


Pilot’s Guide
Engine Data Management
EDM-730
EDM-830
EDM-740
EXPERIMENTAL
Copyright 2000-2010 J.P. Instruments, Inc.
All Rights Reserved
J.P. INSTRUMENTS INC.
Information: P. O. Box 7033
Huntington Beach, CA 92646
Factory: 3185 B Airway
Costa Mesa, CA 92626
PH: (714) 557-5434 PH: (800) 345-4574 FX: (714) 557-9840
www.jpinstruments.com www.jpitech.com Support@jpitech.com
Printed in the United States of America |
Rev C June 1 2010 |
Last printed 3/11/2011 8:44:00 AM |
|
For Your Safe Flight |
Page 1 |
Table of Contents
Section 1 - |
Introduction |
5 |
Product Features |
5 |
|
Engine Data Management |
6 |
|
Benefits of Proper Mixture Control |
6 |
|
JPI Probes |
|
6 |
Temperature and Mixture |
6 |
|
Displays and Controls |
8 |
|
Typical EDM-830-6C Cylinder Display |
8 |
|
Typical display configurations by model and mounting orientation 12
EDM-830 RPM and MAP Display |
13 |
|
EDM-730/830 Linear Gauges |
13 |
|
EDM-730/830 Basic Scanner® Operation |
14 |
|
Operating Modes |
15 |
|
Button Location and Display Rotation |
16 |
|
Scanner® Information Area |
19 |
|
Section 2 - |
Operating Procedures |
20 |
Built-in Diagnostics: Startup and During Flight |
20 |
|
EDM Modes |
20 |
|
Automatic Mode |
20 |
|
Manual Mode |
21 |
|
LeanFind Mode |
22 |
|
LeanFind Procedure—General Explanation |
25 |
|
Expanded Leaning Procedures |
28 |
|
Operation for each Phase of Flight |
29 |
|
Shock Cooling |
30 |
|
Common Misapplications |
31 |
|
Section 3 - |
Diagnosing Engine Problems |
32 |
Engine Diagnosis Chart |
33 |
|
Alarms |
|
35 |
Alarm Priority |
36 |
|
Pre-Ignition and Detonation |
36 |
|
Section 4 - |
Fuel Flow Option Operation |
37 |
Fuel Management |
37 |
|
Start Up Fuel |
38 |
|
Resetting ‘USED’ |
42 |
|
Accumulate — Trip Totalizer |
42 |
|
Fuel Flow Display Select Switch |
42 |
|
Parameter Scan—Systems with Fuel Flow Option |
42 |
|
Section 5 - |
Long Term Data Memory |
44 |
Downloading from Long Term Memory |
44 |
|
Transferring from the USB Flash Drive to a PC |
45 |
|
Page 2 Engine Data Management
Section 6 - |
Personalizing |
45 |
Pilot Programming |
45 |
|
Section 7 - Programming Horsepower Constant |
47 |
|
Section 8 - Programming Manifold Pressure (MAP) |
47 |
|
Section 9 - Programming use of Factory Original TIT Probe |
48 |
|
Section 10 - Programming the Fuel Flow Option |
49 |
|
Section 11 - Programming Long Term Data Memory |
51 |
|
Section 12 - Factory Limits and GPS |
52 |
|
MAP, Fuel Flow Alarm Limits, Units, Fuel Capacity |
55 |
|
Navigation GPS Data Formats |
57 |
|
GPS-C Fuel Flow Format for GPS Bi-directional Comm |
57 |
|
Navigation Data Ports for GPS Communication |
58 |
|
Section 13 - Options Connector Pin Assignments |
59 |
|
Section 14 - |
Display Customization |
60 |
Section 15 - |
Reference Reading |
61 |
Section 16 - |
Technical Support |
61 |
Section 17 - |
Limited Warranty |
62 |
Section 18 - EDM-851 TWIN ENGINE ADDENDUM |
63 |
|
Section 19 - |
Index |
64 |
QUICK REFERENCE GUIDE |
68 |
|
For Your Safe Flight |
Page 3 |

The following is a quick reference of basic operation
|
tap STEP button |
tap STEP and LF |
|
|
|
simultaneously |
|
||
|
|
|
||
AUTO MODE: |
|
MANUAL MODE: |
Toggles to |
|
|
include/exclude |
|||
parameters |
|
Parameters |
||
|
parameter in |
|||
automatically |
|
manually indexed |
||
|
AUTO MODE |
|||
indexed |
tap LF, then tap STEP |
by tapping STEP release buttons |
||
indexing |
||||
|
STEP
L F
LF
LEAN FIND: starts LeanFind procedure
|
|
|
th |
|
F |
|||
|
|
|
o |
|
|
|
||
|
|
b |
|
|
L |
ly |
||
|
|
d |
|
|
||||
|
ld |
n |
|
|
|
s |
||
o |
|
a |
|
|
|
u |
||
h |
|
P |
|
|
o |
|
||
|
|
|
e |
|
|
|||
|
E |
|
n |
|
|
|
||
T |
|
ta |
|
|
|
|
||
|
l |
|
|
|
|
|
||
S |
u |
|
|
|
|
|
||
|
im |
|
|
|
|
|
|
|
s |
|
|
|
|
|
|
|
|
Toggle between
LEAN R and
LEAN L of peak
b |
|
|
l |
e |
|
g |
||
e |
|
i |
a |
|
n |
n |
|
|
|
i |
|
|
n |
|
|
g |
|
continue |
|
hold LF |
|
|
see |
|
Displays |
||
Cylinder I.D. leaning |
|
|||
‘LeanFind |
|
|||
|
peak EGT |
|||
box flashes |
Mode’ for |
|
||
release LF |
value |
|||
|
details |
|||
|
|
|
Page 4 |
Engine Data Management |

Section 1 - Introduction
Product Features
indicates standard feature |
730 |
830 |
Hands-free, automatic scanning |
|
|
All programming done from the Front Panel |
|
|
LeanFind finds the first and last cylinder to peak with |
|
|
true peak detect—eliminates a false peaks |
|
|
Displays both leaned temperature below peak and peak |
|
|
Battery voltage with alarm |
|
|
24 Programmable alarm limits |
|
|
Normalize view |
|
|
DIF low to high EGT with alarm |
|
|
EGTs to stable 1°F resolution |
|
|
Shock cooling monitored on every cylinder |
|
|
User selectable index rate |
|
|
Fast response probes |
|
|
Non-volatile long term memory |
|
|
Records and stores data up to 30 hours |
|
|
Post-flight data retrieval |
|
|
Data retrieval software |
|
|
Alarm and warning light outputs |
|
|
Oil temperature |
opt |
opt |
Oil pressure |
opt |
opt |
Turbine inlet temperature |
opt |
opt |
Outside air temperature |
opt |
|
Compressor discharge temperature |
opt |
opt |
Intercooler temperature |
opt |
opt |
Carburetor temperature |
opt |
opt |
Manifold Pressure (MAP) |
|
|
Fuel Flow |
FF opt |
|
Solid-state rotor fuel flow transducer |
FF opt |
|
Fuel quantity in gallons, kilograms, liters, or pounds |
FF opt |
|
Low fuel quantity alarm |
FF opt |
|
Low fuel time alarm |
FF opt |
|
GPS interface |
FF opt |
|
Instantaneous fuel flow rate |
FF opt |
|
Total amount of fuel consumed |
FF opt |
|
Total fuel remaining |
FF opt |
|
Time to empty at the current fuel flow rate |
FF opt |
|
Displays % horsepower and RPM |
RPM opt |
|
Automatically calculates percent horsepower |
|
|
Requires FF, OAT, RPM, and MAP. |
|
|
For Your Safe Flight |
Page 5 |

Engine Data Management
The EDM Engine Data Management system is the most advanced and accurate piston engine-monitoring instrument on the market. Using the latest microprocessor technology, the EDM will monitor up to twentyfour critical parameters in your engine, four times a second, with a linearized thermocouple accuracy of better than 0.1 percent or 2 F°.
As your built-in flight engineer, the EDM is constantly “red line” checking: all critical parameters are automatically checked four times a second, regardless of the current display status. Leaning is accomplished quickly and automatically using the LeanFind procedure. With the EDM, it is now possible to have substantially more diagnostic information available to you in a timely and usable manner.
Benefits of Proper Mixture Control
|
Improved engine efficiency |
|
|
Greater fuel economy |
|
|
Smoother engine operation |
|
Longer spark plug life |
|
|
JPI Probes
Temperature information processed by the EDM is captured by fast response grounded JPI temperature probes that accurately measure small temperature changes—as small as 1°F—that routinely occur during mixture adjustment.
Reduced maintenance costs Reduced operating costs Proper engine temperatures Reduced engine vibration
|
CHT probe |
cylinder |
exhaust |
head |
manifold |
|
EGT probe |
Temperature and Mixture
In a piston engine only a small portion of the energy from combustion produces movement of the piston during the power stroke. The majority of energy passes into the exhaust pipe as hot gasses. By monitoring the temperature of these exhaust gasses you will have an indication of the quality of the combustion process. Low compression, non-uniform fuel distribution, faulty ignition, and clogged injectors diminish the efficiency of the combustion process that generates power. From the cockpit you can adjust the fuel/air ratio by a process called leaning. Retarding the mixture control changes the fuel/air ratio and hence affects the Exhaust Gas Temperature (EGT).
Page 6 |
Engine Data Management |

The following depicts the power, mixture and temperature relationships.
peak |
|
0 |
|
- |
|
|
|
|
below°FEGT |
|
50 |
|
- |
|
|
|
|
|
100 |
|
|
|
10 |
best |
|
0 |
|
9 |
|
|
|
|
Percentof power |
5 |
|
8 |
||
|
|
9 |
0
8
5
0
Best |
|
|
|
Best |
|
|||||
power |
|
|
economy |
Last cylinder to |
||||||
range |
|
|
|
range |
||||||
|
|
|
peak. Use for LOP |
|||||||
|
|
|
|
|
|
|
|
|
|
|
|
|
|
|
|
|
|
|
|
|
Lean of Peak |
|
|
|
|
|
|
|
|
|
|
leaning |
T |
|
First cylinder to |
||
G |
|
|||
E |
|
peak. Use for ROP |
||
|
|
|||
|
|
Rich of Peak |
||
|
|
|
|
leaning |
|
T |
|
|
|
H |
|
|
|
|
C |
|
|
|
|
|
|
|
|
|
t |
|
|
|
|
n |
|
|
|
|
e |
|
|
|
rc |
|
|
||
e |
|
|
|
r |
|
P |
|
|
|
|
|
|
|
|
|
e |
|
|
|
w |
|
||
|
o |
|
|
|
|
p |
|
|
|
|
|
GAMI spread
20
0
-
20
-
40
-
60
-
80
CHT °F change from best power
Peak Power
|
|
S |
|
|
|
|
|
|
|
|
|
|
|
|
p |
|
|
|
|
|
|
||
|
c |
|
|
e |
|
|
|
|
|
|
|
|
|
|
|
c |
|
|
|
|
|
||
|
o |
|
|
|
if |
|
|
|
|
||
|
|
n |
|
|
|
i |
|
|
|
||
|
|
|
s |
|
|
c |
f |
|
|
||
|
|
|
|
u |
|
|
|
|
|
||
|
|
|
|
|
m |
|
|
u |
|
|
|
|
|
|
|
|
|
|
e |
|
|||
|
|
|
|
|
|
p |
|
|
l |
|
|
|
|
|
|
|
|
|
t |
|
|
|
|
|
|
|
|
|
|
|
|
i |
|
|
|
|
|
|
|
|
|
|
|
o |
|
|
|
|
|
|
|
|
|
|
|
|
n |
|
|
Full Rich |
Rich |
|
|
|
|
|
|
|
Lean |
Too |
|
(Take-off) |
|
|
|
|
|
|
|
||||
|
|
|
|
|
|
|
|
|
|
lean |
|
As the mixture is leaned, EGT rises to a peak temperature, and then drops as the mixture is further leaned. Peak power occurs at a mixture using more fuel than at peak EGT. Best economy occurs at peak EGT. Accurate leaning yields optimal engine temperatures. By being able to precisely adjust the mixture, your engine can produce either the best fuel economy or maximum power, whichever you choose.
A single EGT gauge merely gives you an average of a few cylinder’s temperature: some cylinders can be too rich, while others too lean. Variations produced by differences in fuel distribution, ignition, and compression will cause each cylinder to peak at a different temperature. In some cases the coldest cylinder will peak first. TIT will run up to 100 degrees hotter than the hottest EGT.
For Your Safe Flight |
Page 7 |
Displays and Controls
The EDM monitors engine temperatures and voltages, assists in adjusting the fuel/air mixture, and helps diagnose engine malfunctions. There are three components of the user interface:
Analog display including cylinder number and cylinder I.D. box
Digital display for numeric readouts and messages
Two front panel operating buttons for simple operation.
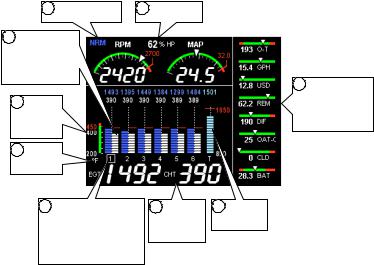
Typical EDM-830-6C Cylinder Display
1 EGT normalize |
6 %HP |
5 Cyl Bargraphs: EGT left side, CHT right side, digital above
|
|
9 |
Linear gauges |
|
|
|
|
4 |
CHT |
|
monitor |
|
numerous |
||
|
|
||
|
absolute |
|
|
|
|
parameters |
|
|
scale |
|
|
|
|
|
2Temp in °F or °C
3 Cyl Number identifies |
7 Scanner |
8 |
TIT |
bargraph cylinder. |
Information |
|
Bargraph |
Cyl I.D. Box identifies |
Area |
|
|
the related Scanner |
|
|
|
digital values |
|
|
|
Display Dimming
The display features automatic dimming. Allow ten seconds for the display to adjust to ambient lighting conditions. The dimming baseline can be user adjusted in Pilot Programming Mode.
Page 8 |
Engine Data Management |

The following is a description of various display areas. Numbers in circles refer to features in the above diagram.
1Normalize View and Percentage View
Percentage View: when the EGT normalize indicator ‘NRM’ is not lit, the columns indicate percent of EGT red line. Each column is composed of a stack of segments. A maximum height column (all segments lit) depicts 100 %, or more, of red line and a one segment-high column depicts 50 % of red line. For example, if the red line is 1650°F, a maximum height column represents 1650°F and a one segment-high column represents half that value, or 825°F. The Percentage View permits comparison of EGTs across all cylinders. Hotter cylinders display higher columns than cooler cylinders.
Normalize View: when the EGT normalize indicator ‘NRM’ is lit, the EGT columns are displayed normalized. When you activate Normalize View, all column peaks are set to the same half-height level for trend analysis. Any changes are shown as an increase or decrease in column height. A one-segment change in column height represents a 10°F change. The Normalize view permits rapid visualization of EGT trends, rather than a percentage of red line. You should use normalize in level cruise and run-up.
To toggle between Percentage View and Normalize View, hold the LF button until the ‘NRM’ indicator either comes on or goes off.
Selecting the Normalize view does not affect the digital display nor alter the parameter sequence. The CHT display—described later—is not affected by either Normalize or Percentage view.
You may select the Normalize view in either the Manual or Automatic modes, but not during Lean Find mode. Normalize view is most helpful for engine trend monitoring of each cylinder’s operation. For example using the Normalize view during engine run-up, a fouled spark plug will appear as a higher column.
TIP: A common misapplication is to be in the Normalize view and then change your power setting. This can cause all columns to go off scale, high or low, giving you the impression there is a problem. Turn off ‘NRM’ (return to Percentage view) before adding or reducing power and when beginning your descent.
For Your Safe Flight |
Page 9 |

2 Temperature Units (°F or °C)
The EDM series engine temps can be set for either degrees Fahrenheit °F or degrees Celsius °C. Note: OAT units can be set independently of the engine temps. To change the display of engine temperatures see
“Changing the Alarm Limits” on page 52.
3 Cylinder Numbers and the Cylinder I.D. box
The row of numbers 1 through 6 (cylinder I.D numbers) and the letter ‘T’ (optional turbine inlet temp) are the column labels for the analog display bargraphs. A square box (cylinder I.D. box), surrounding one or more of the labels, specifies that those particular cylinders relate to the values currently shown in the Scanner® information area.
4 CHT absolute scale
The ‘CHT absolute scale’ allows you to quickly determine the absolute temperature of any CHT by comparing the bargraph height to the scale. This is a quick and useful way to visually determine your CHT temperatures relative to redline.
5 Bar Graph EGT and CHT
A cylinder ‘bargraph set’ is composed of a dotted line leading from the cylinder I.D. number vertically to its EGT/CHT digital values. The EGT column is located to the left of the line and the CHT column to the right. Columns are composed of a stack of segments. The maximum height for a column is the top of the dotted line. The CHT redline value is depicted by a horizontal red line approximately half way up and to the right of the dotted line. When any CHT column reaches redline, its column will turn red and an alarm message will commence. The CHT display is not affected by mode or view. The EGT column has three different viewing modes: Percent View, Normalize View and Lean Find.
6 Percent HP (EDM-830 only)
Displays %HP (if FF, RPM, OAT, MAP functional).
7 Scanner® Information Area
The Scanner® Information Area provides expanded information for the various monitored parameters. The Scanner® operates automatically or manually.
Page 10 Engine Data Management
8 TIT Bargraph
The EDM provides a bargraph display of the hottest TIT and continuously checks for exceedance of the redline temp. Once redline is reached, the bargraph will change to red and an alert will flash in the Scanner® Information Area.
9 Linear Gauges
The Linear gauges provide both digital and analog indications for various parameters. The sliding pointer and color range marks give you a quick indication of where you are relative to the operating limits while the digital value provides precise information. See Section 14 - Display Customization for ways you can customize this area. Note: parameters monitored vary by model and options present.
EGT and CHT operation in Scanner® Information Area
When the Cylinder I.D. Box highlights a cylinder number (1 through 6), the Scanner® Information Area will show the EGT value on the left (four digits) and the CHT value on the right (three digits). Other parameters are displayed in the digital display as described in the subsection “Scanner® Information Area” on page 19.
Cylinder # 1 |
4 digit |
3 digit |
highlighted |
display of |
display of |
|
EGT 1 |
CHT 1 |
For Your Safe Flight |
Page 11 |

Typical display configurations by model and mounting orientation
The EDM-730/830 series features the ability to be mounted either in landscape or portrait orientation. Display layouts will differ as a result of configuration differences. You may examples of the EDM-830 and EDM-730 are shown below:
EDM-830 6 Cylinder (landscape orientation)
EDM-830 6 Cylinder
(portrait orientation)
EDM-730 6 Cylinder
(portrait orientation)
Page 12 |
Engine Data Management |

EDM-830 RPM and MAP Display
The EDM-830 depicts both RPM and Manifold Pressure graphically and digitally. Examples are shown for both landscape and portrait orientation. When a power setting exceeds redline, the digital value changes to red and a blinking message appears in the Scanner® Information Area. Percent horsepower is located in this display area also.
EDM-830 RPM & MAP (portrait orientation)
EDM-730/830 Linear Gauges
This area contains linear bar graphs with digital displays. When a value exceeds red line, it is displayed in RED. You can customize what appears in each position. Examples of available displays are:
Voltage (BAT)
EGT Span (DIF)
Shock Cooling (CLD)
Oil temperature (O-T)
Oil pressure (O-P)
Outside Air Temperature (OAT)
Fuel flow, units per hour (GPH)
Fuel Used (USD)
Fuel Remaining (REM)
Fuel Required to waypoint or destination (REQ)
EDM-830 RPM & MAP (landscape orientation)
EDM-830
Linear Gauge
For Your Safe Flight |
Page 13 |
EDM-730/830 Basic Scanner® Operation
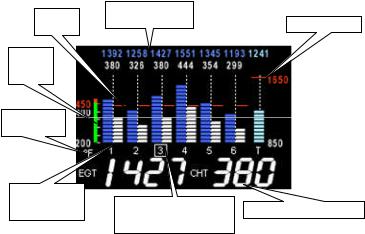
The EDM-730/830 Scanner section contains graphic representation of EGT, CHT and TIT values as well as containing a general purpose text message area. It will go into Automatic scan mode a few minutes after power up. You don’t have to touch any buttons.
CHT redline
CHT absolute scale
Engine temps in F or C
Cylinder numbers 1 through 6. T is TIT
Digital EGT/CHT/TIT
values
Cylinder I.D. box indicates which cylinder temperatures are show in the digital display
TIT redline
Scanner Information Area
EGT: Exhaust Gas Temperatures
Blue segments represent temperature magnitude and are located to the left of the vertical dotted line present in each cylinder bar graph. Cylinder I.D. numbers are located just below the dotted line (one for each cylinder on the engine). A white square around a cylinder I.D. number identifies which cylinder the Scanner® digital value relates to (cylinder 3 in the above example). The digital value is always present above the dotted line and is Blue.
CHT: Cylinder Head Temperatures
White segments represent temperature magnitude and are located to the right of the vertical dotted line present in each cylinder bar graph. Cylinder I.D. numbers are located just below the dotted line (one for each cylinder on the engine). A white square around a cylinder I.D. number identifies which cylinder the Scanner® digital value relates to (cylinder 3 in the above example). The digital value is always present above the dotted line and is White. CHT redline is depicted by red horizontal lines half way up the bar graph scale.
Page 14 |
Engine Data Management |
TIT: Turbine Inlet Temperature
Light Blue segments represent temperature magnitude (at the same scale as EGT) and are located to the right of the last cylinder bar graph set. A ‘T’ just below the dotted line identifies this as TIT. When a white square surrounds the ‘T’, this signifies that the scanner digital values relate to TIT. The digital value is always present above the dotted line and is Light Blue. TIT redline is depicted by a red horizontal line above the majority of the TIT bar graph area.
There are two views: Normalize view levels the EGT columns and increases the sensitivity of the Scanner® bar graph columns. To enter the Normalize view, hold the LeanFind button for three seconds. The NRM icon will be displayed above the Scanner® section and the bars will be blue. Hold the LeanFind button for three seconds to return to the Standard view. See page 9 for a more detailed description.
Operating Modes
There are three standard operating modes of the EDM: Automatic, Manual, and LeanFind. These modes will be described in more detail beginning on page 20. When you first turn on the power the EDM starts in the Manual mode, but will enter the Automatic mode after two minutes (most of the time you will operate the EDM in the Automatic mode). The three modes primarily affect the Scanner® Information Area.
Automatic Mode
Just tap the LF button, then tap the STEP button. No user intervention is required to use this mode. Each cylinder and each parameter value is automatically sequenced and shown in the digital display for a few seconds.
Manual Mode
Just tap the STEP button. This stops Automatic Mode. Each indexed parameter is frozen in the digital display until you manually index to the next parameter by tapping the STEP button.
LeanFind Mode
Simply pre-lean, tap the LF button and begin leaning. The EDM will assist you in finding the correct cylinder to peak to set your mixture to.
For Your Safe Flight |
Page 15 |
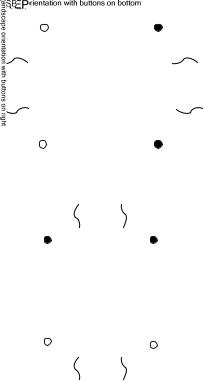
Button Location and Display Rotation
The EDM can be mounted in four different positions. After mounting, you may need to remove and relocate the white button to the ‘STEP’ location. You may also need to rotate the EDM display. Clear any alarms and hold STEP (about 6 seconds) until you see the overlayed arrow. This arrow indicates where the top of the display will be. Tap LF until the arrow points to 12 o’clock. Now tap STEP. Your display should now be upright. The button functions are depicted in the four possible orientations as shown below:
|
|
|
|
|
|
|
|
|
|
|
|
|
|
|
|
|
|
|
|
|
|
|
|
|
|
|
|
|
|
|
|
|
|
|
|
|
|
|
|
|
|
|
|
|
|
|
|
|
|
|
|
|
|
|
|
|
|
|
|
|
|
|
|
|
|
|
|
|
|
|
|
|
|
|
|
|
|
|
|
|
|
|
|
|
|
|
|
|
|
|
|
|
|
|
|
|
|
|
|
|
|
|
|
|
|
|
|
|
|
|
|
|
|
|
|
|
|
|
|
|
|
|
|
|
|
|
|
|
|
|
|
|
|
|
|
|
|
|
|
|
|
|
|
|
|
|
|
|
|
|
|
|
|
|
|
|
|
|
|
|
|
|
|
|
|
|
|
|
|
|
|
|
|
|
|
|
|
|
|
|
|
|
|
|
|
|
|
|
|
|
|
|
|
|
|
|
|
|
|
|
|
|
|
|
|
|
|
|
|
|
|
|
|
|
|
|
|
|
|
|
|
|
|
|
|
|
|
|
|
|
|
|
|
|
|
|
|
|
|
|
|
|
|
|
|
|
|
|
|
|
|
|
|
|
|
|
|
|
|
|
|
|
|
|
|
|
|
|
|
|
|
|
|
|
|
|
|
|
|
|
|
|
|
|
|
|
|
|
|
|
|
|
|
|
|
|
|
|
|
|
|
|
|
|
|
|
|
|
|
|
|
|
|
|
|
|
|
|
|
|
|
|
|
|
|
|
|
|
|
|
|
|
|
|
|
|
|
|
|
|
|
|
|
|
|
|
|
|
|
|
|
|
|
|
|
|
|
|
|
|
|
|
|
|
|
|
|
|
|
|
|
|
|
|
|
|
|
|
|
|
|
|
|
|
|
|
|
|
|
|
|
|
|
|
|
|
|
|
|
|
|
|
|
|
|
|
|
|
|
|
|
|
|
|
|
|
|
|
|
|
|
|
|
|
|
|
|
|
|
|
|
|
|
|
|
|
|
|
|
|
|
|
|
|
|
|
|
|
|
|
|
|
|
|
|
|
|
|
|
|
|
|
|
|
|
|
|
|
|
|
|
|
|
|
|
|
|
|
|
|
|
|
|
|
|
|
|
|
|
|
|
|
|
|
|
|
|
|
|
|
|
|
|
|
|
|
|
|
|
|
|
|
|
|
|
|
|
|
|
|
|
|
|
|
|
|
|
|
|
|
|
|
|
|
|
|
|
|
|
|
|
|
|
|
|
|
|
|
|
|
|
|
|
|
|
|
|
|
|
|
|
|
|
|
|
|
|
|
|
|
|
|
|
|
|
|
|
|
|
|
|
|
|
|
|
|
|
|
|
|
|
|
|
|
|
|
|
|
|
|
|
|
|
|
|
|
|
|
|
|
|
|
|
|
|
|
|
|
|
|
|
|
|
|
|
|
|
|
|
|
|
|
|
|
|
|
|
|
|
|
|
|
|
|
|
|
|
|
|
|
|
|
|
|
|
|
|
|
|
|
|
|
|
|
|
|
|
|
|
|
|
|
|
|
|
|
|
|
|
|
|
|
|
|
|
|
|
|
|
|
|
|
|
|
|
|
|
|
|
|
|
|
|
|
|
|
|
|
|
|
|
|
|
|
|
|
|
|
|
|
|
|
|
|
|
|
|
|
|
|
|
|
|
|
|
|
|
|
|
|
|
|
|
|
|
|
|
|
|
|
|
|
|
|
|
|
|
|
|
|
|
|
|
|
|
|
|
|
|
|
|
|
|
|
|
|
|
|
|
|
|
|
|
|
|
|
|
|
|
|
|
|
|
|
|
|
|
|
|
|
|
|
|
|
|
|
|
|
|
|
|
|
|
|
|
|
|
|
|
|
|
|
|
|
|
|
|
|
|
|
|
|
|
|
|
|
|
|
|
|
|
|
|
|
|
|
|
|
|
|
|
|
|
|
|
|
|
|
|
|
|
|
|
|
|
|
|
|
|
|
|
|
|
|
|
|
|
|
|
|
|
|
|
|
|
|
|
|
|
|
|
|
|
|
|
|
|
|
Page 16 |
|
|
|
|
|
|
|
|
|
|
|
|
|
Engine Data Management |
||||||||||||||||

The STEP and LF buttons control all functions of the EDM. The term tap denotes pressing a button momentarily. The term hold denotes pressing and holding a button for five seconds or longer.
STEP Button - Primary functions
In the Automatic mode, tapping the STEP button will change to the Manual mode. Subsequent taps of the STEP button will display the next parameters in the sequence.
In the LeanFind mode tapping the STEP button will terminate the LeanFind mode and change to the Automatic mode.
STEP Button - Secondary functions
In the Manual mode, holding the STEP button will display the previous parameters in the sequence (rapidly backwards).
In the Pilot Program Mode, tapping the STEP button will generally advance to the next item in the list.
When an alarm is displayed, tapping the STEP button will prevent that alarm from appearing for the next ten minutes.
When an alarm is displayed, holding the STEP button until the word OFF appears, prevents that alarm from appearing for the remainder of the flight.
LF Button - Primary functions
In Automatic or Manual modes, tapping the LF button will change to the LeanFind mode.
In the LeanFind mode, holding the LF button after peak EGT is found will display peak EGT.
In Automatic or Manual modes, holding the LF button for three seconds will toggle between Percentage and Normalize views.
EGT Percentage view |
hold LF button |
EGT Normalize View |
|
is ON. |
is ON. |
||
for 3 seconds |
|||
(NRM icon off) |
(NRM icon on) |
For Your Safe Flight |
Page 17 |
LF Button - Secondary functions
In the pilot programming procedure, holding or tapping the LF button is used to increment or decrement parameter values and toggle between Yes and No answers to questions.
STEP and LF buttons together
Holding both the STEP and LF buttons simultaneously, for several seconds, changes to the Pilot Programming Mode.
Holding both the STEP and LF buttons simultaneously for several seconds when in a unit programming mode and ‘END? Y’ is displayed will take you to the next programming mode (if one exists).
Holding both the STEP and LF buttons simultaneously for several seconds after entering LeanFind mode but before beginning to lean will toggle between leaning ‘Rich Of Peak’ and ‘Lean Of Peak’.
Tapping both the STEP and LF buttons simultaneously in Manual mode toggles to include or exclude the displayed parameter from the Automatic mode. It has no affect on the displayed parameters in the Manual mode.
Page 18 |
Engine Data Management |
Scanner® Information Area
The Scanner® Information Area provides expanded information in the form of alpha-numeric messages, parameters and calculations. In AutoScan, parameters will ‘scan by’ once every 4 seconds (default). This rate can be changed in Pilot Programming Mode. Tap the STEP button for ‘Manual’ selection of any parameter. Parameters for the installed options will be displayed - uninstalled parameters will not appear.
|
DISPLAY |
PARAMETER |
DESCRIPTION |
|
EGT 1436 CHT 382 |
EGT/CHT |
Shows successive pairs of |
|
EGT & CHT per STEP tap. |
||
|
1580 TIT |
TIT 1 |
Turbine Inlet Temp #1 |
|
1490 TI2 |
TIT 2 |
Turbine Inlet Temp #2 |
|
204 OIL-T |
OIL TEMP |
Oil temperature |
|
64 OIL-P |
OIL PRES |
Oil pressure |
|
75 CLD |
SHOCK COOL |
CHT cooling rate (deg/min) |
|
13.9 BAT |
BATTERY |
Battery/Bus voltage |
|
23 OAT |
OAT |
Outside air temperature |
|
40 DIF |
DIF |
Hottest minus coldest EGT |
|
56 CRB |
CRB |
Carburetor Air Temp (only |
|
allowed if IAT not present) |
||
|
145 CDT |
CDT |
Compressor Discharge Temp |
|
(only allowed if CRB not |
||
|
|
|
present) |
|
105 IAT |
IAT |
Intercooler Air Temp |
|
-40 C-I |
CDT-IAT |
Intercooler cooling |
|
RPM 2460 MAP 23.6 |
POWER |
RPM & MAP values |
|
Calculated |
REM |
Calculated fuel remaining |
|
68.0 REM |
||
|
|
||
|
|
|
|
|
12.7 REQ |
FUEL |
Calculated fuel required to |
|
REQUIRED |
reach waypoint (GPS interface |
|
|
|
must be correct) |
|
|
Calculated |
FUEL |
Calculated fuel reserve at |
|
55.2 RES |
RESERVE |
waypoint (GPS interface must |
|
be correct) |
||
|
9.8 MPG |
MILES PER |
Calculated fuel miles per units |
|
GALLON |
(GPS interface must be |
|
|
|
correct) |
|
|
Calculated |
ENDURANCE |
Calculated time remaining to |
|
04:32 H:M |
fuel exhaustion |
|
|
15.0 GPH |
FUEL FLOW |
Calculated fuel flow rate in |
|
RATE |
units per hour |
|
|
|
||
|
7.2 USD |
FUEL USED |
Calculated fuel used |
For Your Safe Flight |
|
Page 19 |
|
Section 2 - Operating Procedures
Built-in Diagnostics: Startup and During Flight
When your EDM is first turned on, the screen begins by showing the unit model number and TSO category. Next, several display patterns are presented allowing you to check for proper screen operation. During this time, the EDM is conducting built-in-tests of certain components, calibration and probes. Any newly installed options are found and logged in at this time. If a probe problem is found, diagnostic indications will be presented on the display. These vary depending on the parameter. For CHT, EGT and TIT, a message appears in the Scanner® Information Area. For example, if EGT#2 were open circuit, the message would read ‘OPEN EGT 2’. For an inoperative horizontal linear gauge function, a red ‘X’ is drawn through it and its digital value is dashed out. Probes determined to be faulty during the power up checks are disabled from the Scanner® automatic sequence. During flight, probes are periodically checked for inconsistent or intermittent signals and are disabled if deemed unusable in which case an appropriate message will appear.
EDM Modes
The EDM has three different operating modes: Automatic, Manual and LeanFind. When you first turn on the power the EDM starts in the Manual mode, but will enter the Automatic mode after a few minutes. The Automatic mode provides you with engine monitoring information for the majority of flight conditions. To adjust the mixture, use the LeanFind mode. To display specific parameters, use the Manual mode. In either Automatic or Manual modes, the cylinder bar graphs show a graphic representation of EGT and CHT for each cylinder and TIT (if present).
Automatic Mode
Just tap the LF button, then tap the STEP button. No other user intervention is required to use this mode. The EDM will begin displaying the parameter sequence at the programmed ‘RATE’ (see “Personalizing” on page 45).
Page 20 |
Engine Data Management |
Individual parameters can be excluded from the Automatic mode: tap STEP to enter the Manual mode. Tap STEP to select the parameter you want to exclude. Now tap both STEP and LF buttons simultaneously. Note that tapping the STEP and LF buttons again, toggles back to include status.
An excluded parameter displays a decimal point before the parameter name.
For example: |
‘Excluded’ marker |
|
||
|
|
|
|
|
|
|
|
|
|
Included: 14.6 BAT |
Excluded: 14.6 |
|
|
.BAT |
|
|
|||
Every time you turn on the EDM, all parameters are set to ‘included’.
All installed parameters are always displayed in the Manual mode. Exclusion only applies to the Automatic mode.
All parameters are checked periodically for alarm conditions regardless of their included or excluded status.
OIL temperature, EGT, CHT and TIT values cannot be excluded.
Manual Mode
Just tap the STEP button. Use the Manual mode when you want to monitor one specific parameter such as shock cooling during descent, or a particular cylinder temperature during climbs. To change to the Manual mode, tap the STEP button once. Subsequent taps will index the digital display through the parameter sequence (see “Scanner® Information Area” on page 19). To exit the Manual mode and return to the Automatic mode, tap the LF button and then tap the STEP button. You may disable the Automatic mode by setting scan rate to ‘0’.
For Your Safe Flight |
Page 21 |
LeanFind Mode
The EDM supports two methods of leaning; Rich Of Peak (ROP) and Lean Of Peak (LOP). Note: you can set the power-up default to LOP or ROP in the Pilot Program Mode but easily change modes during flight. During traditional Rich Of Peak leaning, you’ll finalize the mixture to about 20 to 80° rich of peak (depending on engine operating requirements). However, with the advent of closely balanced injectors (such as GAMI), it is possible to set the mixture lean of peak—thus saving fuel and running the engine cooler. Teledyne Continental recommends lean of peak for the Malibu. Both Rich Of Peak and Lean Of Peak processes are described in detail in this manual.
Upon reaching cruise configuration, use the LeanFind mode to identify the correct cylinder to reach peak EGT (for rich of peak this is the FIRST to peak, for lean of peak this is the LAST to peak). To change from one method to the other, just after activating LeanFind, hold STEP and LF and the other method will be momentarily shown: ROP or LOP. Release buttons after other method appears.
The following charts provide step by step guidelines in leaning your engine, for both rich of peak and lean of peak modes:
Page 22 |
Engine Data Management |
 Loading...