

Page 1

HP Medical Archive Solutions
User Guide
February 2005 (Second Edition)
Part Number 389638-002
Page 2

© Copyright 2005 Hewlett-Packard Development Company, L.P.
The information contained herein is subject to change without notice. The only warranties for HP products and
services are set forth in the express warranty statements accompanying such products and services. Nothing herein
should be construed as constituting an additional warranty. HP shall not be liable for technical or editorial errors
or omissions contained herein.
Bycast® and StorageGRID™ are trademarks of Bycast Inc. Their related marks, images, and symbols are the
exclusive properties of Bycast Inc.
Microsoft, Windows, and Windows NT are U.S. registered trademarks of Microsoft Corporation.
This product includes software developed by the OpenSSL Project for use in the Open SSL Toolkit.
(http://www.openssl.org/)
HP Medical Archive Solutions
February 2005 (Second Edition)
Part Number 389638-002
Page 3

HPMA User Guide
DISCLAIMER
While every reasonable effort has been made to achieve technical
accuracy and completeness, information in this document is subject to
change without notice and does not represent a commitment on the
part of Bycast Inc., or any of its subsidiaries, affiliates, licensors, or
resellers. There are no warranties, express or implied, with respect to
the content of this document.
Features and specifications of Bycast
®
products are subject to change
without notice.
This manual contains information and images about Bycast Inc., its
fixed content storage systems, and its other products that are protected
by copyright and furnished under terms of a license agreement.
This product includes software developed by the OpenSSL Project for
use in the Open SSL Toolkit. (http://www.openssl.org/)
Copyright ©2005 by Bycast Inc. All rights reserved.
Proprietary and Confidential
Bycast® and StorageGRID™ are trademarks of Bycast Inc. Their related marks, images, and symbols are the
exclusive properties of Bycast Inc.
Microsoft® and Windows® are registered trademarks of Microsoft Corporation.
Adobe® and Acrobat® are registered trademarks of Adobe Systems Incorporated in the United States and/or
other countries.
All other brands, product names, company names, trademarks, and service marks are the properties of their
respective owners.
ii
HP Medical Archive
Page 4

Contents
Preface . . . . . . . . . . . . . . . . . . . . . . . . . . . . ix
Purpose . . . . . . . . . . . . . . . . . . . . . . . . . . . . . . . . . . . . ix
Currency . . . . . . . . . . . . . . . . . . . . . . . . . . . . . . . . . . . ix
Intended Audience . . . . . . . . . . . . . . . . . . . . . . . . . . . x
References . . . . . . . . . . . . . . . . . . . . . . . . . . . . . . . . . . xi
Document Structure . . . . . . . . . . . . . . . . . . . . . . . . . . xi
Using this Guide . . . . . . . . . . . . . . . . . . . . . . . . . . . . . xi
Conventions . . . . . . . . . . . . . . . . . . . . . . . . . . . . . . . . . xii
Contacts . . . . . . . . . . . . . . . . . . . . . . . . . . . . . . . . . . . . xiv
Getting Started . . . . . . . . . . . . . . . . . . . . . 1
Architecture Overview . . . . . . . . . . . . . . . . . . . . . . . . 2
Role of the Network Management System (NMS) . . 3
Network and Element Terminology . . . . . . . . . . . . . 3
Capabilities . . . . . . . . . . . . . . . . . . . . . . . . . . . . . . . . . . 4
Software Requirements . . . . . . . . . . . . . . . . . . . . . . . 5
Accessing the NMS . . . . . . . . . . . . . . . . . . . . . . . . . . . 5
Log in . . . . . . . . . . . . . . . . . . . . . . . . . . . . . . . . . . . . . . 6
Log Out . . . . . . . . . . . . . . . . . . . . . . . . . . . . . . . . . . . . . 6
Managing User Accounts . . . . . . . . . . . . . . . . . . . . . . 7
Account Management Configuration . . . . . . . . . . . . 8
Editing Your Account . . . . . . . . . . . . . . . . . . . . . . . . . 10
Interface Components . . . . . . . . . . . . . . . 11
Frames . . . . . . . . . . . . . . . . . . . . . . . . . . . . . . . . . . . . . 12
Header . . . . . . . . . . . . . . . . . . . . . . . . . . . . . . . . . . . . . 12
Refresh Time . . . . . . . . . . . . . . . . . . . . . . . . . . . . . . . . 13
System Status Indicator . . . . . . . . . . . . . . . . . . . . . . . 14
Account Management Button . . . . . . . . . . . . . . . . . . 14
Logout Button . . . . . . . . . . . . . . . . . . . . . . . . . . . . . . . 14
Version Information . . . . . . . . . . . . . . . . . . . . . . . . . . 14
Navigation Tree . . . . . . . . . . . . . . . . . . . . . . . . . . . . . 15
Tree Structure . . . . . . . . . . . . . . . . . . . . . . . . . . . . . . . 15
Status Indicators . . . . . . . . . . . . . . . . . . . . . . . . . . . . . 16
iii
HP Medical Archive
Page 5

HPMA User Guide
Content Frames . . . . . . . . . . . . . . . . . . . . . . . . . . . . . 16
Tabs . . . . . . . . . . . . . . . . . . . . . . . . . . . . . . . . . . . . . . . . 16
Property Information (Overview) . . . . . . . . . . . . . . . 17
Alarms . . . . . . . . . . . . . . . . . . . . . . . . . . . . . . . . . . . . . . 19
Reports . . . . . . . . . . . . . . . . . . . . . . . . . . . . . . . . . . . . . 19
Configuration . . . . . . . . . . . . . . . . . . . . . . . . . . . . . . . . 19
Navigating Locations and Nodes . . . . . . . . . . . . . . . 21
Location and Node Maps . . . . . . . . . . . . . . . . . . . . . . 21
Alarms . . . . . . . . . . . . . . . . . . . . . . . . . . . . 25
System Status Overview . . . . . . . . . . . . . . . . . . . . . . . 26
System Monitoring . . . . . . . . . . . . . . . . . . . . . . . . . . . 26
Notifications . . . . . . . . . . . . . . . . . . . . . . . . . . . . . . . . . 27
Indicators and Propagation . . . . . . . . . . . . . . . . . . . . 28
Alarm Levels and Indicators . . . . . . . . . . . . . . . . . . . 28
Alarms Tab . . . . . . . . . . . . . . . . . . . . . . . . . . . . . . . . . 30
Main Page . . . . . . . . . . . . . . . . . . . . . . . . . . . . . . . . . . . 31
History Page . . . . . . . . . . . . . . . . . . . . . . . . . . . . . . . . . 32
Alarm Handling . . . . . . . . . . . . . . . . . . . . . . . . . . . . . 34
Tracing the Source of an Alarm . . . . . . . . . . . . . . . . . 34
Resolving Alarms . . . . . . . . . . . . . . . . . . . . . . . . . . . . . 35
Reports . . . . . . . . . . . . . . . . . . . . . . . . . . . . 37
Introduction to Reporting . . . . . . . . . . . . . . . . . . . . . 38
Accessing Reports . . . . . . . . . . . . . . . . . . . . . . . . . . . 39
Immediate Reports . . . . . . . . . . . . . . . . . . . . . . . . . . . 39
Quick Reports . . . . . . . . . . . . . . . . . . . . . . . . . . . . . . . . 40
Custom Reports . . . . . . . . . . . . . . . . . . . . . . . . . . . . . . 41
Report Formats . . . . . . . . . . . . . . . . . . . . . . . . . . . . . . 42
Charts . . . . . . . . . . . . . . . . . . . . . . . . . . . . . . . . . . . . . . 42
Text Reports . . . . . . . . . . . . . . . . . . . . . . . . . . . . . . . . . 44
Chart View Controls . . . . . . . . . . . . . . . . . . . . . . . . . . 45
Window . . . . . . . . . . . . . . . . . . . . . . . . . . . . . . . . . . . . . 45
Printing Charts and Reports . . . . . . . . . . . . . . . . . . . 46
Services and Components . . . . . . . . . . . . 49
Overview of Services and Components . . . . . . . . . . 50
Services . . . . . . . . . . . . . . . . . . . . . . . . . . . . . . . . . . . . . 50
Service Components . . . . . . . . . . . . . . . . . . . . . . . . . . 51
Interpreting Attribute Description Tables . . . . . . . . 54
iv
HP Medical Archive
Page 6

ADC—Administrative Domain Controller . . . . . . . . 56
ADC Attributes . . . . . . . . . . . . . . . . . . . . . . . . . . . . . . . 56
ADC Components . . . . . . . . . . . . . . . . . . . . . . . . . . . . 59
AMS—Audit Management System . . . . . . . . . . . . . . 61
AMS Attributes . . . . . . . . . . . . . . . . . . . . . . . . . . . . . . 61
AMS Components . . . . . . . . . . . . . . . . . . . . . . . . . . . . 64
CLB—Connection Load Balancer . . . . . . . . . . . . . . . 67
CLB Attributes . . . . . . . . . . . . . . . . . . . . . . . . . . . . . . . 67
CLB Components . . . . . . . . . . . . . . . . . . . . . . . . . . . . . 70
CMN—Configuration Management Node . . . . . . . . 76
CMN Attributes . . . . . . . . . . . . . . . . . . . . . . . . . . . . . . 76
CMN Components . . . . . . . . . . . . . . . . . . . . . . . . . . . . 79
CMS—Content Management System . . . . . . . . . . . 94
CMS Attributes . . . . . . . . . . . . . . . . . . . . . . . . . . . . . . 94
CMS Components . . . . . . . . . . . . . . . . . . . . . . . . . . . . 96
FSG—File System Gateway . . . . . . . . . . . . . . . . . . . . 102
FSG Attributes . . . . . . . . . . . . . . . . . . . . . . . . . . . . . . . 103
FSG Components . . . . . . . . . . . . . . . . . . . . . . . . . . . . . 105
LDR—Local Distribution Router . . . . . . . . . . . . . . . 115
LDR Attributes . . . . . . . . . . . . . . . . . . . . . . . . . . . . . . . 115
LDR Components . . . . . . . . . . . . . . . . . . . . . . . . . . . . 119
NMS—Network Management System . . . . . . . . . . . 132
NMS Attributes . . . . . . . . . . . . . . . . . . . . . . . . . . . . . . 132
NMS Components . . . . . . . . . . . . . . . . . . . . . . . . . . . . 135
SSM—Server Status Monitor . . . . . . . . . . . . . . . . . . . 138
SSM Attributes . . . . . . . . . . . . . . . . . . . . . . . . . . . . . . . 138
SSM Components . . . . . . . . . . . . . . . . . . . . . . . . . . . . 140
Configuration . . . . . . . . . . . . . . . . . . . . . . 151
Introduction to Configuration . . . . . . . . . . . . . . . . . . 152
Alarm Configuration . . . . . . . . . . . . . . . . . . . . . . . . . 153
Configuration—Notification Page . . . . . . . . . . . . . . . 153
Active Alarms . . . . . . . . . . . . . . . . . . . . . . . . . . . . . . . . 155
Changing Alarm Settings . . . . . . . . . . . . . . . . . . . . . . 157
Service and Component Configuration . . . . . . . . . . 158
Configuration—Main Page . . . . . . . . . . . . . . . . . . . . . 158
ADC Configuration . . . . . . . . . . . . . . . . . . . . . . . . . . . 159
ADC Components . . . . . . . . . . . . . . . . . . . . . . . . . . . . 159
AMS Configuration . . . . . . . . . . . . . . . . . . . . . . . . . . . 160
AMS Components . . . . . . . . . . . . . . . . . . . . . . . . . . . . 160
v
HP Medical Archive
Page 7

HPMA User Guide
CLB Configuration . . . . . . . . . . . . . . . . . . . . . . . . . . . 160
CLB Components . . . . . . . . . . . . . . . . . . . . . . . . . . . . . 160
CMN Configuration . . . . . . . . . . . . . . . . . . . . . . . . . . 161
CMS Configuration . . . . . . . . . . . . . . . . . . . . . . . . . . . 162
CMS Components . . . . . . . . . . . . . . . . . . . . . . . . . . . . 162
FSG Configuration . . . . . . . . . . . . . . . . . . . . . . . . . . . 162
FSG Components . . . . . . . . . . . . . . . . . . . . . . . . . . . . . 162
LDR Configuration . . . . . . . . . . . . . . . . . . . . . . . . . . . 164
LDR Components . . . . . . . . . . . . . . . . . . . . . . . . . . . . . 164
NMS Configuration . . . . . . . . . . . . . . . . . . . . . . . . . . 168
NMS Components . . . . . . . . . . . . . . . . . . . . . . . . . . . . 168
SSM Configuration . . . . . . . . . . . . . . . . . . . . . . . . . . . 168
SSM Components . . . . . . . . . . . . . . . . . . . . . . . . . . . . . 168
Troubleshooting Alarms . . . . . . . . . . . . . 171
Overview . . . . . . . . . . . . . . . . . . . . . . . . . . . . . . . . . . . 172
Alarm Reference Table . . . . . . . . . . . . . . . . . . . . . . . 172
Introduction to Server Manager . . . . . . 195
Overview of Server Manager . . . . . . . . . . . . . . . . . . . 196
Services . . . . . . . . . . . . . . . . . . . . . . . . . . . . . . . . . . . . . 196
Capabilities . . . . . . . . . . . . . . . . . . . . . . . . . . . . . . . . . . 197
Architecture Overview . . . . . . . . . . . . . . . . . . . . . . . . 197
The Core Application . . . . . . . . . . . . . . . . . . . . . . . . . . 197
Automatic Startup and Shutdown . . . . . . . . . . . . . . . 198
Server Manager Operation . . . . . . . . . . . 199
Display Components . . . . . . . . . . . . . . . . . . . . . . . . . 200
Header . . . . . . . . . . . . . . . . . . . . . . . . . . . . . . . . . . . . . . 200
Service List . . . . . . . . . . . . . . . . . . . . . . . . . . . . . . . . . . 201
Control Buttons . . . . . . . . . . . . . . . . . . . . . . . . . . . . . . 202
Server Identification . . . . . . . . . . . . . . . . . . . . . . . . . . 202
Prompt Line . . . . . . . . . . . . . . . . . . . . . . . . . . . . . . . . . 203
Using the Interface . . . . . . . . . . . . . . . . . . . . . . . . . . . 203
Display Updates . . . . . . . . . . . . . . . . . . . . . . . . . . . . . . 203
Keyboard Input . . . . . . . . . . . . . . . . . . . . . . . . . . . . . . 203
vi
HP Medical Archive
Page 8

Command Operations . . . . . . . . . . . . . . . . . . . . . . . . 204
Monitoring Services . . . . . . . . . . . . . . . . . . . . . . . . . . 204
Starting Services . . . . . . . . . . . . . . . . . . . . . . . . . . . . . 205
Stopping Services . . . . . . . . . . . . . . . . . . . . . . . . . . . . . 205
Restarting the Server . . . . . . . . . . . . . . . . . . . . . . . . . . 205
Shutting Down the Server . . . . . . . . . . . . . . . . . . . . . . 206
Glossary . . . . . . . . . . . . . . . . . . . . . . . . . . . 207
Index . . . . . . . . . . . . . . . . . . . . . . . . . . . . . 213
vii
HP Medical Archive
Page 9

HPMA User Guide
viii
HP Medical Archive
Page 10

Preface
Purpose
This guide is intended to familiarize you with operating the
HP Medical Archive grid software. There are two software components covered by this document:
• Network Management System (NMS): the grid monitoring and
reporting interface
• Server Manager: used on all servers in the HP Medical Archive
Network Management System (NMS)
Once familiar with the NMS functionality, you can routinely refer to
this guide for information about system attributes, appropriate alarm
responses, and configuring components and alarm notifications. The
various grid service components, their configuration, and alarms are
documented. An alarm troubleshooting table is included for reference.
Currency
Server Manager
This guide covers the application interface, service monitoring functionality, and application features. The objectives of this document are
to enable you to use the Server Manager to:
• Monitor service operation
• Stop and start services on a node
• Restart a server
• Shutdown a server
Content of this guide is current with release 5.2 of the HP Medical
Archive software.
ix
HP Medical Archive
Page 11
HPMA User Guide
Server Manager
This release uses the Server Manager software version 2.0. This
version of the application does not report its version number.
Network Management System (NMS)
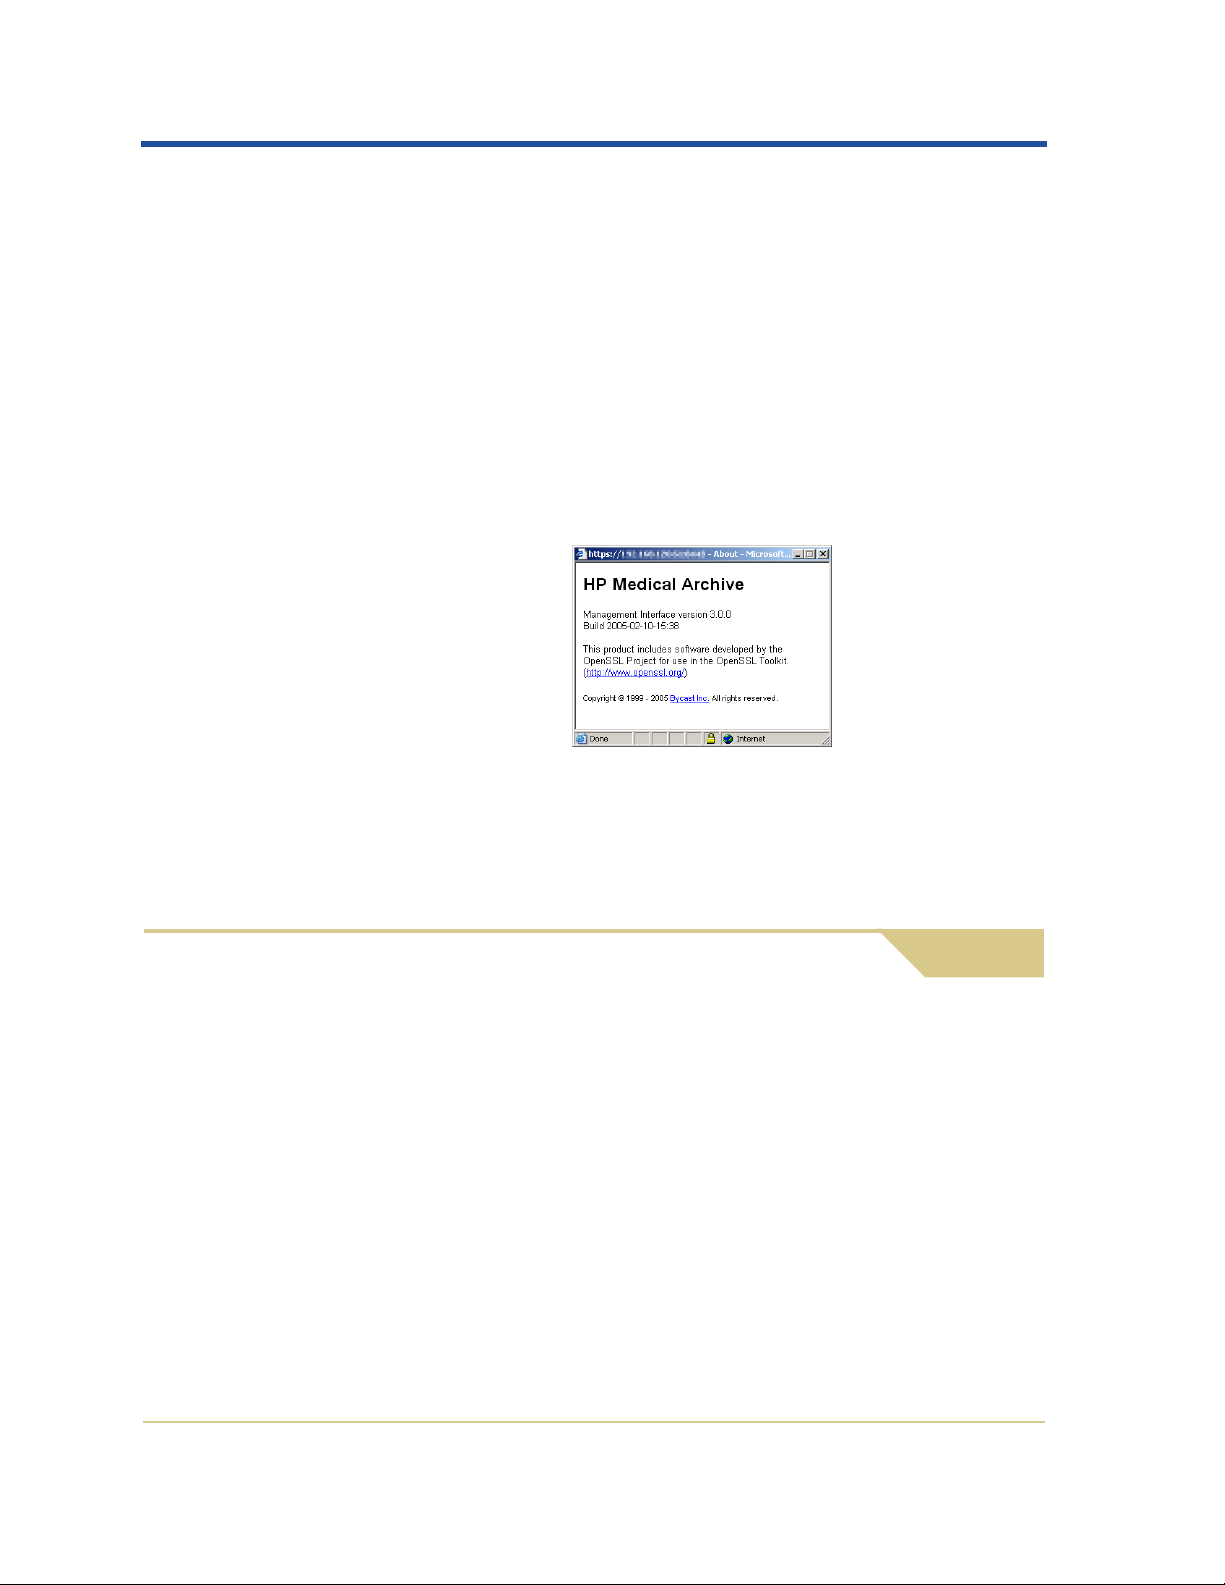
The content is current with the NMS software release version 3.0.0. To
find the version number of your NMS software:
1. Within any page of the NMS interface (after login), click the HP
logo in the top left corner to open a dialog showing the version
information.
2. Use your operating system’s window close button to close the
About dialog.
If you have an earlier version of NMS, contact HP technical support.
Intended Audience
The content of this guide is intended for storage grid administrators,
PACS administrators, and technical support staff responsible for maintaining the HP Medical Archive system.
You are assumed to have a general understanding of the grid’s components and functionality. A fairly high level of computer literacy is
assumed, including knowledge of file systems, tree-structured hierarchies, and network connectivity. You should also be familiar with
using and navigating an Internet web browser.
x
HP Medical Archive
Page 12

References
This document assumes familiarity with many terms related to
computer operations and network administration. There is also a wide
use of acronyms. An abbreviated glossary is included at the back of
this guide (page 207).
Document Structure
PDF editions include hyperlinks to assist navigating the document.
You may print copies of the PDF editions for internal use but all copies
must be treated as proprietary and confidential; not for general
distribution.
Preface
Using this Guide
This guide is comprised of nine chapters covering both general information and reference tables.
Readers new to the HP Medical Archive system should read the first
four chapters to gain an understanding of how the NMS works to help
you monitor the grid. The first two chapters introduce the basic functionality and interface layout of the NMS. The next two chapters
explain NMS functionality for understanding alarm monitoring and
notifications, and for obtaining reports.
The remaining chapters provide references to look up specific information. Chapters 5 and 6 provide reference information on services
and components. Chapter 7 is the final chapter on the NMS; a reference of alarms with troubleshooting tips.
The last two chapters deal with the Server Manager application used
on the HP Medical Archive cabinet console(s).
Chapters
Below is a brief overview of the content of each chapter.
Chapter 1: “Getting Started”—Introducing the HP Medical Archive
architecture and the role of the Network Management System within
xi
HP Medical Archive
Page 13

HPMA User Guide
it. This also describes the procedures to access the NMS and manage
user accounts.
Chapter 2: “Interface Components”—Describing the interface components, their use, and navigation.
Chapter 3: “Alarms”—Providing a conceptual overview of NMS
alarms, their types and levels, and explaining how to display, trace,
and respond to alarms. Use of the alarm history is also discussed.
Chapter 4: “Reports”—Explaining the report options and formats,
how to generate and print reports, and customizing the report view for
the data needed.
Chapter 5: “Services and Components”—Providing a detailed reference of services, their components, and attributes.
Chapter 6: “Configuration”—Describing procedures for customizing
the alarm notification settings, and other elements of system
configuration.
Conventions
Chapter 7: “Troubleshooting Alarms”—Providing a detailed table for
administrators to locate the appropriate response to an alarm, and
better understand the alarms and attributes.
Chapter 8: “Introduction to Server Manager”—Describing the Server
Manager application used on the console of each server in the grid.
Chapter 9: “Server Manager Operation”—Describing procedures for
using the Server Manager to gracefully connect and disconnect grid
nodes.
This guide adheres to conventions for terminology to avoid confusion
or misunderstanding. There are also conventions for typography to
enhance readability and usefulness of the text.
Terminology
There is some room for confusion between common computer
network terminology for “server” and “node” as they are used in this
document.
A server is usually thought of as a piece of computing hardware that
provides data services to requesting network clients; a resource pro-
xii
HP Medical Archive
Page 14

Preface
viding network, computational, and storage services. Within the
context of the HP Medical Archive, a server is a piece of hardware that
hosts one or more grid services.
Nodes in a network are usually defined as an independent entity with
a unique network identity, running on a resource. In this text, the use
of the term “node” refers to the logical entity of a building block
within the HP Medical Archive; it is a server combined with a predefined set of grid services that perform one or more tasks within the
grid.
The term “node” also appears within the NMS interface. In that
context, it generally refers to a single grid service, regardless of how
many services may be hosted on the server. See “Network and
Element Terminology” on page 3 for additional information.
Numerics
Numeric values are presented in decimal unless noted otherwise.
Hexadecimal values in the text are noted using the prefix “0x”; for
example: 0x3B.
Fonts
To assist you in easily picking out the elements of importance, changes
from the standard font are used:
• Items upon which you act are shown in bold. These include:
• Sequences of selections from the navigation tree, tabs, and
page options, such as: CN1-A-1
• Buttons or keys to click or press, such as Apply or <Tab>.
• Radio buttons or check buttons to enable or disable, such as
Save configuration as default.
• Field prompts, names of windows and dialogs, messages, and
other literal text in the interface is shown in sans-serif such as the
LDR State pull-down menu, or the Sign In... window.
• Items within the narrative that require emphasis appear in italics.
• Command or parameter text that is variable (to be replaced by
specific values by the system or when entered) is noted in italics,
such as HPMA_GID_<nnnn>.
X CMS X Reports X Chart.
xiii
HP Medical Archive
Page 15

HPMA User Guide
Keyboard Input
Keyboard keys that use words or standard abbreviations are shown
within angle brackets, such as <Ctrl> for the control key, <Tab>,
<space>, and <Enter>. Where combinations are to entered, they are
noted as <Alt>+<F7>. Where key sequences are needed, they are noted
without the plus “+”, for example: <space>Y<Enter>.
Instructions for keyboard entry come in three forms:
• “Enter” a command or value does not specify pressing <Enter> at
the end; pressing <Enter> at the end is assumed.
• “Type” a string or value explicitly includes any terminating
<Enter> or <Tab> keystroke. If one is not shown, do not assume
one.
• “Press” a key intends that only the specified key should be
pressed; do not also press the <Enter> key.
Color
Contacts
Color plays a helpful role in identifying elements in the text. This
guide is available in color in the PDF edition. The narrative does not
assume that you are reading it in color.
For general product and company information, refer to the HP web
site at:
www.hp.com
If you cannot find the information that you need in this document,
there are several other resources that you can use to get more detailed
information.
• The HP website (http://www.hp.com)
• Your nearest HP authorized reseller (for the locations and tele-
phone numbers of these resellers refer to the HP website)
• HP technical support:
• In North America, call 1-800-652-6672.
• For other regions, refer to the HP website.
xiv
HP Medical Archive
Page 16

Getting Started
NMS and the HP Medical
Archive Architecture
Elements of the grid and capabilities of the
Network Management System.
Chapter Contents
1
Architecture Overview . . . . . . . . . . . . . . . . . . . . . . . . . . . . . . . . . .2
Network and Element Terminology . . . . . . . . . . . . . . . . . . . .3
Capabilities. . . . . . . . . . . . . . . . . . . . . . . . . . . . . . . . . . . . . . . . .4
Software Requirements. . . . . . . . . . . . . . . . . . . . . . . . . . . . . . . . . .5
Accessing the NMS . . . . . . . . . . . . . . . . . . . . . . . . . . . . . . . . . . . . .5
Log in. . . . . . . . . . . . . . . . . . . . . . . . . . . . . . . . . . . . . . . . . . . . . .6
Log Out . . . . . . . . . . . . . . . . . . . . . . . . . . . . . . . . . . . . . . . . . . . .6
Managing User Accounts . . . . . . . . . . . . . . . . . . . . . . . . . . . . . . . .7
Account Management Configuration. . . . . . . . . . . . . . . . . . .8
Editing Your Account . . . . . . . . . . . . . . . . . . . . . . . . . . . . . . .10
1
HP Medical Archive
Page 17

HPMA User Guide
Architecture Overview
The HP Medical Archive architecture provides a secure, reliable, and
high performance solution for the storage and distribution of very
high volumes of fixed content health care data within a data center
and optionally a disaster recovery (DR) site.
The term “grid computing” is inspired by the success of the interconnection of the electric power and communication network
infrastructure in the late 1800s and early 1900s.
The power grid manages the available power resources and balances
loads to ensure continuous operation. How and where the power originates is transparent to the consumer. During peak hours, available
resources are automatically balanced and power is rerouted to where
it is needed most. As demand increases, additional generating
resources come online, and they are transparently utilized. Similarly,
when stations go offline or get decommissioned, there are no
consumer service disruptions. The grid automatically balances the
available resources to changing demand; loss of a subset of resources
does not result in degraded service.
Grid computing is based on the principle that access to computational
resources (storage, processing power, and data) can be enhanced with
high levels of reliability and scalability, analogous to obtaining electric
power from the power grid. Grid storage is the application of grid
computing principles to storage architecture: directories, query,
resource management, and fault management.
The HP Medical Archive system is composed of multiple nodes, which
form a unified archive. Each node consists of software services operating on a server that manages a limited capacity storage resource.
Within a given facility, all nodes are interconnected using standard
TCP/IP networking, and communicate with local imaging modalities,
PACS, and workstations. Wide Area Network (WAN) links extend the
grid, enabling off-site replication of content for disaster recovery.
The HP Medical Archive deployment relies on open standards for
interoperability with external hospital systems. Exchange of clinical
data with external clinical systems, including PACS, viewing workstations, and modalities, takes place over standardized network file
system protocols (NFS/CIFS) or (optionally) via established imaging
protocols, including DICOM.
2
HP Medical Archive
Page 18

Role of the Network Management System (NMS)
The Network Management System (NMS) performs two primary functions for HP Medical Archive deployments:
• It is a monitoring system that notifies administrators of problems
when the status of key hardware or software changes.
• It is a browser-based interface making the system easily available
to multiple users for:
• Reporting status information about the grid’s hardware and
software so you can monitor and resolve grid issues.
• Creating, viewing, and printing reports on current and historic
data about each grid component based on your selection of
report criteria.
• Configuring grid components and customizing the notification
settings according to your criteria.
Network and Element Terminology
Getting Started
The Network Management System views the HP Medical Archive
system as having tiers, or layers of detail. From the highest (big
picture) to the lowest (most granular detail) the elements are:
• Locations
• Nodes
• Services
• Components
• Attributes
Locations
The location tier views the grid as being made up of geographically
separate facilities or groups of nodes. The HP Medical Archive can be
deployed as a Single Site (Site A) or Single Site + DR (Site A and Site B).
Nodes
Within the context of the HP Medical Archive system, a node is a
server hosting a collection of one or more grid services. Physically, a
server is a computer with associated storage and network resources.
Logically, a node hosts services that the NMS can monitor and
manage. (The NMS itself is a service that runs on one or more servers.)
3
HP Medical Archive
Page 19

HPMA User Guide
Services
A service is a software module providing a set of capabilities to the
HP Medical Archive system. They are discussed in detail in Chapter 5.
Each service consists of components that deliver a particular capability. Each node of the grid has a predefined set of services that it hosts.
Services are typically identified by a three letter acronym.
Components
A component within a service delivers a particular capability. Each
component has a set of configurable attributes that can be monitored
automatically.
Services contain one or more components. Each component contains a
set of attributes.
Capabilities
Components have names defined by the software.
Attributes
The most granular level of the system is an attribute. This is a single
value or property of a component in a service. Attributes are the
elements that are monitored for alarm states and may be included in
reports.
Every component contains a set of attributes associated with the capability it enables.
For each service and component the NMS interface presents four tabs,
one for each capability:
• Overview—property information about the service or component.
You can use this capability to trace alarms, generate immediate
reports (page 39), and get an overall sense of a service or component’s performance.
• Alarms—showing the status of monitored attributes and reporting
alarm histories, enabling you to trace and troubleshoot current
alarms and analyze alarm histories to prevent future problems.
• Reports—for generating reports on current and historical condi-
tions of attributes to monitor and improve system performance.
4
HP Medical Archive
Page 20

• Configuration—to set or change service settings or alarm monitor-
ing conditions.
Consult the specific service descriptions in Chapter 5 for details of the
exact information and Chapter 6 for settings available.
Software Requirements
Accessing the NMS requires access to a web browser with grid access
to a well-known address (defined by your system administrator).
At this time, the only supported browser is:
• Microsoft Internet Explorer v6.0 SP2 (and above)
• JavaScript and cookies must be enabled
To view the customized and dynamic graphics used by the NMS, you
must also download and install:
• Adobe SVG Viewer plug-in
The plug-in is available from the Adobe web site:
www.adobe.com/svg/viewer/install/
Getting Started
This viewer supports Scalable Vector Graphic technology (SVG); a
powerful tool used for high quality graphics that are dynamically
created from real-time data.
Accessing the NMS
The Network Management System (NMS) can be accessed using a
supported web browser (page 5).
Both the user name
and password are
case sensitive.
You require a user name and password to access the system. Each
system user is assigned their user name and password when first
introduced to the NMS. If you did not receive a user name and password, contact your system administrator. (See “Managing User
Accounts” on page 7 for more information.)
5
HP Medical Archive
Page 21

HPMA User Guide
Log in
Once you have accessed the NMS via your browser, the HP Medical
Archive log in... window appears.
Figure 1: NMS log in Window
To log into the NMS:
1. Click in the username field to place the cursor in the field.
2. Type your username (case sensitive).
3. Press <Tab> to move the cursor to the password field.
4. Type your password (case sensitive). Keystrokes appear as aster-
isks (*) to protect your password.
5. Click the GO button to access the NMS interface.
Your grid map appears. See the next chapter for information on
using the interface.
If the username or password you entered could not be validated, the
window shows an appropriate message in red (such as “Invalid user
name. Please enter a valid user name and password.”) below the
password field. Repeat the login process to correct your entry.
If you have forgotten your password, contact HP technical support to have
your password reset.
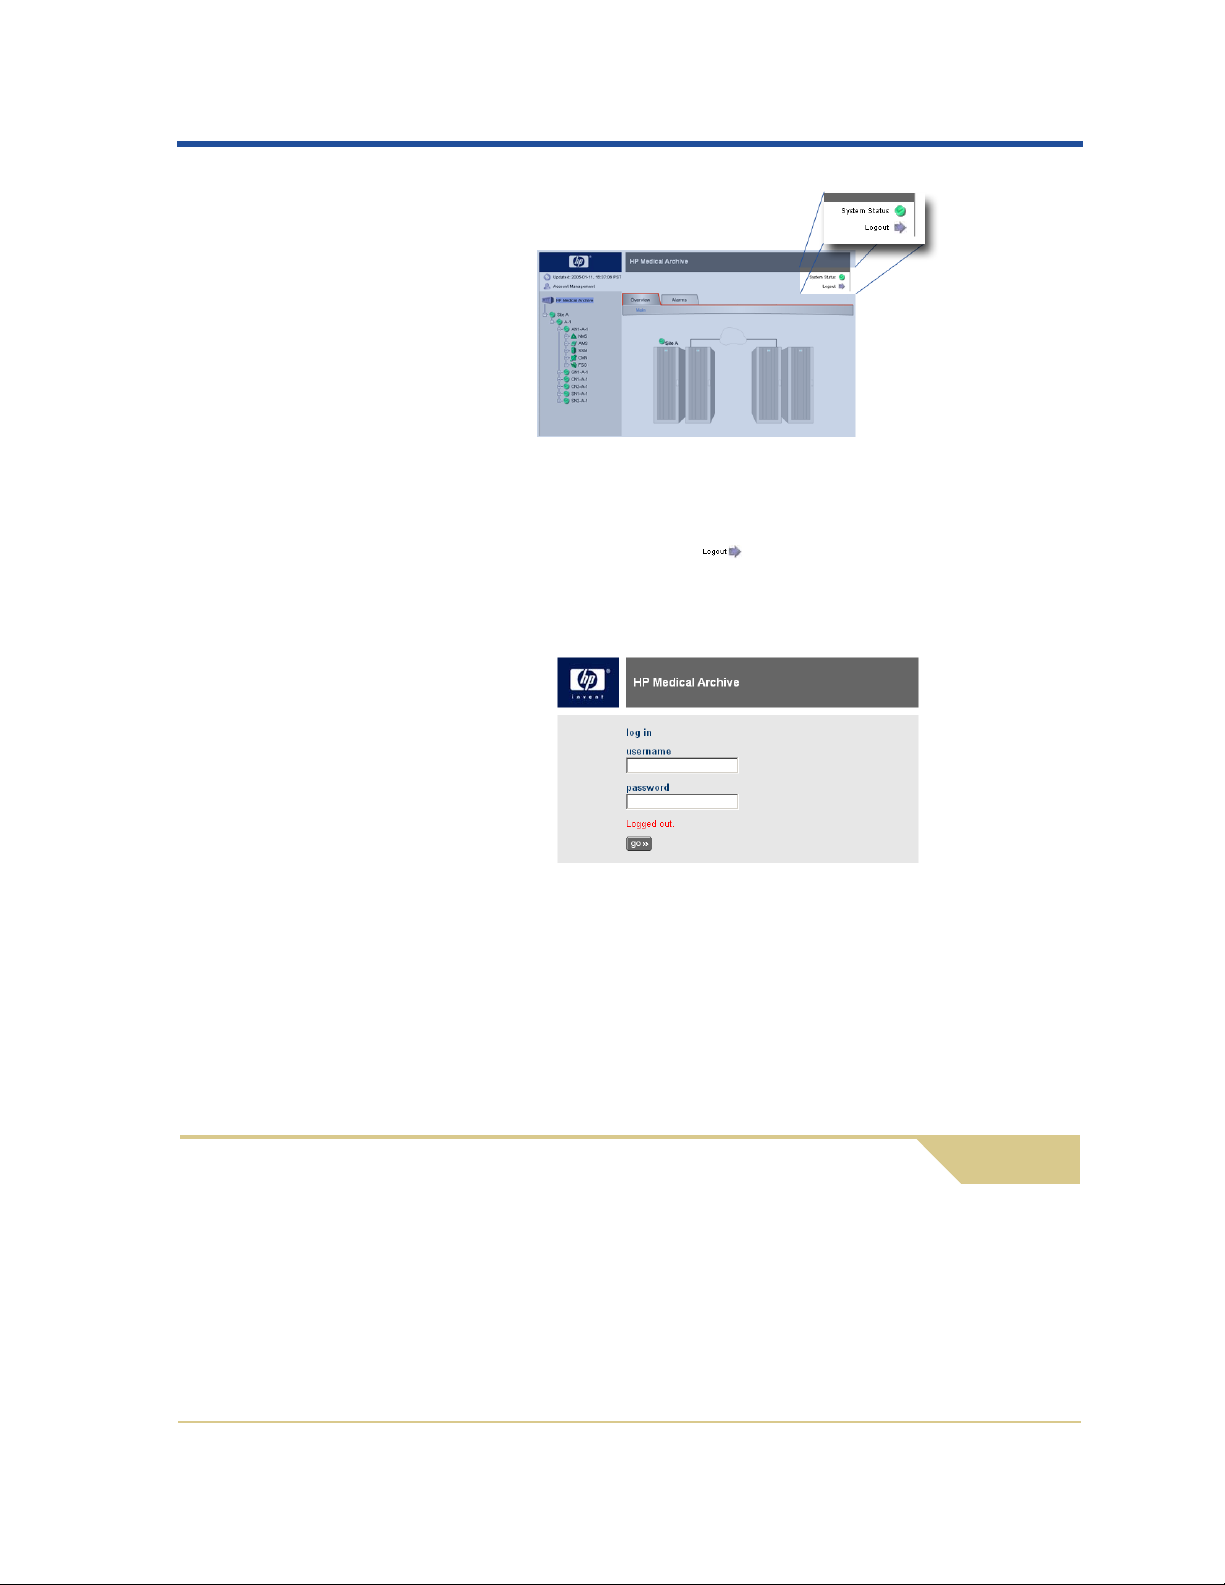
Log Out
When you have finished your NMS session, be sure to log out to keep
the system secure. The Logout arrow button is located under the
System Status icon at the top right corner of the screen.
6
HP Medical Archive
Page 22
Getting Started
Figure 2: Location of the Logout Button
To log out :
1. Click on the Logout arrow button to log out.
The Network Management System log in... screen appears with the
message “Logged out” displayed below the password field.
Figure 3: Successful Log Out Window
2. You may safely close the browser or continue using other
applications.
Failure to log out may permit other (unauthorized) users of the workstation to continue accessing your NMS session. Note that simply
closing your browser is not sufficient to log out of the session.
Managing User Accounts
At the time of installation, default user and group accounts are configured for you. There is an account for system technical support
(Vendor) that has full permissions. The account for your use is the
Admin user. These accounts cannot be deleted.
7
HP Medical Archive
Page 23
HPMA User Guide
You may on ly a lte r th e Password, First Name, and Last Name for your
account.
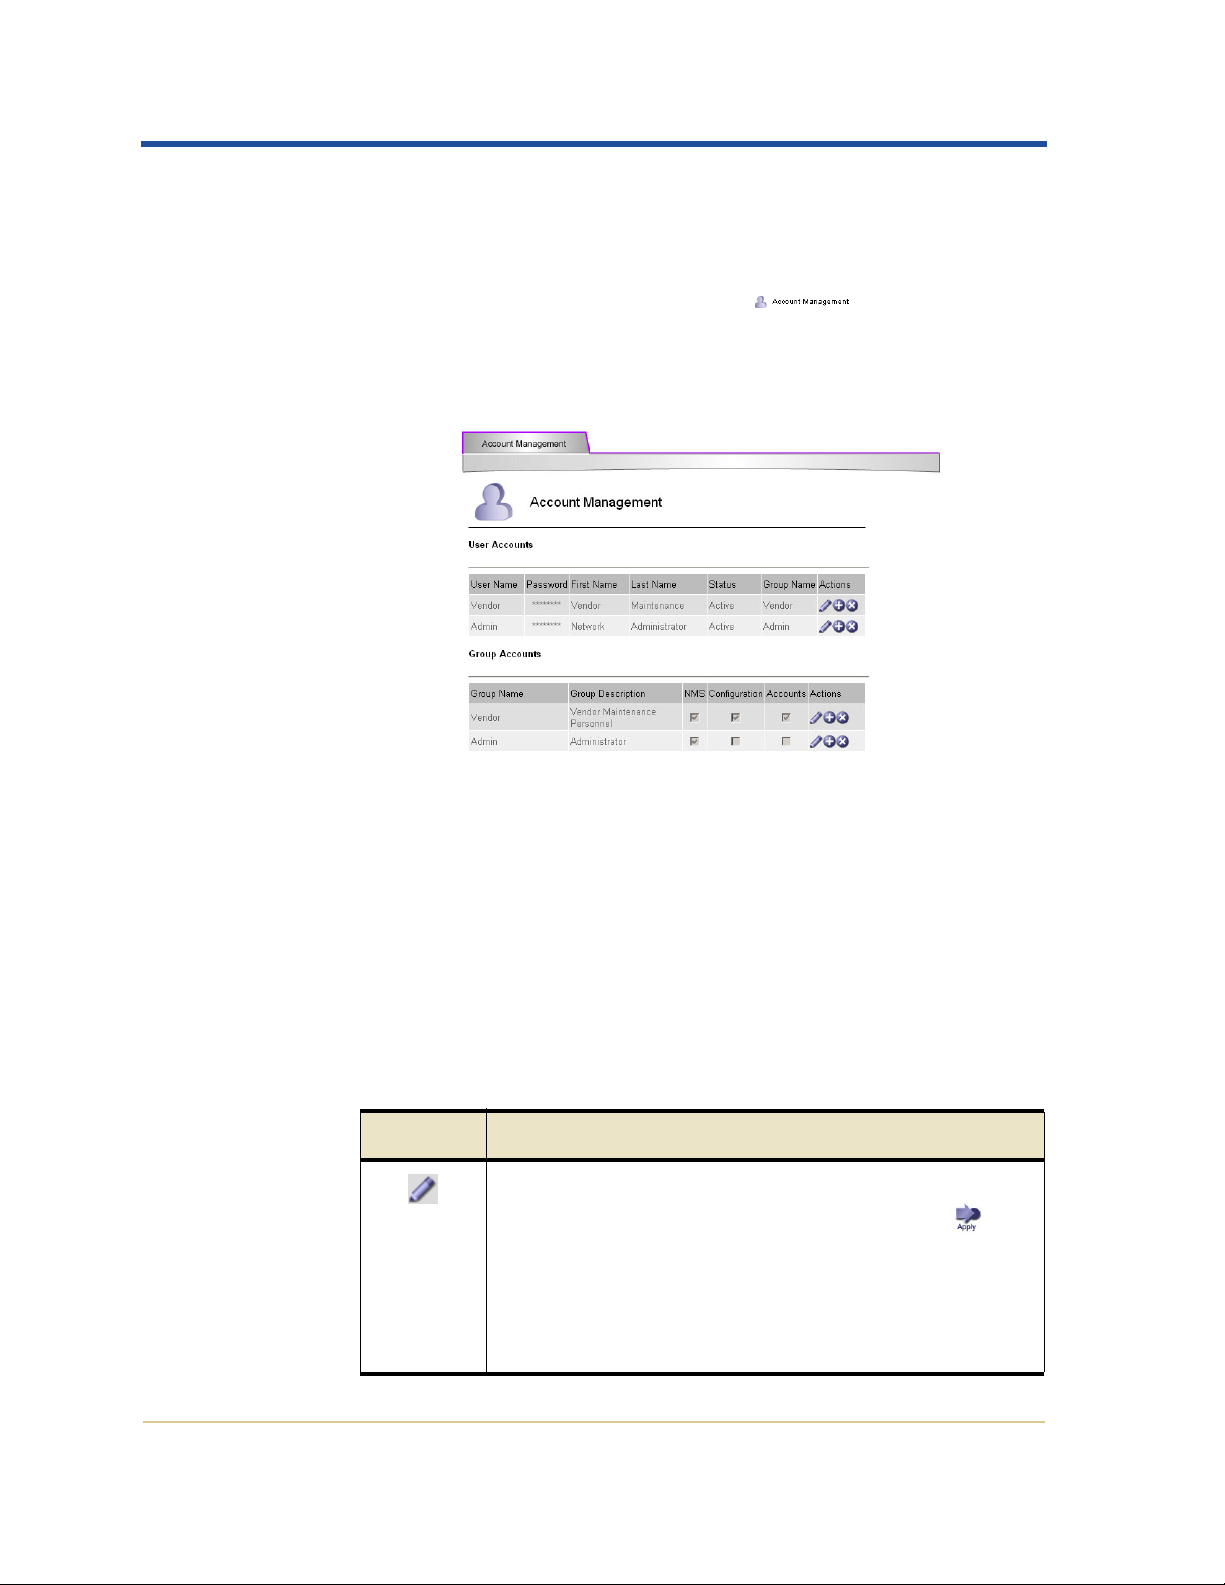
To access the account management panel of the NMS:
1. Click on the Account Management button in the top
left of the Header frame (Figure 2 on page 7).
The Account Management tab appears in the Content frame. Using
the Admin account, only your own account and group appear.
Figure 4: Sample Account Management Tab
To return to the usual NMS content tabs, select any item in the Navigation tree.
Account Management Configuration
User accounts are configured to use a group account profile to control
permissions within the NMS. Action buttons are used to make changes
to account settings.
Table 1: Account Configuration Controls
Action Description
Edit the settings for the row. This enables the fields in
the row to be edited. It also enables the Apply
button at the bottom of the page. Changes are not com-
mitted until the Apply button is selected.
The default HP Medical Archive accounts and groups
cannot be deleted. Only the password, first, and last
name can be edited.
8
HP Medical Archive
Page 24
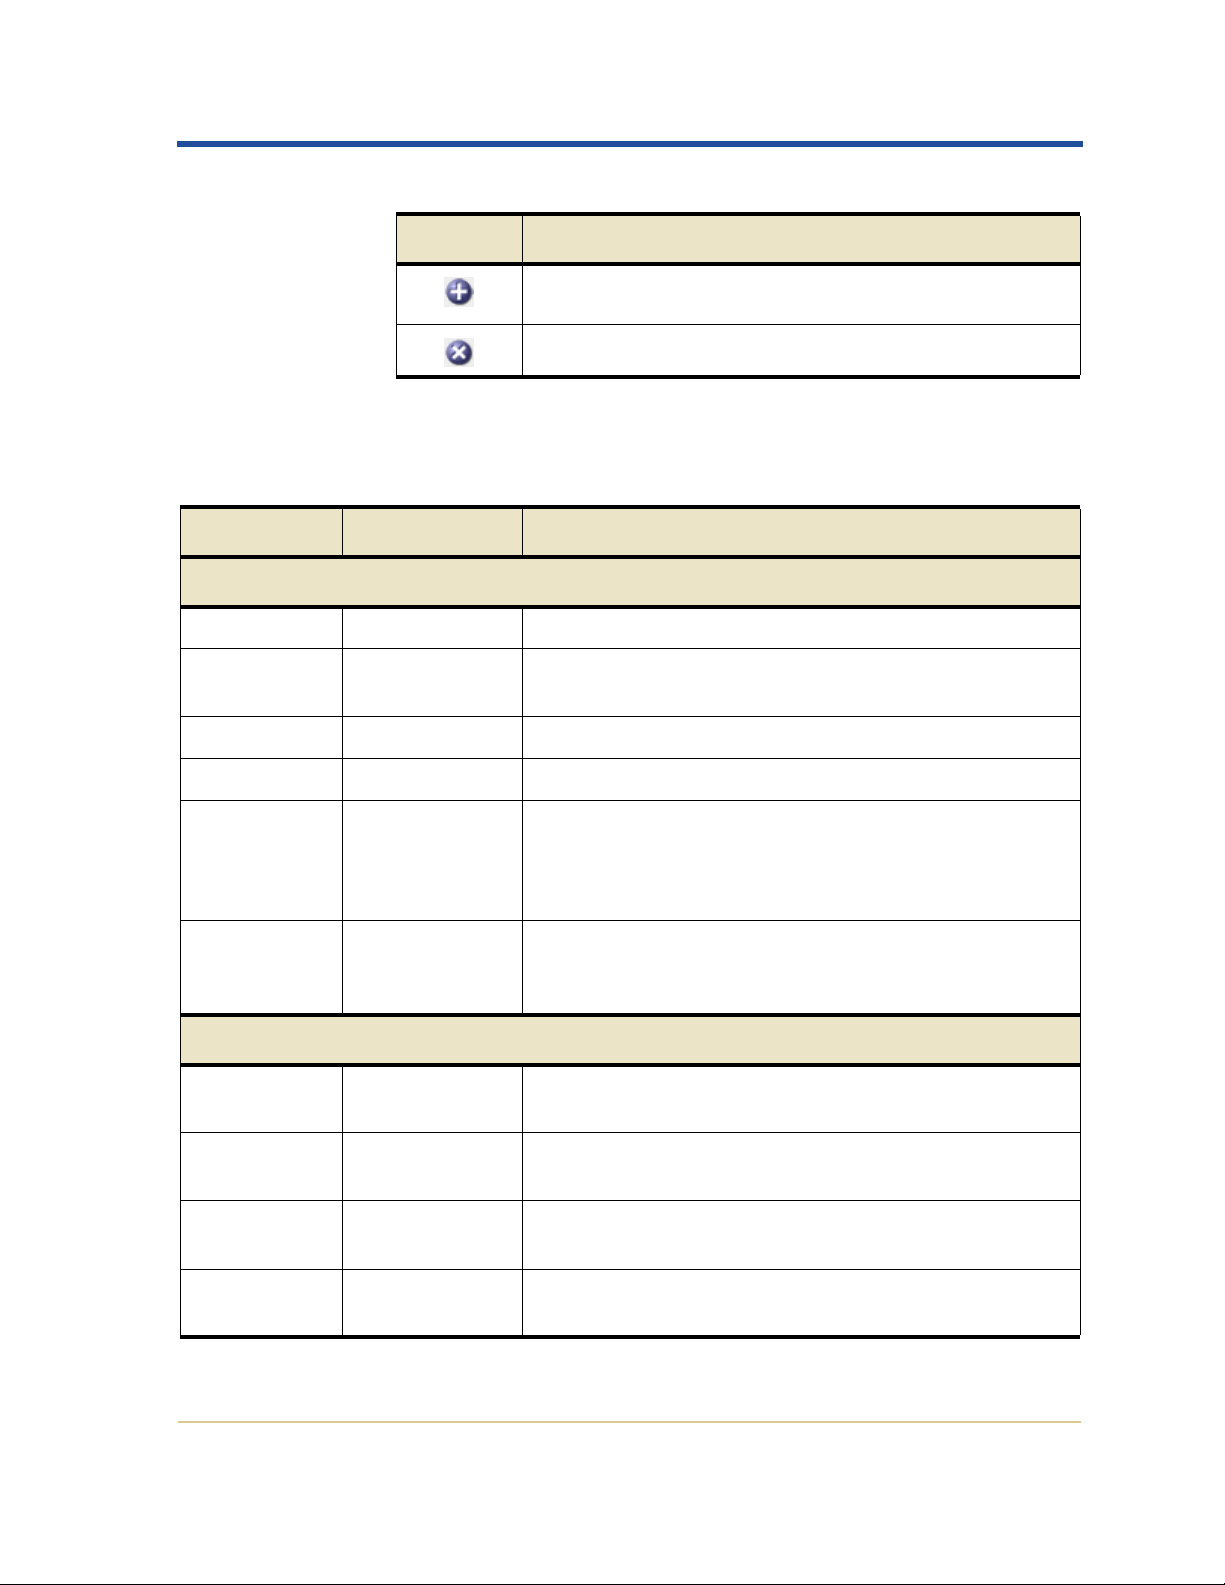
Table 1: Account Configuration Controls (cont.)
Action Description
Disabled for the Admin account.
Disabled for the HP Medical Archive default accounts.
The accounts and groups displayed indicate the profile of an account
and the permissions that each profile supports.
Table 2: Account Management Attributes
Attribute Type / Units Description
User Accounts
User Name Text The user name entered at login.
Getting Started
Password Encrypted Masked password for the account; shown as a string of
asterisks.
First Name Text User’s first name.
Last Name Text User’s last name.
Status Enumerated
text
The current status of the account:
Active—the user can log in and use NMS
Disabled—the user account is prevented from
logging in.
Group Name Text Case sensitive reference to an entry defined in the
Group Accounts table. The profile governs the permitted activities for user accounts within this group.
Group Accounts
Group Name Text A case sensitive user defined profile name. This name
is referenced in the Group Name for a user account.
Group
Description
Text User-defined description; the intent of the user group
profile.
NMS Check box Enables access to monitor the grid using the NMS. This
excludes access to some Configuration tab items.
Configuration Check box Enables access to the Configuration tab Main page of
the CMN service.
9
HP Medical Archive
Page 25
HPMA User Guide
Table 2: Account Management Attributes (cont.)
Attribute Type / Units Description
Accounts Check box Enables full access to the Account Management tab.
When deselected, the user can access the tab to:
• View only their own account settings
• Edit their password, first and last name
Editing Your Account
All users can access the settings for their own account. The action
buttons for inserting a blank line and deleting a line are disabled. You
can edit your entry to change the password, first, and last name.
1. Click the edit button on the line in the User Account table to
enable entry fields.
2. To change your password:
You m ay n e e d t o
configure your
browser to permit
popups from this
site.
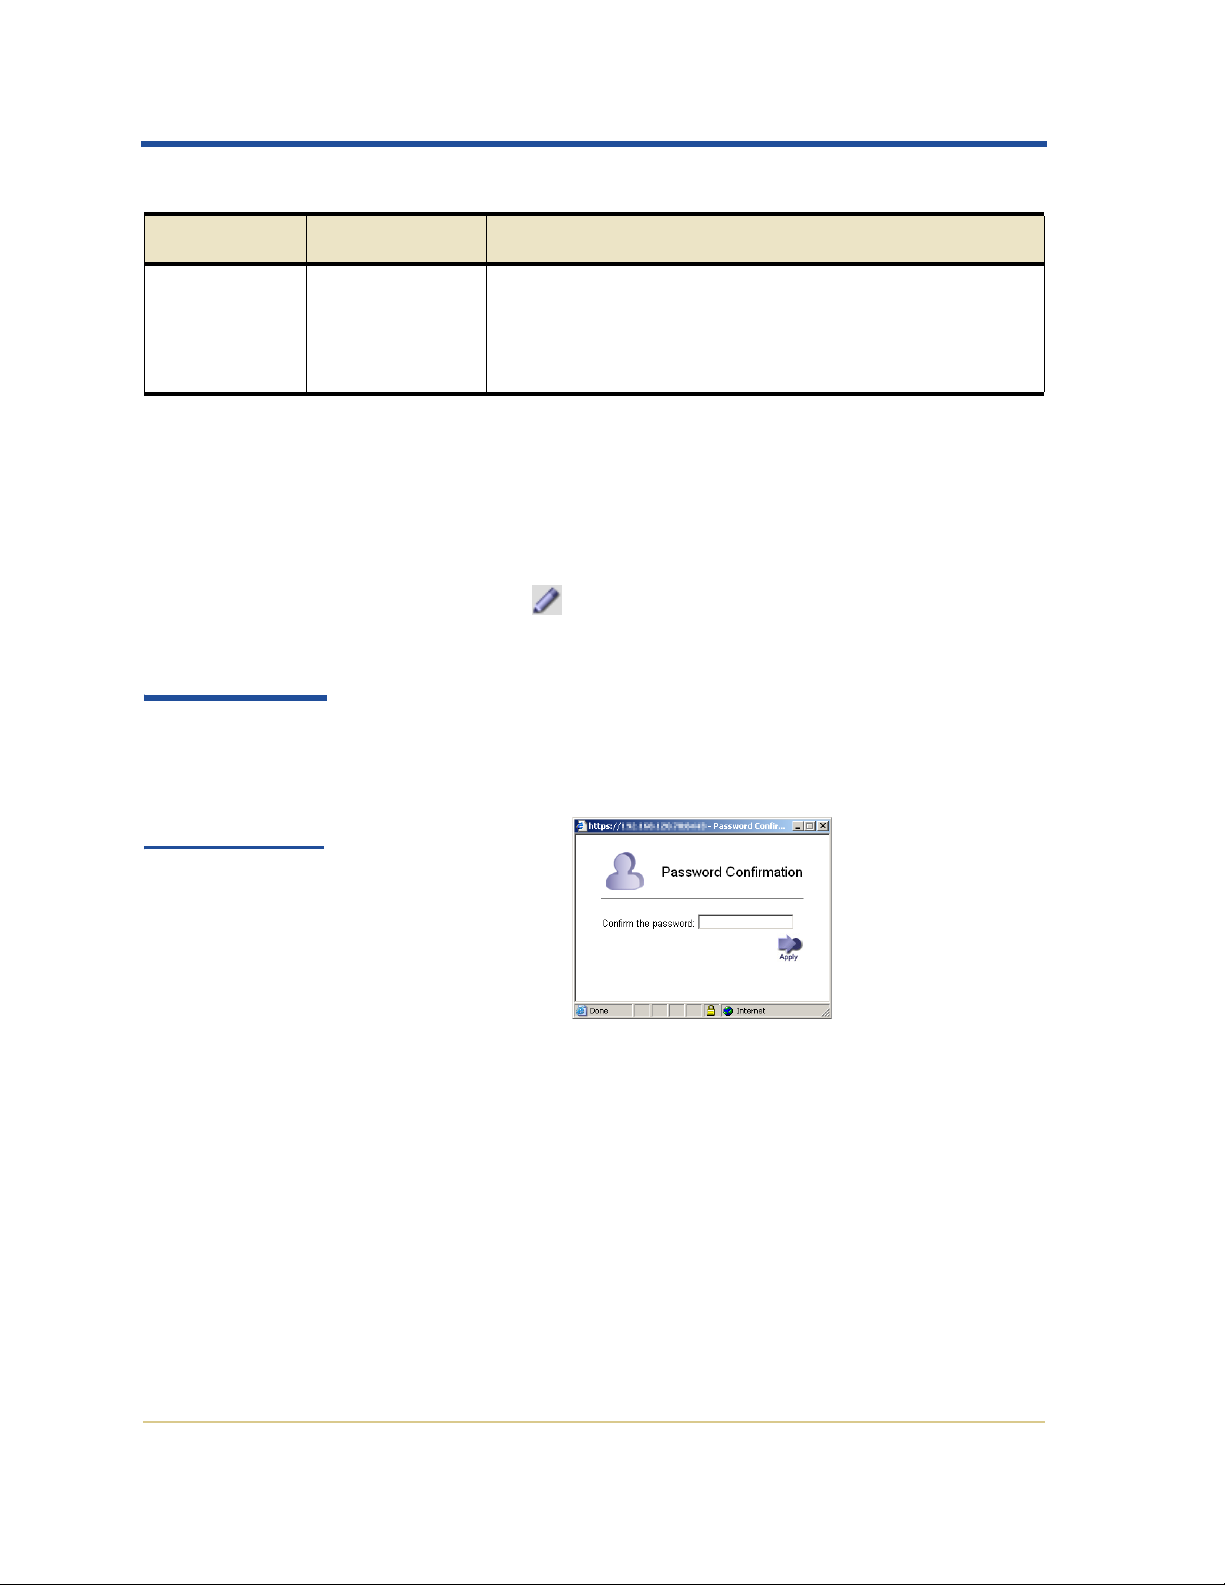
a. Double-click the Password entry to select the complete field.
b. Type a new password and press <Tab>. A popup window
appears to confirm the password:
Figure 5: Password Confirmation Popup
c. Re-enter the password in the popup window.
d. Click the Apply button in the popup window to confirm the
password and close the popup. If the password fails to match, a
dialog appears advising you to re-enter the password (step 2a).
3. To change your real name: edit the First Name and Last Name
fields.
4. Click the Apply button to commit the changes.
10
HP Medical Archive
Page 26

Interface Components
Navigating the NMS Interface
Chapter Contents
2
Frames . . . . . . . . . . . . . . . . . . . . . . . . . . . . . . . . . . . . . . . . . . . . . . .12
Header . . . . . . . . . . . . . . . . . . . . . . . . . . . . . . . . . . . . . . . . . . . . . . .12
Refresh Time . . . . . . . . . . . . . . . . . . . . . . . . . . . . . . . . . . . . . .13
System Status Indicator . . . . . . . . . . . . . . . . . . . . . . . . . . . . .14
Logout Button . . . . . . . . . . . . . . . . . . . . . . . . . . . . . . . . . . . . .14
Version Information . . . . . . . . . . . . . . . . . . . . . . . . . . . . . . . .14
Navigation Tree . . . . . . . . . . . . . . . . . . . . . . . . . . . . . . . . . . . . . . .15
Tree Structure. . . . . . . . . . . . . . . . . . . . . . . . . . . . . . . . . . . . . .15
Status Indicators . . . . . . . . . . . . . . . . . . . . . . . . . . . . . . . . . . .16
Content Frames . . . . . . . . . . . . . . . . . . . . . . . . . . . . . . . . . . . . . . .16
Tabs . . . . . . . . . . . . . . . . . . . . . . . . . . . . . . . . . . . . . . . . . . . . . .16
Property Information (Overview). . . . . . . . . . . . . . . . . . . . .17
Alarms. . . . . . . . . . . . . . . . . . . . . . . . . . . . . . . . . . . . . . . . . . . .19
Reports . . . . . . . . . . . . . . . . . . . . . . . . . . . . . . . . . . . . . . . . . . .19
Configuration. . . . . . . . . . . . . . . . . . . . . . . . . . . . . . . . . . . . . .19
Navigating Locations and Nodes . . . . . . . . . . . . . . . . . . . . . . . .21
Location and Node Maps. . . . . . . . . . . . . . . . . . . . . . . . . . . .21
11
HP Medical Archive
Page 27

HPMA User Guide
Frames
The NMS interface is divided into three key sections or frames:
• Header
• Navigation Tree
• Content Frame
Every “page” of the NMS interface contains these three frames.
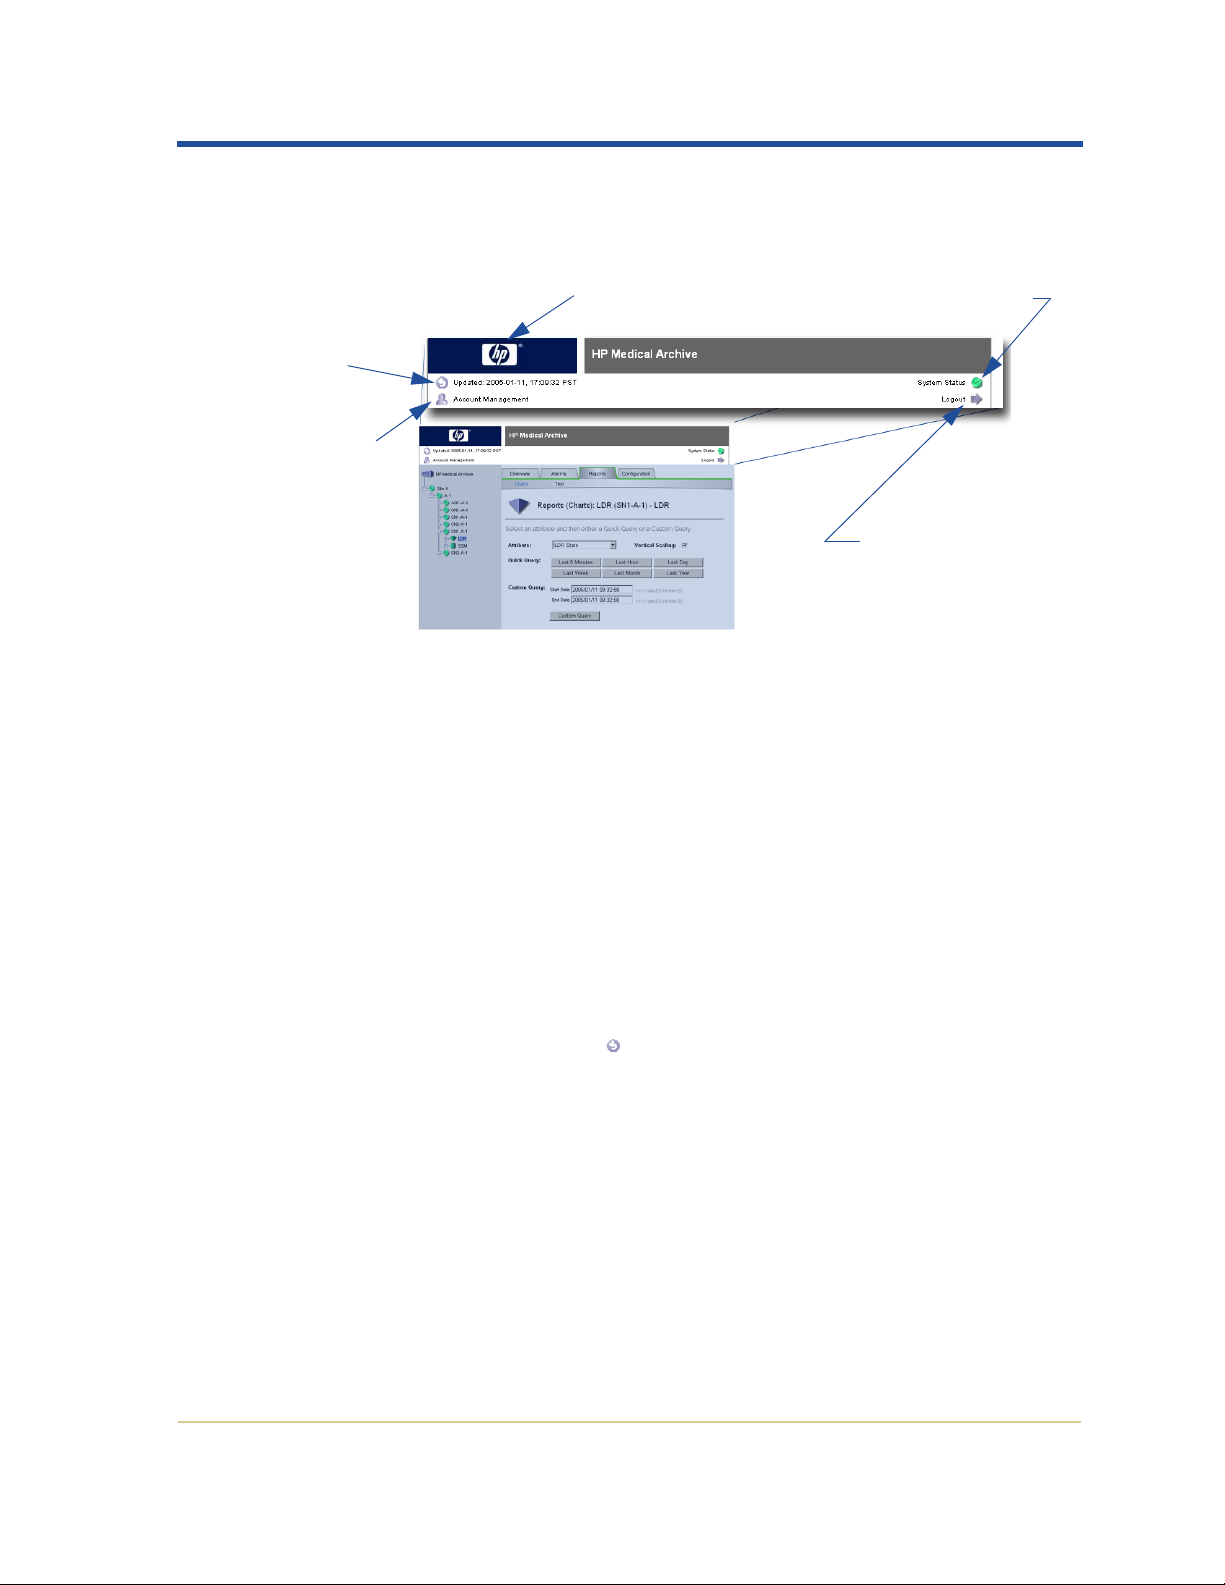
Header
Header
Content
Frame
Navigation Tree
Figure 6: NMS Interface—Frames
The Header frame of the NMS interface contains high-level grid status
information. This frame is primarily used as a reference, providing a
quick overview of the grid’s vital statistics as well as buttons to
manage user accounts and log off of the NMS system.
The latest refresh date and time are shown on the far left along with
the Account Management button. The right side contains the System
Status icon and the Logout button. The Hewlett-Packard logo in the
12
HP Medical Archive
Page 28
Interface Components
top left serves as a button to access the HP Medical Archive Management Interface version information.
Refresh Time
Account
Management
Button
Refresh Time
Version Information
(click logo)
Logout Button
Figure 7: NMS Interface—Header Frame
Information presented in the NMS interface is time-sensitive. Since the
interface is delivered as HTML “pages”, the content shown is static.
The “Updated” date and time indicates when the data shown was collected; the time at which the grid status “snapshot” was taken. The
refresh information is very useful when addressing an alarm situation.
System Status
Indicator
Refreshing the Display
To take a new “snapshot” of the grid status:
• Select the update icon or the date and time text
—or—
• Select the “refresh” button on your browser (for Microsoft Internet
Explorer, press <F5>).
After the page has finished reloading, the content is updated and the
update time reflects the time you took the snapshot.
The interface automatically triggers a refresh at intervals of about one
minute. Configuration pages that allow input do not automatically
refresh, allowing you to complete your data entry without
interruption.
13
HP Medical Archive
Page 29

HPMA User Guide
System Status Indicator
The System Status icon indicates the highest level of alarm within the
grid. If there are no alarms in the system, the icon displays a normal
status (green) as seen in Figure 7 on page 13.
Select the icon to see the Grid Map
current alarm states that are not “normal”.
See “Alarm Levels and Indicators” on page 28 for a description of the
range of alarm indicators. Chapter 3 covers alarms in detail.
Account Management Button
The Account Management button is used to access the
Account Management tab allowing you to access user account settings.
The Admin user can view their own account settings and make
changes to their password and the settings for their first and last
names.
Only the Vendor maintenance user has Account permission to:
• View all accounts
• Reset forgotten passwords
See “Managing User Accounts” on page 7 for more details.
Logout Button
X Alarms X Main page listing all
The Logout arrow button is used to log off of the NMS, ending
your session. Be sure to log off the system every time you finish a
session to protect the grid from unauthorized access. See “Log Out” on
page 6 for more specific information.
Version Information
Clicking on the HP logo at the top left corner of the Header frame
opens a dialog with the interface version number, the software build
date, and copyright information. See “Currency” on page ix for an
example.
14
HP Medical Archive
Page 30

Navigation Tree
The Navigation Tree on the left side of the NMS interface displays a
tree structure of the grid: the sites, cabinets, nodes, services, and components. This frame provides quick access to any element of the grid.
Naming Conventions
The names that appear in the Navigation Tree follow the following
convention:
• Locations:
• Site A—The primary site for the HP Medical Archive.
• Site B—An optional Disaster Recovery (DR) site.
• Cabinets:
• A-1 through A-8—Cabinets at the primary site. (Limited to A-4
• B-1 through B-4—Cabinets at an optional DR site.
• Nodes—Named using the following elements:
• Two or three-letter code for the type of node (such as: AN for
• A sequence number (1 through 4) within the cabinet
• The cabinet identifier (such as B-1, A-3, and so on)
• Services—Named by the software with a three letter acronym and
then the node ID in parenthesis, such as ADC (11010115) for an
Administrative Domain Controller service.
• Components—Named by the software
Interface Components
if the optional DR site exists.)
Admin Node, GN for Gateway Node, or CSN for Control/
Storage Node)
Example: GN1-A-1 is the primary Gateway Node in cabinet
A-1.
Tree Structure
By clicking on the +/- sign to the left of a name, you reveal/hide the list
of related grid elements on that branch. This enables progressive disclosure of grid elements while keeping the number of items listed
more manageable.
To view detailed information about an element of the grid, click on the
element’s name. The information is displayed in the Content frame of
the NMS interface.
15
HP Medical Archive
Page 31

HPMA User Guide
Status Indicators
The icon beside each location, cabinet, node, and service reflects the
overall status of that part of the grid. (Components do not include a
status indicator; they retain their normal icon and color.) If there are no
alarms, the icon appears in the normal (green) state. If there is an
alarm, the icon reflects the most severe alarm currently active on that
branch of the tree (see Table 3 on page 29).
Content Frames
After using the Navigation Tree to select a grid element, you can use
the Content frame to view and report on the component’s status,
alarms, and configuration.
Tabs
The Content frame of the NMS interface displays information on tabs
appropriate to the element:
• Overview
• Alarms
• Reports
• Configuration
Figure 8: NMS Interface—Tabs
Some tabs do not apply to some elements. Only applicable tabs appear.
Select the tab to view its contents.
16
HP Medical Archive
Page 32

Interface Components
Page Selectors
Some tabs organize information into “pages”. If so, a page selector
appears below the selected tab. Select the page name to access that
view.
Figure 9: NMS Interface—Page Selectors
The currently selected page is shown in blue, alternate page options
are in black.
Property Information (Overview)
The Overview tab provides a list of service and component attributes
with their values and (if notification is active) their current status. It
includes attribute information specific to the service or component;
consult the specific service descriptions in Chapter 5 for details of the
exact information available.
17
HP Medical Archive
Page 33

HPMA User Guide
Figure 10: Sample Overview Page
Text Color
The display of attribute values normally appears black, indicating the
service is running normally (reporting to the NMS). If the text appears
blue, the service is in an unknown state (not reporting to the NMS) and
the attribute values shown are the last known values. In cases where a
service is gracefully removed from the grid (offline) the last known
attribute values appear in gray italics.
Immediate Reports
Beside attributes that support chart style reports (“Charts” on page 42)
there is an icon indicating the format of the chart available. Selecting
the icon delivers the page with the Immediate report (“Immediate
Reports” on page 39) for that attribute over the past hour.
Active Alarms
If an alarm status icon (Table 3 on page 29) appears beside the
attribute’s name on the Overview page, alarm monitoring for that
attribute is active (see “Enabling (or Disabling) an Alarm” on
page 157). The attribute status can be viewed in more detail on the
Alarms tab by clicking the icon.
18
HP Medical Archive
Page 34

Alarms
Interface Components
The Alarms tab provides information to trace the source of an alarm
and to review an alarm’s history. This tab offers two pages of
information.
• The Main page displays a table of the attributes actively being
monitored, showing their current state. Each row represents a
monitored attribute and the color represents the alarm state. The
table includes the attribute code, the description, and the alarm
time of faults.
• The History page provides query functionality for attribute alarm
histories. Reviewing the alarm history is useful for preventing grid
issues and for proactive grid maintenance. The query mechanism
operates in the same fashion as custom reports (page 41).
See Chapter 3 for a full description of the alarm capability.
Reports
Configuration
The Reports tab starts with a form to create a quick report or custom
query about a selected attribute. There are two kinds of reports available, chart and text, selected using the appropriate page option.
• The Chart page produces graphical data for the selected attribute.
• The Te xt page produces tables of data.
Both are useful tools for analyzing the system and for troubleshooting
alarms. See Chapter 4 for a full description.
The Configuration tab offers two pages for configuring the main properties of the service or component, and for setting the alarm
monitoring features.
19
HP Medical Archive
Page 35

HPMA User Guide
Some configuration items are not accessible to the Admin account. These can
only be changed using the Vendor account.
• The Main page form allows you to change the state, label, and
notes related to an attribute.
WARNING
Changing configuration settings requires careful and deliberate
planning. Some configurable elements can affect the state of
your live system. Only experienced administrators should alter
the device and component configuration settings.
CAUTION
Changes to the configuration are rarely needed, and should
only be undertaken after consultation with HP technical
support.
• The Notification page is used to change the notification details for
an attribute, as well as activating and deactivating alarms. This
page gives you the ability to customize alarm settings to your
specific grid needs.
CAUTION
Alarm settings are enabled as part of your installation. Changes
to alarm settings should not be made for simple convenience;
this may conceal underlying problems that should be resolved.
If you find an alarm is persistent, discuss the situation with HP
technical support before making changes.
Configuration of alarm notifications is discussed in “Alarm Configuration” on page 153 and changes to the main configuration of services
and components is discussed in Chapter 6 for each service.
20
HP Medical Archive
Page 36

Navigating Locations and Nodes
Once you have logged on to the NMS, the first displayed content is a
Scalable Vector Graphic (SVG) indicating two sites. Icons indicate the
actual installation of Site A and Site B. As you navigate to a site, the
map shows a set of cabinets (the possible maximum of eight); again,
icons above the cabinets indicate the actual installation of your grid. At
the cabinet level, a fully installed cabinet is schematically illustrated
with icons beside the nodes actually installed. For a given node, a schematic image appears with icons for each service installed. Samples are
shown in the following subsections.
Location and Node Maps
The grid’s geographic locations (the primary site and optional DR site)
are illustrated on the map with a status icon representing actual installation. The color of the icon gives you an immediate indication of the
location’s alarm state.
Interface Components
Figure 11: NMS Interface—Sample Grid Map of Locations
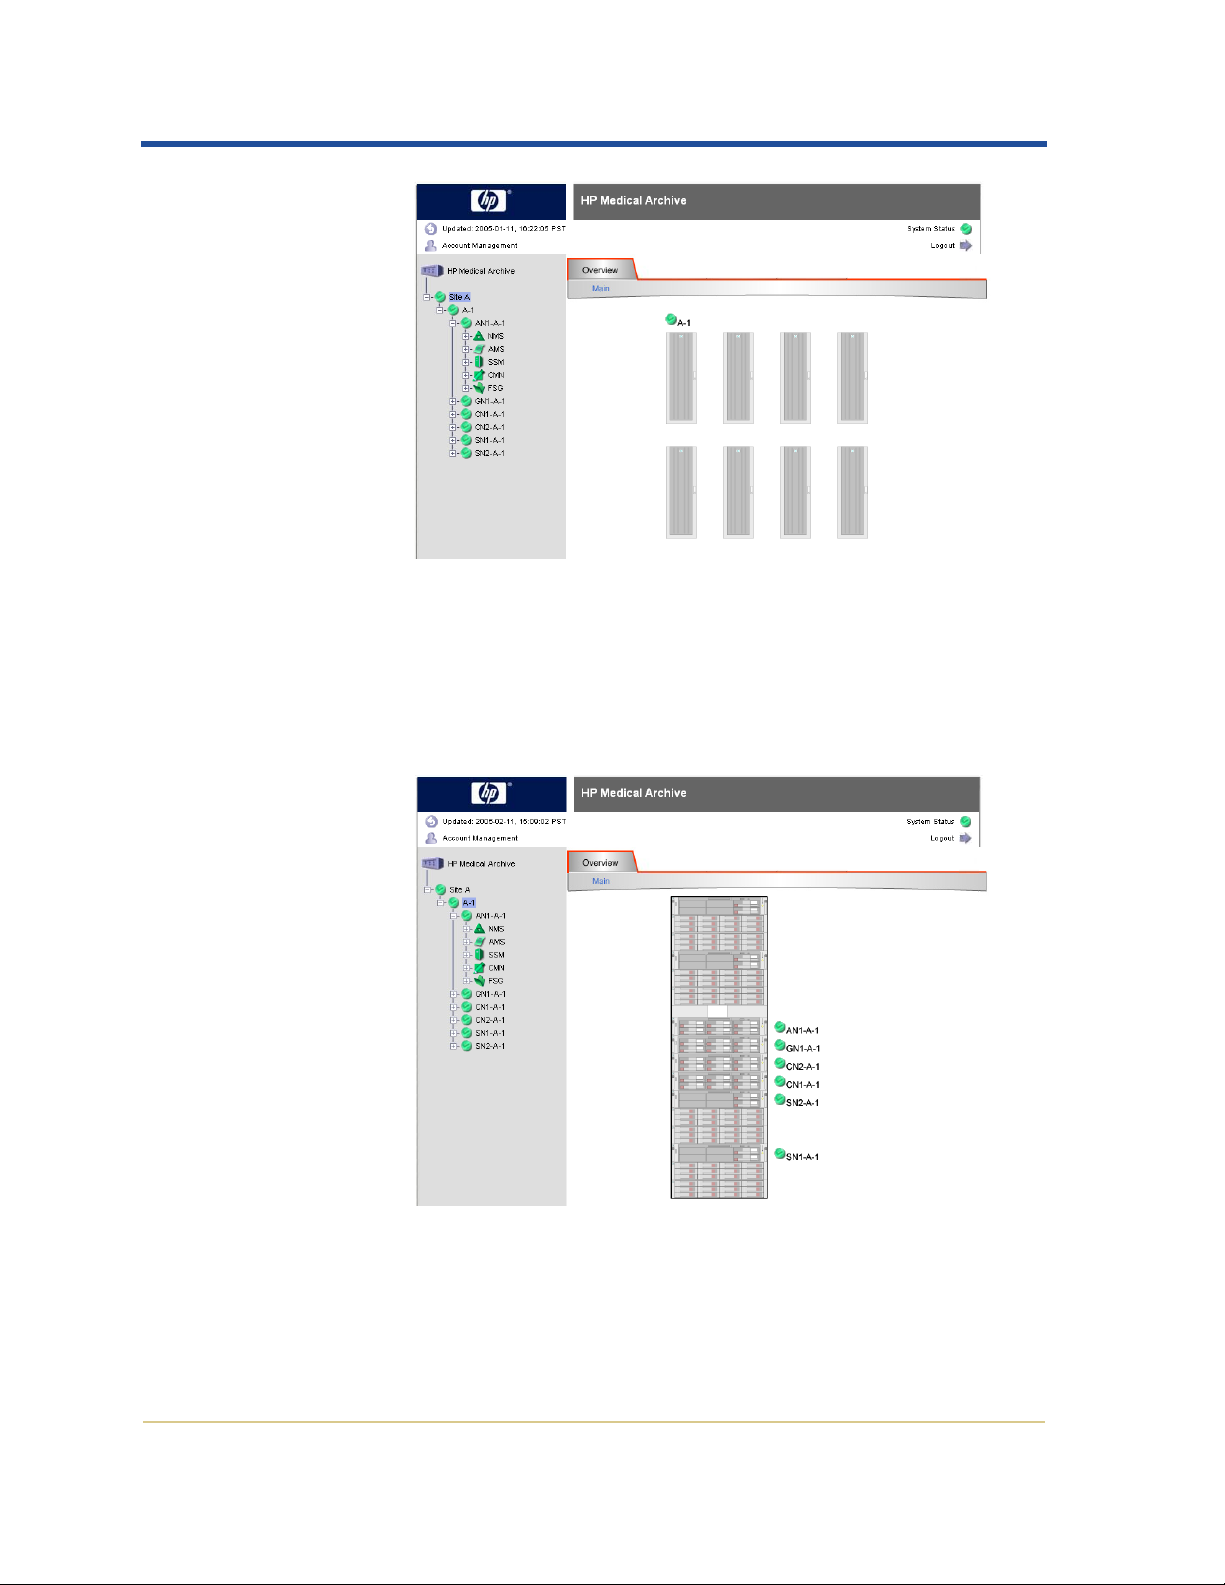
Clicking on an icon displays the next level (the individual location).
At this level, there are eight cabinets illustrated, the maximum possible
in a single site deployment of the HP Medical Archive. (If a DR site is
used, the maximum at either site is four cabinets, however the illustration shows the maximum of eight.) Only installed cabinets have an
icon above them.
21
HP Medical Archive
Page 37
HPMA User Guide
Figure 12: NMS Interface—Sample Site Map of Cabinets
Selecting a cabinet displays the map with node icons positioned where
the hardware is physically located in a fully populated cabinet. The
node icons appear beside the nodes that are installed in your grid. The
icon reflects the alarm status of each node. The names are defined by
the software as described in “Naming Conventions” on page 15.
Figure 13: NMS Interface—Sample Location Map of Nodes
Every grid node typically has multiple services that are individually
monitored. Clicking on the node’s name displays a generic SVG map
of a server with icons for the services it hosts. Each service has its own
status icon appropriately colored to represent its alarm status.
22
HP Medical Archive
Page 38

Interface Components
Figure 14: NMS Interface—Sample Server Map of Services
As with locations, cabinets, and nodes, you can select a service to
reveal status information in the Content frame. The service/component
content is more detailed. The grid map, locations, and grid nodes
content displays only the Overview tab with its illustrative map. The
Content frame for services and components displays the four tabs:
Overview, Alarms, Reports, and Configuration discussed in “Tabs” on
page 16. Click a tab to display the related content and selection forms.
23
HP Medical Archive
Page 39

HPMA User Guide
24
HP Medical Archive
Page 40

Alarms
System Status and
Notifications
Chapter Contents
3
System Status Overview . . . . . . . . . . . . . . . . . . . . . . . . . . . . . . . .26
System Monitoring . . . . . . . . . . . . . . . . . . . . . . . . . . . . . . . . .26
Notifications. . . . . . . . . . . . . . . . . . . . . . . . . . . . . . . . . . . . . . .27
Indicators and Propagation . . . . . . . . . . . . . . . . . . . . . . . . . .28
Alarm Levels and Indicators . . . . . . . . . . . . . . . . . . . . . . . . . . . .28
Alarms Tab . . . . . . . . . . . . . . . . . . . . . . . . . . . . . . . . . . . . . . . . . . .30
Main Page. . . . . . . . . . . . . . . . . . . . . . . . . . . . . . . . . . . . . . . . .31
History Page. . . . . . . . . . . . . . . . . . . . . . . . . . . . . . . . . . . . . . .32
Alarm Handling . . . . . . . . . . . . . . . . . . . . . . . . . . . . . . . . . . . . . . .34
Tracing the Source of an Alarm. . . . . . . . . . . . . . . . . . . . . . .34
Resolving Alarms . . . . . . . . . . . . . . . . . . . . . . . . . . . . . . . . . .35
25
HP Medical Archive
Page 41

HPMA User Guide
System Status Overview
The Network Management System provides useful day-to-day information on the status of your grid. When a component of your grid is
not performing within expectations however, the NMS becomes a
critical assessment tool. Alarm indicators draw immediate attention to
grid issues.
The NMS uses color-coding and icons for easy identification of alarm
locations and levels. When you first view the NMS interface, the
System Status icon (in the upper right corner of the page) indicates the
highest alarm level on the system. You can then use the NMS tree or
maps to locate the specific grid problem, assess the cause, and take
quick action toward a resolution.
System Monitoring
A primary role of the NMS is to monitor grid activity and issue alarms
if any attributes reach or exceed user-defined thresholds. When a
tested alarm level evaluates true, that level is set.
There are six levels of alarm for each attribute; each uniquely identified (by an ID number) and individually configured. As new services
are added to the grid, new alarm attribute IDs are created for it,
ensuring that each alarm is uniquely associated with a specific service
or component attribute and alarm level.
Each monitored attribute of each service and component is tested
against the configured thresholds using the algorithm shown in
Figure 15.
The attribute value is tested against each enabled setting starting from
the most critical and working toward normal. The “Unknown” setting
is the last one tested.
26
HP Medical Archive
Page 42

Alarms
When an alarm condition is found to be true, that level is checked
against the current alarm level for the attribute. If there is no change,
then no further action is taken.
Start
For
Level
= 5 to 0
Level
enabled?
Next Level
Levels:
5 = Critical
4 = Major
3 = Minor
2 = Warning
1 = Normal
0 = Unknown
Level
Yes
No
Figure 15: Alarm Monitoring Algorithm
condition
true?
No No
Level =
Current?
Set
Current = Level
End
YesYes
Only if a new alarm level is detected is there a change in the alarm
level reported. This automatically clears alarms when conditions
return to the “Normal” level.
If an alarm level changes, the current alarm level is set and propagated
up the network hierarchy as needed.
Notifications
All alarms provide indicators for informational purposes that you can
check on a routine basis. The NMS is pre-configured with a default set
of alarms and notification settings. You can easily customize these
settings to reflect your company’s network monitoring methodology.
27
HP Medical Archive
Page 43

HPMA User Guide
For information on how to customize the alarm notification settings,
see “Alarm Configuration” on page 153.
Alarm settings are enabled as part of your installation. Changes
to alarm settings should not be made for simple convenience;
this may conceal underlying problems that should be resolved.
If you find an alarm is persistent, discuss the situation with HP
technical support before making changes.
Indicators and Propagation
Alarms are generated at the attribute level of the grid. When an issue is
detected, the alarm is propagated up through the grid hierarchy. The
associated attribute, component, service, and node information on the
NMS are all changed to reflect the alarm state. As a result, you can
view the general alarm state at the grid level, then drill down through
the service components to locate the specific details. (See
Figure 16: “Sample Alarm Indicator Propagation” on page 30.)
CAUTION
Each individual service reflects the highest alarm state of its components. If more than one alarm exists on a node, the node always reflects
the highest and most serious alarm level (see “Alarm Levels and Indicators” below). Locations (Site A and Site B) display the highest alarm
level of the nodes on that branch.
Refer to Figure 16 on page 30 for an example. One node’s SSM indicates a minor alarm state while its LDR indicates an unknown state.
That node icon displays the unknown alarm state (the higher alarm
level). Another node in the same group shows a major alarm on the
AMS service. The group location propagates the “unknown” alarm
indicator. The color and icon of each service, node, and location
reflects its highest alarm state along its branch of the Navigation Tree.
Alarm Levels and Indicators
NMS alarms are organized into a hierarchy of levels. The hierarchy
reflects the seriousness of a grid issue. There are six alarm levels in the
28
HP Medical Archive
Page 44

NMS interface. Each alarm level has an associated color and icon. The
NMS alarms levels (from lowest to highest) are:
Table 3: Alarm Levels and Indicators
Icon Color Level Meaning
Green Normal All functions are working normally.
Yellow Warning An unusual condition exists that does not affect
normal operation; most likely related to a component
being in a standby state.
Alarms
Light
Orange
Minor Alert An abnormal condition exists that could affect opera-
tion in the future; should be investigated to prevent
escalation.
Dark
Orange
Major Alert An abnormal condition exists that is currently affecting
operation; requires prompt attention to prevent
escalation.
Red Critical A critical alert of an abnormal condition that has
stopped normal operation; should be addressed
immediately.
Blue Unknown /
Offline
An unknown condition exists that has stopped normal
operation. Requires immediate attention.
The “Unknown” alarm level is considered very severe if it is enabled
and detected, although it is the last level tested in the alarm monitoring algorithm (Figure 15 on page 27). Most attributes do not enable
this level.
Each alarm level has its own icon and color. These icons and colors are
used throughout the NMS interface to save you time when analyzing a
critical grid situation. Alarm colors and icons accelerate alarm identification and resolution by making the alarm source quickly visible on
the NMS interface. The System Status icon in the Header frame imme-
diately indicates the most serious alarm level of the grid. The icons on
the Network Map indicate the status of each location or node. You can
then follow the tree branch to the individual service to find the source
of the alarm.
Nodes display the alarm icon of the highest alarm state among their
hosted services (Figure 16). Note that each service retains its unique
icon, but the color changes to reflect its current alarm state. Component
icons and colors, however, remain unchanged regardless of the alarm
state.
29
HP Medical Archive
Page 45

HPMA User Guide
Alarms Tab
Figure 16: Sample Alarm Indicator Propagation
Under the Alarms tab of each service or component, colors highlight
critical alarm information (Figure 17). By default, the table rows are
green to indicate a normal status. If the status of an attribute changes,
an alarm row for that attribute changes to the appropriate color
(Table 3 on page 29).
Figure 17: Sample Alarms Tab
30
HP Medical Archive
Page 46

Main Page
Alarms
Each row provides detailed information about the alarm (see Table 4
on page 31 for details). More detailed information about each
attribute’s code, value, and definition can be found in Chapter 7,
“Troubleshooting Alarms” on page 171.
Once the alarm is resolved, the alarm returns to the green status to
indicate that the attribute has returned to a normal state.
You can access and view alarm status at both the service and the component levels. There are two pages under the Alarms tab: Main and
History. When the tab is selected, it defaults to the Main page, which
provides details of the current status.
The Main page of the Alarms tab gives the current status of the selected
service or component attributes. This page is an overview of each
attribute’s current alarm level. You can use this page to get a quick, but
detailed, sense of what may be causing a system alarm. The Main page
can also be used to track the daily status of the system in order to
prevent major alarms.
Figure 18: Sample Component Alarms Tab—Main Page
The alarm data is listed in a table with the following headings:
Table 4: Alarm Table Headings
Heading Definition
Severity Color icon indicating alarm level (see Table 3 on
page 29)
Attribute Code Code that identifies the attribute and issue
being monitored (see Chapter 7 for an alphabetical lookup table)
31
HP Medical Archive
Page 47

HPMA User Guide
Table 4: Alarm Table Headings (cont.)
Heading Definition
CId “Cell ID”, a secondary identifier used when a
monitored attribute is a cell in a table, such as
the Status attribute of the SSM
X Volumes
component (VMST). The CId indicates the cor-
responding row in the attribute table.
Node ID Unique number identifying the service within
the grid. This number is assigned at
installation.
Description Brief details about the cause of the alarm; con-
sisting of the Primary Message and Secondary
Message in the alarm configuration.
Alarm Time Date and time stamp of the last attribute report
from the service or component.
History Page
Current Value Value of the attribute as last reported by the
service or component.
The History page enables you to perform queries on the history of an
attribute. Alarm history provides perspective on whether an attribute
has been triggering frequent alarms. These statistics allow you to
address deeper grid issues and prevent future alarms.
Figure 19: Sample Alarm History Request Form
You can perform a quick or a custom query (the same selection mechanism as standard reports). Quick queries generate results for a
predefined time range with the click of a single button. Custom
32
HP Medical Archive
Page 48

Alarms
queries provide data based on your specified time and date requirements. For more information on performing queries, see page 39.
The generated data displays in a table with the same headings shown
on the Main page (see Table 4 on page 31). This data is listed sequentially based on the time of an alarm’s change in state. The most recent
change is listed first.
Figure 20: Sample Alarm History Report
Rows showing the green icon show either:
• “Cleared”—an attribute has returned to “Normal” from one of the
alarm states other than “Unknown”.
—or—
• “Normal”—an attribute has returned to normal state from the
unknown state ( ) and the description shows “State Change
Unknown to Active”.
To return to the history request form from an alarm history table, click
the History page selector.
Analyzing Alarm Histories
Queries on the alarm history page provide valuable analytical information. You can query for data about a specific attribute or for all of
the alarms that have occurred on a node over a specified period of
time.
33
HP Medical Archive
Page 49

HPMA User Guide
These queries are a powerful grid diagnostic tool, enabling you to
identify alarm patterns and service issues. Regularly reviewing alarm
patterns can resolve minor issues before they impact grid functionality.
At the very least, reviewing the alarm history gives an overview of
how the system is functioning and may help to prevent future alarms.
Alarm Handling
The NMS is a critical tool for responding to system alarms. When you
receive an alarm notification, the NMS provides the data necessary to
resolve the issue. This section provides step-by-step procedures for
investigating, evaluating, and responding to alarms.
Tracing the Source of an Alarm
Tracing an alarm follows these main steps (each is expanded later in
the text):
1. Trace through the network tree to the specific node generating the
alarm.
2. Use the information from the Alarms table to identify the compo-
nent and attribute causing the alarm.
3. Troubleshoot the alarm by using the lookup table in Chapter 7,
“Troubleshooting Alarms” on page 171.
1. Locate the Source of an Alarm
a. Log in to the NMS to display the Network Map. Use the icons
and color codes (Table 3 on page 29) to determine which
location has triggered the alarm.
b. Select the Site that is displaying the alarm icon to view the
cabinet icons for that location. Use the icons and color codes to
determine which cabinet has triggered the alarm.
c. Select the cabinet that is displaying the alarm icon to view the
node icons for that cabinet.
d. Select the node with the alarm icon to view the service icons
for that node. Use the color codes to determine which service
has triggered the alarm.
e. Select the service with the alarm color to access the service’s
Overview page.
f. Select the Alarms
monitored attributes for the service and its components. Locate
X Main page to view the summary table of
34
HP Medical Archive
Page 50

the row in the table highlighted in the alarm color. Note down
the following information:
• Attribute Code—the four-letter identifier for the alarm type
• Description—the message explaining the alarm
2. Identify the Component and Attribute
a. Using the Description from step 1, determine if the alarm is
associated with a specific component. Select the component to
view its Alarms
b. Select the Configuration
X Main page to find the alarm.
X Notification page to view the list of
monitored attributes for that service or component.
c. Find the rows with the Attribute Code noted in step 1. above.
d. Determine the specific condition for the alarm from the settings
in that row.
3. Troubleshoot the Alarm
a. Look up the four-character Attribute Code from step 1 in the
“Alarm Reference Table” on page 172.
b. Follow the suggested actions for the attribute.
Alarms
Resolving Alarms
Most alarm conditions are temporary situations of grid load and
resolve themselves over time. Always consult Chapter 7 for troubleshooting advice. For persistent alarms, contact HP technical support
after following the suggested actions.
Clearing Alarms
Alarm states are self-correcting when the attribute value for an alarm
returns to normal. Once a grid issue has been resolved, the alarm
details can be viewed under the Alarms
You can perform queries to retrieve data for preventive analysis.
Alarms related to counted events, such as HTTP sessions failed, can
often be reset using a check box on the component’s Configuration
Main page. See Chapter 6.
X History page (see page 32).
X
35
HP Medical Archive
Page 51

HPMA User Guide
36
HP Medical Archive
Page 52

Reports
Current and History Reporting
Create, view, and print reports on system
attributes and status alarm histories.
Chapter Contents
4
Introduction to Reporting. . . . . . . . . . . . . . . . . . . . . . . . . . . . . . . 38
Accessing Reports . . . . . . . . . . . . . . . . . . . . . . . . . . . . . . . . . . . . .39
Immediate Reports . . . . . . . . . . . . . . . . . . . . . . . . . . . . . . . . .39
Quick Reports . . . . . . . . . . . . . . . . . . . . . . . . . . . . . . . . . . . . .40
Custom Reports . . . . . . . . . . . . . . . . . . . . . . . . . . . . . . . . . . . .41
Report Formats. . . . . . . . . . . . . . . . . . . . . . . . . . . . . . . . . . . . . . . .42
Charts . . . . . . . . . . . . . . . . . . . . . . . . . . . . . . . . . . . . . . . . . . . .42
Text Reports . . . . . . . . . . . . . . . . . . . . . . . . . . . . . . . . . . . . . . .44
Chart View Controls . . . . . . . . . . . . . . . . . . . . . . . . . . . . . . . . . . .45
Window . . . . . . . . . . . . . . . . . . . . . . . . . . . . . . . . . . . . . . . . . .45
Printing Charts and Reports. . . . . . . . . . . . . . . . . . . . . . . . . . . . .46
37
HP Medical Archive
Page 53

HPMA User Guide
Introduction to Reporting
Reports are a powerful system analysis and troubleshooting tool. The
NMS can generate reports at both the service and the component level,
although some individual attributes do not have reportable events.
These reports provide an overview of how a system attribute is functioning over a selected period of time. By viewing a report, you can
quickly ascertain if the attribute has any issues.
Reports are also valuable to track the data flow on the grid. You can
view how much data enters the grid each day, how many audit
messages are being sent, and whether the data storage capacity is sufficient. You always know the state of resources on your grid.
The NMS provides a variety of report query options and displays. You
generate reports with the simple click of a button or by requesting a
custom report according to specific time spans. The generated report
can be displayed in a graphical chart or a text table. You can then print
the final report, or copy it for use in documents.
Report Types
The NMS provides three different ways to generate reports:
• Immediate—generated by the click of a button on the Overview
page.
• Quick—created through preset criteria selections on the Reports
page.
• Custom—a form on the Reports page enables you to specify your
requirements, providing feedback specifically customized to your
needs.
Charts and Text Reports
Reports take one of two forms: chart or text. Charts present the data in
a graphical view. Text reports are a simple text table with row entries
for each event that an attribute reported. Both types are described in
greater detail later in this chapter.
The format is determined by the page from which you select the
report. Immediate reports are always charts, selected from the
Overview page. Quick and Custom reports are available from both the
Reports
X Chart and Reports X Tex t pages.
38
HP Medical Archive
Page 54
Accessing Reports
Reports are accessed in one of two ways:
• Immediate reports are accessed by clicking the chart icon on the
Overview tab for the service or component.
• Quick and Customized reports are accessed from a form on the
Reports tab under either the Chart page or the Te xt page.
Under the Reports tab, each service and component has select
attributes for which reports can be generated. Individual service
details in Chapter 5 indicate whether attributes are reportable. In some
cases, the attributes available under the chart and the text pages differ.
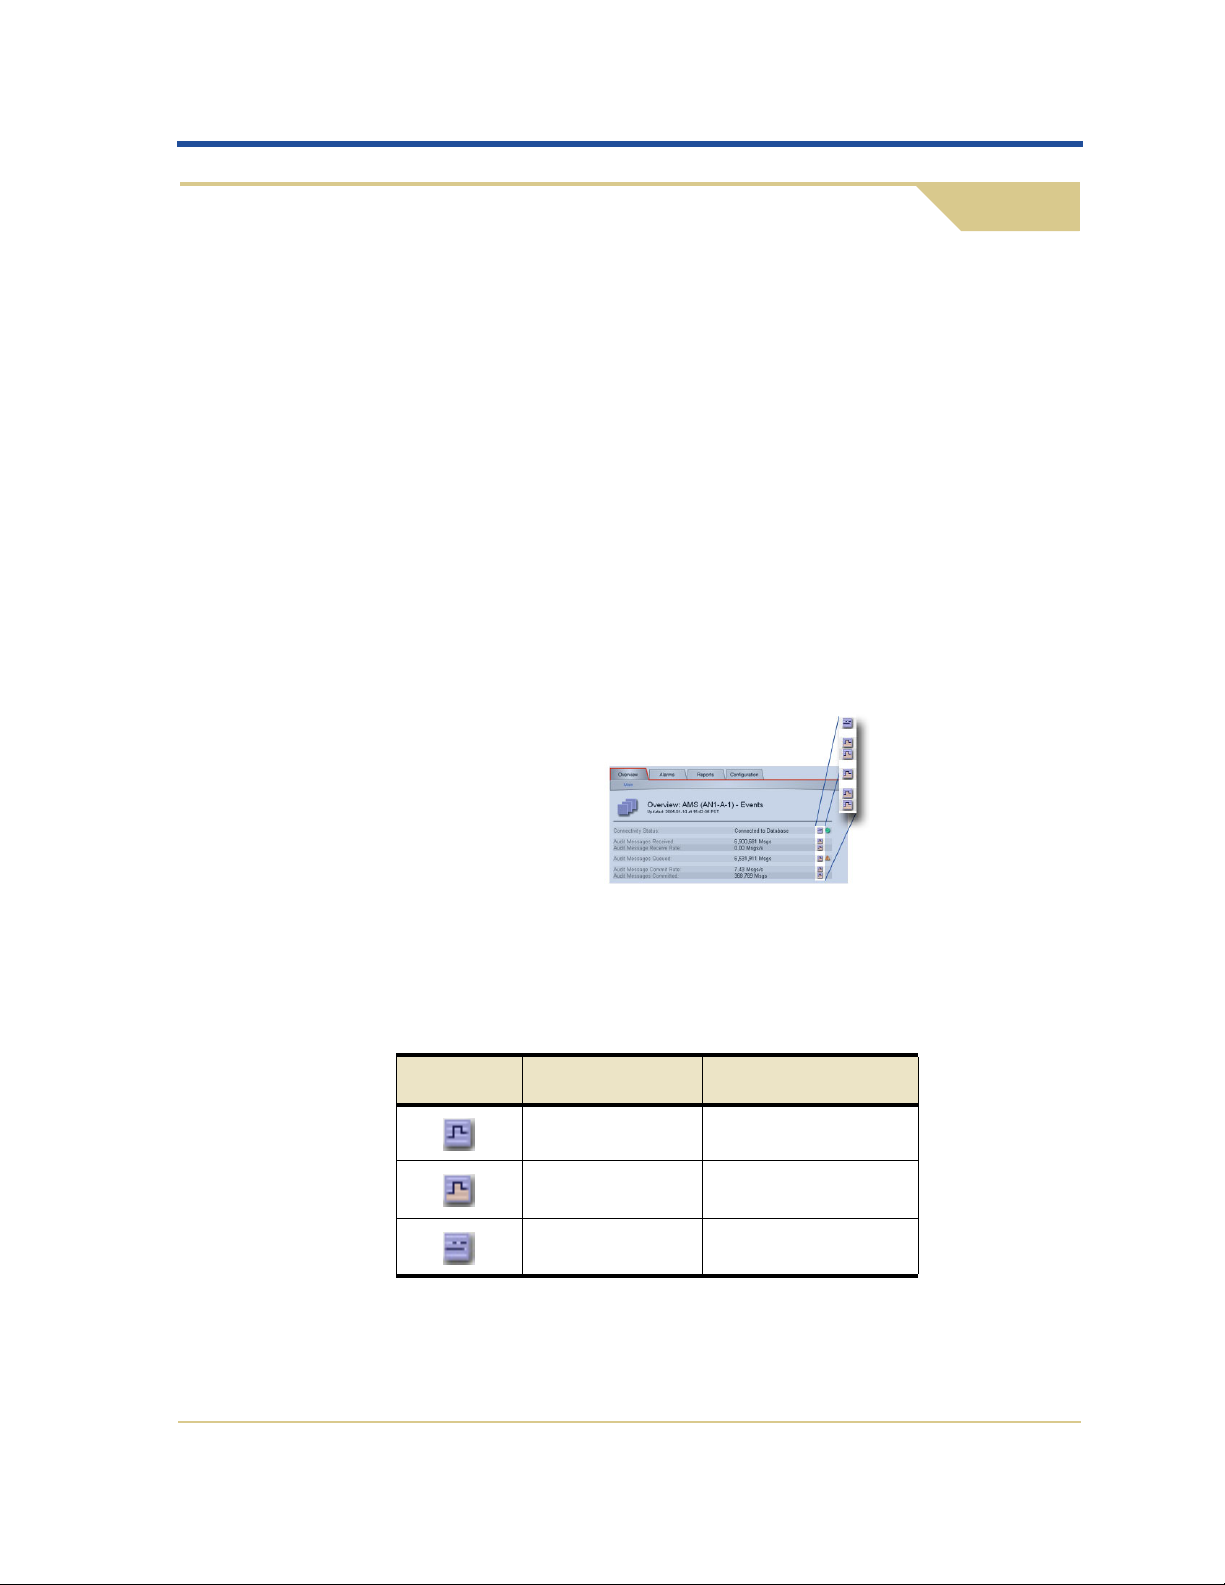
Immediate Reports
Immediate reports are available on the Overview page for reportable
attributes, indicated by a chart button at the right side of the page.
Reports
Figure 21: Sample Immediate Report Buttons
The button graphic reflects the type of graph that is presented. The
graph style is preconfigured to best present the attribute’s data.
Table 5: Immediate Report Buttons
Button Report Type Presentation
Level Bar graph
Bar Bar graph
State Line graph
When a button is selected, a chart report is generated and the NMS
view changes to the Reports tab.
39
HP Medical Archive
Page 55

HPMA User Guide
Quick Reports
To generate an immediate report:
1. Navigate to the service or component you want to report on. The
item’s Overview page appears.
2. Scroll to the attribute you want to chart. If reports can be generated
for the attribute, the appropriate report button is available at the
far right of the attribute’s row.
3. Click on the report button. The Reports page appears and the
requested chart is displayed.
The report displays the attribute’s data over the past hour, a preset
time span. To view other time ranges, or to see a wider (zoom out) or
narrow (zoom in) range of time use either the Quick Reports or the
custom report form.
Quick reports are available on the Reports tab, from both the Chart
and Te xt pages.
There are six options specifying the time span for the report, ranging
from the last 5 minutes to the last year. Quick reports can be generated
with the selection of an attribute and then the push of a time span
button.
Figure 22: Report Request Form—Quick Reports
To generate a quick report:
1. Navigate to the service or component you want to report on. The
item’s Overview page appears.
2. Select the Reports tab. The Charts page appears by default.
40
HP Medical Archive
Page 56

3. Optionally deselect the Vertical Scaling check box to force the Y-
4. Use the Attribute pull-down menu to select the attribute to report.
5. Select the Quick Query button for the desired duration of the
Although the Content frame may update fairly quickly, charts can take some
time to tabulate and form the image. Allow several minutes for tabulation of
long time ranges.
Custom Reports
Reports
axis to start at zero. This option is selected by default, allowing the
Y-axis to cover a range that best fits the data.
—or—
Optionally select the Text page to obtain a text format report.
report. The report appears after a few moments.
Custom reports present in the same way as quick reports but add the
ability to customize the time span of the data (down to the second) to
be displayed. Both Chart and Tex t pages support custom reports.
Figure 23: Report Request Form—Custom Reports
To generate a custom report:
1. Navigate to the service or component you want to report on. The
item’s Overview page appears.
2. Select the Reports tab. The Charts page appears by default.
3. Optionally deselect the Vertical Scaling check box to force the Y-
axis to start at zero. This option is selected by default, allowing the
Y-axis to cover a range that best fits the data.
—or—
Optionally select the Text page to obtain a text format report.
4. Use the Attribute pull-down menu to select the attribute to report.
41
HP Medical Archive
Page 57

HPMA User Guide
5. In the Custom Query panel, enter the Start Date and End Date for
your report. Use the format YYYY/MM/DD HH:MM:SS for both
entries.
6. Select the Custom Query button to generate and display the
report. The report appears after a few moments.
CAUTION
Allow several minutes for charts to appear. Although the
Content frame may update fairly quickly, charts can take several
minutes to tabulate and form the image. Do not initiate another
report request until the current one has completed.
To view other time ranges, or to see a wider (zoom out) or narrow
(zoom in) range of time, modify the start and end dates in the custom
report form.
Report Formats
Chart and text reports present essentially the same data in very different ways. You can use each report format to suit your specific
reporting needs. Chart reports give a graphical presentation of data.
Text reports give the basic data in a simple table with no customization
options after the report has been created.
Charts
Chart reports present the data with the attribute values (vertical axis)
over a specified time span (horizontal axis). The types of chart reports
available are detailed below. If the numbers in the chart represent a
volume portion (such as the percentage of memory being used), the
area under bars is shaded. If the numbers represent exact values (such
as the number of system restarts), the bars appear as a simple line with
no shading.
42
HP Medical Archive
Page 58

Reports
Interpreting Lines and Shading
Charts use color and shading to convey specific information about the
graph.
Table 6: Chart Colors and Shading
Sample Meaning
Reported attribute values are plotted using dark green
lines.
Light green shading around dark green lines indicates
that the actual values in that time range vary and have
been “binned” together for faster plotting. The range in
light green indicates the maximum and minimum
values within the “bin”.
Light brown shading is used for bar graphs to indicate
volumetric data.
Light purple shading indicates that the attribute value
at that time was indeterminate; the attribute was not
reporting.
Blank areas (white, no data plotted) indicate that the
attribute was unavailable. The service or component
was known to be offline, so no data exists for that time
range.
Level Graph
Level graphs are used to plot the values of an attribute that has a
“unit” value (such as Local Clock Rate Error, in ppm). The changes in
the value are plotted in “bins” at regular intervals over time.
43
HP Medical Archive
Page 59

HPMA User Guide
Bar Graph
Bar (area) graphs are similar to level graphs but include a light brown
shading below the line. These are used to plot the values of an
attribute that has a “quantity” value (such as Service Load, a percentage). The changes in the value are plotted in “bins” at regular intervals
over time.
Text Reports
State Graph
State graphs are similar to level graphs but the transition is discontinuous; that is, the value jumps from one state (value) to another. These
are used to plot values that represent distinct states (such as a service
State, that can be online, standby, or offline). The changes in the value
appear as distinct horizontal lines at predefined levels on the chart.
Text reports present the data in a simple table with the date and time
in the first column and the attribute values in the second column. They
give the basic data in a simple format without any of the additional
overview information provided in a chart report.
44
HP Medical Archive
Page 60

Reports
Figure 24: Sample Text Report
The Date column lists the local date and time of attribute reports. The
Value column displays the attribute’s value for each report.
This detailed breakdown of data can result in very long tables. Text reports are
therefore better suited to shorter, more specific time spans.
Text reports support some attributes—such as changes to text
attributes—that are not available in chart form.
Chart View Controls
When you generate a chart report, it may be useful to compare the
results with another chart. The NMS provides the ability to view the
data in a new window; to hold it while using the main interface to
select other reports or views.
To see other time ranges of data, use the custom report form to select
the desired range. Narrowing the time span “zooms” in on the data for
detailed analysis.
Window
To capture the current view for comparison with other chart views,
you can place the chart in a new window (kiosk). You may open as
many of these kiosk views as you wish.
Opens a new window and displays the current view.
45
HP Medical Archive
Page 61

HPMA User Guide
When you are done, use your operating system’s window close
button to close these chart windows.
Printing Charts and Reports
Reports of any type can be printed—as can any other page of the NMS
interface—by using the print function of your browser.
Using Microsoft
®
Internet Explorer:
1. Create the desired report (or other content page).
2. Right-click in the Content frame to access the context menu.
Note that where you right-click determines the context menu you
get. Right-clicking in the title area of the Content frame yields the
menu shown at left; over the chart yields the menu on the right.
Figure 25: Browser Context Menus
3. Select either Print or Print Picture... from the context menu to
open the Print dialog.
4. Use the dialog to make appropriate selections for your needs.
Depending on the context menu used, the Options tab in the dialog
may offer you the selection to print Only the selected frame. This
is the recommended option. See “Print Options” below for a more
detailed discussion.
5. Select Print to send the page to your printer.
46
HP Medical Archive
Page 62

Reports
Print Options
When printing a chart frame, there are two possible outcomes:
• Printing from the frame context menu; printing only the selected
frame yields a page with:
• Content frame heading (service, component, and icon)
• The chart itself with its title
• Chart window button
• Printing from the image context menu drops the Content frame
heading and chart window button, yielding only the chart itself
along with its title.
• Printing from a new window ( ) using the image context menu
yields the Content frame heading (service, component and icon)
and the chart (with its title).
Text reports print as normal web pages with: the Content frame title,
the table title, and the table data.
47
HP Medical Archive
Page 63

HPMA User Guide
48
HP Medical Archive
Page 64

Services and Components
Reference information on service and
component attributes.
Chapter Contents
5
Overview of Services and Components . . . . . . . . . . . . . . . . . . .50
Services . . . . . . . . . . . . . . . . . . . . . . . . . . . . . . . . . . . . . . . . . . .50
Service Components . . . . . . . . . . . . . . . . . . . . . . . . . . . . . . . .51
Interpreting Attribute Description Tables . . . . . . . . . . . . . .54
ADC—Administrative Domain Controller . . . . . . . . . . . . . . . .56
AMS—Audit Management System. . . . . . . . . . . . . . . . . . . . . . .61
CLB—Connection Load Balancer . . . . . . . . . . . . . . . . . . . . . . . .67
CMN—Configuration Management Node . . . . . . . . . . . . . . . . 76
CMS—Content Management System . . . . . . . . . . . . . . . . . . . . .94
FSG—File System Gateway . . . . . . . . . . . . . . . . . . . . . . . . . . . .102
LDR—Local Distribution Router. . . . . . . . . . . . . . . . . . . . . . . .115
NMS—Network Management System . . . . . . . . . . . . . . . . . . .132
SSM—Server Status Monitor . . . . . . . . . . . . . . . . . . . . . . . . . . .138
49
HP Medical Archive
Page 65

HPMA User Guide
Overview of Services and Components
The NMS categorizes system information by the services and service
components found on each node. These services and components
contain attributes that form the basis for the NMS alarm notification
and report options.
This chapter provides a complete list of NMS services and components. Services are listed alphabetically.
Not all grids use every service and component listed here. Each grid uses only
those services and components suited to the options purchased and the functionality required.
Services
Grid services are programs that run on the physical servers (nodes).
Each delivers particular services to the grid as shown in Table 7. The
NMS is used to access the critical information gathered by these
services so that you can monitor the condition and performance of
your grid.
By clicking on the service name in the NMS, you can view detailed
data about the service and each of its component functions. The NMS
provides basic functional statistics, alarm status, reporting functionality, and configuration options for each service and node.
Table 7: HP Medical Archive Services
Icon Tag Service Name Function Pg
LDR Local Distribution
Router
CLB Connection Load
Balancer
Data Plane
FSG File System Gateway Enabling storage and retrieval
Storing and routing data
through the grid.
Enabling storage and retrieval
through the DICOM protocol
option.
through standard network file
systems.
115
67
102
50
HP Medical Archive
Page 66

Table 7: HP Medical Archive Services (cont.)
Icon Tag Service Name Function Pg
Services and Components
Control Plane
Management Plane
CMS Content Management
System
ADC Administrative
Domain Controller
SSM Server Status Monitor Monitoring server activity and
NMS Network Management
System
CMN Configuration
Management Node
AMS Audit Management
System
Storing and managing metadata
for the content.
Authenticating and managing IP
address ranges and nodes,
managing system timing, and
reporting network topology.
hardware.
Notifying administrators of
alarm conditions and providing
the user interface for grid
management.
Managing system configuration
through the NMS interface.
Access to changing settings in
this service is restricted to the
Vendor account.
Logging grid transactions for
audit and reporting.
94
56
138
132
76
61
Within a grid, the same service can be installed and used on more than
one node. The settings made to a service on one node do not affect the
settings on the same service installed on a different node. System-wide
configurations can be made by a service technician under the Vendor
account using components of the Configuration Management
Node (CMN).
Service Components
Each service is composed of one or more components that manage one
piece of the service’s functionality. When using the NMS, you can
select a service’s component to view the attributes that the component
manages. The NMS also provides alarm status, reporting functionality,
51
HP Medical Archive
Page 67

HPMA User Guide
and configuration options for each component. Table 8 (below) lists all
of the available service components.
Table 8: Service Components
Icon Name
Parent
Service
Data Provided
Connectivity All services
except SSM
Connectivity is a component of all services.
The specific attributes listed in the NMS
depend on the parent service. In general, this
component manages information and statistics about network data transfer rates and
volumes to and from the parent service, and
the connection state to other services.
Network SSM Network reports on the network interfaces of
the server.
Events AMS Statistics on the audit messages received and
committed.
SSM Server hardware and driver logs.
Storage LDR, FSG Statistics on storage used and space available.
DICOM CLB, CMS Statistics on DICOM connections and
transactions.
LDR Connectivity settings and statistics for the
DICOM interface.
CMN Connectivity settings for the DICOM inter-
face to the grid.
DICOM
Advanced
CMN Configuration settings for the DICOM con-
nection permissions and behaviors.
DICOM Indexes CMN List of the DICOM tags used by the grid for
content query and management.
Audit CMN Configuration of the audit messages to be
logged.
FSG Groups CMN Configuration of the FSG replication groups,
and primary and secondary settings.
52
HP Medical Archive
Page 68

Table 8: Service Components (cont.)
Parent
Icon Name
Service
Grid Options CMN Report of grid identification information.
Grid Tasks CMN Management of grid-wide programmed
HTTP CLB, LDR Connectivity settings and statistics for the
CMN Connectivity settings for the HTTP interface
HTTP Advanced CMN Configuration settings for the HTTP connec-
Services and Components
Data Provided
maintenance tasks.
HTTP interface.
to the grid.
tion permissions.
IP Ranges CMN IP ranges of permitted remote entity connec-
tions and their locations.
NMS Entities CMN Report of the grid configuration with
object IDs (OIDs).
Content CMS Statistics on grid content ingest, replication,
and purging.
Database CMS Statistics on database type and transactions.
Synchronization CMS Statistics on message processing and informa-
tion synchronization between CMS services.
Replication FSG View FSG Replication settings and activity.
Backup FSG View FSG backup settings and status.
Client Services FSG Status of file sharing services.
RAID SSM Status of any attached RAID hardware and
drives.
53
HP Medical Archive
Page 69

HPMA User Guide
Table 8: Service Components (cont.)
Parent
Icon Name
Service
Data Provided
Services SSM Information on the state and resource usage
of services being monitored.
Volumes SSM Information on the state, mount point, and
space available on storage volumes connected
to the service.
The NMS interface provides you with detailed information and functionality for each service and component on your nodes. Whether you
are inspecting the cause of an alarm or simply monitoring components
on your grid, you can use the NMS to find information.
Interpreting Attribute Description Tables
This chapter provides attribute reference information in tables that
follow a standard format. Given a (partial) sample display (Figure 26):
The corresponding sample table (Table 9) illustrates the format. Below
the sample table is an explanation of some column headings.
Table 9: Sample Service Attributes
Attribute Type / Units Description
State Enumerated
Text
Current state of the service:
2=Online
1 = Standby
0=Offline
Status Enumerated
Text
The status of the service’s
functionality:
0 = No Errors
10 = Errors
Figure 26: Partial Display Sample
C T Alarm
ADCE
ADCA
54
HP Medical Archive
Page 70

Table 9: Sample Service Attributes (cont.)
Services and Components
Attribute Type / Units Description
Node Information
User Label Text User-defined label for the service
appearing in the Navigation Tree,
map views, and the title of the
Content frame.
Notes Text Additional user-defined text pro-
viding description and
annotations of the service or
server.
The Type / Units column identifies the data type or units of measure.
This is useful in interpreting alarm settings and the nature of reports
that can be generated. If the type is “Enumerated text”, the enumerated values that the attribute can have are listed with the description of
the attribute. Note that some attributes have enumerated values that
can only occur under software control.
For units of “Duration” or “Bytes”, the values displayed in the NMS
are scaled to a suitable unit. For example, durations scale to seconds,
minutes, hours, or days; bytes scale to Kilobytes, Megabytes, or
Gigabytes.
C T Alarm
N/A
N/A
The scale of bytes displayed by the NMS uses the “natural” measure of
powers of 10. For example 3 MBytes = 3 x 10
6
= 3,000,000 bytes. This is not
the same as powers of 2 normally used for computing, where 3 MBytes =
3x220 = 3,145,728 bytes.
The three columns on the right indicate if the attribute can be reported
in chart form (C) and text form (T), and the alarm attribute code
(Alarm) used to monitor the attribute where available. In the PDF
edition of this document, the alarm code is a hyperlink to the entry in
Chapter 7, “Troubleshooting Alarms”.
55
HP Medical Archive
Page 71

HPMA User Guide
ADC—Administrative Domain Controller
The Administrative Domain Controller (ADC) authenticates the grid
nodes and their connections with each other. For two nodes to connect,
the ADC must have certificates for both. The ADC maintains the certificates and synchronizes this information with the other ADCs in the
grid.
In general, all system nodes maintain a connection to at least one ADC.
This ensures that the nodes are always accessing the latest certificates
(occasionally updated or revoked). When nodes connect they cache
other nodes’ certificates, enabling systems to continue functioning
with known nodes even when an ADC is unavailable. New nodes can
only establish connections via an ADC.
The connection of each node lets the ADC gather topology information. This node information includes the CPU load, the amount of
available disk space (if it has storage), the supported services, and the
node’s group ID (location). The grid’s LDRs, CMSs, and CLBs ask the
ADC for topology information through topology queries. The ADC
responds to each query with the latest information received from the
grid.
Group IDs are in the form of 10X00Y, where X and Y are pre-assigned
based on the site and cabinet number. For example, cabinet B-3 would
have a Group ID of 102003. These are used in placing replications
under business rules, to permit the grid to disperse data in the most
robust and efficient manner possible within the available topology.
ADC Attributes
The ADC supports the common set of service attributes. These
common service attributes appear on the Overview tab for the service.
Table 10: ADC Service Attributes
Attribute Type / Units Description
ADC State Enumerated
Text
Current state of the service:
2=Online
1 = Standby
0=Offline
C T Alarm
ADCE
56
HP Medical Archive
Page 72

Table 10: ADC Service Attributes (cont.)
Services and Components
Attribute Type / Units Description
ADC Status Enumerated
Text
The status of the service’s
functionality:
0 = No Errors
1 = Errors
Node Information
User Label Text User-defined label for the service
appearing in the Navigation Tree,
map views, and the title of the
Content frame.
Notes Text Additional user-defined text pro-
viding description and
annotations of the service or
server.
Device Type Text The specific internal label for the
service (allocated at manufacturing time), “Administrative Domain
Controller”
C T Alarm
ADCA
N/A
N/A
N/A
Vendor Text Manufacturer of the service. N/A
Version Text Code version and build informa-
N/A
tion for the service. Reporting this
can indicate when upgrades were
implemented.
Node ID Number Unique node ID assigned at
N/A
installation.
X Coordinate Meters Earth-Centered Earth-Fixed
N/A
(ECEF) coordinates for the global
Y Coordinate Meters N/A
position of the server.
Not applicable to the HP Medical
Z Coordinate Meters N/A
Group ID Number Identifier of the logical group
Archive.
N/A
(location) to which the service
belongs. Used in placing replications under business rules.
57
HP Medical Archive
Page 73

HPMA User Guide
Table 10: ADC Service Attributes (cont.)
Attribute Type / Units Description
System Status
Service Load Percent Percentage of the CPU time used
by this service; indicating how
busy the service is.
Memory
Usage
Percent
Memory
Used
Bytes RAM currently being used by this
service.
Percent Percent of total available RAM
being used. This can be greater
than 100% if disk swap space is
used.
Service
Uptime
Service
Runtime
Duration Total duration since the last
restart.
Duration Total duration the service has
functioned since installation; the
sum of all uptimes.
Restarts Count Total number of restarts since
installation.
C T Alarm
N/A
N/A
PMEM
N/A
N/A
N/A
Reference
Clock Source
Reference
Clock Status
Text Indicates the origin of timing
information; used for audit messages, communication, and timing
functions:
• NTP
• GPS (not used in the HPMA)
Enumerated
Text
Indicates the current condition of
the timing source:
0=Stable
1=Flywheeling
2=Unstable
3=Offline
4=Unknown
N/A
TRFS
58
HP Medical Archive
Page 74

Table 10: ADC Service Attributes (cont.)
Services and Components
Attribute Type / Units Description
Local Clock
Status
Local Clock
Rate Error
Local Clock
Rate Drift
Network
Neighbor
Drift
Enumerated
Text
ppm The error between the local clock
ppm The cumulative offsets (since last
µs Rough measure of how different
Indicates the condition of the
internal timing system:
0=Calibrating
1 = Synchronizing
2 = Syntonizing
3=Flywheeling
(Recalibrating)
4=Flywheeling
and the reference clock.
restart) required by the local clock
to keep in sync with the reference
clock.
this service’s clock is from that of
the ADC services.
C T Alarm
TRSS
N/A
N/A
TNER
ADC Components
The only component supported by the ADC is the Connectivity
component.
Connectivity
The ADC Connectivity component supports the standard set of
network attributes.
Table 11: ADC X Connectivity Component Attributes
Attribute Type / Units Description
Received
Data Rate
Transmitted
Data Rate
Received
Bytes
bits / s Current rate that data is being
received.
bits / s Current rate that data is being
transmitted.
Bytes Total data received since the last
service restart.
C T Alarm
N/A
N/A
N/A
59
HP Medical Archive
Page 75
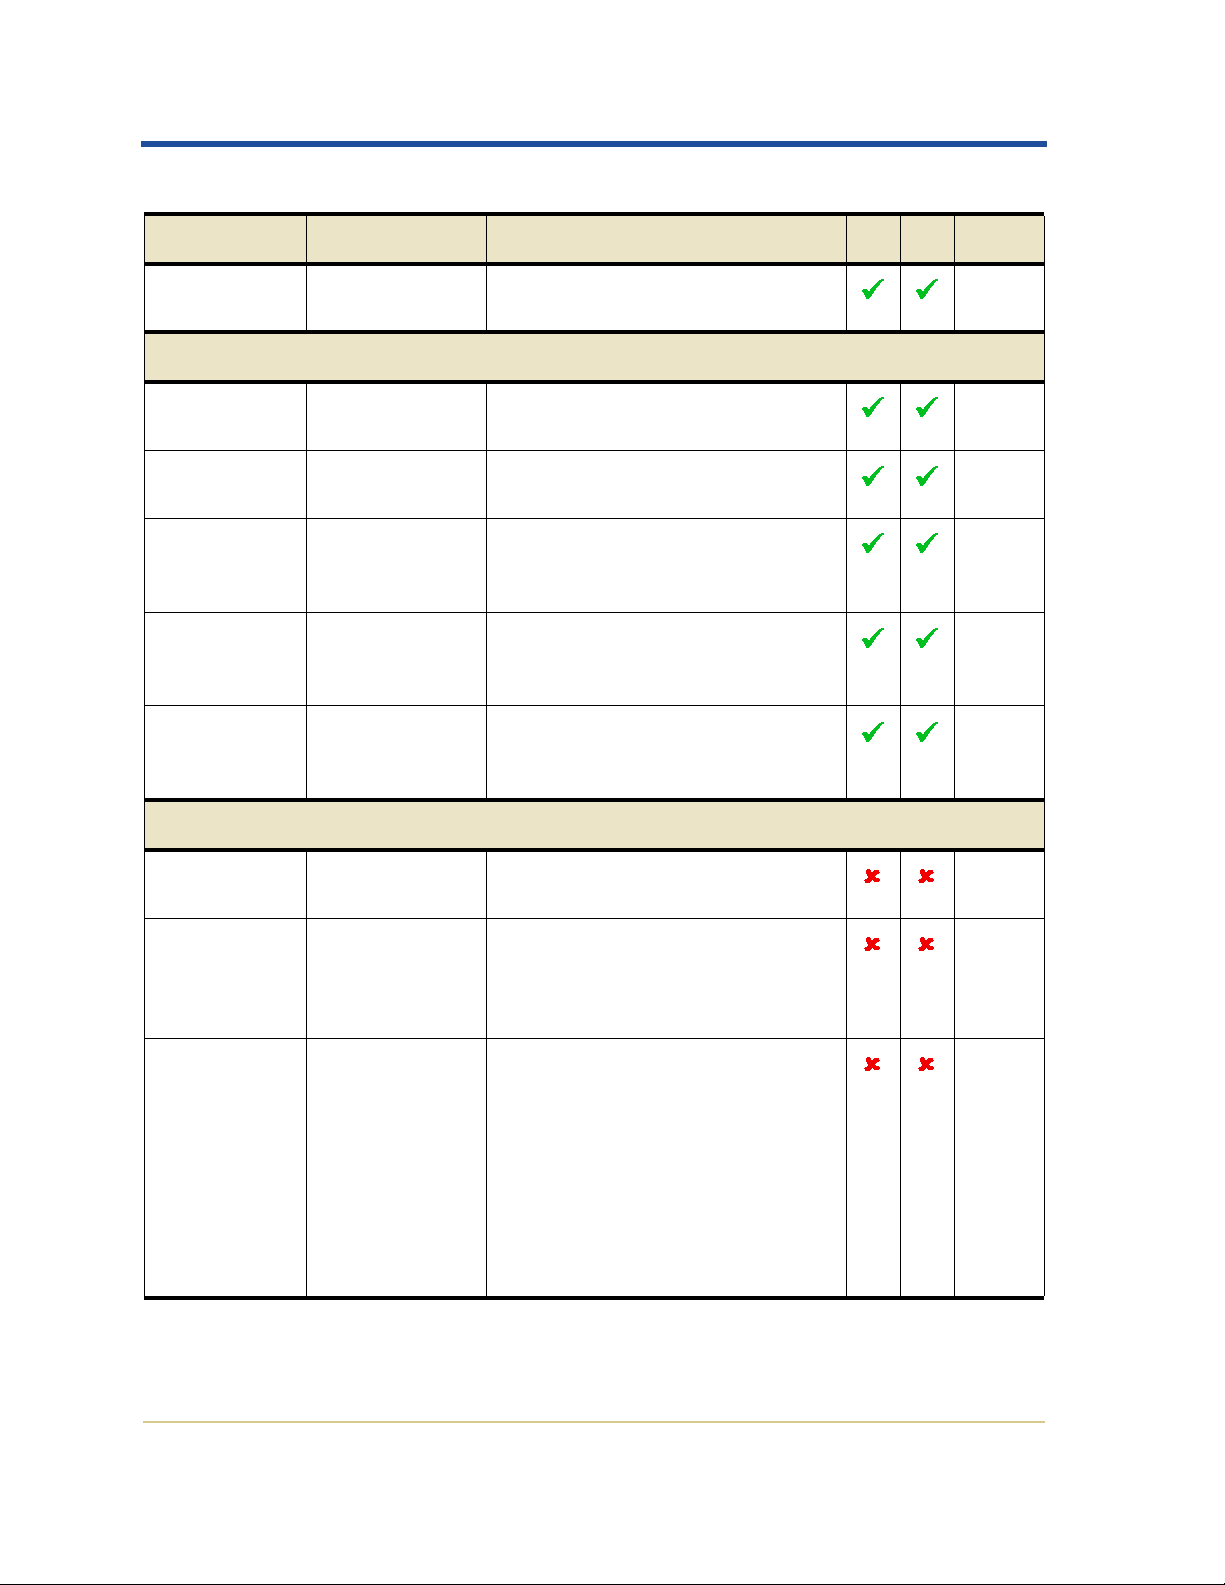
HPMA User Guide
Table 11: ADC
X Connectivity Component Attributes (cont.)
Attribute Type / Units Description
Transmitted
Bytes
Bytes Total data sent since the last
restart.
Connectivity Status
Connected
ADCs
Connected
NMSs
Audit
Message
Destinations
Audit
Messages
Queued
Audit
Messages
Count Number of ADC services con-
nected to this service.
Count Number of NMS services con-
nected to this service.
Count Number of services that can
accept audit messages from this
service.
Count Messages waiting for confirmed
delivery to an AMS (or audit relay
service).
Count Messages committed to the AMS
(or audit relay service).
Committed
C T Alarm
N/A
NADC
NNMS
NAMS
AMQS
N/A
Connections
Node ID Number Unique node ID of a connected
service.
User Label Text User-defined label for the con-
nected service. If the label appears
blue, this service has a connection
to it, but the NMS does not.
Status Text Connection status of the service:
• Connected
• Reconnecting
Transient service connections disappear from the list when
disconnected. Only retained
service connections can report
“Reconnecting” when the connection is lost.
N/A
N/A
N/A
60
HP Medical Archive
Page 76

AMS—Audit Management System
The Audit Management System (AMS) logs all audited system events
to a text file on the server. The grid uses positive acknowledgement to
prevent loss of audit messages. A message remains queued at a service
until the AMS, or an intermediate audit relay service, has acknowledged control of it.
Access to the audit log files is limited to authorized technical support
staff unless you have purchased the audit option. For those with the
audit option a separate document detailing access and log content is
provided.
AMS Attributes
The AMS supports the common set of service attributes. These
common service attributes appear on the Overview tab for the service.
Services and Components
Table 12: AMS Service Attributes
Attribute Type / Units Description
AMS State Enumerated
Text
AMS Status Enumerated
Text
Node Information
User Label Text User-defined label for the service
Notes Text Additional user-defined text pro-
Current state of the service:
2=Online
1 = Standby
0=Offline
The status of the service’s
functionality:
0 = No Errors
1 = DB Connectivity Error
appearing in the Navigation Tree,
map views, and the title of the
Content frame.
viding description and
annotations of the service or
server.
C T Alarm
AUME
AUMA
N/A
N/A
61
HP Medical Archive
Page 77

HPMA User Guide
Table 12: AMS Service Attributes (cont.)
Attribute Type / Units Description
Device Type Text The specific internal label for the
C T Alarm
N/A
service (allocated at manufacturing time), “Audit Management
System”.
Vendor Text Manufacturer of the service. N/A
Version Text Code version and build informa-
N/A
tion for the service. Reporting this
can indicate when upgrades were
implemented.
Node ID Number Unique node ID assigned at
N/A
installation.
X Coordinate Meters Earth-Centered Earth-Fixed
N/A
(ECEF) coordinates for the global
Y Coordinate Meters N/A
position of the server.
Not applicable to the HP Medical
Z Coordinate Meters N/A
Group ID Number Identifier of the logical group
Archive.
N/A
(location) to which the service
belongs. Used in placing replications under business rules.
System Status
Service Load Percent Percentage of the CPU time used
N/A
by this service; indicating how
busy the service is.
Memory
Usage
Percent
Memory
Used
Bytes RAM currently being used by this
service.
Percent Percent of total available RAM
being used. This can be greater
than 100% if disk swap space is
N/A
PMEM
used.
Service
Uptime
62
Duration Total duration since the last
restart.
N/A
HP Medical Archive
Page 78

Table 12: AMS Service Attributes (cont.)
Services and Components
Attribute Type / Units Description
Service
Runtime
Duration Total duration the service has
functioned since installation; the
sum of all uptimes.
Restarts Count Total number of restarts since
installation.
Reference
Clock Source
Text Indicates the origin of timing
information; used for audit messages, communication, and timing
functions:
• NTP
• GPS (not used in the HPMA)
Reference
Clock Status
Enumerated
Text
Indicates the current condition of
the timing source:
0=Stable
1=Flywheeling
2=Unstable
3=Offline
4=Unknown
C T Alarm
N/A
N/A
N/A
TRFS
Local Clock
Status
Local Clock
Rate Error
Local Clock
Rate Drift
Network
Neighbor
Drift
Enumerated
Text
Indicates the condition of the
internal timing system:
0=Calibrating
1 = Synchronizing
2 = Syntonizing
3=Flywheeling
(Recalibrating)
4=Flywheeling
ppm The error between the local clock
and the reference clock.
ppm The cumulative offsets (since last
restart) required by the local clock
to keep in sync with the reference
clock.
µs Rough measure of how different
this service’s clock is from that of
the ADC services.
TRSS
N/A
N/A
TNER
63
HP Medical Archive
Page 79

HPMA User Guide
AMS Components
In addition to the standard service attributes, the AMS also supports
the following components:
• Events
• Connectivity
Events
This component reports audit message statistics.
The Events component ensures that every audit message is accounted
for and tracked. The message totals listed are cumulative from the last
restart of the AMS service.
Table 13: AMS X Events Component Attributes
Attribute Type / Units Description
Connectivity
Status
Audit
Messages
Received
Audit
Message
Receive Rate
Audit
Messages
Queued
Enumerated
Text
Count Messages received by the AMS
Messages /
second
Count Messages queued to be written to
The status of the AMS connectivity to its database:
0 = Connecting
1 = Connected
2 = Connectivity Lost,
Reconnecting
3 = Database Authentication
Failed, Retrying
Not used in the HP Medical
Archive.
since the last restart.
Rate of incoming audit messages. N/A
the log file.
C T Alarm
ERRS
N/A
AMQS
Audit
Messages
Committed
64
Count Messages written to the log file
(since the last restart).
N/A
HP Medical Archive
Page 80
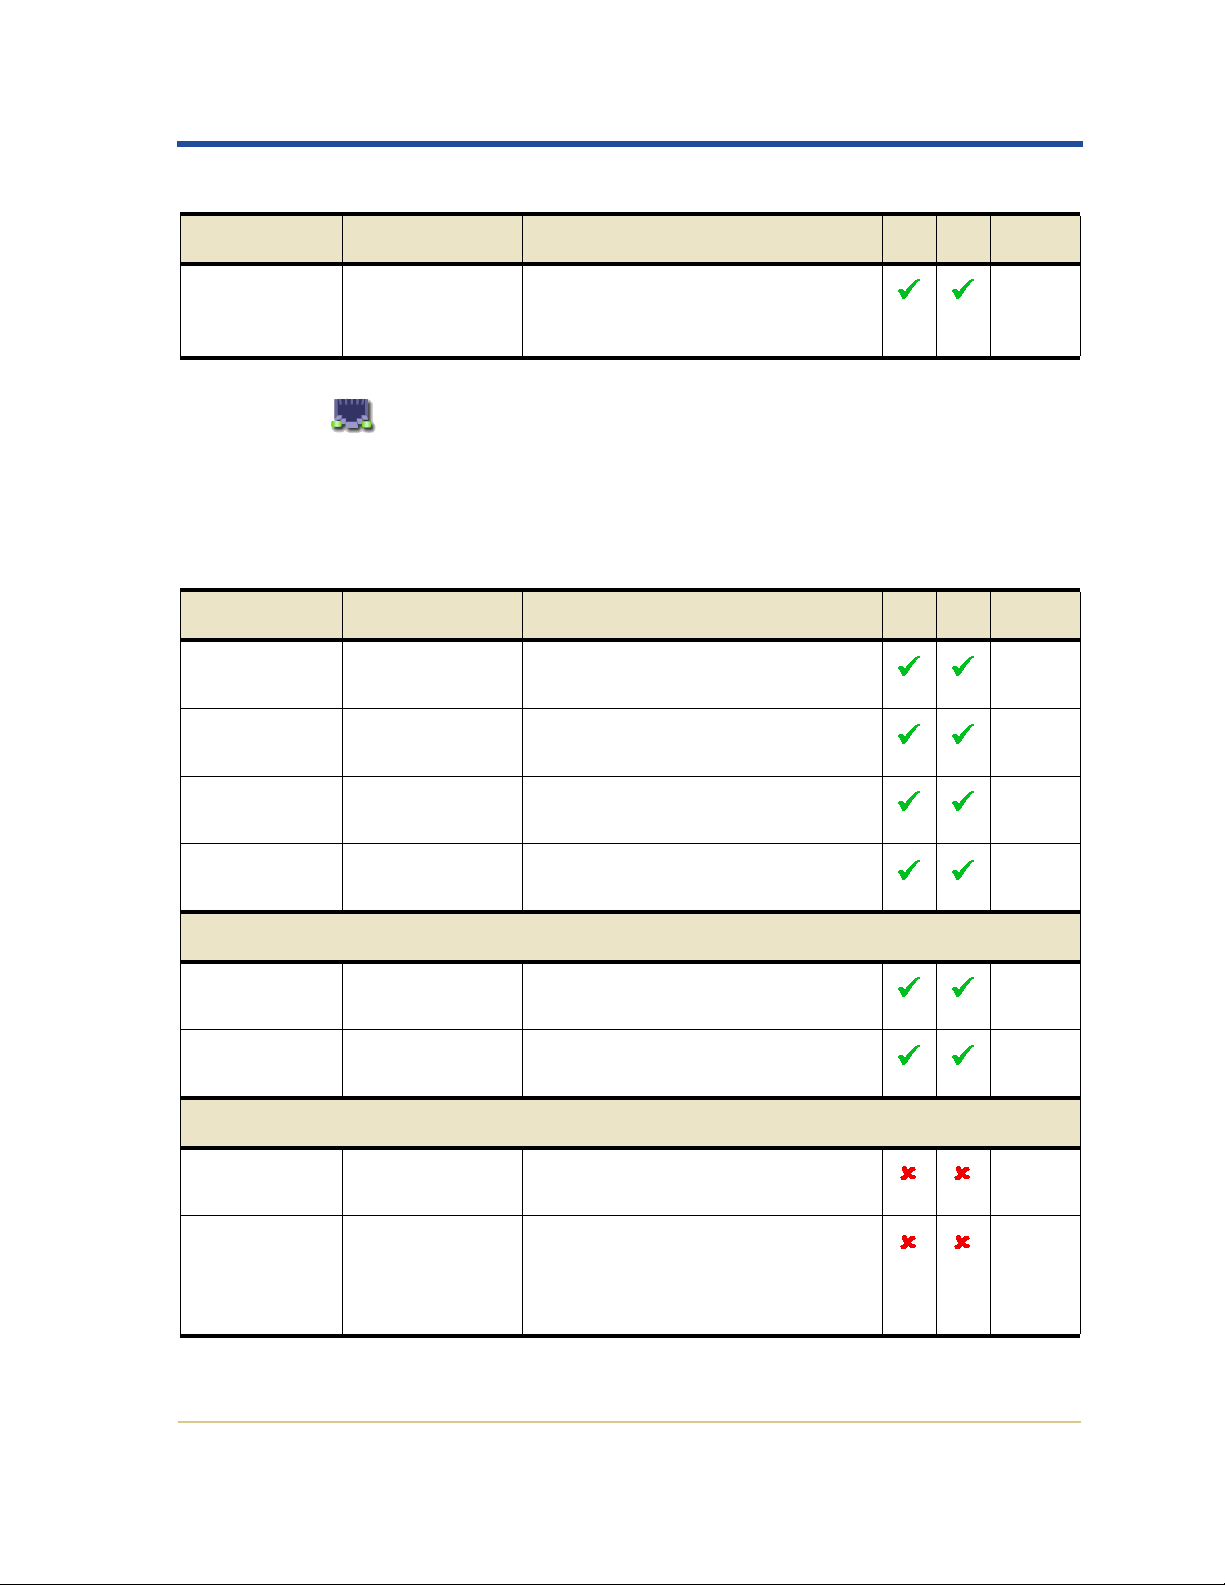
Services and Components
Table 13: AMS
X Events Component Attributes (cont.)
Attribute Type / Units Description
Audit
Message
Messages /
second
Rate of message commitment to
the log file.
Commit Rate
Connectivity
The AMS supports a subset of the standard Connectivity component
attributes (audit message attributes are handled in the events
component).
Table 14: AMS X Connectivity Component Attributes
Attribute Type / Units Description
Received
Data Rate
Transmitted
Data Rate
bits / s Current rate that data is being
received.
bits / s Current rate that data is being
transmitted.
C T Alarm
N/A
C T Alarm
N/A
N/A
Received
Bytes
Transmitted
Bytes
Bytes Total data received since the last
service restart.
Bytes Total data sent since the last
service restart.
Connectivity Status
Connected
ADCs
Connected
NMSs
Count Number of ADC services con-
nected to this service.
Count Number of NMS services con-
nected to this service.
Connections
Node ID Number Unique node ID of a connected
service.
User Label Text User-defined label for the con-
nected service. If the label appears
blue, this service has a connection
to it, but the NMS does not.
N/A
N/A
NADC
NNMS
N/A
N/A
65
HP Medical Archive
Page 81

HPMA User Guide
Table 14: AMS
X Connectivity Component Attributes (cont.)
Attribute Type / Units Description
Status Text Connection status of the service:
• Connected
• Reconnecting
Transient service connections disappear from the list when
disconnected. Only retained
service connections can report
“Reconnecting” when the connection is lost.
C T Alarm
N/A
66
HP Medical Archive
Page 82
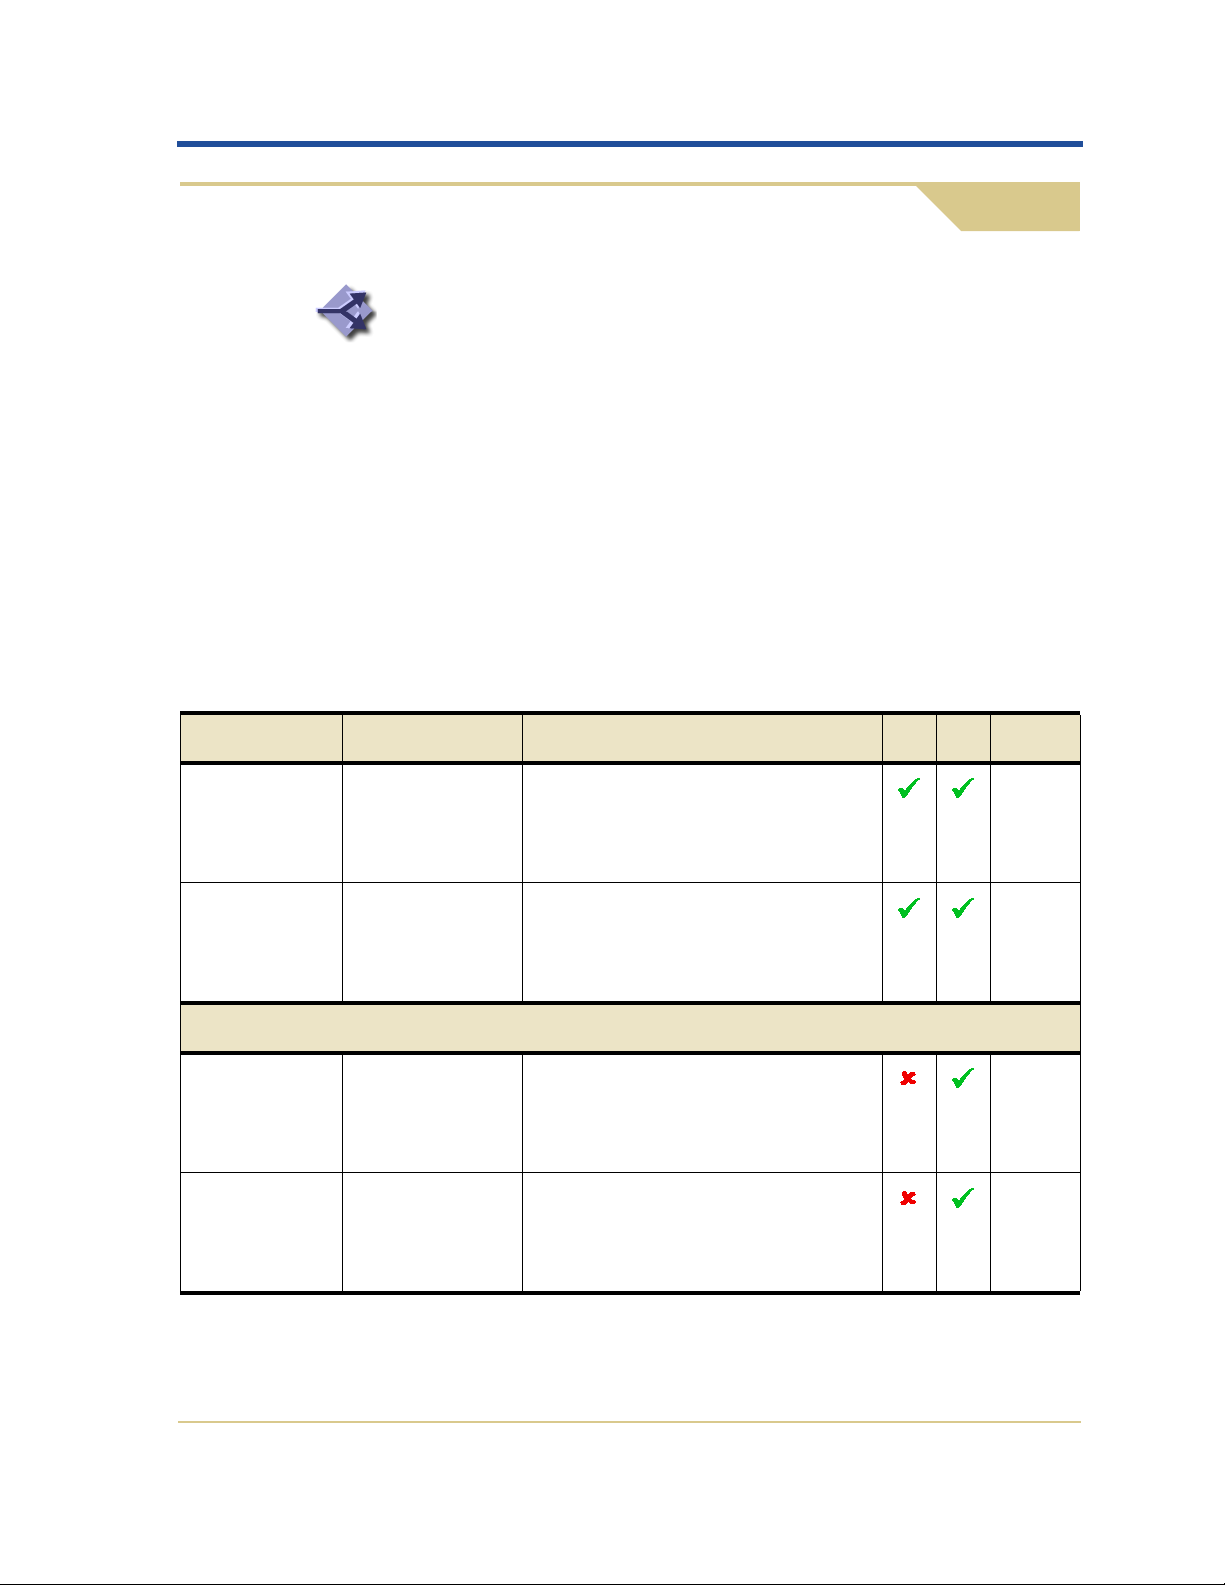
CLB—Connection Load Balancer
The Connection Load Balancer (CLB) directs incoming content to the
most optimal storage service based on a variety of criteria. The CLB
ranks nodes based on several factors such as availability, and system
load. When the most optimal node has been chosen, the CLB establishes an outgoing connection and forwards the traffic to the chosen
node.
The CLB serves as a connection pipeline between the remote entity
and an LDR for DICOM.
CLB Attributes
The CLB supports the common set of service attributes. These
common service attributes appear on the Overview tab for the service.
Services and Components
Table 15: CLB Service Attributes
Attribute Type / Units Description
CLB State Enumerated
Text
CLB Status Enumerated
Text
Node Information
User Label Text User-defined label for the service
Notes Text Additional user-defined text pro-
Current state of the service:
2=Online
1 = Standby
0=Offline
The status of the service’s
functionality:
0 = No Errors
10 = Errors
appearing in the Navigation Tree,
map views, and the title of the
Content frame.
viding description and
annotations of the service or
server.
C T Alarm
CLBE
CLBA
N/A
N/A
67
HP Medical Archive
Page 83

HPMA User Guide
Table 15: CLB Service Attributes (cont.)
Attribute Type / Units Description
Device Type Text The specific internal label for the
C T Alarm
N/A
service (allocated at manufacturing time), “Connection Load
Balancer”
Vendor Text Manufacturer of the service. N/A
Version Text Code version and build informa-
N/A
tion for the service. Reporting this
can indicate when upgrades were
implemented.
Node ID Number Unique node ID assigned at
N/A
installation.
X Coordinate Meters Earth-Centered Earth-Fixed
N/A
(ECEF) coordinates for the global
Y Coordinate Meters N/A
position of the server.
Not applicable to the HP Medical
Z Coordinate Meters N/A
Group ID Number Identifier of the logical group
Archive.
N/A
(location) to which the service
belongs. Used in placing replications under business rules.
System Status
Service Load Percent Percentage of the CPU time used
N/A
by this service; indicating how
busy the service is.
Memory
Usage
Percent
Memory
Used
Bytes RAM currently being used by this
service.
Percent Percent of total available RAM
being used. This can be greater
than 100% if disk swap space is
N/A
PMEM
used.
Service
Uptime
68
Duration Total duration since the last
restart.
N/A
HP Medical Archive
Page 84

Table 15: CLB Service Attributes (cont.)
Services and Components
Attribute Type / Units Description
Service
Runtime
Duration Total duration the service has
functioned since installation; the
sum of all uptimes.
Restarts Count Total number of restarts since
installation.
Reference
Clock Source
Text Indicates the origin of timing
information; used for audit messages, communication, and timing
functions:
• NTP
• GPS (not used in the HPMA)
Reference
Clock Status
Enumerated
Text
Indicates the current condition of
the timing source:
0=Stable
1=Flywheeling
2=Unstable
3=Offline
4=Unknown
C T Alarm
N/A
N/A
N/A
TRFS
Local Clock
Status
Local Clock
Rate Error
Local Clock
Rate Drift
Network
Neighbor
Drift
Enumerated
Text
Indicates the condition of the
internal timing system:
0=Calibrating
1 = Synchronizing
2 = Syntonizing
3=Flywheeling
(Recalibrating)
4=Flywheeling
ppm The error between the local clock
and the reference clock.
ppm The cumulative offsets (since last
restart) required by the local clock
to keep in sync with the reference
clock.
µs Rough measure of how different
this service’s clock is from that of
the ADC services.
TRSS
N/A
N/A
TNER
69
HP Medical Archive
Page 85
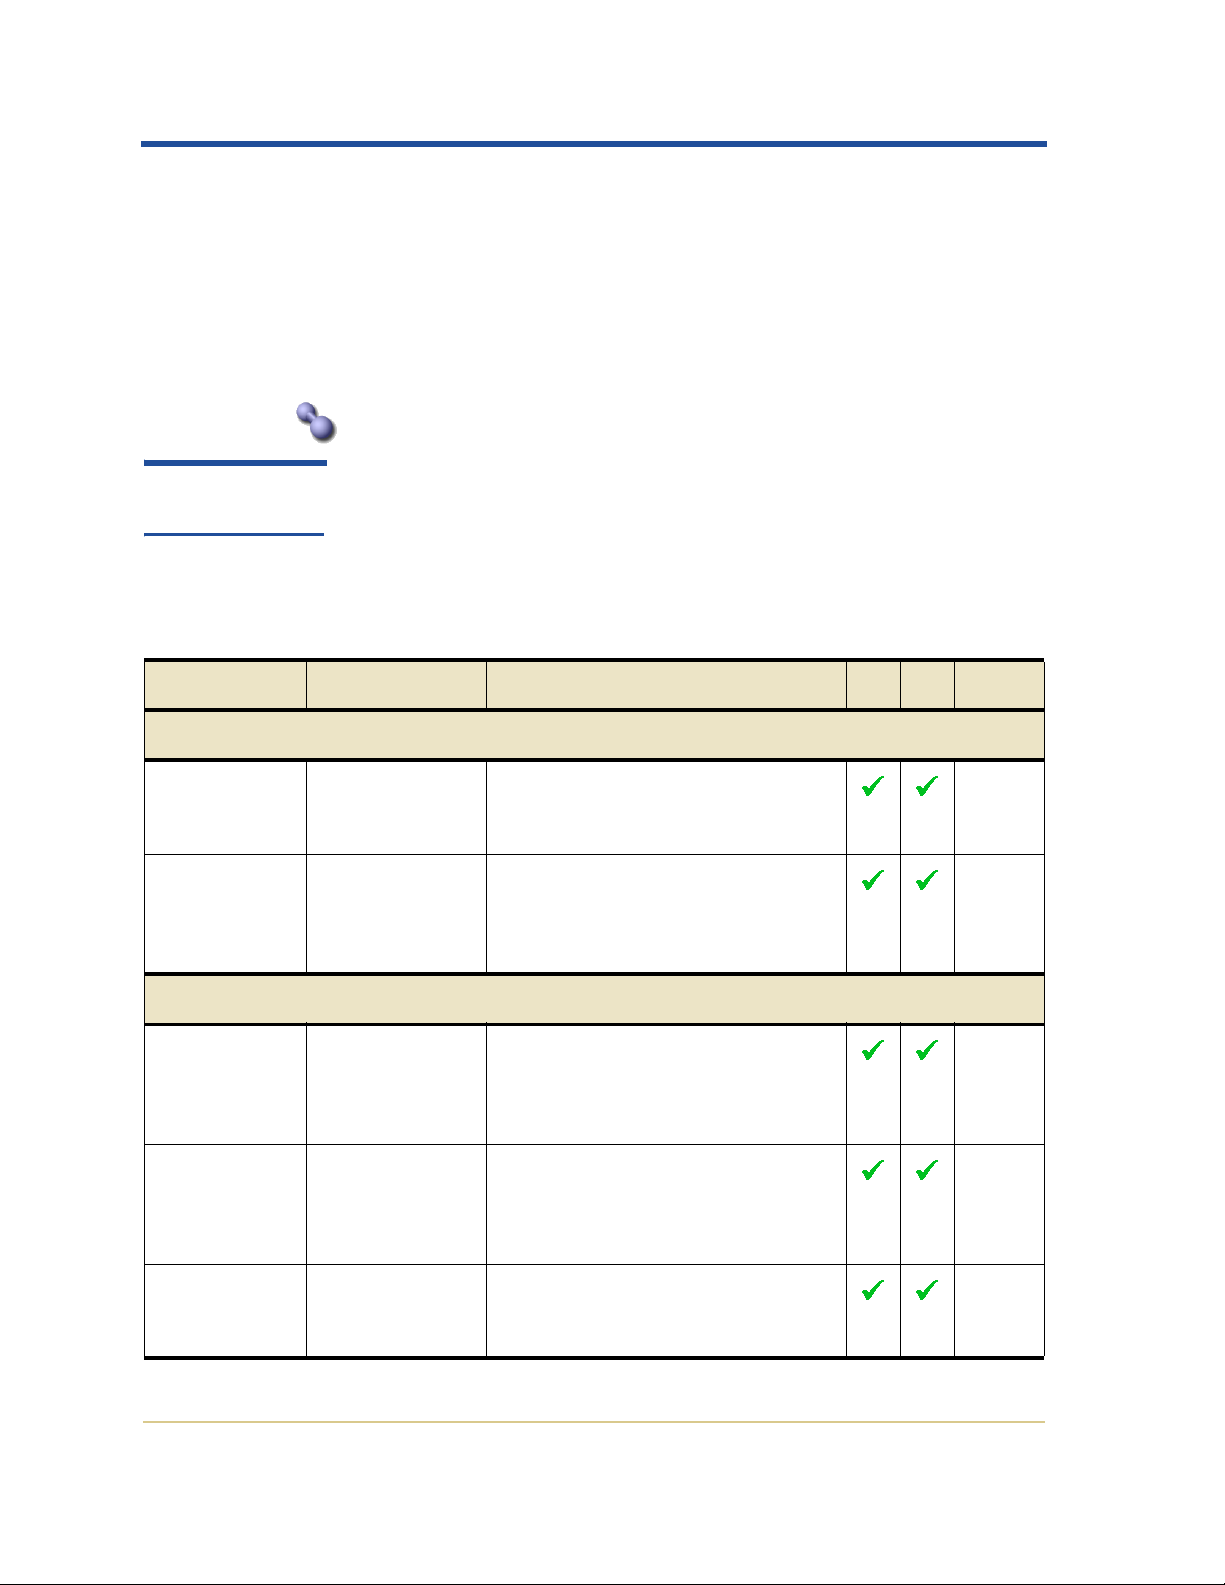
HPMA User Guide
CLB Components
In addition to the standard service attributes, the CLB also supports
the following components:
• DICOM
• HTTP
• Connectivity
DICOM
DICOM is optional
on the HPMA.
Table 16: CLB X DICOM Component Attributes
Attribute Type / Units Description
Destinations
Number
Ava ilab le Q/R
Destinations
Number
Ava ilabl e
Ingest
Destinations
DICOM Associations
Currently
Established
Incoming
Associations
The DICOM component handles forwarding of DICOM traffic to
optimal services and tracks TCP/IP connectivity for DICOM connections. The number of available destinations for query and retrieval
(Q/R) and for ingest via DICOM are reported, as are statistics on
connections.
Count Nodes accepting DICOM connec-
tions for content query and
retrieve operations.
Count Nodes that accept DICOM connec-
tions for ingesting content to the
grid.
Count Active associations originated
from remote entities, to the grid.
C T Alarm
CAQD
CAID
N/A
Currently
Established
Outgoing
Associations
Incoming
Associations Attempted
70
Count Active associations originated
from the grid, to remote entities.
Count Attempted associations from
remote entities since the last
restart.
N/A
N/A
HP Medical Archive
Page 86

Services and Components
Table 16: CLB
X DICOM Component Attributes (cont.)
Attribute Type / Units Description
Incoming
Associations Successful
Count Attempted associations from
remote entities that succeeded in
connecting at the TCP/IP layer
(since the last restart).
Incoming
Associations Failed
Count Attempted associations from
remote clients that failed to
connect at the TCP/IP layer (since
the last restart).
Incoming
Associations Refused
Incoming
Associations Failed Node
Side
Incoming
Associations Failed Client
Side
Count Attempted associations that were
refused by all grid destinations
(since the last restart).
Count Associations from remote entities
that connected and then failed due
to a TCP/IP problem in the grid
(since the last restart).
Count Associations from remote entities
that connected and then failed due
to a TCP/IP problem at the remote
entity (since the last restart).
C T Alarm
N/A
CIAF
N/A
N/A
N/A
Incoming
Associations Unknown
Failure
Outgoing
Associations Attempted
Outgoing
Associations Successful
Outgoing
Associations Failed
Count Attempted associations from
remote entities that failed to
connect the TCP/IP layer for
unknown reasons (since the last
restart).
Count Attempted associations from the
grid since the last restart.
Count Attempted associations from the
grid that succeeded in connecting
at the TCP/IP layer (since the last
restart).
Count Attempted associations from the
grid that failed to connect at the
TCP/IP layer (since the last
restart).
N/A
N/A
N/A
COAF
71
HP Medical Archive
Page 87
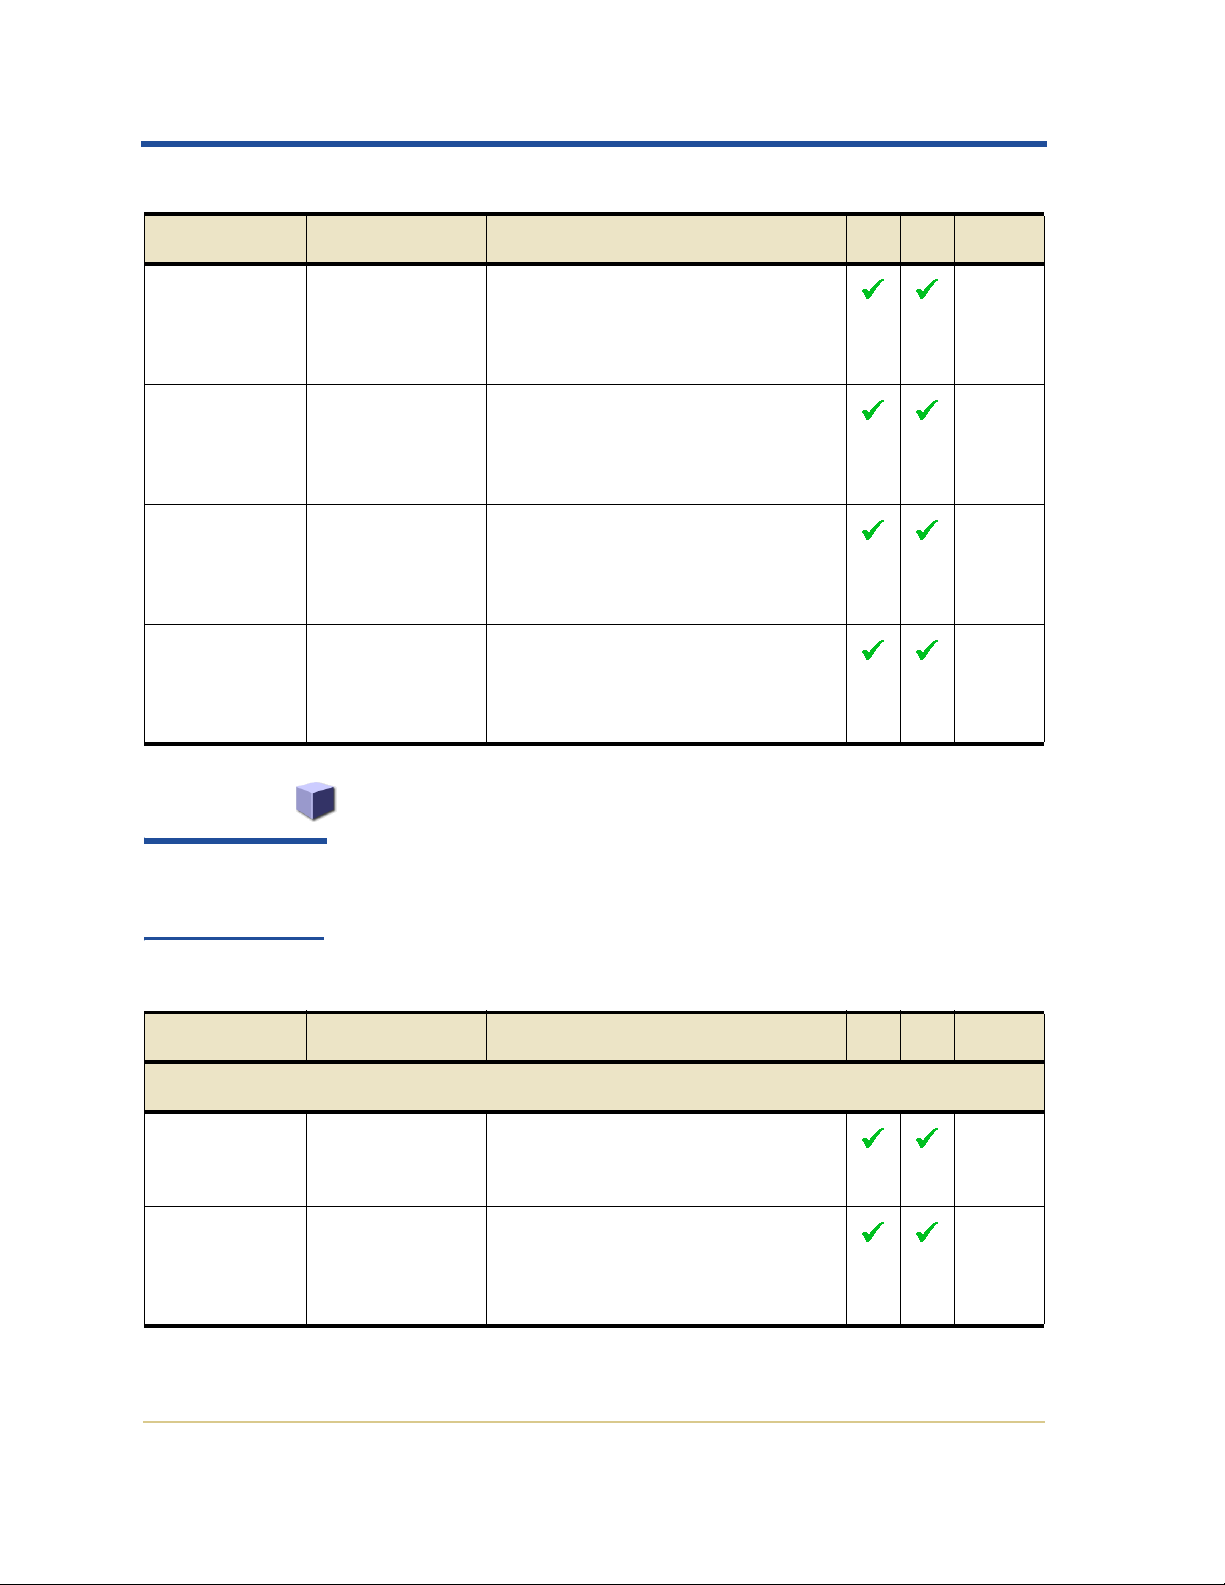
HPMA User Guide
Table 16: CLB
X DICOM Component Attributes (cont.)
Attribute Type / Units Description
Outgoing
Associations Refused
Count Attempted associations from the
grid that were refused by the
remote destination (since the last
restart).
Outgoing
Associations Failed Node
Side
Outgoing
Associations Failed Client
Side
Outgoing
Associations Unknown
Failure
Count Associations from the grid that
connected and then failed due to a
TCP/IP problem in the grid (since
the last restart).
Count Associations from the grid that
connected and then failed due to a
TCP/IP problem at the remote
entity (since the last restart).
Count Attempted associations from the
grid that failed to connect the
TCP/IP layer for unknown reasons
(since the last restart).
C T Alarm
N/A
N/A
N/A
N/A
HTTP
The FSG uses
HTTP for grid
transactions.
Table 17: CLB X HTTP Component Attributes
Attribute Type / Units Description
Destinations
Number
Ava ilab le Q/R
Destinations
Number
Ava ilabl e
Ingest
Destinations
The HTTP component handles forwarding of HTTP session traffic to
optimal services and tracks TCP/IP connectivity for HTTP connections.
The number of available destinations for query and retrieval (Q/R) and
for ingest via HTTP are reported, as are statistics on connections.
Count Nodes accepting HTTP connec-
tions for content query and
retrieve operations.
Count Nodes that accept HTTP connec-
tions for ingesting content to the
grid.
C T Alarm
CAQH
CAIH
72
HP Medical Archive
Page 88

Services and Components
Table 17: CLB
X HTTP Component Attributes (cont.)
Attribute Type / Units Description
HTTP Sessions
Incoming
Sessions -
Count Active HTTP sessions originated
from remote entities.
Established
Incoming
Sessions Attempted
Incoming
Sessions Successful
Count Attempted sessions from remote
entities at the TCP/IP layer (since
the last restart).
Count Attempted sessions from remote
clients that succeeded in connecting at the TCP/IP layer (since the
last restart).
Incoming
Sessions Failed
Count Attempted sessions from remote
clients that failed to connect at the
TCP/IP layer (since the last
restart).
Incoming
Sessions Refused
Count Attempted sessions that were
refused by all grid destinations
(since the last restart).
C T Alarm
N/A
N/A
N/A
CISF
N/A
Incoming
Sessions Failed Node
Side
Incoming
Sessions Failed Client
Side
Incoming
Sessions Unknown
Failure
Count Sessions that connected and then
failed due to a TCP/IP problem in
the grid (since the last restart).
Count Sessions that connected and then
failed due to a TCP/IP problem at
the remote entity (since the last
restart).
Count Attempted sessions that failed to
connect the TCP/IP layer for
unknown reasons (since the last
restart).
N/A
N/A
N/A
73
HP Medical Archive
Page 89

HPMA User Guide
Connectivity
The CLB supports the standard Connectivity component attributes.
Table 18: CLB X Connectivity Component Attributes
Attribute Type / Units Description
Received
Data Rate
Transmitted
Data Rate
Received
Bytes
Transmitted
Bytes
bits / s Current rate that data is being
received.
bits / s Current rate that data is being
transmitted.
Bytes Total data received since the last
service restart.
Bytes Total data sent since the last
restart.
Connectivity Status
Connected
ADCs
Connected
NMSs
Audit
Message
Destinations
Count Number of ADC services con-
nected to this service.
Count Number of NMS services con-
nected to this service.
Count Number of services that can
accept audit messages from this
service.
C T Alarm
N/A
N/A
N/A
N/A
NADC
NNMS
NAMS
Audit
Messages
Queued
Audit
Messages
Count Messages waiting for confirmed
delivery to an AMS (or audit relay
service).
Count Messages committed to the AMS
(or audit relay service).
AMQS
N/A
Committed
Connections
Node ID Number Unique node ID of a connected
N/A
service.
User Label Text User-defined label for the con-
N/A
nected service. If the label appears
blue, this service has a connection
to it, but the NMS does not.
74
HP Medical Archive
Page 90

Services and Components
Table 18: CLB
X Connectivity Component Attributes (cont.)
Attribute Type / Units Description
Status Text Connection status of the service:
• Connected
• Reconnecting
Transient service connections disappear from the list when
disconnected. Only retained
service connections can report
“Reconnecting” when the connection is lost.
C T Alarm
N/A
75
HP Medical Archive
Page 91

HPMA User Guide
CMN—Configuration Management Node
This service provides a mechanism to perform grid-wide configuration of connectivity and protocol features needed by all services in the
grid. Viewing the attributes of this service and its components, enables
you to determine:
• The File System Gateway (FSG) replication groups (see page 102)
and the roles each FSG is performing.
• The remote entities permitted to connect and to which capabilities
they have access
• The state and history of Grid Tasks; specially programmed opera-
tions to update or service the HP Medical Archive.
• Your Grid ID number
• Other information related to servicing your grid.
Remote Connections and Permissions
Components of this service control the list of “friends” from which
connections to the grid are permitted. Each of these is allocated permission to use the HTTP or DICOM protocol, or both. Within each
protocol, there are profiles that govern the permitted activities.
Access to the settings for components of this service is restricted to the Vendor
account. Contact HP technical support for assistance.
CMN Attributes
The CMN supports the standard set of service attributes. These
common service attributes appear on the Overview tab for the service.
Table 19: CMN Service Attributes
Attribute Type / Units Description
CMN State Enumerated
Text
Current state of the service:
2=Online
1 = Standby
0=Offline
C T Alarm
CMNE
76
HP Medical Archive
Page 92

Table 19: CMN Service Attributes (cont.)
Services and Components
Attribute Type / Units Description
CMN Status Enumerated
Text
The status of the service’s
functionality:
0 = No Errors
1=Error
Node Information
User Label Text User-defined label for the service
appearing in the Navigation Tree,
map views, and the title of the
Content frame.
Notes Text Additional user-defined text pro-
viding description and
annotations of the service or
server.
Device Type Text The specific internal label for the
service (allocated at manufacturing time), “Configuration
Management Node”.
C T Alarm
CMNA
N/A
N/A
N/A
Vendor Text Manufacturer of the service. N/A
Version Text Code version and build informa-
N/A
tion for the service. Reporting this
can indicate when upgrades were
implemented.
Node ID Number Unique node ID assigned at
N/A
installation.
X Coordinate Meters Earth-Centered Earth-Fixed
N/A
(ECEF) coordinates for the global
Y Coordinate Meters N/A
position of the server.
Not applicable to the HP Medical
Z Coordinate Meters N/A
Group ID Number Identifier of the logical group
Archive.
N/A
(location) to which the service
belongs. Used in placing replications under business rules.
77
HP Medical Archive
Page 93

HPMA User Guide
Table 19: CMN Service Attributes (cont.)
Attribute Type / Units Description
System Status
Service Load Percent Percentage of the CPU time used
by this service; indicating how
busy the service is.
Memory
Usage
Percent
Memory
Used
Bytes RAM currently being used by this
service.
Percent Percent of total available RAM
being used. This can be greater
than 100% if disk swap space is
used.
Service
Uptime
Service
Runtime
Duration Total duration since the last
restart.
Duration Total duration the service has
functioned since installation; the
sum of all uptimes.
Restarts Count Total number of restarts since
installation.
C T Alarm
N/A
N/A
PMEM
N/A
N/A
N/A
Reference
Clock Source
Reference
Clock Status
Text Indicates the origin of timing
information; used for audit messages, communication, and timing
functions:
• NTP
• GPS (not used in the HPMA)
Enumerated
Text
Indicates the current condition of
the timing source:
0=Stable
1=Flywheeling
2=Unstable
3=Offline
4=Unknown
N/A
TRFS
78
HP Medical Archive
Page 94

Table 19: CMN Service Attributes (cont.)
Services and Components
Attribute Type / Units Description
Local Clock
Status
Local Clock
Rate Error
Local Clock
Rate Drift
Network
Neighbor
Drift
Enumerated
Text
ppm The error between the local clock
ppm The cumulative offsets (since last
µs Rough measure of how different
Indicates the condition of the
internal timing system:
0=Calibrating
1 = Synchronizing
2 = Syntonizing
3=Flywheeling
(Recalibrating)
4=Flywheeling
and the reference clock.
restart) required by the local clock
to keep in sync with the reference
clock.
this service’s clock is from that of
the ADC services.
C T Alarm
TRSS
N/A
N/A
TNER
CMN Components
In addition to the standard service attributes, the CMN also supports
the following components:
• Audit
• IP Ranges
• HTTP
• HTTP Advanced
• DICOM
• DICOM Advanced
• DICOM Indexes
• FSG Groups
• Grid Options
• Grid Tasks
• NMS Entities
• Connectivity
79
HP Medical Archive
Page 95

HPMA User Guide
Access to the settings for components of this service is restricted to the Vendor
account. Contact HP technical support for assistance.
Audit
This component provides data on the level of audit message reporting
to the audit log. The audit log is a file of grid events used by technical
support staff when troubleshooting issues.
Access to the audit log files is limited to authorized technical support
staff unless you have purchased the audit option. For those with the
audit option a separate document detailing access and log content is
provided.
Table 20: CMN X Audit Component Attributes
Attribute Type / Units Description
Audit Levels
Audit
Category
Level Enumerated
Audit
Category
Code
Text Categories of grid events that can
generate audit messages.
The level of audit messages that
Text
Text A four-character code designation
are retained in the audit log:
0=Off (none)
1=Error
2=Normal
3=Debug
for the class of audit messages.
Not applicable to the HP Medical
Archive.
IP Ranges
This component provides data on the range of IP addresses from
which the grid will accept a TCP/IP connection.
C T Alarm
N/A
N/A
N/A
IP ranges are organized by an IP Range Name; usually a geographical
location, a device, or a workgroup of users. The Location and group
assignments are not used in the HP Medical Archive.
80
HP Medical Archive
Page 96
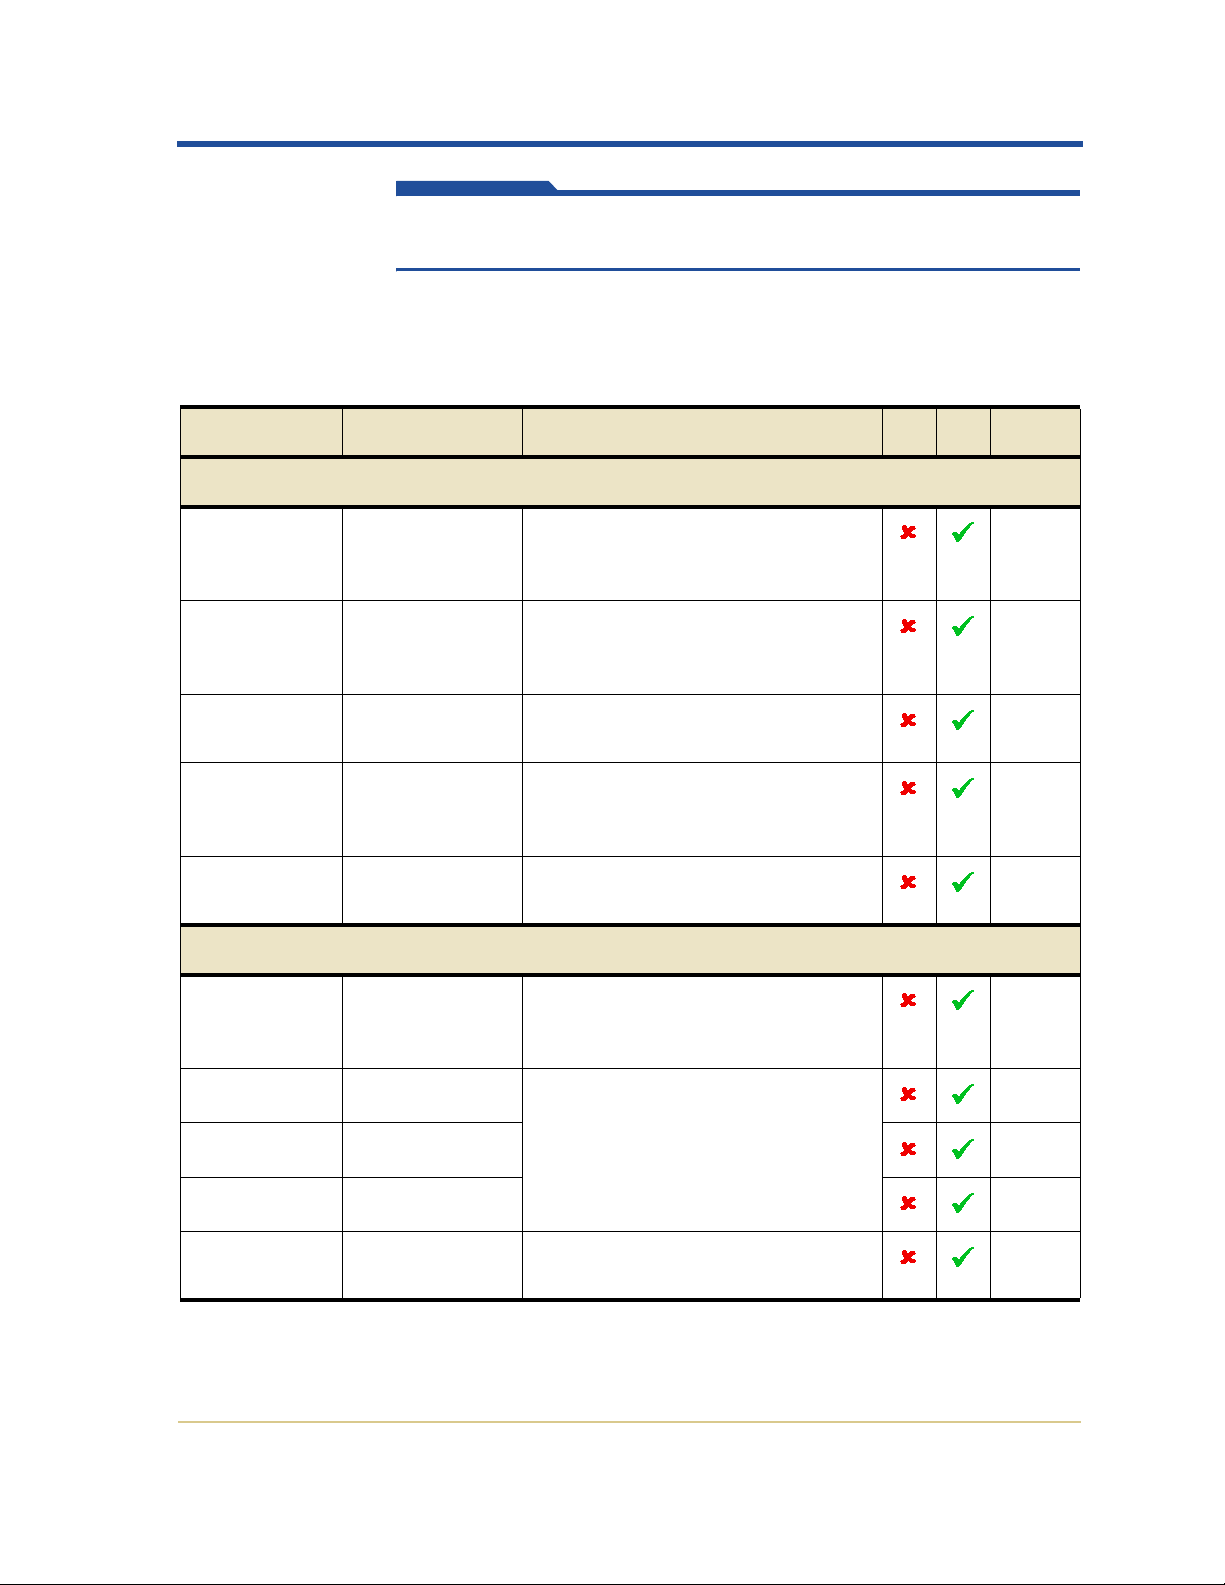
Services and Components
If an incoming IP address is included in more than one range, the device is
matched to the first occurrence from the top of the table downward.
The protocols supported for entities connecting from an address in the
range are indicated by check boxes.
Table 21: CMN
X IP Ranges Component Attributes
Attribute Type / Units Description
Allowable IP Ranges
IP Range
Name
Text User-defined label assigned to the
IP range, usually a location or
workgroup.
IP Range Dotted decimal
or CIDR
Range of remote IP addresses
(inclusive) from which the grid
accepts TCP/IP connections.
Location Text Case sensitive reference to an
entry in the Locations table below.
DICOM Check box Indicates if DICOM protocol is
supported for devices in this IP
range.
HTTP Check box Indicates if HTTP is supported for
devices in this IP range.
Locations
C T Alarm
N/A
N/A
N/A
N/A
N/A
Location Text User-defined name for a location
N/A
definition; this is referenced in the
IP Ranges table.
X Coordinate Meters This is not used in the HP Medical
N/A
Archive; leave blank.
Y Coordinate Meters N/A
Z Coordinate Meters N/A
Group ID Number This is not used in the HP Medical
N/A
Archive; leave blank.
81
HP Medical Archive
Page 97

HPMA User Guide
HTTP
When a range of IP addresses defined above has HTTP support
enabled, those devices must also be enabled as HTTP entities using
this component. This allocates a capability profile (see “HTTP
Advanced” below) to the devices from selected IP ranges.
Table 22: CMN X HTTP Component Attributes
Attribute Type / Units Description
HTTP Entities
Description Text User-defined description for the
set of entities in this IP range.
IP Range Dotted decimal
or CIDR
Profile Name Text Case sensitive reference to an
Range of remote device IP
addresses (inclusive) to which the
grid assigns the profile.
entry defined in the HTTP
Advanced component. The profile
governs the permitted activities
for connections from this IP range.
HTTP Advanced
Each remote entity that supports HTTP is allocated a profile defining
the capabilities the grid offers to that entity. This component defines
the profiles that can be assigned in the HTTP component (above).
C T Alarm
N/A
N/A
N/A
Profiles can be defined in each of the three supported namespaces:
• /CBID for object access by Content Block ID
• /UUID for access by Universal Unique ID handle
• /DICOM for adding DICOM content to the grid
The range of capabilities HTTP offers in each namespace varies. The
same (case sensitive) profile name can be repeated in each namespace.
82
HP Medical Archive
Page 98

Services and Components
Thus, a profile combines capabilities for an entity to use more than one
namespace.
Table 23: CMN
X HTTP Advanced Component Attributes
Attribute Type / Units Description
HTTP /CBID Namespace
Profile Name Text User-defined profile name. This
name is referenced in the HTTP
component.
PUT Check box Indicates if clients assigned this
profile can use the HTTP PUT
command to add content to the
grid.
GET Check box Indicates if clients assigned this
profile can use the HTTP GET
command to retrieve content from
the grid.
POST Check box Indicates if clients assigned this
profile can use the HTTP POST
(query) command.
DELETE Check box Indicates if clients assigned this
profile can use the HTTP DELETE
command; disabled in this release.
C T Alarm
N/A
N/A
N/A
N/A
N/A
HTTP /UUID Namespace
Profile Name Text User-defined profile name. This
N/A
name is referenced in the HTTP
component.
PUT Check box Indicates if clients assigned this
N/A
profile can use the HTTP PUT
command to store files and
allocate a UUID handle.
GET Check box Indicates if clients assigned this
N/A
profile can use the HTTP GET
command to retrieve files by
UUID handle; disabled in this
release.
83
HP Medical Archive
Page 99
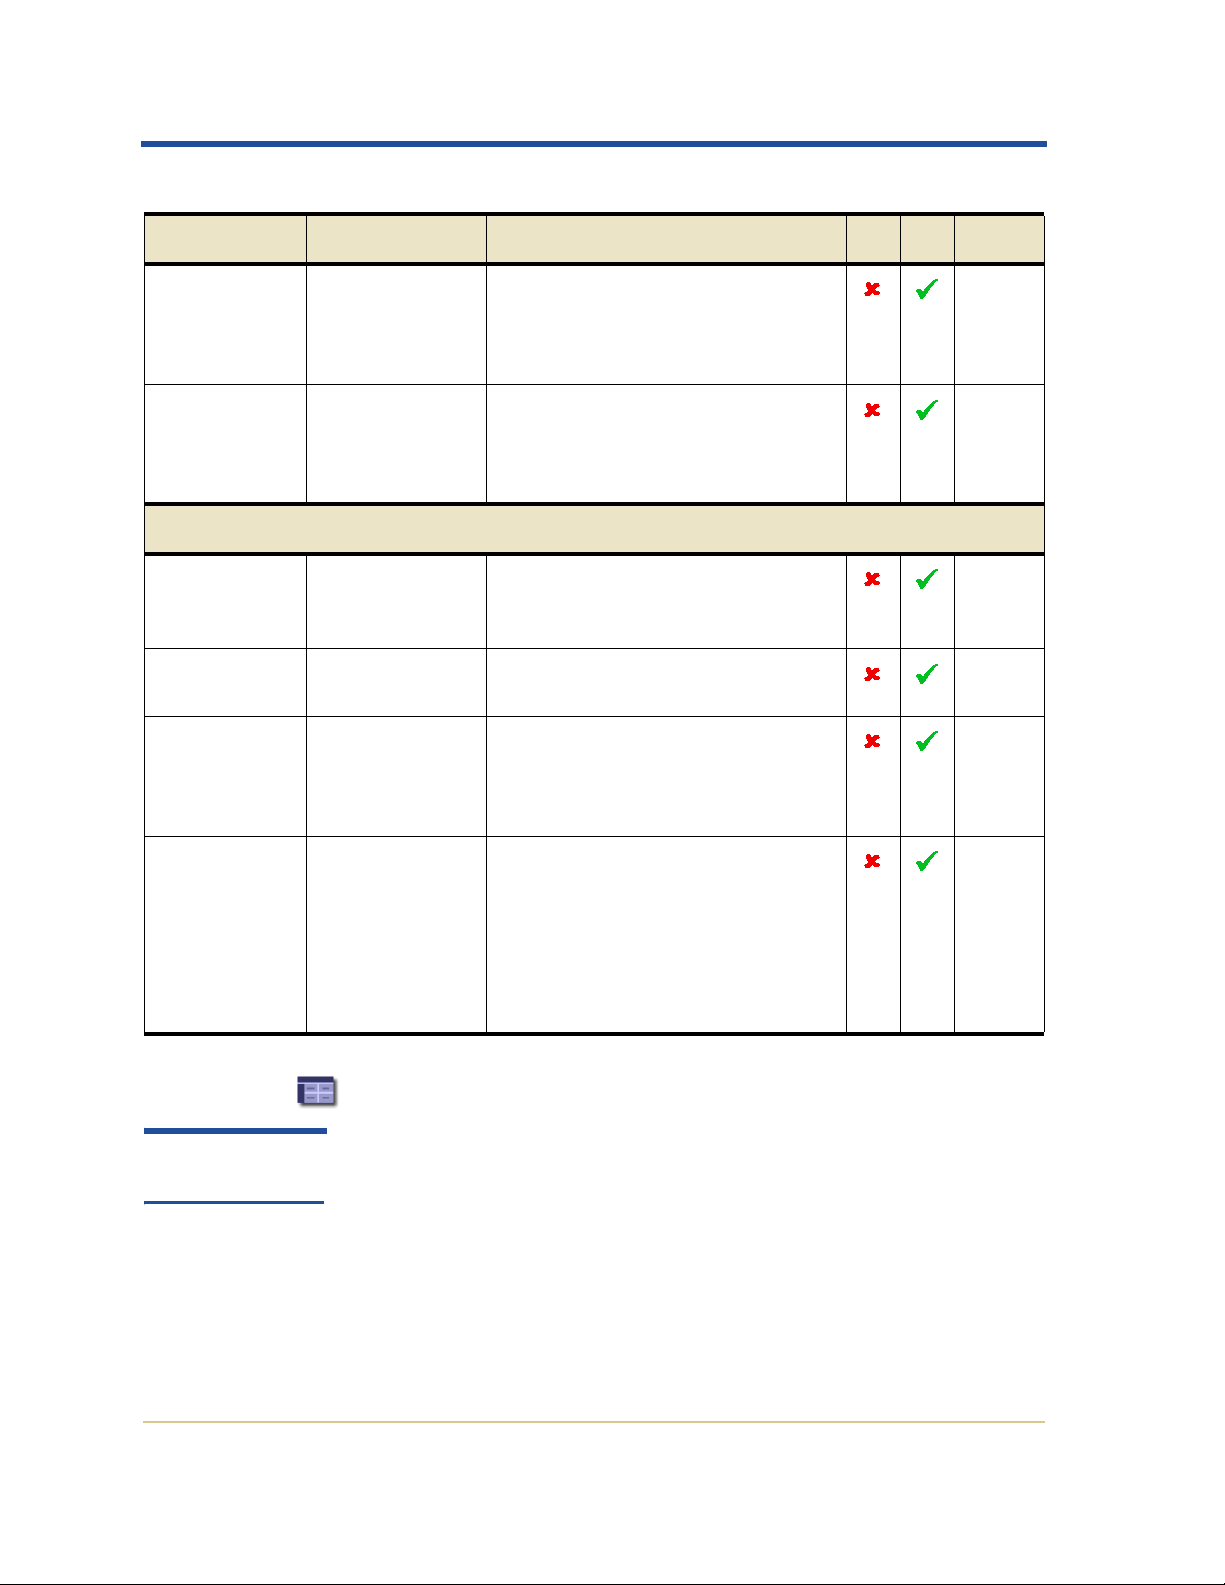
HPMA User Guide
Table 23: CMN
X HTTP Advanced Component Attributes (cont.)
Attribute Type / Units Description
POST Check box Indicates if clients assigned this
profile can use the HTTP POST
(query) command; disabled in this
release.
DELETE Check box Indicates if clients assigned this
profile can use the HTTP DELETE
command to release a UUID
handle.
HTTP /DICOM Namespace
Profile Name Text User-defined profile name. This
name is referenced in the HTTP
component.
AE Title Text The AE Title allocated to the
remote entity.
Coerce Tag
Profile Name
Text Case sensitive reference to an
entry defined in the DICOM
Advanced component. The profile
is used to enable data partitioning.
C T Alarm
N/A
N/A
N/A
N/A
N/A
PUT Check box Indicates if remote entities
assigned this profile can use the
HTTP PUT command to store
DICOM objects. This should
always be enabled; without it, an
entity with this profile has no
access to the DICOM namespace.
DICOM
DICOM is optional
on the HPMA.
When a range of IP addresses defined above has DICOM support
enabled, devices from that range must also be enabled as DICOM
Application Entities (AEs). This allocates a capability profile (see
“DICOM Advanced” below) to those devices. An entity is uniquely
defined by the combination of AE Title, IP address and port, and the
grid AE to which it is associating. For example, entities can share an
AE Title and port number while still being distinguished by unique IP
addresses within the defined range.
N/A
84
HP Medical Archive
Page 100

Services and Components
The grid can present multiple AE titles, so associations must also
match the caller to an accepted grid AE. This is used to assign differing
profiles to single remote AEs.
Table 24: CMN
Attribute Type / Units Description
X DICOM Component Attributes
C T Alarm
DICOM AEs
Description Text User-defined description of the
N/A
entity or group of entities.
AE Title Text The AE Title of the remote entity. N/A
IP Range Dotted decimal
or CIDR
A remote device IP address (or
inclusive range) to which the grid
N/A
assigns the profile.
Port Number The port used for DICOM by the
N/A
remote device.
Via LDR Check box Indicates whether the LDR can
N/A
make direct connections with
remote entities. If not selected,
connections are routed through a
CLB service. The HP Medical
Archive must use the CLB (check
box is deselected).
GRID AE Text AE Title of the grid to which the
N/A
entity can associate.
Profile Name Text Case sensitive reference to an
N/A
entry defined in the DICOM
Advanced component. The profile
governs the permitted activities
for entities in this IP range.
DICOM Advanced
Each remote entity that supports DICOM can be allocated a profile
defining the capabilities the grid offers to that entity. This component
defines the profiles that can be assigned to AEs in the DICOM component (above).
The Advanced Config Profile is used during the association handshake
to control the types of actions permitted and the format of files in the
85
HP Medical Archive
 Loading...