

Page 1

Errata
4342A Q-meter Operating and
Service Manual
04342-90006
March 1983
Thanks to John Day who provided this scanned copy
Title & Document Type:
Manual Part Number:
Revision Date:
HP References in this Manual
This manual may contain references to HP or Hewlett-Packard. Please note that HewlettPackard's former test and measurement, semiconductor products and chemical analysis
businesses are now part of Agilent Technologies. We have made no changes to this
manual copy. The HP XXXX referred to in this document is now the Agilent XXXX.
For example, model number HP8648A is now model number Agilent 8648A.
About this Manual
We’ve added this manual to the Agilent website in an effort to help you support your
product. This manual provides the best information we could find. It may be incomplete
or contain dated information, and the scan quality may not be idea l. If we find a better
copy in the future, we will add it to the Agilent website.
Support for Your Product
Agilent no longer sells or supports this product. You will find any other available
product information on the Agilent Test & Measurement website:
www.tm.agilent.com
Search for the model number of this product, and the resulting product page will guide
you to any available information. Our service centers may be able to perform calibration
if no repair parts are needed, but no other support from Agilent is available.
Page 2

MET6LoGY
JAN 21 1986
thERATING
i
.
AND
SERVICE MANUAL
434.2A.
HEWLETT
I?!!
PACKARD
Page 3

COPYRIGHT AND DISCLAIMER NOTICE
Copyright - Agilent Technologies, Inc. Reproduced with the permission of Agilent
Technologies Inc. Agilent Technologies, Inc. makes no warranty of any kind with regard
to this material including, but not limited to, the implied warranties of merchantability
and fitness for a particular purpose. Agilent Technologies, Inc. is not liable for errors
contained herein or for incidental or consequential damages in connection with the
furnishing, performance, or use of this material or data.
Page 4

CERTI FI CATI 0 N,
The Hewlett-Packard Company certifies that this instrument was
thoroughly tested and inspected and found to meet its published
specifications when it was shipped
Packard -Company further
ments are traceable to the U.S. National Bureau
the extent allowed by the Bureau’s calibration facility.
certifies
from
the factory. The Hewlett-
that its calibration meusure-
of
Standards to
WARRANTY AND ASSISTANCE
All Hewlett-Packard products are warranted against defects in
materials and workmanship. This warranty applies for one year
from the date of delivery, or, in the case of certain major compo-
nents listed in the operating manual, for the specified period. We
will repair or replace products which prove to be defective during
the warranty period provided they are returned to Hewlett-
Packard. No other warranty is expressed or implied. We are not
liable for consequential damages.
Service contracts or customer assistance agreements are available
for Hewlett-Packard products that require maintenance and re-
pair on-site.
For any assistance, contact your nearest Hewlett-Packard Sales and
Service Office. Addresses are provided at the back of this manual.
Page 5

OPERATING AND SERVICE
MODEL 4342A
Q METER
SERIAL NUMBERES COVERED
This manual applies directly to Model 43428 Q Meter
with serial prefixed 12125. Backdating changes in
SectionVII cover instruments with serials 12125-00590
and below. Instruments with higher serial prefix will
be covered in an Updating Manual Supplement at the
first of the manual.
MANUAL
This manual cover-es Option 001 instruments as well
as the standard instrument.
aCOPYRIGHT: YOKOGAWA-HEWLETT-PACKARD, LTD., 1970
9-1, TAKAKURA-CHO, HACHIOJI-SHI, TOKYO, JAPAN
Manual Part No. 04342-90009
Microfiche Part No. 04342-90059
OPTIONS COVERED
Printed: MAR. 1983
HEWLETT
PACKARD
Page 6

Table
of Contents
Model 4342A
TABLE OF CONTENTS
Section
GENERAL INFORMATION
I
Title Page
...................................
l-l. Introduction.. .......................................
1-3.
How the 4342A Measures
l-8. Instruments Covered by Manual
1-13.
Specifications .......................................
1-15. Accessories Supplied
1-17. Accessories Available
l-19. Options..
II INSTALLATION
2-l. Introduction
2-3. Initial Inspection
...........................................
...........................................
.........................................
.....................................
2-4. Mechanical Check
2-6.
Performance Check
2-8. Damage Claim
2-11. Storage and Shipment
.............................
.......................
................................
............................... I-3
..............................
............................. 2-I
.................................
.................................
2-12. Packaging .....................................
2-13. Environment
2-14.
2-15.
2-16.
III OPERATION
3-l.
3-3.
Power Connection
Line Voltage
Power Cable
........................................................................................
Introduction
Panel Controls, Connectors and Indicators
3-5. Q Measurement General
...................................
....................................
...................................
...................................
.............................. 3-l
3-8. Go/No-Go Function ..................................
3-10. Measurement Terminals
3-12. How to Connect Unknown
..............................
..............................
3-14. Measurement Parameters and Connection Methods
3-16.
3-18.
3-20.
3-22.
3-24.
Direct Method Limitations
Expansion of Measurement Ranges
Capacitance Measurement
Resistance Measurement
High Q Measurement
....................... 3-5
....................... 3-6
........................
........................... 3-7
3-26. Supplemental Equipment Used in Parallel
......................... 3-7
.........................
3-30.
3-31.
and Series Methods
Basic Q Meter Measurements
Quality Factor and Inductance
Measurements (Direct Connection)
3-33. Q Measurement
3-35.
dQ Measurement
3-37. Inductance Measurement
3-39.
3-41.
3-42.
3-45.
Inductance Measurement (at a desired frequency).
Measurement Requiring Corrections
Effects of Distributed Capacitance
Measuring Distributed Capacitance
(Preferred Method)
3-47.
Measuring Distributed Capacitance
(Approximate Method, Cd IlOpF)
3-49. Correction for Q
3-55.
Parallel and Series Connection Measurement Methods
................................
...............................
........................
................... 3-13
.........................
...............................
3-56. General .......................................
3-60.
3-64.
Parallel Measurements
Additional Error Discussion
...............................
3-65. High Inductance Measurement
3-67.
3-69.
3-71.
Low CapacitanceMeasurement (~45OpF) ..........
High Resistance Measurement
Dielectric Measurement
...................
....................
................... 3-20
........................
.............
...............
........... 3-11
................
............
1-I
l-l
l-2
l-2
l-3
1-3
l-3
2-l
2-i
2-l
2-I
i::
2-l
2-I
i-t
-
2-1
;-;
-
3-l
3-l
3-5
3-5
...... 3-5
3-6
3-6
3-11
3-11
3-12
3-12
.. 3-13
3-13
3-14
3-15
3-16
... 3-1’7
3-17
3-17
3-18
3-18
3-19
3-21
Page 7

Model 43426 Table of Contents
Section Title Page
3-73. Series Measurements ................................
3-23
3-74. Low Inductance Measurement .................... 3-23
3-76. High Capacitance Measurement (>450pF) .........
3-24
3-78. Self-resonant Frequency Measurement
of High Capacitors .......................... 3-24
3-80. Low Resistance Measurement
....................
3-26
IV THEORY OF OPERATION ................................... 4-l
4-l.
4-3.
Introduction.. ....................................... 4-1
Q Determination and Measurement ..................... 4-l
4-6. Simplified Block Diagram ............................. 4-l
4-8. Block Diagram Description ...........................
4-l
4-10. Oscillator and Impedance Converter (AlAl) ....... 4-l
4-12.
4-14. ALC Amplifier (P/O A8)
4-16. Q/AQ Range Attenuator (A3) .....................
RF Power Amplifier (AlA2) ..................... 4-l
........................
4-2
4-2
4-18. Tuning Capacitor and Injection Transformer (A2). .. 4-2
4-21.
4-24. DC Amplifier (A6)
4-26.
4-28. Circuit Details
4-29. LC Oscillator (P/O AlAl) .......................
RF Amplifier and Detector (A5) .................. 4-2
Q Limit Selector (A7) ...........................
..............................
......................................
4-2
4-2
4-2
4-2
4-31. Impedance Converter (P/O AlAl) and RF
Power Amplifier (AlA2) .... 4-3
4-33.
4-35. Q Range Attenuator (A3)
4-37.
ACL Amplifier (P/O A8) ........................ 4-3
........................
4-3
Impedance Converter, RF Amplifier
and Detector (A5)
...... 4-3
4-39. DC Amplifier (A6) .............................. 4-3
4-41. Q Limit Selector (A7)
4-43. Power Supply (P/O ~8)
........................... 4-3
.........................
4-3
V MAINTENANCE
5-l.
Introduction ......................................... 5-l
............................................
5-3. Test Equipment Required ............................. 5-l
5-5.
Q Accuracy Considerations ........................... 5-l
5-7. Option .............................................. 5-l
5-9. Performance Checks
5-11. Frequency Accuracy Check..
5-12.
5-13.
QRange Check.. ............................... 5-3
AQ Range Check ............................... 5-4
5-14. Capacitance Accuracy Check
5-15. Q Limit Operation Check
.................................
....................
....................
........................ 5-5
5-16. Adjustment and Calibration Procedures ................
5-18.
5-19. Oscillator Level Adjustment
Power Supply Adjustment
........................
.....................
5-20. Oscillator Frequency Adjustment ................. 5-8
5-21.
5-22.
5-23. Frequency Response Adjustment
5-24. Q Limit Selector Adjustment
5-25. Option 001 Maintenance Instructions
Q Voltmeter Adjustment ........................ 5-9
Q Analog Output Adjustment .....................
.................
.....................
...................
5-27. Option 001 Performance Checks ..................
5-29. Option 001 Calibration and Adjustment Procedures . 5-13
5-31.
Dial Re-stringing Instructions .........................
5-34. Frequency Dial ................................. 5-14
5-35.
L/C Dial
......................................
5-36. AC Dial .......................................
5-37. Troubleshooting Guides ...............................
5-39. High Frequency Line Noise
5-40.
Operating in a Strong Electromagnetic Field .......
......................
5-41. Operating in High Humidity Environment .......... 5-18
5-l
5-3
5-3
5-4
5-8
5-8
5-8
5-10
5-11
5-11
5-12
5-12
5-14
5-14
5-14
5-18
5-18
5-18
. .
111
Page 8

Table of Contents
List of Tables
Model 4342A
Section
5-42.
5-43.
5-44.
5-45.
5-46.
Elementary Troubleshooting Guide
Meter Zeroing Troubles ........................
Incorrect Q Meter Indication
Low Q Indication in High Frequency
Faulty Q Limit Operation
VI REPLACEABLE PARTS
6-l.
Introduction.. ....................................... 6-l
Title
.................................... 6-l
6-6. Ordering Information .................................
VII MANUAL CHANGES AND OPTIONS
7-1.
7-3.
7-5.
Options
Special Instruments .................................
Manual Changes .....................................
............................................. 7-l
7-7. Later Instruments
7-8.
7-9.
VIII CIRCUIT DIAGRAMS
Earlier Instruments ............................
Option 001 Instruments .........................
.......................................
..........................
..............................
8-l. Introduction .........................................
8-4.
APPENDIX OPTION 001
I
II Manual Changes
III
GeneralNotes
.......................................
........................................ A-l
Replaceable Parts
Circuit Diagrams
................................... A-l
.....................................
....................................
Page
.....................
5-18
5-18
..................... 5-18
Measurements
.......... 5-19
....................... 5-19
A-l
A-2
6-l
7-l
7-l
7-l
7-l
7-l
7-l
8-l
8-l
8-l
Number
l-l.
l-2.
2-l.
3-l.
3-2.
3-3.
3-4.
5-l.
5-2.
5-3.
5-4.
5-5.
5-6.
5-7.
5-8.
5-9.
6-l.
6-2.
7-l.
LIST OF TABLES
Title
Specifications
Accessories - Typical Values
.......................................
.........................
AC Line Fuse .......................................
Methods of Connecting Unknown .......................
16451A (4342A-KOl) Typical Characteristics
............ 3-21
Formulas for Calculating Q and Impedance Parameters
from Parallel and Series Measurements
Formulas Relating Series and Parallel Components
.......... 3-27
...... 3-27
Recommended Test Equipment ........................
Q Correlation Factors
Frequency Accuracy Check
............................... 5-l
........................... 5-2
QRange Check ......................................
Capacitance Accuracy Check
Adjustable Components
Frequency Adjustment.
Frequency Accuracy Check (Option 001)
Frequency Adjustment (Option 001).
List of Reference Designators and Abbreviations
.......................... 5-5
............................... 5-7
............................... 5-8
................
.................... 5-13
........ 6-l
Reference Designation Index ..........................
Backdating Changes
..................................
Page
1-2
l-3
2-l
3-10
5-o
5-3
5-12
6-3
7-l
iv
A-l.
A-2.
Reference Designation Index for Option 001 (Al Al Ass’y). .
Reference Designation Index for Option 001 (A5
Ass’y)
....
A-3
A-5
Page 9

Model 4342A List of Illustrations
LIST OF ILLUSTRATIONS
Number Title
l-l.
3-l.
3-2.
3-3.
3-4.
3-5.
3-6.
3-7.
3-8.
3-9.
Model 4342A Q Meter . . . . . . . . . . . . . . . . . . . . . . . . . . . . . . . .
Front Panel Controls
................................
Rear Panel Controls and Connectors
Measurement Terminal Circuit
Inductance Measurement Ranges vs. Frequency
Ranges of Measurable Resistance
Zeroing Procedure
...................................
Distributed Capacitance in Direct Connection ........... 3-11
Distributed Capacitance Circuit Model
Typical Variation of Effective Q and
Inductance with Frequency ....... 3-14
3-10.
3-11.
4-l. Series Resonant Circuit
4-2.
4-3.
5-l.
5-2.
5-3.
5-4.
5-5.
5-6.
5-7.
5-8.
5-9.
5-10.
5-11.
5-12.
5-13.
Correction Chart for Distributed Capacitance ........... 3-14
Residual Parameters .................................
..............................
Model 43426 Simplified Block Diagram
Constant Voltage Injection System
Q Range Check
AQ
Range Check
......................................
.....................................
Capacitance Accuracy Check
Model 4342A Adjustment Locations
Model 4342A Assembly Locations
Voltmeter Adjustment
................................ 5-10
Frequency Response Adjustment
Frequency Dial Restringing
Main C Dial Restringing
AC Dial Restringing
.............................. 5-16
..................................
Tuning Capacitor Disassembly (top view) ............... 5-19
Troubleshooting, Oscillator Section
Troubleshooting, Voltmeter Section
Page
l-l
3-2
...................
.......................
(direct method)
......................
.........
3-4
3-5
3-6
3-7
3-8
................. 3-13
3-17
4-o
.................
.....................
..........................
....................
...................... 5-6
......................
........................... 5-15
4-O
4-2
5-2
5-3
5-4
5-6
5-11
5-17
................... 5-21
...................
5-19
6-l.
6-2.
6-3.
6-4.
Exploded View of Oscillator Ass’y
.....................
Exploded View of Tuning Capacitor Ass’y
Exploded View of Q Range Attenuator Ass'y
Exploded View of Frequency Multiplier, Over Limit
Indicator, and Frequency Scale Indicator
6-5.
6-6.
6-7.
6-8.
7-1. A7 04342-7707 .......................................
7-2. All 04342-7711
7-3.
8-1.
8-2.
8-3.
Exploded View of Main and Vernier Capacitor
Exploded View of Oscillator Lever Ass’y
Exploded View of Rear Panel
Exploded View of Handle Section
Partial Schematic of Power Supply
...................................... 7-2
Schematic Diagram Notes . .
Function Overall Block Diagram
Oscillator
Ass'y Al,
Q Range Attenuator
..........................
......................
.................... 7-5
. . . . . . . . . . . . . . . . . . . . . . . . . . 8-2
. . . . . . . . . . . . . . . . . . . . . . 8-3
Power Supply & ACL Amplifier Ass’y A8,
Frequency Multiplier & Over Limit Indicator
.............. 6-24
.............
..........
Dial Ass’y
...... 6-28
...............
Ass'y A3,
Ass'y
AlO.. 8-5
6-22
6-26
6-27
6-29
6-30
6-32
7-2
Page 10

List of Illustrations
Model 4342A
Number Title Page
8-4. Tuning Capacitor Ass’y A2, QRange Attenuator Ass’y A3,
8-5.
8-6. Q Limit Selector Ass’y A7
8-7.
A-l
A-2.
Impedance Converter Ass’y A4,
Meter Scale Indicator Ass’y All . . . . . . . . . . . . . . . . . . . . . . . 8-7
Q Range Attenuator Ass’y A3, Impedance Converter, RF
Amplifier &Detector Ass’y A5, DC Amplifier Ass’y A6,
Meter Scale Indicator Ass’y All . . . . . . . . . . . . . . . . . . . . . . 8-9
Frequency Multiplier & Over Limit Indicator Ass’y A 10 . . 8-11
Power Supply & ALC Amplifier Ass’y A8
Oscillator Ass’y Al (Option 001) . . . . . . . . . . . . . . . . . . . . . .
Impedance Converter, RF Amplifier & Detector
. . . . . . . . . . . . . . . . . . . . . . . . . . .
. . . . . . . . . . . . . .
Ass’y A5 (Option 001) . . . . . A-9
8-13
A-7
Page 11

Model 4342A
Section I
Paragraphs l-1 and 1-2
SECTION I
GENERAL INFORMATION
l-l. INTRODUCTION.
1-2.
The HP Model 4342A Q Meter is designed
to meet the requirements for making easy and
accurate quality factor measurements in the
laboratory, on the production line, or in QA
incoming inspection areas. The direct read-
ing,expanded scale of the 4342.4 permits measurement of Q from 5 to 1000 and the reading
of very small changes in Q resulting from
variation in test parameters. The long frequency dial scale and the pushbutton range
selector continuously cover the frequency
range of 22kHz to 7OPlHz (in seven - l/3 de-
cade steps) and permit setting the frequency
to an accuracy of 1.5% with 1% resolution.
The calibrated long-scale capacitance dials
permit reading the capacitance of the
tuning capacitor at an accuracy of 1% and
provides the capability for varying the
capacitance with O.lpF resolution on the
vernier scale. Inductance of sample can be
read directly from the inductance scale ad-
jacent to the capacitance scale at seven
specific frequencies by setting the frequency
dial to the "L" point on each frequency range.
Flat oscillator output, automatically levelcontrolled over the entire frequency ranges,
is a feature of the 4342A.
This advantage
obviates the necessity for frequent oscil-
lator level adjustments to maintain the out-
put level constant or the use of a
specially
matched fragile thermocouple level meter.
The high reliability of the instrument and
ease of operation are the direct results of
these measurement advancements in the 4342A.
For determing the resistance, reactance, or
quality factor of capacitance and inductance
samples in the high frequency region, the
4342A is a most versatile measuring instru-
ment. The 4342,1 can measure the dissipation
factor and dielectric constant of insulating
materials, coefficient of coupling, mutual
inductance, and the frequency characteristics
of transformers. Accessories which extend
the measurement capabilities, designed for
Figure l-l. Model 4342A Q Meter.
Page 12
Section I
Paragraphs 1-3 to l-12
Model 4342A
user convenience, have broad applications
in testing components and electronic materials, in physical and chemical research, and
in related scientific fields.
Pushbutton operation of frequency range and
Q/AQ range selection provides for straight-
forward measurement.
meter scales,
multipliers are used,
and reading speed.
l-3. How The 4342A Measures.
l-4. The Q Meter is basically composed of a
stable, variable oscillator, a tuning circuit
for taking resonance with an unknown sample,
and a high input impedance RF voltmeter connected across the variable capacitor which is
a section of the tuning circuit.
To measure the quality factor of a sample, a
stable oscillator signal is injected into the
series tuning circuit composed of the vari-
able capacitor and the unknown (inductor).
At the tuned frequency, the RF voltmeter
(called Q voltmeter) indicates a peak value
in the signal level increase (resonance) and
is proportional to the quality factor of the
sample measured.
signal with a low output impedance and by
measuring the signal level of the series re-
sonant circuit with a high impedance volt-
meter, the quality factor of the unknown
samnle can be accurately determined at the
resonant frequency.
parameters of the sample can be measured
(directly and indirectly) as factors of the
resonant frequency and the tuning capacity
which can be read from their respective dial
scales.
l-5. For accurate measurements, the 4342A
employs a unique constant voltage injection
system and a low output impedance injection
transformer. The oscillator signal is automatically leveled by an ALC loop to provide
the constant injection voltage required by
the Q range in use.
of an oscillator level control or the fragile
thermocouple level meter (as used in tradi-
tional Q Meters).
transformer along with the high quality low
loss tuning capacitor contribute minimal additional loss to the measurement circuit (resonant circuit) and greatly improve the Q ac-
curacy in high Q measurements.
l-6. High stability of the Q voltmeter virtually eliminates the need for Q-zero adjustments in routine measurements. Troublesome
zero settings prior to each adjustment are
thus eliminated, ensuring simple and rapid operation. Accurate determination of Q changes
l-2
frequency dials, and frequency
Automatic indication of
adding to the simplicity
By injecting an oscillator
Additionally, various
This obviates the need
The unique injection
in delta-Q measurements can be obtained in all
Q ranges by using the expanded resolution
(X10) capability.
l-7. The unique Q Limit selector is especially useful in Go/No-Go checking on the
production line. The high response speed of
the Go/No-Go indicator (compared to using a
meter pointer deflection method) permits
faster Go/No-Go testing. For even easier
testing, external indicating devices may be
remotely controlled by the Go/No-Go output
signal (on the rear panel).
1-8. INSTRUMENTS COVERED BY MANUAL.
l-9. Hewlett-Packard uses a two-section
nine character serial number which is marked
on the serial number plate (Figure 1-2) attached to the instrument rear panel.
first four digits and the letter are the serial prefix and the last five digits are the
suffix. The letter placed between the two
sections identifies country where instrument
was manufactured.
all identical instruments; it changes only
when a change is made to the instrument.
suffix, however,
and is different for each instrument.
contents of this manual apply to instruments
with the serial number prefix(es) listed
under SERIAL NUMBERS on the title page.
l-10. An instrument manufactured after the
printing of this manual may have a serial
number prefix that is not listed on the title
page.
dicates that the instrument is different from
those described in this manual. The manual
for this new instrument may be accompanied by
a yellow Manual Changes supplement or have a
different manual part number. This supplement contains
plains how to adapt the manual to the newer
instrument.
l-11. In addition to change information, the
supplement may contain information for correcting errors (called Errata) in the manual.
To keep this manual as current and accurate
as possible, Hewlett-Packard recommends that
you periodically request the latest Manual
Changes supplement. The supplement for this
manual is identified with this manual's title
page.
are available from ltewlett-Packard. If the
serial prefix or number of an instrument is
lower than that on title page of this manual,
see Section VII Manual Changes.
1-12.
number prefix that is not listed on the title
page or in the Manual Changes supplement,
contact your nearest Hewlett-Packard office.
This unlisted serial number prefix in-
Complimentary copies of the supplement
For information concerning a serial
The prefix is the same for
is assigned sequentially
"change information" that ex-
The
The
The
Page 13

Model 4342A
Paragraphs l-13 to l-22
Section I
1-13. SPECIFICATIONS.
1-14. Complete specifications of the Model
4342A Q Meter are given in Table l-1. These
specifications are the performance standards
or limits against which the instrument is
tested. The test procedures for testing the
instrument to determine if it meets its specifications are covered in Section V Mainte-
nance Paragraph 5-9 Performance Checks.
When the 4342A Q Meter is shipped from the
factory, it meets the specifications listed
in Table l-l.
l-15. ACCESSORIES SUPPLIED.
1-16. Fuses (HP Part No. 2110-0339 and 2110-
0044), the Operating and Service Manual, and
a power cord are furnished with the 4342A.
One of four types of power cords (HP Part No.
8120-1703, -0696, -1692 or -1521) is fur-
nished depending on the instrument destin-
ation. All accessories supplied are packed
in the instrument carton.
l-17. ACCESSORIES AVAIALABLE.
l-18.
devices which extend or enhance the measure-
ment capabilities of the 4342A.
ing accessories are available for use with
the 4342A Q Meter:
Accessories are specially designed
The follow-
16014A Series Loss Test Adapter:
The 16014A Series Loss Test Adapter is
a special terminal adapter designed
for measuring low impedance components,
low-value inductors and resistors, and
also high value capacitors.
adapter adds convenience in connecting
components in series with the test
circuit of the 4342A Q Meter.
sists of a teflon printed-circuit
base on which are mounted binding
posts to accept the supplemental inductors,
series terminals for the unknown.
16451A Dielectric Test Adapter (4342A-KOl):
The 16451A Dielectric Test Adapter is
a test fixture for measuring the dielectric constant or dielectric loss
angle (tan 6) of insulating materials.
The 16451A has a pair of precision
variable electrodes (one side is fixed)
which hold the sample and which op-
erate similar to a micrometer to per-
mit direct reading of electrode spac-
ing. This test adapter is directly
attached to 4342A measurement
terminals.
Typical performance, characteristics, and additional information regarding these accessories are given in Table l-2.
and a pair of low-inductance
The
It con-
16470 Series Supplemental Inductors:
A range of 20 inductors (model num-
bers 16471A to 1649OA), which can be
supplied separately or as a set, are
available for use with the 4342A Q
Meter.
reference devices when measuring the
RF characteristics of capacitors, re-
sistors, or insulating materials.
4342A option 001 instruments, the
Model 16465A Inductor is additionally
available.
terminals including a guard terminal
for stabilization of measurements.
16462A Auxiliary Capacitor:
The 16462A Auxiliary Capacitor is de-
signed to extend the Q and L measurement capabilities of the 4342A. It is
especially useful when measuring small
inductors at low frequencies.
These inductors are useful as
These inductors have three
For
1-19. OPTIONS.
l-20. An option is a standard modification
performed in the instrument to meet a special
requirement desired by a user.
strument model is ordered with an option number, the corresponding optional parts are
installed in/or packaged with instrument at
the factory.
lower measurement frequency range is avail-
able for installation in the 4342A.
l-21.
l-22.
frequency range, 1OkHz to 32MHz, instead of
the standard frequency range of 20kHz to
70MHz. All specifications that apply to Option 001 instruments are given in Table 1-1.
Option 001.
The 4342A Option 001 covers a lower
An Option for obtaining a
When an in-
1-3
Page 14

Section I
Table l-l
Model 4342A
Table l-1. Specifications (Sheet 1 of 2).
FREQUENCY CHARACTERISTICS
Measurement Frequency Range:
22kHz to 70MHz in 7 bands (22 to
70kHz, 70 to 220kHz,
700 to 2200kHz, 2.2 to 7MHz, 7 to
22MHz, and 22 to 70MHz).
Frequency Dial Accuracy:
21.5% at 22kHz to 22MHz,
22%
at 22MHz to 70MHz,
-cl%
at "L" point on frequency dial.
Frequency Dial Resolution:
Approximately 21%.
Q MEASUREMENT CHARACTERISTICS
Q Range:
5 to 1000 in
to 100, 50 to 300, and 200 to 1000).
Q Tolerance:
quency 22kHz - 30MHz 30MHz - 70MHz
:
5 - 300
300 - 600
600 - 1000
Q Resolution:
Upper scale: 1 from 20 to
Lower scale: 0.5 from 5 to
AQ Range:
0 to 100 in 4 ranges, 0 to 3, 0 to
10, 0 to 30, 0 to 100.
4 ranges (5 to 30, 20
% of indicated value
(at 25'C)
27% 210%
210% 215%
215% ?20%
220 to 700kHz,
100,
30.
AQ Tolerance:
210% of full scale.
AQ Resolution:
Upper scale:
Lower scale:
I
NDUCTANCE MEASUREMENT CHARACTERISTICS
L Range:
0.09nH to 1.2H, direct reading for
seven specific frequencies as marked
at the frequency dial "L" scale point
and selected by the frequency range
switches.
L Accuracy:
?3%
after compensation for residual
inductance (approx. 1OnH).
TUNING CAPACITOR CHARACTERISTICS
Capacitance Range:
Main dial capacitor: 25 to 470pF
Vernier dial capacitor:
Capacitance Dial Accuracy:
Main dial: *l% or 1pF whichever is
Vernier dial: +O.lpF.
Capacitance Resolution:
Main dial: 1pF from 25 to 30pF,
Vernier d ial: O.lpF.
0.1 from 0 to 10,
0.05 from 0 to 3.
-5 to +5pF
greater.
2pF from 30 to 200pF,
5pF from 200 to 470pF.
1
l-4
Page 15

Model 4342A Section I
Table l-1
Table 1-l.
REAR PANEL OUTPUTS
Frequency Monitor:
17OmVrms min. into SOR.
Q Analog Output:
1V +-50mV dc at full scale, proportional to meter deflection, output
impedance approx. 1kR.
Over Limit Signal Output:
Single pole relay contact output,
one side grounded, relay contact
capacity 0.5.4/15VA.
Over Limit Display Time:
Switch-selectable, lsec. or
continuous.
GENERAL
Operating Temperature Range:
o"c to 50°C.
Warm-up Time: 30 minutes.
Power: 115 or 230V +lO%,
approx. 25VA.
Weight: Approx. 31 lbs (
Specifications (Sheet 2 of 2).
48 - 440Hz,
4kd.
OPTION 001:
This option covers a frequency range
of 10kHz to 32MHz. Specifications
are identical with those of the
standard model except as noted below.
Oscillator Frequency Range:
1OkHz to 32MHz in 7 bands (10 to
32kHz, 32 to lOOkf-Iz, 100 to 320kHz,
320 to lOOOkHz, 1 to 3.2MHz, 3.2 to
IOMHz, and 10 to 32MHz).
Frequency Accuracy:
i-1.5%
at 1OkHz to 1OMllz.
+_2% at 1OMllz to 32MHz.
21% at "L" point on frequency dial.
Q Tolerance: % of indicated value
(at 25'C)
1 5 - 300 1 300 - 600 1 600 - 1000 1
I 27% I ?lO% I
?15%
DIMENSIONS:
NOTE :
DLL(ENSIW IN INCHES AND OALLIYETERSI.
I
:& (41
Accessories Furnished:
Power Cord
Accessories Available:
16471A through 16490A,
and 16465A
Supplemental
16462A Auxiliary Capacitor.
16014A Series Loss Test Adapter.
16451A Dielectric Test Adapter.
Extender Board 15pin
(Part No. 5060-4940).
Extender Board 6pin
(Part
No.
5060-0651).
Inductors.
l-5
Page 16

Section I Model 43426
Table l-2
Table l-2. Accessories - Typical Values.
16471A - 1649OA, 164656 Supplemental Inductors
Approx. resonant frequency
Model Inductance
16471A 130
mH
for tuning capacitance of
400pF
lOOpF 50pF
22 40 62 kHz below 300( 30 kHz)*
16472A 52 mH 35 70
Q Limit
100 kHz below 300( 50 kHz)* 8
Capaci-
tance
(PF)
16473A 25 mH 50 100 140 kHz below 300( 70 kHz)*
16474A 10 mH 80 160 220 kHz below 300(100 kHz)* 8
l6475A 5.2mH 110 220 300 kHz below 300(150 kHz)*
16476A 2.8mH 150 300 420 kHz below 300(200 kHz)* 8
16477A 1 mH 250 500 700 kHz below 300(300 kHz)*
l6478A 520 /JH 350 700 1000 kHz below 300(500 kHz)* 8
16479A 250 PH 500 1000
1400 kHz below 300( lMHz)* 7
16480A 100 IJ.H 800 1600 2200 kHz below 300( lMHz)* 7
16481A 56 PH ** 1 2.2 3.lMHz below 300( lMHz)* 7
16482A 28
FH
1.5 3 4.2MHz below 3OO(l. SMHz)*
16483A 10 /JH 2.5 5 7 MHz below 300(2. SMHz)* 6
16484A 5.21~.H 3.5 7 10 MHz below 300( lOMHz)*
16485A 2.51~.H 5 10 14 MHz below 300( lSMHz)*
l6486A 1 PH 8 16
22 MHz below 300( 20MHz)* 6
8
8
8
8
7
6
6
lOOpF 35pF
16487A 0.52pH 22MHz 35MHz below 300( 35MHz)* 6
16488A 0.28~~ 30MHz 5OMHz below 300( SOMHz)*
16489A
0.1 IJ.H 5OMHz 70MHz below 300( 7OMHz)*
16490A 0.07pH 6OMHz 1 OOMHz below 300( 70MHz)*
400pF
lOOpF 50pF
**16465A 630 mH 10 20 28 kHz below 300( 12 kHz)*
* The frequency in parentheses indicates frequency at which maximum Q factor is obtained
(for the respective inductor).
** Approx. resonant frequency for tuning capacitance of 450pF.
*** For 43426 Option 001 only. use
16462A
16014A Series Loss Test Adapter
Auxilialy
Capacitance Range: 300pF to 2700pF in steps
of 300pF. 10 ranges including OFF position.
Capacitance Accuracy: +l% on all ranges.
5000 at 20kHz on all ranges.
Q:
Residual inductance: approx. O.luH.
Residual capacitahce at OFF position:
approx. 23pF.
Useable Frequency Range: 1OkHz to 10MHz.
Capacitor
Measurable Capacitance Range: 450pF to 0.225uF
Measurable Resistance Range: 1Om.Q to 80R at
lOMHz, 4R to 8kR
Stray Capacitance Between Unknown Terminals:
approx. 3pF.
Insulation Resistance between Unknown Terminals
approx. 1OMR at 1MHz.
Residual Inductance: approx. 30nH
16451A Dierectric Test Adapter
(refer to Page 3-21 Table 3-2).
at
1OkHz.
4
3
2
9
l-6
Page 17

Model 4342A
Section II
Paragraphs 2-l to 2-16
SECTION II
INSTALLATION
2-l. INTRODUCTION
2-2. This sectioncontains informationfor unpacking,
inspection, repacking, storage, and installation of the
Model 4342A.
2-3. INITIAL INSPECTION
2-4. MECHANICAL CHECK
2~5. If damage to the shipping carton is evident, ask
that the carrier’s agent be present when the instrument
is unpacked. Inspect the instrument for mechanical
damage. Also check the cushioning material for signs
of severe stress.
2-6. PERFORMANCE CHECKS
2-7. The electrical performance of the Model4342A
should be verified upon receipt. Performance checks
suitable for incoming inspectionare given in Section
V, Maintenance.
2-8. DAMAGE CLAIMS
2-9. If the instrument is mechanically damaged in
transit, notify the carrier and the nearest Hewlett-
Packard field office immediately. A list of field offices
is on the backof this manual. Retain the shipping carton andpadding material for the carrier’s inspection.
The fieldoffice will arrange for replacement or repair
of your instrument without waiting for claim settle-
ments against the carrier.
2-10. Before shipment this instrument was inspected
and found free of mechanical and electrical defects.
If there is any deficiency, or if electrical performance
is not within specifications, notify your nearest
Hewlett-Packard Sales and Service Office.
sq in. bursting test) with a layer of excelsior
about 6 inches thick packed firmly against all
surfaces of the instrument.
2-13. ENVIRONMENT. Conditions during storage
and shipment should normally be limited as follows:
a. Maximum altitude, 20,000 feet
b. Minimum temperature, -40” F (-40” C)
C.
Maximum temperature, 167” F (75°C)
2-14.
2-15.
from
and Line frequency from 50 to 400Hz. A slide
switch on the rear panel permits quick conversion for
operating from either voltage. Insert a narrow- blade
screwdriver in the switch slot and slide the switch
the right for 115-volt operation (“115” marking exposed) or to the left for 230-voltoperation (“230” marking exposed). The Model 4342A is supplied with 115volt fuse; for 230-volt operation, be sure to replace
this fuse with that listed in Table 2-I.
POWER CONNECTION
LINE VOLTAGE. The Model 4342Aoperates
either 115 or 230 volt (*lo%) ac line voltage
Table 2-l. AC Line Fuse
Conversion 115-volt
Slide Switch Right
(“115’)
AC Line Fuse 0.6 amperes
Slow-Blow
2110-0339
230-volt
Left
(“230”)
0.3 amperes
Slow-Blow
21 lo-0044
to
2-11. STORAGE AND SHIPMENT
2-12. PACKAGING. To protect valuable electronic
equipment during storage or shipment always use the
best packaging methods available,
Packard field office can provide packing material such
as that used,for original factory packaging. Contract
packaging companies in many cities can provide dependable custom packaging on short notice. Here are
a few recommended packaging methods :
a. RUBBERIZED HAIR.
of instrument with protective wrapping paper.
Pack instrument securely in strong corrugated
container (350 lb/sq in. bursting test) with 2inch rubberized hair pads placed along all surfaces of the instrument. Insert fillers between
pads and container to ensure a snug fit.
b. EXCELSIOR. Cover painted surfaces of instru-
ment with protective wrapping paper. Pack in-
strument in strong corrugated container (350 lb/
Cover painted surfaces
Your Hewlett-
CAUTION
To avoiddamage to theinstrument, before
connecting the power cable, set the 115/
230-volt switch for the line voltage to be
used.
2-16. POWER CABLE, To protect operating personnel, the National Electrical Manufacturers Association (NEMA) recommends that instrument panels and
cabinets be grounded. Accordingly, the Model 4342A
is equipped with a detachable three.-conductor power
cable which, when plugged into an appropriate recepta-
cle, grounds panel and cabinet. The offset pin of the
three-prong connector is the ground pin. Proceed as
follows for power cable installation.
a. Connect flatplug (3-terminal connector) to LINE
jack at rear of instrument.
b. Connect plug (a-blade with round grounding pin)
to J-wire (grounded) power outlet. Exposed
2-l
Page 18

Section II
portions of instrument are grounded through the
round pin on the plug for safety; when only 2blade outlet is available, use connector adapter
(HP Part No. 1251-0048). Then connect short
wire from slide of adapter to groundto preserve
the protection feature.
Model 4342A
2-2
Page 19
Model 4342A
Section III
Paragraphs 3-1 to 3-9
SECTION III
OPERATION
3-1. INTRODUCTION.
3-2.
quality factor of inductors from 5 to 1000
and,
resistance, and the dielectric constant of
insulating materials over the frequency range
of 22kHz to 70MHz.
instructions and information necessary for
operating the 4342A Q Meter.
Fundamental operating procedures and general
techniques for measuring various parameter
values of the unknown directly and indirectly
by using accessories appropriate to the
characteristics of the unknown are also
outlined in this section.
3-3. PANEL CONTROLS, CONNECTORS AND
3-4. Control panel, top terminal deck, and
rear panel features of the 4342A are described in Figures 3-1 and 3-2. The numbers
in the illustrations are keyed to the descriptive items for each figure. Other detailed information about the functions of the
panel controls and connectors is provided in
paragraphs 3-8 through 3-11.
3-5. Q MEASUREMENT-GENERAL.
3-6. To complete the measuring circuit, the
Model 4342A requires the connection of an inductor to the measurement COIL terminals.
This circuit is then used to establish a
resonance, either by setting the frequency
controls to a predetermined frequency and
varying the tuning capacitor, or by presetting the tuning capacitor to a desired value
and adjusting the frequency controls. Reso-
nance is indicated by maximum deflection of
the panel Q meter. The Q value of the sample
is proportional to Q meter deflection at the
resonant frequency.
3-7. The "indicated Q" which is the Q meter
reading at resonance is called the "circuit
Q" because it includes all the additive
losses inherent in the instrument including
The 4342A Q Meter can measure the
in addition, capacitance, inductance and
This section provides the
INDICATORS.
those in the tuning capacitor, the Q volt-
meter input resistance, output resistance of
the oscillator signal injection circuit, and
contact resistances of the measurement termi-
nals.
ing or "circuit Q" is called "indicated Q"
throughout the balance of this manual. The
"effective Q", which is dependent only on the
inherent loss of the sample and can be meas-
ured only by an ideal measuring circuit, is
somewhat greater than the "indicated Q".
However, the "indicated Q" can
the "effective Q", by reducing instrument
losses as much as is possible. So, in most
instances, these Q values can be deemed to be
the same. The 4342A employs a Constant Voltage Injection System obviating the use of a
thermocouple level meter (the resistance of
thermocouple device would contribute additional losses to the measuring circuit) and
the coupling resistor used in traditional Q
meters.
jection transformer, the improved operating
performance of the Q voltmeter, and the pre-
cision tuning capacitor which has extremely
low loss over a wide frequency range minimize
the difference between the "indicated Q" and
"effective Q".
3-8. GO/NO-GO FUNCTION.
3-9. The 4342.4 Go/No-Go function provides
an annunciation when the measured Q value exceeds a reference value.
outputs, the OVER LIVIT lamp display and a
relay contact output (rear panel) are available. The OVER LIMIT indicator lamp lights
and the relay is energized when the measured
Q value is over the reference value set by
the front panel Q LIMIT control. Annunciation time can be selected to occur at either
1 second intervals or to be continuous by the
rear panel OVER LIMIT DISPLAY TIME switch,
When the switch is set to its 1 set position
and the Q meter indication goes over the pre-
set Q limit control value, the OVER LIMIT
lamp lights once for 1 second. In the con-
tinous mode,
during the entire time that the Q value meter
deflection exceeds the preset value. Relay
contact output follows in the same manner.
To avoid ambiguity, the Q meter read-
approximate
The low output impedance of the in-
Two annunciation
the lamp stays continuously lit
3-l
Page 20

Section III
Figure 3-l
Model 4342A
3-2
LINE PUSH ON/OFF Switch:
1.
power on/off switch.
FREQUENCY RANGE Selector: These push- The frequency is read from FREQHENCY
2.
buttons select the desired measurement scale @and the multiplier indicator
frequency range from among the seven
ranges covering 22kHz to 7OMllz (10kHz
to 32MHz for Option 001). The inductance range which may be measured
directly at the "L" scale frequency
point on the selected frequency range
is labeled on the panel adjacent to
the pushbuttons.
Figure 3-l.
Instrument
Front Panel Controls (Sheet 1 of 2).
3. FREQUENCY Dial Control: This dial
wheel varies the measurement frequency
as well as the FREQUENCY dial scale@.
0
Q LIMIT Control:
4.
sets the low limit of the Q value for
Go/No-Go checks. The Q LIMIT setting
dial scale numbers are related to
meter deflection (% of full scale).
This dial control
Page 21

Model
4342A
Section III
Figure 3-l
Frequency Multiplier Indicator: The
5.
Frequency multiplier indicators, ad-
jacent to the frequency dial scale,
light and correspond with the settings
of the frequency range selector @
pushbuttons.
6.
FREQUENCY Scale:
The Frequency scale
comprises two scales with ranges of
2.2 to 7.0 and 7 to 22 (1.0 to 3.2 and
3.2 to 10 for Option 001). One or the
other of the scales is automatically
illuminated depending on the FREQUENCY
RANGE selector @ setting.
OVER LIMIT Display: The letters "OVER
7.
LIMIT" are displayed when the measured
Q value exceeds the limit value set by
the Q LIMIT control 0.
Measurement Terminals: These binding
8.
post terminals facilitate connection
of the unknown and the various measurement aid accessories. A simplified
terminal circuit schematic is provided
by the top panel label.
9.
Q Meter:
At
maximum meter pointer de-
flection, this meter indicates the Q
value of the sample or of the measuring circuit as well as the optimum
tuning point. The outer two scales (0
to 100 and 0 to 30) are the Q readings.
The inner two reverse scales (10 to 0
and 3 to 0) provide hQ readings when
making AQ measurements. Meter scale
indicators at the left end of scale
automatically light to indicate the
appropriate scale (to read) on the se-
lected
Meter Pointer Adjustment Screw:
10.
Q/hQ
range.
adjustment screw zero-sets the meter
pointer so it is exactly over the zero
calibration mark when the instrument
is off.
AQ ZERO Controls:
11.
These coarse and
fine controls adjust the meter indication for zero (reference) scale in AQ
measurements.
This function applies
only to AQ measurements.
This
L Scale: This dial scale allows di-
12.
rect reading of inductance sample
values at the "L" frequency. An "L"
scale frequency point, common to and
useable on all frequency ranges, is
labeled with a blue letter on the FRE-
QUENCY scale 0.
The L scale indi-
cates the inductance value of the un-
known when resonated with the tuning
capacitance at the "L" frequency.
13. AC Scale: This dial scale permits the
reading of the capacitance of a
vernier tuning capacitor from -5pF to
+5pF in O.lpF steps. The actual tuning capacitance is sum of the C Scale
@ and the AC Scale readings. A small
change in the tuning capacitance ad-
justment point resulting from a
variation in test parameters can be
accurately read from the spread AC
scale.
14. C Scale:
This dial scale is for reading the capacitance of the main tuning
capacitor which may be varied from
25pF to 470pF.
A
C scale reading is
exact (calibrated) when the AC scale@
is set to OpF.
15.
AC Dial Control: This dial wheel
varies the vernier tuning capacitor
and moves the AC Scale 0. The control employs a string drive mechanism
which facilitates easy adjustment of
vernier capacitor.
L/C Dial Control: This dial wheel
16.
varies the main tuning capacitor as
well as moving the C scale @ and L
scale 0.
Q/ AQ RANGE Selector: These push-
17.
buttons select the desired Q range
(either 30, 100, 300 or 1000 full
scale).
AQ button enables AQ measure-
ment and expands Q resolution by ten
times (3, 10, 30 or 100 full scale).
Figure 3-l. Front Panel Controls (Sheet 2 of 2).
3-3
Page 22

Section III
Figure 3-2
Model 4342A
1
METER ZERO AD<J: This trimmer adjust-
1.
ment electrically zero-sets the meter
pointer so that it is exactly over the
zero calibration mark when the instru-
ment is on.
FUSE: Instrument power fuse is in-
2.
stalled in this fuse holder. Appropriate current rating for the fuse required is labeled on the rear panel.
VOLTAGE SELECTOR: This slide switch
3.
selects the appropriate ac operating
power voltage (115V or 230V +lO%).
Selection of the ac voltage must be
made before the instrument is connected to power line.
LINE Receptacle: Male ac power line
4.
receptacle with center ground pin for
powering the instrument from a 115V or
23OV, 48 - 440Hz line. Before con-
necting power cord (furnished), VOLTAGE SELECTOR @ should be properly set.
OVER LIMIT DISPLAY TIME Switch: This
5.
slide switch sets "OVER LIMIT" annunciation time for Go/No-Go checks to
either 1 second (1 set) or to contin-
ous (00).
OVER LIMIT SIC. OUTPUT Connector:
6.
Relay contact output for Go/No-Go
checks. Center and outer conductors
of this BNC connector are internally
short-circuited when measured Q value
exceeds the limit value set by the Q
LIMIT control.
7.
Q .4NALOG OUTPUT Connector: 0 to 1v
analog output proportional to meter
deflection.
Output impedance is ap-
proximately 1kR.
FREQUENCY MONITOR Connector:
8.
connector provides a portion of inter-
nal oscillator output for monitoring
oscillator frequency with external e-
quipment (such as a frequency counter).
Output level is 17OmVrms min. and
output impedance is 50R.
9.
Measurement Terminals: These six
binding post terminals, including the
two shield terminals, provide the con-
nection capabilities for attaching the
unknown sample as well as supplemental
inductors, auxiliary capacitors, and
other devices and accessories used in
making measurements.
This BNC
3-4
Figure 3-2. Rear Panel Controls and Connectors.
Page 23

Model 4342A
Section III
Paragraphs 3-10 to 3-17
3-10. MEASUREMENT TERMINALS.
3-11. Six binding post terminals, including
two shield terminals, mounted on the instrument top deck, facilitate connection of unknown samples and accessories to the measuring circuit. Figure 3-3 illustrates the
measurement terminals circuit configuration.
Shield terminals 3 and 6, and binding post 4
are directly connected to instrument chassis
(grounded). Binding posts 1 and 2 are the LO
and HI COIL terminals, respectively, to which
an inductor is connected to compose the circuit to be resonated. Inductors can be meas-
ured by connecting them to the COIL terminals
(1 and 2) and by taking resonance with the
tuning capacitor.
injected into the measuring circuit between
LO COIL terminal 1 and GND terminal 4. Bind-
ing posts 4 and 5 are CAPACITOR terminals
which are used for doing parallel connection
measurements (outlined in paragraph 3-19).
Shield terminals 3 and 6 are used for connec-
tion to the shield terminal of an inductor or
to the guard terminal of the device connected
between HI COIL terminal 5 and GND terminal 4.
3-12. HOW TO CONNECT UNKNOWN.
3-13. There are three basic methods of connecting unknown sample to the measuring cir-
cuit of the Q Meter. The characteristics of
the unknown, the parameter value to be measured, and the measurement frequency are the
factors which guide the selection of an appropriate connection method. The fundamental
operating procedures for each individual connection method are outlined in Table 3-l.
The oscillator signal is
3-14. MEASUREMENT PARAMETERS AND CONNECTION
METHODS.
3-15. The connection to the measuring circuit of the 4342A, when measuring quality
factor, inductance, capacitance, resistance
or dielectric constant, may be either a di-
rect, parallel, or a series connection and
depends upon the sample. As the sample
values and measurement parameters are the
guidelines for selecting an appropriate connection method, a discussion of the measurement capabilities unique to each connection
method will help you to make straight-forward
measurements. The measurement range limits
of the individual connection methods and
associated reasoning are outlined in the
paragraphs which follow.
3-16.
3-17.
method in taking Q meter measurement parameters, only the quality' factor, inductance,
equivalent series resistance, and distributed
capacitance of the inductor can be read from
Q meter indications. In addition, the quality factor and the inductance measurement
ranges covered by the direct connection
method are dependent on sample inductance and
measurement frequency. This is because the
sample value and measuring frequency must
satisfy the following mathematical relationship so as to resonate with the measuring
circuit:
Direct Method Limitations.
When using the direct connection
(2Trf)2LC = 1 . . . . . . . . . . . . . . . . . (eq. 3-l)
Where, f: Measurement frequency
L: Inductance of sample
Tuning capacitance (read from
c:
C dial scale; 25pF to 470pF)
SHIELD
0
0
3
Figure 3-3.
SHIELD
0
0
6
Measurement Terminal Circuit.
For example, if the measurement frequency is
lMHz, the inductance range of a sample which
can be measured directly by the 4342A is approximately 54uH to 1.2mH. And, for a given
inductance, the measurement frequency range
is indicated. For example, a 1OuH inductor
can be measured over a frequency range of ap-
proximately 2.3MHz to 11MHz. Additionally,
the quality factor of sample must be below
1000 (upper range limit). Figure 3-4 sh/ows
the relationships between the measurement fre-
quency and the inductance limits measurable
with the 4342A alone (without using any supplemental equipment). In Figure 3-4, the
shaded area denotes the applicable induct-
ances and useable frequencies. The seven
bold lines in the shaded area indicate the "L"
frequencies and the ranges of inductance
which can be read from the L/C dial L scale
3-5
Page 24

Section III
Paragraphs 3-18 to 3-23
Model 4342A
at these particular L frequencies. The induc-
tance at a measurement frequency other than
the "L" frequency can be determined by substi-
tuting frequency and L/C dial (C scale) read-
ings in equation 3-l.
3-18. Expansion of measurement ranges.
3-19.
For higher or lower value inductances
(above or below the shaded area in Figure
3-4), a parallel or series connection of the
unknown to the measuring circuit enables the
measurement to be made. To obtain the value
of the desired parameter, these methods em-
ploy a comparison of the Q meter indications.
The Q meter measuring circuit is first resonated with a reference inductor.
Then the
sample is connected in parallel or in series
with the measuring circuit and the circuit
again resonated.
The sample value is calcu-
lated from the difference in Q meter indica-
tion measurements made before and after connecting the sample. In the equation from
which the sample values are obtained, the
values inherent in the reference inductor are
subtracted from the measurement quantities.
Consequently, the characteristics of the reference inductor do not (theoretically) affect
measurement results.
In addition to their expanded measurement
ranges,
the parallel and series methods have
some measurement capability advantages which
do not appear when using direct methods.
A detailed description of these advantages is
given in the discussion in paragraph 3-58.
3-20. Capacitance Measurement.
3-21. For capacitor samples, either a paral-
lel or series connection method may be used
when measuring either the capacitance or the
Q value. The criteria for selecting the ap-
propriate connection method concerns only the
sample value and is irrespective of the measurement frequency. Capacitances higher than
approximately 450pF (up to approximately
0.2uF) are normally measured by the series
method and lower capacitances are easily
measured by the parallel method. Generally,
capacitors can be measured at the desired
frequency by using an appropriate inductor as
a measurement aid.
3-22. Resistance Measurement.
3-23. Resistance values are fundamentally
calculated from measured Q values. Thus, the
connection method selected depends upon the
sample value and the measurement frequency.
Figure 3-5 shows approximate limits for both
parallel and series measurements.
The upper
shaded area indicates the combinations of frequency and measurable resistance values for
parallel measurements. Similarly, the lower
shaded area indicates the values for series
measurements. For sample values between the
upper and lower shaded areas, it is difficult
3-6
I I I III I I III I I III I I III
IOK lOOK
Figure 3-4.
FREQUENCY (Hz)
Inductance Measurement Ranges
IM IOM l3OM
vs. Frequency (direct method).
Page 25

Model 4342A
Section III
Paragraphs 3-24 to 3-29
to measure with either connection method.
These limits are based on the use of a reference inductor having a Q value of 280.
Parallel measurement low limits can be ex-
tended by using an external capacitor connected to the measurement CAPACITOR (HI and
GND)
terminals.
3-24. High Q Measurement.
3-25. Measurement of high quality factors up
to 10000 can also be made by the parallel or
series connection methods. These methods
enable the measurement of low loss samples
and are especially useful in the measurement
of high Q capacitors.
As
inherent losses in
the instrument will cause larger incremental
measurement errors in higher Q measurements,
these residual loss factors should be taken
into consideration in the accuracies of measured values. In high Q measurements, the
measured Q should be deemed to be only a
rough approximation of the sample Q value.
A
detailed discussion on parallel and series
connection measurement errors is provided in
paragraph 3-60 and those which follow.
3-26.
Supplemental Equipment Used in
Parallel and Series Methods.
3-27. For use with the 4342A as reference
inductors, the Model 16470A series supple-
mental inductors are available. The
16470A
series inductors have various inductances
(from 0.07pH to 630mH) and totally cover the
frequency range of 1OkHz to 70MHz when used
with the 4342A as measurement aids. The reference inductor must be resonated alone
(before connecting unknown) at the desired
measurement frequency to take its inherent
values for reference. And, of course, the
useable frequency range of each individual
supplemental inductor depends upon the inductance of the individual coil. This frequency range is indicated on a label attached
to the case of each inductor. Detailed data
and information on the supplemental inductors
is tabulated in Table 1-2.
3-28. Inductor samples whose inductance is
somewhat lower than the low limits of the
measurement range of the 4342A may be meas-
ured by using an external high Q capacitor to
extend the available tuning capacitance range.
The external capacitor is connected between
HI and GND measurement terminals; its capacitance, thereby, adds to the tuning capacitance. For this special purpose, the HP
16462A Auxiliary Capacitor is available.
This capacitor module combines nine capacitors from 300pF to 2700pF (in 300pF steps) and,
when used with the 4342A, allows measurement
of low inductances to approximately l/6.7 of
the measurement
low limit
of the instrument.
IOK 22K IOOK IM IOM 70M
Figure 3-5.
MEASURING FREQUENCY IN Hz
Ranges of Measurable Resistance.
3-29.
Dielectric constant of an insulating
material is calculated from the capacitance
value of the sample held between a pair of
electrodes whose dimensions are accurately
known. Model 16451A Dielectric Test Adapter
is the test fixture which is specially designed for measuring dielectric constant
(E)
and dielectric loss angle (tan 6) and is directly attached to the 4342A measurement
terminals. The 16451A has a pair of variable
precision electrodes which can hold materials
measuring up to a maximum of 1Omm in thick-
ness. The electrodes operate similar to a
micrometer permitting direct reading of elec-
trode spacing (0 to 1Omm) with 0.02mm resolution.
The diameter of the electrodes has
been designed so as to simplify the associat-
ed calculations. Measurement time is thus
greatly shortened.
3-7
Page 26

Section III
Figure 3-6
Model 4342A
3-8
I I
1
Figure 3-6.
1
Zeroing Procedure (sheet 1 of 2).
J’
Page 27

Model 4342A
Mechanical zero adiustment
The meter is properly zero-set when the pointer sets exactly over
the zero calibration scale mark and the instrument is in its normal
operating environment.
To check the meter mechanical zero, turn the
instrument off and allow 30 seconds to completely deenergizethe z
strument.
the meter is not over zero,
Rotate meter pointer adjustment screw @ clockwise until meter
a.
To obtain maximum accuracy and mechanical stability, if
zero-set the meter as follows:
is moving toward zero in an upscale direction.
b. Continue rotating screw clockwise and stop when pointer is
exactly at zero. If the pointer overshoots, continue rotating
the adjustment screw clockwise to do steps a and b once again.
C.
When the pointer is exactly over zero, rotate adjustment screw
slightly counterclockwise to relieve tension on pointer suspension. If pointer moves off zero, repeat steps a, b and c, but
rotate less counterclockwise.
Section
Figure 3-6
TTT
Electrical zero adiustment
The meter pointer should set exactly over the zero scale mark when instrument is
turned on and nothing is connected to measurement terminals.
Turn the instru-
ment on and allow at least 15 minuts warm-up time to let the instrument reach a
stable operating condition. If meter pointer is not over zero, zero-set the
meter as follows:
Set FREQUENCY RANGE selector @to 22k - 70k (10k - 32k for Option
a.
001) and Q RANGE@ to 1000.
Adjust rear panel METER ZERO ADJ control@ so that the meter
b.
pointer is exactly over zero.
Figure 3-6. Zeroing Procedure (sheet 2 of 2).
3-9
Page 28

Section III
Table 3-l
Model 4342A
Table 3-1.
Direct Connection.
HI HI
osc frequency.
Parallel Connection.
LO
osc -
(Bl
I
E
HI
-
v-
UNKNOWN
b
ON0
Methods of Connecting Unknown.
Inductors can usually be measured by connecting
them directly to the COIL terminals as shown in
Figure A. The measuring circuit is resonated by
adjusting either the L/C dial or the FREQUENCY
dial controls. The quality factor (indicated Q) of
0
the sample is read at maximum deflection of the Q
Meter. Setting the FREQUENCY dial to the "L"
scale point and taking resonance with the L/C dial
control permits reading the inductance of the
sample directly from the inductance scale (adjacent
to the tuning capacitor scale). Otherwise the
0
GND
inductance can be calculated from the frequency and
capacitance dial readings at the desired resonant
The parallel connection is suitable for high imped-
ance measurements. High inductances, high resist-
ances, and small capacitances can be measured by
connecting the samples to the CAPACITOR terminals
as shown in Figure B. Before connecting a sample,
the measuring circuit is resonated with a stable
inductor (such as a 16470 series supplemental
inductor) connected to the HI and LO COIL terminals
to obtain a reference Q reading and a capacitance
dial reading. The measuring circuit is again re-
sonated with the sample connected to the CAPACITOR
terminals by re-adjusting the L/C dial for maximum
Q meter deflection.
sample are derived from the Q meter readings and
the L/C dial readings obtained before and after
connecting the unknown sample. The derivation of
parameter values related to the unknown are detailed in paragraphs 3-64 through 3-72.
The parameter values of the
Series Connection.
3-10
HI
h
osc
(Cl
HI
0
GND
The Series connection is suitable for low impedance
measurements. Low inductances, low resistances and
high capacitances can be measured by connecting the
sample in series with a stable inductor as shown in
Figure C.
The 16014A Test Adapter is useful for
making the series connection to the unknown sample.
First,
a shorting strap is attached to the unknown
connection terminals in parallel with the sample
and the measuring circuit resonated with the L/C
control. For reference, the Q meter and capacitance dial readings are noted. The shorting strap
is then disconnected (or removed) and resonance of
the measuring cicuit is again taken by adjusting
the L/C dial.
The parameter values of the unknown
can be derived from the Q meter and capacitance
dial readings obtained before and after disconnecting the shorting strap. The derivation of the
parameter values related to the unknown are described in paragraphs 3-73 through 3-81.
Page 29

Model 4342A
Section III
Paragraphs 3-30 to 3-34
Direct Connection Measurements
3-30. BASIC Q METER MEASUREMENTS.
3-31. QUALITY FACTOR AND INDUCTANCE
MEASLREMENT~ (DIRECT C~NNK-U~N).
3-32. This paragraph and those which follow
describe the fundamental operating procedures
for quality factor and inductance measurements which are typical applications of the
Q Meter. An inductor usually has some
distributed capacitance (Cd).
resonant frequency (fo) of the inductor is
determined by its self-inductance and the Cd.
The 4342A measuring circuit consideration of
distributed capacitance is shown in Figure
3-7. If the Q meter indication is Qt when Cd
is zero, then the presence of Cd will influence the voltage across the resonating induc-
tor such that the Q meter will actually indicate a Q value lower than Qt. The indicated
Q value (Qi) and the Qt can be correlated by
a correction factor (which is a function of
Cd and the tuning capacitance) each with the
other. A similar correction factor also
applies to difference of inductance readings
resulting from the presence of Cd.
tailed discussion of correction factors is
given in paragraph 3-50. When the Cd is less
than l/20 of the tuning capacitance, the
difference between Qi and Qt (Li and Lt are
similar in meaning) is within 5%.
The self-
A de-
Adjust L/C dial control for maximum
C.
panel Q meter deflection on the
instrument.
Note
Alternatively, the resonance may be
taken by setting the L/C dial to a
desired position and adjusting the
FREQUENCY dial for maximum Q meter
deflection.
Depress Q RANGE button as appropriate
d.
for obtaining a Q meter deflection
more than one-third of full scale and
less than full scale.
Re-adjust L/C dial (or FREQUENCY dial)
e.
control for maximum deflection. If
panel meter deflection exceeds full
scale,
up-range the Q RANGE and continue the adjustment. For easily obtaining a precise resonance, use the
AC dial control.
Note
The AC dial control facilitates
accurate adjustment for establishing resonance especially in high Q
measurements.
rI
I
Cd +
I
I
L,
GND
Figure 3-7.
Distributed Capacitance in
Direct Connection.
3-33. Q Measurement.
3-34.
To read the quality factor of an in-
ductance sample directly from the Q meter
indication, proceed as follows:
a. Connect unknown to measurement COIL
(HI and LO) terminals.
Depress an appropriate FREQUENCY RANGE
b.
button and set FREQUENCY dial control
to the desired frequency.
0
Read panel Q meter indication on the
f.
meter scale designated by the appro-
priate scale lamp indicator lit.
Note
The measured Q value corresponds to
the "indicated Q" of the sample.
To derive series equivalent resistance
g*
of the sample, substitute the Q meter
FREQUENCY, C dial, AC dial, and Q
readings in the following equation:
Rs = l/wCQWO.l59/fCQ . . . . . (eq. 3-2)
Where, Rs: equivalent series resist-
ance in ohms.
f: frequency dial reading in
hertz.
0: 2~r times the frequncy
(2wf).
c: sum of C and AC dial read-
ings in farads.
panel Q meter reading.
Q:
3-11
Page 30

Section III
Paragraphs 3-35 to 3-38
Direct Connection Measurements
AQ
3-35.
3-36.
cal,
accurately on the normal Q scale.
Measurement.
When two Q values are nearly identi-
the difference is difficult to read
The AQ
feature of the 4342A provides accurate read-
ings for changes in Q on all Q ranges by providing ten times resolution, namely: 0 to 3,
0 to 10, 0 to 30, and 0 to 100.
To make a AQ
measurement, proceed as follows:
Connect the sample inductor to the
a.
measurement COIL (HI and LO) terminals
Resonate the inductor using the
b,
same
procedure as described in Q Measurement (para. 3-34) steps b, c, d and e.
c. Note panel Q meter reading.
Depress AQ button and set AQ COARSE
d.
and FINE controls so that meter pointer indicates zero (full scale) on AQ
scale.
Check for correct resonance by slight-
e.
ly rotating AC dial control.
If
Q
meter deflection is not at peak, re-
adjust AC dial and AQ controls.
Make the desired change in the sample
f.
or in the measuring circuit.
Adjust L/C dial control for maximum Q
g.
meter deflection.
Use AC dial control
for easily taking a precise resonance.
If meter pointer scales out at the
left end of the scale (AQ full scale),
reset the function to normal Q
meas-
urement and skip steps h and i.
h. Read panel Q meter indication on AQ
scale.
The AQ reading is the difference in Q resulting from the change
made in step f.
Model 4342A
3-37. Inductance Measurement.
3-38.
The inductance of a coil can be
meas-
ured directly from the Q meter inductance
scale at specific "L" frequencies. The in-
ductance range which
may
be measured directly
at the "L" scale frequency point on the selected frequency range is labeled on the
panel adjacent to the FREQUENCY RANGE pushbuttons. To measure inductance at the "L"
frequency, proceed as follows:
Connect unknown to measurement COIL
a.
(HI and LO) terminals.
b.
If the approximate value of inductance
is known, select an appropriate
measuring frequency range. Refer to
the chart in Figure 3-4 or the inductance multiplier label adjacent to the
FREQUENCY RANGE pushbuttons. For the
samples whose values are quite unknown,
select a trial frequency range. Depress the selected frequency range
pushbutton.
Set FREQUENCY dial control for the "L"
C.
scale frequency designated by the mark
"-L-" (shown in blue) on the FREQUENCY
scale.
Set Q RANGE to 100. Rotate L/C dial
d.
control and verify that panel Q meter
indicates peak deflection.
If a peak
meter deflection can not be recognized,
change to another trial FREQUENCY
RANGE setting and repeat the procedure
until a peak is verified.
Set AC dial to zero scale (OpF).
e.
1.
.
1.
3-12
The differential Q value (after
change) is given by the following
equation:
Qz = Q1 - AQ
where, Q1:
. . . . . . . . . . . . . . . (eq. 3-3)
Q meter reading in step c
(before change).
present Q value (after
Q2:
change).
AQ: Q meter reading from AQ
scale in step h.
When the change in Q exceeds AQ full
scale, the difference is given by the
following equation:
AQ = QI - Qz
. . . . . . . . . . . . . . .
(eq. 3-4)
Adjust L/C dial control for maximum Q
f.
meter deflection (change Q RANGE setting as necessary).
Read L/C dial L scale indicated by the
g.
fixed scale pointer. To calculate the
inductance value,
multiply the L scale
reading by the factor for the selected
inductance range.
Note
The measured value corresponds to
the "indicated L" including meas-
uring circuit residual factors
(similar to "indicated Q" value).
Page 31

Model 4342A
Section III
Paragraphs 3-49 to 3-44
3-39.
3-40.
measure inductance at frequencies other than
the specific "L" frequencies. The frequency
characteristic measurements of an inductor
or of an inductor core are representative
examples.
may
Inductance Measurement (at a desired
frequency).
Occasionally it
In such instances, the inductance
be measured as follows:
Connect unknown inductor and resonate
a.
it using the procedure
cribed in Q Measurement (para. 3-34)
steps a through e.
b. Note FREQUENCY dial, L/C dial C scale
and AC dial readings. Substitute these
values in the following equation:
L = l/w2C "N0.0253/f2C . . . . . (eq. 3-5)
Where, L:
f: measurement frequency in
W:
c:
may
be necessary to
same as
inductance value (indicated
L)
of
sample in henries.
hertz.
2~r times the measurement
frequency.
sum of C and AC dial
readings in farads.
des-
3-41. MEASUREMENTS REQUIRING CORRECTIONS.
3-42. Effects of Distributed Capacitance.
3-43. The presence of distributed capacitances in a sample influences Q meter indications with a factor that is related to both
its capacity and the measurement frequency.
Considerations for the distributed capacitances in an inductor may be equivalently
expressed as shown in Figure 3-8. In the
low frequency region, the impedance of the
distributed capacitance Cd is extremely high
and has negligible effect on the resonating
circuit. Thus, the sample measured has
an inductance of Lo, an equivalent series
resistance of Ro, and a Q value of wLo/Ro
(where, w is 2~ times the measurement
frequency). In the high frequency region,
the inductor develops a parallel resonance
with the distributed capacitance and the impedance of the sample increases at frequen-
cies near the resonant frequency.
readings for measured inductances will be
higher as the measurement frequency gets
closer to the self-resonant frequency.
Additionally, at parallel resonance, the
equivalent series resistance is substantially
increased (this is because, at resonance,
the impedance of the sample changes from re-
active to resistive because of the phase
shift in the measurement current) and the
measured Q value reading is lower than that
determined by wLo/Ro. Typical variations
of Q and inductance values under these condi-
tions are given in Figure 3-9.
Therefore,
Cd
,4,,A;,i~,
I
r
Cd
Figure 3-8. Distributed Capacitance Circuit Model.
3-44.
the self-resonant frequency can be converted
to a distributed capacitance and tuning capa-
citance relationship with the following equation:
Figure 3-10 graphically shows the variation
of measured Q and inductance as capacitance
is taken for the parameter.
inductance and Q values in the presence of
no distributed capacitance (or when it is
negligible) are correlated with the actually
measured values by correction factors which
correspond to readings along the vertical
axis scales in Figures 3-9 and 3-10.
Ratio of the measurement frequency and
fl/fo = kd/(C + Cd) . . . . . . . (eq. 3-6)
Where, fi: measurement frequency.
fo: self-resonant frequency of
sample.
Cd:
distributed capacitance of
sample.
c: tuning capacitance of Q
meter.
The ideal
3-13
Page 32

Section III
Paragraphs 3-45 and 3-46
Measurements Requiring Corrections
3-45.
Measuring Distributed Capacitance
(Preferred Method).
3-46. The impedance of a coil at its selfresonant frequency is resistive and usually
high.
This characteristic may be utilized
for measuring distributed capacitance.
Proceed as follows:
1.25
Model 4342A
Connect inductor sample to be tested
a.
to the 4342A measurement COIL (HI and
LO) terminals.
Set L/C dial control to approximately
b.
400pF and AC dial control to OpF.
Note C dial reading as Cl.
Depress a trial FREQUENCY RANGE button
C.
and rotate FREQUENCY dial to search
for the frequency at which panel Q
meter shows a maximum deflection.
no peak deflection can be observed,
change FREQUENCY RANGE setting and
repeat the procedure.
Adjust FREQUENCY dial control for
d.
imum Q meter deflection. Note the
dial frequency reading as fl.
Set measurement frequency to approxi-
e.
mately ten times the frequency fl
noted in step d.
If
max-
(fo=SELF-RESONANT FREQUENCY OF COIL)
Figure 3-9.
and Inductance with Frequency.
Figure 3-10.
Typical Variation of Effective Q
TUNING CAPACITANCE IN pF
Correction Chart for Distributed
Capacitance.
Replace the inductor sample with a
f.
stable coil (16470 series supplemental
inductor) capable of resonating in the
measuring circuit at this higher fre-
quency.
Adjust the L/C dial control for maxi-
g.
mum Q meter deflection.
Connect the test inductor to the
h.
urement CAPACITOR (HI and GND) terminals.
Adjust the L/C dial control for again
1.
obtaining maximum Q meter deflection.
If the L/C dial control has to be
rotated in the direction of higher
capacitance, increase the measurement
frequency.
If it has to be rotated
towards a lower capacitance, decrease
the frequency.
Alternately connect and disconnect the
j.
test inductor to/from the CAPACITOR
terminals and adjust the FREQUENCY
dial control (if necessary, change
FREQUENCY RANGE setting) until the in-
fluence of the test inductor to tuning
conditions is non-existent (indicated
Q value may change).
quency reading as fo.
Note dial fre-
This frequency
is identical with the self resonant
frequency of the inductor.
Distributed capacitance of the induc-
k.
tor sample is given by the following
equation. Substitute measured values
of Cl, fo, and f~ in the equation:
meas-
3-14
Page 33

Model 4342A
D..oO.o..O. (eq. 3-7)
Cd =*
Where, Cd: distributed capacitance in
farads.
Cl : C dial reading (farads)
noted in step b.
fo: measurement frequency
(hertz) noted in step j.
f1:
measurement frequency
(hertz) noted in step d.
Note
If fo>fl, the eq. 3-7 is simplified
as follows:
2
Cd =
. . . . . . . . . . . (eq. 3-7)
Cl
Measurements Requiring Corrections
Distributed capacitance is given by
g-
the following equation. Substitute
measured values of Cl, Cp, fl and f2
in the equation:
Cd = w . . . . . .
n =Where, Cd:
fl
f2
Paragraphs 3-47 to 3-50
. . (eq. 3-9)
distributed capacitance in
farads.
C dial reading (farads)
Cl :
noted in step b.
c2 :
C dial reading (farads)
noted in step f.
f1:
measurement frequency
(hertz) noted in step d.
f2:
measurement frequency
(hertz) given in step e.
Section III
3-47. Measuring Distributed Capacitance
(Approximate Method, CdllOpF).
3-48.
A distributed capacitance more than
approximately 1OpF may be measured with the
simplified procedure described below (this
procedure is useful for obtaining approximate
values of distributed capacitance with an
accuracy which serves practical purposes):
Connect inductor sample to the meas-
a.
urement COIL (HI and LO) terminals.
b. Set L/C dial control to approximately
50pF and AC dial control to OpF. Note
the C dial reading as Cr.
C. Depress a trial FREQUENCY RANGE button
and rotate FREQUENCY dial control to
search for the frequency at which
panel Q meter shows a maximum deflection. If no peak deflection can be
observed, change FREQUENCY RANGE setting and repeat the procedure.
Adjust FREQUENCY dial control for max-
d.
imum panel Q meter deflection. Note
this frequency as fr.
Change FREQUENCY dial setting to f2
e.
equal to fl/n (n should be a selected
integer, e.g. 2 or 3).
Adjust L/C dial and AC dial controls
f.
for again obtaining maximum meter
deflection. Note the sum of C dial
and AC dial readings as Cz.
Note
If fz is exactly one half of fl, then
Cd = ‘2 - 4c1
3
. . . . . . . . . . .
(eq. 3-10)
An average of several measurements
using different values of Cl will im-
prove the results of this measurement.
The best accuracy to be expected with
this method, however, is in the range
of +2pF.
3-49.
3-50.
CORRECTION FOR Q.
To use the indicated Q for the purpose
of calculating L and Rs (in determining the
actual equivalent circuit), it must be corrected for the effects of the distributed
capacitance. The corrected Q and the Q value
measured by the Q meter can be obtained from
the following equation:
Qt = Qi
' +CCd . . . . . . . . . . .
(eq. 3-11)
Then,
Correction factor =
C + Cd
C
. . . . . . . . . . .
(eq. 3-12)
Where, Qt: corrected Q value.
Qi:
indicated Q value.
c:
sum of C and AC dial readings.
Cd:
distributed capacitance of
sample.
3-15
Page 34

Section III
Paragraphs 3-51 to 3-54
Model 4342A
Measurements Requiring Corrections
Figure 3-10 is a graphical solution to equation 3-11. The corrected Q value Qt may be
deemed the quality factor calculated
as
wLo/Ro from inductance Lo, equivalent series
resistance Ro,
(refer to paragraph 3-43).
not identical to "effective Q".
and the measurement frequency
However, Qt is
The corrected Q is also a "circuit Q" which includes the
additional losses of the measuring circuit.
3-51. By substituting equation 3-6 in equation 3-11, the correction factor in equation
3-11 can be converted into a relationship of
measurement frequency and self resonant fre-
quency of sample. And the corrected quality
factor may be expressed as follows:
Qt = Qi
Where, fl:
fl 2”“““’
+
fo
measurement frequency.
(eq. 3-13)
fo: self resonant frequency of
sample.
A graphic expression of the above equation is
shown in Figure 3-9.
equation 3-13 produces a negative Qt.
fo ,
When fl is greater than
However, this negative Q has no meaning and
should not be used.
A negative Q is obtained
when the reactance of the sample becomes
capacitive (effect of distributed capacitance)
instead of inductive at frequencies above fo.
3-54. Correction of the measured inductance
to arrive at a true model of the equivalent
circuit of the sample also requires a correc-
tion for the distributed capacitance (similar
to the correction in para. 3-50 for indicated
The corrected inductance value is given
9)
.
by the following equation:
Lt =
Where, Lt:
Li:
c:
Cd:
Li
C
C + Cd
. . . . . . . . . .
(eq. 3-15)
corrected inductance value.
indicated inductance value.
sum of C and AC dial readings.
distributed capacitance of
sample.
Equation 3-15 may be converted into a frequency form as follows:
Lt = Li {l - [%I21 . . . . . . (eq. 3-16)
Where, fi:
measurement frequency
fo: self resonant frequency
of
sample.
Graphic solutions of equations 3-15 and
3-16 are shown in Figures 3-10 and 3-9,
respectively.
3-52.
CORRECTION FOR INDUCTANCE.
3-53. The residual inductance of the meas-
uring circuit is included in the measured
inductance of sample.
When the sample value
is in the vicinity of 0.5~H or less, the
measured inductance should be compensated for
such residual inductance.
This compensation
can be made simply by subtraction as follows:
Lm = Li - Lres . . . . . . . . . . . . (eq. 3-14)
Where, Lm:
measured value excluding re-
sidual inductance.
Li: measured inductance.
Lres: residual inductance of meas-
uring circuit.
The Lres in the 4342A is approximately
O.OlpH.
3-16
Page 35

Model 4342P
Section III
Paragraphs 3-55 to 3-61
3-55. PARALLEL AND SERIES CONNECTION
MEASUREMENT METHODS.
3-56. GENERAL.
3-57. In practical applications of the Q
meter,
of parallel and series connection measurements yield various advantages. For example,
the parallel method permits measuring inductor samples at frequencies about its selfresonant frequency (fo). In addition, inductance just below resonance, impedance at
resonance, and apparent capacitance above fo
can be measured.
for measurement of inductors which are designed to resonate with tuning capacitors
less than 20pF at their respective nominal
working frequencies. A great number of coils
known as "peaking coils" fall into this
category. If there is no requirement for
particular measurement conditions, the coil
can be measured using the direct connection
method. Here, the measurement parameter
values may be read directly from Q meter
indications. However, if the sample requires measurement with a tuning capacitance
of less than 20pF, a direct measurement is
impossible (due to the minimum capacitance of
the tuning capacitor). A parallel measurement will provide the desired data eliminating the limitations of the direct connection
method.
3-58. Sometimes parallel or series connection measurements offer improved measurement
accuracies. At first glance, these measurement configurations appear to be incompatible
with the stray capacitance, residual induct-
ance and other unwanted additional factors
incident in the use of supplemental equipment
the expanded measurement capabilities
This is especially useful
such as reference inductors and the test
terminal adapter. Actually,
these residual
factors do not contribute additional errors
in the measurement results.
factor measurements,
the "indicated Q" va.lues
In quality
obtained by parallel or series methods are
usually a better approximation of "effective
Q" than those obtained by direct methods. As
the differences between the measured values
and the effective values decrease further to
small orders of magnitude, parallel and
series methods are sometimes also used for
samples which can he measured by direct
methods.
3-59.
Measured values in parallel and series
methods are theoretically given only by the
variable quantities which yield to differences
in tuning conditions before and after connecting the sample. The constant quantities in
the measuring circuit, which do not vary for
the duration of measurement, are not factors
in the results of the calculations for the
individual measurement parameters.
Since re-
sidual impedances in measuring circuit as
well as inherent values of reference inductors
are almost constant, these values are mathe-
matically eliminated and also do not influ-
ence the measurement results.
So, what
additional measurement errors are contributed
by the parallel and series methods?
Let's discuss them in detail.
3-60. Additional Error Discussion.
3-61. Certain residual impedance elements
change with the method of connection of the
sample; in addition, the residual impedance
also depends upon the mutual distances between the sample and the individual components of the measurement apparatus. Typical
circuit models showing such residual factors
are illustrated in Figure 3-11.
CI, and C5 in
Stray Capacitances about
Measurement Terminals
(A)
Figure 3-11. Residual Parameters.
Rotor plates
Stator plates
Distributed Inductances
In Tuning Capacitor
(B)
3-17
Page 36

Section III
Paragraphs 3-62 to 3-66
Model 4342A
Figure 3-11 (A) exhibit the stray capacities
added by connecting a sample with a shielded
case.
This capacitance increase adds to the
stray capacitances (Cl, C2 and Cs) around the
measurement terminals. In a series measurement,
the shorting strap, for initially
short-circuiting the unknown connection ter-
minals, has its own residual impedance.
Additionally, its contact resistances differ
from those of samples. Small changes in the
loss and the distributed inductance of the
tuning capacitor affect measurement accuracies. Figure 3-11(B) graphically shows an
electrical model of a variable capacitor.
The distributed inductance and the loss
varies depending on the position of the
capacitor rotor.
In the 4342A, these residual factors are minimum because specially
designed, high quality variable capacitors
are employed in the tuning circuit.
Actually,
the residual impedances present in
the measuring circuit do not cause significant errors except when measurements of extremely high or extremely low impedance
samples are taken at high frequency.
A full
consideration of the factors of additional
errors is not practical except in cases where
the experiment requires improved accuracies.
However, it is difficult to make an accurate
Q measurement above 1000 (effective Q) at a
frequency higher than about 1MHz.
3-62. In parallel and series measurements, Q
meter indications are read twice as often as
those in direct method measurements; thus,
the accumulation of reading errors and instrumental errors should be taken into consideration. In addition, a more accurate
tuning operation is required to minimize
these additional errors. To improve frequency accuracy, the oscillator frequency may
be monitored with a frequency counter (using
FREQUENCY MONITOR output at rear panel).
3-63. When a low Q sample is measured, the Q
meter deflection increases and decreases
broadly during the tuning operation. Because
of this low resonance sharpness, it is usual-
ly difficult to do exact tuning (to get a resonant peak) and to obtain correct indications.
This limits the resistance value
measurable with parallel and series methods,
respectively, as shown in Figure 3-5. As
high series resistance and low parallel re-
sistance make for very low Q resonance circuits (below lo), the measurement accuracies
for such samples are thus much lower.
3-64. PARALLEL MEASUREMENTS.
Note
In the following parallel connection
measurement procedures, set 4342A Q
RANGE as appropriate unless specially
instructed otherwise.
3-65. High Inductance Measurement.
3-66. When the measuring circuit is resonated using a reference inductor and then the
sample (unknown) inductor placed in parallel
with the tuning capacitor, the tuning fre-
quency will increase.
at the measurement frequency, the tuning capacitance
must
be increased.
the unknown inductor can be determined from
relationship of the tuning capacitances at
the same measurement frequency.
sample is connected, quality factor and
equivalent parallel resistance can also be
calculated from a reduction of the panel Q
meter indication,
To measure an inductance sample by the paral-
lel method, proceed as follows:
a. Depress appropriate FREQUENCY RANGE
pushbutton and set FREQUENCY dial
control for desired measurement
frequency.
b. Select a reference inductor which
allows the measuring circuit to resonate with a tuning capacitance of
30pF to 70pF at this frequency. Connect it to measurement COIL (HI and
LO) terminals.
c. Adjust L/C dial and AC dial controls
for a maximum Q meter deflection.
Note sum of the C dial and AC dial
readings as C1 and panel meter reading
as
Ql.
d. Depress AQ button and adjust AQ ZERO
(COARSE and FINE) controls so that
meter pointer indicates zero (full
scale) on AQ scale.
Press AQ button to release AQ function and recheck for correct resonance. Again depress the AQ button
and recheck for AQ zero indication.
To restore resonance
The inductance of
After the
Note
3-18
Page 37

Model 4342A
Connect unknown inductor to measure-
e.
ment CAPACITOR (HI and GND) terminals.
Restore resonance by adjusting the L/C
f.
and AC dial controls.
C dial and AC dial readings as C2 and
panel meter AQ reading. If meter
pointer scales out at the left end of
the scale (AQ full scale), reset the
function for normal Q measurement.
The difference in Q is calculated from
the two Q values as AQ = Q1 - Q2.
Inductance of the unknown inductor is:
EC.
L=
Where, W= 2~r times the measurement
frequency.
Q value of the unknown is:
Q
= 4142
1
w21c2 - Cl)
CC2 - Cl)
AQCl
Parallel Connection Measurements
Note sum of the
(H) . . . . . (eq. 3-17)
-‘--**‘-
(eq. 3-18)
Section III
Paragraphs 3-67 and 3-68
3-67.
Low Capacitance Measurement (<45OpF)
3-68. When the measuring circuit is resonated using a reference inductor, a capacitor
placed in parallel with the tuning capacitor
will lower the tuning frequency.
To restore
resonance at the measurement frequency, the
tuning capacitance must be reduced as much as
the capacitance of the sample.
Hence, the
sample value can be determined by noting the
difference between the tuning capacitor dial
readings. After the sample is connected,
quality factor and equivalent parallel resistance can be calculated from a reduction
of panel Q meter indication.
To measure a capacitance sample, proceed as
follows:
Select a reference inductor which can
a.
resonate at the desired measurement
frequency and connect it to measure-
ment COIL (HI and LO) terminals.
b.
Set L/C dial control to desired tuning
capacitance and AC dial to zero. Note
the tuning capacitance Cl.
Where,
AQ = QI
- 42
Equivalent parallel resistance is:
Rp = -QLQ- (52) . . . . . . . . . . (eq. 3-19)
wC1 AQ
h. The capacitance required to tune the
coil at the measuring frequency is
simply,
c = c2 - Cl . . . . . . . . . . . . . . . (eq. 3-20)
Note
If the measurement frequency is
higher than the self-resonant fre-
quency of the unknown inductor, the
unknown will not appear inductive
but capacitive,
than Cl.
and Cp will be less
Apparent capacitance of
the unknown in such frequency
region is:
Ca = Cl - CZ . . . . . . . . . . .
(es.
3-21)
and equivalent parallel conductance
is
Note
If the approximate value of the
capacitor sample is known, select
a value for Cl such that the difference between Cl and the sample
value is 30 to 100pF.
C.
Depress appropriate FREQUENCY RANGE
button and adjust FREQUENCY dial con-
trol for a maximum Q meter deflection.
Note frequency fl and panel Q meter
reading Q1.
d.
Depress AQ button and adjust AQ ZERO
(COARSE and FINE) controls so that
meter pointer indicates zero (full
scale) on AQ scale.
Note
Press AQ button to release AQ function and recheck for correct reso-
nance. Again depress the AQ button
and recheck for AQ zero indication.
e.
Connect the unknown capacitor to measurement CAPACITOR (HI and GND) termi-
nals.
Restore resonance by adjusting the L/C
f.
and AC dial controls. Note sum of the
L/C dial and AC dial readings as C2
and panel meter AQ reading.
If meter
3-19
Page 38

Section III
Paragraphs 3-69 and 3-70
Model 4342A
Parallel Connection Measurements
g.
3-69.
pointer scales out at the left end of
the scale (AQ full scale), reset the
function to normal Q measurement. The
difference in Q is calculated from the
two Q values as AQ = Q1 - 42.
Capacitance value of the unknown capacitor is:
cp = Cl - c2
. . . . ..*...m*.. (eq. 3-23)
Q value of the unknown is:
Q
=
QlQz(C1
- c2)
*QCl
. . . . . . . .
(eq. 3-24)
where, AQ = Q1 - 42
and equivalent parallel resistance of
the unknown is:
Rp = -$$$- (n) . . . . . . . . . . (eq. 3-25)
where,
High Resistance Measurement.
w= 2Tfl.
Note
The reference inductor should be
selected so that high resistances
are measured with a low tuning
capacitance and relatively low resistances are measured with a high
tuning capacitance.
Depress AQ button and adjust AQ ZERO
d.
(COARSE
and FINE) controls so that
meter pointer indicates zero (full
scale) on AQ scale.
Note
Press AQ button to release AQ function and recheck for correct resonance. Again depress the AQ button
and recheck for AQ zero indication.
Connect the unknown resistor to meas-
e.
urement CAPACITOR (HI and GND)
terminals.
3-70.
When the measuring circuit is resonat-
ed using a reference inductor, a resistor
placed in parallel with the tuning capacitor
will lower the indicated Q in inverse propor-
tion to the sample value.
This reduction of
Q is utilized to measure the resistance.
avoid a significant increment of measurement
error, the measurement should be made for
resistors within a reasonable range.
For
high resistances, the change in the indicated
Q should be greater than the Q meter resolution, that is, 0.1 on AQ = 3 range, 0.3 on
10 range, 1 on 30 range and 3 on 100 range,
respectively. For relatively low resistances, the indicated Q should be higher than
10 when the sample is connected.
See Figure
3-5 for suitable sample value ranges.
To measure high resistances, proceed as
follows:
a. Depress appropriate FREQUENCY
RANGE
button and set FREQUENCY dial control
to the desired frequency.
b. Connect a suitable reference inductor
to measurement COIL (HI and LO)
terminals.
Adjust L/C dial and AC dial controls
C.
for maximum panel Q meter deflection.
Note sum of the C dial and AC dial
readings as Cl and panel meter reading
91.
TO
Restore resonance by adjusting the L/C
f.
and AC dial controls.
Note sum of the
C dial and AC dial readings as C2 and
panel meter AQ reading. If meter
pointer scales out at the left end of
the scale (AQ full scale), reset the
function to normal Q measurement.
The difference in Q is calculated from
the two Q values as AQ = Q1 - 42.
The resistance of the unknown resistor
g.
is:
Rp = ---$$& (CL) . . . . . . . . . . (eq. 3-26)
Where, w = 2~ times the measurement
frequency.
If the sample is also reactive, its
reactance is:
xp =
1
w(G2 - Cl)
(CL) . . . . (eq. 3-27)
(usually capacitive)
and its capacitance is:
cp = Cl -
c2
. . . . . . . . . . . . . . (eq. 3-28)
If the sample appears inductive, Cz is
larger than Cl.
3-20
Page 39

Model 4342A
Section III
Paragraphs 3-71 and 3-72
Parallel Connection Measurements
3-71. Dielectric Measurement.
3-72. The dielectric constant and dielectric
loss of insulating materials can be measured
by a method similar to and is basically a
capacitance measurement.
When a pair of
parallel electrodes (air capacitor) connected
to 4342A (in air) and an insulating material
placed between the electrodes, the electrode
capacitance increases in proportional to the
specific inductive capacity (ES) of the
sample material.
The dielectric constant of
the sample material is calculated as the product of Es and the vacuum dielectric constant
Accordingly, the dielectric constant can
CO.
be determined from the capacitance measurements made before and after placing the
sample between the elecrodes.
Additionally,
after the sample is mounted in the holder,
the conductance of the sample can also be
calculated from a reduction of the Q meter
indication. To make easy and accurate
dielectric measurements, it is recommended
that the 16451A Dielectric Test Adapter be
used with the 4342A.
Typical characteristics
of the 16451A are described in Table 3-2.
Materials to be measured with the 16451A
should be less than 1Omm in thickness and
from 38 to 55nn in diameter.
When measuring
materials with a high dielectric constant or
a large loss, it is usually best to prepare
material in thicknesses greater than 3nn.
On the other hand, when low loss material is
to be measured, the material thickness should
be less than 3mm.
Materials measuring less
than 0.5mm in thickness are usually difficult
to measure.
To make dielectric measurements using the
16451A, proceed as follows:
Depress the appropriate FREQUENCY
a.
RANGE button and set FREQUENCY dial
control for the desired measurement
frequency.
b.
Select a reference inductor which can
resonate at the measurement frequency.
Connect it to 4342A measurement COIL
(HI and LO) terminals.
CO
Adjust L/C dial and AC dial controls
for a maximum Q meter deflection.
Note sum of the C dial and AC dial
readings as Cl and panel meter read-
ing as Qi.
d.
Let the reference inductor remain in
place (as is) and attach the 16451A to
4342A measurement CAPACITOR (HI and
GND) terminals.
e.
Set 16451A electrode spacing as desired.
However, if possible, it is
best to set the electrode spacing
dimension to about the same as the
thickness of the material to be
measured.
Again resonate the measurement circuit
f.
by adjusting the L/C and AC dial con-
trols.
Note C dial and AC dial read-
ings as C2 and panel meter reading Qa.
Table 3-2.
16451A (4342A-KOl) Typical Characteristics.
Electrode Diameter: 38mm
Electrode Spacing: 0 ~1Omm variable
Minimum vernier division: 0.02nm
Residual Parameters: Co=5pF
Go<0.4uS (at 1OMHz)
Loz40nH
Minimum measurable loss angle (tan 6):
Approximately 1 x 10e4
3-21
Page 40

Section III
Model 4342A
Parallel Connection Measurements
Depress AQ button and adjust AQ ZERO
g.
(COARSE and FINE) controls so that
meter pointer indicates zero (full
scale) on AQ scale.
Note
Press AQ button to release AQ function and recheck for current reso-
nance. Again depress the AQ button
and recheck for AQ zero indication.
h.
Place the sample material between
1645lA electrodes. The sample mate-
rial should be in close
contact
electrodes. Note 164SlA micrometer
reading TX (as thickness of the
sample).
1.
Again adjust the L/C and AC dial con-
trols for resonance. Note sum of the
C dial and AC dial readings as C3 and
panel meter AQ reading.
If meter
pointer scales out at the left end of
the scale (AQ full scale), reset the
function for normal Q measurement.
The difference in Q is calculated
from the two Q values as AQ = Q2 - 93.
Remove the sample material from be-
j.
tween the 1645lA electrodes.
k.
Let the L/C and AC dial settings remain
as is, and reduce space between the
1645lA electrodes until resonance
again occurs. Note the micrometer
reading as To.
Note
with
E = EO’ES
TX
= - x 8.85
To
x lo-" (F/m)
. . . . . . . . . . . . . . . (eq. 3-30)
Electrode capacitance with the sample
material is:
cx = +
= c4 - c3 + &
Where,
(PF)
(PF) . .
(eq. 3-31)
the unit for TX and To is cm.
Equivalent parallel conductance of the
sample material is:
Gx = 2TrfC1
Qz (Qz- AQ)
..(eq. 3-32)
Dielectric loss angle (dissipation
factor) of the sample material is:
tand = Cl . To
Cl
AQ
Q2(Q2 -
AQ
AQ>
= ??c ' Q2(Q2 - AQ)
= Gx/2nfCx . . . . . . . . . . . (eq. 3-33)
Where, f is measurement frequency.
Note
If this procedure is a little difficult,
let the distance between the
16451A electrodes remain the same as
the thickness of the sample being
measured and take resonance again
by adjusting the L/C and AC dial
controls.
Note sum of the C and
AC dial readings as CI,.
Calculation formulas of the dielectric
1.
constant, dielectric loss, and associated measurement parameter values
are summarized below:
Specific inductive capacity of the
sample material is:
Es =
TX
To . . . . . . . . . . . . . . . . (eq. 3-29)
Dielectric constant of the sample
material is:
3-22
%2?
Q2(Q2 -
may be used instead of
AQ
in equation 3-33.
AQ)
Q value of the sample material is:
Qx = l/tan B . . . . . . . . . . . . . . (eq. 3-34)
Note
The theoretical formula for
1645lA
electrode capacitance is:
c =
s x1o-2
(F) = '
(PF)
36.~1 xlOg xTo 3.6~ To
where S is area of electrode (cm2).
Since the size of the electrode is
3.8cm in diameter, C aboke can be
shown to be l/To (pF).
Page 41

Model 4342A
3-73. SERIES
Series Connection Measurements
MEASUREMENTS.
Note
Section III
Paragraphs 3-73 to 3-75
C.
Short-circuit the unknown (series connection terminals) with a heavy (low
impedance) shorting strap.
In the following series connection
measurement procedures, set 43424
Q RANGE as appropriate unless
specifically instructed otherwise.
3-74.
Low Inductance Measurement.
3-75. Measurement of small inductors at
relatively low frequencies can not be made
directly at the measurement COIL terminals.
However, by using an external high Q capaci-
tor (such as the 16462A Auxiliary Capacitor)
connected in parallel with the tuning capa-
citor, resonance can be obtained at the de-
sired frequency. A second method, which is
explained here, is the series method.
This
method is recommended for measuring low value
inductors without using an external capacitor
(but with an external inductor).
When the measuring circuit is resonated using
a reference inductor, the test inductor
placed in series with the reference inductor
will lower the tuning frequency.
To restore
resonance at the measurement frequency, the
tuning capacitance must be reduced.
The in-
ductance of the unknown inductor can be
determined from the relationship between the
tuning capacitances at the same frequency.
After the sample is connected, quality factor
and equivalent series resistance can also be
calculated from a reduction of panel Q meter
indication. Proceed as follows:
a. Depress the appropriate FREQUENCY
RANGE button and set FREQUENCY dial
control for the desired measurement
frequency.
d. Adjust L/C dial and AC dial controls
for a maximum Q meter deflection.
Note sum of the C dial and AC dial
readings as Cl and panel meter read-
ing as Ql.
Depress AQ button and adjust AQ ZERO
e.
(COARSE and FINE) controls so that
meter pointer indicates zero (full
scale) on AQ scale.
Note
Press AQ button to release AQ function and recheck for correct reso-
nance. Again depress the AQ button
and recheck for hQ zero indication.
Disconnect the shorting strap. Again
f.
resonate the measuring circuit by ad-
justing L/C dial and AC dial controls.
Note sum of the C dial and AC dial
readings as C2 and panel Q meter AQ
reading. If meter pointer scales out
at the left end of the scale (AQ full
scale), reset the function to normal
Q measurement. The difference in Q is
calculated from the two Q values as
AQ = Q1 - Q2.
Note
This procedure (steps c, d and f)
permits the unknown component to
be physically connected even
through it is electrically out of
the circuit, and eliminates possible errors by maintaining the
relative positions of the reference inductor and unknown component.
b. Select a reference inductor which
allows the measuring circuit to resonate with a tuning capacitance of approximately 400pF.
Connect unknown
inductor in series with the reference
inductor (between measurement LO
terminal and low potential end of the
reference inductor) and to measurement
COIL (HI and LO) terminals.
Note
If 16014A Series Loss Test Adapter
is available, attach it to measure-
ment COIL terminals.
Connect the
reference inductor to appropriate
terminals of the 16014A and unknown
inductor to 16014A series connection
terminals.
Inductance of the unknown inductor is:
g.
l,s = (zic;cf2)
Where,
W = 2~ times
(H) . . . . . (eq. 3-35)
the measurement
frequency.
Q value of the unknown is:
Q=
Where,
Q1Q2CC1
Cl (21
42 = Ql - AQ
-
C2)
- C2Q2
"....... (eq. 3-36)
Equivalent series resistance is:
Rs = ($$I Q1 - 42 (n)
. . . . . (eq.
~CI QI Qz
3-37)
3-23
Page 42
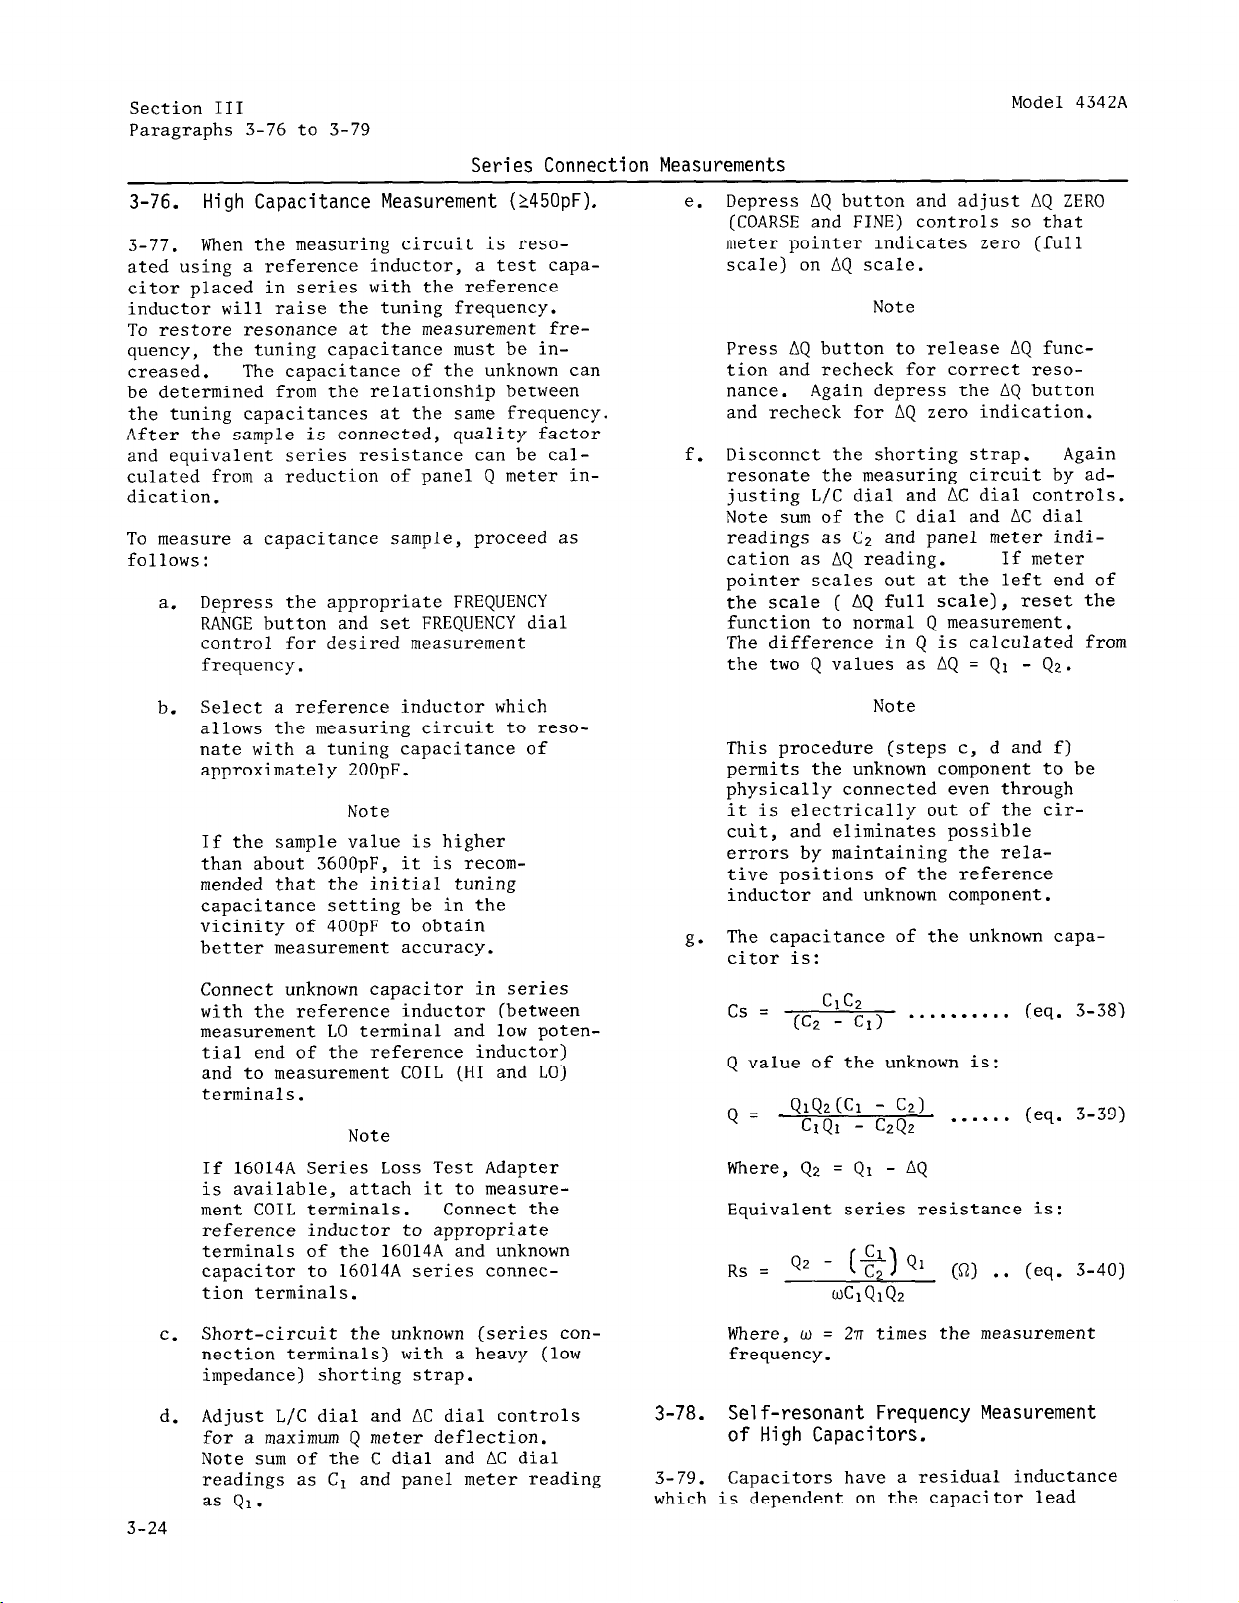
Section III
Paragraphs 3-76 to 3-79
Model 4342A
Series Connection Measurements
3-76. High Capacitance Measurement (145OpF).
3-77.
When the measuring circuit is resoated using a reference inductor, a test capacitor placed in series with the reference
inductor will raise the tuning frequency.
To
restore
resonance
at
the measurement frequency, the tuning capacitance must be increased. The capacitance of the unknown can
be determined from the relationship between
the tuning capacitances at the same frequency.
After the sample is connected, quality factor
and equivalent series resistance can be cal-
culated from a reduction of panel Q meter indication.
To measure a capacitance sample, proceed as
follows:
a. Depress the appropriate FREQUENCY
RANGE button and set FREQUENCY dial
control for desired measurement
frequency.
Select a reference inductor which
b.
allows the measuring circuit to resonate with a tuning capacitance of
approximately 200pF.
Note
If the sample value is higher
than about 3600pF, it is recom-
mended that the initial tuning
capacitance setting be in the
vicinity of 400pF to obtain
better measurement accuracy.
Connect unknown capacitor in series
with the reference inductor (between
measurement LO terminal and low poten-
tial end of the reference inductor)
and to measurement COIL (HI and LO)
terminals.
Note
If
16014A
Series Loss Test Adapter
is available, attach it to measure-
ment COIL terminals.
Connect the
reference inductor to appropriate
terminals of the
16014A
and unknown
capacitor to 16014A series connection terminals.
Depress AQ button and adjust AQ ZERO
e.
(COARSE and FINE) controls so that
meter pointer indicates zero (full
scale) on AQ scale.
Note
Press AQ button to release AQ function and recheck for correct resonance.
Again depress the AQ button
and recheck for AQ zero indication.
Disconnct the shorting strap. Again
f.
resonate the measuring circuit by adjusting L/C dial and AC dial controls.
Note sum of the C dial and AC dial
readings as Cz and panel meter indication as AQ reading. If meter
pointer scales out at the left end of
the scale ( AQ full scale), reset the
function to normal Q measurement.
The difference in Q is calculated from
the two Q values as AQ = Qr - 42.
Note
This procedure (steps c, d and f)
permits the unknown component to be
physically connected even through
it is electrically out of the circuit,
and eliminates possible
errors by maintaining the relative positions of the reference
inductor and unknown component.
The capacitance of the unknown capa-
g-
citor is:
cs = (C, - C,)
ClC2
. . . . . . . . . .
(eq. 3-38)
Q value of the unknown is:
Q=
QlQ2(Cl -
CIQI - CzQz
C21
. . . . . .
(eq. 3-39)
Where, 42 = Q1 - AQ
Equivalent series resistance is:
Rs =
Q2 - (21 Q1 (52) . . (eq. 3-40)
WCIQIQP
c. Short-circuit the unknown (series con-
nection terminals) with a heavy (low
impedance) shorting strap.
Adjust L/C dial and AC dial controls
d.
for a maximum Q meter deflection.
Note sum of the C dial and AC dial
readings as C1 and panel meter reading
as
QI.
3-24
Where, w = 271 times the measurement
frequency.
3-78.
3-79.
Self-resonant Frequency Measurement
of High Capacitors.
Capacitors have a residual inductance
which is dependent on the capacitor lead
Page 43

Model 4342A
Section III
Series Connection Measurements
length and electrode structure. This inductance resonates with the capacitance of
the capacitor at a high frequency.
self-resonant frequency, the impedance of the
capacitor is minimum owing to the series
resonance which occurs in the capacitor itself. Hence, its self-resonant frequency
determines the upper limit of the useable
frequency for the capacitor.
self-resonant frequency of electrolytic,
tantalum,
which are within a capacitance range of about
5nF to 1nF can be measured with a Q meter.
When the capacitor self-resonates, the impedance is minimum and purely resistive.
characteristic is utilized to determine the
self-resonant frequency and the equivalent
series resistance at this frequency.
measurement procedure to determine the selfresonant frequency of a capacitor is similar
to that for an inductor (described in paragraph 3-46). Proceed as follows:
a. Depress a trial FREQUENCY RANGE
b.
C.
d.
film, mylar capacitors and others
button.
Note
For high capacitance samples, se-
lect either the 22k - 70k or the
70k - 220k range and, for a relatively low capacitance samples,
select the 220k - 700k or the
0.7M - 2.2M range, respectively.
Select a reference inductor which
allows the measuring circuit to resonate with a tuning capacitance of
approximately 400pF. Connect unknown
capacitor in series with the reference
inductor (between measurement LO ter-
minal and low potential end of the
reference inductor) and to measurement
COIL (HI and LO) terminals.
Note
If 16014A Series Loss Test Adapter
is available, attach it to meas-
urement COIL terminals.
the reference inductor to appropriate terminals of the 16014A
and unknown capacitor to 16014A
series connection terminals.
Short-circuit the unknown (series con-
nection terminals) with a heavy (low
impedance) shorting strap.
Adjust FREQUENCY dial control for a
maximum panel Q meter deflection.
At this
Usually the
This
The
Connect
Disconnect the shorting strap. Again
e.
resonate the measuring circuit by adjusting the L/C dial control.
dial control has to be rotated in the
direction of higher capacitance, increase the measurement frequency. If
it has to be rotated towards a lower
capacitance, decrease the frequency.
Repeat steps c, d, and e until the in-
f.
fluence of the test capacitor to tun-
ing condition is non-existent (indicated Q value may change).
Note
If such condition can not be obtained on the selected frequency
range even though the L/C dial
control is set to maximum, change
FREQUENCY RANGE setting to upper
range. If the L/C dial control
must be reduced to less than 200pF,
change FREQUENCY RANGE setting to
a lower range. Replace reference
inductor with another trial in-
ductor and repeat steps a through
f until the adjustment in step f
succeeds.
Note sum of C dial and AC dial read-
g.
ings as Cl and dial freauencv reading
as-fo. This frequency is identical
with the self-resonant frequency of
the unknown capacitor.
Connect the shorting strap (if not
h.
already connected). Depress AQ
button and adjust AQ ZERO (COARSE and
FINE) controls so that meter pointer
indicates zero (full scale) on AQ
scale.
Note
Press AQ button to release AQ
function and recheck for correct
resonance. Again depress the AQ
button and recheck for AQ zero
indication.
Disconnect the shorting strap.
1.
panel Q meter AQ reading.
pointer scales out at the left end of
the scale (AQ full scale), reset the
function to normal Q measurement. The
difference in Q is calculated from the
two Q values as AQ = Q1 - Qz.
.
Equivalent resistance of the capacitor
7.
at the resonant frequency is:
Rs =
Where, w = 27rfo.
AQ
JJJCIQIQZ
. . . . . . . (eq. 3-41)
PI
If L/C
Note
If meter
3-25
Page 44

Section III
Paragraphs 3-80 and 3-81
Model 4342A
Series Connection Measurements
3-80.
3-81.
using a reference inductor, a resistor placed
in series with the reference inductor will
lower the indicated Q in proportion to the
resistance value of the sample.
tion of Q is utilized to measure the resist-
ance. To avoid a significant increment of
measurement error, the measurement should be
made for resistors within a reasonable range.
For low resistance,
cated Q should be greater than the Q meter
resolution, that is, 0.1 on AQ = 3 range, 0.3
on 10 range, 1 on 30 range and 3 on 100 range,
respectively. For high resistance, the indi-
cated Q should be higher than 10 when the
sample is connected. See Figure 3-5 for the
suitable sample value range.
To measure low resistances, proceed as
follows:
Low Resistance Measurement.
\lrhen measuring circuit is resonated
This reduc-
the change in the indi-
Depress
a.
RANGE button and set FREQUENCY dial
control for the desired measurement
frequency.
Select a suitable reference inductor so
b.
that relatively high resistances are
measured with a low tuning capacitance
and low resistances are measured with
a high tuning capacitance.
unknown resistor in series with the
reference inductor (between measurement LO terminal and low potential end
of the reference inductor) and to
measurement COIL (HI and LO) terminals.
If 16014A Series Loss Test Adapter
is available, attach it to measure-
ment COIL terminals. Connect the
reference inductor to appropriate
terminals of the 16014A and unknown
resistor to 16014A series connection
terminals.
Short-circuit the unknown (series con-
C.
nection terminals) with a heavy (low
impedance) shorting strap.
the
appropriate FREQUENCY
Note
Connect
Depress AQ button and adjust AQ ZERO
e.
(COARSE and FINE) controls so that
meter pointer indicates zero (full
scale) on AQ scale.
Note
Press AQ button to release AQ
function and recheck for correct
resonance. Again depress the AQ
button and recheck for AQ zero
indication.
Disconnect the shorting strap. Again
f.
resonate the measuring circuit by adjusting L/C dial and AC dial controls.
Note sum of the C dial and AC dial
readings as C2 and panel meter as AQ
reading.
at the left end of the scale ( AQ full
scale), reset the function to normal
Q measurement.
is calculated from the two Q values
as AQ = Ql - 42.
This procedure (steps c, d and f)
permits the unknown component to be
physically connected even though it
is electrically out of the circuit,
and eliminates possible errors by
maintaining the relative positions
of the reference inductor and unknown component.
The resistance of unknown resistor is:
22.
Rs= z
Where,
frequency.
42 = Ql - AQ
If the unknown is purely .resistive
(C2 = Cl), the equation for resist-
ance reduces to:
Rs =
If meter pointer scales out
The difference in Q
Note
Cl
Ql
-
t 1
WCIQIQZ
w= 2~r times the measurement
AQ
wClQlQ2
42
(a) . .
(Q) . . . . . . . . . (eq. 3-43)
(eq. 3-42)
d. Adjust L/C dial and AC dial controls
for a maximum Q meter deflection.
Note sum of the C dial and AC dial
readings as Cl and panel meter reading
as
Ql.
3-26
If the unknown is also reactive, the
reactance is:
Xs = '",',;,~" (a) . . . . . (eq. 3-44)
Page 45

Model 4342A
Section III
Table 3-3.
Parallel Measurements
Effective Q of Unknown
Q =
QlQ2
CC2
- Cl)
Formulas for Calculating Q and Impedance Parameters
from Parallel and Series Measurements.
AQCl
Effective Parallel Resistance of Unknown
Rp =
Effective Parallel Reactance of Unknown
xp=
Effective Parallel Inductance of Unknown
Lp=
Effective Parallel Capacitance of Unknown
QlQ2
oC,A&
o(C,
w2(C2
1
- Cl)
1
- Cl)
cp=c, -c,
Series Measurements
Effective Q of Unknown
Q = QIQZ (Cl -
Cl&l
Effective Series Resistance of Unknown
R S =
@Q1- Q2
w
CIQIQZ
Effective Series Reactance of Unknown
x S _ Cl - C2
Effective Series Inductance of Unknown
Effective Series Capacitance of Unknown
WClC2
L S = Cl - C2
W2ClC2
cs =
Cl C2
c,
C2)
- C2Q2
- Cl
Note
In the equation for Xp, the polarity (sign) of the quantity (CZ-Cl)
indicates the effective reactance,
a positive quantity indicates an
inductive reactance and a negative
quantity indicate a capacitive
result.
Disregard the sign of the quantity
(C2-Cl) in the equation above for Q.
Table 3-4.
Q-e-““- l Rp=i!k=
PARALLEL TO
SERIES
CONVERSION
R, = -!fk
1 + Q2
Xs=Xpl+Q2
Q2
Formulas for Formulas for SERIES TO
Q greater Q less
than 10 than 0. 1
Rs=g-
x, = xp X, = XpQ2
Note
In the equation for Xs, the polarity (sign) of the quantity (Cl-C2)
indicates the effective reactance,
a positive quantity indicates an
inductive reactance and a negative
quantity indicate a capacitive
result.
Disregard the sign of the quantity
(Cl-C2) in the equation above for Q.
Formulas Relating Series and Parallel Components.
L
ll-
S
L
c
r
Formulas for Formulas for
Q greater Q less
than 10 than 0. 1
xp= x,
Rs
R, = Rp
wCsRs =xp
WLP
RpwCp+ =
PARALLEL
CONVERSION
Rp = R, (1 + Q2) Rp = RsQ2 Rp= R,
xp= x&g
xp=gf-
Ls = LP 1 +
‘, = ‘p Q2
1 + Q2
Q2
Q2
L, = Lp L, = LpQ2
cs = cp
cs = cp
Q2
Lp=LsQ2
cp=cs1+&2
1
+Q2
Q2
LP’ L,
cp= cs
Lp=$-
Cp = CsQ2
Page 46

Section IV
Figure 4-1, 4-2
Model 4342A
I I
Figure 4-l. Series Resonant Circuit
-------
I-
oSC’LLAToR - AMPLIFIER
I AMPLIFIER I
OSCILLATOR
t
ALC
--------
POWER
DETECTOR h
l- ----------------
-----------------
r
Q - VOLTMETER
I
I I
I
I
I ”
L----------------:
DETECToR - AMP::FlER T I
* AMPIFFIER
9
-@
1
i -
I
w
* ATTENUATOR
I
I
I
I
I
-I
1
,I
=
I
I
I
I
0 RANGE
----
II
I SHIELD
I
L-o
Y
I
--
L 1
‘--i
---------w-
I-
- I
I
0
I
I
I
I
I
I
I
L ---a---------
RESONANT CIRCUIT
z
1
I
I
I
I
I
I
I
J
4-o
) QLIMIT
SELETOR
Figure 4-2. Model 4342A Simplified Block Diagram
Page 47

Model 4342A
Section IV
Paragraphs 4-l to 4-13
SECTION IV
THEORY OF
4-I. INTRODUCTION
4-2. This discussion of the HP Model4342A Q Meter
internal operation is divided into two parts: Block
diagram description and circuit description. The
block diagram section discusses the functions of the
major circuitswithin the instrument, using the overall block diagram. The circuit description provides
a detailed description of all the major circuits within
the instrument. It is suggested that the block diagram
and schematics which have been included in this manual be referred to while reading the circuit description.
A Functional Overall Block Diagram of the instrument,
showing all the major circuits and associated relevant
information is provided in Section VIII at the back of
the manual. Also in Section VIII, there are complete
schematics of all the circuitry within the Model 4342A
which include components, reference designators, and
values.
4-3. Q DETERMINATION AND MEASUREMENT.
4-4. The ratio of a component’s reactance to its
resistance is measured by the Q meter. The magnitude of Q is usually considered a figure of merit expressing the ability of component to store energy
compared to the energy it dissipates. A measure of
Q is important to determine the RF resistance of
components, the loss angle of capacitors, dielectric
constants, transmission line parameters and antenna
characteristics, etc. Q is a dimensionless number.
In acircuit at resonance, &can bedefined as the ratio
of total energy stored to the average power dissipated
per cycle.
Where Xs and Xp are series and parallel reactance
and Rs and Rp are series and parallel resistance, The
most common form of Q meter uses a series resonant
circuit to measure Q, as shown in Figure 4-l.
4-5. When the variable air capacitor C is adjusted
so that Xc = XL, the only remaining impedance in the
loop is Rs.
For a single reactance component:
Q = Xs/Rs = Rp/Xp
The current that flows then is;
e
i=Fik
and the voltage E across capacitor C is;
E = &. Xc and-$=g=$$=
This equation is correct for values of QZlO, for it
can be shown that the true
the Q meter is equal to
held at a constant and known level, a voltmeier with
high input impedance can be connected across the
capacitor and calibrated directly in terms of Q. The
e values in the above equations are functions of selected Q ranges. Rs is a function of the unknown inductor or Q reference coils. A detailed explanation
$y$y b,;~;pgfy~ ;;
Q
OPERATION
for the measurement of unknowns is provided in
SECTION III.
4-6. SIMPLIFIED BLOCK DIAGRAM
4-7. The measurement principle used in the Model
4342A is the series resonant circuit. A simplified
block diagram of the Q Meter is shown in Figure 4-2.
The oscillator which covers 22kHz to 70MHz(lOkHz
to 32MHz in Option OOl), is automatically leveled by
a loop consisting of the detector and the ALC amplifier. The oscillator output is controlledautomatically
by comparing it to a fixed dc level. Thus, constant
voltage is supplied to the Q-range attenuator.
attenuator adjusts the signal level according to the Q
range settings. This signal is fed into the resonant
circuit by a transformer (sometimes called an injec-
tion transformer). Resonance is acheived by adjusting
the variable capacitor, and this level is read by the
high-impedance voltmeter. Thus the Q value of the
resonant circuit is indicated on the meter.
4-8. BLOCK DIAGRAM DESCRIPTION
4-9. TheModel4342A Q Meter performsQmeasure-
ment in the range of 5 to 1000 on coils in seven bands
covering a frequency range from 22kHz to 70MHz
(1OkHz to 32MHz in Option 001). The following paragraphs contain a brief outline of function of the major
circuit groups in the Q Meter. Reference is made to
the Functional Overall Block Diagram in SECTION
VIII.
4-10. OSCILLATOR AND IMPEDANCE
CONVERTER (AlAll
4-11. The Oscillator circuit QI-Q2 is a seven-band
variable frequency oscillator covering a frequency
range from 22kHz to 70MHz (1OkHz to 32MHz in Option
001). The instrument utilizes a Hartley type circuit
which operates from 22kHz to22MHz(lOkHz to 1OMHz
in Option OO1)and a Colpitts type circuit from 22MHz
to 70MHz(lOMHz to 32MHz in OptionOOl). The FREQUENCY RANGE switch provides for the selection of
the desired band of operation. The output amplitude
of the oscillator is automatically controlled by an ALC
loop Q9-Q13(P/O A8) to provide the injection voltages
required by the Q ranges used. The oscillator output
is further coupled to a high impedance circuit Q3-Q6
which provides a buffer stage between the oscillator
and the RF power amplifier assembly.
4-12. RF POWER AMPLIFIER(AlA21
4-13. The RF Power Amplifier assembly consists of
a cascade amplifier circuit &l-Q2 with a gain of about
18dB and an impedance converter Q3-Q4. Commonly
called a cascade, the circuit uses an emitter grounded
amplifier followed by a grounded base stage. The
circuit has excellent noise figure, broadband characteristics, and is very stable. The impedance con-
The
4-l
Page 48

Section IV
Paragraphs 4-14 to 4-30
Model 4342A
verter Q3-Q4 consists of a pair of emitter followers
connected in series which provides ahigher input im-
pedance and lower output impedance.
4-14. ALC AMPLIFIER(P/O A81
4-15. The ALC Amplifier circuit Q9-Q13 provides
the appropriate correction signal to the Oscillator
assembly(AlA1) in order to control the oscillator output in accordance with the fixed reference dc level
set by the OX LEVEL control.
4-16. Q,‘nQ RANGE ATTENUATOR(A3)
4-17. The Q RANGE Attenuator consists of four
switches which provide a total attenuation of 30.4dB.
An additional switch is used for the AQ measurement.
The Meter Scale Indicator (Al 1) ganged with Q RANGE
switches, utilizes four lamps, two of these lamps are
used for the Q scale display and the other two for the
n Q scale. The attenuator output is fed to an Impedance Converter(A4) which consists of transistors Ql
and Q2 and which is similar in operation to the one
described in paragraph 4-13.
4-18. TUNING CAPACITOR AND INJECTION
TRANSFORMER(A2)
4-19. The Tuning Capacitor sometimes referred to
as the Q Capacitor is an important part of the QMeter.
It is the reactance standard in the Q measurement.
Because the Q Capacitor can be calibrated precisely,
the Q Meter provides direct reading of inductance in
addition to Q. To achieve this high accuracy, the
capacitor is designed with low loss and low residual
inductance.
Minimum capacitance is low to maintain
accuracy at high frequencies. The Q Capacitor covers
a range of 2OpF to 475pF. Residual inductance is less
than 10nH.
4-20. The Model4342A uses a new method of injecting a constant voltage through a transformer as shown
in Figure 4-3, which has very low output impedance.
The transformer has a toroidal core and nearly flat
frequency reaponse from 1OkHz to 70MHz. The LO
terminal consists of a one-turn secondary winding
which has an output impedance of approximately 1 milliohm. High measurement accuracy is thus achieved.
4-21. RF AMPLIFIER AND DETECTOR(A5)
4-22. The RF Amplifier and Detector assembly in-
cludes the Impedance Converter, the RF Amplifier,
and the Detector circuits. The impedance converter
Ql-Q4is a”unity”gain buffer stage amplifier between
the Tuning Capacitor assembly A2 and the RFAmplifier Q5-Q9. It provides a high input impedance and a
low output impedance similar to what has been de-
scribed in paragraph 4-13.
4-23. The RF Amplifier circuit Q5-Q9 is a highgain
and broad band amplifier. The frequency response of
the amplifier is flat and covers the entire spectrum
range given in the specifications, while broad band
RF transistors supply power gain. The approximate
gain is about 34dB. The amplified signal is detected
by diodes CR2-CR5 and coupled to the DC Amplifier
assembly A6.
4-24. DC AMPLIFIER(A6)
4-25. The DC Amplifier Ql-Q5 provides a gain from
0 to 20dB. It is used to drive linearly the meter.
Various gain adjustment, balance control, aQ COARSE
AND FINE adjustments, METER ZERO ADJUST, and
A Q function are provided for in this assembly. A Q
ANALOG OUTPUT is also supplied which can be interfaced with other instruments. Frequency signals
down to and including dc can be handled by theamplifier. By combining direct coupling with a resistive
feedback circuit, good stability is obtained.
4-26. Q LIMIT SELECTOR(A7)
4-27. The Q Limit Selector assembly includes acomparator circuit Ql-Q3, a Schmitt trigger Q4-Q5, a
monostable multivibrator Q6-Q7 and a driver Q8-Q9.
The comparator compares the output of the detected
RF signal with the Q LIMIT setting. Thecomparator
output is then coupled via an emitter follower to the
Schmitt trigger which generates a fast rise pulse out-
This signal is coupled to the monostable multi-
put.
vibrator which has a fixed time constant of 1 second,
and also supplies the necessary drive signal to the
driver stage. An OVER LIMIT SIGNAL OUTPUT and
DISPLAY TIME(l set Oreo) are provided.
4-28. CIRCUIT DETAILS
FROM
OSCILLATOR
yy$(Y-zq
Z-Y
50:1
1twcT10N TRANSFORMER
Figure 4-3. Constant Voltage Injection System
4-2
4-29. LC OSCILLATOR(P/O AlAl)
4-30. FREQUENCY RANGE switches select the ap-
propriate LC circuit, setting the operating frequencies
of the oscillator &l-&2. In the Hartley configuration,
when an RF current flows in the tuned circuit, there
is a voltage drop across L. The tap on the Lcoil will
be at an intermediatepotentialwith respect to the two
ends of the coil. The amplified current in the Q2coIlector circuit, which flows through the bottom section
of L, is in phase with the current already flowing in
the circuit and thus in the proper relationship for
positive feedback. The Colpitts arrangement uses the
voltage drops across the two capacitors Cl8 and Cl9
in series in the tuned circuit to supply the feedback,
Other than this, the Colpitts operation is the same as
just described for the Hartley configuration.
Page 49

Model 4342A
Section IV
Paragraphs 4-31 to 4-45
4-31.
4-32. FET Q3 provides a high input impedance for
the impedance Converter circuit. Transistor Q5 is
used as a current source and Q4 provides positive
feedback to make Q3 gain equal to unity. Emitter
follower QS provides low impedance output signals to
the RF Amplifier stage. Inductor L8 acts as a parasitic oscillation suppressor and C30 is a dc blocking
capacitor. The signal from the Impedance Converter
is ac coupled to RF Power Amplifier Q2 via C2. Transistors Ql and Q2 form a cascade stage as previously
described in paragraph 4-12. Resistor Rll and C6
form a frequency compensation network and C5 is a
bypass capacitor. Transistors Q3 and Q4 form an
Impedance Converter as described in paragraph 4-
12. Inductor Ll and L4 are parasitic oscillation
suppressors.
4-33. ALC AMPLIFIER(P/O A81
4-34. Transistor Q9 thru Q13 form the ALC Ampli-
fier assembly. FET Q9Aand Q9Bform a differential
amplifier with Qll as its current source.
of the rectified RF Amplifier signal is taken across
diode A3CRl and coupled to FET Q9B. Transistors
QlO and Q12 form another differential amplifier with
Q13 as its current source. The drain output signal
of FET Q9B turns on transistor Q12.
flowing through the collectors of transistors AlAlQl
and AlAlQ2 is caused to vary by the setting of the
OSC LEVEL control R26. This variation in AlAlQl
collector current causes a change in the tuned circuit
current and the gain of the Oscillator is thereby con-
trolled. Cl0 provides ac feedback and circuit stabilization.
4-35. Q RANGE ATTENUATOR(A3l
4-36. The Q Range Attenuator with a total attenuation
of 30.4dB covers the entire frequency range. The
following steps of 10.4dB, 9.6dB, and 10.4dB are
provided to correlate the meter reading with the Q
Ranges used in the proper ratio (ie. 30/3, lOO/lO,
etc. ). The maximum insertion loss is 0. 1dB and the
impedance is 50R nominal. The Q Attenuator output
is coupled to Impedance Converter A4 which is arranged in a Darlington pair configuration.
4-37. IMPEDANCE CONVERTER, RF AMPLIFIER
4-38. The Impedance Converter Ql-Q4 is identical
in operation to the description given in paragraph
4-32. Diode CR1 protects Q4 from initial current
surge. TransistorsQS-Q9 provide RF amplification
for the broad bandRF fraquencieswith a total gain of
approximate 34dB. Variable resistor R32 and variable capacitor Cl6 provide for the adjustment of me-
dium and high frquency response of the amplifier
respectively. A flat response is obtained through out
the entire frequency band. The signal is ac coupled
to detector diode CR2 via C19. Capacitor C20 pro-
vides filtering action. Diodes CR3 thru CR5 in conjunction with R42 and R43 cancel the non -1inearities
of diode CR2. A linear reading is provided to the
meter circuit.
IMPEDANCE CONVERTER(P/O Al Al) AND
RF POWER AMPLIFIER(AlA2)
A portion
The current
AND DETECTOR(A5J
4-39. DC AMPLIFIER(A6)
4-40. FET Ql supplies &ANALOG OUTPUT propor-
tional to the meter deflection to Jl connector. Variable resistors R4 and R6 are used for the settings of
the &ANALOG OUTPUT-BALANCE and GAIN respectively. FET Q2Aand Q2Bform adifferential amplifier
with transistor Q4 as a current source. Diode CR1
compensates for temperature changes. Q3 and Q5
supply current drive to the meter. Resistors R2 and
R21 provide for Xl GAIN and X10 GAIN adjustments
respectively. Zenor diode CR2 and CR3 are used to
regulate for the +25V and -25V supplies, inductors
Ll, L2 and capacitors C2, C3 are used to obtain additional filtering of meter circuit supply voltages.
Resistor R2 (mounted on chassis) provides for METER
ZERO adjustment. Resistors R3 and R4(mounted on
chassis) are used for the
adjustments respectively.
4-41. Q LIMIT SELECTOR(A71
4-42. High impedance FETs Ql and Q2 form a com-
parator circuit. Emitter follower Q3 dc couples the
comparator output to the Schmitt trigger Q4 and Q5.
Capacitor C2 is used as a negative feedback path to
reduce the ripple voltage at Q3 emitter. Transistors
Q4 and Q5 provide Schmitt trigger action. When Q4
base voltage reaches 9V, the transistor will turn on
and Q5 which is normally on will turn off.
going pulse will be generated and coupled via capacitor
C3 and diode CR3 to the one-shot multivibrator QS
and Q7. Normally, transistor Q7 is on and Q6 is cut
off by the voltage drop across the common bias resistor R19. The pulse from Q5 turns onQ6 which in turn
switches off Q7 for one second. Capacitor C6, resistors R20, R21, and R22 determine the constant of the
circuit. Transistor Q8 turned on by the rise in Q7
collector voltage operates Kl the OVER LIMIT DISPLAY relay. Transistor Q9(normally on) is used for
00 OVER LIMIT DISPLAY TIME. Diodes CR5 and
CR6 protect Q8 and Q9 against initial line transient
when the instrument is turned on.
4-43. POWER SUPPLY(P/O A8)
4-44. Description of the Power Supply operation will
pertain to the +25 volt supply. For the negative supply,
operation will be identical but with reversed polarities.
Rectifiers CR1 thru CR4form a fullwave bridge rectifier for the +25 volt supply.
two rectifiers operate in series on each half of the
cycle, one rectifier being in the lead to the load; the
other being in the return lead.
4-45. Pulsating(rectified) dc at the output of the fourdiode rectifier bridge is applied to the collector of
the series regulator Ql. Closely matched transistors
Q2, Q5 and Q3, Q4 form differential amplifier with
high common mode signal rejection. The output voltage is applied across Rll, R12, and R13 a voltage
divider, such that some fraction of this voltagewill
be applied to the base of Q5.
the base of Q5 increase, its collector will gomore
negative. This negative going signal will be applied
through emitter follower Q4 and cause Q3 collector
to go negative. The negative going signal from Q3 is
coupled through emitter follower Ql and seriesregu-
later Ql (mounted on chassis). Subsequently the signal
AQ ZERO FINE and COARSE
A positive
In this arrangement
Should the voltage at
4-3
Page 50

Section IV
Paragraph 4-46
at the base of Ql will increase the effective resistance
of series regulator.
Model 4342A
4-46. The rectifier output is continually changing, as
it is a pulsating current.
feeding the series regulator is continually compen-
sating for this pulsation, effectively smoothing the
rectifiers output. Capacitor C2 (mounted on chassis)
sets ac output impedance. Zenor diode CR5 provides
constant basevoltage toQ2. Diode CR6 protects tran-
sistor Q3 against transients. Diodes CR7, CR8, and
CR9 provide current limiting in the event of a grounded
output. As stated earlier the operation for the negative supply is identical to the positive supply, except
that only one differential amplifier is used in the
circuit.
Thus the amplifier chain
4-4
Page 51

Section V
Table 5-l
Model 4342A
Table 5-l. Recommended Test Equipment.
Instrument Type
AC Voltmeter
RF Voltmeter
Digital
Voltmeter
Frequency
Counter
Test Oscillator
RF Oscillator
Oscilloscope
Required Performance
Frequency Range:
Voltage Range: lmV to 1V
Accuracy: 1% at 200kHz.
Frequency Range:
Voltage Range:
Frequency Flatness:
Voltage Range:
DC Voltage Accuracy:
AC Frequency Range:
AC Voltage Accuracy:
Frequency Range:
Sensitivity: 50mV
Frequency Range: 1OkHz
Output Voltage:
Distortion:
Frequency Range: 1OOkHz to 70bIHz
output: l.OV max.
Bandwidth: 5OMHz
Sensitivity: SmV/cm
Input Impedance: 1MR
1OkHz to 1MHz
500kHz to 1OOMHz
1OmV to lV
kl%
0.11,' to 1OOV dc
0.1% of reading
<lOOkHz
1% of reading
1OkHz to 80111112
to
1OOkHz
l.OV max.
less than 1%.
Recommended Model
HP 400E
HP 3406A (with
known frequency
flatness)
HP 3456A
-
HP 5381A
-
HP 651B
HP 8601A
-
HP 180C with
1801A and 1821A
Plug-ins
Impedance
Meter
Reference
Inductor
5OQ Resistor
5-o
Frequency: 1OOkHz
Full Scale Range: 500pF
Accuracy: 0.3%
Frequency Range: 1lOkHz to 3OOkHz
higher than 100
Q:
Metal Film 0.5% 1/4W
HP 4192A
-
HP 16475A
-
HP P/N 0698-5965
Page 52

Model 4342A
Section V
Paragraphs 5-l to 5-8
SECTION V
MAINTENANCE
5-1. INTRODUCTION.
5-2. This section provides the instructions
and information required to maintain the HP
Model 4342A Q Meter. Included are Performance
Checks, Adjustment and Calibration Procedures,
Servicing and Troubleshooting guides.
5-3. TEST EQUIPMENT REQUIRED.
5-4.
Model 4342A are listed in Table S-l. The
table lists the type of equipment to be used,
the performance requirements and recommended
model. If the recommended model is not
available, equipment which meets or exceeds
the critical performance may be substituted.
5-5.
5-6. A Q Meter theoretically measures the
comprehensive Q of a circuit. In practice,
residual circuit parameters, which do not
exist in ideal circuits, contribute to meas-
ured Q values.
inductance in series with the COIL terminals,
The equipment required to maintain the
Q ACCURACY CONSIDERATIONS.
Insertion resistance, residual
Table 5-2. Q Correlation Factors.
Q voltmeter input conductance, and tuning
capacitor loss are some of the factors that
contribute to measurement errors in the practical measurement of Q in a typical circuit.
These errors can be minimized by the use of a
low output impedance injection transformer
system,
voltmeter which has a low input conductance,
as in the Model 4342A. Consequently, the
4342A will indicate higher Q values than
other currently available Q meters.
By assuming that no internal circuit loss
exists in the Q Meter, the specified Q accuracy can be guaranteed by performing the
adjustment and calibration procedures in this
section.
actual internal loss of the instrument into
account is required, a Q value reading check
with Q standards (inductors) should be done
in addition to the adjustment and calibration
procedures described in paragraphs 5-9 and
those which follow.
At the present time, no Q standards are
available for users, thus a Q accuracy check
with Q standards can not be performed at the
facility where the instrument is used. Since,
Hewlett-Packard, however, maintains Q standards
traceable to NBS (National Bureau of Standards)
in its major service offices, a calibration
service with authorized Q standards for the
4342A is always available. If a Q accuracy
check is needed, contact your nearest HewlettPackard office. If HP Models 513A/518A Q
standards are owned and maintained, a Q ac-
curacy check for the 4342A can be done at the
user’s location. Refer to Table 5-2 for Q
Correction Factors.
a low loss tuning capacitor, and a Q
If a Q calibration, which takes the
30
MHz
45
MHz 1.37
1.17
* Correlation Factor x Indicated Q - Value on513/
518 = 4342A Indicated Q-Value.
5-7.
5-8. The calibration and adjustment pro-
cedures for Option 001 instruments (that
differ from the standard Model 4342A) are
provided in paragraphs 5-25 and below.
OPTION.
5-1
Page 53

Section V
Table 5-3 and Figure 5-I
Model 4342A
Table 5-3. Frequency Accuracy Check.
I
Frequency
Range
22k - 70k
70k - 220k
220k - 700k
700k - 2.2M
2.2M - 7M
7M - 22M
Frequency Measured
Dial Setting Accuracy
2.2
L
5.0
7.0
7.0
L *l. 0%
15
22
*l. 5%
il. 0%
il. 5%
&l. 5%
il. 5% 68.950 - 71.050 kHz
il. 5% 147.75 - 152.25 kHi
il. 5% 216.70 - 223.30 kHz
Counter Reading
21.670 - 22.330 kHz
24.922 - 25.424
49.250 - 50.750 kHz
68.950 - 71.050
78.822 - 80.413
216.70 - 223.30 kHz
249.22 - 254.24 kHz
492.50 - 507.50 kHz
689.50 - 710.50 kHz
689.50 - 710.50 kHz
788.22 - 804.13 kHz
1477.5 - 1522.5 kHz
2167.0 - 2233.0
2167.0 - 2233.0 kHz
2492.2 - 2542.4
4925.0 - 5075.0 kHz
6895.0 - 7105.0 kHz
6895.0 - 7105.0 kHz
7882.2 - 8041.3 kHz
14.775 - 15.225
21.670 - 22.330 MHz
kHz
kHz
kHz
kHz
kHz
MHz
22M - 70M
-yl
4342A
21.560 - 22.440 MHz
24.922 - 25.424 MHz
49.000 - 51.000 MHz
68.600 - 71.400 MHz
r
DIGITAL VOLTMETER
@1@
JpqL!J
(REAR PANEL)
5-2
Figure 5-l. Q Range Check.
Page 54

Model 4342A
Paragraphs 5-9 to 5-12 '
Section V
5-9. PERFORMANCE CHECKS.
S-10. The Performance Checks compare the
4342A instrument with its specifications.
These checks are used in incoming inspection,
periodic maintenance, and after a repair.
Before beginning the Performance Checks, do
mechanical and electrical meter zero adjustments using the procedure in Figure 3-6.
5-11. FREQUENCY ACCURACY CHECK.
An electronic frequency counter is required
for this check.
Connect frequency counter to 4342A
a.
rear panel FREQUENCY MONITOR connector.
Set 4342A controls as follows:
b.
FREQUENCY RANGE
........
22k to 70k
FREQUENCY dial ................ 2.2
Other controls
Frequency counter reading should be
C.
....... any settings
within 21,678kHz to 22,320kHz.
Check frequency at each frequency set-
d.
ting in accord with Table 5-3. Counter
readings should be within the tolerance limits given in Table 5-3.
a. Connect an
and
GND
5-1. Connect Digital Voltmeter to
AC
Voltmeter to 4342A LO
terminals as shown in Figure
AC
Voltmeter dc output terminals.
b. Set 4342A controls as follows:
FREQUENCY RANGE
FREQUENCY dial
Q RANGE
Q LIMIT
........................ 30
........................
....... 70k - 220k
................. 20
CW
L/C dial ................... 25(pF)
AC dial .........................
Set AC Voltmeter range to 30mV and
C.
0
Digital Voltmeter to 1V. Digital
Voltmeter reading should be between
920.6 and 977.4mV.
Set Q RANGE and
d.
accord with Table 5-4.
AC
Voltmeter range in
Digital Volt-
meter reading should be within the
tolerance limits given in Table 5-4.
Table 5-4. Q Range Check.
,
( Q Range ( Vgzr / Digit:ztyter (
1
5-12.
An
Q RANGE CHECK.
AC
Voltmeter and a Digital Voltmeter are
required for this check.
1000 1 mV 873.0 - 927.0 mV
I
G -
d DC OUTPUT
Figure 5-2. AQ Range Check.
DIGITAL VOLTMETER
uzl @I
(REAR PANEL)
I
5-3
Page 55

Section V
Paragraphs 5-13 to 5-14
5-13. AQ RANGE CHECK.
An AC Voltmeter, a Digital Voltmeter, and a
Reference Inductor are required for this
check.
a. Connect the AC Voltmeter to 4342A HI
and GND terminals and place the Reference Inductor in the HI and LO terminals as shown in Figure 5-2.
Monitor
DC voltage at AC Voltmeter dc output
terminals with Digital Voltmeter.
Model 4342A
Set Q/AQ RANGE to AQlO and adjust AQ
g.
ZERO control (coarse and fine) so that
Q meter indicates 0 (full scale) on AQ
scale.
Adjust AC dial so that Q meter indi-
h.
cates 10 on AQ scale and note Digital
Voltmeter reading. It should be within
801.9mV to 818.lmV.
Set 4342A controls as follows:
b.
FREQUENCY RANGE . . . . . . . . 70k - 220k
FREQUENCY dial . . . . . . . . . . . . . . . . . 20
Q RANGE . . . . . . . . . . . . . . . . . . . . . . . 100
Q LIMIT . . . . . . . . . . . . . . . . . . . . . . . . CW
L/C dial . . . . . . . . . . . . . . . . . . . 25(pF)
AC dial . . . . . . . . . . . . . . . . . . . . . . . . . 0
C.
Set AC Voltmeter range to 1V.
d. Adjust L/C dial so that 4342A meter
pointer indicates 100 (need not indi-
cate a peak value).
Adjust to exactly
100 with the AC dial.
Digital Voltmeter reading should
e.
within 873mV to 927mV.
Adjust L/C dial for 900.0mV on Di
f.
Voltmeter display.
Use AC dial
accurate adjustment.
be
gital
for
5-14. CAPACITANCE ACCURACY CHECK.
An Impedance Meter is required for this check.
a. Connect Impedance Meter to 4342A HI
and GND terminals as shown in Figure
5-3.
Note
When the Model 4192A is used for this
check, set panel controls as
follows:
DISPLAY A . . . . . . . . . . . . . . . . . . . . . . . C
ZY RANGE . . . . . . . . . . . . . . . . . . . . . AUTO
CIRCUIT MODE . . . . . . . . . . . . . . . . . AUTO
FREQUENCY . . . . . . . . . . . . . . . . . . 1OOkHz
OSC LEVEL . . . . . . . . . . . . . . . . . . . . . . 1V
CABLE LENGTH . . . . . . . . . . . . . . . . . . . lm
5-4
Figure 5-3.
IMPEDANCE METER
Capacitance Accuracy Check.
Page 56

Section V
Figures 5-4 and S-5
0 - PRESET METER
VERNIER ZEW&DJ C$CR;yEL
A7 R7
I
- E-%J
+ZvR?iJ
O-PRESET
(A7 R3)
Top View
Bottom View
5-6
Figure 5-4.
Model 4342A Adjustment Locations.
Page 57

Model 4342A
Set 4342A controls as follows:
b.
Section V
Paragraph 5-15
5-15. Q LIMIT OPERATION CHECK.
L/C dial . . . . . . . . . . . . . . . . . . . 25(pF)
AC dial . . . . . . . . . . . . . . . . . . . . . . . . . 0
Other controls . . . . . . . any settings
Capacitance Bridge reading should be
C.
between 23.9 and 26.lpF.
d. Check capacitance on each L/C dial and
AC dial setting in accord with Table
5-5.
Capacitance Bridge readings
should be within the specified tolerance limits given in Table S-5.
Table 5-5. Capacitance Accuracy Check.
( Z Dial AC Dial C-Bridge Reading
25 0 23.9 - 26.1
25 -5 (0 Reading)* - 520.1
25 +5 (0 Reading)* + 520.1
100
0 98.9 - 101.1
200 0 197.9 - 202.1
300 0 296.9 - 303.1
400 0 395.9 - 404.1
470 0 465.2 - 474.8
470 +5 (0 Reading)* + 5tO.l
* Note: 0 Reading is the readout on the
Capacitance Bridge when AC Dial
is set to 0.
A Reference Inductor is required for this
check.
Connect a Reference Inductor to 4342A
a.
HI and LO terminals.
Set 4342A controls as follows:
b.
FREQUENCY RANGE . . . . . . . . 70k - 220k
FREQUENCY dial . . . . . . . . . . . . . . . . . 20
Q RANGE . . . . . . . . . . . . . . . . . . . . . . . 100
Q LIMIT . . . . . . . . . . . . . . . . . . . . . . . . CW
L/C dial . . . . . . . . . . . . . . . . . . . 25(pF)
AC dial . . . . . . . . . . . . . . . . . . . . . . . . . 0
Set OVER LIMIT DISPLAY TIME switch on
C.
4342A rear panel toooposition.
Rotate L/C dial until Q meter pointer
d.
deflection exceeds full scale and
scales out.
Set Q LIMIT control dial to 60. OVER
e.
LIMIT lamp should light.
Adjust L/C dial so that Q meter pointer
f.
indicates approximately 50. OVER
LIMIT lamp should be extinguished.
Rotate L/C dial so that Q meter indi-
g*
cation increases slowly as it approaches
60. The OVER LIMIT lamp should light
at or near a Q meter indication of 60.
5-5
Page 58

Model 4342A
Top View
Bottom View
Figure 5-5. Model 4342A Assembly Locations.
Page 59

Model 4342A
Section V
Table 5-6
Table 5-6. Adjustable Components.
Reference
Designator
AlAlCl, -c3,
-c5, -C7,
-c9, -Cll,
-Cl3
AlAlLl
thru
AlAlL
7
ASR32
ASR43 LINEARITY ADJ To adjust Q meter linearity to maximize
A6R2
A6R4
Name of Control
I
FREQ. ADJ C To adjust oscillator frequency of upper range
FREQ. ADJ L To adjust oscillator frequency of lower range
HIGH FREQ. ADJ To adjust Q meter sensitivity in high frequency
MED FREQ. ADJ To adjust Q meter sensitivity in high frequency
Xl GAIN To set Q meter full scale sensitivity to
REC BAL To set Q ANALOG OUTPUT dc voltage at rear
I
limits of individual frequency ranges to
maximize frequency accuracies.
limits of individual frequency ranges to
maximize frequency accuracies.
(7OMHz) region to obtain optimum frequency
flatness.
(2OMHz) region to obtain optimum frequency
flatness.
measurement accuracy.
maximize measurement accuracy.
panel to zero volts at Q meter zero scale
deflection.
Purpose
A6R6
REC GAIN
I::
A6R21 X10 GAIN To adjust AQ measurement full scale sensitivity
A7R3
A7R7 Q-PRESET
A8R12
-RZl
A8R26
I
Q-PRESET To properly set Q limit selector sensitivity at
VERNIER
+25V ADJ
-25V ADJ
OSC LEVEL
To set Q ANALOG OUTPUT dc voltage at rear
panel (to 1 volt) at Q meter full scale
deflection.
to maximize AQ measurement accuracy.
Q LIMIT dial full scale setting to maximize the
dial scale accuracy.
To properly set Q limit selector sensitivity at
Q LIMIT dial center scale setting to maximize
the dial scale accuracy.
To set +25V and -2SV output voltages of dc
power supply.
To adjust oscillator output voltage to maximize
measurement accuracy.
I
5-7
Page 60

Section V
Paragraphs 5-16 to S-20
5-16.
ADJUSTMENT AND CALIBRATION
PROCEDURES.
Adjust ASR21 (-25V ADJ) for a reading
e.
of -25V _+O.O25V on DC
Voltmeter.
Model 4342A
5-17.
These paragraphs describe complete
adjustment and calibration procedures for the
Model 4342A. The procedures should be per-
formed when any performance test fails or
when it is known that the instrument does not
meet the specifications or may be necessary
after certain repairs.
Table 5-6 is a sum-
mary of the purpose of each adjustment and
its effect on instrument performance.
Adjustment and assembly locations are shown
in Figure 5-4 and 5-5, respectively.
WARNING
ADJUSTMENTS DESCRIBED IN THIS SEC-
TION ARE ALLOWED FOR QUALIFIED
TECHNICAL PERSONNEL ONLY.
WARNING
ADJUSTMENTS DESCRIBED HEREIN ARE
PERFORMED WITH POWER SUPPLIED TO THE
INSTRUMENT AFTER PROTECTIVE COVERS
HAVE BEEN REMOVED. ENERGY EXISTING
AT MANY POINTS MAY, IF CONTACTED,
RESULT IN PERSONAL INLJURY.
Preparatory to beginning adjustments, remove
top cover by removing the four retaining
screws near side frames (both sides).
Remove
bottom cover with similar procedure.
5-18.
POWER SUPPLY ADJUSTMENT.
Note
Voltage ripple should be less than
0.35mVrms for both +25V and -25V
power supplies.
5-19.
OSCILLATOR LEVEL ADJUSTMENT.
An AC Voltmeter and a Digital Voltmeter are
required for this adjustment.
a. Connect AC Voltmeter to 4342A LO and
GND terminals as shown in Figure 5-l.
Monitor dc voltage at AC Voltmater dc
output terminals with Digital Voltmeter.
Set 4342A controls as follows:
b.
FREQUENCY RANGE
FREQUENCY dial
................
.........
22k - 70k
5.0
Q RANGE ........................ 30
Q LIMIT
........................
L/C dial ...................
25
cw
(PF)
K dial ......................... 0
Set AC Voltmeter range to 30mV and
C.
Digital Voltmeter range to 1V.
Adjust A8R26 (OSC LEVEL adj.) for
d.
949.0mV -t5mV on Digital Voltmeter display.
A DC Voltmeter (or a DMM) is required for
this adjustment.
a. Turn 4342A power off.
Take out A8
Power Supply Assembly. Reinstall it
with an extender board.
Turn instrument on. Connect DC Volt-
b.
meter plus input lead to plus terminal
of capacitor A8C3 and minus input lead
of voltmeter to chassis.
Adjust A8R12 (+25V ADJ) for a reading
C.
of +25 iO.025V on DC Voltmeter.
d. Connect DC Voltmeter minus input lead
to minus terminal of capacitor
A8C6
and plus input lead of voltmeter to names of FREQ AD-J potentiometers and
chassis.
5-8
5-20. OSCILLATOR FREQUENCY ADJUSTMENT.
A Frequency Counter is required for this
adjustment.
a. Connect a frequency counter to 4342A
rear panel FREQUENCY MONITOR connector.
b.
Set
4342A controls as follows:
FREQIJENCY RANGE ......... 22k - 70k
FREQUENCY dial ................
2.2
Other controls ....... any settings
Remove instrument bottom cover and
C.
oscillator shield cover labeled with
trimmer capacitors.
Page 61

Model 4342A
Section V
Paragraph 5-21
d. Loosen all oscillator coil locking
nuts. Replace oscillator shield cover.
e. Adjust AlAlLl (see Figure 5-5, instru-
ment bottom view) for 22.000kHz
20.330kHz on frequency counter display.
Set FREQUENCY dial to 7.0.
f.
Adjust AlAlCl for 70.000kHz +l.O50kHz
ET-
on frequency counter display.
h. Set FREQUENCY dial to "L" point.
1. Frequency counter reading should be
within 24.922kHz to 25.420ktIz. If not,
repeat steps b through g.
Check dial tracking throughout the
j.
22 - 70kHz frequency range. A compromise adjustment may improve tracking.
Compare with Table 5-3.
k. Set FREQUENCY RANGE and FREQUENCY dial
in accord with Table 5-7 and adjust
each individual adjustment control
(AlAlL through L7, C3, C5, C7, C9,
Cl1 and C13) for correct frequency
with procedures similar to steps b
through j.
1. Remove oscillator shield cover and
carefully tighten all oscillator coil
locking nuts. Take care that potentiometer does not rotate with nut.
Replace oscillator cover.
m. Recheck instrument against Table 5-7.
5-21. Q VOLTMETER ADJUSTMENT.
A Test Oscillator and a Digital Volemeter are
required for this adjustment.
Note
Before proceeding with this adjust-
ment,
check meter mechanical and
electrical zero using the procedure
given in Figure 3-6.
1) Xl Gain and meter linearity adjustments.
a.
Connect the Test Oscillator and the
Digital Volemeter to 4342.A as shown
in Figure 5-6.
Frequency
Range
22k - 70k
220k - 700k
2.2M - 7.OM
22M - 70M
70k - 220k
0.7M - 2.2M
Table 5-7.
Frequency Adjustment.
Frequency Measured
Dial Setting
2.2 22.000 50.330 kHz AlAlLl
7.0 70.000 rtl. 050 kHz AlAlCl
“L” 25.173 *O. 251 kHz NONE
2.2 220.00 i3.30 kHz AlAlL
7.0 700.00 +lO. 50 kHz AlAlC5
“L” 251.73 *2.51 kHz
2.2 2200.0 k33.0 kHz AlAlL
7.0 7000.0 klO5.0 kHz AlAlC9
“L”
2.2 22.000
7.0 70.000 + 1.400MHz AlAlC13
“L”
7.0 70.000
22 220.00 *3.30 kHz AlAlC3
“L” 79.618
7.0 700.00 +lO. 50 kHz AlAlL
22 2200.0
“L”
Frequent y
2517.3 +25.1 kHz NONE
+ 0.440MHz Al Al L7
25.173 + 0.251MHz NONE
il. 050 kHz Al Al L2
&O. 796 kHz NONE
k33.0 kHz AlAlC7
796.18 *7.96 kHz
Adjustment
NONE
NONE
7. OM - 22M
7.0 7000.0 k 105. OkHz AlAlL
22 22.000 k 0.330MHz AlAlCll
“L” 7961.8 + 79.6kHz NONE
5-9
Page 62

Section V
Paragraph 5-22
Model 4342A
Set 4342A controls as follows:
b.
FREQUENCY RANGE . . . . . . . . . 22k - 70k
FREQUENCY dial . . . . . . . . . . . . . . . . 2.2
L/C dial . . . . . . . . . . . . . . . . . . . 25(pF)
AC dial . . . . . . . . . . . . . . . . . . . . . . . . -5
C.
Set the Test Oscillator frequency to
1OOkHz and adjust the signal level
until the Digital Voltmeter reads
9OO.OmV.
d. Adjust A6R2 (Xl GAIN adj.) for full
scale Q meter reading.
e. Adjust the Test Oscillator's signal
level until the DVM reads 450.0mV.
f. Q meter should indicate exactly l/2
full scale. If Q meter deflection is
insufficient, rotate ASR43 (LINEARITY
ADJ) CCW until meter reads correctly.
If deflection is excessive, rotate AS-
R43 slightly CW.
Repeat steps c through f until meter
g-
indicates l/2 full scale within
+O.S/lOO full scale (l/2 minor divi-
sion) in step f.
Adjust the Test Oscillator's signal
h.
level until the DVM reads 300.0mV.
Q meter should indicate within l/3
1.
full scale ?l/lOO of full scale (1
minor division).
c through f.
If not, repeat steps
2) X10 GAIN adjustment.
Adjust the Test Oscillator's signal
j.
level until the DVM reads 810.0mV.
Depress 4342A AQ button and set
k.
RANGE to 10.
Adjust AQ ZERO control for 10 (zero
1.
scale deflection) on AQ scale.
m. Adjust the Test Oscillator's signal
level until the DVM reads 900.0mV.
Q meter should indicate 0 (full scale)
n.
on AQ scale.
not zero, adjust A6R21 (X10 GAIN adj.)
for correct reading.
through n because both adjustments
interact.
5-22.
A Test Oscillator and a Digital Voltmeter are
required for this adjustment.
Q ANALOG OUTPUT
Set 4342A controls as follows:
a.
Q RANGE . . . . . . . . . . . . . . . . . . . . . . . . 30
other controls . . . . . . . any settings
Connect Digital Voltmeter to 4342A
b.
rear panel Q ANALOG OUTPUT connector.
Adjust A6R4 (REC BAL adj.) for OV
C.
?O.OlV on Digital Voltmeter display.
If Q meter reading is
Repeat steps j
ADJUSTMENT.
AQ
S-10
TEST OSCILLATOR
1
4342A
Figure 5-6.
l-y
DIGITAL VOLTMETER
Voltmeter Adjustment.
Page 63

Model 4342A
d. Connect the Test Oscillator to the
4342A as shown in Figure 5-6.
e. Set the Test Oscillator frequency to
1OOkHz and output for full scale
reading (approx. 9OOmVrms) on 4342A Q
meter.
f. Adjust A6R6 (REC GAIN adj.) for 1V
?O.OlV on Digital Voltmeter display.
Repeat steps c through f because both
g.
adjustments interact.
Section V
Paragraphs 5-23 and 5-24
f. Adjust A5R32 (MED. FREQ. ADJ) for full
scale reading on 4342A Q meter.
Set RF Oscillator frequency to 7OMHz
g.
and its output for the same RF Voltmeter reading as that noted in step d.
h. Adjust A5C16 (HIGH FREQ. ADJ) for full
scale reading on 4342A Q meter.
1.
Repeat steps c through h until both
difference (from full scale) Q meter
readings obtained in steps f and h are
within +2% of full scale.
5-23. FREQUENCY RESPONSE ADJUSTMENT.
An RF Oscillator and an RF Voltmeter (with
known frequency flatness) are required for
this adjustment.
a. Connect RF Oscillator and RF Voltmeter
as shown in Figure 5-7.
b. Set 4342A C and AC dials to minimum.
C.
Set RF Oscillator frequency to 1OMHz
and its output for full scale meter
deflection (approx. 9OOmVrms) on 4342A
Q meter.
d. Note RF Voltmeter reading.
e. Set RF Oscillator frequency to 20MHz
and its output for the same RF Voltmeter reading as that noted in step d.
5-24. Q LIMIT
SELECTOR ADJUSTMENT.
An RF Oscillator is required for this adjustment.
a.
Set 4342A rear panel OVER LIMIT DISPLAY TIME switch toooposition.
b.
Connect RF Oscillator between HI and
GND terminals.
Set 4342A Q LIMIT control to 100.
C.
d.
Set RF Oscillator to desired frequency
(100kHz to 1MHz) and adjust its output
for full scale reading on 4342A Q
meter.
Rotate A7R3 (Q-PRESET adj.) CCW until
e.
front panel OVER LIMIT indicator
lights.
Figure 5-7. Frequency Response Adjustment.
RF OSCILLATOR
5-11
Page 64

Section V
Paragraphs 5-25 to 5-27
Model 4342A
Rotate A7R3 very slowly CW until OVER
f.
LIMIT indicator is extinguished.
Set Q LIMIT control to 50. OVER LIMIT
g.
indicator should light.
Decrease RF Oscillator output level
h.
and note 4342A Q meter reading at
which OVER LIMIT indicator just extin-
guishes.
Q Meter reading should be
approx. l/2 full scale (50 +5 divisions on meter top scale).
If Q Meter reading is low, rotate A7R7
1.
(Q-PRESET VERNIER) slightly CW and re-
peat steps c through h.
If Q Meter reading is high, rotate
1.
A7R7 slightly CCW and repeat steps c
through h.
Table 5-8. Frequency Accuracy Check (Option 001).
5-25.
OPTION 001 MAINTENANCE INSTRUCTIONS.
5-26. This paragraph and those below des-
cribe the changes necessary for applying the
Performance Checks and Adjustment and Calibration Procedures in this section (V) to
Option 001 instruments.
5-27.
5-28.
OPTION 001 PERFORMANCE CHECKS.
To apply the Performance Check procedure in paragraphs 5-9 and below to option
001 instruments, make the following changes
in standard procedures:
a. Para. 5-11 b. Change the FREQUENCY
RANGE and FREQUENCY dial settings
to 10k - 32k and 1.0, respectively.
Para. 5-11 c. Change the upper and
Frequency
Range
10k - 32k
32k - 1OOk
1OOk - 320k
320k - 1M
1M - 3.2M
3.2M - 10M
Frequency
Dial Setting
1.0
1.5 *l. 5%
L A. 0%
3.2 *1.50/o
3.2
5.0
L il.O%
10 A. 5%
1.0
1.5
L *1.00/o
3.2
3.2 *1.5%
5.0
L A. 0%
10 il. 5%
1.0 *1.50/o
1.5
L *1.00/o
3.2 *1.5%
3.2 *l. 5%
5.0 *1.50/o
L il. 0%
10 A. 5%
Specified
Accuracy
il. 5%
*l. 5Yo
*1.5%
il. 5%
*1.50/o
*l. 5%
A. 5%
*1.50/o
Counter Reading
9.8500 - 10.150 kHz
14.775 - 15.225 kHz
24.922 - 25.424 kHz
31.520 - 32.480 kHz
31.520 - 32.480 kHz
- 49.250 50.750 kHz
78.822 - 80.413 kHz
98.500 - 101.50 kHz
98.500 - 101.50 kHz
147.75 - 152.25 kHz
249.22 - 254.24 kHz
315.20 - 324.80 kHz
315.20 - 324.80 kHz
492.50 - 507.50 kHz
788.22 - 804.13 kHz
985.00 - 1015.0 kHz
985.00 - 1015.0 kHz
1477.5 - 1522.5 kHz
2492.2 - 2542.4 kHz
3152.0 - 3248.0 kHz
3152.0 - 3248.0 kHz
4925.0 - 5075.0 kHz
7882.2 - 8041.3 kHz
9.8500 - 10.150 MHz
5-12
10M - 32M
1.0 *2.0%
1.5 *2.0%
L *l.O%
3.2 *2.0%
9.8000 - 10.200 MHz
14.700 - 15.300 MHz
24.922 - 25.424 MHz
31.360 - 32.640 MHz
Page 65

Model 4342A
Section V
Paragraphs 5-29 and S-30
lower frequency limits to 9.850kHz
and lO.lSOkHz, respectively.
Para. 5-11 d.
Use Table 5-8 for op-
tion 001 instead of Table 5-3.
Para. 5-12 b, 5-13 b, and 5-15 b.
b.
Change FREQUENCY RANGE and FREQUENCY
dial settings to 1OOk - 320k and 2.0,
respectively.
5-29. OPTION 001 CALIBRATION AND
ADJUSTMENT PROCEDURES.
S-30.
To apply the Calibration and Adjustment Procedures in paragraphs 5-16 and those
below to option 001 instruments, partially
make the following changes in standard pro-
cedures:
Para. 5-19 b.
a.
Change the FREQUENCY
RANGE and FREQUENCY dial settings
to 10k - 32k and 2.0, respectively.
b. Para. S-20 b. Change the FREQUENCY
RANGE and FREQUENCY dial settings
to 10k - 32k and 1.0, respectively.
Para. S-20 e. Change frequency toler-
ance limits to lO.OOOkHz +O.lSOkHz.
Para. 5-20 f.
Change FREQUENCY dial
setting to 3.2.
Para. S-20 g. Change frequency toler-
ance limits to 32.000kHzi0.480kHz.
Para. S-20 j. Change frequency range
to 10 - 32kHz (from 22 - 70kHz).
Para. 5-20k. Use Table 5-9 instead of
Table 5-7.
Para. 5-21 b. Change FREQUENCY RANGE
C.
and FREQUENCY dial settings to 10k -
32k and 1.0,
Para. 5-23 g. Change RF Oscillator
d.
respectively.
frequency setting to 32MHz.
Table 5-9. Frequency Adjustment (Option 001).
Frequent y
Range
10k - 32k
Frequency
Dial Setting
1.0
3.2
L
1OOk - 320k 3.2
1.0
L
1M - 3.2M 3.2
1.0
L
10M - 32M 3.2
32k - 1OOk 10
320k -
3.2M - 10M 10
1M 10
1.0
L
3.2
Ll
3.2
L
3.2
L
Measured
Frequency
10.000 +0.150
32.000 &O. 480
25.173 *to. 251
100.00 &l. 50 kHz
320.00 i4.80 kHz
251. ‘73 i2.51 kHz
1000.0 &5.0 kHz
3200.0 k48.0 kHz
2517.3 k25.1 kHz
10.000 +O. 200 MHz
32.000 iO.640 MHz
25.1’73 10.251 MHz
32.000 kO.480 kHz
100.00 *II. 50 kHz
79.618 *to. 796 kHz
3200.0 *48.0 kHz
10.000 +O. 150 MHz
7961.8 i79.6 kHz
kHz
kHz
kHz
Adjustment
AlAlLl
AlAlCl
NONE
AlAlL
AlAlC5
NONE
AlAlL
AlAlC9
NONE
AlAlL
AlAlC13
NONE
AlAlL
AlAlC3
NONE
AlAlL
AlAlC7
NONE
AlAlL
AlAlCll
NONE
1
I
5-13
Page 66

Section V
Paragraphs 5-31 to 5-36
Model
4342A
5-31. DIAL RE-STRINGING INSTRUCTIONS.
5-32. This paragraph explains how to restring and set the dial drive strings which
move
FREQUENCY, L/C, and C dials which
rotate the internal variable capacitors.
maintain dial scale accuracy and smooth dial
operation, the dial string must be correctly
wound on and attached to the drum scale
pulley and dial or capacitor pulley and its
tension set properly. If a dial string is
off or loose, repair the string in accord
with the following instructions which outline
the procedures for correctly interlocking
dial and capacitor.
5-33. For access to internal dial interlock-
ing mechanism, remove control panel, top,
bottom, and side covers, and side frames as
follows:
Turn instrument off and remove power
a.
cord.
b.
Unscrew the four retaining screws and
remove top cover. Remove bottom cover
with like procedure.
To
5-34. FREQUENCY DIAL.
The parts required for stringing frequecy
dial are:
String I:
1)
2) String II:
Belt: HP Part No. 04342-1051
3)
Screws (2):
4)
f1P Part No. 04342-8541
HP Part No. 04342-8542
HP Part No. 0520-0127
Frequency dial re-stringing procedure is
illustrated in Figure 5-8.
5-35.
L/C DIAL.
To re-string tuning capacitor dial, the
following parts are required:
String I: HP Part No. 04342-8541
1)
2) String II: HP Part No. 04342-8544
3) Belt: HP Part No. 04342-1052
Screws (2): f1P Part No. 0520-0127
4)
L/C dial re-stringing procedure is illustratd
in Figure 5-9.
C.
Remove the four retaining screws lo-
cated at the left and right (top and
bottom) sides of the control panel.
d.
Lift control panel front edge up and
remove the panel.
e.
Remove both side panels by removing
the four screws on each side.
Remove both side-casting-frames by
f.
removing the eight screws on each side.
5-36. AC DIAL.
To re-string AC dial, the following parts are
required:
String I: HP Part No. 04342-8541
1)
String II: flP Part No. 04342-8543
21
Belt:
3)
4)
Screws (2): HP Part No. 0520-0127
HP Part No. 04342-1053
AC dial re-stringing procedure is illustrated
in Figure S-10.
5-14
Page 67

Model 4342A
Section V
Figure 5-8
(81 Malre one~and half loop around the Drum Scale
securing thebelt to the pu
Figure 5-8. Frequency Dial Restringing.
5-15
Page 68

Section V
Figure 5-9
Model 4342A
length) to the free end oP the spring on Main Ca-
pacitor Drum Scale Pulley.
(2) Make one hp aroundttheDr”m Scale lwley, and
tring (04342-8541. 620mm
(6) Hook the smallor circle at one end 01 the string
(04342-8544, 165mm length) to the free end OC
the spring on the Main Capacitor Pulley.
5-16
Figure 5-9. Main C Dial Restringing.
to the Drum Scale Pulley using anelectrical wire.
the Main Capacitor Pulley
Page 69

Model 4342A
I Serure theother end ot the belt Lo theDrum Scale
Puiiey by a SCPCW which should not be tipbtened.
Section V
Figure S-10
Hook theother end of the strinxto the stud
Drum SCrtlE Pulicy.
(4) Secure abelt (04342-1053, 142mm length) and C
pulley by a YCWW.
Figure S-10.
AC Dial Restringing.
5-17
Page 70

Section V
Paragraphs 5-37 to 5-44
Model 4342A
5-37.
5-38.
TROUBLESHOOTING GUIDES.
This paragraph and those below provide
information helpful to isolating a faulty
circuit in a defective unit and the appro-
priate remedy for the trouble. Component
level troubleshooting procedures are provided
in Figures 5-13 and 5-14 in the form of flow
diagrams [however, for simple circuits composed of only a few (active) components,
these figures treat the breakdown only to
circuit block level and component level
troubleshooting procedure is omitted]. Before
proceeding with troubleshooting, verify
whether any external factor relating to the
instrument operating environment is contri-
buting to the trouble symptoms.
The following paragraphs outline some considerations
for such external troubles:
5-39. High Frequency Line Noise.
High frequency noise superposed on the AC
power line may possibily cause an abnormal
deflection of the Q meter regardless of the
sample measured. If meter pointer shows al-
most the sane deflection on any FREQUENCY and
Q RANGE setting, check quality of operating
power line. To isolate trouble, proceed as
follows:
1) Operate the instrument from another ac
power line and attempt measurement.
deflection caused by such external electromagnetic field is irrespective of the Q range.
One solution to this trouble is to enclose
the instrument in a grounded wire net shield.
Securely ground the instrument.
5-41. Operation in High Humidity
Environment.
The Q factor of a high Q inductor is generally
sensitive to atmospheric humidity. Usually,
ordinary high Q inductors tend to show a pronounced decrease in Q factor when they are
located in a high humidity environment (more
than 80%). If Q meter indicates a lower Q
value (different from a nominal value of the
sample), compare instrument reading by using
a Q reference coil or a stable inductor (hermetically sealed).
5-42. ELEMENTARY TROUBLESHOOTING GUIDE.
5-43. Meter Zeroing Troubles.
If Q meter does not indicate zero after the
instrument is turned on and if meter zero
adjustment (Figure 3-6) is not successful,
A6 DC Amplifier Assembly is probably faulty.
Check differential meter amplifier (A6Q2, 43,
44 and QS) and dc power supply voltages on
the circuit board.
5-44.
Incorrect Q Meter Indication.
2) Securely ground the instrument chassis
to earth.
If the symnton disappears or is different,
use the sane procedures on actual neasurements or use a line filter in the power line.
5-40. Operating in a Strong Electromagnetic
Field.
When the instrument is operated in a strong
RF electromagnetic field, two (or more) re-
sonant frequency points are sometimes ob-
served on the Q meter indication. This
symptom arises from the fact that the Qmeasuring circuit resonates with the oscil-
lator signal injected into the circuit and
additionally with the RF signal induced by
the electromagnetic field as well.
tice,
this trouble sometimes occurs when the
In prac-
instrument is located near a high power
transmitting station (such as a broadcasting
station).
The meter "true" tuning deflection
can be easily distinguished from the "false"
behavior because the amplitude of any meter
If indicated Q values of Q measurements are
incorrect (compared with a known sample),
the trouble is probably located in either
the oscillator section or the Q voltmeter
section. (If no deflection at all can be
obtained, first check power supply voltages).
To isolate the trouble, proceed as follows:
Connect a RF Voltmeter to 4342A LO
a.
and GND terminals.
b. Set 4342A Q RANGE to 30.
C.
Rotate FREQUENCY dial from lowest to
highest frequency on each FREQUENCY
RANGE setting and check RF voltmeter
reading.
RF Voltmeter reading should be within
d.
30nV *O.SmVrns at any frequency setting. If this check fails, troubleshoot oscillator section and follow
Figure 5-12 Troubleshooting Tree. If
OK, troubleshoot voltmeter section and
follow Figure 5-13 Troubleshooting
Tree.
5-18
Page 71

Model 4342A
Section V
Paragraphs 5-45 and 5-46
5-45. Low Q indication in high frequency
measurements.
If the Q meter shows lower Q indication at
higher frequencies (above approx. lOMltz), it
is conceivable that the symptom is being
caused by a drop in Q of the tuning capacitor.
The tuning capacitor has a spring contact
brush for grounding the capacitor rotor
plates with minimal residual impedance to
maintain the inherent loss of the capacitor
at minimum in the high frequency region.
A
contact brush in service for a long period
may possibly cause an increase in contact
resistance and resultant increase in capacitor loss. The remedy for this trouble is
to clean the contact brush. Clean with a
cloth moistened with alcohol. To take out
the contact brush, proceed as follows:
a.
Remove top cover.
b.
Remove
white plastic top plate
on
measurement terminal deck.
c. Unsolder center conductor 1 of
coaxial module connected to A4 Imped-
0
ance Converter (see Figure S-11).
Remove nut
d.
retaining the coaxial
0
assembly module.
Remove the six terminal deck retaining
e.
screws
Lift terminal deck up and out. The
f.
0.
contact brush is located on bottom
side of terminal deck.
5-46. Faulty Q Limit Operation.
If 4342A operates normally in Q measurements
but Q OVER LIMIT indication malfunctions, A7
Q Limit Selector assembly is probably faulty.
If OVER LIMIT lamp does not light, first
check lamp AlODSS.
A2 TUNING CAPACITOR ASS?
Figure S-11. Tuning Capacitor Disassembly (top view).
5-19
Page 72

Model 4342A
I
c
YES
Set FRI
and FR
Monitor
T adapt
within
Is there no output or is
there erratic output at
LO and GND terminals
on all FREQUENCY
ranges and Q Ranges?
NO
Is thert
output
nals on
RANGE
Page 73

Section V Model 4342A
5-22
Page 74

&lENCY RANGE to 220k-770k
WENCY dial
AI output (AIJ3) using BNC
- and VTVM. Is reading
628 rms ilO%?
to
5.0.
ES
-,Monitor A4 input (A4J6)
-
-
L
NO
Set Q RANGE to 30.
using VTVM. Is reading
within 1.62V rms +lO%?
Connect A8 PIN 15 to ground.
Monitor Al output using
oscilloscope. Is display as shown in Figure A?
-
I
I
ES
YES
110 output or does erratic
:ist at LO and GND termi-
ne or certain FREQUENCY
1) and on all Q RANGES?
-I
YES
NO
Is there no output or does
erratic output exist at LO
and GND terminals for all
FREQUENCY dial settings ?
No output or erratic output at
LO and GND terminals on one
or some Q RANGE(S) and on
all FREQUENCY RANGE(S).
iI
NO
r
Page 75

*
SEE INSIDE
Table 5-12.
TROUBLESHOOTtNB, OSCILLATOR SECTION
5-21
Page 76

Monitor A4 output using VTVM.
-1s reading should be within
1.6OV rms *lo%?
YES
NO
A2Tl Check:
Check; A4
-Check: A3 Q Range Attenuator.
Unsolder the wire from XA8 PIN
S and connect a -23V to -24V dc
variable power supply to the wire
-(Ql Base) and GND. Observe Al
output waveform with oscilloscope
After adjustment of the variable
power supply, can a distortionfree sine wave be seen on the
oscilloscope ?
-Monitor DC voltage at XA8 PIN S.
Is voltmeter reading -24Vdc +50/o?
Check: AlAl (Sl and, L and C)
-
Connect A8 PIN 15 to ground.
Observe Al output using
-oscilloscope. Is display as
shown in Figure A at any
FREQUENCY dial setting ?
identified with the
FREQUENCY RANGE.
‘.
-c
-r
YES
I
NO
YES
I
NO
YES
NO
Remove connection lead between
XA8 PIN 15 and ground. Keep
Al output at 4Vp-p and monitor
DC voltage at XA8 PIN 15. -
Is voltmeter reading within
-1. SVdc-llO%?
Check; AlAl, Ql
Monitor waveform at AlAl Q3
Gate using oscilloscope. Is display as shown in Figure B?
Check: A8 ALC Amp. (Q9 through (
Check: A3 (Cl Rl and CR1 Frequei
Response)
Monitor DC voltage at XA8 PLN S. I
Is voltmeter reading -24Vdc+5%?
rrue
- Check. A3 Q Range Attenuator.
d
Page 77

section v
Figure 5-12
-c
I
‘CY
YES
NO
YES
NO
YES
Check: A8 ALC Amp.
Check; A3 (54, Cl, Rl and CRl)
Monitor waveform at AlA
PIN 6F using Oscilloscope.
Is display as shown in Figure C?
Check: AlAl (Ql and Q2)
Check* AlAl (Ql, Q2, andR)
-
iI
YES
NO -
Check- AlA RF Power Amp.
-
Check* AlAl Impedance Converter.
NO -
Check* A8 ALC Amp.
Figure 5-12. Troubleshooting, Oscillator Section
5-21
Page 78

Does Q-meter indicate full
scale (*3%) over the frequency range (from
22kHZ
to 70MHz)?
YES
NO
Connect an oscillator or
to HI and GROUND termi
with a 50R resistor) and
0.9V rms (monitor with
Set C and AC dials to mi
____-. ----
Page 79

SEE INSIDE
Table 5-13.
TROUBLESHOOTING, VOLTMETER SECTION
5-23
Page 80

A6 DC Amplifier Assembly.
Does Q-meter indicate full
-scale (+3’%) at higher
frequencies?
a signal generator
nals (terminated
set its output to
an RF Voltmeter).
nimum.
--E
YES
NO d
Observe waveform at A5Q9
emitter with oscilloscope.
Is amplitude flatness within*3W?
Check* A2 Tuning Capacitor
Page 81

Section V
Figure 5-13
YES
r
NO
YES
c
NO h
Set oscillator frequency to
1OOkHz and observe wave-
form at A5Q9 emitter with
oscilloscope. Is display a
5.7Vp-p *100/o sinewave?
Set oscillator frequency to
1OOkHz and observe wave-
form at A5Q4 emitter with
oscilloscope. Is display
a O. OSVp-p *lo% sinewave?
Check: A5 Detector
Check*
A5, RF Amplifier
--I
s
YES
NO
YES
NO
Check; A5 Detector
Check; A5 (RF Amp. Q7, 8, 9)
Check; A5 (RF Amp. Q5, 6)
Check; A5 (Impedance Converter Ql thru Q4)
Figure 5-13. Troubleshooting, Voltmeter Section
5-23
Page 82

PERFORMANCE CHECK TEST CARD
Hewlett-Packard Model 4342A Test Performed by
Q Meter
Serial No. Date
DESCRIPTION
1. FREQUENCY ACCURACY: STANDARD
22 kHz
22 kHz - 70 kHz L
Range 50 kHz
70 kHz
70 kHz
70 kHz - 220 kHz
Range 150 kHz
220 kHz - 700 kHz L
Range 500 kHz
700 kHz - 2.2 MHz L
Range 1.5 MHz
2.2 MHz - 7.0 MHz L
Range 5.0 MHz
L
220 kHz
220 kHz
700 kHz
700 kHz
2.2 MHz
2.2 MHz
7.0 MHz
CHECK
Counter Reading
21.6’70 kHz < < 22.330 kHz
24.922 kHz < < 25.424 kHz
49. 250 kHz < < 50.750 kHz
68.950
68. 950
78.822 kHz < < 80.413 kHz
147.75 kHz < < 152.25 kHz
216.70 kHz < < 223. 30 kHz
216.70 kHz < < 223. 30 kHz
249. 22 kHz < < 254. 24 kHz
492.50
689.50 kHz < < 710.50 kHz
689.50 kHz < < 710.50 kHz
788. 22 kHz < < 804.13 kHz
1477.5 kHz < < 1522.5 kHz
2167.0 kHz < < 2233.0 kHz
2167.0
2492.2 kHz < < 2542.4 kHz
4925.0 kHz < < 5075.0 kHz
6895.0 kHz < < 7105.0 kHz
kHz < < 71.050 kHz
kHz < < 71.050 kHz
kHz < < 507.50 kHz
kHz < < 2233.0 kHz
7.0 MHz
7.0 MHz - 22 MHz L
Range 15 MHz
22 MHz - 70 MHz L
Range 50 MHz
1’. FREQUENCY ACCURACY: OPTION 001
10 kHz - 32 kHz 15 kHz
Range L
32 kHz - 100 kHz
Range L
100 kHz - 320 kHz 150 kHz
Range L
22 MHz
22 MHz
70 MHz
10 kHz
32 kHz
32 kHz
50 kHz
100 kHz
100 kHz
320 kHz
6895.0 kHz < < 7105.0 kHz
7882.2 kHz < < 8041.3 kHz
14.775
21.670
21.560 MHz < < 22.440 MHz
24.922
49.000 MHz < < 51.000 MHz
68.600 MHz < < 71.400 MHz
9.8500 kHz < < 10.150 kHz
14.775 kHz < C 15.225 kHz
24.922 kHz < < 25.424 kHz
31.520
31.520
49. 250 kHz < < 50.750 kHz
78.822 kHz < < 80.413 kHz
98,500
98.500 kHz < < 101.50 kHz
147.75
249.22 kHz < < 254.24 kHz
315. 20 kHz < < 324.80 kHz
MHz < -< 15.225 MHz
MHz < < 22.330 MHz
MHz < < 25.424 MHz
Counter Reading
kHz < < 32.480 kHz
kHz < < 32.480 kHz
kHz < < 101.50 kHz
kHz < < 152. 25 kHz
Page 83

PERFORMANCE CHECK TEST CARD
1’. FREQUENCY ACCURACY: OPTION 001
(Cont’d)
320 kHz
320 kHz - 1.0 MHz
500 kHz
Range L
1.0 MHz
1.0 MHz
1.0 MHz - 3.2 MHz 1.5 MHz
Range L
3.2 MHz
3.2 MHz
3.2
MHz -
10 MHz
Range
5.0 MHz
L
10 MHz
10 MHz
10 MHz - 32 MHz 15 MHz
Range L
32 MHz
2. Q RANGE
30
Q Range
100
300
1000
Counter Reading
315.20 kHz C < 324.80 kHz
492.50 kHz < < 507.50 kHz
788.22 kHz <
985.00 kHz <
985.00 kHz <
< 804.13 kHz
< 1015.0 kHz
< 1015.0 kHz
1477.5 kHz C < 1522.5 kHz
2492.2 kHz < < 2542.4 kHz
3152.0 kHz < < 3248.0 kHz
3152.0 kHz < < 3248.0 kHz
4925.0 kHz <
< 5075.0 kHz
7882.2 kHz < < 8041.3 kHz
9.8500 MHz < < 10.150 MHz
9.8000 MHz <
< 10. 200 MHz
14.700 MHz < < 15. 300 MHz
24.922 MHz < < 25.424 MHz
31. 360 MHz < < 32.640 MHz
Digital Voltmeter Reading
920. 6 mV < < 977.4 mV
873.0 mV < < 927.0 mV
920.6 mV <
< 977.4 mV
873.0 mV < < 927.0 mV
3. aQ RANGE
Q Range
nQ Range
4. CAPACITANCE ACCURACY
C Dial
25 pF
25 pF
25 pF
100 pF
200 pF 0
300 pF
400 pF
470 pF
470 pF 15 pF
5. Q OVER LIMIT OPERATION
Q Limit Setting 60
Meter Indication 50
Meter Indication
Digital Voltmeter Reading
100
10
873.0 mV < < 927.0 mV
801.9mV < < 818.lmV
AC Dial Capacitance Bridge Reading
0
-5 pF
+5 pF
0
0
0
0
(0 Reading)* -5.lpF <
(0 Reading)* +4.9pF <
(0 Reading)* +4.9pF <
* Note: 0 Reading is the readout of the
23.9pF < < 26.lpF
< (0 Reading)* -4.9pE
98.9pF < < lOl.lpF
197.9pF < < 202.lpF
296.9pF <
395.9pF <
465.2pF <
Capacitance Bridge when C Dial
< (0 Reading)* +5.lpE
< 303.lpF
< 404.lpF
< 474.8pF
< (0 Reading)* +5.lpF
is set
to 0.
Over Limit Lamp
On I
Off 0
2 60
On 0
Page 84

Model 4342A
Paragraphs 6-l to 6-8
Section VI
SECTION VI
REPLACEABLE PARTS
6-l. INTRODUCTION
6-2. This section contains information for ordering
replacement parts. Table 6-2 lists parts in alphanumerical order of their reference designators - and
indicates the description (see Table 6-l for abbreviations used) and HP part number of each part, together with any applicable notes.
6-3. Miscellaneous parts associated with each assembly are listed at the end of each assemblylisting.
Others are listed at the end of Table 6-2.
6-4. Exploded views of major parts of the instrument
are given in Figure 6-l through 6-8 to aid in identify-
ing mechanical parts.
The parts in these figures are
keyed to the mechanical parts index which are also
included in each figure.
Table 6-l. List of Reference Designators and Abbreviations
REFERENCE DESIGNATORS
= assembly
A
= motor
B
BT = battery
C = capacitor
CP = coupler
CR = diode
= delay line
DL
= device signaling (lamp)
DS
A = amperes
A. F.C. = automatic frequency control
AMPL = amplifier
8. F. 0. = beat frequency oscillator
BE CU = beryllium copper
BH = binder head
BP = bandpass
BRS = brass
= backward wave oscillator
BWO
= counter-clockwise
ccw
= ceramic
CER
CM0 = cabinet mount only
COEF = coefficient
COM = common
COMP = composition
COMPL = complete
CONN = c0”“ect0r
CP = cadmium plate
CRT = cathode-ray tube
cw = clockwise
DEPC = deposited carbon
DR
= drive
ELECT = electrolytic
ENCAP = encapsulated
EXT = external
F = farads
FH
= flat head
FIL tl = fillister head
FXD = fixed
= germanium
= glass
= grou”d(ed)
E = mist electronic part
F = fuse
FL = filter R
J = jack RT
K = relay S
L = inductor T
M = meter TB
MP = mechanical part TP
ABBREVIATIONS
H
HEX
HG
HR
IF
IMPG
INCD
INCL
INS
INT
K
LH
LIN
LK WASH
LOG
LPF
M
MEG = “leg = 106
MET FLM = metal film
MET OX = metallic
MFR = manufacturer
MINAT = miniature
MOM = momentary
MTG = mounting
MY
N = “a”0 (10-9)
N/C
NE
NI PL
N/O
NPO
= henries
= hexagonal
= mercury
= hour(s)
= intermediate freq
= impregnated
= incandescent
= include(s)
= insulation(ed)
= internal
= kilo = 1000
= left hand
= linear taper
= lock washer
= logarithmic taper
= low pass filter
=
milli = 10-S
oxide
= “mylar”
= normally closed
= neon
= nickel plate RECT
= normally open RF
= negative positive zero RR
(zero temperature
coefficient) RMO
6-5. Replaceable Part Lists for Option001 are given
in Appendix. Changes were made in Assembly AlAl
and Assembly A5 only.
6-6. ORDERING INFORMATION
6-7. To obtain replacement parts, address order or
inquiry to your local Hewlett-Packard Field Office
(see lists at rear of this manual for addresses).
Identify parts by their Hewlett-Packardpart numbers.
6-8. To obtain a part that is not listed, include:
a. Instrument model number.
b. Instrument serial number
c. Description of the part.
d. Function and location of the part.
:
NPN
NRFR
NSR
OBD
OH
ox
P
PC
PF
PH BRZ
PHL
PIV
PNP
p/o
POLY
PORC
POS
POT
PP
PT
PWV
= plug
= transistor
= resistor
= thermistor
= switch
= transformer
= terminal board
= test point
= neeative-oositive-
“e&ive
= not recommended for
field replacement
= not separately
replaceable
= order by description
= oval head
= oxide
= peak
= printed circuit
= picofarads = 10
farads
= phosphor bronze
= Phillips
= peak inverse voltage
= positive-negative-
positive
= part of
= Po1ystYrene
= porcelain
= position(s)
= pote”ttmneter
= peak-to-peak
= point
= peak working voltage
= rectifier
= radio frequency
= round head or
right hand
=
rack
mount only
V
VR
W
X
Y
RMS
RWV
S-B
SCR
SE
SECT
SEMICON
SI
SIL
SL
SPG
SPL
SST
SR
STL
TA
TD
TGL
THD = thread
TI = titanium
TOL = tolerance
TRIM = trimmer
TWT = traveling wave tube
u
VAR
VDCW
W/
W
WN
= YOCUU~I, tube, “eu”
bulb, photocell, etc.
= voltage regulator
= cable
= socket
= crystal
= root-mea” square
= reverse working
voltage
= slow-blow
= screw
= selenium
= section(s)
= semiconductor
= silicon
= silver
= slide
= spring
= spedal
= stainless steel
= split ring
= steel
= tantalum
= time delay
= toggle
= micro = 10-S
= variable
= dc working volts
= with
= watts
= working inverse
voltage
= wirewound
= without
6-l
Page 85

Model 4342A
Section VI
Table 6-2
Table 6-2. Reference Designation Index
Reference
Designation
Al
A
1Al
AlAlCl 0121-0236
AlAlC2”
AlAlC3 0121-0236
AlAlC4*
AlAlC5 0121-0236
AlAlCG*
AlAlC7
Al AlC8* 0160-2247
AlAlC9 0121-0236
AlAlClO* 0160-2253
AlAlCll
AlAlC12*
AlAlC13
AlAlC14*
AlAlC15
Part No.
04342-7020 OSCILLATOR ASS’Y
04342-7751 OSCILLATOR BOARD ASS’Y
04342-8751 BOARD:BLANK PC
0160-2248
0150-2243
0160-2240
0121-0236
0121-0236
0160-2256
0121-0236
0160-2241
Description
C:VAR CER CYLINDER 0.8 - 8.5pF
C:FXD CER 4. 3pF i0. 25pF 500VDCW
C:VAR CER CYLINDER 0.8 - 8.5pF
C:FXD CER 2.7pF k0. 25pF 500VDCW
C:VAR CER CYLINDER 0.8 - 8.5pF
C:FXD CER 2. OpF i0. 25pF 500VDCW
C :VAR CER CYLINDER 0.8 - 8.5pF
C:FXD CER 3.9pF k0. 25pF 500VDCW
C:VAR CER CYLINDER 0.8 - 8.5pF
C:FXD CER 6.8pF +O. 25pF 500VDCW
C :VAR CER CYLINDER 0.8 - 8.5pF
C :FXD CER 9.lpF 10. 25pF 500VDCW
C:VAR CER CYLINDER 0.8 - 8.5pF
C:FXD CER 2.2pF i0. 25pF SOOVDCW
NOT ASSIGNED
AlAlC16
AlAlC17
AlAlC18
AlAlC19
AlAlC20
AlAlC21
AlAlC22
AlAlC23*
AlAlC24
AlAlC25
AlAlC26 0180-0291
AlAlC27 0180-0116
AlAlC28
AlAlC29 0160-2266
AlAlC30 0180-0116
AlAlC33
AlAlLl 04342-8603 COIL:VAR 39 - 58mH
AlAlL
AlAlL 04342-8605 COIL:VAR 1 - 1.6mH
AlAlL 04342-8606 COIL:VAR 102 - 150/~H
AlAlL 04342-8607
0180-1743 C:FXD TA 0. 1nF 10% 35VDCW
0160-2264 C:FXD CER 20pF 5% 500VDCW
0160-0417 C:FXD CER 150pF 10% 500VDCW
0121-0232 C:VAR AIR 12 - 460pF
0160-2238
0180-0291
0160-2251
0180-0116
0160-2266
0150-0093
04342-8604
NOT ASSIGNED
C:FXD CER 1.5pF 500VDCW
C:FXD TA OFF 10% 35VDCW
C:FXD CER 5. 6pF 500VDCW
C:FXD TA 6.8nF 10% 35VDCW
NOT ASSIGNED
C:FXD TA 1nF 10% 35VDCW
C:FXD TA 6.8pF 10% 35VDCW
C:FXD CER 24pF 5% 500VDCW
C:FXD CER 24pF 5% 500VDCW
C:FXD TA 6.8pF 10% 35VDCW
C:FXD CER 0. OlclF -20% +80% 1OOVDCW
COIL:VAR 9 - 14mH
COIL:VAR 11 - 15nI.I
See list of abbreviations in introduction to this section
6-3
Page 86

Section VI
Table 6-2
Model 4342A
Table 6-2. Reference Designation Index (Cont’d)
Reference
Designation
AlAlL 04342-8608
AlAlL 04342-8609
AlAlL
AlAlL
AlAlLlO
Al AlQl 1854-0071
AlAlQ2
AlAlQ3 1855-0022
AlAlQ4 1853-0034
AlAlQ5 1854-0019
Al AlQ6 1854-0019
AlAlRl* 0757-1094
AlAlR2* 0757-0417
AlAlR3*
Al AlR4* 0698-3488
Al AlR5* 0698-3446
Al AlRG*
AlAlRr 0698-3243
AlAlR8
AlAlR9 0698-3359
AlAlRlO 0757-0279
Part No. Description
9170-0029
9170-0029
9170-0029
1854-0092
0757-0411
0698-6324
0698-0085
Jote
COIL:VAR 1 - 1.3@
COIL:VAR 0. 09 - O.lpH
MAGNETIC CORE:BEAD FERRITE
MAGNETIC CORE :BE AD FERRITE
MAGNETIC CORE:BEAD FERRITE
TRANSISTOR:NPN SILICON
TRANSISTOR:NPN SILICON
TRANSISTOR:FIELD EFFECT N-CHANNEL
TRANSISTOR:PNP SILICON
TRANSISTOR:NPN SILICON
TRANSISTOR:NPN SILICON
R:FXD MET FLM 1.47kS2 1% 1/8W
R:FXD MET FLM 56252 1% 1/8W
R:FXD MET FLM 3320 1% 1/8W
R:FXD MET FLM 44252 1% 1/8W
R:FXD MET FLM 38352 1% 1/8W
R:FXD MET FLM 187a 1% 1/8W
R:FXD MET FLM 178kS2 1% 1/8W
R:FXD MET FLM 2.61kiZ 1% 1/8W
R:FXD MET FLM 12. 7k0 1% 1/8W
R:FXD MET FLM 3.16kS1 1% 1/8W
AlAlRll
AlAlRl2 0683-2265
AlAlRl3 0757-0123
AlAlR14 0757-0442
AlAlR15 0698-3156
AlAlR16 0698-3153
AlAlRlP 0698-3151
AlAlRl8
AlAlR19 0698-4125
Al AlR20* 0757-0401
AlAlR21
AlAlR22 0757-0346
AlAlR23
AlAlSl
Al AlXAlA
0698-3156
0698-4453
0757-0821
0757-0453
3101-0260
1251-0478
04342-1026
04342-3022
R:FXD MET FLM 14.7kfi 1% 1/8W
R:FXD COMP 22MS2 5% 1/4W
R:FXD MET FLM 34.8k52 1% 1/8W
R:FXD MET FLM 10kS-J 1% 1/8W
R:FXD MET FLM 14.7kS1 1% 1/8W
R:FXD MET FLM 3.83k0 1% 1/8W
R:FXD MET FLM 2.87kS2 1% 1/8W
R:FXD MET FLM 4020 1% 1/8W
R:FXD MET FLM 95351 1% 1/8W
R:FXD MET FLM 10052 1% 1/8W
R:FXD MET FLM 1.21kR 1% 1/2W
R:FXD MET FLM 1On 1% 1/8W.
R:FXD MET FLM 3O.lk51 1% 1/8W
SWITCH :PUSH BUTTON ‘I-RANGE
CONNECTOR:PRINTED CIRCUIT 12-CONTACT
MISCELLANEOUS
PLATE:ANGLE
NUT:HEX FOR FERRITE CORE 7 REQ’D
6-4
See list of abbreviations in introduction to this section
Page 87

Model 4342A
Section VI
Table 6-2
Table 6-2. Reference Designation Index (Cont’d)
Reference
Designation
AlA
AlA2Cl 0180-0116
AlA2C2 0180-0376
AlA2C3 0180-0116
AlA2C4 0180-0197
AlA2C5 0180-0116
AlA2C6 0160-2203
AlA2C7 0180-0116
AlA2Jl
AlA2Ll
AlA2L2 9140-0098 COIL:FXD RF 2. 21J.H 10%
AlA2L3 9170-0029 MAGNETIC CORE :BEAD FERRITE
AlA2L4 9170-0029 MAGNETIC CORE :BEAD FERRITE
Part No.
04342-7702 RF POWER AMPLIFIER ASS’Y
04342-8702 BOARD:BLANK PC
C:FXD TA 6.81~.F 10% 35VDCW
C:FXD TA 0.47pF 10% 35VDCW
C:FXD TA 6.8pF 10% 35VDCW
C:FXD TA 2.2wF 10% 20VDCW
C:FXD TA 6.81~.F 10% 35VDCW
C:FXD MICA 91pF 5% SOOVDCW
C:FXD TA 6.8uF 10% 35VDCW
1250-0257
9140-0158 COIL:FXD RF l@ 10%
CONNECTOR:RF FEMALE
Description Note
AlA2Ql 1854-0091 TRANSISTOR:NPN SILICON
AlA2Q2
AlA2Q3 1854-0091 TRANSISTOR:NPN SILICON
AlA2Q4
AlABRl 0757-0395 R:FXD MET FLM 56.251 1% 1/8W
AlA2R2 0698-0085 R:FXD MET FLM 2.61ka 1% 1/8W
AlA2R3 0698 -4422 R:FXD MET FLM 1.27ka 1% 1/8W
AlA2R4
AlA2R5 0757-0394 R:FXD MET FLM 51.151 1% 1/8W
AlA2R6 0698-4418
AlA2R7 0757-0294
AlA2R8
AlA2R9 0698-3439
AlABRlO 0698-3438
AlA2Rll 0698-3430
AlA2R12 0757-0159
AlA2R13 0698-3628
1854-0091 TRANSISTOR :NPN SILICON
1854-0332 TRANSISTOR :NPN SILICON
0757-0424 R:FXD MET FLM 1. lkS1 1% 1/8W
R:FXD MET FLM 20552 1% 1/8W
0757-0294
1205-0007
1205-0008
R:FXD MET FLM 17.8R 1% 1/8W
R:FXD MET FLM 17.852 1% 1/8W
R:FXD MET FLM 17852 1% 1/8W
R:FXD MET FLM 14752 1% 1/8W
R:FXD MET FLM 21.5S2 1% 1/8W
R:FXD MET FLM 1000$-Z 1% l/‘ZW
R:FXD MET OX 2200 5% 2W
MISCELLANEOUS
HEAT DISSIPATOR NUT
HEAT DISSIPATOR BODY
AlA
04342-8709 BOARD :WIRING
See list of abbreviations in introduction to this section
6-5
Page 88

Section VI
Table 6-2
Model 4342A
Table 6-2. Reference Designation Index (Cont’d)
Reference
Designation
AlCl
AlC2
AlC3
AlJl
AlJ2
AlJ3
Al Pl
AlWl
Part No.
0160-235’7 C:FXD CER 1OOOpF -20% +800/o
0160-2357 C:FXD CER 1OOOpF -20% +80%
0160-2357
1250-0083 CONNECTOR:BNC FEMALE
1250-0252 CONNECTOR:BNC FEMALE PART OF AlWl
1250-0050 NUT:RF CONNECTOR PART OF AlJ3
1250-0051
1250-0872 CONNECTOR:RF MALE PART OF AlWl
04342-7601 CABLE ASS’Y:INTER CONNECTING INCLUDING AlJ3 AND
C:FXD CER 1OOOpF -20% +80%
NOT ASSIGNED
CONTACT:RF CONNECTOR PART OF AlJ3
MISCELLANEOUS
See Figure 6-1.
Description
A
Note
lP3
6-6
See list of abbreviations in introduction to this section
Page 89

Model 4342A
Table 6-2. Reference Designation Index (Cont’d)
Section VI
Table 6-2
Reference
Designation
A2
A2Cl
A2C2
A2C3
A2C4
A2Jl
A2J2
A2J2
A2J3
A2J4
A2J5
Part No. Description
04342-7201
04342-7205
0140-0074
04342-3259
04342-3259
04342-3239
04342-3232
04342-3259
04342-3259
TUNING CAPACITOR ASS’Y* (See Note below).
C:VAR AIR MAIN 25 - 475pF
NOT SEPARATELY REPLACEABLE PART OF A2
C:VAR AIR VERNIER -5 - +5pF
NOTSEPARATELYREPLACEABLE PARTOFA2
C:FXD AIR 2pF INCLUDING C4
C:FKD MICA 56pF 10% 500VDCW
NOT SEPARATELY REPLACEABLE PART OF C3
NOT SEPARATELY REPLACEABLE
CAP:BINDING POST
NOT SEPARATELY REPLACEABLE
CAP:BINDING POST
CONNECTOR:HEXAGONALGROUNDLUG
BODY:GROUND LUG
NOT SEPARATELY REPLACEABLE
C AP:BINDING POST
NOT SEPARATELY REPLACEABLE
CAP :BINDING POST
Note
A2J6
A2Rl
A2Tl
04342-3239
04342-3232
0757-0398
04342-8601
04342-00602
04342-00601
CONNECTOR:HEXAGONALGROUNDLUG
BODY:GROUND LUG
R:FXD MET FLM 750 1% l/SW
TRANSFORMER:INJECTION
SCALE AC
SCALE C
MISCELLANEOUS
See Figure 6-2.
Note
Tuning Capacitor Ass’y Service Kit is available
with Part No. 04342-65001. This kit includes:
P/N 04342-7201: TUNING CAPACITOR ASS’Y
P/N 04342-00602: SCALE AC
P/N 04342-00601: SCALE C
P/N 04342-3267 : HEXAGONAL GND LUG
Pf N 04342-3259 :
P/N 04342-3256 : TERMINAL TEFLON
BINDING POST
See list of abbreviations in introduction to this section
6-7
Page 90

Section VI
Table 6-2
Model 4342A
Table 6-2. Reference Designation Index (Cont’d)
Reference
Designation
A3
A3Cl
A3CRl
A3Jl
A3J2
A3J3
A3J4
A3J5
A3Rl
A3R2
A3R3
A3R4
Part No. Description
04342-7703 Q RANGE ATTENUATOR ASS’Y
04342-8703 BOARD:BLANK PC
0160-2145 C:FXD CER 0.005yF -20% +80%
1901-0347
1250-0257
1250-0257
0757-0482
0698-2041
0698-2040
0698-2041
SEMICON DEVICE:DIODE HOT CARRIER
NOT ASSIGNED
NOT ASSIGNED
NOT ASSIGNED
CONNECTOR:RF FEMALE
CONNECTOR:RF FEMALE
R:FXD MET FLM 511kS2 1% 1/8W
R:FXD MET FLM 10.4dB *O. 1dB
R:FXD MET FLM 9.6dB i-0. 1dB
R:FXD MET FLM 10.4dB &O. 1dB
Note
A3Sl
A3S2
3101-0262
3101-0261
04342-1047
04342-i055
SWITCH:PUSH BUTTON 4-RANGE
SWITCH:PUSH BUTTON l-RANGE
MISCELLANEOUS
PLATE:SHIELD MOUNTED ON PC BOARD
BRACKET:SHIELD MOUNTED ON PC BOARD
See Figure 6-3.
6-8
See list of abbreviations in introduction to this section
Page 91

Model 4342A
Section VI
Table 6-2
Table 6-2. Reference Designation Index (Cont’d)
Reference
Designation
A4
A4Cl
A4C2
A4C3
A4Jl
A4J2
A4J3
A4J4
A4J5
A4J6
A4Ll
A4L2
A4Ql
A4Q2
Part No.
04342-7704
04342-8704
0180-0291
0150-0121
0180-0228
1250-025’7
9170-0029
9140-0098
1854-0091
1854-0332
Description Note
IMPEDANCE CONVERTER ASS’Y
BOARD:BLANK PC
C:FXD TA 1pF +lO% 35VDCW
C:FXD CER 0. 1pF -20% +80% 50VDCW
C:FXD TA 221~.F 10% 15VDCW
NOT ASSIGNED
NOT ASSIGNED
NOT ASSIGNED
NOT ASSIGNED
NOT ASSIGNED
CONNECTOR:RF FEMALE
MAGNETIC CORE:BEAD FERRITE
COIL:FXD RF 2.2pH 10%
TRANSISTOR:NPN SILICON
TRANSISTOR:NPN SILICON
A4Rl
A4R2
A4R3
A4R4
A4R5
0757-0395
0757-0417
0698-4431
0757-0159
0698-3628
1205-0007
1205-0008
04342-1223
R:FXD MET FLM 56.252 1% 1/8W
R:FXD MET FLM 562n 1% 1/8W
R:FXD MET FLM 2.05kS1 1% 1/8W
R:FXD MET FLM lka 1% 1/8W
R:FXD MET OX 220R 5% 2W
MISCELLANEOUS
HEAT DISSIPATOR NUT 1 REQ’D
HEAT DISSIPATOR BODY 1 REQ’D
PLATE
See list of abbreviations in introduction to this section
6-9
Page 92

Section VI
Table 6-2
Model 4342A
Table 6-2. Reference Designation Index (Cont’d)
Reference
Designation
A5
A5Cl 0160-2244
A5C2
A5C3 0180-0376
A5C4 0160-2259
A5C5
A5C6 0160-0128
A5C7
A5C8
A5C9
A5ClO 0180-0376
A5Cll 0160-0174
A5C12
A5C13 0140-0192
A5C14 0160-0128
A5C15
A5C16
A5C17
A5C18 0180-0376
A5C19
A5C20 0150-0121
Part No.
04342-7705 IMPEDANCE CONVERTER & RF AMPLIFIER ASS’Y
04342-8705
0180-1735
0180-1745
0160-0128
0160-0128
0160-0155
0160-0128
0160-2150
0121-0147
0160-0128
0160-0174
Description Note
BOARD :BLANK PC
C:FXD CER 3pF *O. 25pF
C:FXD TA 0.221~.F 10% 35VDCW
C:FXD TA 0.47pF 10% 35VDCW
C:FXD CER 12pF 5%
C:FXD TA 1.51_1F 10% 20VDCW
C:FXD CER 2.2pF 20% 25VDCW
C:FXD CER 2.21.1F 20% 25VDCw
C:FXD CER 2.21~.F 20% 25VDCW
C:FXD MY 0.0033~F 10% BOOVDCW
C:FXD TA 0.47kF 10% 35VDCW
C:FXD CER 0.47pF -20% +80% 25VDCW
C:FXD CER 2. ~/.IF 20% 25VDCW
C:FXD MICA 68pF 5% 300VDCW
C:FXD CER 2.21~.F 20% 25VDCW
C:FXD MICA 33pF 5% SOOVDCW
C:VAR AIR 2.0 - 19. 3pF
C:FXD CER 2.2pF 20% 25VDCW
C:FXD TA 0.47pF 10% 35VDCW
C:FXD CER 0.47pF -20% +80% 25VDCW
C:FXD CER 0. 1pF -20% +80% 50VDCW
A5C21 0180-0376
A5C22
A5C23 0180-0291
A5CRl
A5CR2 1910-0016 SEMICON DEVICE:DIODE GERMANIUM
A5CR3
A5CR4
A5CR5 1910-0016 SEMICON DEVICE :DIODE GERMANIUM
A5CR6 1910-0016 SEMICON DEVICE :DIODE GERMANIUM
A5Ll
A5L2 9140-0179
A5Ql
A5Q2
A5Q3
A5Q4
A5Q5
A5Q6
A5Q7
A5Q8
A5Q9
0180-0376
1901-0025 SEMICON DEVICE :DIODE SILICON
1910-0016 SEMICON DEVICE :DIODE GERMANIUM
1910-0016 SEMICON DEVICE :DIODE GERMANIUM
1855-0022 TRANSISTOR:FIELD EFFECT N-CHANNEL
1853-0015 TRANSISTOR:PNP SILICON 2N3640
1854-0023 TRANSISTOR :NPN SILICON
1854-0092 TRANSISTOR:NPN SILICON 2N3563
1854-0296 TRANSISTOR:NPN SILICON MPS6543
1854-0092 TRANSISTOR :NPN SILICON 2N3563
1853-0015 TRANSISTOR:PNP SILICON 2N3640
1854-0233 TRANSISTOR:NPN SILICON 2N3866
1854-0091 TRANSISTOR :NPN SILICON
C:FXD TA 0.47pF 10% 35VDCW
C:FXD TA 0.47j~F 10% 35VDCW
C:FXD TA ~/JF 10% 35VDCW
NOT ASSIGNED
COIL:FXD RF 22w 10%
6-10
See list of abbreviations in introduction to this section
Page 93

Model 4342A
Section VI
Table 6-2
Table 6-2. Reference Designation Index (Cont’d)
Reference
Designation
Part No.
Description
A5Rl 0757-0346 R:FXD MET FLM 1051 1% 1/8W
A5R2
0698-3151
R:FXD MET FLM 2.87kS2 1% 1/8W
A5R3 0757-0465 R:FXD MET FLM lOOka 1% l/GW
A5R4 0757-0465
A5R5
0698-2335
R:FXD MET FLM lOOkG! 1% 1,‘8W
R:FXD C FLM 28.lMs2 0.5% 1W
A5R6 0698 -0085 R:FXD MET FLM 2.61kS2 1% l/GW
A5R7 0698-3155 R:FXD MET FLM 4.64kSI 1% l/GW
A5R8 0757-0401 R:FXD MET FLM 10052 1% 1/8W
A5R9
A5RlO
0757-0441
0698-3150
R:FXD MET FLM 8.25ka 1% 1/8W
R:FXD MET FLM 2.37k9 1% 1/8W
A5Rll 0698-3439 R:FXD MET FLM 178G 1% 1/8W
A5R12
0698-0089
R:FXD MET FLM 1.78kD 1% 1/2W
A5R13 0698-3430 R:FXD MET FLM 21.5a 1% 1/8W
A5R14
0757-0346
R:FXD MET FLM 1Oa 1% 1/8W
A5R15 0698-3152 R:FXD MET FLM 3.48ka 1% 1,‘8W
A5R16 0757-0438 R:FXD MET FLM 5.llkG’ 1% 1/8W
A5R17
0757-0440 R:FXD MET FLM 7.5k&-? 1% 1/8W
A5R18 0757-0438 R:FXD MET FLM 5.llkS1 1% 1/8W
A5R19 0757-0422 R:FXD MET FLM 90952 1% 1/8W
A5R20
0757-0398
R:FXD MET FLM 7552 1% 1/8W
Note
A5R21 0757-0294 R:FXD MET FLM 17.8G? 1% l/GW
A5R22 0698 -4422 R:FXD MET FLM 1.27kS2 1% 1/8W
A5R23
A5R24
0757-0346
0757-0405
R:FXD MET FLM 1052 1% 1,‘GW
R:FXD MET FLM 162a 1% 1/8W
A5R25 0698-3409 R:FXD MET FLM 2.37kSl 1% 1/2W
A5R26 0757-0439 R:FXD MET FLM 6.81kS2 1% 1/8W
A5R27 0757-0290 R:FXD MET FLM 6.19kS1 1% 1/8W
A5R28
0757-0274
R:FXD MET FLM 1.21kS1 1% 1,‘GW
A5R29 0698-3434 R:FXD MET FLM 34.852 1% 1/8W
A5R30
0757-0419
R:FXD MET FLM 68152 1% 1/8W
A5R31 0757-0394 R:FXD MET FLM 51.10 1% 1/8W
A5R32 2100-1986 R:VAR MET FLM lkS2 10% 1/2W
A5R33
A5R34
A5R35
A5R36 0757-0379
0698-3430
0698-3700
0757-0814
R:FXD MET FLM 21.5a 1% 1/8W
R:FXD MET FLM 715G 1% 1/8W
R:FXD MET FLM 51152 1% 1/2W
R:FXD MET FLM 12.1s2 1% 1/8W
A5R37 0757-1092 R:FXD MET FLM 287fi 1% 1/2W
A5R38
0757-0346
R:FXD MET FLM 10R 1% 1/8W
A5R39 0757-0159 R:FXD MET FLM lkfi 1% 1/2W
A5R40 0698-3152 R:FXD MET FLM 3.48k52 1% l/GW
A5R4 1
A5R43
A5R44
A5R45
0757-0401
2100-0558
0698-3429
0698-3429
R:FXD MET FLM lOOa 1% l/GW
R:VAR CERMET 20kR 10% 1/2W
R:FXD MET FLM 19.652 1% 1/8W
R:FXD MET FLM 19.6a 1% 1/8W
0340-0008
9170-0029
See list of abbreviations in introduction to this section
INSULATOR-STAND OFF 2 REQ’D
MISCELLANEOUS
BEAD FERRITE
6-11
Page 94

Section VI
Table 6-2
Model 4342A
Table 6-2. Reference Designation Index (Cont’d)
Reference
Designation
A6
A6Cl
A6C2 0180-0116
A6C3
A6C4 0180-0197
A6C5 0180-0197
A6CRl
A6CR2
A6CR3
A6Ll
A6L2
A6Ql 1855-0081
A6Q2 1855-0049
A6Q3 1853-0010
A6Q4 1854-0023
A6Q5 1853-0010
Part No.
04342-7706 DC AMPLIFIER ASS’Y
04342-8706 BOARD :BLANK PC
0160-0127 C:FXD CER 1pF 20% 25VDCW
0180-0116 C:FXD TA 6.8pF 10% 35VDCW
1901-0025 SEMICON DE VICE :DIODE SILICON
1902-3097 SEMICON DEVICE :DIODE BREAKDOWN 5.23V 2% 400mW
1902-3097 SEMICON DEVICE :DIODE BREAKDOWN 5.23V 2% 400mW
9140-0179 COIL:FXD RF 221~.H 10%
9140-0179 COIL:FXD RF 22/~H 10%
Description
C:FXD TA 6.8yF 10% 35VDCW
C:FXD TA 2.2vF 10% BOVDCW
C:FXD TA 2.21~.F 10% BOVDCW
TRANSISTOR:FIELD EFFECT N-CHANNEL
TRANSISTOR:FIELD EFFECT N-CHANNEL DUAL
TRANSISTOR:PNP SILICON
TRANSISTOR:NPN SILICON
TRANSISTOR:PNP SILICON
Note
A6Rl
A6R2
A6R3
A6R4
A6R5
A6R6 2100-3352
A6R7 0698-3151
A6R8 0757-0416
A6R9 0757-0482
A6RlO
A6Rll 0757-0462
A6R12
A6R13 0757-0280
A6R14 0757-0439
A6R15 0757-0419
A6R16 0698-3136
A6R17 0757-0438
A6R18 0757-0419
A6R19 0757-0442
A6R20 0698-4037
0757-0442
2100-3356
0757-0401
2100-3351
0757-0439
0757-0401
0757-0442
R:FXD MET FLM lOkS2 1% 1/‘8W
R:VAR CERMET 200kR 10% 1/2W
R:FXD MET FLM 10052 1% 1/8W
R:VAR CERMET 500R 10% 1/2W
R:FXD MET FLM 6.81kS2 1% 1/8W
R:VAR CERMET 1kR 10% 1/2W
R:FXD MET FLM 2.87ka 1% 1/8W
R:FXD MET FLM 51152 1% 1/8W
R:FXD MET FLM 511kG 1% l/SW
R:FXD MET FLM 1000 1% 1/8W
R:FXD MET FLM 75k9 1% 1/8W
R:FXD MET FLM lOk0 1% 1,‘8W
R:FXD MET FLM IkG? 1% 1/8W
R:FXD MET FLM 6.81kB 1% 1/8W
R:FXD MET FLM 681G 1% 1/8W
R:FXD MET FLM 17.8k0 1% 1/8W
R:FXD MET FLM 5. llkfi 1% l/‘SW
R:FXD MET FLM 681W 1% 1,‘8W
R:FXD MET FLM 10kfi 1% 1/8W
R:FXD MET FLM 46.452 1% 1/8W
6-12
See list of abbreviations in introduction to this section
Page 95

Model 4342A
Section VI
Table 6-2
Table 6-2, Reference Designation Index (Cont’d)
Reference
Designation
A6R21
A6R22
A6R23
A6R24
A6R25
A6R26
A6R27
A6R28
A6R29
Part No.
2100-3349
0757-0462
0757-0401
0698 -0083
0698-0083
0698-4431
0698-0083
0698-0084
0757-0200
0757-0200
0757-0273
5040-5117
Description Note
R:VAR CERMET 1OOR 10% 1/2W
R:FXD MET FLM 75kf-Z 1% 1/8W
R:FXD MET FLM 1OOR 1% 1/8W
R:FXD MET FLM 1.96kS2 1% 1/8W
R:FXD MET FLM 1.96k0 1% 1/8W
R:FXD MET FLM 2.05kR 1% 1/8W
R:FXD
R:FXD
R:FXD MET FLM
R:FXD MET FLM 5.62kS-l 1% 1/8W
R:FXD MET FLM 3.01kR 1% 1/8W
1.96kR
10% 1/8W
2.15kR 10% 1/8W
5.62kR
1% 1/8W
MISCELLANEOUS
EXTRACTOR:BLUE 2 REQ’D
See list of abbreviations in introduction to this section
6-13
Page 96

Section VI
Table 6-2
Model 4 342A
Table 6-2. Reference Designation Index (Cont’d)
Reference
Designation
A7
A7Cl
A7C2 015020121
A7C3
A7C4 0180-0373
A7C5
A7C6 0160-0128 C:FXD CER 2.2pF 20% 25VDCW
A7C7 0160-0155 C:FXD MY 0.0033pF 10% BOOVDCW
A7C8 0180-0116 C:FXD TA 6.8yF 10% 35VDCW
A7CRl 1902-3059
A7CR2 1902-3234
A7CR3
A7CR4 1902-3149
A7CR5
A7CR6 1901-0025
Part No. Description Note
04342-7707 Q-LIMIT SELECTOR ASS’Y
04342-8707 BOARD :BLANK PC
0160-2964 C:FXD CER 0. OlpF -20% +80%
0160-0155 C:FXD MY 0.0033pF 10% 200VDCW
0180-0116 C:FXD TA 6.8pF 10% 35VDCW
1910-0016
1901-0025
C:FXD CER 0. 1pF -20% +80%
C:FXD TA 0. 68yF 10% 35VDCW
SEMICON DEVICE:DIODE BREAKDOWN 3.83V 5% 400mW
SEMICON DEVICE:DIODE BREAKDOWN 19.6V 5% 400mW
SEMICON DEVICE :DIODE GERMANIUM
SEMICON DEVICE:DIODE BREAKDOWN 9.09V 5% 400mW
SEMICON DEVICE :DIODE SILICON
SEMICON DEVICE :DIODE SILICON
A7Kl 0490-0214
A7Ll 9140-0210
A7L2 9140-0210
A7Ql 1855-0081
A7Q2
A7Q3 1854-0071
A7Q4
A7Q5 1854-0071
A7Q6 1854-0071
A7Q7 1854-0298
A7Q8 1854-0071
A7Q9 1854-0071
A7Rl
A7R2 0757-0280
A7R3 2100-3353
A7R4 0698-3157
A7R5 0757-0199
A7R6 0698-3245
A7R7 2100-3356
A7R8
A7R9
A7RlO
1855-0081
1854-0071
0757-1094
0698-3445
0698-3429
0757-0458
RELAY REED:DPST 8.7 - 22VDCW 0.5A, 15VA SRG-13A
COIL:FXD RF 1OOpH 5%
COIL:FXD RF 1OOpH 5%
TRANSISTOR:FIELD EFFECT N-CHANNEL
TRANSISTOR:FIELD EFFECT N-CHANNEL
TRANSISTOR :NPN SILICON 2N3391
TRANSISTOH:NPN SILICON 2N3391
TRANSISTOR:NPN SILICON 2N3391
TRANSISTOR :NPN SILICON 2N3391
TRANSISTOR :NPN SILICON
TRANSISTOR:NPN SILICON 2N3391
TRANSISTOR:NPN SILICON 2N3391
R:FXD MET FLM 1.47kfi 1% 1/8W
R:FXD MET FLM lka 1% 1,‘8W
R:VAR CERMET 20kR 10% 1/2W
R:FXD MET FLM 19.6k0 1% 1/8W
R:FXD MET FLM 21.5kSt 1% 1/8W
R:FXD MET FLM 20.5kS1 1% 1/8W
R:VAR CERMET 200kR 10% 1/2W
R:FXD MET FLM 34852 1% 1,‘8W
R:FXD MET FLM 19.6fi 1% li/8W
R:FXD MET FLM 5l.lkR 1% 1/8W
6-14
See list of abbreviations in introduction to this section
Page 97

Model 4342A
Section VI
Table 6-2
Table 6-2. Reference Designation Index (Cont’d)
Reference
Designation
A7Rll
A7R12 0757-0443
A7R13 0757-1094
A7R14 0757-0409
A7R15 0757-0440
A7R16
A7R17 075770433
A7R18 0757-0441
A7R19 0757-0289
A7R20
A7R21 0698-3158
A7R22 0757-0433
A7R23 0757-0279
A7R24
A7R25 0698-3158
A7R26 0698-3160
A7R27
A7R28 0698-3160
A7R29 0757-0416
A7R30
Part No.
0698-4207
0698-3136
0698-3460
0690-6811
0757-0346
0698-3136
Description
R:FXD MET FLM 44. 2kS2 1% 1/8W
R:FXD MET FLM llkS2 1% 1/8W
R:FXD MET FLM 1.47kS2 1% 1/8W
R:FXD MET FLM 274a 1% 1/8W
R:FXD MET FLM 7.5kR 1% l/‘SW
R:FXD MET FLM 17.8ka 1% 1/8W
R:FXD MET FLM 5.llkS2 1% 1/8W
R:FXD MET FLM 8.25k53 1% 1/8W
R:FXD MET FLM 13.3k52 1% 1/8W
R:FXD MET FLM 422kR 1% 1/8W
R:FXD MET FLM 23. 7ka 1% 1/8W
R:FXD MET FLM 3.32kfl 1% 1/8W
R:FXD MET FLM 3.16ka 1% 1/8W
R:FXD COMP 6809 10% 1W
R:FXD MET FLM 23.7kS1 1% 1/8W
R:FXD MET FLM 31.6kS2 1% 1/8W
R:FXD MET FLM 1052 1% 1/8W
R:FXD MET FLM 31.6kR 1% 1,‘8W
R:FXD MET FLM 511a 1% 1/8W
R:FXD MET FLM 17.8k9 1% 1/8W
Note
A7R31
0698 -3400
5040-5118
R:FXD MET OX 14752 1% li2W
MISCELLANEOUS
EXTRACTOR:VIOLET 2 REQ’D
See list of abbreviations in introduction to this section
Page 98

Section VI
Table 6-2
Model 4342A
Table 6-2. Reference Designation Index (Cont’d)
Reference
Designation
A8
A8Cl
A8 c2
A8C3
A8C4
A8C5
A8C6 0180-0097
A8C7 0180-0982
A8C8
A8C9 0180-1735
A8C10
A8CRl 1901-0026
A8CR2 1901-0026
A8CR3
A8CR4 1901-0026
A8CR5
Part No.
04342-7708 POWER SUPPLY & ALC AMPLIFIER ASS’Y
04342-8708 BOARD:BLANK PC
0150-0121 C:FXD CER 0. 1nF -20% +80% 50VDCW
0180-0291
0180-0097 C:FXD TA 47/.~F 10% 35VDCW
0150-0121
0180-0291 C:FXD TA 1nF 10% 35VDCW
0180-0982
0180-1735
1901-0026
1902-0041
Description
C:FXD TA 1pF 10% 35VDCW
C :FXD CER 0. 1lF -20% +80% 50VDCW
C:FXD TA 47yF 10% 35VDCW
C:FXD ELECT 1pF -10% +lOO% 250VDCW
C:FXD ELECT 1nF -10% +lOO% 250VDCW
C:FXD TA 0.22nF 10% 35VDCW
C:FXD TA 0.22pF 10% 35VDCW
SEMICON DEVICE :DIODE SILICON
SEMICON DEVICE :DIODE SILICON
SEMICON DEVICE :DIODE SILICON
SEMICON DEVICE :DIODE SILICON
SEMICON DEVICE:DIODE BREAKDOWN 5.11V 5% 400mW
Note
A8CR6 1901-0025
A8CR7 1901-0025
A8CR8 1901-0025
A8CR9 1901-0025
A8CRlO 1901-0026
A8CRll 1901-0026
A8CR12 1901-0026
A8CR13 1901-0026
A8CR14
A8CR15
A8CR16 1901-0025
A8CR17 1910-0016
A8CR18 1902-0041
A8CR19
A8CR20 1901-0026
A8CR21 1901-0026
A8CR22 1902-3182
A8Ql
A8Q2
A8Q3
A8Q4
A8Q5
1901-0025
1901-0025
1901-0025
1854-0039 TRANSISTOR:SILICON NPN 2N3053
1854-0071 TRANSISTOR:SILICON NPN 2N3391
1854-0215 TRANSISTOR :SILICON NPN 2N3904
1854-0215 TRANSISTOR:SILICON NPN 2N3904
1854-0071 TRANSISTOR:SILICON NPN 2N3391
SEMICON DEVICE :DIODE SILICON
SEMICON DEVICE :DIODE SILICON
SEMICON DEVICE :DIODE SILICON
SEMICON DEVICE:DIODE SILICON
SEMICON DEVICE :DIODE SILICON
SEMICON DEVICE :DIODE SILICON
SEMICON DEVICE :DIODE SILICON
SEMICON DEVICE :DIODE SILICON
SEMICON DEVICE :DIODE SILICON
SEMICON DEVICE :DIODE SILICON
SEMICON DEVICE:DIODE SILICON
SEMICON DEVICE:DIODE GERMANIUM
SEMICON DEVICE:DIODE BREAKDOWN 5.11V 5% 400mW
SEMICON DEVICE :DIODE SILICON
SEMICON DEVICE :DIODE SILICON
SEMICON DEVICE :DIODE SILICON
SEMICON DEVICE:DIODE BREAKDOWN 12.1V 5% 400mW
6-16
See list of abbreviations in introduction to this section
Page 99

Model 4342A
Section VI
Table 6-2
Table 6-2. Reference Designation Index (Cont’d)
Reference
Designation
A8Q6 1854-0039
A8Q7 1854-0071
A8Q8 1854-0071
A8Q9 1855-0049
A8QlO 1853-0036
A8Qll 1854-0071
A8Q12 1853-0036
A8Q13 1853-0036
A8Rl
A8R2 0757-0288
A8 R3 0757-0346
A8 R4 0813-0029
A8R5 0698 -0084
A8R6 0757-0442
A8R7 0757-0439
A8R8 0698-4433
A8R9
A8RlO 0757-0442
Part No.
0813-0029
0757-0442
Description
TRANSISTOR:SILICON NPN 2N3053
TRANSISTOR:SILICON NPN 2N3391
TRANSISTOR:SILICON NPN 2N3391
TRANSISTOR:FIELD EFFECT N-CHANNEL DUAL
TRANSISTOR:SILICON PNP 2N3906
TRANSISTOR:SILICON NPN 2N3391
TRANSISTOR :SILICON PNP 2N3906
TRANSISTOR:SILICON PNP 2N3906
R:FXD WW la 10% 3W
R:FXD MET FLM 9.09kSZ 1% 1/8W
R:FXD MET FLM 1Ofl 1% 1/8W
R:FXD WW la 10% 3W
R:FXD MET FLM 2.15k51 1% 1/8W
R:FXD MET FLM lOkS2 1% 1/8W
R:FXD MET FLM 6.81kS1 1% 1/8W
R:FXD MET FLM 2.26ka 1% 1/8W
R:FXD MET FLM lOk52 1% 1/8W
R:FXD MET FLM lOkS2 1% 1/8W
Note
A8Rll
A8Rl2
A8Rl3
A8Rl4 0813-0029
A8R15 0698-3447
A8Rl6
A8Rl7
A8R18
A8R19 0757-0442
A8R20
A8R21 2100-3352
A8R22 0698-4020
A8R23
A8R24 0698-3412
A8R25 0698-4477
A8R26 2100-3352
A8R27 0757-0401
A8R28 0683-1055
A8R29 0698-4511
A8R30 0757-0453
A8R31
A8R32
A8R33
A8R34
A8R35
0757-0441
2100-3352
0698-4431
0698-0084
0698-4020
0698-3158
0698-3156
0813-0029
0757-0470
0757-0442
0757-0280
0757-0444
0757-0442
R:FXD MET FLM 8.25ka 1% 1/8W
R:VAR CERMET 1kR 10% 1/2W
R:FXD MET FLM 2.05kS2 1% 1/8W
R:FXD WW 152 10% 3W
R:FXD MET FLM 422n 1% 1/8W
R:FXD MET FLM 2.15kQ 1% 1/8W
R:FXD MET FLM 9.53kS2 1% 1/8W
R:FXD MET FLM 23. 7kf-z 1% 1/8W
R:FXD MET FLM lOkS2 1% 1/8W
R:FXD MET FLM 14.7ka 1% 1/8W
R:VAR CERMET lkR 10% l/2W
R:FXD MET FLM 9.53kfi 1% 1/8W
R:FXD WW lS2 10% 3W
R:FXD MET FLM 3.83kfi 1% 1/2W
R:FXD MET FLM 10.5k52 1% 1/8W
R:VAR CERMET 1kR 10% 1/2W
R:FXD MET FLM 1000 1% 1/8W
R:FXD COMP 1Mfi 5% 1/4W
R:FXD MET FLM 86.6k8 1% 1/8W
R:FXD MET FLM 30.lkS1 1% 1/8W
R:FXD MET FLM 162k52 1% 1/8W
R:FXD MET FLM lOkS2 1% 1/8W
R:FXD MET FLM lka 1% 1/8W
R:FXD MET FLM 12. lkn 1% 1/8W
R:FXD MET FLM 10ka 1% 1/8W
See list of abbreviations in introduction to this section
6-17
Page 100

Section VI
Table 6-2
Model 4342A
Table 6-2, Reference Designation Index (Cont’d)
Reference
Designation
A8R36
A8R37
A8R38
A8R39
A8R40
A8R41
A8R42
A8R43
A9
A10
Part No. Description
0757-0280
0757-0200
0757-0453
0757-0438
0698-3157
0683-1055
0757-0482
0757-0461
5040-4592
04342-7710
04342-8710
R:FXD MET FLM lkS2 1% 1/8W
R:FXD MET FLM 5.62kfl 1% 1/8W
R:FXD MET FLM 30.lkS2 1% 1/8W
R:FXD MET FLM 5. llkfl 1% 1/8W
R:FXD MET FLM 19.6kS2 1% 1/8W
R:FXD COMP 1Ma 5% 1/4W
R:FXD MET FLM 511kR 1% 1/8W
R:FXD MET FLM 68. lkn 1% 1/8W
MISCELLANEOUS
EXTRACTOR:GRAY 2 REQ’D
NOT ASSIGNED
FREQUENCY MULTIPLIER AND OVER LIMIT INDICATOR ASS’Y
BOARD:BLANK PC
Note
AlODSl
AlODSX
AlODS3
AlODS4
AlODS5
AlORl
All
Al lDS1
Al lDS2
Al lDS3
Al lDS4
2140-0037
2140-0037
2140-0037
2140-0037
2140-0037
0698-3402
04342-5022
04342-7711
04342-8711
2140-0123
2140-0123
2140-0123
2140-0123
5040-3313
LAMP:INCD 28V 0.04A
LAMP:INCD 28V 0.04A
LAMP:INCD 28V 0.04A
LAMP:INCD 28V 0.04A
LAMP:INCD 28V 0.04A
R:FXD MET FLM 3160 1% 1/2W
MISCELLANEOUS
SEPARATOR.LAMP
METER SCALE INDICATOR ASS’Y
BOARD:BLANK PC
LAMP:NEON
LAMP :NEON
LAMP :NEON
LAMP:NEON
MISCELLANEOUS
HOLDER:LAMP
6-18
See list of abbreviations in introduction to this section
 Loading...