

Page 1
DEH–027
32:(5/($'(5706\VWHP
0RGEXV
8VHU¶V*XLGH
0RQLWRU
Page 2

WARNINGS
CAUTIONS
NOTES
DEH–027
WARNINGS, CAUTIONS, AND NOTES
AS USED IN THIS PUBLICATION
Warning notices are used in this publication to emphasize that hazardous voltages, currents, or
other conditions that could cause personal injury exist in this equipment or may be associated
with its use.
Warning notices are also used for situations in which inattention or lack of equipment
knowledge could cause either personal injury or damage to equipment.
Caution notices are used for situations in which equipment might be damaged if care is not
taken.
Notes call attention to information that is especially significant to understanding and operating
the equipment.
This document is based on information available at the time of its publication. While efforts
have been made to ensure accuracy, the information contained herein does not cover all details
or variations in hardware and software, nor does it provide for every possible contingency in
connection with installation, operation, and maintenance. Features may be described herein that
are not present in all hardware and software systems. GE Industrial Systems assumes no
obligation of notice to holders of this document with respect to changes subsequently made.
REFERENCES
GE Industrial Systems makes no representation or warranty, expressed, implied, or statutory,
with respect to, and assumes no responsibility for the accuracy, completeness, sufficiency, or
usefulness of the information contained herein. No warrantees of merchantability or fitness for
purpose shall apply.
For details of the Modbus RTU protocol, refer to PI-MBUS-300 Rev. E from Modicon/AEG
Schneider Automation. For details of RS-485 communications, refer to the EIA-485 standard.
POWER LEADER™ is a trademark of General Electric Company.
Modbus RTU® is a registered trademark of AEG Schneider Automation.
Modbus® is a registered trademark of Modicon Inc.
Windows and Windows NT are registered trademarks of Microsoft Corporation.
© Copyright 1999 GE Company
All Rights Reserved
Page 3

POWER LEADER Modbus Monitor
................................
................................
................................
................................
..........
................................
................................
................................
................................
...........
................................
................................
................................
................................
.....
Table of Contents
CHAPTER 1 INTRODUCTION
Overview.....................................................................................................................................................................................1
Theory of Operation..................................................................................................................................................................2
PMCS operation ...................................................................................................................................................................2
Monitor operation with PMCS .............................................................................................................................................3
Monitor stand-alone operation..............................................................................................................................................3
Multiple Modbus Monitors...................................................................................................................................................3
Supported Devices......................................................................................................................................................................4
Typical Network Configurations..............................................................................................................................................6
Physical Description ..................................................................................................................................................................7
Specifications..............................................................................................................................................................................8
Environmental............................................................................................................................................................................8
Catalog Numbers .......................................................................................................................................................................8
CHAPTER 2 INSTALLATION
Valid Network Architectures....................................................................................................................................................9
Mounting ....................................................................................................................................................................................9
Control Power Connections....................................................................................................................................................10
Grounding...........................................................................................................................................................................10
RS-485 Connection(s)..............................................................................................................................................................10
RS-485 Termination Considerations...................................................................................................................................11
Software Installation ...............................................................................................................................................................12
Modbus Monitor Configuration Tool .................................................................................................................................12
Modbus Monitor Proxy.......................................................................................................................................................13
Maintenance.............................................................................................................................................................................13
1
9
CHAPTER 3 CONFIGURATION
Modbus Monitor Configuration Tool....................................................................................................................................15
Notes on Modbus Monitor Configuration Tool Keyboard Interface ..................................................................................17
Device Table.......................................................................................................................................................................18
Groups ................................................................................................................................................................................21
Communication Timeout Setting........................................................................................................................................22
Port Configuration Settings.................................................................................................................................................22
Advanced Configuration.........................................................................................................................................................22
Read Files from a Monitor..................................................................................................................................................22
Write Files to a Monitor .....................................................................................................................................................24
Print Files............................................................................................................................................................................24
PC to Monitor Connection......................................................................................................................................................25
PC-Monitor Communications.................................................................................................................................................25
Monitor Setup Menu ...............................................................................................................................................................26
Program Upgrade................................................................................................................................................................26
Screen Saver Configuration................................................................................................................................................26
Set Password.......................................................................................................................................................................27
RS-485 Port Configuration.................................................................................................................................................27
Auto-Detection for SLT......................................................................................................................................................27
Set Date & Time.................................................................................................................................................................27
15
i
Page 4

POWER LEADER Modbus Monitor
................................
................................
................................
................................
..............
................................
................................
................................
.................
................................
................................
................................
..................
................................
................................
................................
................
................................
................................
................................
...........................
................................
................................
................................
..
................................
........
................................
................................
..............
................................
................................
................................
................................
................................
....
Table of Contents
CHAPTER 4 OPERATION
Introduction..............................................................................................................................................................................29
Keypad/Menu Navigation .......................................................................................................................................................29
Main Menu...............................................................................................................................................................................29
Look at a Device.................................................................................................................................................................30
Look at the Local Event Log...............................................................................................................................................32
PMCS Event Log................................................................................................................................................................33
Notes on Password Protection.................................................................................................................................................30
Using the Modbus Monitor with PMCS ................................................................................................................................33
CHAPTER 5 ERRORS AND DIAGNOSTICS
CHAPTER 6 TROUBLESHOOTING GUIDE
CHAPTER 7 ADVANCED CONFIGURATION
Step 1: Define a New Device Type..........................................................................................................................................41
Step 2: Define the Device Type as Hybrid or Generic .........................................................................................................42
Step 3: Create the Device Type’s Register Map...................................................................................................................42
Add Register.......................................................................................................................................................................43
Modify Register..................................................................................................................................................................43
Delete Register....................................................................................................................................................................43
Utilized Register Block List (URBL)......................................................................................................................................43
Step 4. Customize the Display.................................................................................................................................................44
Notes on Hybrid/Generic Device Types .................................................................................................................................45
Special Handling Registers.................................................................................................................................................45
Hybrid Device Types..........................................................................................................................................................45
Generic Device Types.........................................................................................................................................................46
Defining Hybrid and Generic Device Types.......................................................................................................................46
Defining the Register Set....................................................................................................................................................46
29
35
37
41
APPENDIX A: MODBUS PROTOCOL
Implementation Basics.............................................................................................................................................................49
Modbus RTU Message Format...............................................................................................................................................49
CRC-16 Algorithm..............................................................................................................................................................50
Message Framing and Timing.................................................................................................................................................50
Register Groupings..................................................................................................................................................................50
Data Conventions.....................................................................................................................................................................51
Format for Floating Point and Long Integer Data Types ....................................................................................................51
APPENDIX B: MODBUS MONITOR REGISTER MAP
APPENDIX C: REGISTER DATA FORMATS SUPPORTED BY THE MODBUS MONITOR
APPENDIX D: SUPPORTED FIRMWARE REVISIONS FOR TID’S
GLOSSARY
ii
49
53
55
51
60
Page 5

POWER LEADER Modbus Monitor
List of Figures and Tables
List of Figures
Figure 1. POWER LEADER Modbus Monitor. ...............................................................................................................1
Figure 2. PMCS DDE communications cycle...................................................................................................................2
Figure 3. Monitor Proxy and PMCS DDE communications.............................................................................................3
Figure 4. Monitor acting as master to a network of POWER LEADER devices. ............................................................6
Figure 5. Typical PMCS network incorporating Monitor. ...............................................................................................6
Figure 6. Front view of Monitor, showing dimensions.....................................................................................................7
Figure 7. Side view of the Monitor, showing dimensions and connections.....................................................................7
Figure 8. Valid Modbus Monitor network architectures. .................................................................................................9
Figure 9. Cutout pattern for mounting the Monitor........................................................................................................10
Figure 10. RS-485 port and RS-485 connector pinouts..................................................................................................11
Figure 11. RS-485 Terminations.....................................................................................................................................11
Figure 12. RS-485 network wiring..................................................................................................................................12
Figure 13. Removing the cooling fan filter.....................................................................................................................13
Figure 14. Configuration Tool main screen....................................................................................................................16
Figure 15. Configuration Tool View dialog. ..................................................................................................................16
Figure 16. New Configuration screen.............................................................................................................................17
Figure 17. Port Configuration screen..............................................................................................................................17
Figure 18. Modify Configuration screen. .......................................................................................................................18
Figure 19. Configuration Tool Device Table screen. .....................................................................................................18
Figure 20. Add a Network Device dialog. ......................................................................................................................19
Figure 21. Select PMCS Topic File dialog.....................................................................................................................20
Figure 22. PMCS Configuration information screen......................................................................................................20
Figure 23. AutoDetect dialog box...................................................................................................................................20
Figure 24. Configuration Tool Group Configuration screen..........................................................................................21
Figure 25. Add New Group screen. ................................................................................................................................21
Figure 26. Modify Groups screen...................................................................................................................................22
Figure 27. Configuration Tool Operational Parameters screen......................................................................................22
Figure 28. Monitor Configuration Tool: Read Configuration dialog.............................................................................22
Figure 29. Device Types Result Log. .............................................................................................................................24
Figure 30. Monitor Configuration Tool Write Configuration dialog. ............................................................................24
Figure 31. Monitor Configuration Tool’s Print dialog...................................................................................................25
Figure 32. PC to Monitor RS-232 connection. ...............................................................................................................25
Figure 33. Monitor Main menu.......................................................................................................................................25
Figure 34. Monitor Setup menu......................................................................................................................................26
Figure 35. Monitor Keypad.............................................................................................................................................29
Figure 36. Monitor Main menu (details).........................................................................................................................29
Figure 37. Monitor View menu.......................................................................................................................................30
Figure 38. Device Groups screen....................................................................................................................................30
Figure 39. Monitor Devices list......................................................................................................................................31
Figure 40. Device Data screen........................................................................................................................................31
Figure 41. Monitor View Devices menu structure..........................................................................................................32
Figure 42. Sample Event Log screen. .............................................................................................................................32
Figure 43. Monitor Diagnostics Menu............................................................................................................................35
Figure 44. Monitor Configuration Tool: New Device Type dialog................................................................................41
iii
Page 6

POWER LEADER Modbus Monitor
Figures and Tables
Figure 45. Save As.... dialog box....................................................................................................................................42
Figure 46. Monitor Configuration Tool: Modify Device Types dialog. ........................................................................42
Figure 47. Monitor Configuration Tool: Register Map dialog.......................................................................................42
Figure 48. Monitor Configuration Tool: Add Register dialog box................................................................................43
Figure 49. Customize Display dialog box. .....................................................................................................................44
Figure 50. Assign/Unassign Registers dialog.................................................................................................................44
Figure 51. Insert Screen dialog.......................................................................................................................................45
List of Tables
Table 1. Devices supported by the Monitor. ....................................................................................................................5
Table 2. Monitor specifications........................................................................................................................................8
Table 3. Monitor environmental requirements.................................................................................................................8
Table 4. Monitor catalog numbers....................................................................................................................................8
Table 5. Device firmware revisions supported by the Modbus Monitor........................................................................59
iv
Page 7
POWER LEADER Modbus Monitor
Chapter 1
Introduction
Chapter 1 – Introduction
Overview
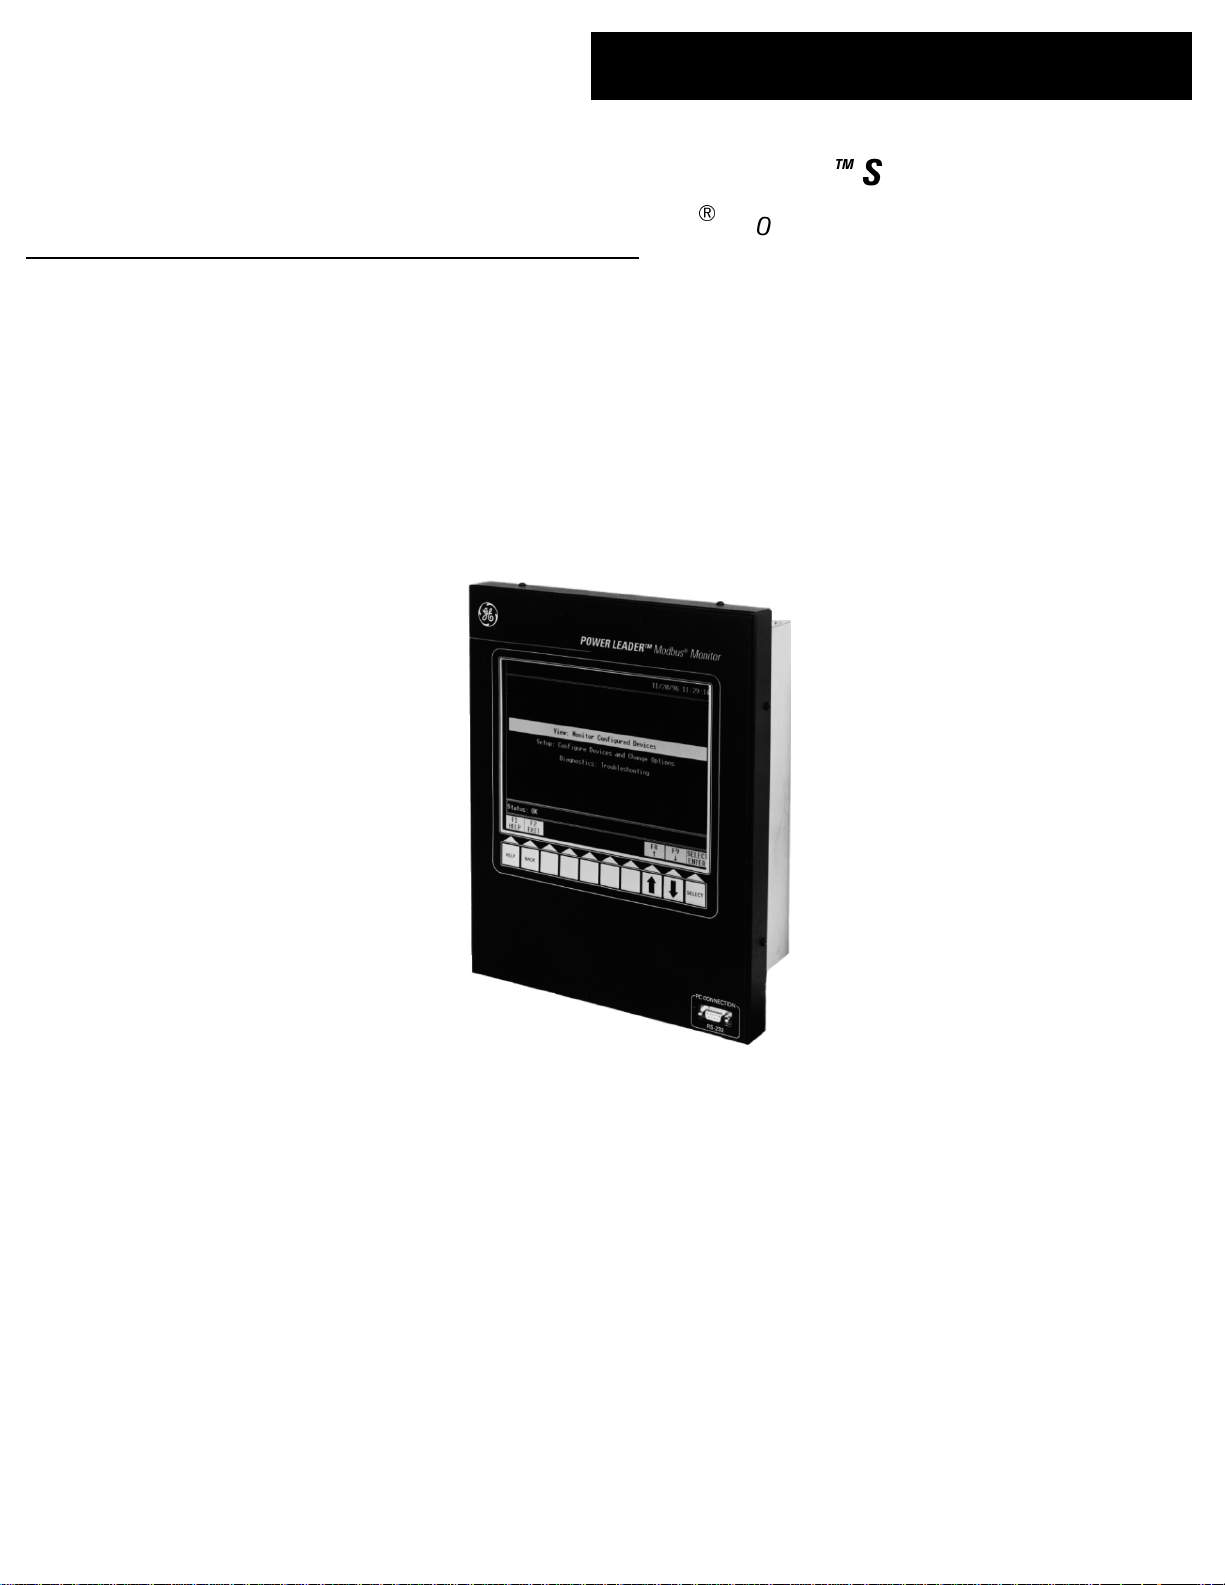
The GE POWER LEADER Modbus Monitor, shown in
Figure 1, is a microprocessor-based device that connects
to an industry-standard Modbus RTU network,
implemented on RS-485 wiring. The Monitor tracks
metering and status information collected by GE
POWER LEADER power management devices and a
variety of third-party power management devices. The
Monitor provides a convenient station for viewing of
data from remote devices.
Figure 1. POWER LEADER Modbus Monitor.
Modbus RTU networks are designed on a master-slave
architecture. Only one master per network is permitted.
The master queries the slaves when it needs their data,
and slave devices may only communicate on the network
in response to a request from the master.
The Monitor can operate in either of two roles. First, it is
capable of acting as a master on one or two Modbus
segments of power management devices, collecting data
from the devices for local display, as shown in Figure 4.
Second, it is capable of behaving as a “second-incommand” to GE’s Power Management Control System
(PMCS), as shown in Figure 5. In this role, the Monitor
resides on the RS-485 network with other POWER
LEADER devices, performing its monitoring duties but
behaving as a slave device to the PMCS master.
However, if the master is disabled for some reason,
perhaps a computer problem or a power failure at the
host PC, the Monitor will immediately and transparently
assume the role of master to the other devices.
NOTE: The POWER LEADER Modbus Monitor is
compatible only with GE Power Management Control
System software, version 5.1, version 6.0 or greater. It is
not certified to be compatible with any other host
software.
Once installed and wired to control power and network
connections, the Monitor must be configured for
communications (Modbus address, baud rate, etc.) on the
RS-485 network. It must also be configured with the
identity and type of the other network devices. This
configuration is performed using a software application,
the Modbus Monitor Configuration Tool, running on a
PC. When you are ready to download the configuration
to a Monitor, you’ll connect the PC to the
communications port on the Monitor’s front panel using
an RS-232 straight-through cable (provided with
Monitor).
NOTE: In this manual, the term SEGMENT or
MODBUS SEGMENT will refer to a single RS-485
communications network operating under the Modbus
protocol. A Monitor may be connected to one or two
Modbus segments, depending on whether it is a single or
dual port version.
1
Page 8
POWER LEADER Modbus Monitor
Chapter 1 – Introduction
Theory of Operation
As mentioned previously, the POWER LEADER
Modbus Monitor has two modes of operation. It can
operate as a stand-alone master to one or two Modbus
segments of compatible devices or it may operate in
conjunction with the GE Power Management Control
System (PMCS) software. In this second mode, the
Monitor collects the data it needs to display and also
watches for the PMCS to go off-line. If for some reason
the Monitor does not sense the PMCS being online as
Modbus master, the Monitor will immediately and
transparently assume the role of master on the Modbus
segment(s).
We’ll explain briefly how PMCS operates, and then the
relationship of the Monitor to the PMCS, and finally the
operation of the Monitor independent of PMCS.
PMCS operation
The GE Power Management Control System consists of
four basic parts: (1) power management devices, (2) an
RS-485 network (“Modbus segment”) connecting these
devices to (3) a host computer running GE’s Power
Management Control System software and a Dynamic
Data Exchange (DDE) server, which monitors the
devices for data requested by (4) client software
programs, and feeds this data back to the clients
requesting it.
The power management devices vary in complexity and
intended use, but in general their function is similar: they
collect data on specific electrical metered, status and
event parameters (volts, amps, power consumption,
peaks, trips, etc.). The various information they monitor
is recorded in specific memory locations called registers.
Registers are organized by address. The complete list of
a devices’ registers, their addresses and their contents is
referred to as a register map.
PMCS has been preprogrammed with the register maps
of a variety of GE and third party devices. When the user
configures PMCS with the details of what devices are
connected to his network, the software automatically
associates the appropriate register map with the given
device type. This enables the software to locate
information in a device based on its type.
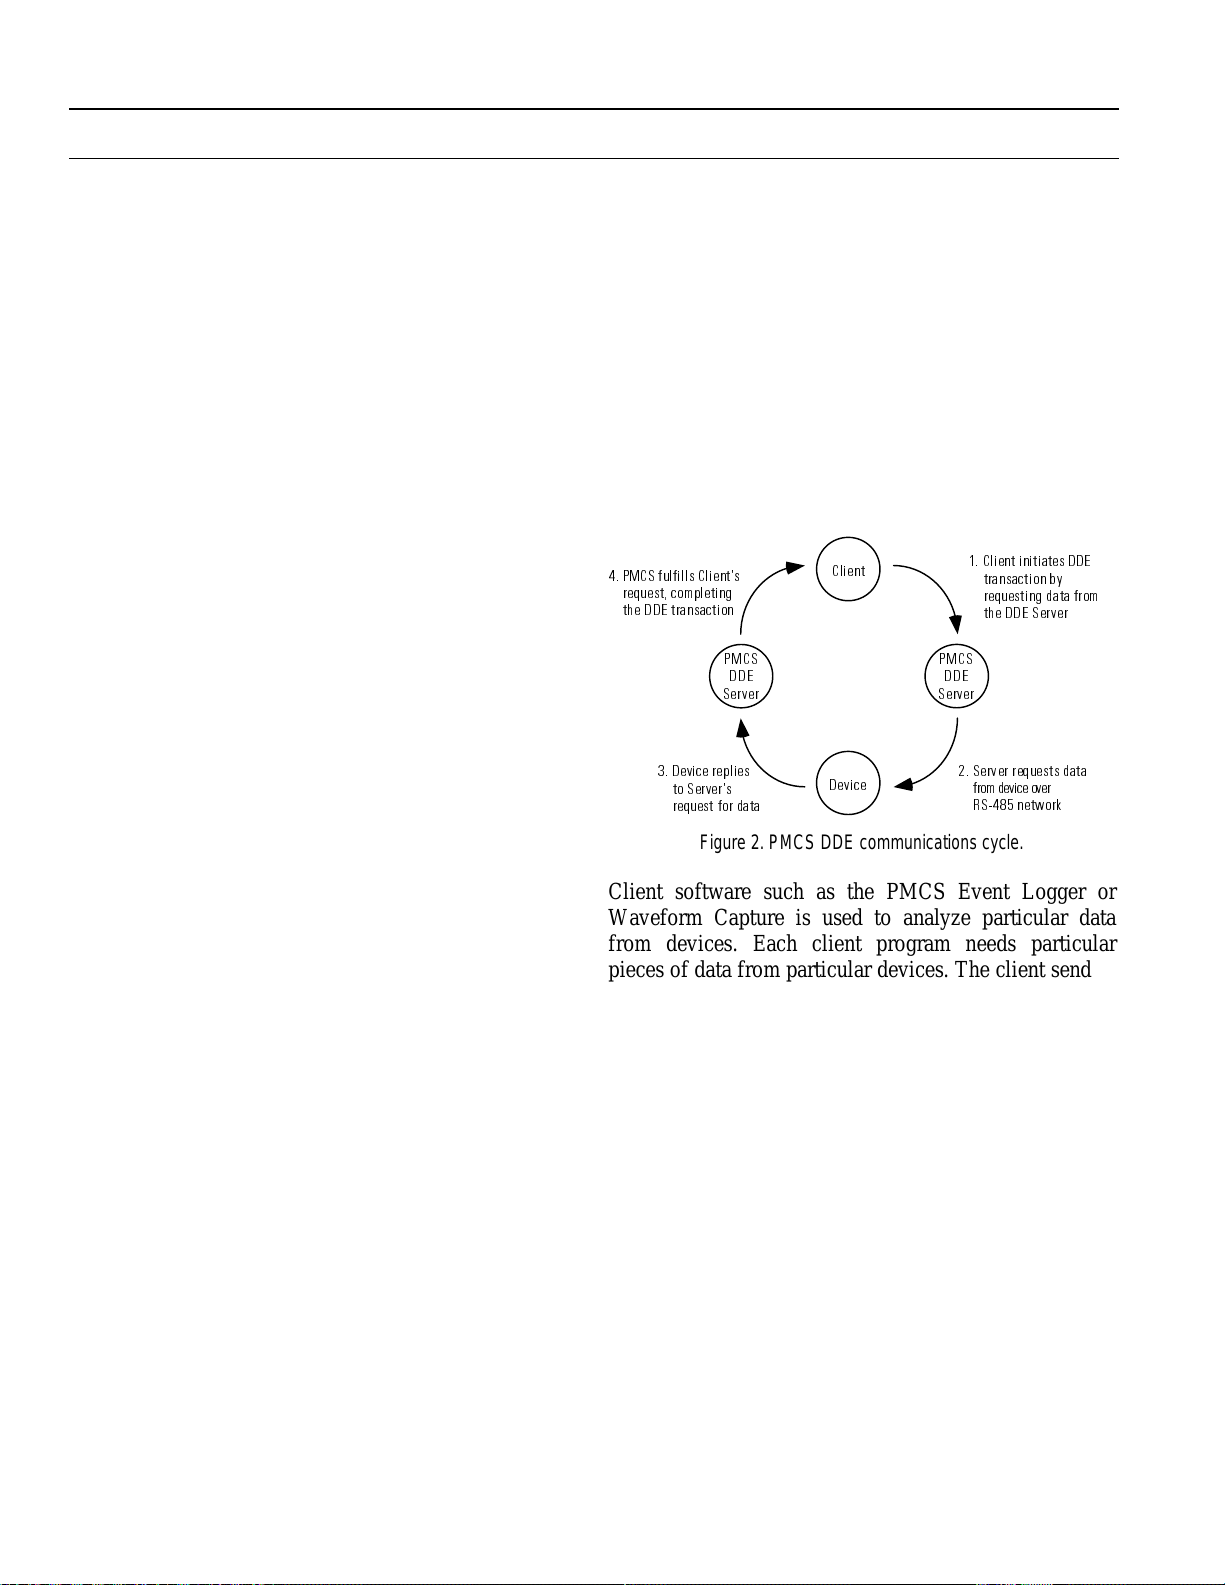
PMCS operates using a client-server architecture called
DDE - Dynamic Data Exchange. DDE is a means of
exchanging information between software programs
operating on a PC. Client programs request information
from a Server program; the Server program fills these
requests. In the case of the PMCS DDE Server, these
requests are for power management information being
gathered by physical power management devices on
Modbus segments connected to the PC. An example of
PMCS DDE communications is shown in Figure 2.
30&6 IXOILOOV &OLHQWV
UHTXHVW F RP SOH WL QJ
WKH ''( WUDQVD FW L RQ
30&6
6HUYHU
'HYLFH UHS OL HV
WR 6HUYHU V
UHTXHVW IRU GD WD
Figure 2. PMCS DDE communications cycle.
&OLHQW
''(
'HYLFH
&OLHQW LQLWLDWHV ''(
WUDQVDFWLRQ E\
UHTXHVWLQJ GDWD IURP
WKH ''( 6HUYHU
30&6
''(
6HUYHU
6HUYHU UHTXHVW V GDWD
IURPGHYLFH RYHU
56 QHWZRUN
Client software such as the PMCS Event Logger or
Waveform Capture is used to analyze particular data
from devices. Each client program needs particular
pieces of data from particular devices. The client sends a
DDE request to the Server, the Server queries the
devices for the requested information, and when it has
received the information from the devices, it replies to
the client’s request with the desired information.
An important aspect of DDE is its ‘dynamic’ nature;
once a client has requested information from the Server,
a ‘DDE link’ to that data is established. The Server will
continue to monitor that information and, if any changes
occur, will forward the new data to the client.
2
Page 9
Monitor operation with PMCS
POWER LEADER Modbus Monitor
Chapter 1 – Introduction
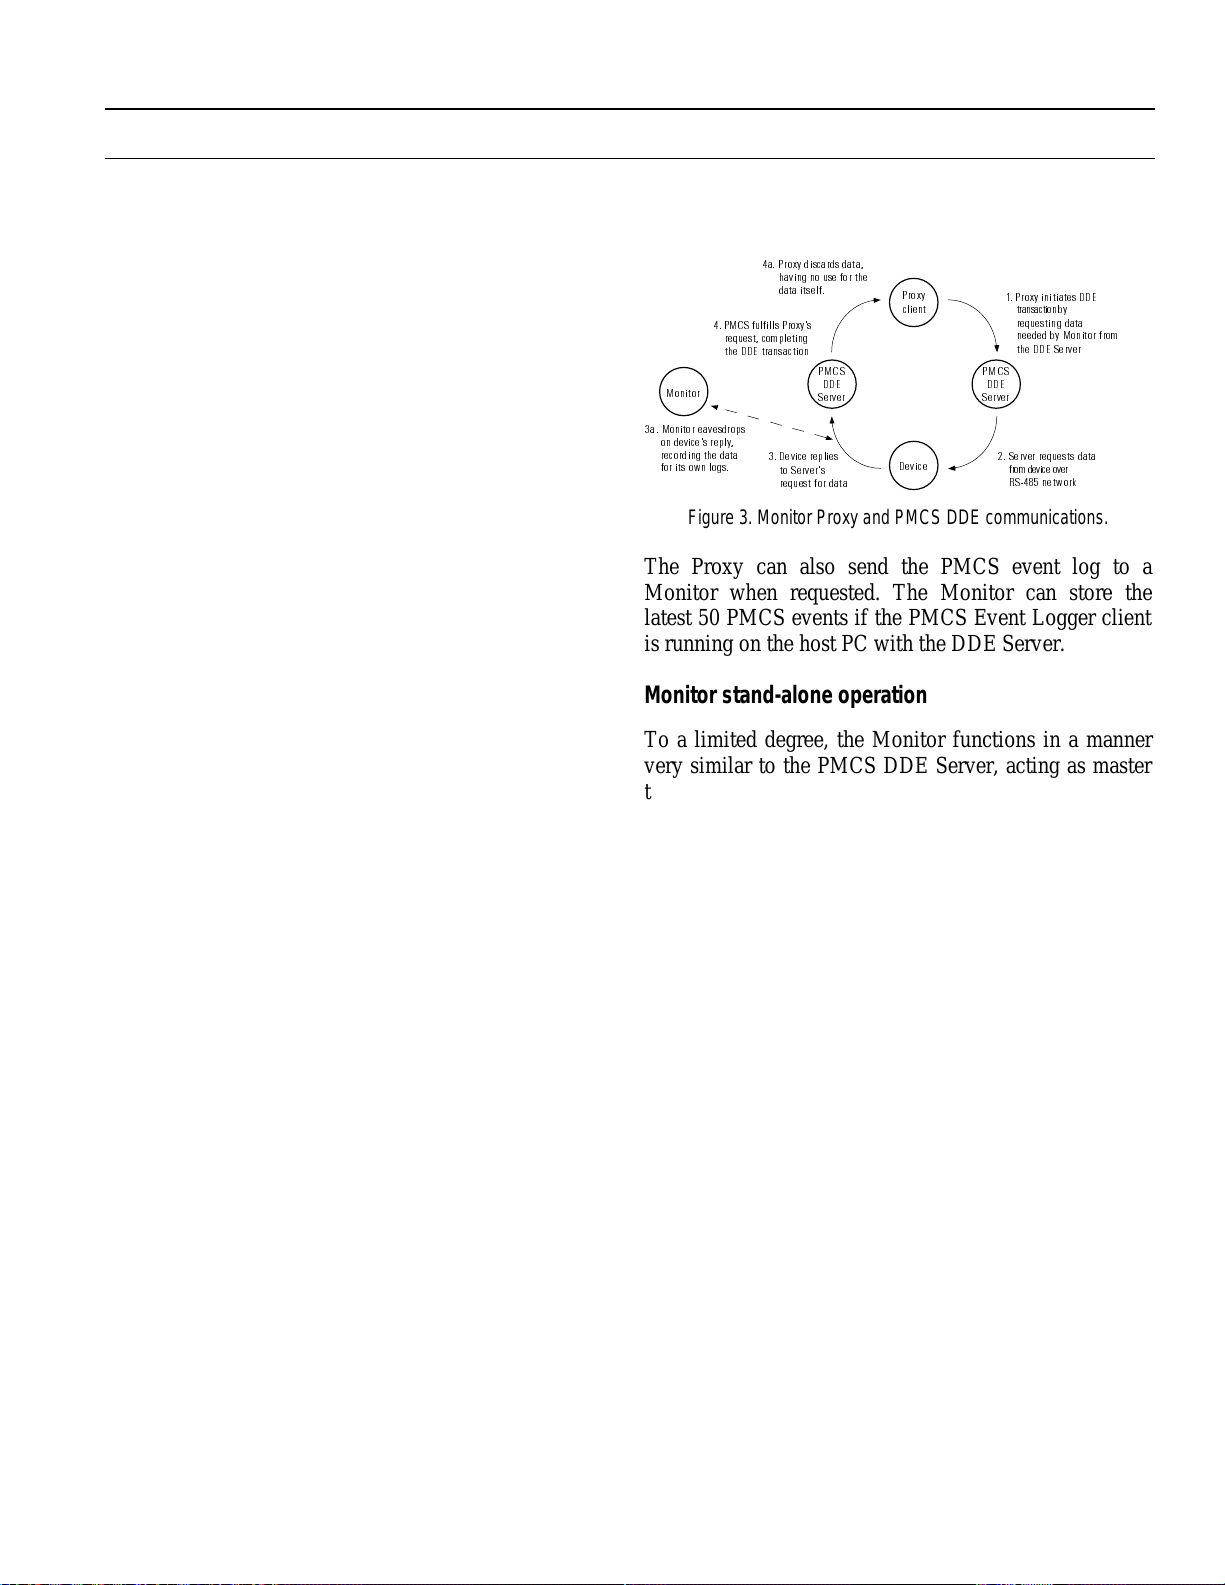
The Proxy’s role in assisting the Monitor in DDE
communications is shown in Figure 3.
The Monitor’s place in this scenario is as a backup
device to the PMCS software on the host computer, and
also as a remote monitor, enabling viewing of PMCS
device data at locations other than the host PC.
When the PMCS DDE Server is present on a network,
Monitors on the network operate as slaves to the PMCS
system acting as master. Because Modbus networks
operate on a master-slave architecture, which allows
only the master device to initiate communications, a
Monitor cannot directly request information from the
devices it needs to track. A special client application
called the Monitor Proxy provides the means for a
Modbus Monitor to obtain the data it requires from
network devices. The Proxy runs on the host PC
alongside the PMCS DDE Server.
When the Monitor Proxy application is launched, its first
task is to query the PMCS DDE Server, checking for any
Monitor devices on the segment. If Monitor devices are
found, the Proxy records their device names and then
asks the DDE Server for each Monitor’s request list
information. The Monitor’s request list is a listing of all
devices and specific data the Monitor needs to display.
The Monitors send their request lists back to the Server,
which passes this information on to the Monitor Proxy,
completing the DDE transaction.
The Proxy now knows which devices each Monitor
needs to track for data and events. The Proxy uses the
information in the Monitor’s request lists to establish
DDE links with the Server for the devices and
corresponding registers. The Server begins polling these
devices for data and sending the data back to the Proxy.
As a slave device, the Monitor cannot initiate
communications or requests for data. However, there is
nothing to prevent the Monitor from ‘eavesdropping’ on
network traffic. The Monitor watches the segment for
requests to and responses from the devices it is supposed
to track and uses this information to update its displays.
The Proxy itself has no need for the data from the
devices, since its purpose is merely to create the
conversation so that the Monitor can eavesdrop on the
reply. The Proxy discards all device data received from
the DDE Server.
D 3UR[\ GLVFDUGV GDWD
KDYLQJ QR XVH IRU WKH
30&6 IXO ILOO V 3UR [ \ V
UHTXHVW FRPSOHWLQJ
WKH ''( WUDQVDFWLRQ
0RQLWRU
D 0RQLWRU HDYHVGURSV
RQ GHYLFHV UHSO\
UHFRUGLQJ WKH GDWD
IRU LWV RZQ OR JV
GDWD LWVHOI
30&6
''(
6HUYHU
'HYLFH UHSOLHV
WR 6HUYHUV
UHTXHV W IRU GDW D
3UR[\
FOLHQW
'HYLFH
3UR[\ LQLWLDWHV ''(
WUDQVDFWLRQ E\
UHTXHVWLQJ GDWD
QHHGHG E\ 0RQLWRU IURP
WKH ''( 6HUYHU
30&6
''(
6HUYHU
6HUYHU UHTXHVWV GDWD
IURP GHYLFH RYHU
56 QHWZRUN
Figure 3. Monitor Proxy and PMCS DDE communications.
The Proxy can also send the PMCS event log to a
Monitor when requested. The Monitor can store the
latest 50 PMCS events if the PMCS Event Logger client
is running on the host PC with the DDE Server.
Monitor stand-alone operation
To a limited degree, the Monitor functions in a manner
very similar to the PMCS DDE Server, acting as master
to a network of power management devices.
The Monitor has been preconfigured with the register
maps of a variety of GE and third-party power
management devices. The user programs the Monitor
with the Modbus addresses and device types of the
devices on the segment(s), and tells the Monitor what
information he wishes to monitor from each device. The
Monitor will query the devices for the desired data and
display it on-screen.
Multiple Modbus Monitors
Up to two Modbus Monitors are permitted on a single
segment. In compliance with the Modbus master-slave
architecture, only one device may act as master at a
given time. However, while one Monitor is acting as
master, the second Monitor is constantly checking for
the master’s presence. Should the master go off-line, the
second Monitor will immediately assume the role of
master device.
3
Page 10

POWER LEADER Modbus Monitor
Chapter 1 – Introduction
Supported Devices
The Modbus Monitor supports three classes of power
management devices: tightly integrated devices, generic
devices, and hybrid devices.
Tightly integrated devices are those device types which
are predefined in the Monitor. The Monitor has a copy of
these devices’ register maps in its memory, and knows
precisely where to find any data it needs from such a
device. The register maps of tightly integrated devices
may not be changed in any way. The display screens of
tightly integrated device types are also pre-defined and
may not be changed (see hybrid devices, below, for more
information on customizing displays).
Generic devices are user-defined. The Modbus Monitor
supports any power management device with registerbased Modbus RTU communications via RS-485. To set
up a generic device, the user must manually enter the
register map (or those parts of interest) into the Modbus
Monitor via the Monitor Configuration Tool (see
Chapter 7, Advanced Configuration). In contrast to the
tightly integrated devices, whose register maps have
already been programmed into the Monitor, the Monitor
knows nothing about a generic device until the user
enters this data. Event recording and special handling
registers are not supported for generic device types.
The third type of device supported by the Monitor is the
hybrid device. This device type is derived from a tightly
integrated device, but is not as loosely defined as a
generic device. A hybrid device type’s register map and
display screens are copied from the register map of a
tightly integrated device, but they may be modified like a
generic device. This allows some flexibility to be
supported by the Monitor without giving up the
convenience of pre-defined tightly integrated devices.
The display screens of tightly integrated devices may be
customized by creating a new hybrid device type based
on the tightly integrated device type in question, and
then modifying the display portion of the device type.
Chapter 7, Advanced Configuration, discusses the
creation and configuration of generic and hybrid device
types.
The Monitor supports up to 31 device types, including
the 21 tightly-integrated devices shown in Table 1. All
tightly integrated devices are fully supported by PMCS
6.0; a sub-set (devices indicated by an asterisk) is
supported by PMCS 5.1.
4
Page 11

POWER LEADER Modbus Monitor
Chapter 1 – Introduction
Device Name as displayed on Monitor
screen
POWER LEADER EPM* PL EPM Metering
POWER LEADER Meter* PL Meter Metering
EPM 3710* EPM 3710 Metering
EPM 3720* EPM 3720 Metering
MULTILIN Power Quality Meter (PQM)* Multilin PQM Metering
POWER LEADER MDP Overcurrent Relay* MDP Relay Protection
Spectra MicroVersaTrip™ * Spectra MVT PM Protection
Enhanced MicroVersaTrip™ C* Enhanced MVT PM (RMS9C) Protection
Enhanced MicroVersaTrip™ D* Enhanced MVT PM (RMS9D) Protection
Spectra ECM™ Electronic Control Module* Spectra ECM Protection/Control
MULTILIN 239 Motor Protection Relay* Multilin 239 Protection/Control
MULTILIN 269 Plus Motor Management Relay* Multilin 269 Protection/Control
MULTILIN SR469 Motor Management Relay* Multilin 469 Protection/Control
MULTILIN SR489 Generator Management Relay* Multilin 489 Protection/Control
MULTILIN 565 Feeder Management Relay* Multilin 565 Protection/Control
MULTILIN 735 Feeder Relay* Multilin 735 Protection/Control
MULTILIN SR745 Transformer Management Relay* Multilin 745 Protection/Control
MULTILIN SR750 Feeder Management Relay* Multilin 750 Protection/Control
MULTILIN SR760 Feeder Management Relay Multilin 760 Protection/Control
System Monitor SM-3 Voltage Regulator SM3 Protection/Control
EPM 7300 PML7300 Protection/Control
Function
Table 1. Devices supported by the Monitor.
5
Page 12
POWER LEADER Modbus Monitor
Chapter 1 – Introduction
Typical Network Configurations
0RGEXV0RQLWRU
0RGEXV 0RQLWRU
DFWLQJ DV PDVWHU WR
0RGEXV VHJPHQW
(30 RU
0RGEXV VHJPHQW FRQQHFWV 56 QDWLYH GHYLFHV
MULT ILIN
)(('(5 0$1$*(0(17 5(/$ <
565
0XOWLOLQ
DFWLQJ DV VODYH ZLOO DVVXPH UROH RI
PDVWHU LI 0RQLWRU JRHV RIIOLQH
0LFUR9HUVD7ULS
WULS XQLWV
3720 ACM
32:(5/($'(5
0RGEXV&RQFHQWUDWRU
32:(5 /($'(5
0HWHU
&RPPQHW VHJPHQWV WR 32:(5 /($'(5 &RPPQHW GHYLFHV
Figure 4. Monitor acting as master to a network of POWER LEADER devices.
0RGEXV0RQLWRU
0RGEXV 0RQLWRU
32:(5 /($'(5
(OHFWURQLF 3RZHU 0HWHU
30&6
0DVWHU
(30 RU
0RGEXV0RQLWRU
0RGEXV 0RQLWRU
&RPPQHW VHJPHQWV WR 32:(5 /($'(5 &RPPQHW GHYLFHV
0RGEXV VHJPHQW FRQQHFWV 56 QDWLYH GHYLFHV
3720 ACM
MULT ILIN
)(('(5 0$1$*(0(17 5(/$ <
565
0XOWLOLQ
32:(5/($'(5
0RGEXV&RQFHQWUDWRU
32:(5 /($'(5
0HWHU
Figure 5. Typical PMCS network incorporating Monitor.
0RGEXV0RQLWRU
0RGEXV 0RQLWRU
DFWLQJ DV VODYH ZLOO DVVXPH UROH RI
PDVWHU LI 0RQLWRU JRHV RIIOLQH
0LFUR9HUVD7ULS
WULS XQLWV
32:(5 /($'(5
(OHFWURQLF 3RZHU 0HWHU
6
Page 13
Physical Description
Figure 6 and Figure 7 show the dimensions of the
Monitor. The important features of the Monitor are listed
below:
• The Monitor’s front panel display is used for viewing
device data and event messages during operation, for
diagnostics purposes, and for some very limited
configuration capabilities.
• The keypad is located directly beneath the display. Ten
keys are used for navigating the menus of the Monitor.
LQ
32:(5 /($'(5
0RGEXV0RQLWRU
POWER LEADER Modbus Monitor
Chapter 1 – Introduction
• A set of three terminals for AC or DC control power
input are provided on the side of the case.
• A grounding screw is provided above the control power
connection.
• Two five-terminal connectors on the side of the case
provide daisychained RS-485 input and output
connections to one or two Modbus segments.
• The on/off switch for the Monitor is located on the side of
the case above the RS-485 connectors.
32:(5 /($'(5
0RGEXV0RQLWRU
70
LQ
LQ
LQ
',63/$<
Figure 6. Front view of Monitor, showing dimensions.
NH\
PHPEUDQH
NH\SDG
56 3RUW
0RGEXV 6HJPHQW
LQ
127(
1RW WR VFDOH
,1 287 ,1 287
%
0RGEXV 6HJPHQW
$
66
*5281'
&RQWURO 3RZHU ,QSXW
+
1
*1'
LQ
&RPPXQLFDWLRQV
)URQW
LQ
Figure 7. Side view of the Monitor, showing dimensions and
connections.
7
Page 14

POWER LEADER Modbus Monitor
Chapter 1 – Introduction
Specifications
The specifications of the Modbus Monitor are listed in
Table 2.
Parameter Value
Control power 100–240 Vac, 50, 60 Hz;
125–250 Vdc;
30 W min
Current draw for fusing Use 1.5A – 3.0A slow-blow fuse
Modbus communications Two RS-485 ports, 1200 baud, 2400 baud, 4800
baud, 9600 baud, and 19.2 Kbaud supported; no
parity, eight data bits, one stop bit.
Mating connector: Precision Connector Designs
(PCD) ELFT03260 or equivalent (supplied with
unit)
RS-485 Modbus
interconnections
Standards: UL 508, File No. E146421
Device types supported The Monitor supports up to 32 device types,
Devices per Modbus
segment
Compatible Modbus RTU
Host Software
Bare wire, AWG #12–24
CSA: C22.2 No. 14, File No. LR-77871-25
including the 21 Tightly Integrated Device types
and the Modbus Monitor device type itself.
Per the Modbus standard, up to 32 total ‘drops’
(devices) per segment,
applicable) PMCS host.
Up to 215 commnet devices may be supported via
Modbus Concentrators.
See GEH-6502,
Guide
, for details.
GE Industrial Systems
Power Management Control System, version 5.1 or
greater
including
Monitors and (if
PMCS Network Architecture
Environmental
The environmental requirements of the Monitor are
listed in Table 3.
Parameter Value
Operating temperature 0° C to +65° C
Storage temperature –20° C to +80° C
Relative humidity 5% to 95% noncondensing
Environmental exposure NEMA 12
Vibration response and
endurance
Fast transient surge ANSI C37.90.1
Radiated EMI withstand ANSI C37.90.2
Electrostatic discharge IEC 801–2
Table 3. Monitor environmental requirements.
IEC 255–21–1
Severity Class 1
Severity Class 4
Catalog Numbers
Two versions of the Monitor are available: a single RS485 port version and a dual RS-485 port version. Catalog
numbers for each version are shown in Table 4.
Description Catalog Number
Monitor, single RS-485 port PLMNTR1
Monitor, dual RS-485 port PLMNTR2
Table 4. Monitor catalog numbers.
Table 2. Monitor specifications.
8
Page 15
Chapter 2
Installation
The installation of a Monitor is straightforward and
relatively simple. The device is mounted in an
appropriate cutout in switchgear or a panelboard, control
power and grounding connections are made, and the RS485 connections to one or two Modbus segments are
made. Software necessary to configure the Monitor must
be installed on a PC. Finally, if the Monitor is to be used
as part of a PMCS system, a special client software
package called the Modbus Monitor Proxy must be
installed on the host PC where PMCS runs. This chapter
presents the instructions for each of these procedures.
Valid Network Architectures
There are only four permissible network architectures
with which the Modbus Monitor may be used. Select the
architecture appropriate for the network you have
designed. Refer to GEH-6502, the POWER LEADER
PMCS Network Architecture Guide for information on
designing RS-485 networks. These are shown in Figure
8, below.
0RGE XV
6HJPHQW $
0RGE XV
6HJPHQW $
([DPSOH %
0RGE XV
6HJPHQW %
0RQLWRU
([DPSOH '
0RGE XV
6HJPHQW %
0RQLWRU
0RQLWRU
([DPSOH $
0RGEXV
6HJPHQW $
0RQLWRU
([DPSOH &
0RGEXV
6HJPHQW $
0RQLWRU
0RQLWRU
POWER LEADER Modbus Monitor
Chapter 2 – Installation
DUAL PORT MONITOR USERS:
DO NOT CONNECT THE MONITOR’S TWO RS-485
PORTS TO THE SAME MODBUS SEGMENT. This
will cause communications errors and misoperation of
the Monitor.
Example A shows a single Modbus Monitor wired to a
single Modbus segment. Example B shows the same
monitor in a dual-port version, wired to two different
Modbus segments.
Examples C and D illustrate fully loaded Modbus
segments - no more than 2 Monitors are permitted on a
given Modbus segment.
Example C illustrates a pair of Monitors connected to a
single Modbus segment. In this example, the Monitors
may be either single port or dual-port versions, provided
both are the same. You may not mix single-port and
dual-port Monitors on a Modbus segment (see note
below.)
Example D shows the same pair of Monitors wired to a
second Modbus segment.
IMPORTANT: With regard to Example C (two Monitors
on a single RS-485 segment) it is NOT permissible to
mix different models of Monitors on a segment.
Monitors #1 and #2 MUST be of the same model, either
both single-port or both dual-port.
The nature of the other network architectures makes this
concern irrelevant for examples A, B and D, since in
Example A you could have either a single or a dual port
Monitor, and in Examples B and D, you may only use a
dual-port monitor(s).
Figure 8. Valid Modbus Monitor network architectures.
WARNING: Any other wiring of the Modbus Monitor
may result in incorrect operation and errors.
Mounting
The hole pattern for mounting the Monitor in switchgear
is shown in Figure 9. Insert the Monitor through the
mounting hole, being careful to line up the six faceplate
studs with the six holes drilled in the panel. From the
9
Page 16
POWER LEADER Modbus Monitor
Chapter 2 – Installation
back of the panel, apply the lock washers and mounting
nuts (included with the Monitor) to the studs. Hand
tighten them with a small wrench.
Be sure to allow clearance behind the unit so that the fan
can operate effectively and along the bottom of the unit
where the ventilation vents are located. A minimum of
0.25 inch must be allowed.
GLD
LQ
LQ
LQ
NOTE: Failure to properly connect earth ground to
the Monitor may result in inconsistent or noisy
network communications.
WARNING: Failure to properly connect earth
ground may result in voltages hazardous to
personnel and equipment being present at the
Monitor enclosure.
RS-485 Connection(s)
LQ
LQ
LQ
Figure 9. Cutout pattern for mounting the Monitor.
Control Power Connections
Control power connections are made on the side of the
case. The connectors are labeled H+, N-, and GND. The
appropriate power cable terminations are spade lugs on
AWG #12–18 wire. See Table 2 for control power
voltage ranges. Hand-tighten connection screws with a
Phillips head screwdriver.
On the side of the Monitor case are two five-pin
connectors labeled Modbus Segment A and Modbus
Segment B.
NOTE:
Both connectors are present and labeled
regardless of whether the individual Monitor is a single
or dual port version. In the single port version, the
Segment B connector is disabled.
Mating connectors (one for each segment) are included
with the Monitor for customer connection. The pinout
for assembling the mating connector is shown in Figure
10. If the Monitor is to be the first or last device on the
RS-485 network, it must be terminated using the
enclosed terminating resistor. Place the resistor between
the appropriate + and - connections on the mating
connector. (See below for details on RS-485
termination).
Grounding
The Monitor chassis should be connected to earth
ground for personnel safety reasons. Connect earth
ground to the green-colored grounding screw on the side
of the Monitor enclosure. Earth ground connection
requires #14 AWG or thicker wire and a ring or spade
lug.
10
Page 17
POWER LEADER Modbus Monitor
Chapter 2 – Installation
When the assembly is complete, plug the connector into
port labeled Segment A on the side of the Monitor, as
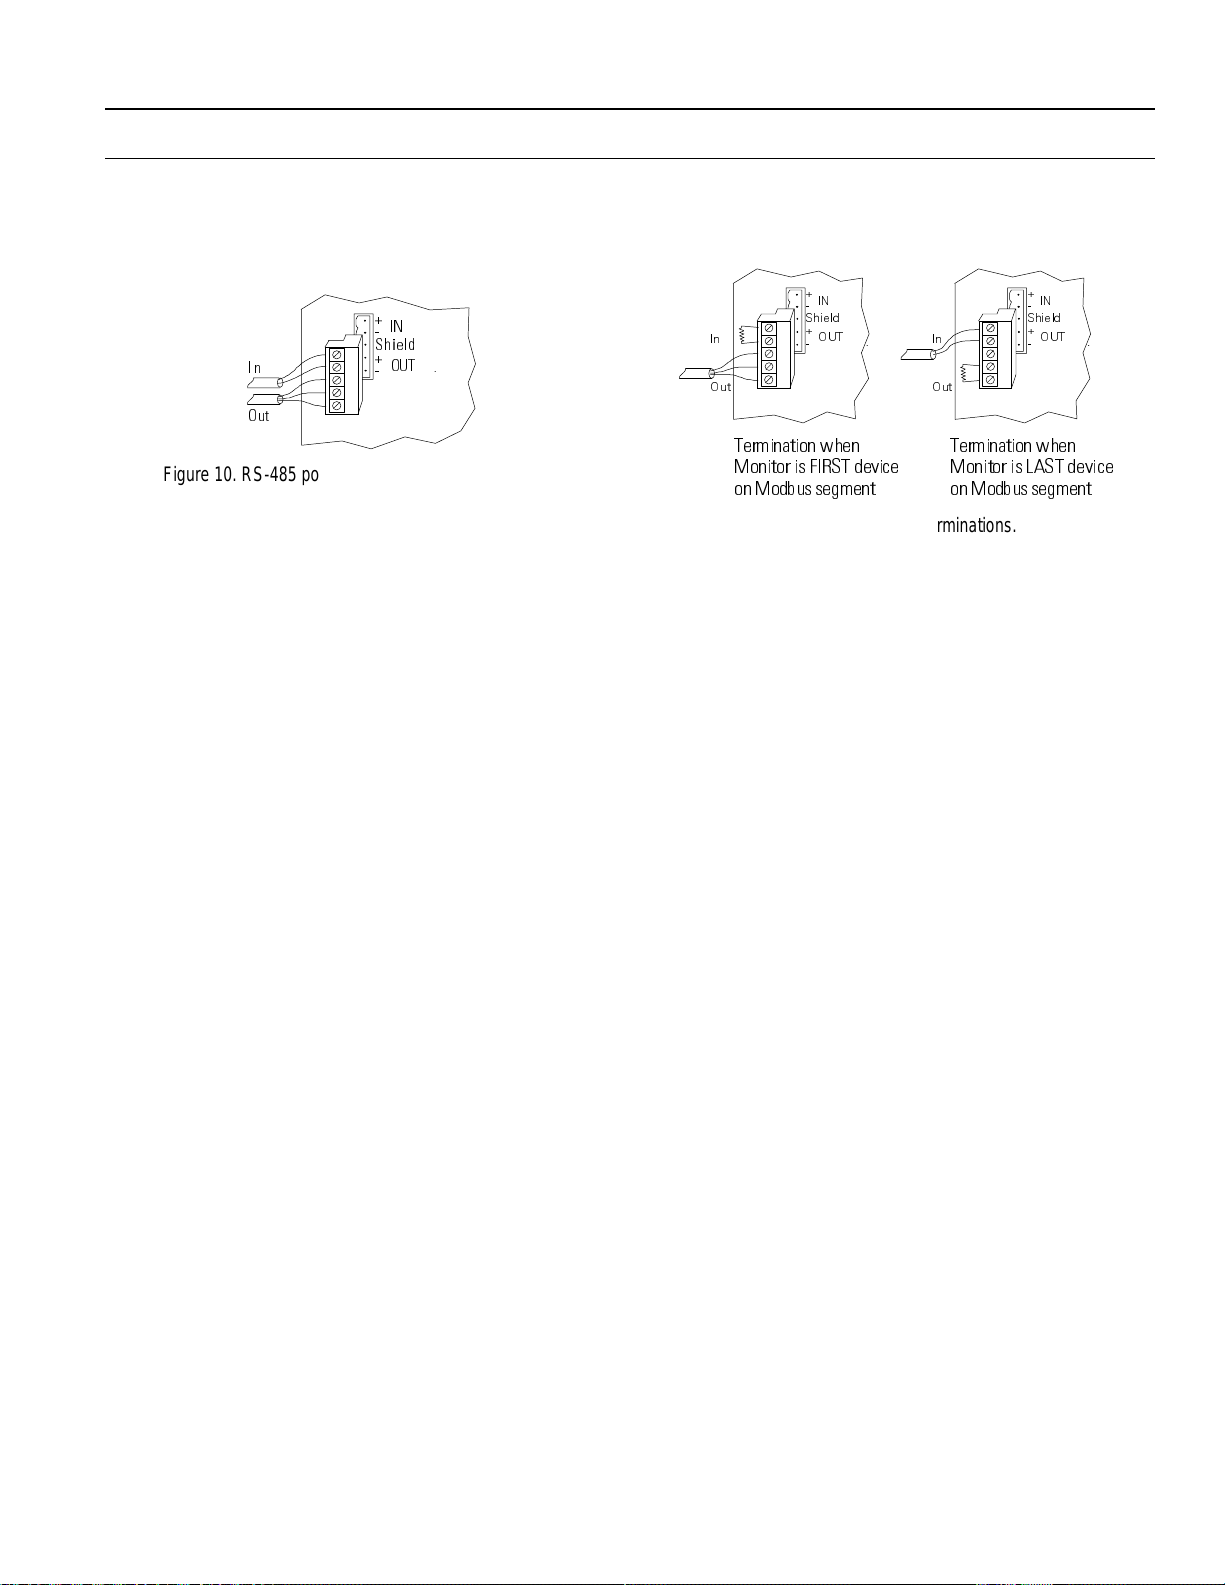
shown in Figure 10.
,1
6KLHOG
,Q
2XW
287
Figure 10. RS-485 port and RS-485 connector pinouts.
The connectors labeled
should be wired to the cable
IN
coming from the host (or previous device), or should be
terminated if the Monitor is the first device on the
Modbus segment. The
RS-485 IN
connector of the next Modbus device, or
connectors are wired to the
OUT
terminated if the Monitor is the final device on the
Modbus segment. Please study and follow the RS-485
grounding considerations and termination rules below to
ensure the correct operation of your Modbus segments.
If the Monitor is to be connected to a second Modbus
segment, follow the procedures outline above to wire the
connector, and plug it into the port labeled
Segment B
on the side of the Monitor. Note that
Modbus
termination considerations are independent for each
segment; i.e., the Monitor may need to be terminated for
one or both RS-485 segments, or for neither, if it is
positioned in the middle of the segment(s).
Figure 11 illustrates appropriate termination of an RS485 segment at the Modbus Monitor
,1
6KLHOG
,Q
2XW
287
7HUPLQDWLRQ ZKHQ
0RQLWRULV ),567 GHYLFH
RQ 0RGEXV VHJPHQW
Figure 11. RS-485 Terminations.
,Q
2XW
7HUPLQDWLRQ ZKHQ
0RQLWRULV /$67 GHYLFH
RQ 0RGEXV VHJPHQW
,1
6KLHOG
287
RS-485 Termination Considerations
Per the EIA485 standard, every RS-485 network must be
terminated at both ends. If the Modbus Monitor is the
first device, place the supplied 120-ohm, 1/2-watt
resistor between the + and - connectors of the
port. If the Modbus Monitor is the last device, place the
supplied 120-ohm, 1/2-watt resistor between the + and connectors of the
RS-485 OUT
port.
RS-485 IN
11
Page 18
POWER LEADER Modbus Monitor
Chapter 2 – Installation
RS-485 Grounding Considerations
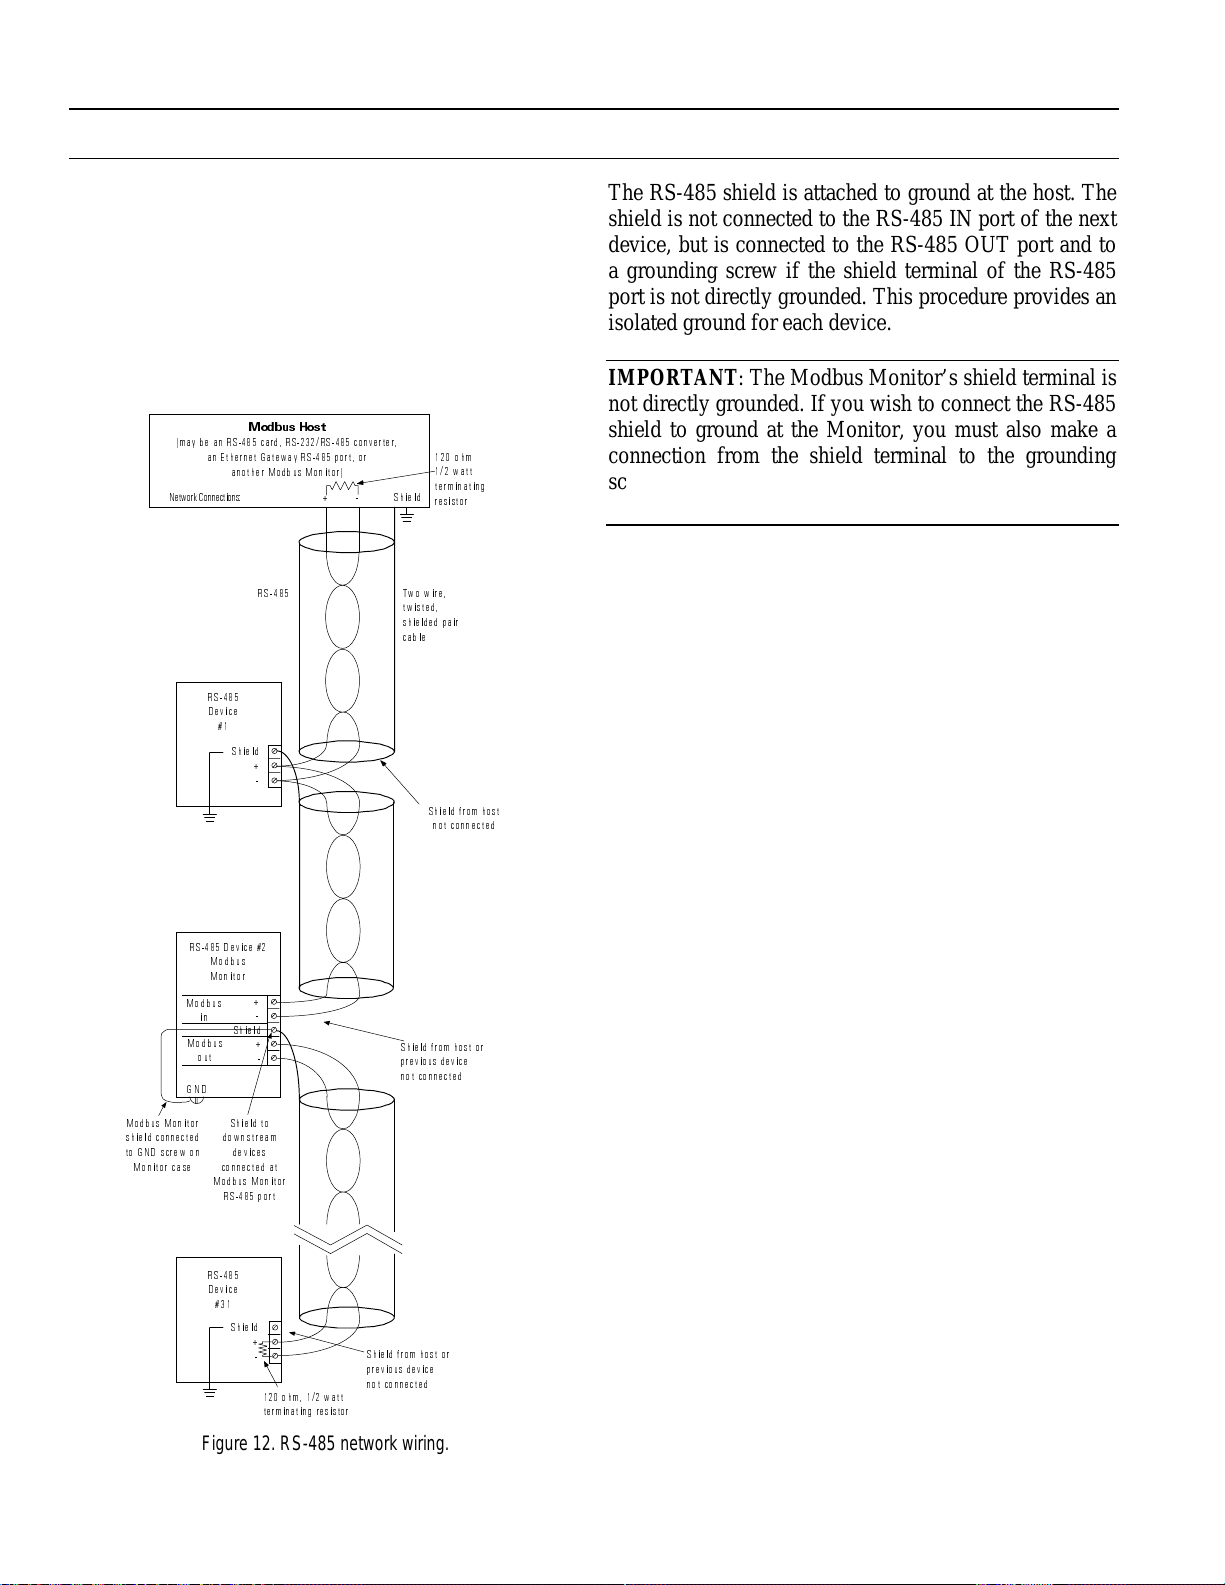
Figure 12 illustrates correct wiring for communications
and shield grounding. By following this example, a
secure grounding point will be provided for each device
on the network. Any surge will dissipate locally without
being carried up or down the network to other devices,
thus minimizing the chance for damage to devices due to
surge or EMI.
PD\ EH DQ 56 FDUG 56 56 FRQYHUWH U
1HWZRUN &RQQHFWLRQV 6K L H O G
0RGEXV
0RGEXV
*1'
0RGEXV 0RQLWRU
VKLHOG FRQQHFWH G
WR *1' VFUHZ RQ
0RQLWRU F DVH
0RGEXV +RVW
DQ (WKHUQHW *DWHZD \ 56 SRUW RU
DQRWKHU 0R GEXV 0 RQLWRU
56
56
'HYLFH
6KLHOG
56 ' HYLFH
0RGEXV
0RQLWRU
LQ
6KLHOG
RXW
6KLHOG WR
GRZQVWUHDP
GHYLFHV
FRQQHFWH G DW
0RGEXV 0RQLWRU
56 SRU W
RKP
ZDWW
WHUP LQDW LQJ
UHVLVWRU
7ZR ZL UH
WZLV WHG
VKLHOGHG SDLU
FDEOH
6KLHOG IURP KRVW
QRW FRQQHFWHG
6KLHOG I URP KRVW RU
SUHYLR XV G HYLFH
QRW FRQQHFWHG
The RS-485 shield is attached to ground at the host. The
shield is not connected to the RS-485 IN port of the next
device, but is connected to the RS-485 OUT port and to
a grounding screw if the shield terminal of the RS-485
port is not directly grounded. This procedure provides an
isolated ground for each device.
IMPORTANT: The Modbus Monitor’s shield terminal is
not directly grounded. If you wish to connect the RS-485
shield to ground at the Monitor, you must also make a
connection from the shield terminal to the grounding
screw on the Monitor’s case. Use AWG #12-14 wire for
this connection.
Software Installation
Modbus Monitor Configuration Tool
Configuration of the Monitor requires a Windows-based
software program, the Modbus Monitor Configuration
Tool. This program is included with the Modbus
Monitor, on several 3.5” high density floppy disks. This
section describes installation of this software onto a PC.
A laptop PC’s portability lends itself well to this use if
configurations are to be downloaded to Monitors already
installed in the likely facility-floor setting. However, it is
acceptable to create configuration files on a desktop PC
and then copy the files to a laptop for transportation to
the Monitor’s location.
The Configuration Tool requires a 486 or better PC
running Windows 3.1x, at least 8 megabytes of RAM,
and a floppy drive for installing the Configuration Tool
from the floppy disk. A minimum of 15 megabytes of
hard disk space is required to install the Configuration
Tool. A mouse is recommended for ease of use, but not
required.
To install the Monitor Configuration Tool on the
selected PC:
56
'HYLFH
6KLHOG
RKP Z DWW
WHUPLQDWLQJ UHVLVWRU
6KLHOG I URP KRVW RU
SUHYLRXV GHYLFH
QRW FRQQHFWHG
Figure 12. RS-485 network wiring.
1. Power up the PC and launch Windows. Start the
Windows Program Manager.
2. Insert the Monitor Configuration Tool disk
labeled “DISK 1”.
3. Select Run from the Program Manager’s File
Menu.
4. Enter A:\setup.exe and press return.
12
Page 19

POWER LEADER Modbus Monitor
Chapter 2 – Installation
A new program group with the name Modbus Monitor
Configuration Tool will be created. In it will be a
README file and the Configuration Tool application.
Double-click on the application’s icon to launch the
Configuration Tool.
Modbus Monitor Proxy
For the Modbus Monitor to function in slave mode in a
PMCS system, the Modbus Monitor Proxy client
program must be installed on the host PC where the
PMCS DDE Server is running. Complete the PMCS
installation, then perform the Proxy installation as
described below. The Modbus Monitor Proxy program is
included with the Modbus Monitor on 3.5” high density
floppy disk(s).
NOTE: PMCS requires the Windows NT 4.0 operating
system, therefore the Modbus Monitor Proxy also
requires NT 4.0.
To install the Modbus Monitor Proxy:
Maintenance
The Modbus Monitor requires very little operational
maintenance due to its heavy-duty industrial
construction. However, it is recommended that the
cooling fan filter be cleaned periodically to prevent
unnecessary heat buildup inside the Monitor case.
To clean the fan filter, remove the plastic gasket from
the rear of the Monitor case, then remove the fan filter
itself, as shown in Figure 13. Gently vacuum or shake
the filter to remove any accumulated dust or debris, or
blow the debris off using a can of compressed air.
Replace the filter and gasket when cleaning is complete.
1. Log in to Windows NT on the host PC.
2. Insert the Modbus Monitor Proxy disk labeled
Disk 1.
3. Select Run from the Windows NT Start menu.
4. Enter A:\SETUP and hit return.
Follow the on-screen instructions. The installer will
prompt you to select a directory to install the Proxy in.
The default is C:\Monitor.
You will be prompted to locate the PMCS DDE Server’s
.ini file. This file is usually located in the WINNT\
directory and will have the name GE32MODB.ini or
GE32ENET.ini.
If you’re using the PMCS Event Logger client program,
you’ll also be asked to locate the directory where the
Event Logger database file is located. The file name is
EventLog.mdb and is usually located in the directory
GE_PMCS\EventLog\ .
To use the Proxy, launch the application from the Start
menu. You’ll find an icon for the program named GE
Modbus Monitor Proxy. Launching the Proxy
application automatically starts the PMCS DDE Server.
Figure 13. Removing the cooling fan filter.
13
Page 20

POWER LEADER Modbus Monitor
Chapter 2 – Installation
(This page left blank intentionally.)
14
Page 21

POWER LEADER Modbus Monitor
Chapter 3
Configuration
Chapter 3 – Configuration
After installing the Modbus Monitor, some initial
configuration is required to set up the Monitor for
communications. Communications settings such as baud
rate, parity, and Modbus address must be set to
correspond with the network’s settings.
Once the Monitor has been successfully configured for
network communications, it must also be configured for
its task: monitoring the other devices on the network. To
successfully monitor other devices on the Modbus
segment(s), a Monitor must know the Modbus addresses
and device types of all the devices on the segment(s).
These configuration tasks require the use of the Modbus
Monitor Configuration Tool, a Windows-based software
program included with the Modbus Monitor.
The Modbus Monitor Configuration Tool is used to
create a “profile” of the Monitor, consisting of all the
different configurable attributes, such as
communications settings, information on devices
connected to the Modbus segment(s), the register maps
for these devices, etc.
Once the desired profile has been established, it can be
downloaded to the Monitor via the RS-232 port on the
Monitor’s front panel. When a new profile has been
downloaded to the Monitor, the old profile will be
replaced and the new profile will take effect.
This chapter will cover using the Configuration Tool to
create a profile for the Monitor and how to download the
profile to the Monitor. Later in the chapter, we’ll discuss
what other configuration options are available from the
Monitor’s display/keypad, not requiring the
Configuration Tool.
Modbus Monitor Configuration Tool
First, launch the Monitor Configuration Tool from the
Windows Program Manager. The Modbus Monitor
Configuration Tool main window will appear (Figure
14).
There are three pulldown menus available from the main
screen of the Configuration Tool. The first, File, offers
standard options to create a new database of Monitor
configurations, open an existing database, or create a
new database by Saving the current database As… under
a new file name. Within one database, you may have
many Monitor configurations. This allows you to group
configurations by project or customer; for instance, you
might have a file called Customer_A and within that file,
there might be configurations named Plant 1 Monitor 1,
Plant 1 Monitor 2, Paint Shop Monitor, etc.
The Configuration pulldown menu offers access to the
Print dialog box (discussed later in this chapter) and the
View dialog box, which permits you to create, modify or
delete configurations within a database. The View dialog
box is shown in Figure 15.
The third pulldown menu, Help, offers the standard
Contents item, which accesses the Configuration Tool’s
HELP table of contents, and the About dialog, which
gives information about the version of the Configuration
Tool you are using.
15
Page 22

POWER LEADER Modbus Monitor
Chapter 3 – Configuration
Figure 14. Configuration Tool main screen.
Figure 15. Configuration Tool View dialog.
16
Page 23

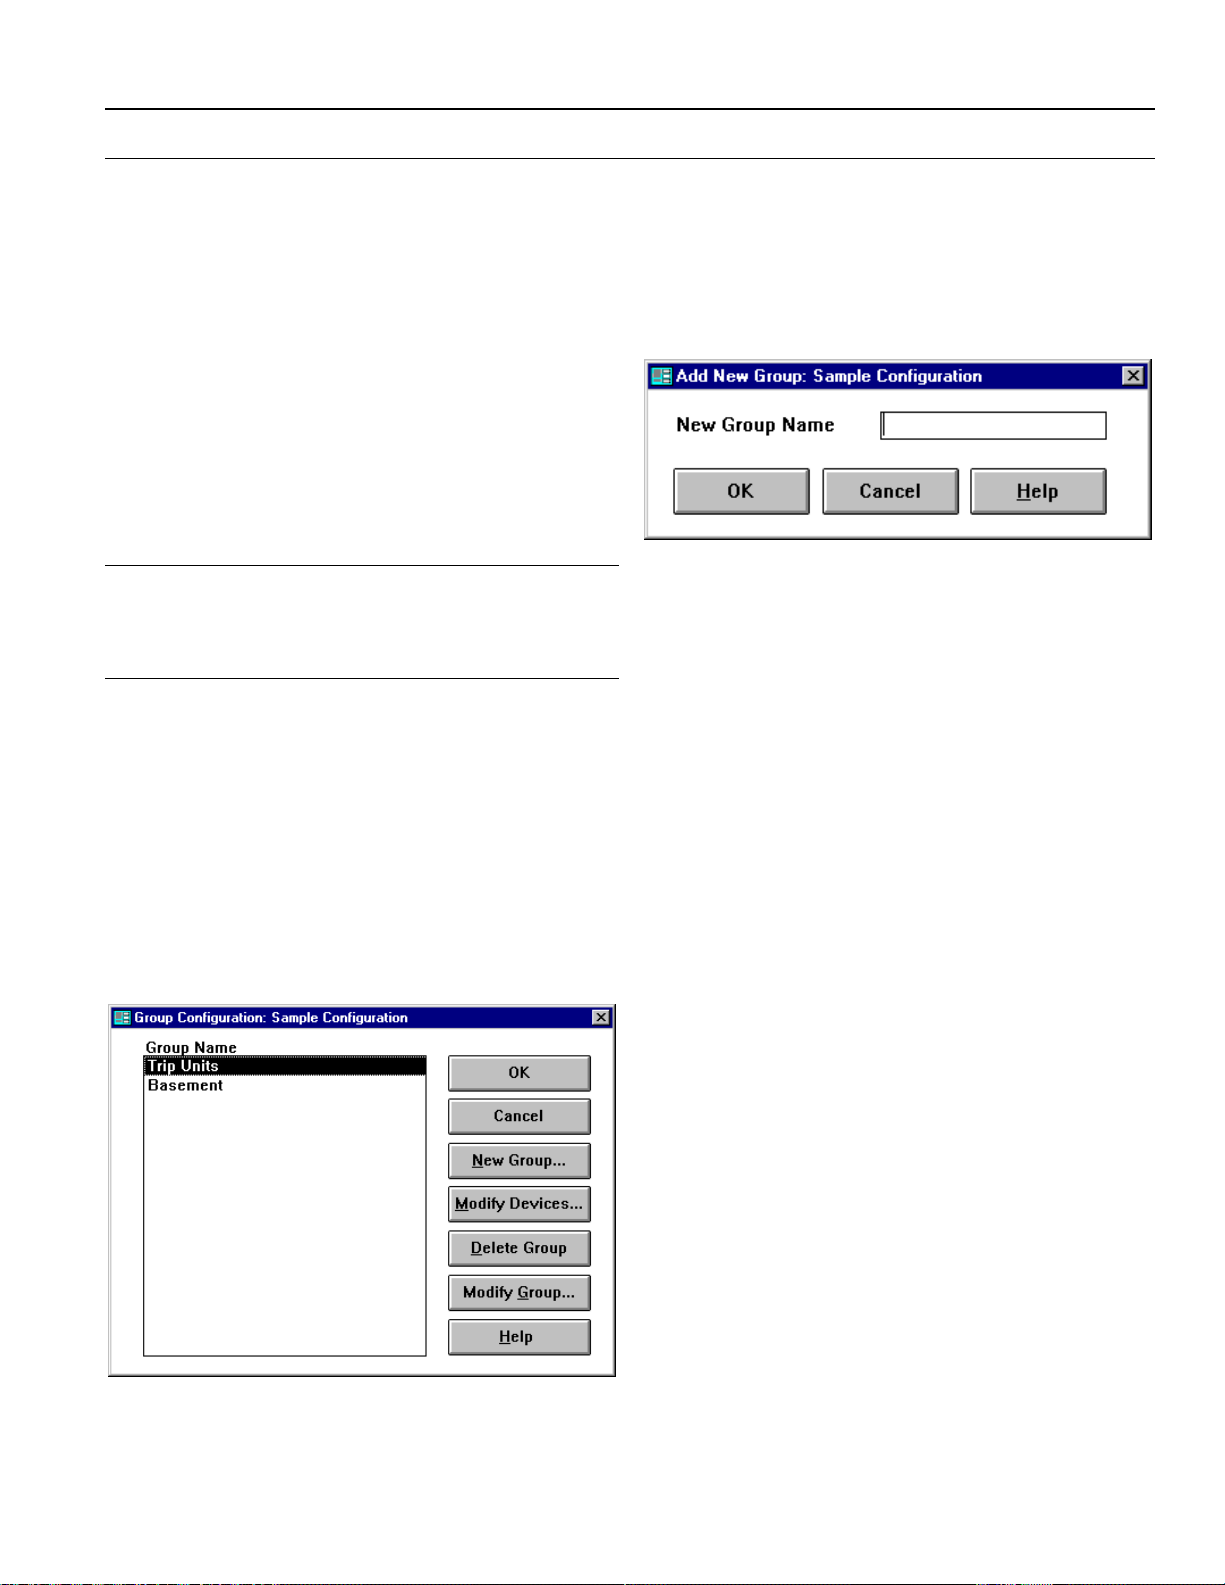
We’ll begin by creating a New Monitor Configuration.
Select the Define a New Monitor Configuration radio
button and then click OK. (If you wish to make changes
to an existing monitor configuration, select Modify an
Existing Monitor Configuration.)
The New Configuration dialog box appears:
Figure 16. New Configuration screen.
Enter the name to be assigned to the new monitor. The
name must be between 4 and 20 alphanumeric
characters. Next, from the pull-down list labeled
“Number of Ports”, select the number of Modbus ports
(1 or 2) appropriate for the particular Monitor you’ll be
configuring, then click OK to display the Port
Configuration dialog box (Figure 17).
POWER LEADER Modbus Monitor
Chapter 3 – Configuration
Figure 17. Port Configuration screen.
Complete the configuration for the RS-485
communications segments, setting the Baud Rate, Parity,
Flow Control and Stop Bits to match the
communications specifications for the rest of each
segment. The default values are pre-selected and are
typically not changed for Modbus RTU systems: Baud
Rate: 19200, Parity: None, Flow Control: None, Stop
Bits: 1. These fields are described in the following table.
Notes on Modbus Monitor Configuration Tool Keyboard Interface
While using a mouse makes navigating the dialog boxes of the Configuration Tool much easier, not all laptop computers are
equipped with a mouse or trackpad. Therefore there are keyboard shortcuts available to complete all dialog boxes of the
Configuration Tool.
To select an option button gro uping, press the TAB key until the desired selection is highlighted. Then use the up/down arrow
keys to select the desired option.
To select items from a pull-down list, press the Tab key until the pull-down list box is active, p ress alt-down arrow to d isplay th e
full pull-down list. Use the up/down arrow keys to scroll to your desired selection, then press TAB to move the desired command
button, or press ENTER to accept the default command of that dialog box.
To select items from a standard list box, TAB to the list box, then press the do wn arrow key to highlight the first item in the list.
Then use the up/down arrow keys to make your selection. Press TAB to move to the desired command button or ENTER to accept
the default command of that dialog box.
Selecting the Default System Menu (the upper left hand corner of the window) is done by pressing the Alt key, then the down
arrow key (NOT as a combination, but as a sequence). Use the up/down arrow keys to select the desired item or press the short-cut
key (example: “m” for Move or “c” for Close).
Short cut keys are available for most command buttons in a window. Use the Tab key to move the desired button, then press
ENTER or the SPACE BAR. Additionally, some command buttons include a short-cut key combination, indicated by the
underlined letter of the button’s caption. Pressing Alt and that letter simultaneously invokes that command. For example, on the
Device Table screen, you can add a new device by pressing ALT+A.
17
Page 24

POWER LEADER Modbus Monitor
Chapter 3 – Configuration
Segment For two port Monitors, select the segment to configure;
the rest of the values in this dialog box will apply to the
segment selected here. A one-port Monitor will have
this box frozen to “A” as port B will be unavailable.
Monitor Address Select the Modbus Address for the segment selected
above. Addresses assigned to other devices will not be
available.
Baud Rate Select the communications speed for the segment. The
Monitor supports baud rates of 1200, 2400, 4800, 9600
and 19.2kbaud.
Parity If the segment being configured uses parity in its
communications, select that here. Default is none.
Flow Control If the segment being configured uses flow control in its
communications, select that here. Default is none.
Stop Bits Select the number of stop bits used by this segment.
Default is one stop bit.
If you make a mistake, press Reset to Defaults to restore
the default values.
which contains the parameters for the functioning of the
Monitor. Select the Modify an Existing Monitor
Configuration radio button and click OK. The Modify
Configuration screen is displayed:
NOTE: If you have a single-port version of the Monitor,
the segment pull down list is disabled, and you will only
need to configure the settings for Segment A. However,
for a dual port Monitor you MUST configure these
settings for BOTH ports, even if you intend to use only
one port.
Select the Monitor’s Modbus RTU address for the
segment from the Network Address pull-down list. The
valid range of Modbus addresses for a Modbus Monitor
is 1–247. Address zero is reserved for broadcast
messages, per the Modbus standard. The Modbus
address assigned to each Monitor must be unique to
avoid communication conflicts with other Modbus
devices on the RS-485 network.
NOTE: Addresses which have already been utilized will
not appear in the pull-down address list; this helps to
avoid addressing conflicts. However, you should still
check the list of device addresses for each segment to be
sure that every device has a unique Modbus address.
Figure 18. Modify Configuration screen.
From this screen, we can select any existing monitor
configuration file and adjust any of the configuration
parameters of that file.
Select the desired configuration name from the pulldown list at the top of the dialog box, then select the
parameter you wish to modify from the list box beneath,
and click OK. The following sections describe the
various aspects of a Monitor configuration file.
Device Table
The Monitor keeps track of the devices attached to its
Modbus segment(s) by keeping a table of devices for
each port. The Device Table lists the name, type,
location and Modbus address of each device connected
to an RS-485 port.
Click OK to accept changes and return to the main
screen.
Now that we’ve defined the monitor’s identity, we need
to set the monitor’s attributes. Modify Configuration
provides access to the Monitor’s configuration file,
Figure 19. Configuration Tool Device Table screen.
18
Page 25

NOTE: IF YOU ARE USING PMCS AND WISH TO
COPY THE CONFIGURATION INFORMATION
FROM YOUR PMCS SETUP, SKIP AHEAD TO
CREATE FROM PMCS. You do not need to manually
add devices if you copy the configuration from the
PMCS topic file.
Add Device
To add a device to the current configuration, press Add
Device. The Add a Network Device dialog box appears:
POWER LEADER Modbus Monitor
Chapter 3 – Configuration
Device Name Enter the device name as 4 to 20 alphanumeric
characters.
Device Location Optionally, enter the device location or a note about the
device in this field. 4 to 20 alphanumeric characters.
Device Type Select the correct device type (MUST match the
physical device) from this pulldown list.
Scan Rate Select the rate at which you wish the device to be
polled for display data. Default is 1000 ms; other
options are available, but lowering this value may result
in degraded network performance, while increasing this
value may result in stale data being gathered.
Network Address Select the Modbus address for the device here. This
must match the address that has been set at the
device. Address which have already been assigned are
not available from this list.
When you have completed these fields, press OK to
accept the new device. Cancel returns to the Device
Table dialog without adding a new device.
Figure 20. Add a Network Device dialog.
The Current Configuration field shows the current
configuration name and segment. Enter the device name
and (optionally) the location. These fields may be from 4
to 20 alpha-numeric characters long. Next select the
appropriate device type, the scan rate for the device, and
the Modbus address of the device from the pull-down
lists. These explanations of the fields are as follows:
Modify Device
To modify an existing device, select the device from the
device table list, then press Modify Device. Make any
necessary changes and press OK.
Delete Device
To delete a device, select it from the device table list and
press Delete. You will be prompted for confirmation.
The remaining two options, Create from PMCS and
AutoDetect, allow you to create the entire device list for
a particular segment automatically.
Create from PMCS
This item applies only to systems where the Modbus
Monitor will be a slave on a PMCS network.
The PMCS DDE Server keeps track of all its
configuration data in a .cfg file. This file is created
during the setup process of the PMCS DDE Server; for
its location, refer to the PMCS documentation, especially
the Read-This-Book-First guide. The Modbus Monitor’s
Configuration Tool can reference this file (or a copy of
it) to extract the information relevant to a particular
Modbus segment which a Monitor will be connected to.
Select Create from PMCS from the Device Table dialog
box. The Select PMCS Topic File dialog appears, as
19
Page 26
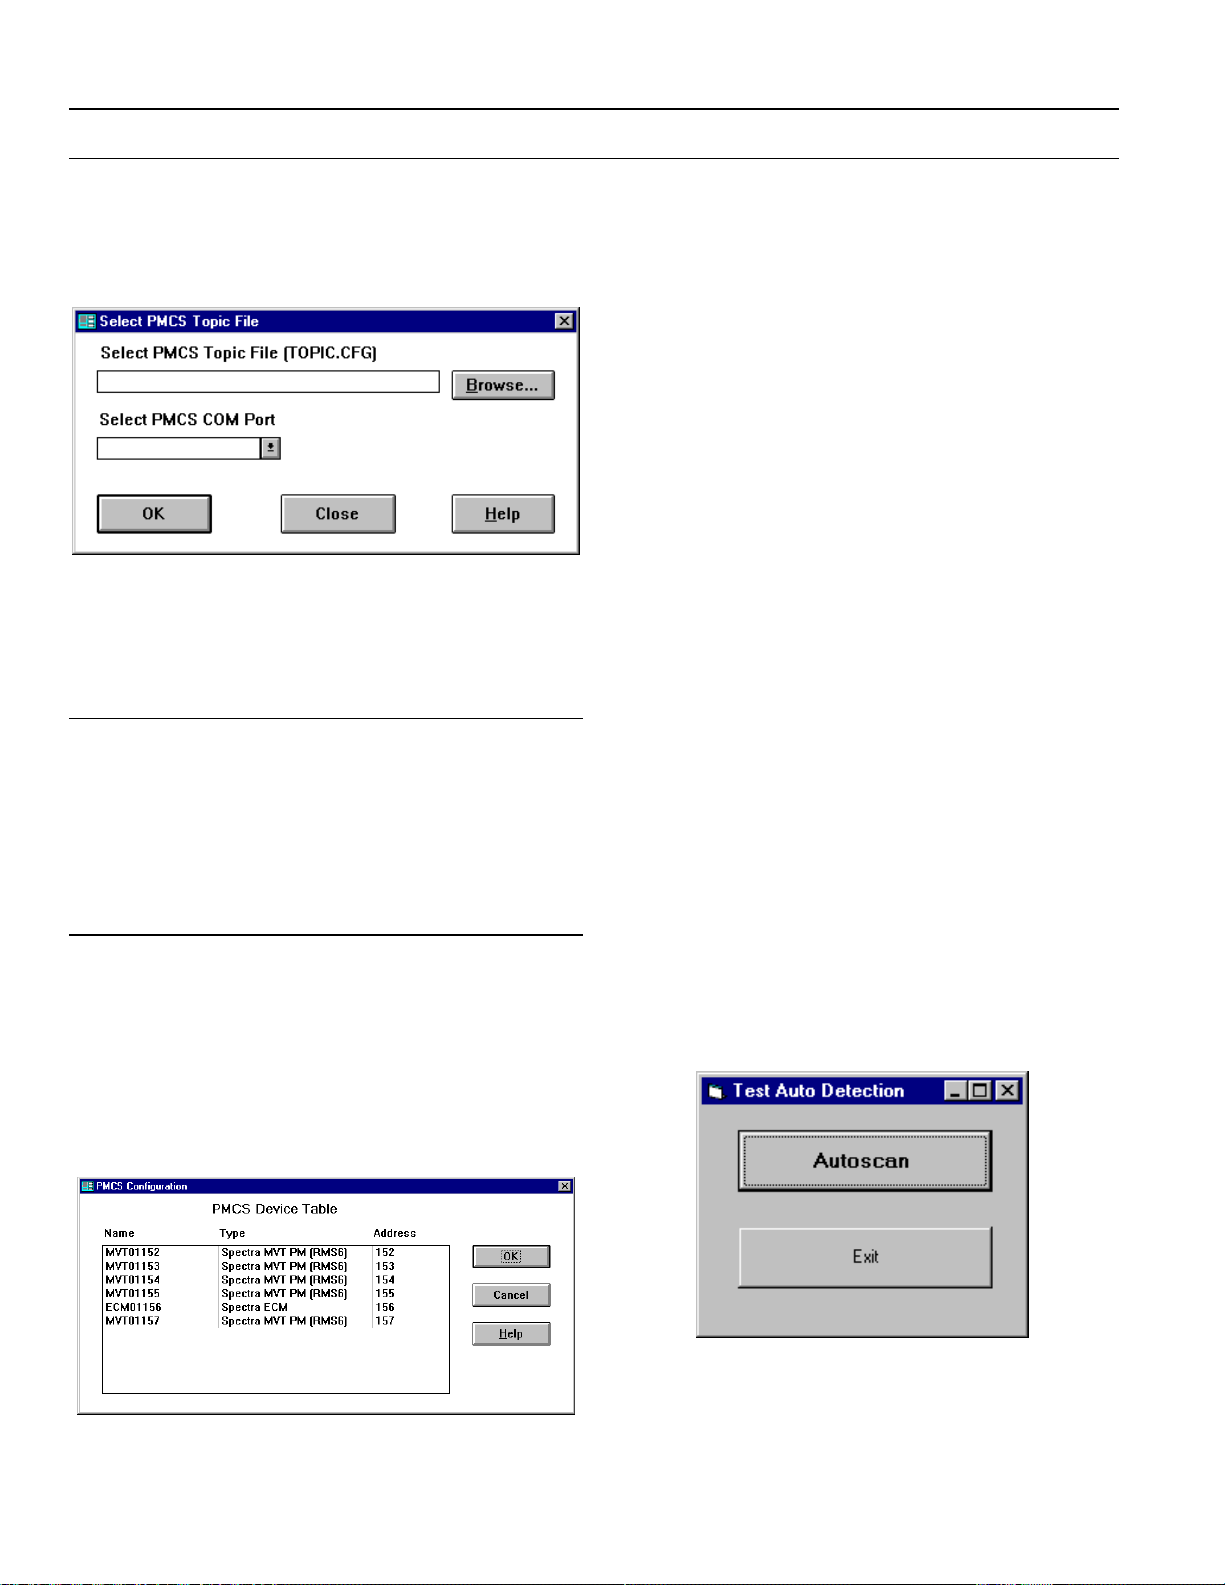
POWER LEADER Modbus Monitor
Chapter 3 – Configuration
shown below in Figure 21. The topic file’s default name
is TOPIC.CFG, but check with the PMCS administrator
to make sure that this is the correct name for your PMCS
topic file.
Figure 21. Select PMCS Topic File dialog.
You will be prompted to locate the DDE Server’s .cfg
file. Click Browse and locate the file. Highlight it and
click OK.
NOTE: If you are using the Monitor Configuration Tool
on a different PC than the PMCS DDE Server runs on,
you will not have access to the PMCS topic file directly.
Copy the topic file from the PMCS DDE Server PC to
the PC where the Configuration Tool is located. The
Configuration Tool is just reading the data out of the
topic file and does not need to access the original topic
file.
Now select the PMCS COM port of the Modbus segment
to which your Monitor will be attached. The PMCS DDE
Server can support up to 256 com ports and Modbus
segments; obviously, we want the configuration data for
the segment our Monitor will be connected to.
If you are satisfied with the data collected from the
PMCS .cfg file, click OK; otherwise, click Cancel.
The Configuration Tool will check the data imported
from the .cfg file for address conflicts. If address
conflicts are found the conflicting devices are not added
to the configuration.
AutoDetect
Another option to obtain segment configuration
information is to perform an AutoDetect. This function
allows the Monitor Configuration Tool to check the
Monitor’s RS-485 ports for attached devices, and create
the Device Table from the responses received from this
poll.
For this option to work, the PC running the
Configuration Tool must be connected to the Monitor via
the RS-232 port, as we’ll be asking the Monitor to
provide us with information about the network to which
it is attached. RS-485 port configuration must already
have been completed as well, so that the Monitor will be
able to properly use the RS-485 port in question.
Selecting this option causes the Monitor to begin
querying the selected Modbus segment for any devices
which may be present on the network, similar to an
electronic roll call. The Monitor sends out a message to
each Modbus address on the Modbus segment asking “Is
there anyone out there?” If there is a device present at
the address, it replies, identifying itself by Modbus
address, device type, etc.
Select AutoDetect from the Device Table dialog box to
display the AutoDetect dialog:
The PMCS Configuration data collected from the .cfg
file is displayed as shown in Figure 22.
Figure 22. PMCS Configuration information screen.
Figure 23. AutoDetect dialog box.
This process may take several minutes, as the Monitor
polls every Modbus address, waits for a reply, and
20
Page 27
POWER LEADER Modbus Monitor
Chapter 3 – Configuration
records the replies from all devices present. While the
Auto Detect routine is in process, the Configuration Tool
is suspended. A progress indicator is displayed showing
the estimated time remaining to completion.
When the Monitor has scanned all available Modbus
addresses, the information it has collected is passed to
the Configuration tool and analyzed to create a
configuration file based on these findings. A message
indicating the successful completion of the AutoScan is
displayed.
From this point, you can perform additional
configuration on the profile, organizing the devices into
logical groups or performing further customization.
NOTE: Modbus Concentrators detected by the AutoScan
function are not saved in the profile; the Concentrator is
not a tightly integrated device type, so the Monitor sees
it as an unknown device type.
Groups
The devices tracked by the Modbus Monitor may be
organized into groups for easier viewing or more logical
organization. For instance, you might want to group all
devices on an assembly line into one group, and all
devices in a paint room into another group, or group all
devices on an electrical panel together.
Select Group Configuration to display the Group
Configuration dialog box shown in Figure 24.
To create a new group, click on New Group, enter the
new group’s name, and click OK. Up to 31 groups can
be defined, for a total of 32 groups (counting the Default
group). The Default group contains all devices which
have not been assigned to a user-defined group. A device
may only belong to one group.
Figure 25. Add New Group screen.
Similarly, to delete a group, select it from the Group:
window and click Delete Group. The group is deleted
and the devices assigned to it are returned to the Default
group.
To change the name of a group you have created, click
Modify Group and enter the new name.
To add devices to or remove devices from a group, select
it from the Groups list box at left, then click the Modify
Devices… button.
The Modify Group Devices box is shown in Figure 26.
The Default group appears in the left window, showing
all available (unassigned) devices. The selected group
appears in the right window. The controls between the
two windows may be used to shuffle devices back and
forth between the two groups. When you are satisfied
with the devices assigned to the selected group, click
OK.
Figure 24. Configuration Tool Group Configuration screen.
21
Page 28

POWER LEADER Modbus Monitor
Chapter 3 – Configuration
Figure 26. Modify Groups screen.
parameters, click the radio button for Port Configuration
and press OK. The Monitor Port Configuration screen is
displayed as shown in Figure 17. Make any necessary
changes and press OK to return to the Modify
Configuration screen.
Advanced Configuration
The Modbus Monitor is highly flexible and offers ability
to support user-defined “generic” device types. The only
requirement is that devices have register-based Modbus
RTU communications via RS-485, and that the data
formats used for these registers are supported by the
Monitor (see Appendix C for a list of supported data
formats).
Communication Timeout Setting
The Communication Timeout Setting option refers to the
amount of time in milliseconds the Modbus Monitor
(when serving as Master on a Modbus segment) will wait
for a response from a device before declaring that the
device has timed out. When a device times out, the
request for data will be sent again.
After three consecutive time-outs, a device is declared to
be dead and will be periodically scanned to see if it has
come back online.
It is recommended that this setting be left at the default
value of 1000 ms. Increasing this setting may slow down
network performance, while decreasing it may cause
excessive and unnecessary timeout errors.
If you wish to use devices other than those listed in
Table 1, you’ll need to define new device types so that
the Modbus Monitor will recognize these devices. This
configuration, while not difficult, is an advanced feature
and it is recommended that generic device configuration
be attempted only if you have a thorough understanding
of Modbus RTU register-based communications.
Due its advanced nature, this option has been removed
from the main body of instructions to Chapter 7:
Advanced Configuration.
Read Files from a Monitor
The Monitor Configuration Tool allows you to read the
configuration data from a particular Monitor into the
Configuration Tool, where you may then save it to disk
for a backup or modify it. This procedure also reads the
Monitor’s local event log, if there are any events
recorded.
Select Read Configuration from a Monitor and click OK.
The Read Configuration screen appears:
Figure 27. Configuration Tool Operational Parameters screen.
Port Configuration Settings
As discussed previously, for the Monitor to receive and
transmit data with the Modbus network correctly, the
Monitor’s communication settings (baud rate, data bits,
parity, and stop bits) for each RS-485 port must match
the communications settings for the Modbus segment
associated with that RS-485 port. To change any of these
Figure 28. Monitor Configuration Tool: Read Configuration dialog.
22
Page 29

POWER LEADER Modbus Monitor
Chapter 3 – Configuration
To perform this function, the Configuration Tool
requires two things. First, the RS-232 connection
between the PC and the Monitor must be in place.
Second, the Monitor must be placed in Setup mode. See
the section below titled PC to Monitor Connection for
details.
Select an existing configuration to overwrite with the
incoming data from the Monitor, or enter a new name (4
to 20 alphanumeric characters) to create a new
configuration to receive the Monitor’s data. Click Read
to upload the configuration information from the
Monitor to the selected Configuration. A progress
indicator will appear, showing as each portion of the
configuration file is transmitted from the Monitor to the
Configuration Tool.
Click Cancel to exit without reading files.
When you read a configuration from a Monitor, both the
Hybrid device definition file and the Generic device
definition file stored by the Modbus Monitor are read by
the Configuration Tool. There are three possible
outcomes that the Configuration Tool may find:
When the Read Configuration is complete, if generic or
hybrid device types were found, you’ll have the option to
display the Device Types Result Log, showing what
information was obtained from the Monitor. This is
shown in Figure 29.
The three columns in the Result Log show any device
types added, any device types ignored due to a duplicate
name already existing in the configuration, and any
device types skipped. If any device types were skipped,
you’ll know that you have exceeded the 31 device type
limit and must delete one or more device types if you
wish to add those which were skipped.
1. There may be hybrid or generic device types
defined at the Monitor which do not exist in the
defined configuration at the Configuration Tool, so
they are added;
2. There may be hybrid or generic device types
defined at the Monitor which are already present
in the Configuration Tool and are ignored;
3. There may be hybrid or generic device types
defined at the Monitor which do not exist in the
defined configuration at the Configuration Tool,
but cannot be added because the configuration
already contains the maximum of 31 device types.
23
Page 30
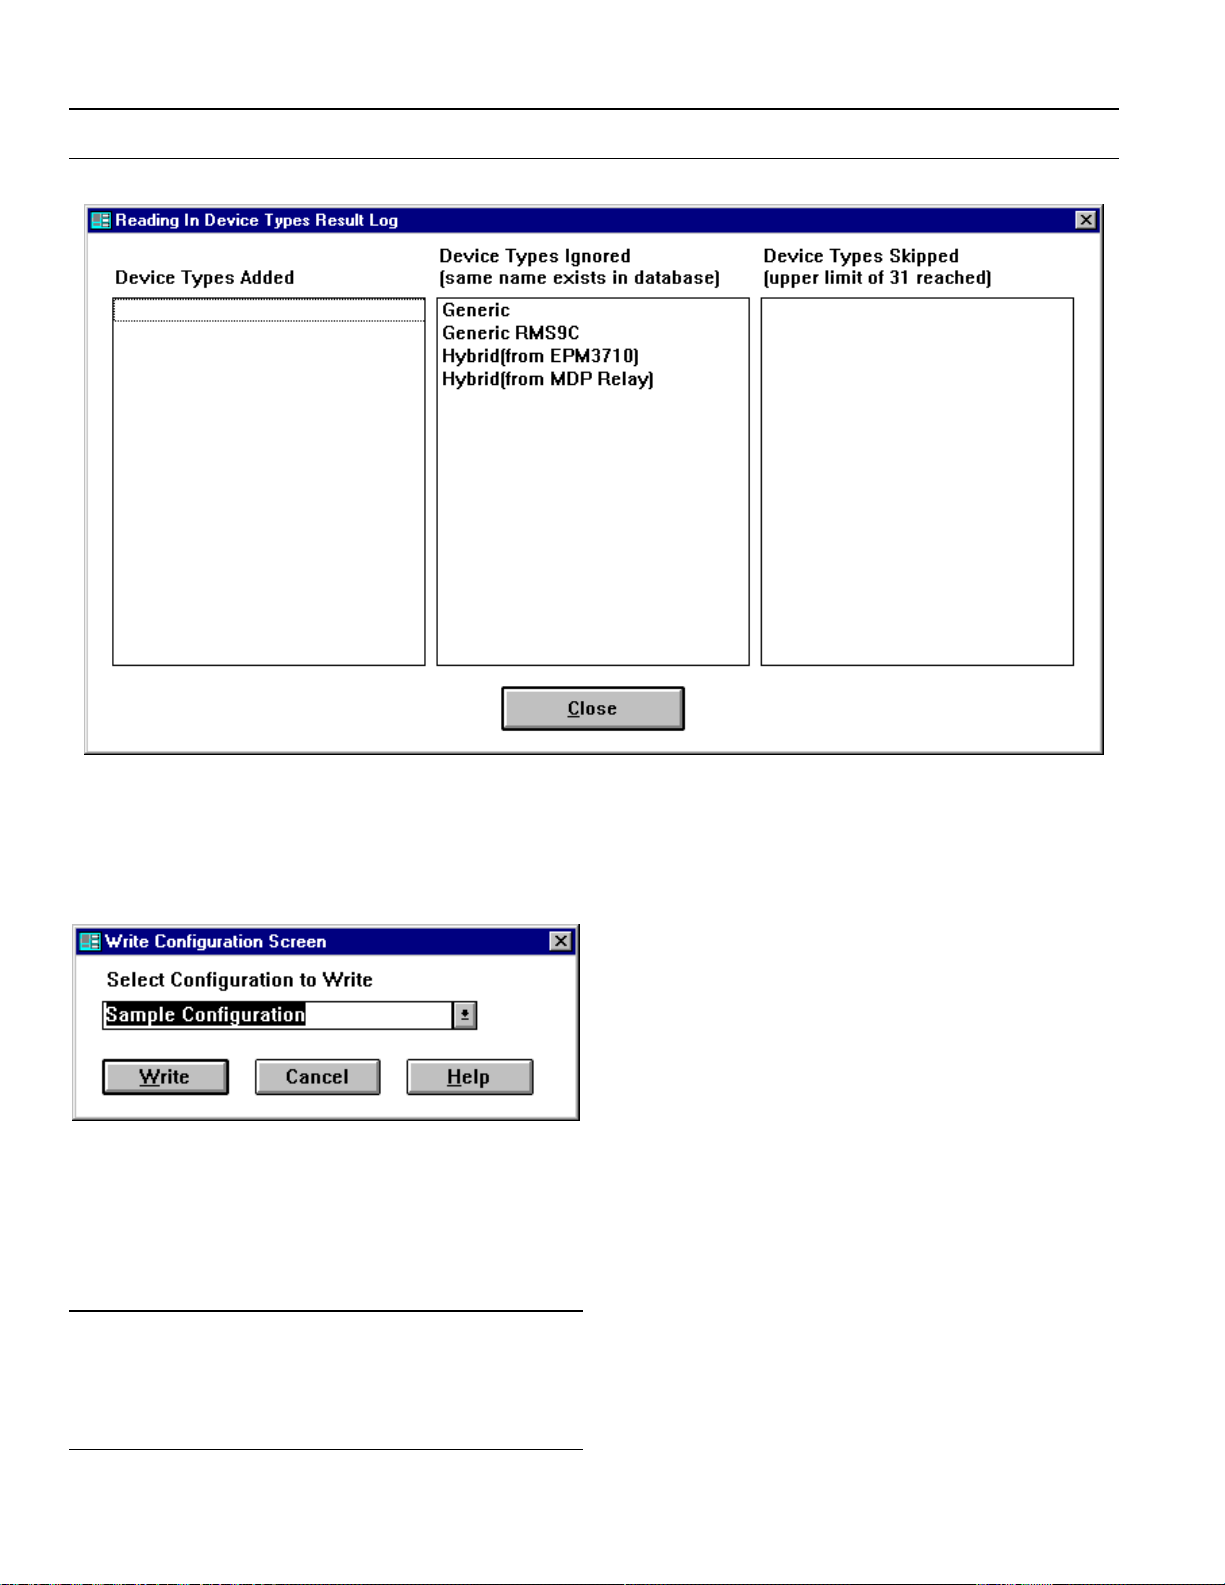
POWER LEADER Modbus Monitor
Chapter 3 – Configuration
Figure 29. Device Types Result Log.
Write Files to a Monitor
Figure 30. Monitor Configuration Tool Write Configuration dialog.
When a Monitor profile is completed and ready to be
written to the Monitor, select Write Configuration to a
Monitor and click OK. The Write Configuration screen
(Figure 30) is displayed.
To perform this function, the Configuration Tool
requires two things. First, the RS-232 connection
between the PC and the Monitor must be in place.
Second, the Monitor must be placed in Setup mode. See
the section PC to Monitor Connection for details.
Select the desired configuration from the pulldown list,
then click Write to download the configuration file to the
Monitor.
When the configuration file has been written to the
Monitor, exit the Configuration Tool. The Monitor is
now ready for operation. Disconnect the RS-232 cable
from the Monitor and the PC. Turn off the unit until the
rest of the network is ready for operation.
Print Files
There are only two options on the Monitor Configuration
Tool’s Configuration pull-down menu. One option, Exit,
closes the Configuration Tool. The other option allows
you to print the current configuration file. The Print Files
dialog is shown in Figure 31.
24
Page 31
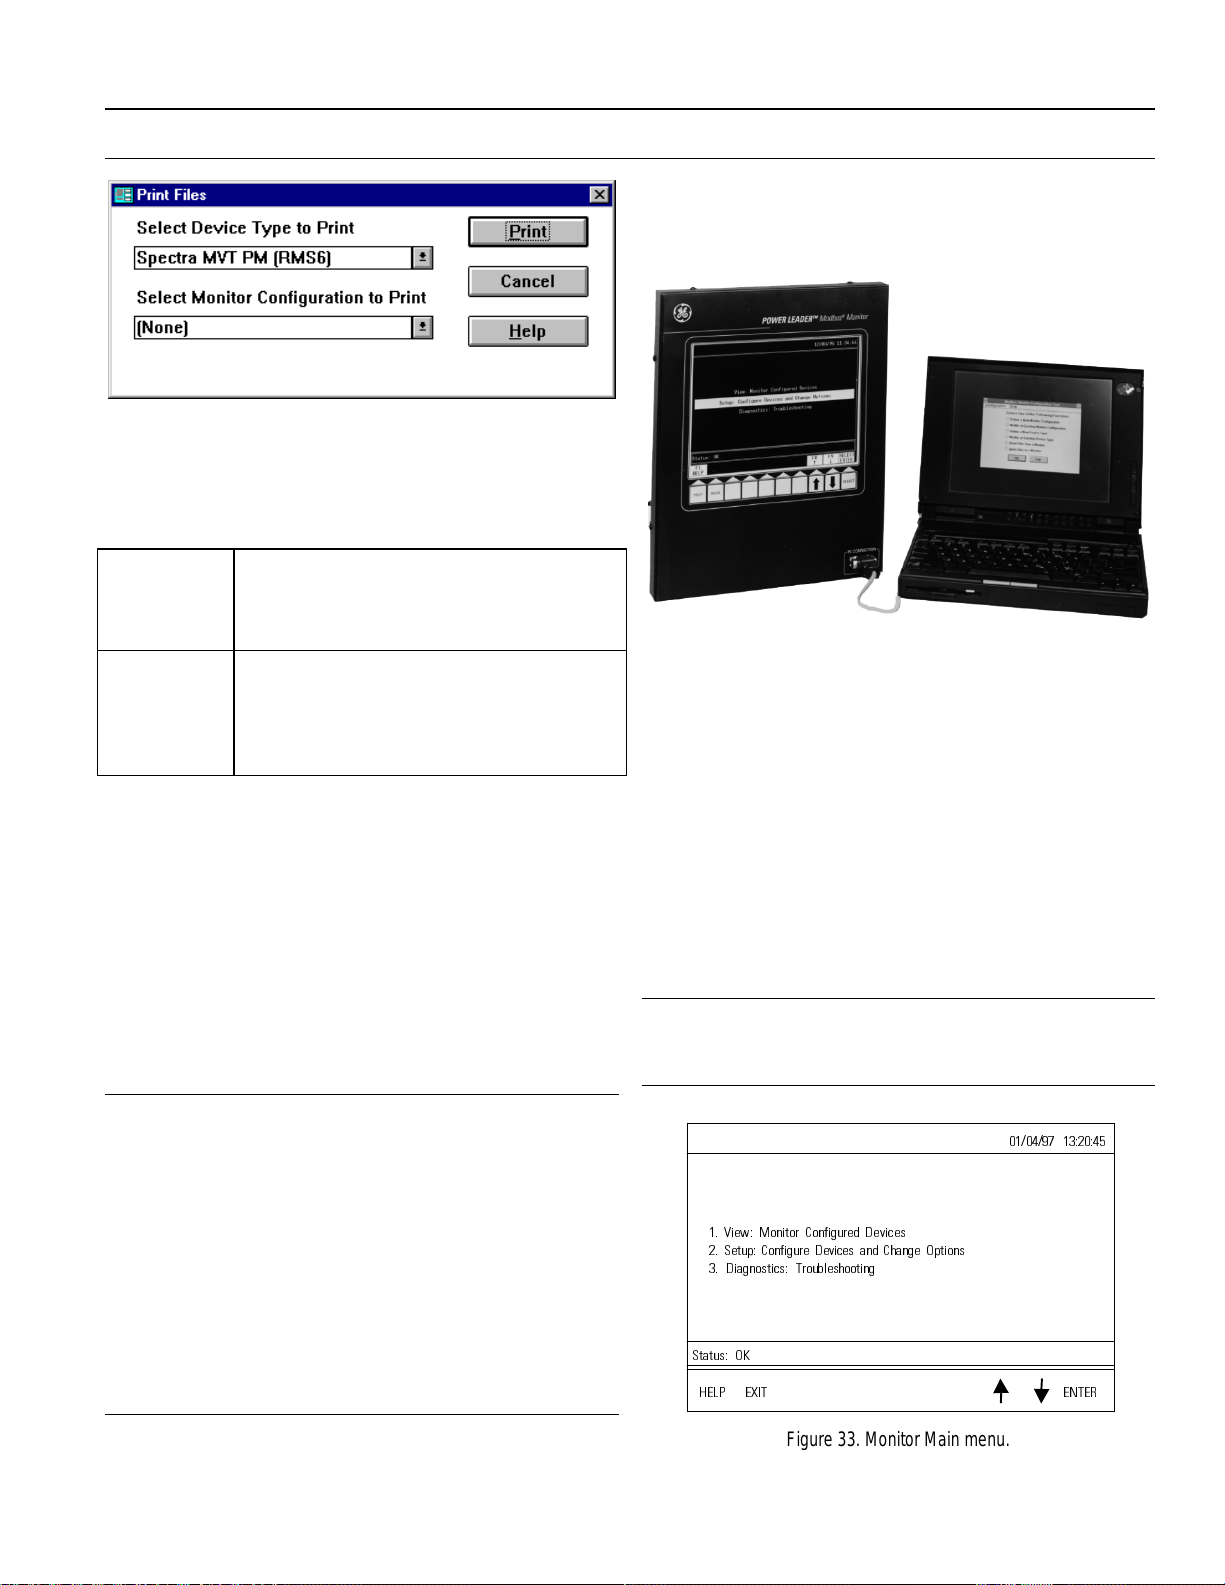
Figure 31. Monitor Configuration Tool’s Print dialog.
Select either a Device Type or a Monitor Configuration,
then click the Print button. The following information
prints on the default printer.
Device Type Prints the Device Type Name, Class, Source TID Type
Name, Operating Mode, a map of the device’s data
screens, and a complete register map for the device
type.
Monitor
Configuration
Prints a complete list of devices in the selected
configuration, including port, device name, location,
device type, address, scan rate and group name,
followed by detailed information on each RS-485 port
and the local event log.
To change the default printer, use the Printers control
panel.
POWER LEADER Modbus Monitor
Chapter 3 – Configuration
Using the RS-232 cable provided with the Monitor,
connect the RS-232 port of the PC to the RS-232 port of
the Monitor, as shown in Figure 32.
Figure 32. PC to Monitor RS-232 connection.
PC-Monitor Communications
The Monitor must be placed in Setup mode to accept
configuration changes from the Monitor Configuration
Tool.
First, log in to the Monitor.
PC to Monitor Connection
The Monitor Configuration Tool must be able to
communicate with the Monitor to download a
configuration file to the Monitor or to perform an
AutoScan function. This communications connection is
made through the RS-232 port on the front panel of the
Monitor.
NOTE: By default, the Configuration Tool attempts to
communicate with the Monitor using COM1
communications port on the PC. If the RS-232
connection will be made using any other comm port,
you’ll need to edit the Configuration Tool’s .ini file. The
title of this file is environ.ini and it is located in the same
directory as the application. Using a text editor, change
the PORT= parameter to the number of the comm port
connected to the Monitor. The Configuration Tool
supports communications ports 1 - 4. Save the changes,
then launch the Configuration Tool application and
proceed.
At the Monitor main menu (Figure 33), move the
selection bar (using the up-arrow or down-arrow keys)
down to Setup: Configure Devices and Change Options,
and press the ENTER key.
NOTE: If this is the first time the Monitor has been
powered up, it automatically displays the Setup menu,
since there is no default configuration.
9LHZ 0RQLWRU &RQILJXUHG 'HYLFHV
6HWXS &RQILJXUH 'HYLFHV DQG &KDQJH 2SWLRQV
'LDJQRVWLFV 7URXEOHVKRRWLQJ
6WDWXV 2.
+(/3 (;,7 (17(5
Figure 33. Monitor Main menu.
25
Page 32

POWER LEADER Modbus Monitor
Chapter 3 – Configuration
The Setup menu (Figure 34) should be displayed. While
the Setup menu is displayed (we’ll call this being in
‘Setup mode’), the Monitor listens to its RS-232 port for
commands from the Configuration Tool to upload or
download its configuration file.
NOTE: When you’re going to upload or download
information to or from the Monitor, make sure that the
Screen Saver is disabled or on a very long delay. If the
screen save attempts to operate while an upload or
download is in progress, data transmission errors may
occur.
3URJUDP 8 SJUDGH
6FUHHQ 6DYHU &RQILJXUDWLRQ
6HW 3DVVZRUG
56 3RUW & RQILJXUDWLRQ
$XWR 'HWHFWLRQ IRU 6/7
6HW 'DWH DQG 7LPH
5HWXUQ WR 0DLQ 0HQX
6WDWXV 2.
+(/3 (;,7 (17(5
Figure 34. Monitor Setup menu.
If a download or upload command is received, a progress
bar will show the percentage completed, and indicate
when the transfer is complete.
In the unlikely event of a power failure or system crash
during the download, restart the Monitor and redownload the new configuration.
Monitor Setup Menu
NOTE: Entering Setup mode will SUSPEND monitoring
functions, including Event Logging. While in Setup
mode, the Monitor will not initiate communications with
devices nor collect events.
If password protection is enabled, a password will be
required to enter the Setup menu. If the password is
misplaced or forgotten, contact a GE Resolution
Engineer at 1-888-GE-RESOLV for assistance.
The following options are available from the Setup
menu:
1. Program Upgrade
2. Screen Saver Configuration
3. Set Password
4. RS-485 Configuration
5. Auto-Detection for SLT
6. Set Date & Time
7. Return to Main Menu
These options are described below.
Program Upgrade
The Program Upgrade option is an advanced feature
which allows a new firmware version to be loaded into
the Monitor. This feature should ONLY be used under
specific direction from qualified GE Industrial Systems
personnel.
NOTE: Downloading firmware not approved by GE
Industrial Systems for use with this product will void
ALL product warrantees.
This section details the options available from the Setup
menu.
While most configuration should be done using the
Windows-based Configuration Tool, the Monitor’s user
interface does allow some minor configuration tasks to
be performed directly at the Monitor without needing a
PC.
Enter the Setup menu as previously described.
WARNING: Misapplication of this function will
PERMANENTLY disable the Monitor.
Screen Saver Configuration
This option enables you to set the time delay for the
built-in screen saver. Enter the value in minutes (from 1
to 59 minutes) using the UP and DOWN keys, the press
ENTER to accept your changes.
When the screen saver activates, pressing any key brings
back the current display.
26
Page 33

Set Password
POWER LEADER Modbus Monitor
Chapter 3 – Configuration
This option permits you to enable or disable the
Monitor’s password protection. You may also use this
option to change the current password.
Selecting Set Password displays the Set Password
screen. The cursor is positioned next to
ENABLE/DISABLE PASSWORD. Press the UP arrow
or DOWN arrow key to toggle between enabled and
disabled password protection. Press SELECT to enter
your choice. If you are choosing to disable password
protection, press SELECT again to confirm your choice.
If you have enabled password protection, the cursor will
be positioned on the first space of the ENTER NEW
PASSWORD line. The labels for several keys will
change to 1, 2, 3 and 4. Press one of the numbered keys
to enter the first digit of the password and advance the
cursor to the next character. Enter the remaining digits.
When you have completed the four character password,
press SELECT to enter it. You will be asked to confirm
the password by repeating the process. If the
confirmation password does not match the new
password, a message will alert you of this and you will
be asked to begin again.
RS-485 Port Configuration
Some parameters of the Monitor’s RS-485 ports may be
configured locally rather than via the Configuration
Tool. This menu item allows you to make changes to the
following items:
ITEM DEFAULT
VALUE
Segment
connection
Modbus address (null) 1 - 247
Baud rate 19,200 1200, 2400, 4800,
Parity none none, odd, even
Stop Bits 1 1, 2
A A or B
VALID
OPTIONS
9600, 19,200
Use the UP arrow or DOWN arrow keys to scr oll to the
item you wish to change. Press SELECT. Then use the
UP and DOWN arrow keys to adjust the item to the
desired value and press SELECT to enter the change.
The available options are shown to the right of each
field.
Note that the first field, Segment Connection, determines
which Modbus port the remaining fields refer to. On a
single-port version of the Monitor, the Segment
Connection field is always A.
When changes are completed, press BACK to exit.
Auto-Detection for SLT
For factory use only. If you accidentally select this item,
press BACK/EXIT to return to the Setup menu.
Set Date & Time
This option allows you to set the date & time of the
Monitor’s internal clock. The clock is battery powered
and will keep time regardless of whether the Monitor has
control power connected. However, the operating system
does not support automatic time adjustment for Daylight
Savings Time or geographic time zones. The Modbus
Monitor ships from the factory with the real-time clock
set for Eastern Standard Time. Note that military time is
used; i.e., the hours field may have a value of 1 to 24.
To change the date or time, use the UP or DOWN arrow
keys to move to the field you wish to change, then press
SELECT. Now use the UP or DOWN arrow keys to
adjust the field to the desired value. Press SELECT to
enter the changes.
NOTE: If the Monitor is connected to a PMCS system,
the PMCS DDE Server provides time synchronization to
the Modbus Monitor.
Return to Main Menu
Selecting this option returns you the Monitor’s main
menu.
27
Page 34

POWER LEADER Modbus Monitor
Chapter 3 – Configuration
(This page left blank intentionally.)
28
Page 35

Chapter 4 Operation
POWER LEADER Modbus Monitor
Chapter 4 – Operation
Introduction
During normal operation, the Monitor collects data from
devices on the Modbus segments. The data may be
viewed locally on the display.
When not in immediate use, a screen saver is activated to
prevent screen burn-in. The Monitor automatically
activates its built-in screen saver after 10 minutes
without user interaction. Pressing any key returns the
display to normal operation.
Keypad/Menu Navigation
The Modbus Monitor’s functions are menu-driven,
accessed using the up arrow and down arrow keys to
highlight desired selections, then the SELECT key to
accept your choices. Should you inadvertently enter a
wrong screen, pressing the BACK key will return you to
the previous screen. Pressing the HELP button displays
context-sensitive help regarding the current screen.
The Monitor keypad has 10 keys, located on its front
panel directly below the screen. At the bottom of the
screen is a key bar, displaying a command above each
key that has a function at the current time.
At any given time, various options are listed on the
display, one of which will be highlighted by a ‘selection
bar’. Pressing the up-arrow or down-arrow key on the
keypad scrolls the selection bar up or down the list of
items. Pressing the SELECT selects the currently
highlighted menu item.
6(/(&7%$&.+(/3
Figure 35. Monitor Keypad.
Main Menu
During usual operation of the Monitor, the following
main menu is displayed:
+267
LQGLFDWRU
DSSHDUV KHUH
(9(17
LQGLFDWRU
6WDWXV EDU
9LHZ 0RQLWRU &RQILJXUHG 'HYLFHV
6HWXS &RQILJXUH 'HYLFHV DQG &KDQJH 2SWLRQV
'LDJQRVWLFV 7URXEOHVKRRWLQJ
6WDWXV 2.
+(/3 (17(5%$&.
Figure 36. Monitor Main menu (details).
The indicator bar at the top of the screen contains several
fields. An indicator at the top left corner will display
“HOST” if the Monitor is acting as master to the
Modbus segments. To the right of the Host indicator is
the EVENT indicator. If this is present, it indicates that
there are new events to view. Lastly, in the upper right
corner of the display, the date and time are shown.
Beneath the indicator bar is the main body of the screen,
usually presenting a menu, a screen of device data, or a
list of events.
Under the main body of the screen is another horizontal
bar of data - the status bar. The status bar contains
system messages such as STATUS: OK if all is well, or
error messages if problems have occurred. While
viewing device data, this area contains device
information such as device name, device type, location,
Modbus segment and network address.
Beneath the status bar, the key bar display shows which
keys are currently available and active; i.e., which keys
have an effect for the current display.
'$7( 7,0((9(17
'DWH 7LPH
GLVSOD\
0DLQ ERG\
RI VFUHHQ
GLVSOD\V
PHQXVGDWD
.H\SDG
IXQFWLRQ FXHV
The first option on the main menu, View: Monitor
Configured Devices, is the focus of this chapter. Option
2, Setup, has been covered in Chapter 3, and Option 3,
Diagnostics, is the subject of Chapter 5.
29
Page 36

POWER LEADER Modbus Monitor
Chapter 4 – Operation
Notes on Password Protection
The Monitor’s Setup menu and Diagnostics menu can be protected from unauthorized access by activating the Monitor’s
password protection function. (There is no password protection for the basic viewing functions.) If Password Protection is
enabled, the user must enter the correct password when selecting either Setup or Diagnostics from the Main Menu. As well, if the
screen saver activates while the Monitor is in either Setup or Diagnostic modes, you will be required to re-enter the password to
resume functioning.
At the ENTER PASSWORD prompt, enter the password by entering four sequential digits, selecting each digit with the up/down
arrow keys and pressing select to move on to the next digit. Entering an incorrect password causes an error message to be
displayed and asks you to re-enter the password.
Forgotten the Password?
Should the password be forgotten or misplaced, contact a GE Resolution Engineer at 1-888-GE-RESOLV.
Using the up arrow or down arrow key, move the
selection bar until View is highlighted. Press ENTER to
select the View option, and the following menu appears:
'$7( 7,0((9(17
/RRN DW D 'HYLFH
/RRN DW WKH /RFDO (YHQW /RJ
5HWXUQ WR WKH 0DLQ 0HQX
6WDWXV 2.
+(/3 (17(5%$&.
Figure 37. Monitor View menu.
Option 1, Look At Device, allows you to view real-time
data being read from an individual device. Option 2,
Look at the Local Event Log, allows you to review
events which have been logged by the Monitor. These
options are discussed in greater detail below. The third
option returns to the main menu.
Look at a Device
To see the current data for individual devices, move the
selection bar to this item and press SELECT.
The Device Groups screen appears, similar to the sample
shown in Figure 38. (If no groups have been created, the
DEFAULT group is highlighted.)
'$7( 7,0((9(17
*5283 1$0(
$VP /LQH
$VP /LQH
$VP /LQH
3DLQW 5RRP
6WDWXV 2.
+(/3 (17(5%$&.
Figure 38. Device Groups screen.
Scroll down to the desired device group and press
SELECT to view a list of devices in this group; a sample
screen is shown in Figure 39.
30
Page 37

POWER LEADER Modbus Monitor
Chapter 4 – Operation
'$7( 7,0((9(17
'(9,&( 1$0(
3/ 0RWRU 5HOD\
3/ 0RWRU 5HOD\
3/ )HHGHU 5HOD\
3/ )HHGHU 5HOD\
3/0
6WDWXV 2.
+(/3 (17(5%$&.
Figure 39. Monitor Devices list.
The devices in the selected group are listed. If the group
contains more devices than will fit on one screen, the
Page Down button becomes active, and you may scroll
through multiple pages of device listings within the
currently selected group.
At the bottom of the screen is a summary of the currently
selected device’s information, including the device
name, location (if entered by the user), device type, and
Modbus address.
Scroll to the particular device of interest and press
SELECT to view detailed information for the chosen
device. The first screen of detailed device information
appears, presented in a tabular format. There may be as
many as 10 screens per device. An example of a device
data screen is shown below:
/DVW 8SGDWH KP
'HYLFH$/0HWHU
:\H 9DOXHV $ % & 1 7RWDO
&XUUHQW $
9ROWDJH /1 9
5HDO 3RZHU N:
5HDF 3ZU N9$5
$SUQW 3ZU N9$
3RZHU )DFWRU
'HYLFH $/ 0HWHU 7\SH (OHF 3RZHU 0HWHU (30
/RFDWLRQ 1 3ODQW 0H]]DQLQH 6HJ $
6WDWXV 2.
(917 35(9
+(/3 %$&. /2* '(9
Figure 40. Device Data screen.
3DJH RI
NOTE: The first time you view the data for a particular
device, the data fields will contain asterisks
momentarily, while the Monitor collects the real-time
data. When the data is received, the asterisks are
replaced by real values.
Also worth noting is the fact that, in some cases, N/A
(not available) may be displayed in particular data fields.
This happens in cases where the particular field does not
make sense in the real-world context of the device. For
example, if a device is set up to meter phase voltages,
and the electrical configuration of the circuit that the
device is metering is a DELTA configuration (as
opposed to WYE), then voltages relative to Neutral are
meaningless. In this case, data fields associated with
Phase to Neutral voltages will contain N/A.
The Monitor supports up to ten pages of data for each
device, and you may scroll through these pages using the
Monitor’s keypad, pressing the page up and page down
arrows. Help for the particular device being viewed is
available by pressing the HELP key
Up to this point, you have been working “vertically”;
that is, one screen is always parent to another and you
may opt to return to a previous screen or move to a sub
screen. From the View Device screen, however, you may
page between the current device and the last device
viewed by using the PREVIOUS DEVICE key. When
you page between the current and the last-viewed device,
the buffered information held in the Monitor’s memory
is presented on the display. However, this data may be
somewhat aged (stale). The ‘staleness’ of the data may
be checked by looking at the LAST UPDATE field next
to the DATE/TIME field. The LAST UPDATE field
indicates how long in hours and minutes it has been
since the data was received at the Monitor. This field
also provides a means to check if a device has gone
“dead”- the DATA AGE counter only accumulates up to
99 hours and 59 minutes and does not roll over; if the
data age is 99 hours, 59 minutes, there’s a good chance
that the device in question is dead and should be
checked.
A visual representation of the screen hierarchy is
presented in Figure 41.
31
Page 38

POWER LEADER Modbus Monitor
Chapter 4 – Operation
'HYLFH *URXSV
VHOHFW JURXLS KHUH
6HOHFW 'HYLFH WR 9LHZ
VHOHFW LQGLYLGXDO GHYLFH KHUH
3DJH
3DJH
3DJH
'HYLFH 'DWD
&XUUHQW 'HYLFH
/RFDO (YHQW /RJ
/RRN DW D 'HYLFH
Figure 41. Monitor View Devices menu structure.
Look at the Local Event Log
The Local Event Log tracks events such as tripping
circuit breakers, etc., for any tightly integrated and
hybrid devices which support events. The last 50 events
and alarms are stored in the Local Event Log.
As mentioned previously, as new events occur the
Events indicator is displayed to alert the user. When the
events have been viewed, the indicator vanishes until the
next time an event occurs.
Events are time and date stamped with a resolution of
milliseconds, and contain the name of the device
experiencing the event, the device type, and a text string
describing the event. Events are periodically stored to
non-volatile memory; in the event of a power failure, it is
possible that events which have occurred in the last 100
milliseconds might be lost.
The Event Log stores and displays the individual events
based on time and date, with most recent events
appearing at the top of the event log. When the 50 event
limit has been reached, new events begin to replace the
oldest events in the log on a first-in, first-out basis. A
sample event log screen is shown in Figure 42:
/RFDO
(YHQWV /RJ
30&6
(YHQWV /RJ
LI DYDLODEOH
3DJH
3DJH
3DJH
'HYLFH 'DWD
3UHYLRXV 'HYLFH
'HYLFH $/ 7ULS /RFDO (YHQW /RJ 3DJH RI
'DWH 7LPH 'HYLFH 1DPH 7\SH
$/ 7ULS 7ULS
/RQJ 7LPH 7ULS $ $
$/ 7ULS 7ULS
6KRUW 7LPH 7ULS % $
$/ 7ULS 7ULS
6KRUW 7LPH 7ULS & $
'HYLFH $/ 7ULS 7\SH (QK 09HUVD 7ULS 506&'
/RFDWLRQ 1 3ODQW 0H]]DQLQH 6HJ $
6WDWXV 2.
'(/(7( &/($5 30&6 /1 /1 3* 3*
+(/3 %$&. (9(17 (9(176 (9(176 83 '1 83 '1
Figure 42. Sample Event Log screen.
Use the LINE UP and LINE DOWN keys to scroll up or
down the Events Log one event at a time.
Use the PAGE UP and PAGE DOWN keys to move
between pages of the local Event Log. The current page
number and total number of pages are displayed in the
upper right corner of the screen. Each page of the Event
Log displays up to three events, so there may be as many
as 17 pages to scroll through in the Event Log.
A single event may be deleted individually, or the entire
Event Log may be cleared. To delete an event, scroll to
the desired event using the LINE UP or LINE DOWN
32
Page 39

POWER LEADER Modbus Monitor
Chapter 4 – Operation
keys, then press the DELETE EVENT key. To clear the
entire events log, press the CLEAR EVENTS key.
PMCS Event Log
The PMCS Event Log is a copy of the Event Log tracked
at the PMCS Event Logger software. This option is
available only if the Modbus Monitor is operating as a
slave on a PMCS network and the PMCS Event Logger
client is running. It will appear as an option available
from the Local Events Log displayed at the Monitor.
The PMCS Events Log presented at the Monitor displays
the last 50 events logged by the PMCS Event Logger
software, whether for devices being monitored by the
Modbus Monitor or for other devices being tracked by
the PMCS Event Logger. Alarms are not recorded or
displayed at the Monitor.
NOTE: It is possible that the same event logged by the
Modbus Monitor and the PMCS may have different time
stamps due to differences between the clock settings at
the PC and the Monitor. This may be exacerbated during
Daylight Savings Time, since the Modbus Monitor does
not support automatic Daylight Savings Time correction.
Using the Modbus Monitor with PMCS
As mentioned earlier, the Monitor’s relationship with
PMCS requires the use of the Modbus Monitor Proxy, a
client software package which requests data from the
DDE Server so that the Monitor can eavesdrop on the
replies from the devices to the server.
Launching the Monitor Proxy application automatically
starts the PMCS DDE Server application if it is not
already running. However, quitting the Proxy does not
affect the PMCS DDE Server. To exit both applications,
quit the Monitor Proxy first, then close the PMCS DDE
Server. If you attempt to exit the Server before quitting
the Proxy, an error message will be displayed warning
you that there are client applications with active DDE
links to the Server.
The PMCS Event Log screens may be navigated in the
same manner as the Local Event Log, with the following
exception. The PMCS Event Log may only be viewed;
events may not be deleted, nor may the event log be
cleared, only updated with new events from PMCS.
Press BACK to exit the PMCS Event Log and return to
the Local Events Log.
33
Page 40

POWER LEADER Modbus Monitor
Chapter 4 – Operation
(This page left blank intentionally.)
34
Page 41
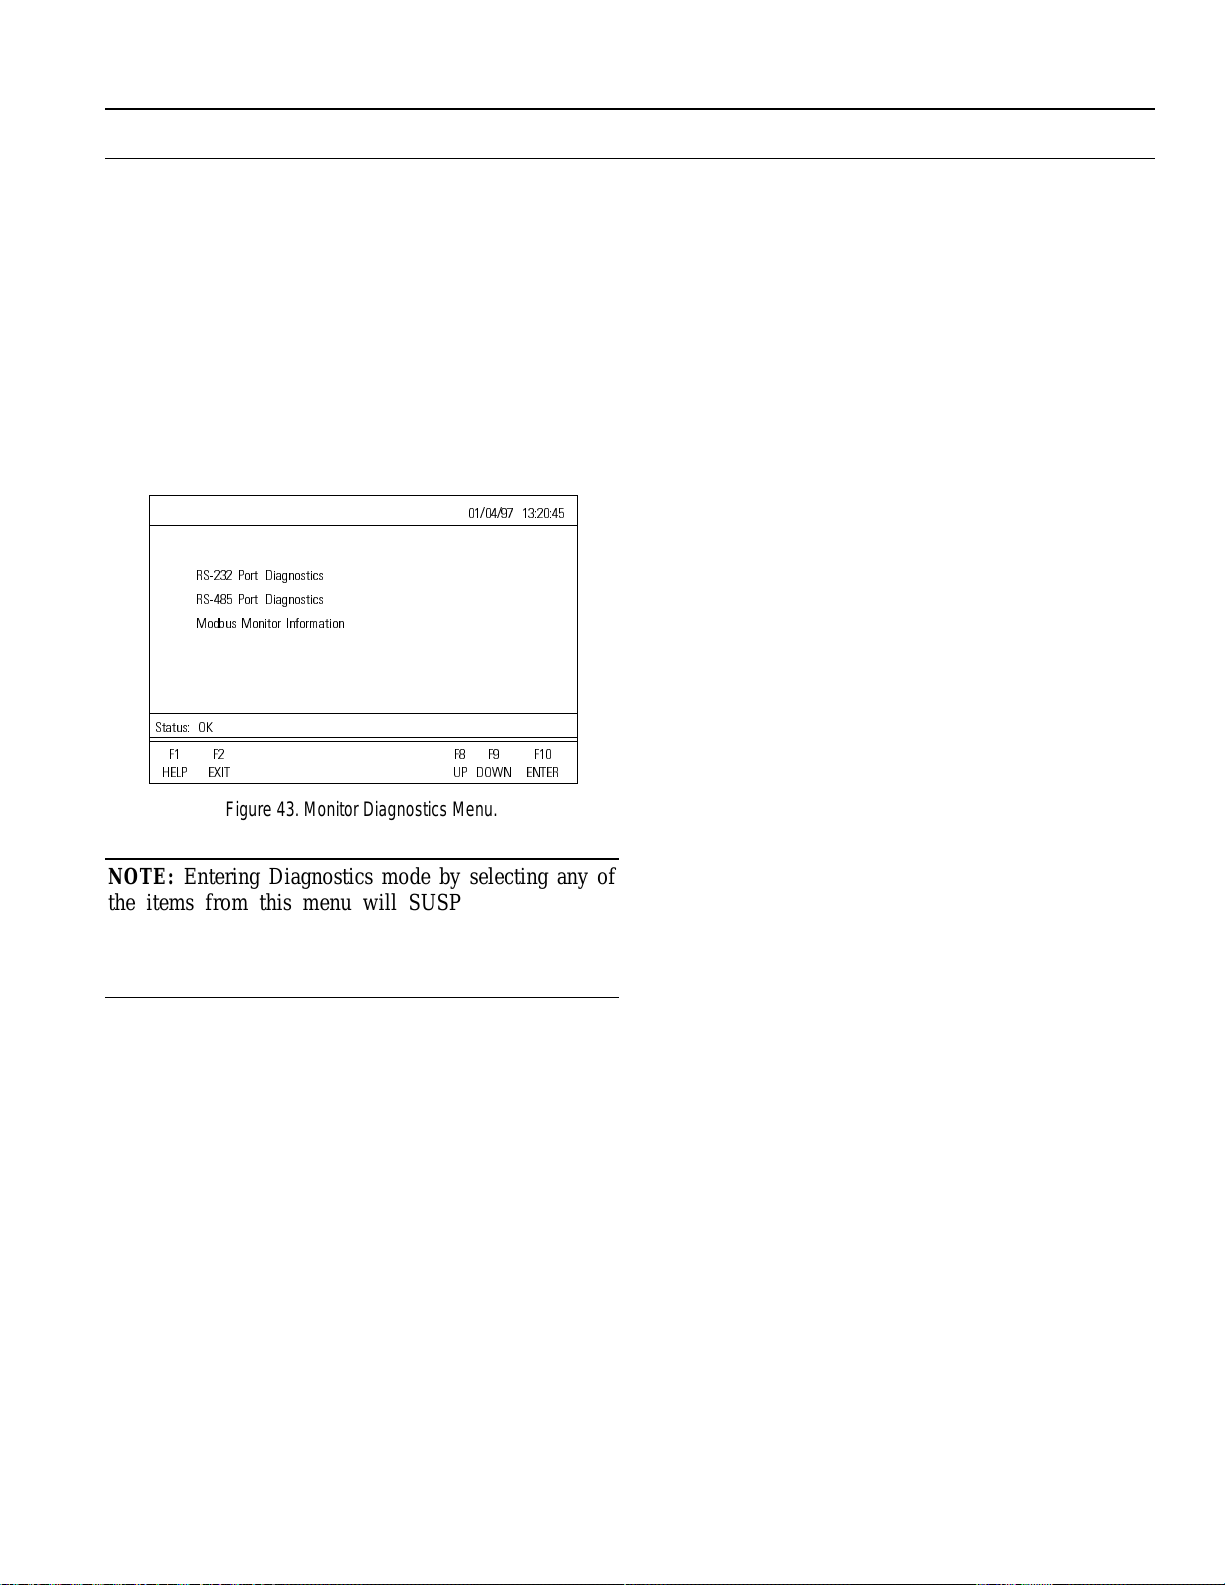
POWER LEADER Modbus Monitor
Chapter 5 – Errors and Diagnostics
Chapter 5
Errors and Diagnostics
Diagnostics & Troubleshooting
The third option on the Monitor’s main menu is
Diagnostics and Troubleshooting.
Selecting this option displays the Monitor Diagnostics
screen (Figure 43).
56 3RUW 'LDJQRVWLFV
56 3RUW 'LDJQRVWLFV
0RGEXV 0RQLWRU ,QIRUPDWLRQ
6WDWXV 2.
) ) ) ) )
+(/3 (;,7 83 '2:1 (17(5
Figure 43. Monitor Diagnostics Menu.
NOTE: Entering Diagnostics mode by selecting any of
the items from this menu will SUSPEND monitoring
functions, including Event Logging. While in
Diagnostics mode, the Monitor will not initiate
communications with devices nor collect events.
RS-485 Port Diagnostics
Selecting this option causes the Monitor’s RS-485 port
diagnostics to perform a self-test on the RS-485 port(s)
and report back on status.
The RS-485 port(s) is opened and closed, and if the test
is successful, the Status Bar will display “RS-485 Port
Test Passed!”. If the test fails, the Status Bar will display
“RS-485 Port Test Failed: Segment (A or B)!”
If the RS-485 port test fails, contact a GE Resolution
Engineer at 1-888-GE-RESOLV for assistance.
Modbus Monitor Information
Selecting this menu item presents a screen of
information on the Monitor, including the Firmware
Revision Number, Hardware Serial Number, the number
of RS-232 ports (always 1) and the number of RS-485
ports (1 or 2).
Press PAGE UP or BACK to return to the Diagnostics
menu.
If password protection is enabled, a password will be
required to enter Diagnostic Mode. If the password is
misplaced or forgotten, contact a GE Resolution
Engineer at 1-888-GE-RESOLV for assistance.
RS-232 Port Diagnostics
This option performs a self-test on the RS-232 port and
reports back on status. The RS-232 port is opened and
closed, and if the test is successful, the Status Bar will
display “RS-232 Port Test Passed!”. If the test fails, the
Status Bar will display “RS-232 Port Test Failed!”
If the RS-232 port test fails, contact a GE Resolution
Engineer at 1-888-GE-RESOLV for assistance.
35
Page 42

POWER LEADER Modbus Monitor
Chapter 5 – Errors and Diagnostics
(This page left blank intentionally.)
36
Page 43

POWER LEADER Modbus Monitor
Chapter 6 – Troubleshooting Guide
Chapter 6
Troubleshooting Guide
The following guide is provided for trouble-shooting and
isolating common problems. It does not cover every
possible condition. Contact a GE Resolution Engineer at
1-888-GE-RESOLV if the problem persists.
Symptom Possible Cause Corrective Action
Display blank Lack of power
1.
Check that power wires are correctly connected. Measure
voltage by probing directly on the control power terminal
screws.
WARNING:
Voltages hazardous to personnel and equipment may be
present at the power connection.
2. Communications not
functioning correctly;
devices not recognized or
excessive
communications errors.
3. Time stamps at the
Monitor Event Log do
not match the time stamps
seen at PMCS Event
Logger.
4. I’ve forgotten the
password for my
Monitor!
Internal failure in Modbus Monitor
Faulty RS-485 wiring between
Modbus Monitor and Modbus
devices.
Modbus master malfunctioning or
off.
RS-232/RS-485 converter in use
but not configured correctly.
Invalid Monitor network
architecture is in use.
Network wiring may require
additional capacitance.
Clock settings differ between
PMCS host PC and Modbus
Monitor.
Daylight Savings Time in effect.
Misplaced password Contact a GE Resolution Engineer at 1-888-GE-RESOLV
Remove and reapply power to the Monitor to see if the
failure clears itself (possibly caused by external noise).
Note the contents of the display and contact the GE
Resolution Center if the problem persists.
Check that the RS-485 connectors are properly wired and
firmly seated. Are + and - connections reversed? Test
wiring for continuity and polarity to the Modbus master.
Check status of the Modbus master and verify attempted
communications to the Modbus Monitor.
Check RS-232/RS-485 converter setup to be sure that
configuration is correct. The baud rate set at the converter
must match the Monitor’s baud rate.
Verify that the wiring for the networks connected to the
Modbus Monitor matches one of the four valid
architectures described in Chapter 2.
(Non-PMCS systems only.) Replace the 120-ohm
terminating resistor at one end of the Modbus segment in
question with the optional series RC terminator included
with your Modbus Monitor.
Use the setup menu to set the Monitor’s system clock to
the correct time.
for assistance.
37
Page 44

POWER LEADER Modbus Monitor
Chapter 6 – Troubleshooting Guide
Symptom Possible Cause Corrective Action
5. No communication to one
or more Modbus devices;
some devices OK.
The device or a repeater is not
powered.
Check that all devices and repeaters have control power.
If a device does not operate when control power is
present, contact the GE Resolution Center.
6. Garbage data displayed
on screen or display not
updating.
7. Display doesn’t update
when Monitor is in slave
mode and another
Monitor is master.
8. Monitor malfunctions
while in slave mode.
9. PMCS Troubleshooting:
No communications with
Event Logger client.
10. In Slave mode under
PMCS, some or all
displayed values not
updating; fields show
***.
RS-485 wiring is shorted or
improperly connected.
An RS-485 shield has been
grounded incorrectly.
Network configuration is incorrect.
The device is not addressed.
Two or more Modbus devices
have the same address.
Network not properly terminated.
Device type may be incorrect. Check the device type assigned to the device at that
Multiple devices may have the
same Modbus address.
Modbus addresses have been
changed for one or more devices
on the segment without the
Monitor’s configuration being
updated to match.
Event Logger not running or
program has hung.
PMCS DDE Server not
functioning.
Modbus Monitor Proxy not
running.
Locate and remove the incorrect connection.
Refer to Chapter 2 for RS-485 grounding considerations.
Recheck RS-485 network for compliance. Improper
grounding can cause communications errors.
Check that the network conforms to the rules in Chapter 2
regarding RS-485 wiring. Check any dual-port devices to
be sure that each RS-485 port is wired to a separate RS485 network.
Ensure that each device’s Modbus address corresponds to
the address set at the Monitor.
Check devices for duplicate address assignments. Change
the address of the affected device, attempt to
communicate with the original address to see if another
device has that address.
Check that each RS-485 segment has been properly wired
and is correctly terminated at each end.
network address. The device type assigned at the Monitor
must match the real device at each address.
Make sure that each device has a unique Modbus address.
When changing the Modbus address of a device or
changing any of the network configuration parameters,
put the Monitor into Setup mode. Make any local changes
at devices, change the Monitor configuration with the
Configuration Tool, and download the new configuration
to the Monitor before returning the Monitor to normal
operation.
Check to make sure that the Event Logger client software
is running correctly.
Check to make sure that the PMCS DDE Server is
running correctly.
Check to make sure that the Modbus Monitor Proxy is
running.
38
Page 45

POWER LEADER Modbus Monitor
Chapter 6 – Troubleshooting Guide
Symptom Possible Cause Corrective Action
11. PMCS Event Log screen
viewed at Monitor is
blank.
No events have been logged.
None - no events will be visible at the Monitor until some
events are logged by the Event Logger. Note that alarms
are not considered events by the Monitor and will not be
displayed.
12. Monitor displays
“UNABLE TO UPDATE
DATA” and no updates
are displayed.
13. Many timeouts recorded
at PMCS DDE Server.
14. Unable to read or write
configurations to the
Monitor using the
Configuration Tool.
15. AutoScan does not detect
any devices on the
Modbus segment.
16. Device network address
is not available for
selection when adding a
new network device.
Monitor Proxy client application
has lost communications with
PMCS Event Logger client.
The PMCS DDE Server may be
incorrectly configured, showing
the Monitor to be on the wrong
Modbus segment.
Monitor may be physically
disconnected from the network.
Incorrect Modbus address or
Modbus segment set at Server;
Server expects Monitor to be at
address X on segment x when
Monitor is actually at address Y on
segment y.
PC not connected to Monitor.
Port setting on PC doesn’t match
port used by Configuration Tool.
RS-232 port settings incorrect in
either environ.ini or autoscan.ini
file.
Another device has already been
assigned this address.
For the Monitor to display the PMCS Event Log, the
Monitor Proxy client application must be able to
communicate with the PMCS Event Logger client. The
Event Logger client may have locked up or, if it is located
on a different PC and the two clients are communicating
by NetDDE, the network connection may have been lost.
Restart the Proxy after checking to see that the Event
Logger client is running correctly.
Check PMCS network configuration to make sure that the
Monitor is on the correct Modbus segment.
Check the RS-485 connections to the Monitor.
The PMCS DDE Server supports up to 256 Modbus
segments. Check that the PMCS DDE Server is correctly
configured with the proper Modbus segment and Modbus
address for the Monitor in question.
Make sure the RS-232 cable is properly connected
between the Monitor and the PC running the
Configuration Tool.
Check the Configuration Tool’s environ.ini file and make
sure that the Port=x line is consistent with the physical
RS-232 port in use. X must equal the com port number
where the RS-232 cable is attached to the PC.
Check the two .ini files to make sure the RS-232 port is
set correctly. Default is COM1, but not all laptops have
the COM1 port available as the RS-232 port.
In the environ.ini file, the port entry under the [Port
Settings] group must be set to the number of the com port
to which the RS-232 cable is attached. In the autoscan.ini
file, the port entry under the [Settings] group must be set
to the same value.
As device addresses are used, they are removed from the
list of available addresses to prevent conflicts. If an
address appears to be missing, check to see if you have
already assigned this address to another device. Also
check the Modbus Monitor’s network address under the
Port Settings dialog.
39
Page 46

POWER LEADER Modbus Monitor
Chapter 6 – Troubleshooting Guide
Symptom Possible Cause Corrective Action
17. The Configuration Tool
won’t let me change my
configuration from one
port to two ports. .
18. I don’t have a mouse to
use with the
Configuration Tool.
19. I want to use the Create
from PMCS function of
the Configuration Tool,
but can’t find the PMCS
topic file.
20. The Monitor I want to use
as Modbus Master is
operating as a slave to the
other Monitor.
21. The Configuration Tool
won’t let me add a device
type.
22. I’ve forgotten which
database I’ve loaded.
How can I find this out?
23. I’m trying to download a
configuration to the
Monitor, and I’m getting
error messages.
24. I created a configuration,
and downloaded it to the
Monitor. How do I know
that the transfer was
successful?
This function is not permitted. When creating a configuration for a Monitor, you must
assign the correct number of comm ports initially. This
cannot be changed later.
See the notes on using the
Configuration Tool’s keyboard
interface.
Topic file may have a nonstandard name.
Modbus address is higher than the
other Monitor.
The Configuration in question may
already have the maximum number
of device types.
The Configuration Tool allows
you to create new databases, open
existing databases, or save
databases under a new file name.
The Monitor may not be in the
proper mode to receive the
transfer.
The Configuration Tool does not
provide status on this event.
Refer to Chapter 3.
The default name for a PMCS topic file is TOPIC.CFG.
This may be changed by the user of the PMCS DDE
Server, so be sure that you use the correct topic file name
. See your PMCS administrator for information on PMCS
configuration.
Check the Monitors’ Modbus addresses. The Monitor
with the lower Modbus address is always the master on a
segment.
The Monitor supports up to 31 device types, the 21
tightly-integrated types and a maximum of 10 userdefined hybrid and generic devices.
The name of the current database can be seen by using a
text editor to view the environ.ini file (located in the
Windows subdirectory). The file name of the current
database is shown in the [GEDEV6] Table Database
Name entry.
The Monitor must be in Setup Mode to receive
downloads from the Configuration Tool. From the main
menu on the Modbus Monitor, select Setup Mode. Retry
the download.
The Modbus Monitor will display information in the
Status Bar after the transfer is completed. After a
successful download, the Status Bar will indicate “File
Transfer Completed”.
40
Page 47
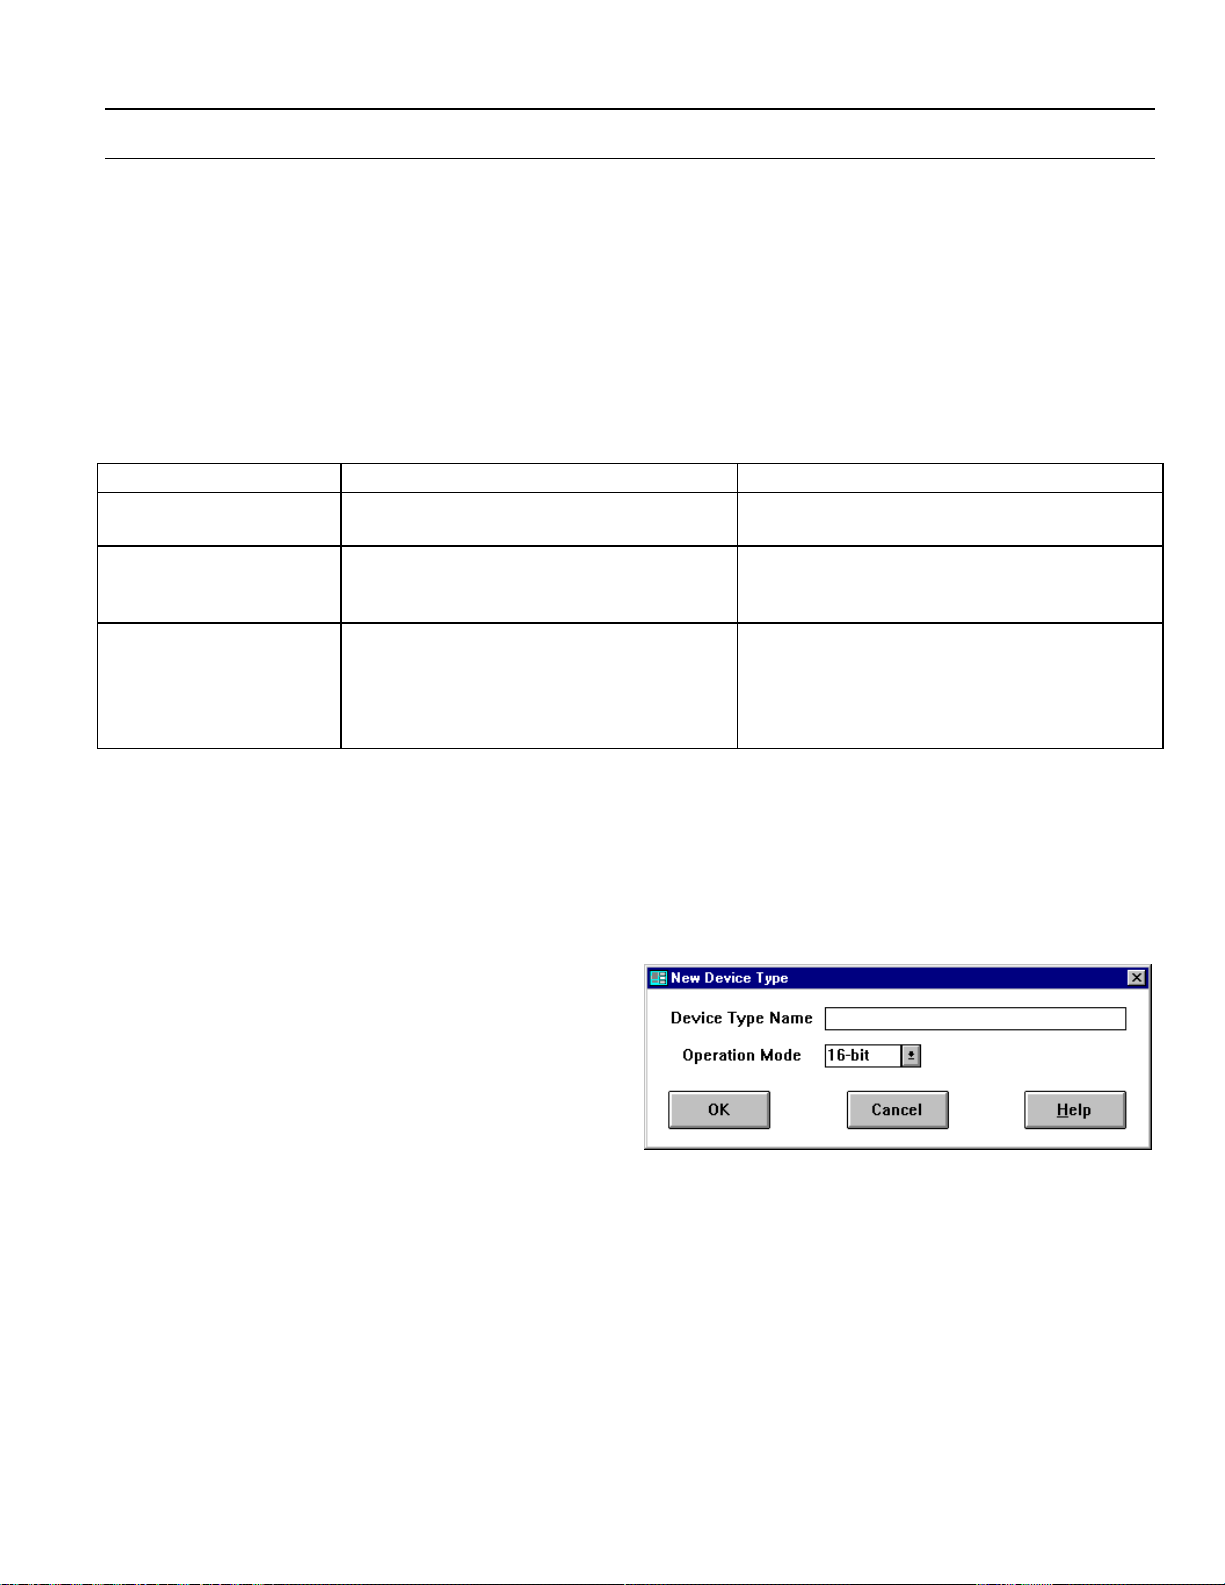
POWER LEADER Modbus Monitor
Chapter 7 – Advanced Configuration
Chapter 7
Advanced Configuration
As we discussed earlier, the Modbus Monitor supports
three classes of device types, tightly integrated devices,
hybrid devices and generic devices. Each class of device
is described in the table below.
Device Class What’s it used for? How’s it created?
Tightly Integrated Devices Displaying standard devices at the Monitor. All register maps and display screens are built into the
Hybrid Devices May be used to create a copy of a TID and then
customize display screens. Supports Events
Handling and Special Handling Registers.
Generic Devices Allows a user to add any kind of device type so
long as the device supports register-based Modbus
RTU communications via RS-485, and the data
formats used are supported by the Modbus Monitor
(see Appendix C).
To create a new hybrid device type or generic device
type based on a tightly integrated device (TID), you’ll
merely save a TID as a new device type with event
To create and define a new generic device type from
scratch, you should have on hand the Modbus RTU
register map for the device. The register map is a
complete listing of the addresses in the device where
data is stored. From this list, you will be able to extract
the registers for the data you are interested in.
This chapter describes how to create hybrid and generic
device types, enter and modify their register maps and
customize the screens displayed at the Monitor for these
device types.
Monitor
Created by saving a tightly-integrated device type as a
new device type WITH Link Events checked.
May be created from scratch.
May also be created by saving a tightly-integrated
device type as a new device type WITHOUT Link
Events checked.
Step 1: Define a New Device Type
The Define New Device Type option from the Monitor
Configuration Tool main menu allows you to create new
device types. The New Device Type screen is shown in
Figure 44.
The Monitor offers the same flexible support of generic
devices whether operating as a stand-alone host device
or as part of a PMCS network. If you are using PMCS
and wish to incorporate a generic device, it is
recommended that you define the device type at the
PMCS DDE Server first, then use the Modbus Monitor
Configuration Tool to set up the new device type for the
Monitor. For information on defining a new device type
at the PMCS DDE Server, refer to GEH-6510, the PMCS
DDE Server User’s Guide.
Figure 44. Monitor Configuration Tool: New Device Type dialog.
Enter a name for the new device type. The name must be
at least 4 and no more than 20 alpha-numeric characters,
and may not include special characters such as \ / , ‘ * +.
Select the appropriate operation mode (16-bit or 32-bit)
from the Operation Mode pull-down list. (The device’s
documentation should provide this information.)
Click OK to accept the new device type, or Cancel to
exit.
41
Page 48

POWER LEADER Modbus Monitor
Chapter 7 – Advanced Configuration
Step 2: Define the Device Type as Hybrid or Generic
To create a generic device from scratch, skip this section
and proceed to Step 3.
To create a new hybrid or generic device type based on a
TID, select a preconfigured device type and click Save
As to save a copy with a new name. The Save As dialog
is shown below:
Figure 45. Save As.... dialog box.
To create a hybrid device type, select YES from the
LINK EVENTS pulldown menu; selecting NO creates a
generic device type.
Saving As… creates a hybrid or generic device type with
the register map and all the display screens of the base
device, which may then be modified or deleted. Generic
devices created from scratch do not have any screens
configured initially; all their screens must be set up by
the user. See the section titled Notes on Hybrid/Generic
Devices later in this chapter for more technical details on
hybrid and generic device types.
Figure 46. Monitor Configuration Tool: Modify Device Types dialog.
The list box displays a list of all defined device types.
Generic device types and hybrid device types may
modified, deleted or saved as new device types.
Preconfigured devices (indicated by a YES in the Tightly
Integrated column next to the device type name) may not
be modified or deleted, but they may be Saved As… to
create a new hybrid or generic device type. Select the
new device type we defined earlier and click Modify to
display the Register Map dialog box (Figure 47).
(To delete a device type, select it and click DELETE.)
Step 3: Create the Device Type’s Register Map
Once a new device type has been created, its register
map must be defined. This enables the Monitor to
request the device’s data. Without knowing the device
type’s register map, the Monitor cannot know where to
retrieve data desired by the user.
From the Monitor Configuration Tool main menu, select
Modify an Existing Device Type and click OK. The
Modify Device Types dialog box appears (Figure 46).
Figure 47. Monitor Configuration Tool: Register Map dialog.
The Register Map dialog box shown in Figure 47 allows
you to tell the Monitor where to find the data you’re
interested in, and what to call that piece of data – its
mnemonic. When you want to fetch the current reading
for phase A, it is far easier to remember (for example)
Amps_A than to remember R42000 or whatever the
register number may be.
Use the following commands to define the register map
for your new device type, then click OK to accept your
changes, or Cancel to exit the dialog without saving your
changes.
42
Page 49

POWER LEADER Modbus Monitor
Chapter 7 – Advanced Configuration
Add Register
Click Add Register to enter a new register:
Figure 48. Monitor Configuration Tool: Add Register dialog box.
Enter the register mnemonic, the register type, the
numeric register address. Select the register format and
the scaling factor from the pull-down lists. The table
below describes each field in more detail. Refer to the
device’s documentation for more information.
Register
Mnemonic
Register
Type
Register
Address
Register
Format
Scaling
Factor
Click OK when the register information is complete. The
register will now appear in the register map list.
Text string, no spaces or special characters.
R0 - coil R3 - input
R1 - contact R4 - holding
See device documentation for details.
Decimal integer only.
Range 0 - 9999 for standard addressing.
Range 0 - 65535 for extended addressing.
See device documentation for correct range.
See Appendix C for more information. The Modbus Monitor
does not support any Register Formats not shown in this
pulldown list.
Default = 1. Select other scaling factors from pulldown list.
Register is multiplied by this value prior to being displayed
on the Monitor’s screen.
Modify Register
To modify an existing register, select it from the register
map list and click Modify to change any of its attributes.
The dialog box to change an existing register is the same
as to add a new register, but instead of coming up blank,
the current values for each register attribute are
displayed. Make any appropriate changes and click OK.
Delete Register
To delete a register, select it from the register map list
and click Delete Register. The register will be removed
from the list and also from any custom screens on which
it has been displayed.
Utilized Register Block List (URBL)
Because of the nature of Modbus RTU communications,
where obtaining a register value requires the master to
query the slave and the slave to send a reply, when you
wish to obtain several register values it is more efficient
to request them all together in a single block. The master
will only have to send one request and the slave will
only have to send one reply, even though the reply
contains additional data.
The Modbus Monitor supports up to 10 blocks of
registers for each register type. A block may contain
from 1 to 125 registers. The register addresses must be
contiguous; that is to say, no holes or skipped addresses
are permitted. If you wanted to obtain data from registers
at addresses 1000, 1015, 1040 and 1042, you would
create a single block of registers starting at 1000 and
ending at 1042 by defining each register in between,
without skipping any, even those of no interest. The
only exception to this rule is that some registers, such as
floating point registers, may occupy multiple addresses;
you are not required to enter each of these addresses,
only the first one. This should be evident from the
device’s register map, where the address will probably
be listed as (for example), 1000-1003.
The idea of register blocks becomes important when you
attempt to customize screens of data, because the
Modbus Monitor will look at the register fields for
display on a screen and will only request up to 10
register blocks. If all the registers you are attempting to
display can be retrieved by requesting 10 or fewer
register blocks, the screen will be displayed correctly. If
more than 10 register blocks must be requested to
43
Page 50

POWER LEADER Modbus Monitor
Chapter 7 – Advanced Configuration
display the screen, only the first 10 blocks will be used
and the rest of the screen display will be discarded.
The creation of these register blocks is a logical exercise
which must be performed by the user; the Configuration
Tool does not offer any special dialog boxes or lists of
register blocks.
To ease the process of creating these blocks of registers,
we suggest that you begin by making a list of the
registers you wish to display, then divide them into a
maximum of 10 groups per register type, with each
group containing no more than 125 addresses, keeping
the extraneous addresses between those you’re interested
in to a minimum. Remember that the addresses should be
sorted by type; all the registers in a single register block
must be of the same type.
Figure 49. Customize Display dialog box.
The Customize Display dialog box appears. From this
dialog box, you’ll be able to add or delete screens and
modify their contents.
Assigning Registers to Screens
With this list of register blocks in hand, go ahead and
enter your registers, including the extraneous ones, into
the configuration.
Step 4. Customize the Display
The screens that will appear on the Monitor are predefined for the pre-supported devices. When you create a
new device type, you have the opportunity to customize
the way you’ll see that device type’s data on the
Monitor’s screen.
If you are creating a generic device type from scratch
you’ll have to define each screen from the ground up. If
you have created the device type by saving a tightly
integrated device type as a hybrid or generic device type,
you’ll have access to all the base device type’s screens to
modify as you please.
To customize the display of a device type, select
MODIFY AN EXISTING DEVICE TYPE from the
Configuration Tool main menu.
The Modify Device Types dialog appears, prompting
you to select the device you wish to modify. Choose the
generic or hybrid device whose screens you need to
create or modify, and click MODIFY.
The Register Map dialog box appears. Click the
Customize Display button.
There are two types of fields available: Label fields and
Data fields. Label fields allow you to enter text labels
which will be displayed on the Monitor. Data fields
allow you to assign a particular register to be displayed.
To assign a label to a field, click in the field and type in
the desired label. To assign a register to a data field,
double click in the field. The Assign/Unassign Registers
dialog box appears, similar to Figure 50. Select the
register for the current field, and click Assign.
Figure 50. Assign/Unassign Registers dialog.
For instance, in the top left field, you might enter the
label Amps Phase A. Then you would double click in the
field next to this label (a data field) and bring up the
Assign/Unassign Registers dialog box.
Select the register you want to assign to this field (in this
case, the register for Amps Phase A), and click Assign.
(If you want to change the register associated with this
44
Page 51

POWER LEADER Modbus Monitor
Chapter 7 – Advanced Configuration
field later, you can use the Unassign button to clear the
field, then Assign a different register to be displayed.)
NOTE: The two sorts of fields are mutually exclusive.
You cannot assign a register to a label field, nor can you
enter a label into a data field. If you attempt any other
action than what is allowed for a particular field, the
program will display a warning box telling you what sort
of field it is and what needs to be placed in the field.
Inserting Screens
To add additional screens, press the INSERT BEFORE
or INSERT AFTER button. (Conversely, the current
screen may be deleted by pressing the DELETE
SCREEN button.) A new screen will be created and
placed before or after the current screen in the list of
screens. The order of the screens set up here determines
the order in which they will be displayed on the Monitor.
Pressing the Insert Before or Insert After button displays
the Insert Screen dialog.
Notes on Hybrid/Generic Device Types
This section will provide some additional background
information on the operation of the Modbus Monitor
with regard to device types.
Special Handling Registers
The tightly integrated device types support special
handling registers which are not available to generic
devices. These special handling registers give the
Modbus Monitor additional information about the
register. In particular, they allow the Modbus Monitor to
associate a string with a register’s value or allow the
displayed value of one register to be modified by the
value of another register.
For example, many devices have a register that indicates
the Last Trip Cause, where a register value of 10
indicates a Long Time Trip and the value of 11 indicates
a Short Time Trip. The Modbus Monitor could easily
display the actual register value, but this is not very
descriptive to the user. By defining the register as a
special handling register, the Modbus Monitor can
display “Long Time Trip” or “Short Time Trip” as
appropriate. The special handling registers are only
available for set of registers defined by the default types,
and cannot be modified by the user.
Figure 51. Insert Screen dialog.
Select the format of the screen you wish to insert by
pressing the Format #1, Format #2, or Format #3
buttons, then press OK. A new screen is created with the
selected format, and you are returned to the Customize
Display dialog with the new screen displayed for you to
fill in with labels and associated registers.
Reset to Defaults
The Reset to Defaults button is available if the hybrid or
generic device being customized is based on a tightly
integrated device. Pressing the Reset to Defaults button
restores the register map and displays to the original
settings present when the TID device type was copied.
Hybrid Device Types
Hybrid devices are redefinitions of the tightly integrated
device types specified by GE. When you Save As… to
create a copy of a tightly integrated device type, you’re
creating a copy of a TID which you may then modify.
(Tightly integrated device types may not be modified.)
The hybrid device types retain all the special handling
registers and event logging features of the tightly
integrated device upon which it was based. This is the
function of the Link Events selection in the Save As…
dialog box. Selecting YES in Link Events creates a
hybrid device with all the special handling registers and
event logging features of the base device; selecting NO
in Link Events creates a generic device type, which do
not support special handling registers or events handling.
When adding additional registers to the hybrid device,
there is no guarantee of support for the data format and
no way to define the register as a special handling
45
Page 52

POWER LEADER Modbus Monitor
Chapter 7 – Advanced Configuration
register. The user can only define a data format from the
list of available formats for the device.
Generic Device Types
Generic device types do not support:
• event logging
• special handling registers
• register data formats other than those shown in
Appendix C
Registers can only be displayed by the Modbus Monitor
if their data formats are recognized by the Monitor. If a
register has any special processing or is an unsupported
data format, the Monitor will not correctly interpret and
display the information.
Generic device types must also be able to support system
communications at 150 milliseconds or faster to be
compatible with the Modbus Monitor. This ‘protocol
timer tick’ is the rate at which the Monitor will query
devices. Every ‘tick’ (150 ms) the Monitor will perform
a network communications action (speaking on the
network). If a generic device cannot keep up with the
potential of one message every 150 milliseconds, the
device will cause communications errors.
Defining Hybrid and Generic Device Types
The Modbus Monitor allows a maximum of 300 registers
to be defined and displayed. The screen formats chosen
for the pages of a device dictate the actual number of
registers that can be displayed for a device. Screen
Format #1 allows 30 registers to be displayed, so having
10 Format #1 pages will allow 300 displayable registers.
Screen Format #3 allows 14 registers to be displayed, so
having 10 of these pages will give 140 displayable
registers. The actual number of registers displayable at
the Modbus Monitor is dictated by the types of screens
defined using Modbus Monitor Configuration Tool and
ranges from a minimum of 140 registers to a maximum
of 300 registers.
It is recommended that when you create a generic or
hybrid device, you define all the device type’s registers
first, then customize the display screens. This way you
will have the full list of registers to select from when yo u
create the display screens.
Defining the Register Set
The Modbus Monitor represents devices by defining a
set of registers for that device. For each register, the
Modbus Monitor requires a register mnemonic, register
type, register address (index), register format and scaling
factor.
The register mnemonic is used by the Modbus Monitor
Configuration Tool to give the register a useful meaning.
The register address is the decimal address of the
register. The register type specifies to the Modbus
Monitor whether the register is a Coil, Contact, Input, or
Holding register. The register format specifies how to
display the register at the Modbus Monitor, and the
scaling factor is a multiplier that specifies a value to
multiply the register data by before displaying it on the
screen.
The Modbus Monitor supports any register within the
extended Modbus address range (0 - 65535), as does
PMCS 6.0. When a register is defined at the user
interface, the Modbus Monitor will request that register
from the device when needed. If the register is not valid
the Modbus Monitor will still request the register.
As discussed earlier in the section titled Utilized
Register Block List (URBL), the Modbus Monitor
allows the user to specify up to 10 blocks of registers for
each type of register. A block of register is defined as a
contiguous sub-set of registers within the current set of
defined registers. If a gap occurs within the register set a
new block is generated. This is to prevent the Modbus
Monitor from requesting an invalid register address
range from a device (thus not updating any register
within that request). Each block can contain a maximum
of 125 registers as per the Modbus specification. The
worst case would allow the user to define only 10
registers.
For example, if the user defines the following registers
in the Modbus Monitor Configuration Tool R40000,
R40010, R40020, R40030, R40040, R40050, R40060,
R40070, R40080 and R40090. The configuration tool
would generate 10 separate register blocks for the R4
type registers. The Configuration Tool has no way to be
sure whether the registers between the defined registers
are valid. If all the registers from R40000-R40090 are
defined at the Configuration Tool, it would only generate
one register block list consisting of a request for all the
registers.
46
Page 53

The Configuration Tool will take the length of the data
format into account when deciding if a gap is present in
the register set. For example, if R31000 is a 4-byte
integer and R31002 is the next register in the register set,
then the Configuration Tool would not consider this a
gap in the register set since R31001 is part of R31000’s
format.
POWER LEADER Modbus Monitor
Chapter 7 – Advanced Configuration
47
Page 54

POWER LEADER Modbus Monitor
Chapter 7 – Advanced Configuration
(This page left blank intentionally.)
48
Page 55

Implementation Basics
POWER LEADER Modbus Monitor
Appendix A – Modbus RTU Protocol
Appendix A:
Modbus Protocol
The Modbus Monitor implements a subset of the
Modicon Modbus RTU protocol standard. Modbus is a
master-slave protocol, which means that a single
host/master device initiates and controls all
communication with the other devices on the network.
For the Modbus Monitor, this would be either a second
Modbus Monitor acting as master, or a computer running
PMCS.
NOTE: The POWER LEADER Modbus Monitor is
compatible only with GE Power Management Control
System software, version 6.0 or greater. It is not certified
to be compatible with any other host software.
The hardware interface is implemented as 2-wire RS-
485. In a 2-wire link, data is transmitted and received
over the same lines. In such a half-duplex link, data is
transmitted and received in separate time slices. Also,
per the EIA-485 standard, the number of devices that can
be connected on a single communication channel is
limited to 32 (including the master). Please refer to
GEH-6502, PMCS Network Architecture Guide and the
EIA-485 standard for complete details of the physical
interface including cabling, termination, and shielding.
Modbus RTU Message Format
The Modbus RTU protocol is strictly based upon a
transaction scheme where a master device generates a
query and a slave device replies with a response.
Each query and response message transaction consists of
the following four parts:
SLAVE ADDRESS 1 byte
FUNCTION CODE 1 byte
DATA N bytes
CRC 2 bytes
DEAD TIME 3.5 bytes transmission time
These parts are described in detail below:
1. Device Address – This is the first byte of each Modbus
RTU transmission. The device address is a number limited
to the range of 0-247 and is associated with a single device
configured with a matching address. This device receives
and processes the transmission from the master. Only the
addressed slave device responds to a transmission beginning
with this address.
Note that a Device Address of 0 indicates a broadcast
command. The broadcast command is not recognized or
supported by the Modbus Monitor.
2. Function Code – This is the second byte of each
transmission and represents the commanded action to the
slave device (for queries from the master) or the action that
was taken by the slave device (for responses from the slave).
Codes between 1 and 127 are defined as Modbus RTU
functions.
If a slave device responds with a function code with the most
significant bit (MSB) equal to 1 (or equivalently a function
code greater than 127), then the slave device did not perform
the commanded action and is signaling an error response.
3. Data – This field contains a variable number of bytes,
depending on the function performed. Data may contain
addresses, actual values, or setpoints.
4. CRC – This is a 2 -byte error-checking code, known as a
Cyclic Redundancy Check. The Modbus RTU standard
requires each message to have a two-byte CRC (commonly
known as CRC-16 for 16 bits of error checking) to be
appended to every transmission.
If the Modbus Monitor detects a CRC error in a received
Modbus message, the Monitor does not respond to the
message. An error in the CRC calculation indicates that
one or more bytes of the transmission were received
incorrectly, so the entire transmission is ignored,
preventing an unintended operation.
The CRC-16 calculation is an industry standard method
used for error detection. An algorithm is included here to
assist programmers in situations where no standard
CRC-16 calculation routines are available.
49
Page 56

POWER LEADER Modbus Monitor
Appendix A – Modbus RTU Protocol
CRC-16 Algorithm
Once the following algorithm is complete, the working
register “A” will contain the CRC value to be
transmitted. Note that this algorithm requires the
characteristic polynomial to be reverse bit ordered. The
MSBit of the characteristic polynomial is dropped since
it does not affect the value of the remainder. The
following symbols are used in the algorithm:
-----> data transfer
A 16 bit working register
AL low order byte of A
AH high order byte of A
CRC 16 bit CRC-16 value
I, j loop counters
(+) logical exclusive or operator
Di i-th data byte (I = 0 to N-1)
G 16 bit characteristic polynomial = 1010000000000001
with MSBit dropped and bit order reversed
shr(x) shift right (the LSBit of the low order byte of x shifts into
a carry flag, a ‘0’ is shifted into the MSBit of the high
order byte of x, all other bits shift right one location.
Algorithm:
1. FFFF hex -----> A
2. 0 -----> i
3. 0 -----> j
4. Di (+) AL -----> AL
5. j+1 -----> j
6. shr(A)
7. Is there a carry? No: go to 8.
Yes: G (+) A -----> A
8. Is j = 8? No: go to 3.
Yes: go to 9.
9. i + 1 -----> I
10. Is i = N? No: go to 3.
Yes: go to 11.
11. A -----> CRC
Message Framing and Timing
Each 8 bits of data in a Modbus RTU message are sent
as part of a 11-bit byte, with the extra bits used for
framing of each byte transmitted. The master device
should have the port settings set to N-8-1 (no parity, 8
data bits, 1 stop bit).
Per the Modbus RTU standard, all messages must start
with a silent interval of at least 3.5 character times (or
equivalently 38.5 bit times), followed by the device
address. For example, at 19200 baud the minimum delay
between messages is:
s
1
()( )
35 11
19200
Modbus RTU messages must be transmitted as a
continuous stream. If a silent interval of more than 3.5
character times occurs before the message is complete,
the receiving device resets the link and assumes that the
next byte received is the start of a new message.
Similarly, if fewer than 3.5 character times elapse
between messages, the receiving device considers the
second message a continuation of the previous one,
resulting in an error.
The Modbus Monitor, upon detecting an appropriate
silent time, readies itself to recognize the next received
byte as the device address. If the device address is the
same as the Monitor address or the equivalent Modbus
address of an attached POWER LEADER device, the
Monitor receives the rest of the query from the master
and responds appropriately.
A typical Modbus RTU message appears as follows (the
3.5 character time silent interval is explicitly shown
below but often implied in other diagrams):
Silent
Interval
Device
Address
(1 byte)
Function
Code
(1 byte)
Data
(n bytes)
bits
=
2.01. characters bits / character
CRC-16
(2 bytes)
ms
50
Page 57

POWER LEADER Modbus Monitor
Appendix A – Modbus RTU Protocol
Register Groupings
Device registers are divided into the following
categories. All registers are defined as read only except
for coils.
Fixed-Value registers: These contain information that is
very unlikely to change, such as rating plug value, serial
number, and factory configuration options. These registers
have addresses starting at 0000. Use the Read Holding
Registers (Function Code 03) command to read this data.
Actual value registers: These hold dynamic information
such as metering values and have addresses starting at
1000. Use the Read Input Registers (Function Code 04)
command to read this data.
Event registers: These store event-specific data for
abnormal behavior such as a circuit breaker trip and have
addresses starting at 2000. Use the Read Input Registers
(Function Code 04) command to read this data.
Setpoint registers: These store configuration information
or programmed parameters that are user programmable
and have addresses starting at 3000. Use the Read Holding
Registers (Function Code 03) command to read this data.
Coils: These read/write registers are used to implement
supervisory control through remote commands and are
addressed sequentially. Use the Read Coil Status (Function
Code 01) and Force Single Coil (Function Code 05)
commands to read this data and perform remote control
respectively.
Data Conventions
All registers are composed of 16 bits (2 bytes) per the
Modbus RTU protocol standard. All integer values less
than 256 are stored in the lower byte of the register.
Format for Floating Point and Long Integer Data Types
Registers in the Modbus Protocol are 16-bit quantities.
Since long integers and floating point data formats are
32-bit quantities, it is necessary to store these quantities
in 2 registers. The following information describes the
register, byte and bit ordering of floating point and long
integer formats transmitted by the GE Modbus Monitor.
Floating Point Number Format
Floating point values, in the GE Modbus Monitor, follow
the IEEE Single Precision Floating Point Standard. This
standard is readily available in computer communication
text books. The following summarizes the IEEE format.
IEEE Floating Point Number - Single Precision (32 bits)
bit
31
Sign Exponent Fraction
The order of the bytes of floating point numbers
transmitted by the Monitor via Modbus protocol is
rearranged (register x is transmitted before register x +
1). Floating point values will be transmitted as 1st byte,
0th byte, 3rd byte and 2nd byte from the Modbus
Monitor.
servers.
Modbus Monitor Transmission of Floating Point Value
bits
15...............8
1st byte 0th byte 3rd byte 2nd byte
Register x Register x + 1
bits
30...................23
22....................................0
bits
This format is compatible with standard DDE
in Modbus Protocol
bits
7..............0
bits
31..............24
bits
23..............16
All data is transmitted with the high byte first except for
the CRC-16 which is transmitted low byte first.
Long Integers
Long Integers are transmitted in MSB/LSB format, as
shown below.
Modbus Monitor Transmission of Floating Point Value
in Modbus Protocol
bits
31..............24
3rd byte 2nd byte 1st byte 0th byte
Register x Register x + 1
51
bits
23..............16
bits
15...............8
bits
7..............0
Page 58

POWER LEADER Modbus Monitor
Appendix A – Modbus RTU Protocol
NOTE: Data values in the Monitor are constantly being
updated. Therefore, both registers of a floating point or
long integer value must be read together. If the Monitor
receives a read request for one but not both of the two
registers which represent a floating point or a long
integer value, the Monitor will return Exception Code 84
- Partial Register Access Error.
52
Page 59

POWER LEADER Modbus Monitor
Appendix B – Modbus Monitor Register Map
Appendix B:
Modbus Monitor Register Map
This Appendix provides the Register Map of the Modbus
Monitor.
Only two sorts of Input Registers are supported:
Dynamic Value Registers and Event Registers.
Note the final column (Number of Registers) indicates
how many registers will be received when the indicated
register is requested. For example, when register R40340
is requested, two registers are returned.
Other registers such as R0, R1, R2, R3 are not being
supported.
Address Contents Units/Value/Range Type
(R = Read only
RW = Read/Write)
R40340 IEM Time Register XX SS MM HH RW Long (BCD) 2
R40342 IEM Date Register XX DD MM YY RW Long (BCD) 2
R41000 Product ID 30 R unsigned integer 1
R41001 Modbus Address R unsigned integer 1
R41002-R41003 Serial Number R unsigned long integer
R41004-R41005 Firmware Revision R unsigned long integer
R41012 Proxy Status
Indicator
R41013 Event Logger
Indicator
R41014-R41023 Reserved 1
R41100-R41150 Reserved 1
0h - if PMCS Modbus Monitor
Proxy software is not present
1h - if PMCS Modbus Monitor
Proxy software is present
0h - if PMCS Event Logger client
software is not present
1h - if PMCS Event Logger client
software is present
RW unsigned integer 1
RW unsigned integer 1
Format Number of
Registers
(First Register contains Low
Word, Second contains High
Word)
(First Register contains the
integer part, Second Register
contains the decimal part:
High Byte = 0.1*N
Low Byte = 0.01*M)
2
2
53
Page 60

POWER LEADER Modbus Monitor
Appendix B –Register Map
(This page left blank intentionally.)
54
Page 61

POWER LEADER Modbus Monitor
Appendix C – Register Data Formats
Appendix C:
Register Data Formats supported by the Modbus Monitor
The following table describes the supported format codes of the Modbus Monitor. These are the only formats
available when either adding registers to a hybrid device or defining registers in a generic device. These data formats
appear in the Register Format pulldown list in the Configuration Tool’s Add Device Type Register dialog box.
A scaling factor will be applied to most register formats just before display. The user should use caution when
applying a scaling factor to a register since the results can be unexpected.
All register formats (except the floating point formats) will expect the data to be returned in the MSB-LSB order. For
example, a register with a ULONG format has a register value of 0x01020304. The data returned in the Modbus
packet is expected in the following bytes: 0x01 0x02 0x03 0x04. If the bytes are in any other order the Modbus
Monitor will not display the value correctly. The Modbus Monitor expects the two floating point formats to be in the
LSW-MSW order, where the LSW is the least significant word and MSW is the most significant word. For example,
a register with a FLOAT format has a register value of 1.000000 (0x3F800000). The data returned in the Modbus
packet is expected in the following byte order: 0x00 0x00 0x3F 0x80.
It should also be noted that the maximum number of characters which can be displayed in a data field on the Modbus
Monitor is 10. In the rare instances when a value exceeds 10 characters in length, the Monitor will truncate the least
significant digit(s) necessary to make the value 10 characters in length. For example, a value of -1000000000 would
be displayed as -100000000.
Format Description
BYTE The monitor will request one 16 bit register. The LS byte of the data received will be displayed as an unsigned
integer. The displayed values will range from 0 to 255. The selected scaling factor will be applied to the byte value.
UINT The monitor will request one 16 bit register. The data received will be displayed as an unsigned integer ranging from
0-65535.
INT The monitor will request one 16 bit register. The data received will be displayed as a signed integer ranging from
-32768 to 32767.
ULONG The monitor will request two 16-bit registers starting from the register address. The data received will be displayed as
an unsigned integer ranging from 0 to 4,294,967,295.
LONG The monitor will request two 16-bit registers starting from the register address. The data received will be displayed as
a signed integer ranging from -2,147,483,648 to 2,147,483,647.
FLOAT The monitor will request two 16-bit registers starting at the register address. The data is in a single precision IEEE
floating point format. The data received will be displayed to two decimal places of accuracy. Any value over 8 digits
will be displayed in scientific notation with a two decimal place accuracy.
UHEX The monitor will request one 16-bit register. The data received will be displayed as 4 hexadecimal digits.
MOD10000 The monitor will request one 32-bit register from the device. The data will be displayed as an integer. This format
supports the EPM 3710 and EPM 3720 modulus 10,000 format (please refer to the EPM documentation for the exact
data representation).
BCD The monitor will request one 16-bit register from the device. The data received will be displayed as an integer
ranging from 0000 to 9999. If any hex digit is out of the decimal range “Undefined” will be displayed.
UINT0FF The monitor will request one 16 bit register. The data received will be displayed as an unsigned integer ranging from
0-65535. A value of 0 in the register will be displayed as “OFF”.
INTOFF The monitor will request one 16 bit register. The data received will be displayed as a signed integer ranging from
-32768 to 32767. A value of 32767 in the register will be displayed as “OFF”.
FLOAT0FF The monitor will request two 16-bit registers starting at the register address. The data is in a single precision IEEE
floating point format. The data received will be displayed to two decimal places of accuracy. Any value over 8 digits
will be displayed in scientific notation with a two decimal place accuracy.
55
Page 62

POWER LEADER Modbus Monitor
Appendix C – Register Data Formats
Format Description
BYTEBINARY The monitor will request one 16-bit register. The LS byte of received data will be displayed as an 8-bit binary number.
This format is the same as LOWBYTEBINARY. The only difference is in the storage of the date. This register format
will only store the lower byte in memory.
HIGHBYTE The monitor will request one 16-bit register. The MS byte of the received data will be displayed as an integer. The
value displayed will range from 0-255.
LOWBYTEBINARY The monitor will request one 16-bit register. The LS byte of received data will be displayed as an 8-bit binary number.
This format is the same as BYTEBINARY. The only difference is in the storage of the date. This register format will
only store the entire 16-bit register in memory and ignore the high byte.
HIGHBYTEBINARY The monitor will request one 16-bit register. The MS byte of received data will be displayed as an 8-bit binary
number.
UINTMOD256 The monitor will request one 16-bit register. The received data will be MODed with 256 and the remainder is
displayed at the monitor.
UNIXDATETIME The monitor will request two 16-bit registers. The received data is expected to be in the Unix Date/Time format. The
Unix Date/Time format is the number of seconds that have elapsed since January 1, 1970. NOTE: With the current
font size the date and time cannot be displayed properly in a cell. Only the date will be visible if this format is
selected. The user should use two separate cells with the UNIXDATE format in one cell and the UNIXTIME format in
the other cell.
UNIXDATE The monitor will request two 16-bit registers. The received data is expected to be in the Unix Date/Time format. The
Unix Date/Time format is the number of seconds that have elapsed since January 1, 1970. Only the date (mm/dd/yy)
will be displayed with this format.
UNIXTIME The monitor will request two 16-bit registers. The received data is expected to be in the Unix Date/Time format. The
Unix Date/Time format is the number of seconds that have elapsed since January 1, 1970. Only the time (hh:mm:ss)
will be displayed with this format.
PML3710DATE The monitor will request one 32-bit register. The received data will be in the EPM 3710 date/time format (refer to the
EPM manual for the data representation). The date will be displayed at the monitor
PML3710TIME The monitor will request one 32-bit register. The received data will be in the EPM 3710 date/time format (refer to the
EPM manual for the data representation). The time will be displayed at the monitor
M469DATE The monitor will request one 16-bit register. The received data is expected to be in the Multilin 469 date format (refer
to the Multilin 469 manual for the data representation). The date will be displayed at the monitor
M469TIME The monitor will request one 16-bit register. The received data is expected to be in the Multilin 469 time format (refer
to the Multilin 469 manual for the data representation). The time will be displayed at the monitor
M565DATE The monitor will request one 16-bit register. The received data is expected to be in the Multilin 565 date format (refer
to the Multilin 565 manual for the data representation). The date will be displayed at the monitor
M565TIME The monitor will request one 16-bit register. The received data is expected to be in the Multilin 565 time format (refer
to the Multilin 565 manual for the data representation). The time will be displayed at the monitor
PQMM750DATE The monitor will request one 16-bit register. The received data is expected to be in the Multilin PQM/Multilin 750 date
format (refer to the Multilin PQM/Multilin 750 manual(s) for the data representation). The date will be displayed at the
monitor
PQMM750TIME The monitor will request one 16-bit register. The received data is expected to be in the Multilin PQM/Multilin 750 time
format (refer to the Multilin PQM/Multilin 750 manual(s) for the data representation). The time will be displayed at the
monitor
Bit x (0-OPEN; 1-CLOSED) The monitor will request one 16-bit register. The selected bit x will be tested for a 0 value or a 1 value. A bit value of
0 will display “Open”. A bit value of 1 will display “Closed”. Bit x can range from 0-15, where Bit 0 is the LSB and Bit
15 is the MSB.
Bit x (0-DISABLED; 1-ENABLED) The monitor will request one 16-bit register. The selected bit x will be tested for a 0 value or a 1 value. A bit value of
0 will display “Disabled”. A bit value of 1 will display “Enabled”. Bit x can range from 0-15, where Bit 0 is the LSB and
Bit 15 is the MSB.
Bit x (0-OFF; 1-ON) The monitor will request one 16-bit register. The selected bit x will be tested for a 0 value or a 1 value. A bit value of
0 will display “Off”. A bit value of 1 will display “On”. Bit x can range from 0-15, where Bit 0 is the LSB and Bit 15 is
the MSB.
Bit x (0-NORMAL; 1-ACTIVE) The monitor will request one 16-bit register. The selected bit x will be tested for a 0 value or a 1 value. A bit value of
0 will display “Normal”. A bit value of 1 will display “Active”. Bit x can range from 0-15, where Bit 0 is the LSB and Bit
15 is the MSB.
56
Page 63

POWER LEADER Modbus Monitor
Appendix C – Register Data Formats
Format Description
Bit x (0-NO; 1-YES) The monitor will request one 16-bit register. The selected bit x will be tested for a 0 value or a 1 value. A bit value of
0 will display “No”. A bit value of 1 will display “Yes”. Bit x can range from 0-15, where Bit 0 is the LSB and Bit 15 is
the MSB.
Bit x (0-INACTIVE; 1-ACTIVE) The monitor will request one 16-bit register. The selected bit x will be tested for a 0 value or a 1 value. A bit value of
0 will display “Inactive”. A bit value of 1 will display “Active”. Bit x can range from 0-15, where Bit 0 is the LSB and Bit
15 is the MSB.
Bit x (0- 3-WIRE; 1- 4-WIRE) The monitor will request one 16-bit register. The selected bit x will be tested for a 0 value or a 1 value. A bit value of
0 will display “3-Wire”. A bit value of 1 will display “4-Wire”. Bit x can range from 0-15, where Bit 0 is the LSB and Bit
15 is the MSB.
Bit x (0- NOTRIP; 1- TRIP) The monitor will request one 16-bit register. The selected bit x will be tested for a 0 value or a 1 value. A bit value of
0 will display “No Trip”. A bit value of 1 will display “Trip”. Bit x can range from 0-15, where Bit 0 is the LSB and Bit 15
is the MSB.
Bit x (0- NO; 1- INPICKUP) The monitor will request one 16-bit register. The selected bit x will be tested for a 0 value or a 1 value. A bit value of
0 will display “No”. A bit value of 1 will display “Pickup”. Bit x can range from 0-15, where Bit 0 is the LSB and Bit 15
is the MSB.
Bit x (0- LATCHED; 1- PULSED) The monitor will request one 16-bit register. The selected bit x will be tested for a 0 value or a 1 value. A bit value of
0 will display “Latched”. A bit value of 1 will display “Pulsed”. Bit x can range from 0-15, where Bit 0 is the LSB and
Bit 15 is the MSB.
Bit x (0- PHASEOK; 1- PHASELOST) The monitor will request one 16-bit register. The selected bit x will be tested for a 0 value or a 1 value. A bit value of
0 will display “Phase OK”. A bit value of 1 will display “Phase Lost”. Bit x can range from 0-15, where Bit 0 is the LSB
and Bit 15 is the MSB.
Bit x (0- DEENERGIZE; 1-
ENERGIZED)
Bit x (0- CHANGED; 1- NORMAL) The monitor will request one 16-bit register. The selected bit x will be tested for a 0 value or a 1 value. A bit value of
The monitor will request one 16-bit register. The selected bit x will be tested for a 0 value or a 1 value. A bit value of
0 will display “Deenergize”. A bit value of 1 will display “Energized”. Bit x can range from 0-15, where Bit 0 is the LSB
and Bit 15 is the MSB.
0 will display “Changed”. A bit value of 1 will display “Normal”. Bit x can range from 0-15, where Bit 0 is the LSB and
Bit 15 is the MSB.
57
Page 64

POWER LEADER Modbus Monitor
Appendix C – Register Data Formats
(This page left blank intentionally.)
58
Page 65

POWER LEADER Modbus Monitor
Appendix D – Supported Firmware Revisions for TID’s
The Modbus Monitor supports a variety of devices; however, each of these devices has had its own product
development cycle and undergone various revisions. Therefore, this appendix provides the firmware revision of each
device which has been tested with the Modbus Monitor and found to be compatible. Other firmware revisions may or
may not function with the Modbus Monitor. If you are concerned about compatibility of a device firmware revision,
contact the GE Resolution Center at 1-888-GE-RESOLV.
Device Device Firmware
Revision
Supported
POWER LEADER EPM (commnet communications option) 1.06
POWER LEADER EPM (Modbus communications option) 2.0/3.3
POWER LEADER Meter 2.0
EPM 3710 MOD3.0.1.0-B
EPM 3720 V05B1502
MULTILIN Power Quality Meter (PQM) 2.02
POWER LEADER MDP Overcurrent Relay (commnet communications option) 1.0
POWER LEADER MDP Overcurrent Relay (Modbus communications option) 2.0/3.3
Spectra MicroVersaTrip™ 5.12
Enhanced MicroVersaTrip™ C 4.13
Enhanced MicroVersaTrip™ D 4.13
Spectra ECM™ 7.2
MULTILIN 239 Motor Protection Relay 2.11
MULTILIN 269 Plus Motor Management Relay 5.2.1
MULTILIN SR469 Motor Management Relay 2.4.2
MULTILIN SR489 Generator Management Relay 32D120A8.000
MULTILIN 565 Feeder Management Relay 2.4
MULTILIN 735 Feeder Relay 1.0
MULTILIN SR745 Transformer Management Relay 2.10
MULTILIN SR750 Feeder Management Relay 3.30
MULTILIN SR760 Feeder Management Relay 3.30
System Monitor SM-3 Voltage Regulator 2.01
EPM 7300 1.33
Table 5. Device firmware revisions supported by the Modbus Monitor.
POWER LEADER Modbus Concentrator
The Modbus Monitor offers compatibility with commnet communications devices through the POWER LEADER
Modbus Concentrator (see GEH-6491 for details), which maps devices’ commnet addresses to an equivalent Modbus
address and routes Modbus network communications to and from the commnet devices attached to it. The Modbus
Concentrator firmware revision supported by the Modbus Monitor is 2.1.
Power Management Control System (PMCS)
The Modbus Monitor is compatible with GE Power Management and Control System version 5.1 or greater. Earlier
versions of PMCS are not compatible with the Modbus Monitor. It is also important to remember that not all devices
supported by the Monitor are supported by the PMCS 5.1 Server (although all devices supported by the Monitor are
supported by the PMCS 6.0 Server).
59
Page 66

POWER LEADER Modbus Monitor
Glossary
Glossary
The following are definitions of some of the terms used in this document.
commnet – A GE proprietary network communications standard.
DCS (Distributed Control System) – A group of systems including building automation and status monitoring
systems.
Generic device – A user-defined device type whose register map is entered from scratch or copied from that of an
existing tightly integrated device (TID). Generic device types do not support events or special handling registers.
Hybrid device – A user-defined device type whose register map is copied from that of an existing tightly integrated
device (TID), including event handling and any special handling registers, then customized like a generic device.
Modbus master – The device acting as master to the other devices (slaves) on the RS-485 network. Only the master
may initiate communications; all other devices may communicate only in response to a query from the master.
With regard to the POWER LEADER Modbus Monitor, the master is either a host computer running PMCS
software or a second Modbus Monitor.
Modbus RTU (Remote Terminal Unit) – An open, industry-standard, high-performance network communications
protocol developed by Modicon/AEG Schneider Automation.
Modbus segment – A single RS-485 network connected to one of the Monitor’s two RS-485 ports, labeled Segment
A and Segment B, respectively. No more than two Modbus Monitors are permitted on a single Modbus segment.
A Modbus segment must be properly terminated at each end with a 1/2 watt, 120 ohm resistor.
Modbus-compatible device – Any device equipped with a Modbus RTU communications port.
Monitor – GE POWER LEADER Modbus Monitor.
PMCS – GE’s Power Management Control System software. The Modbus Monitor is compatible with PMCS
version 5.1 or greater.
POWER LEADER – The GE family of comprehensive power management devices and system software used to
minimize downtime and overall power cost.
RS-485/EIA485 – A physical standard for multi-drop, high-speed, noise-tolerant communications over a twisted
pair network; often used with the Modbus RTU protocol.
SCADA (Supervisory Control And Data Acquisition) – A group of systems including power management control
systems.
Segment – see Modbus Segment.
Tightly integrated device – Any of the device types whose register map has been pre-configured in the Monitor.
These devices are listed in Table 1.
60
Page 67

POWER LEADER Modbus Monitor
Glossary
(This page left blank intentionally.)
61
Page 68

s
GE Industrial System
General Electric Company
41 Woodford Ave., Plainville, CT 06062
DEH-027 R05 0499 © 1999 General Electric Company
 Loading...