

Page 1

Cisco ASR 9000 Series Aggregation Services Router System Monitoring Configuration Guide, Release 4.2.x
First Published: 2011-12-01
Last Modified: 2012-06-01
Americas Headquarters
Cisco Systems, Inc.
170 West Tasman Drive
San Jose, CA 95134-1706
USA
http://www.cisco.com
Tel: 408 526-4000
800 553-NETS (6387)
Fax: 408 527-0883
Page 2

THE SPECIFICATIONS AND INFORMATION REGARDING THE PRODUCTS IN THIS MANUAL ARE SUBJECT TO CHANGE WITHOUT NOTICE. ALL STATEMENTS,
INFORMATION, AND RECOMMENDATIONS IN THIS MANUAL ARE BELIEVED TO BE ACCURATE BUT ARE PRESENTED WITHOUT WARRANTY OF ANY KIND,
EXPRESS OR IMPLIED. USERS MUST TAKE FULL RESPONSIBILITY FOR THEIR APPLICATION OF ANY PRODUCTS.
THE SOFTWARE LICENSE AND LIMITED WARRANTY FOR THE ACCOMPANYING PRODUCT ARE SET FORTH IN THE INFORMATION PACKET THAT SHIPPED WITH
THE PRODUCT AND ARE INCORPORATED HEREIN BY THIS REFERENCE. IF YOU ARE UNABLE TO LOCATE THE SOFTWARE LICENSE OR LIMITED WARRANTY,
CONTACT YOUR CISCO REPRESENTATIVE FOR A COPY.
The Cisco implementation of TCP header compression is an adaptation of a program developed by the University of California, Berkeley (UCB) as part of UCB's public domain version
of the UNIX operating system. All rights reserved. Copyright©1981, Regents of the University of California.
NOTWITHSTANDING ANY OTHER WARRANTY HEREIN, ALL DOCUMENT FILES AND SOFTWAREOF THESE SUPPLIERS ARE PROVIDED “AS IS" WITH ALL FAULTS.
CISCO AND THE ABOVE-NAMED SUPPLIERS DISCLAIM ALL WARRANTIES, EXPRESSED OR IMPLIED, INCLUDING, WITHOUT LIMITATION, THOSE OF
MERCHANTABILITY, FITNESS FOR A PARTICULAR PURPOSE AND NONINFRINGEMENT OR ARISING FROM A COURSE OF DEALING, USAGE, OR TRADE PRACTICE.
IN NO EVENT SHALL CISCO OR ITS SUPPLIERS BE LIABLE FOR ANY INDIRECT, SPECIAL, CONSEQUENTIAL, OR INCIDENTAL DAMAGES, INCLUDING, WITHOUT
LIMITATION, LOST PROFITS OR LOSS OR DAMAGE TO DATA ARISING OUT OF THE USE OR INABILITY TO USE THIS MANUAL, EVEN IF CISCO OR ITS SUPPLIERS
HAVE BEEN ADVISED OF THE POSSIBILITY OF SUCH DAMAGES.
Any Internet Protocol (IP) addresses and phone numbers used in this document are not intended to be actual addresses and phone numbers. Any examples, command display output, network
topology diagrams, and other figures included in the document are shown for illustrative purposes only. Any use of actual IP addresses or phone numbers in illustrative content is unintentional
and coincidental.
Cisco and the Cisco logo are trademarks or registered trademarks of Cisco and/or its affiliates in the U.S. and other countries. To view a list of Cisco trademarks, go to this URL: http://
www.cisco.com/go/trademarks. Third-party trademarks mentioned are the property of their respective owners. The use of the word partner does not imply a partnership
relationship between Cisco and any other company. (1110R)
©
2012 Cisco Systems, Inc. All rights reserved.
Page 3

CONTENTS
Preface
CHAPTER 1
Preface xv
Changes to This Document xv
Obtaining Documentation and Submitting a Service Request xv
Implementing and Monitoring Alarms and Alarm Log Correlation 1
Prerequisites for Implementing and Monitoring Alarms and Alarm Log Correlation 2
Information About Implementing Alarms and Alarm Log Correlation 2
Alarm Logging and Debugging Event Management System 2
Correlator 3
System Logging Process 4
Alarm Logger 4
Logging Correlation 4
Correlation Rules 4
Types of Correlation 5
Application of Rules and Rule Sets 5
Root Message and Correlated Messages 5
Alarm Severity Level and Filtering 6
Bistate Alarms 6
Capacity Threshold Setting for Alarms 7
Hierarchical Correlation 7
Context Correlation Flag 7
Duration Timeout Flags 8
Reparent Flag 8
Reissue Nonbistate Flag 8
Internal Rules 9
SNMP Alarm Correlation 9
How to Implement and Monitor Alarm Management and Logging Correlation 9
Cisco ASR 9000 Series Aggregation Services Router System Monitoring Configuration Guide, Release 4.2.x
iii
Page 4

Contents
Configuring Logging Correlation Rules 9
Configuring Logging Correlation Rule Sets 10
Configuring Root-cause and Non-root-cause Alarms 11
Configuring Hierarchical Correlation Rule Flags 13
Applying Logging Correlation Rules 14
Applying Logging Correlation Rule Sets 16
Modifying Logging Events Buffer Settings 17
Modifying Logging Correlator Buffer Settings 19
Displaying Alarms by Severity and Severity Range 20
Displaying Alarms According to a Time Stamp Range 22
Displaying Alarms According to Message Group and Message Code 23
Displaying Alarms According to a First and Last Range 24
Displaying Alarms by Location 25
Displaying Alarms by Event Record ID 26
Displaying the Logging Correlation Buffer Size, Messages, and Rules 27
Clearing Alarm Event Records and Resetting Bistate Alarms 28
Defining SNMP Correlation Buffer Size 30
Defining SNMP Rulesets 31
Configuring SNMP Correlation Rules 31
Applying SNMP Correlation Rules 32
Applying SNMP Correlation Ruleset 33
Configuration Examples for Alarm Management and Logging Correlation 34
Increasing the Severity Level for Alarm Filtering to Display Fewer Events and Modifying
the Alarm Buffer Size and Capacity Threshold: Example 34
Configuring a Nonstateful Correlation Rule to Permanently Suppress Node Status Messages:
Example 34
Configuring a Stateful Correlation Rule for LINK UPDOWN and SONET ALARM Alarms:
Example 36
Additional References 37
CHAPTER 2
iv
Configuring and Managing Embedded Event Manager Policies 41
Prerequisites for Configuring and Managing Embedded Event Manager Policies 42
Information About Configuring and Managing Embedded Event Manager Policies 42
Event Management 42
System Event Detection 42
Cisco ASR 9000 Series Aggregation Services Router System Monitoring Configuration Guide, Release 4.2.x
Page 5

Contents
Policy-Based Event Response 43
Reliability Metrics 43
System Event Processing 43
Embedded Event Manager Management Policies 43
Embedded Event Manager Scripts and the Scripting Interface (Tcl) 44
Script Language 45
Regular Embedded Event Manager Scripts 45
Embedded Event Manager Callback Scripts 46
Embedded Event Manager Policy Tcl Command Extension Categories 46
Cisco File Naming Convention for Embedded Event Manager 47
Embedded Event Manager Built-in Actions 48
Application-specific Embedded Event Management 49
Event Detection and Recovery 49
General Flow of EEM Event Detection and Recovery 49
System Manager Event Detector 50
Timer Services Event Detector 51
Syslog Event Detector 51
None Event Detector 51
Watchdog System Monitor Event Detector 52
Distributed Event Detectors 53
Embedded Event Manager Event Scheduling and Notification 53
Reliability Statistics 53
Hardware Card Reliability Metric Data 53
Process Reliability Metric Data 54
How to Configure and Manage Embedded Event Manager Policies 55
Configuring Environmental Variables 55
Environment Variables 55
Registering Embedded Event Manager Policies 56
Embedded Event Manager Policies 56
How to Write Embedded Event Manager Policies Using Tcl 59
Registering and Defining an EEM Tcl Script 59
Displaying EEM Registered Policies 61
Unregistering EEM Policies 61
Suspending EEM Policy Execution 62
Managing EEM Policies 63
Cisco ASR 9000 Series Aggregation Services Router System Monitoring Configuration Guide, Release 4.2.x
v
Page 6

Contents
Displaying Software Modularity Process Reliability Metrics Using EEM 64
Sample EEM Policies 64
Programming EEM Policies with Tcl 66
Tcl Policy Structure and Requirements 66
EEM Entry Status 68
EEM Exit Status 68
EEM Policies and Cisco Error Number 69
_cerrno: 32-Bit Error Return Values 69
Error Class Encodings for XY 70
Creating an EEM User Tcl Library Index 74
Creating an EEM User Tcl Package Index 77
Configuration Examples for Event Management Policies 80
Environmental Variables Configuration: Example 80
User-Defined Embedded Event Manager Policy Registration: Example 80
Display Available Policies: Example 81
Display Embedded Event Manager Process: Example 81
Configuration Examples for Writing Embedded Event Manager Policies Using Tcl 82
EEM Event Detector Demo: Example 82
EEM Sample Policy Descriptions 82
Event Manager Environment Variables for the Sample Policies 82
Registration of Some EEM Policies 84
Basic Configuration Details for All Sample Policies 85
Using the Sample Policies 85
Running the sl_intf_down.tcl Sample Policy 85
Running the tm_cli_cmd.tcl Sample Policy 86
Running the tm_crash_reporter.tcl Sample Policy 86
Running the tm_fsys_usage.tcl Sample Policy 87
Programming Policies with Tcl: Sample Scripts Example 87
tm_cli_cmd.tcl Sample Policy 87
sl_intf_down.tcl Sample Policy 90
Tracing Tcl set Command Operations: Example 92
Additional References 92
Embedded Event Manager Policy Tcl Command Extension Reference 93
Embedded Event Manager Event Registration Tcl Command Extensions 94
event_register_appl 94
Cisco ASR 9000 Series Aggregation Services Router System Monitoring Configuration Guide, Release 4.2.x
vi
Page 7

Contents
event_register_cli 95
event_register_config 97
event_register_counter 98
event_register_hardware 99
event_register_none 101
event_register_oir 102
event_register_process 103
event_register_snmp 105
event_register_snmp_notification 108
event_register_stat 109
event_register_syslog 112
event_register_timer 114
event_register_timer_subscriber 119
event_register_track 121
event_register_wdsysmon 123
Embedded Event Manager Event Information Tcl Command Extension 129
event_reqinfo 129
event_reqinfo_multi 145
Embedded Event Manager Event Publish Tcl Command Extension 145
event_publish appl 145
Embedded Event Manager Multiple Event Support Tcl Command Extensions 148
Attribute 148
Correlate 148
Trigger 149
Embedded Event Manager Action Tcl Command Extensions 150
action_process 150
action_program 152
action_script 153
action_setver_prior 153
action_setnode 154
action_syslog 154
action_track_read 155
Embedded Event Manager Utility Tcl Command Extensions 156
appl_read 156
appl_reqinfo 157
Cisco ASR 9000 Series Aggregation Services Router System Monitoring Configuration Guide, Release 4.2.x
vii
Page 8

Contents
appl_setinfo 157
counter_modify 158
fts_get_stamp 159
register_counter 160
register_timer 161
timer_arm 163
timer_cancel 165
unregister_counter 166
Embedded Event Manager System Information Tcl Command Extensions 167
sys_reqinfo_cpu_all 167
sys_reqinfo_crash_history 168
sys_reqinfo_mem_all 169
sys_reqinfo_proc 171
sys_reqinfo_proc_all 173
sys_reqinfo_proc_version 173
sys_reqinfo_routername 174
sys_reqinfo_syslog_freq 174
sys_reqinfo_syslog_history 175
sys_reqinfo_stat 176
sys_reqinfo_snmp 177
sys_reqinfo_snmp_trap 178
sys_reqinfo_snmp_trapvar 178
SMTP Library Command Extensions 178
smtp_send_email 179
smtp_subst 180
CLI Library Command Extensions 181
cli_close 181
cli_exec 182
cli_get_ttyname 182
cli_open 183
viii
cli_read 183
cli_read_drain 184
cli_read_line 184
cli_read_pattern 185
cli_write 186
Cisco ASR 9000 Series Aggregation Services Router System Monitoring Configuration Guide, Release 4.2.x
Page 9

Contents
Tcl Context Library Command Extensions 189
context_retrieve 189
context_save 192
CHAPTER 3
Implementing IP Service Level Agreements 195
Prerequisites for Implementing IP Service Level Agreements 196
Restrictions for Implementing IP Service Level Agreements 196
Information About Implementing IP Service Level Agreements 198
About IP Service Level Agreements Technology 198
Service Level Agreements 198
Benefits of IP Service Level Agreements 200
Measuring Network Performance with IP Service Level Agreements 200
Operation Types for IP Service Level Agreements 202
IP SLA Responder and IP SLA Control Protocol 203
Response Time Computation for IP SLA 204
IP SLA VRF Support 204
IP SLA Operation Scheduling 205
IP SLA—Proactive Threshold Monitoring 205
IP SLA Reaction Configuration 205
IP SLA Threshold Monitoring and Notifications 205
MPLS LSP Monitoring 205
How MPLS LSP Monitoring Works 206
BGP Next-hop Neighbor Discovery 206
IP SLA LSP Ping and LSP Traceroute Operations 207
Proactive Threshold Monitoring for MPLS LSP Monitoring 208
Multi-operation Scheduling for the LSP Health Monitor 208
LSP Path Discovery 208
How to Implement IP Service Level Agreements 209
Configuring IP Service Levels Using the UDP Jitter Operation 209
Enabling the IP SLA Responder on the Destination Device 209
Configuring and Scheduling a UDP Jitter Operation on the Source Device 210
Prerequisites for Configuring a UDP Jitter Operation on the Source Device 212
Configuring and Scheduling a Basic UDP Jitter Operation on the Source Device 212
Configuring and Scheduling a UDP Jitter Operation with Additional Characteristics 214
Configuring the IP SLA for a UDP Echo Operation 219
Cisco ASR 9000 Series Aggregation Services Router System Monitoring Configuration Guide, Release 4.2.x
ix
Page 10

Contents
Prerequisites for Configuring a UDP Echo Operation on the Source Device 219
Configuring and Scheduling a UDP Echo Operation on the Source Device 219
Configuring and Scheduling a UDP Echo Operation with Optional Parameters on the
Source Device 222
Configuring an ICMP Echo Operation 226
Configuring and Scheduling a Basic ICMP Echo Operation on the Source Device 226
Configuring and Scheduling an ICMP Echo Operation with Optional Parameters on
the Source Device 229
Configuring the ICMP Path-echo Operation 232
Configuring and Scheduling a Basic ICMP Path-echo Operation on the Source Device
232
Configuring and Scheduling an ICMP Path-echo Operation with Optional Parameters
on the Source Device 235
Configuring the ICMP Path-jitter Operation 238
Configuring and Scheduling a Basic ICMP Path-jitter Operation 239
Configuring and Scheduling an ICMP Path-jitter Operation with Additional
Parameters 242
Configuring IP SLA MPLS LSP Ping and Trace Operations 246
Configuring and Scheduling an MPLS LSP Ping Operation 246
Configuring and Scheduling an MPLS LSP Trace Operation 250
Configuring IP SLA Reactions and Threshold Monitoring 254
Configuring Monitored Elements for IP SLA Reactions 254
Configuring Triggers for Connection-Loss Violations 254
Configuring Triggers for Jitter Violations 255
Configuring Triggers for Packet Loss Violations 255
Configuring Triggers for Round-Trip Violations 256
Configuring Triggers for Timeout Violations 257
Configuring Triggers for Verify Error Violations 258
Configuring Threshold Violation Types for IP SLA Reactions 259
Generating Events for Each Violation 260
Generating Events for Consecutive Violations 260
Generating Events for X of Y Violations 261
Generating Events for Averaged Violations 262
Specifying Reaction Events 263
Configuring the MPLS LSP Monitoring Instance on a Source PE Router 265
Cisco ASR 9000 Series Aggregation Services Router System Monitoring Configuration Guide, Release 4.2.x
x
Page 11

Contents
Configuring an MPLS LSP Monitoring Ping Instance 265
Configuring an MPLS LSP Monitoring Trace Instance 269
Configuring the Reaction Conditions for an MPLS LSP Monitoring Instance on a Source PE
Router 273
Scheduling an MPLS LSP Monitoring Instance on a Source PE Router 275
LSP Path Discovery 276
Configuring tracking type (rtr) 279
Configuration Examples for Implementing IP Service Level Agreements 280
Configuring IP Service Level Agreements: Example 280
Configuring IP SLA Reactions and Threshold Monitoring: Example 281
Configuring IP SLA MPLS LSP Monitoring: Example 282
Configuring LSP Path Discovery: Example 282
CHAPTER 4
Additional References 282
Implementing Logging Services 285
Prerequisites for Implementing Logging Services 285
Information About Implementing Logging Services 286
System Logging Process 286
Format of System Logging Messages 286
Duplicate Message Suppression 287
Interruption of Message Suppression 287
Syslog Message Destinations 288
Guidelines for Sending Syslog Messages to Destinations Other Than the Console 289
Logging for the Current Terminal Session 289
Syslog Messages Sent to Syslog Servers 289
UNIX System Logging Facilities 289
Hostname Prefix Logging 290
Syslog Source Address Logging 291
UNIX Syslog Daemon Configuration 291
Archiving Logging Messages on a Local Storage Device 291
Setting Archive Attributes 291
Archive Storage Directories 292
Severity Levels 292
Logging History Table 293
Syslog Message Severity Level Definitions 294
Cisco ASR 9000 Series Aggregation Services Router System Monitoring Configuration Guide, Release 4.2.x
xi
Page 12

Contents
Syslog Severity Level Command Defaults 294
How to Implement Logging Services 295
Setting Up Destinations for System Logging Messages 295
Configuring Logging to a Remote Server 296
Configuring the Settings for the Logging History Table 297
Modifying Logging to the Console Terminal and the Logging Buffer 298
Modifying the Format of Time Stamps 299
Disabling Time Stamps 301
Suppressing Duplicate Syslog Messages 302
Disabling the Logging of Link-Status Syslog Messages 302
Displaying System Logging Messages 303
Archiving System Logging Messages to a Local Storage Device 304
Configuration Examples for Implementing Logging Services 306
CHAPTER 5
Configuring Logging to the Console Terminal and the Logging Buffer: Example 306
Setting Up Destinations for Syslog Messages: Example 307
Configuring the Settings for the Logging History Table: Example 307
Modifying Time Stamps: Example 307
Configuring a Logging Archive: Example 307
Where to Go Next 308
Additional References 308
Onboard Failure Logging 311
Prerequisites 312
Information About Implementing OBFL 312
Data Collection Types 312
Baseline Data Collection 312
Event-Driven Data Collection 313
Supported Cards and Platforms 314
How to Implement OBFL 314
xii
Enabling or Disabling OBFL 315
Configuring Message Severity Levels 316
Monitoring and Maintaining OBFL 316
Clearing OBFL Data 317
Configuration Examples for OBFL 318
Enabling and Disabling OBFL: Example 318
Cisco ASR 9000 Series Aggregation Services Router System Monitoring Configuration Guide, Release 4.2.x
Page 13

Contents
Configuring Message Severity Levels: Example 318
Clearing OBFL Messages: Example 319
Displaying OBFL Data: Example 319
Where to Go Next 319
Additional References 319
CHAPTER 6
Implementing Performance Management 323
Prerequisites for Implementing Performance Management 324
Information About Implementing Performance Management 324
PM Functional Overview 324
PM Statistics Server 324
PM Statistics Collector 324
PM Benefits 325
PM Statistics Collection Overview 326
PM Statistics Collection Templates 326
Guidelines for Creating PM Statistics Collection Templates 327
Guidelines for Enabling and Disabling PM Statistics Collection Templates 327
Exporting Statistics Data 328
Binary File Format 328
Binary File ID Assignments for Entity, Subentity, and StatsCounter Names 329
Filenaming Convention Applied to Binary Files 333
PM Entity Instance Monitoring Overview 333
PM Threshold Monitoring Overview 337
Guidelines for Creating PM Threshold Monitoring Templates 337
Guidelines for Enabling and Disabling PM Threshold Monitoring Templates 350
How to Implement Performance Management 351
Configuring an External TFTP Server for PM Statistic Collections 351
Configuring Local Disk Dump for PM Statistics Collections 351
Configuring Instance Filtering by Regular-expression 352
Creating PM Statistics Collection Templates 353
Enabling and Disabling PM Statistics Collection Templates 354
Enabling PM Entity Instance Monitoring 356
Creating PM Threshold Monitoring Templates 356
Enabling and Disabling PM Threshold Monitoring Templates 357
Configuration Examples for Implementing Performance Management 359
Cisco ASR 9000 Series Aggregation Services Router System Monitoring Configuration Guide, Release 4.2.x
xiii
Page 14

Contents
Creating and Enabling PM Statistics Collection Templates: Example 359
Creating and Enabling PM Threshold Monitoring Templates: Example 360
Additional References 360
xiv
Cisco ASR 9000 Series Aggregation Services Router System Monitoring Configuration Guide, Release 4.2.x
Page 15

Preface
From Release 6.1.1 onwards, Cisco introduces support for the 64-bit Linux-based IOS XR operating system.
Extensive feature parity is maintained between the 32-bit and 64-bit environments. Unless explicitly marked
otherwise, the contents of this document are applicable for both the environments. For more details on Cisco
IOS XR 64 bit, refer to the Release Notes for Cisco ASR 9000 Series Routers, Release 6.1.1 document.
The Cisco ASR 9000 Series Aggregation Services Router System Monitoring Configuration Guide preface
contains these sections:
Changes to This Document, page xv
•
Obtaining Documentation and Submitting a Service Request, page xv
•
Changes to This Document
This table lists the technical changes made to this document since it was first printed.
Table 1: Changes to This Document
Change SummaryDateRevision
June 2012OL-26513-02
Republished for Cisco IOS XR
Release 4.2.1.
Initial release of this document.December 2011OL-26513-01
Obtaining Documentation and Submitting a Service Request
For information on obtaining documentation, using the Cisco Bug Search Tool (BST), submitting a service
request, and gathering additional information, see What's New in Cisco Product Documentation.
To receive new and revised Cisco technical content directly to your desktop, you can subscribe to the What's
New in Cisco Product Documentation RSS feed. RSS feeds are a free service.
Cisco ASR 9000 Series Aggregation Services Router System Monitoring Configuration Guide, Release 4.2.x
xv
Page 16

Obtaining Documentation and Submitting a Service Request
Preface
xvi
Cisco ASR 9000 Series Aggregation Services Router System Monitoring Configuration Guide, Release 4.2.x
Page 17

CHAPTER 1
Implementing and Monitoring Alarms and Alarm Log Correlation
This module describes the concepts and tasks related to configuring alarm log correlation and monitoring
alarm logs and correlated event records. Alarm log correlation extends system logging to include the ability
to group and filter messages generated by various applications and system servers and to isolate root messages
on the router.
This module describes the new and revised tasks you need to perform to implement logging correlation and
monitor alarms on your network.
Note
For more information about system logging on Cisco IOS XR Software and complete descriptions of the
alarm management and logging correlation commands listed in this module, see the Related Documents,
on page 37 section of this module.
To locate documentation for other commands that might appear in the course of performing a configuration
task, search online in the Cisco ASR 9000 Series Aggregation Services Router Commands Master List.
Feature History for Implementing and Monitoring Alarms and Alarm Log Correlation
ModificationRelease
This feature was introduced.Release 3.7.2
SNMP alarm correlation feature was added.Release 3.8.0
Prerequisites for Implementing and Monitoring Alarms and Alarm Log Correlation, page 2
•
Information About Implementing Alarms and Alarm Log Correlation, page 2
•
How to Implement and Monitor Alarm Management and Logging Correlation, page 9
•
Configuration Examples for Alarm Management and Logging Correlation, page 34
•
Additional References, page 37
•
Cisco ASR 9000 Series Aggregation Services Router System Monitoring Configuration Guide, Release 4.2.x
1
Page 18

Implementing and Monitoring Alarms and Alarm Log Correlation
Prerequisites for Implementing and Monitoring Alarms and Alarm Log Correlation
Prerequisites for Implementing and Monitoring Alarms and
Alarm Log Correlation
You must be in a user group associated with a task group that includes the proper task IDs. The command
reference guides include the task IDs required for each command. If you suspect user group assignment is
preventing you from using a command, contact your AAA administrator for assistance.
Information About Implementing Alarms and Alarm Log Correlation
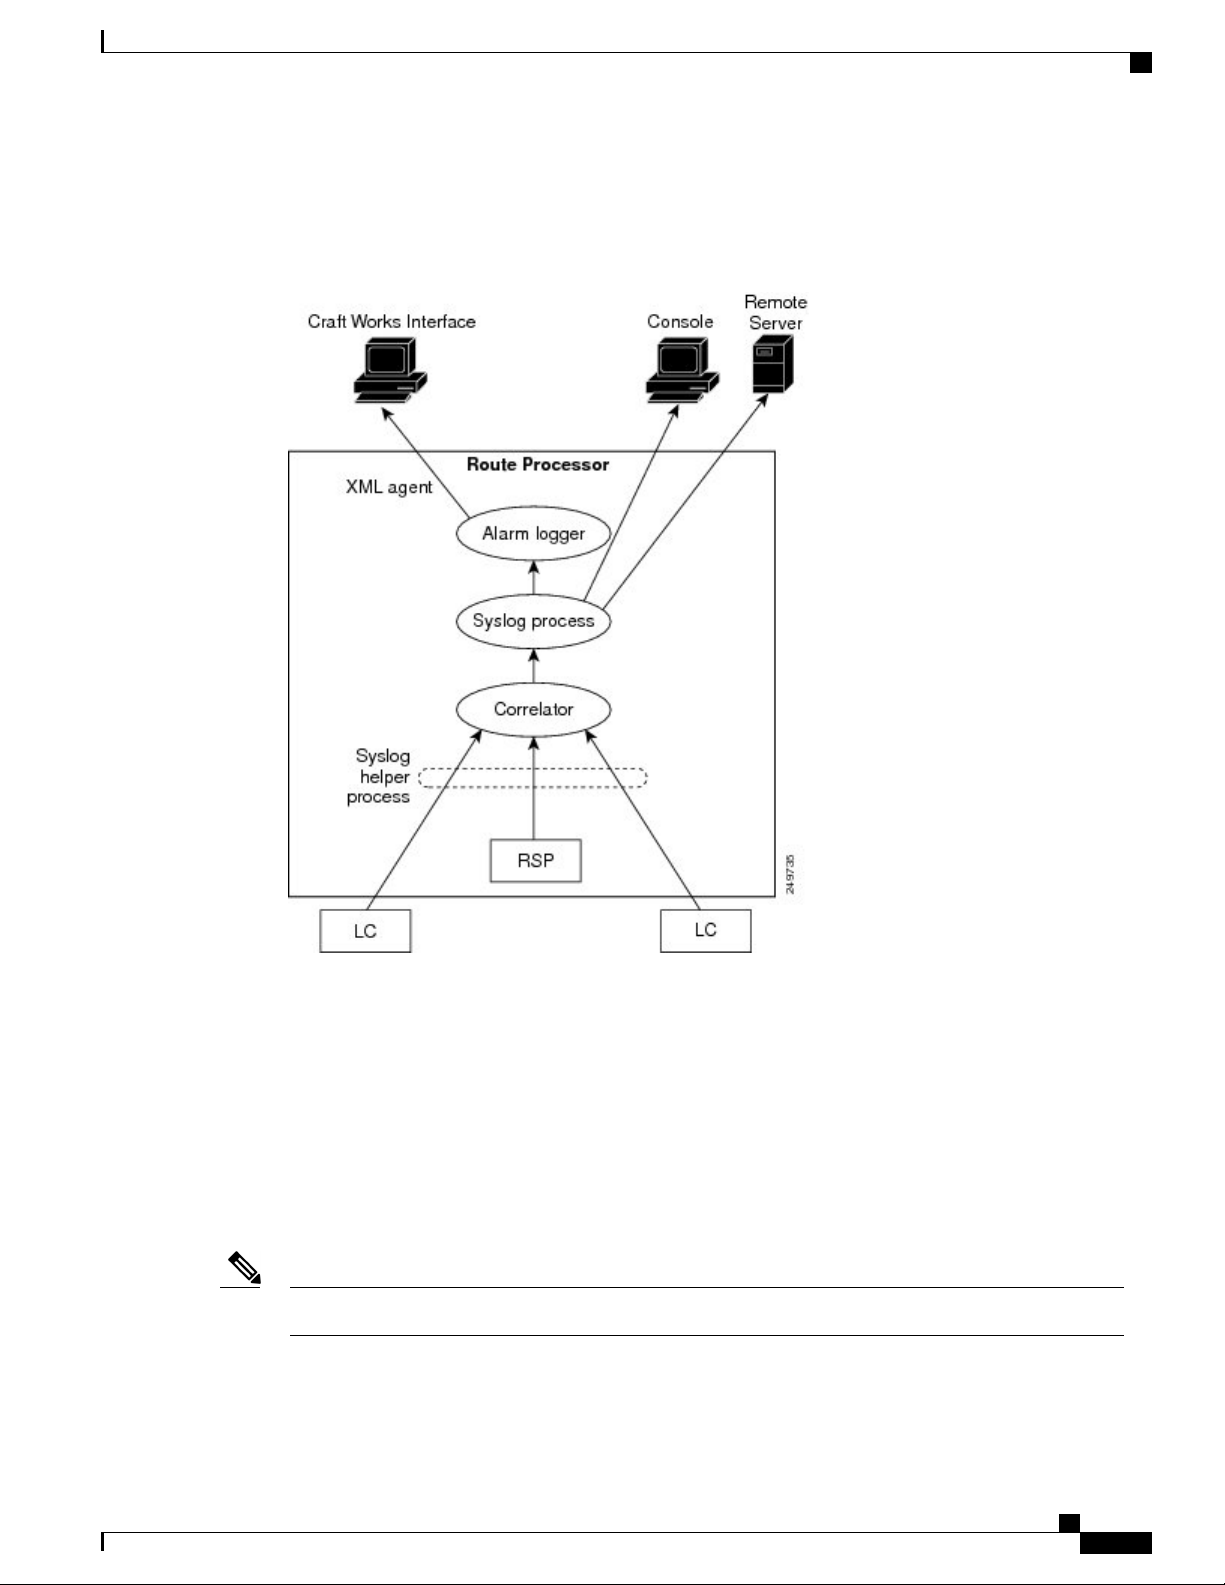
Alarm Logging and Debugging Event Management System
Cisco IOS XR Software Alarm Logging and Debugging Event Management System (ALDEMS) is used to
monitor and store alarm messages that are forwarded by system servers and applications. In addition, ALDEMS
correlates alarm messages forwarded due to a single root cause.
ALDEMS enlarges on the basic logging and monitoring functionality of Cisco IOS XR Software, providing
the level of alarm and event management necessary for a highly distributed system .
Cisco IOS XR Software achieves this necessary level of alarm and event management by distributing logging
applications across the nodes on the system.
Cisco ASR 9000 Series Aggregation Services Router System Monitoring Configuration Guide, Release 4.2.x
2
Page 19
Implementing and Monitoring Alarms and Alarm Log Correlation
Figure 1: ALDEMS Component Communications, on page 3 illustrates the relationship between the
components that constitute ALDEMS.
Figure 1: ALDEMS Component Communications
Alarm Logging and Debugging Event Management System
Correlator
The correlator receives messages from system logging (syslog) helper processes that are distributed across
the nodes on the router and forwards syslog messages to the syslog process. If a logging correlation rule is
configured, the correlator captures messages searching for a match with any message specified in the rule. If
the correlator finds a match, it starts a timer that corresponds to the timeout interval specified in the rule. The
correlator continues searching for a match to messages in the rule until the timer expires. If the root case
message was received, then a correlation occurs; otherwise, all captured messages are forwarded to the syslog.
When a correlation occurs, the correlated messages are stored in the logging correlation buffer. The correlator
tags each set of correlated messages with a correlation ID.
For more information about logging correlation, see the Logging Correlation, on page 4 section.Note
Cisco ASR 9000 Series Aggregation Services Router System Monitoring Configuration Guide, Release 4.2.x
3
Page 20

Logging Correlation
System Logging Process
By default, routers are configured to send system logging messages to a system logging (syslog) process.
Syslog messages are gathered by syslog helper processes that are distributed across the nodes on the system.
The system logging process controls the distribution of logging messages to the various destinations, such as
the system logging buffer, the console, terminal lines, or a syslog server, depending on the network device
configuration.
Alarm Logger
The alarm logger is the final destination for system logging messages forwarded on the router. The alarm
logger stores alarm messages in the logging events buffer. The logging events buffer is circular; that is, when
full, it overwrites the oldest messages in the buffer.
Implementing and Monitoring Alarms and Alarm Log Correlation
Note
Alarms are prioritized in the logging events buffer. When it is necessary to overwrite an alarm record, the
logging events buffer overwrites messages in the following order: nonbistate alarms first, then bistate
alarms in the CLEAR state, and, finally, bistate alarms in the SET state. For more information about bistate
alarms, see the Bistate Alarms, on page 6 section.
When the table becomes full of messages caused by bistate alarms in the SET state, the earliest bistate message
(based on the message time stamp, not arrival time) is reclaimed before others. The buffer size for the logging
events buffer and the logging correlation buffer, thus, should be adjusted so that memory consumption is
within your requirements.
A table-full alarm is generated each time the logging events buffer wraps around. A threshold crossing
notification is generated each time the logging events buffer reaches the capacity threshold.
Messages stored in the logging events buffer can be queried by clients to locate records matching specific
criteria. The alarm logging mechanism assigns a sequential, unique ID to each alarm message.
Logging Correlation
Logging correlation can be used to isolate the most significant root messages for events affecting system
performance. For example, the original message describing a card online insertion and removal (OIR) of a
card can be isolated so that only the root-cause message is displayed and all subsequent messages related to
the same event are correlated. When correlation rules are configured, a common root event that is generating
secondary (non-root-cause) messages can be isolated and sent to the syslog, while secondary messages are
suppressed. An operator can retrieve all correlated messages from the logging correlator buffer to view
correlation events that have occurred.
Correlation Rules
Correlation rules can be configured to isolate root messages that may generate system alarms. Correlation
rules prevent unnecessary stress on ALDEMS caused by the accumulation of unnecessary messages. Each
correlation rule hinges on a message identification, consisting of a message category, message group name,
and message code. The correlator process scans messages for occurrences of the message.
If the correlator receives a root message, the correlator stores it in the logging correlator buffer and forwards
it to the syslog process on the RP. From there, the syslog process forwards the root message to the alarm
Cisco ASR 9000 Series Aggregation Services Router System Monitoring Configuration Guide, Release 4.2.x
4
Page 21

Implementing and Monitoring Alarms and Alarm Log Correlation
logger in which it is stored in the logging events buffer. From the syslog process, the root message may also
be forwarded to destinations such as the console, remote terminals, remote servers, the fault management
system, and the Simple Network Management Protocol (SNMP) agent, depending on the network device
configuration. Subsequent messages meeting the same criteria (including another occurrence of the root
message) are stored in the logging correlation buffer and are forwarded to the syslog process on the router.
If a message matches multiple correlation rules, all matching rules apply and the message becomes a part of
all matching correlation queues in the logging correlator buffer.
The following message fields are used to define a message in a logging correlation rule:
Message category
•
Message group
•
Message code
•
Wildcards can be used for any of the message fields to cover wider set of messages. Configure the appropriate
set of messages in a logging correlation rule configuration to achieve correlation with a narrow or wide scope
(depending on your objective).
Application of Rules and Rule Sets
Types of Correlation
There are two types of correlation that are configured in rules to isolate root-cause messages:
Nonstateful Correlation—This correlation is fixed after it has occurred, and non-root-cause alarms that are
suppressed are never forwarded to the syslog process. All non-root-cause alarms remain buffered in correlation
buffers.
Stateful Correlation—This correlation can change after it has occurred, if the bistate root-cause alarm clears.
When the alarm clears, all the correlated non-root-cause alarms are sent to syslog and are removed from the
correlation buffer. Stateful correlations are useful to detect non-root-cause conditions that continue to exist
even if the suspected root cause no longer exists.
Application of Rules and Rule Sets
If a correlation rule is applied to the entire router, then correlation takes place only for those messages that
match the configured cause values for the rule, regardless of the context or location setting of that message.
If a correlation rule is applied to a specific set of contexts or locations, then correlation takes place only for
those messages that match the configured cause values for the rule and that match at least one of those contexts
or locations.
In the case of a rule-set application, the behavior is the same; however, the apply configuration takes place
for all rules that are part of the given rule set.
The show logging correlator rule command is used to display apply settings for a given rule, including
those settings that have been configured with the logging correlator apply ruleset command.
Root Message and Correlated Messages
When a correlation rule is configured and applied, the correlator starts searching for a message match as
specified in the rule. After a match is found, the correlator starts a timer corresponding to the timeout interval
Cisco ASR 9000 Series Aggregation Services Router System Monitoring Configuration Guide, Release 4.2.x
5
Page 22

Alarm Severity Level and Filtering
that is also specified in the rule. A message search for a match continues until the timer expires. Correlation
occurs after the root-cause message is received.
The first message (with category, group, and code triplet) configured in a correlation rule defines the root-cause
message. A root-cause message is always forwarded to the syslog process. See the Correlation Rules, on page
4 section to learn how the root-cause message is forwarded and stored.
Alarm Severity Level and Filtering
Filter settings can be used to display information based on severity level. The alarm filter display indicates
the severity level settings used to report alarms, the number of records, and the current and maximum log
size.
Alarms can be filtered according to the severity level shown in this table.
Table 2: Alarm Severity Levels for Event Logging
Implementing and Monitoring Alarms and Alarm Log Correlation
System ConditionSeverity Level
Bistate Alarms
Bistate alarms are generated by state changes associated with system hardware, such as a change of interface
state from active to inactive, the online insertion and removal (OIR) of a card , or a change in component
temperature. Bistate alarm events are reported to the logging events buffer by default; informational and debug
messages are not.
Cisco IOS XR Software software provides the ability to reset and clear alarms. Clients interested in monitoring
alarms in the system can register with the alarm logging mechanism to receive asynchronous notifications
when a monitored alarm changes state.
Bistate alarm notifications provide the following information:
Emergencies0
Alerts1
Critical2
Errors3
Warnings4
Notifications5
Informational6
The alarm state, which may be in the set state or the clear state.
•
Cisco ASR 9000 Series Aggregation Services Router System Monitoring Configuration Guide, Release 4.2.x
6
Page 23

Implementing and Monitoring Alarms and Alarm Log Correlation
Capacity Threshold Setting for Alarms
The capacity threshold setting determines when the alarm system begins reporting threshold crossing alarms.
The capacity threshold for generating warning alarms is generally set at 80 percent of buffer capacity, but
individual configurations may require different settings.
Hierarchical Correlation
Hierarchical correlation takes effect when the following conditions are true:
When a single alarm is both a root cause for one rule and a non-root cause for another rule.
•
When alarms are generated that result in successful correlations associated with both rules.
•
The following example illustrates two hierarchical correlation rules:
Capacity Threshold Setting for Alarms
CodeGroupCategoryRule 1
Note
Code 1Group 1Cat 1Root Cause 1
Code 2Group 2Cat 2Non-root Cause 2
Rule 2
Code 2Group 2Cat 2Root Cause 2
Code 3Group 3Cat 3Non-root Cause 3
If three alarms are generated for Cause 1, 2, and 3, with all alarms arriving within their respective correlation
timeout periods, then the hierarchical correlation appears like this:
Cause 1 -> Cause 2 -> Cause 3
The correlation buffers show two separate correlations: one for Cause 1 and Cause 2 and the second for Cause
2 and Cause 3. However, the hierarchical relationship is implicitly defined.
Stateful behavior, such as reparenting and reissuing of alarms, is supported for rules that are defined as
stateful; that is, correlations that can change.
Context Correlation Flag
The context correlation flag allows correlations to take place on a “per context” basis or not.
This flag causes behavior change only if the rule is applied to one or more contexts. It does not go into effect
if the rule is applied to the entire router or location nodes.
The following is a scenario of context correlation behavior:
Cisco ASR 9000 Series Aggregation Services Router System Monitoring Configuration Guide, Release 4.2.x
7
Page 24

Duration Timeout Flags
Rule 1 has a root cause A and an associated non-root cause.
•
Context correlation flag is not set on Rule 1.
•
Rule 1 is applied to contexts 1 and 2.
•
If the context correlation flag is not set on Rule 1, a scenario in which alarm A generated from context 1 and
alarm B generated from context 2 results in the rule applying to both contexts regardless of the type of context.
If the context correlation flag is now set on Rule 1 and the same alarms are generated, they are not correlated
as they are from different contexts.
With the flag set, the correlator analyzes alarms against the rule only if alarms arrive from the same context.
In other words, if alarm A is generated from context 1 and alarm B is generated from context 2, then a
correlation does not occur.
Duration Timeout Flags
The root-cause timeout (if specified) is the alternative rule timeout to use in the situation in which a
non-root-cause alarm arrives before a root-cause alarm in the given rule. It is typically used to give a shorter
timeout in a situation under the assumption that it is less likely that the root-cause alarm arrives, and, therefore,
releases the hold on the non-root-cause alarms sooner.
Implementing and Monitoring Alarms and Alarm Log Correlation
Reparent Flag
The reparent flag specifies what happens to non-root-cause alarms in a hierarchical correlation when their
immediate root cause clears.
The following example illustrates context correlation behavior:
Rule 1 has a root cause A and an associated non-root cause B
•
Context correlation flag is not set on Rule 1
•
Rule 1 is applied to contexts 1 and 2
•
In this scenario, if alarm A arrives generated from context 1 and alarm B generated from context 2, then a
correlation occurs—regardless of context.
If the context correlation flag is now set on Rule 1 and the same alarms are generated, they are not correlated,
because they are from different contexts.
Reissue Nonbistate Flag
The reissue nonbistate flag controls whether nonbistate alarms (events) are forwarded from the correlator log
if their parent bistate root-cause alarm clears. Active bistate non-root-causes are always forwarded in this
situation, because the condition is still present.
The reissue-nonbistate flag allows you to control whether non-bistate alarms are forwarded.
Cisco ASR 9000 Series Aggregation Services Router System Monitoring Configuration Guide, Release 4.2.x
8
Page 25

Implementing and Monitoring Alarms and Alarm Log Correlation
Internal Rules
Internal rules are defined on Cisco IOS XR Software and are used by protocols and processes within
Cisco IOS XR Software. These rules are not customer configurable, but you may view them by using the
show logging correlator rule command. All internal rule names are prefixed with [INTERNAL].
SNMP Alarm Correlation
In large-scale systems, such as Cisco IOS XR multi-chassis system , there may be situations when you encounter
many SNMP traps emitted at regular intervals of time. These traps, in turn, cause additional time in the Cisco
IOS XR processing of traps.
The additional traps can also slow down troubleshooting and increases workload for the monitoring systems
and the operators. So, this feature addresses these issues.
The objective of this SNMP alarm correlation feature is to:
Extract the generic pieces of correlation functionality from the existing syslog correlator
•
Internal Rules
Create DLLs and APIs suitable for reusing the functionality in other components
•
Integrate the SNMP agent with the DLLs to enable SNMP trap correlation
•
How to Implement and Monitor Alarm Management and Logging Correlation
Configuring Logging Correlation Rules
This task explains how to configure logging correlation rules.
The purpose of configuring logging correlation rules is to define the root cause and non-root-cause alarm
messages (with message category, group, and code combinations) for logging correlation. The originating
root-cause alarm message is forwarded to the syslog process, and all subsequent (non-root-cause) alarm
messages are sent to the logging correlation buffer.
The fields inside a message that can be used for configuring correlation rules are as follows:
Message category (for example, PKT_INFRA, MGBL, OS)
•
Message group (for example, LINK, LINEPROTO, or OIR)
•
Message code (for example, UPDOWN or GO_ACTIVE).
•
The logging correlator mechanism, running on the active route processor, begins queueing messages matching
the ones specified in the correlation rules for the time specified in the timeout interval of the correlation rule.
The timeout interval begins when the correlator captures any alarm message specified for a given rule.
Cisco ASR 9000 Series Aggregation Services Router System Monitoring Configuration Guide, Release 4.2.x
9
Page 26

Configuring Logging Correlation Rule Sets
SUMMARY STEPS
1.
2.
3.
4.
5.
DETAILED STEPS
Implementing and Monitoring Alarms and Alarm Log Correlation
configure
logging correlator rule correlation-rule { type { stateful | nonstateful }}
timeout [ milliseconds ]
commit
show logging correlator rule {all | correlation-rule1 ... correlation-rule14 } [ context context1 ... context
6 ] [ location node-id1...node-id6 ] [ rulesource { internal | user }] [ ruletype { nonstateful | stateful
}] [ summary | detail ]
PurposeCommand or Action
Step 1
Step 2
Step 3
Step 4
Step 5
configure
logging correlator rule correlation-rule { type { stateful
| nonstateful }}
Example:
RP/0/RSP0/CPU0:router(config)# logging correlator
rule rule_stateful
timeout [ milliseconds ]
Example:
RP/0/RSP0/CPU0:router(config-corr-rule-st)#
timeout 60000
commit
show logging correlator rule {all | correlation-rule1 ...
correlation-rule14 } [ context context1 ... context 6 ] [
location node-id1...node-id6 ] [ rulesource { internal |
user }] [ ruletype { nonstateful | stateful }] [ summary
| detail ]
Example:
Configures a logging correlation rule.
Stateful correlations can change specifically if the
•
root-cause alarm is bistate.
Nonstate correlations cannot change. All
•
non-root-cause alarms remain in the correlation
buffers.
Specifies the collection period duration time for the logging
correlator rule message.
Timeout begins when the first alarm message
•
identified by the correlation rule is logged.
(Optional) Displays defined correlation rules.
The output describes the configuration of each rule
•
name, including the message category, group, and
code information.
RP/0/RSP0/CPU0:router# show logging correlator
rule all
Configuring Logging Correlation Rule Sets
This task explains how to configure logging correlation rule sets.
Cisco ASR 9000 Series Aggregation Services Router System Monitoring Configuration Guide, Release 4.2.x
10
Page 27

Implementing and Monitoring Alarms and Alarm Log Correlation
SUMMARY STEPS
configure
1.
logging correlator ruleset ruleset
2.
rulename rulename
3.
commit
4.
show logging correlator ruleset { all | correlation-ruleset1...correlation-ruleset14 } [ detail | summary
5.
]
DETAILED STEPS
Configuring Root-cause and Non-root-cause Alarms
PurposeCommand or Action
Step 1
Step 2
Step 3
Step 4
Step 5
configure
logging correlator ruleset ruleset
Example:
RP/0/RSP0/CPU0:router(config)# logging correlator ruleset
ruleset1
rulename rulename
Example:
RP/0/RSP0/CPU0:router(config-corr-ruleset)# rulename
stateful_rule
commit
show logging correlator ruleset { all |
correlation-ruleset1...correlation-ruleset14 } [ detail | summary ]
Example:
RP/0/RSP0/CPU0:router# show logging correlator ruleset all
Configures a logging correlation rule
set.
Configures a rule name.
(Optional) Displays defined correlation
rule sets.
Configuring Root-cause and Non-root-cause Alarms
To correlate a root cause to one or more non-root-cause alarms and configure them to a rule, use the rootcause
and nonrootcause commands specified for the correlation rule.
Cisco ASR 9000 Series Aggregation Services Router System Monitoring Configuration Guide, Release 4.2.x
11
Page 28

Configuring Root-cause and Non-root-cause Alarms
SUMMARY STEPS
configure
1.
logging correlator rule correlation-rule { type { stateful | nonstateful }}
2.
rootcause { msg-category group-name msg-code }
3.
nonrootcause
4.
alarm msg-category group-name msg-code
5.
commit
6.
show logging correlator rule { all | correlation-rule1...correlation-rule14 } [ context context1...context
7.
6 ] [ location node-id1...node-id6 ] [ rulesource { internal | user }] [ ruletype { nonstateful | stateful
}] [ summary | detail ]
DETAILED STEPS
Implementing and Monitoring Alarms and Alarm Log Correlation
PurposeCommand or Action
Step 1
Step 2
Step 3
Step 4
Step 5
configure
logging correlator rule correlation-rule { type { stateful |
nonstateful }}
Example:
RP/0/RSP0/CPU0:router(config)# logging correlator
rule rule_stateful
rootcause { msg-category group-name msg-code }
Example:
RP/0/RSP0/CPU0:router(config-corr-rule-st)#
rootcause CAT_BI_1 GROUP_BI_1 CODE_BI_1
Example:
RP/0/RSP0/CPU0:router(config-corr-rule-st)#
nonrootcause
alarm msg-category group-name msg-code
Example:
RP/0/RSP0/CPU0:router(config-corr-rule-st-nonrc)#
alarm CAT_BI_2 GROUP_BI_2 CODE_BI_2
Configures a logging correlation rule and enters submodes
for stateful and nonstateful rule types.
Stateful correlations can change specifically if the
•
root-cause alarm is bistate.
Nonstate correlations cannot change. All
•
non-root-cause alarms remain in the correlation
buffers.
Configures a root-cause alarm message.
This example specifies a root-cause alarm under
•
stateful configuration mode
Enters the non-root-cause configuration modenonrootcause
Specifies a non-root-cause alarm message.
This command can be issued with the
•
nonrootcause command, such as
nonrootcause alarm msg-category group-name
msg-code
Step 6
12
commit
Cisco ASR 9000 Series Aggregation Services Router System Monitoring Configuration Guide, Release 4.2.x
Page 29

Implementing and Monitoring Alarms and Alarm Log Correlation
Configuring Hierarchical Correlation Rule Flags
PurposeCommand or Action
Step 7
(Optional) Displays the correlator rules that are defined.show logging correlator rule { all |
correlation-rule1...correlation-rule14 } [ context
context1...context 6 ] [ location node-id1...node-id6 ] [
rulesource { internal | user }] [ ruletype { nonstateful |
stateful }] [ summary | detail ]
Example:
RP/0/RSP0/CPU0:router# show logging correlator rule
all
Configuring Hierarchical Correlation Rule Flags
Hierarchical correlation is when a single alarm is both a root cause for one correlation rule and a non-root
cause for another rule, and when alarms are generated resulting in a successful correlation associated with
both rules. What happens to a non-root-cause alarm hinges on the behavior of its correlated root-cause alarm.
There are cases in which you want to control the stateful behavior associated with these hierarchies and to
implement flags, such as reparenting and reissuing of nonbistate alarms. This task explains how to implement
these flags.
See the Reparent Flag, on page 8 and Reissue Nonbistate Flag, on page 8 sections for detailed information
about these flags.
SUMMARY STEPS
DETAILED STEPS
Step 1
Step 2
configure
logging correlator rule correlation-rule { type { stateful |
nonstateful }}
configure
1.
logging correlator rule correlation-rule { type { stateful | nonstateful }}
2.
reissue-nonbistate
3.
reparent
4.
commit
5.
show logging correlator rule { all | correlation-rule1...correlation-rule14 } [ context context1...context
6.
6 ] [ location node-id1...node-id6 ] [ rulesource { internal | user }] [ ruletype { nonstateful | stateful
}] [ summary | detail ]
PurposeCommand or Action
Configures a logging correlation rule.
Stateful correlations can change specifically if
•
the root-cause alarm is bistate.
Cisco ASR 9000 Series Aggregation Services Router System Monitoring Configuration Guide, Release 4.2.x
13
Page 30

Applying Logging Correlation Rules
Example:
RP/0/RSP0/CPU0:router(config)# logging correlator
rule rule_stateful type nonstateful
Step 3
Step 4
reissue-nonbistate
Example:
RP/0/RSP0/CPU0:router(config-corr-rule-st)#
reissue-nonbistate
reparent
Example:
RP/0/RSP0/CPU0:router(config-corr-rule-st)# reparent
Implementing and Monitoring Alarms and Alarm Log Correlation
PurposeCommand or Action
Nonstateful correlations cannot change. All
•
non-root-cause alarms remain in the correlation
buffers.
Issues nonbistate alarm messages (events) from the
correlator log after its root-cause alarm clears.
Specifies the behavior of non-root-cause alarms after
a root-cause parent clears.
Step 5
Step 6
commit
show logging correlator rule { all |
correlation-rule1...correlation-rule14 } [ context
context1...context 6 ] [ location node-id1...node-id6 ] [
rulesource { internal | user }] [ ruletype { nonstateful |
stateful }] [ summary | detail ]
Example:
RP/0/RSP0/CPU0:router# show logging correlator rule
all
What to Do Next
To activate a defined correlation rule and rule set, you must apply them by using the logging correlator apply
rule and logging correlator apply ruleset commands.
Applying Logging Correlation Rules
This task explains how to apply logging correlation rules.
Applying a correlation rule activates it and gives a scope. A single correlation rule can be applied to multiple
scopes on the router; that is, a rule can be applied to the entire router, to several locations, or to several contexts.
(Optional) Displays the correlator rules that are
defined.
Note
When a rule is applied or if a rule set that contains this rule is applied, then the rule definition cannot be
modified through the configuration until the rule or rule set is once again unapplied.
Cisco ASR 9000 Series Aggregation Services Router System Monitoring Configuration Guide, Release 4.2.x
14
Page 31

Implementing and Monitoring Alarms and Alarm Log Correlation
Applying Logging Correlation Rules
Note
SUMMARY STEPS
DETAILED STEPS
It is possible to configure apply settings at the same time for both a rule and rule sets that contain the rule.
In this case, the apply settings for the rule are the union of all these apply configurations.
configure
1.
logging correlator apply rule correlation-rule
2.
Do one of the following:
3.
all-of-router
•
location node-id
•
context name
•
commit
4.
show logging correlator rule { all | correlation-rule1...correlation-rule14 } [ context context1...context
5.
6 ] [ location node-id1...node-id6 ] [ rulesource { internal | user }] [ ruletype { nonstateful | stateful
}] [ summary | detail ]
PurposeCommand or Action
Step 1
Step 2
Step 3
configure
logging correlator apply rule correlation-rule
Example:
RP/0/RSP0/CPU0:router(config)# logging correlator
apply-rule rule1
Do one of the following:
all-of-router
•
location node-id
•
context name
•
Example:
RP/0/RSP0/CPU0:router(config-corr-apply-rule)#
all-of-router
or
RP/0/RSP0/CPU0:router(config-corr-apply-rule)# location
0/2/CPU0
Applies and activates a correlation rule and enters
correlation apply rule configuration mode.
Applies a logging correlation rule to all nodes
•
on the router.
Applies a logging correlation rule to a
•
specific node on the router.
The location of the node is specified in
◦
the format rack/slot/module.
Applies a logging correlation rule to a
•
specific context.
Cisco ASR 9000 Series Aggregation Services Router System Monitoring Configuration Guide, Release 4.2.x
15
Page 32

Applying Logging Correlation Rule Sets
or
RP/0/RSP0/CPU0:router(config-corr-apply-rule)# logging
correlator apply-rule rule2 context POS_0_0_0_0
Step 4
commit
Implementing and Monitoring Alarms and Alarm Log Correlation
PurposeCommand or Action
Step 5
show logging correlator rule { all |
correlation-rule1...correlation-rule14 } [ context context1...context
6 ] [ location node-id1...node-id6 ] [ rulesource { internal | user
}] [ ruletype { nonstateful | stateful }] [ summary | detail ]
Example:
RP/0/RSP0/CPU0:router# show logging correlator rule all
Applying Logging Correlation Rule Sets
This task explains how to apply logging correlation rule sets.
Applying a correlation rule set activates it and gives a scope. When applied, a single rule-set configuration
immediately effects the rules that are part of that given rule set.
Note
Rule definitions that were previously applied (singly or as part of another rule set) cannot be modified
until that rule or rule set is unapplied. Use the no form of the command to negate usage and then try to
reapply rule set.
(Optional) Displays the correlator rules that are
defined.
SUMMARY STEPS
Cisco ASR 9000 Series Aggregation Services Router System Monitoring Configuration Guide, Release 4.2.x
16
configure
1.
logging correlator apply ruleset correlation-rule
2.
Do one of the following:
3.
all-of-router
•
location node-id
•
context name
•
commit
4.
show logging correlator ruleset { all | correlation-ruleset1 ... correlation-ruleset14 } [ detail | summary
5.
]
Page 33

Implementing and Monitoring Alarms and Alarm Log Correlation
DETAILED STEPS
Modifying Logging Events Buffer Settings
PurposeCommand or Action
Step 1
Step 2
Step 3
configure
logging correlator apply ruleset correlation-rule
Example:
RP/0/RSP0/CPU0:router(config)# logging correlator
apply ruleset ruleset2
Do one of the following:
all-of-router
•
location node-id
•
context name
•
Example:
RP/0/RSP0/CPU0:router(config-corr-ruleset)#
all-of-router
or
RP/0/RSP0/CPU0:router(config-corr-ruleset)# location
0/2/CPU0
or
RP/0/RSP0/CPU0:router(config-corr-ruleset)# context
Applies and activates a rule set and enters correlation
apply rule set configuration mode.
Applies a logging correlation rule set to all nodes
•
on the router.
Applies a logging correlation rule set to a specific
•
node on the router.
The location of the node is specified in the
◦
format rack/slot/module .
Applies a logging correlation rule set to a specific
•
context.
Step 4
Step 5
commit
show logging correlator ruleset { all | correlation-ruleset1
... correlation-ruleset14 } [ detail | summary ]
Example:
RP/0/RSP0/CPU0:router# show logging correlator
ruleset all
Modifying Logging Events Buffer Settings
Logging events buffer settings can be adjusted to respond to changes in user activity, network events, or
system configuration events that affect network performance, or in network monitoring requirements. The
appropriate settings depend on the configuration and requirements of the system.
This task involves the following steps:
Modifying logging events buffer size
•
(Optional) Displays the correlator rules that are
defined.
Cisco ASR 9000 Series Aggregation Services Router System Monitoring Configuration Guide, Release 4.2.x
17
Page 34

Modifying Logging Events Buffer Settings
Setting threshold for generating alarms
•
Setting the alarm filter (severity)
•
Implementing and Monitoring Alarms and Alarm Log Correlation
Caution
Caution
SUMMARY STEPS
DETAILED STEPS
Modifications to alarm settings that lower the severity level for reporting alarms and threshold for generating
capacity-warning alarms may slow system performance.
Modifying the logging events buffer size clears the buffer of all event records except for the bistate alarms
in the set state.
show logging events info
1.
configure
2.
logging events buffer-size bytes
3.
logging events threshold percent
4.
logging events level severity
5.
commit
6.
show logging events info
7.
PurposeCommand or Action
Step 1
Step 2
Step 3
Step 4
show logging events info
Example:
RP/0/RSP0/CPU0:router# show logging
events info
configure
logging events buffer-size bytes
Example:
RP/0/RSP0/CPU0:router(config)#
logging events buffer-size 50000
logging events threshold percent
Example:
RP/0/RSP0/CPU0:router(config)#
logging events threshold 85
(Optional) Displays the size of the logging events buffer (in bytes), the
percentage of the buffer that is occupied by alarm-event records, capacity
threshold for reporting alarms, total number of records in the buffer, and
severity filter, if any.
Specifies the size of the alarm record buffer.
In this example, the buffer size is set to 50000 bytes.
•
Specifies the percentage of the logging events buffer that must be filled
before the alarm logger generates a threshold-crossing alarm.
In this example, the alarm logger generates athreshold-crossing alarm
•
notification when the event buffer reaches 85 percent of capacity.
Cisco ASR 9000 Series Aggregation Services Router System Monitoring Configuration Guide, Release 4.2.x
18
Page 35

Implementing and Monitoring Alarms and Alarm Log Correlation
Modifying Logging Correlator Buffer Settings
PurposeCommand or Action
Step 5
Step 6
Step 7
logging events level severity
Example:
RP/0/RSP0/CPU0:router(config)#
logging events level warnings
commit
show logging events info
Example:
RP/0/RSP0/CPU0:router# show logging
events info
Sets the severity level that determines which logging events are displayed.
(See Table 2: Alarm Severity Levels for Event Logging , on page 6 under
the Alarm Severity Level and Filtering, on page 6 section for a list of the
severity levels.)
Keyword options are as follows: emergencies, alerts, critical, errors,
•
warnings, notifications, and informational.
In this example, messages with a warning (Level 4) severity or greater
•
are written to the alarm log. Messages of a lesser severity (notifications
and informational messages) are not recorded.
(Optional) Displays the size of the logging events buffer (in bytes), percentage
of the buffer that is occupied by alarm-event records, capacity threshold for
reporting alarms, total number of records in the buffer, and severity filter, if
any.
This command is used to verify that all settings have been modified
•
and that the changes have been accepted by the system.
Modifying Logging Correlator Buffer Settings
This task explains how to modify the logging correlator buffer settings.
The size of the logging correlator buffer can be adjusted to accommodate the anticipated volume of incoming
correlated messages. Records can be removed from the buffer by correlation ID, or the buffer can be cleared
of all records.
SUMMARY STEPS
configure
1.
logging correlator buffer-size bytes
2.
exit
3.
show logging correlator info
4.
clear logging correlator delete correlation-id
5.
clear logging correlator delete all-in-buffer
6.
show logging correlator buffer { all-in-buffer [ ruletype [ nonstateful | stateful ]] | [ rulesource [
7.
internal | user ]] | rule-name correlation-rule1...correlation-rule14 | correlationID
correlation-id1..correlation-id14 }
Cisco ASR 9000 Series Aggregation Services Router System Monitoring Configuration Guide, Release 4.2.x
19
Page 36

Displaying Alarms by Severity and Severity Range
DETAILED STEPS
Implementing and Monitoring Alarms and Alarm Log Correlation
PurposeCommand or Action
Step 1
Step 2
Step 3
Step 4
Step 5
configure
logging correlator buffer-size bytes
Example:
RP/0/RSP0/CPU0:router(config)# logging correlator
buffer-size 100000
exit
Example:
RP/0/RSP0/CPU0:router(config)# exit
show logging correlator info
Example:
RP/0/RSP0/CPU0:router# show logging correlator
info
clear logging correlator delete correlation-id
Example:
RP/0/RSP0/CPU0:router# clear logging correlator
delete 48 49 50
Specifies the size of the logging correlator buffer.
In this example, the size of the logging correlator buffer
•
is set to 100,000 bytes.
Exits global configuration mode and returns the router to
EXEC mode.
(Optional) Displays information about the size of the logging
correlator buffer and percentage of the buffer occupied by
correlated messages
(Optional) Removes a particular correlated event record or
records from the logging correlator buffer.
A range of correlation IDs can also be specified for
•
removal (up to 32 correlation IDs, separated by a
space).
Step 6
clear logging correlator delete all-in-buffer
(Optional) Clears all correlated event messages from the
logging correlator buffer.
Example:
RP/0/RSP0/CPU0:router# clear logging correlator
delete all-in-buffer
Step 7
show logging correlator buffer { all-in-buffer [ ruletype
[ nonstateful | stateful ]] | [ rulesource [ internal | user
]] | rule-name correlation-rule1...correlation-rule14 |
correlationID correlation-id1..correlation-id14 }
(Optional) Displays the contents of the correlated event
record.
Use this step to verify that records for particular
•
correlation IDs have been removed from the correlated
event log.
Example:
RP/0/RSP0/CPU0:router# show logging correlator
buffer all-in-buffer
Displaying Alarms by Severity and Severity Range
This task explains how to display alarms by severity and severity range.
Cisco ASR 9000 Series Aggregation Services Router System Monitoring Configuration Guide, Release 4.2.x
20
Page 37

Implementing and Monitoring Alarms and Alarm Log Correlation
Alarms can be displayed according to severity level or a range of severity levels. Severity levels and their
respective system conditions are listed in Table 2: Alarm Severity Levels for Event Logging , on page 6
under the Alarm Severity Level and Filtering, on page 6 section.
The commands can be entered in any order.Note
SUMMARY STEPS
show logging events buffer severity-lo-limit severity
1.
show logging events buffer severity-hi-limit severity
2.
show logging events buffer severity-hi-limit severity severity-lo-limit severity
3.
show logging events buffer severity-hi-limit severity severity-lo-limit severity timestamp-lo-limit hh
4.
: mm : ss [ month ] [ day ] [ year ]
DETAILED STEPS
Displaying Alarms by Severity and Severity Range
Step 1
Step 2
Step 3
show logging events buffer severity-lo-limit
severity
Example:
RP/0/RSP0/CPU0:router# show logging events
buffer severity-lo-limit notifications
show logging events buffer severity-hi-limit
severity
Example:
RP/0/RSP0/CPU0:router# show logging events
buffer severity-hi-limit critical
severity severity-lo-limit severity
Example:
RP/0/RSP0/CPU0:router# show logging events
buffer severity-hi-limit alerts
severity-lo-limit critical
PurposeCommand or Action
(Optional) Displays logging events with a severity at or below the
numeric value of the specified severity level.
In this example, alarms with a severity of notifications (severity
•
of 5) or lower are displayed. Informational (severity of 6) messages
are omitted.
Note
Use the severity-lo-limit keyword and the severity argument
to specify the severity level description, not the numeric value
assigned to that severity level.
(Optional) Displays logging events with a severity at or above the
numeric value specified severity level.
In this example, alarms with a severity of critical (severity of 2) or
•
greater are displayed. Alerts (severity of 1) and emergencies
(severity of 0) are omitted.
Note
Use the severity-hi-limit keyword and the severity argument
to specify the severity level description, not the numeric value
assigned to that severity level.
(Optional) Displays logging events within a severity range.show logging events buffer severity-hi-limit
In this example, alarms with a severity of critical (severity of 2)
•
and alerts (severity of 1) are displayed. All other event severities
are omitted.
Cisco ASR 9000 Series Aggregation Services Router System Monitoring Configuration Guide, Release 4.2.x
21
Page 38

Displaying Alarms According to a Time Stamp Range
Implementing and Monitoring Alarms and Alarm Log Correlation
PurposeCommand or Action
Step 4
show logging events buffer severity-hi-limit
severity severity-lo-limit severity
timestamp-lo-limit hh : mm : ss [ month ] [ day
] [ year ]
Example:
RP/0/RSP0/CPU0:router# show logging events
buffer severity-lo-limit warnings
severity-hi-limit critical
timestamp-lo-limit 22:00:00 may 07 04
(Optional) Displays logging events occurring after the specified time
stamp and within a severity range. The month, day, and year arguments
default to the current month, date, and year, if not specified.
In this example, alarms with a severity of warnings (severity of 4),
•
errors (severity of 3), and critical (severity of 2) that occur after
22:00:00 on May 7, 2004 are displayed. All other messages
occurring before the time stamp are omitted.
Displaying Alarms According to a Time Stamp Range
Alarms can be displayed according to a time stamp range. Specifying a specific beginning and endpoint can
be useful in isolating alarms occurring during a particular known system event.
This task explains how to display alarms according to a time stamp range.
The commands can be entered in any order.Note
SUMMARY STEPS
DETAILED STEPS
Step 1
show logging events buffer timestamp-lo-limit hh :
mm : ss [ month ] [ day ] [ year ]
Example:
RP/0/RSP0/CPU0:router# show logging events
buffer timestamp-lo-limit 21:28:00 april 18 04
Step 2
show logging events buffer timestamp-hi-limit hh :
mm : ss [ month ] [ day ] [ year ]
show logging events buffer timestamp-lo-limit hh : mm : ss [ month ] [ day ] [ year ]
1.
show logging events buffer timestamp-hi-limit hh : mm : ss [ month ] [ day ] [ year ]
2.
show logging events buffer timestamp-hi-limit hh : mm : ss [ month ] [ day ] [ year ] timestamp-lo-limit
3.
hh : mm : ss [ month ] [ day ] [ year ]
PurposeCommand or Action
(Optional) Displays logging events with a time stamp after the
specified time and date.
The month, day, and year arguments default to the current
•
month, date, and year if not specified.
The sample output displays events logged after 21:28:00 on
•
April 18, 2004.
(Optional) Displays logging events with a time stamp before the
specified time and date.
Cisco ASR 9000 Series Aggregation Services Router System Monitoring Configuration Guide, Release 4.2.x
22
Page 39

Implementing and Monitoring Alarms and Alarm Log Correlation
Example:
RP/0/RSP0/CPU0:router# show logging events
buffer timestamp-hi-limit 21:28:03 april 18 04
Displaying Alarms According to Message Group and Message Code
PurposeCommand or Action
The month, day, and year arguments default to the current
•
month, date, and year if not specified.
The sample output displays events logged before 21:28:03
•
on April 18, 2004.
Step 3
show logging events buffer timestamp-hi-limit hh :
mm : ss [ month ] [ day ] [ year ] timestamp-lo-limit
hh : mm : ss [ month ] [ day ] [ year ]
Example:
RP/0/RSP0/CPU0:router# show logging events
buffer timestamp-hi-limit 21:28:00 april 18 04
timestamp-lo-limit 21:16:00 april 18 03
(Optional) Displays logging events with a time stamp after and
before the specified time and date.
The month, day, and year arguments default to the current
•
month, day, and year if not specified.
The sample output displays events logged after 21:16:00 on
•
April 18, 2003 and before 21:28:00 on April 18, 2004.
Displaying Alarms According to Message Group and Message Code
This task explains how to display alarms in the logging events buffer according to message code and message
group.
Displaying alarms by message group and message code can be useful in isolating related events.
The commands can be entered in any order.Note
SUMMARY STEPS
DETAILED STEPS
Step 1
show logging events buffer group message-group
Example:
RP/0/RSP0/CPU0:router# show logging events
buffer group SONET
show logging events buffer group message-group
1.
show logging events buffer message message-code
2.
show logging events buffer group message-group message message-code
3.
PurposeCommand or Action
(Optional) Displays logging events matching the specified
message group.
In this example, all events that contain the message group
•
SONET are displayed.
Cisco ASR 9000 Series Aggregation Services Router System Monitoring Configuration Guide, Release 4.2.x
23
Page 40

Displaying Alarms According to a First and Last Range
Implementing and Monitoring Alarms and Alarm Log Correlation
PurposeCommand or Action
Step 2
show logging events buffer message message-code
(Optional) Displays logging events matching the specified
message code.
Step 3
Example:
RP/0/RSP0/CPU0:router# show logging events
buffer message ALARM
show logging events buffer group message-group
message message-code
Example:
RP/0/RSP0/CPU0:router# show logging events
buffer group SONET message ALARM
In this example, all events that contain the message code
•
ALARM are displayed.
(Optional) Displays logging events matching the specified
message group and message code.
In this example, all events that contain the message group
•
SONET and message code ALARM are displayed.
Displaying Alarms According to a First and Last Range
This task explains how to display alarms according to a range of the first and last alarms in the logging events
buffer.
Alarms can be displayed according to a range, beginning with the first or last alarm in the logging events
buffer.
SUMMARY STEPS
DETAILED STEPS
Step 1
show logging events buffer first event-count
Example:
RP/0/RSP0/CPU0:router# show logging
events buffer first 15
The commands can be entered in any order.Note
show logging events buffer first event-count
1.
show logging events buffer last event-count
2.
show logging events buffer first event-count last event-count
3.
PurposeCommand or Action
(Optional) Displays logging events beginning with the first event in the
logging events buffer.
For the event-count argument, enter the number of events to be
•
displayed.
In this example, the first 15 events in the logging events buffer
•
are displayed.
Cisco ASR 9000 Series Aggregation Services Router System Monitoring Configuration Guide, Release 4.2.x
24
Page 41

Implementing and Monitoring Alarms and Alarm Log Correlation
Displaying Alarms by Location
PurposeCommand or Action
Step 2
Step 3
show logging events buffer last event-count
Example:
RP/0/RSP0/CPU0:router# show logging
events buffer last 20
show logging events buffer first event-count
last event-count
Example:
RP/0/RSP0/CPU0:router# show logging
events buffer first 20 last 20
Displaying Alarms by Location
This task explains how to display alarms by location.
(Optional) Displays logging events beginning with the last event in the
logging events buffer.
For the event-count argument, enter the number of events to be
•
displayed.
In this example, the last 20 events in the logging events buffer are
•
displayed.
(Optional) Displays the first and last events in the logging events buffer.
For the event-count argument, enter the number of events to be
•
displayed.
In this example, both the first 20 and last 20 events in the logging
•
events buffer are displayed.
SUMMARY STEPS
DETAILED STEPS
Step 1
show logging events buffer location node-id
Example:
RP/0/RSP0/CPU0:router# show logging events
buffer 0/2/CPU0
The commands can be entered in any order.Note
show logging events buffer location node-id
1.
show logging events buffer location node-id event-hi-limit event-id event-lo-limit event-id
2.
PurposeCommand or Action
(Optional) Isolates the occurrence of the range of event IDs to
a particular node.
The location of the node is specified in the format
•
rack/slot/module.
Cisco ASR 9000 Series Aggregation Services Router System Monitoring Configuration Guide, Release 4.2.x
25
Page 42

Displaying Alarms by Event Record ID
Implementing and Monitoring Alarms and Alarm Log Correlation
PurposeCommand or Action
Step 2
show logging events buffer location node-id
event-hi-limit event-id event-lo-limit event-id
Example:
RP/0/RSP0/CPU0:router# show logging events
buffer location 0/2/CPU0 event-hi-limit 100
event-lo-limit 1
Displaying Alarms by Event Record ID
This task explains how to display alarms by event record ID.
The commands can be entered in any order.Note
SUMMARY STEPS
show logging events buffer all-in-buffer
1.
show logging events buffer event-hi-limit event-id event-lo-limit event-id
2.
(Optional) Isolates the occurrence of the range of event IDs to
a particular node and narrows the range by specifying a high
and low limit of event IDs to be displayed.
The location of the node is specified in the format
•
rack/slot/module.
DETAILED STEPS
Step 1
Step 2
show logging events buffer all-in-buffer
Example:
RP/0/RSP0/CPU0:router# show logging events buffer
all-in-buffer
show logging events buffer event-hi-limit event-id
event-lo-limit event-id
Example:
RP/0/RSP0/CPU0:router# show logging events buffer
event-hi-limit 100 event-lo-limit 1
PurposeCommand or Action
(Optional) Displays all messages in the logging events
buffer.
Caution
Depending on the alarm severity settings, use
of this command can create a large amount of
output.
(Optional) Narrows the range by specifying a high and low
limit of event IDs to be displayed.
Cisco ASR 9000 Series Aggregation Services Router System Monitoring Configuration Guide, Release 4.2.x
26
Page 43

Implementing and Monitoring Alarms and Alarm Log Correlation
Displaying the Logging Correlation Buffer Size, Messages, and Rules
Displaying the Logging Correlation Buffer Size, Messages, and Rules
This task explains how to display the logging correlation buffer size, messages in the logging correlation
buffer, and correlation rules.
The commands can be entered in any order.Note
SUMMARY STEPS
show logging correlator info
1.
show logging correlator buffer all-in-buffer
2.
show logging correlator buffer correlationID correlation-id
3.
show logging correlator buffer rule-name correlation-rule
4.
show logging correlator rule all
5.
show logging correlator rule correlation-rule
6.
show logging correlator ruleset all
7.
show logging correlator ruleset ruleset-name
8.
DETAILED STEPS
Step 1
Step 2
Step 3
Step 4
show logging correlator info
Example:
RP/0/RSP0/CPU0:router# show logging correlator info
show logging correlator buffer all-in-buffer
Example:
RP/0/RSP0/CPU0:router# show logging correlator buffer
all-in-buffer
show logging correlator buffer correlationID correlation-id
Example:
RP/0/RSP0/CPU0:router# show logging correlator buffer
correlationID 37
show logging correlator buffer rule-name correlation-rule
Example:
PurposeCommand or Action
(Optional) Displays the size of the logging correlation
buffer (in bytes) and the percentage occupied by
correlated messages.
(Optional) Displays all messages in the logging
correlation buffer.
(Optional) Displays specific messages matching a
particular correlation ID in the correlation buffer.
(Optional) Displays specific messages matching a
particular rule in the correlation buffer.
RP/0/RSP0/CPU0:router# show logging correlator buffer
rule-name rule7
Cisco ASR 9000 Series Aggregation Services Router System Monitoring Configuration Guide, Release 4.2.x
27
Page 44

Clearing Alarm Event Records and Resetting Bistate Alarms
Implementing and Monitoring Alarms and Alarm Log Correlation
PurposeCommand or Action
Step 5
Step 6
Step 7
Step 8
Example:
RP/0/RSP0/CPU0:router# show logging correlator rule
all
show logging correlator rule correlation-rule
Example:
RP/0/RSP0/CPU0:router# show logging correlator rule
rule7
Example:
RP/0/RSP0/CPU0:router# show logging correlator ruleset
all
show logging correlator ruleset ruleset-name
Example:
RP/0/RSP0/CPU0:router# show logging correlator ruleset
ruleset_static
(Optional) Displays all defined correlation rules.show logging correlator rule all
(Optional) Displays the specified correlation rule.
(Optional) Displays all defined correlation rule sets.show logging correlator ruleset all
(Optional) Displays the specified correlation rule set.
Clearing Alarm Event Records and Resetting Bistate Alarms
This task explains how to clear alarm event records and bistate alarms.
Unnecessary and obsolete messages can be cleared to reduce the size of the event logging buffer and make it
more searchable, and thus more navigable.
The filtering capabilities available for clearing events in the logging events buffer (with the clear logging
events delete command) are also available for displaying events in the logging events buffer (with the show
logging events buffer command).
The commands can be entered in any order.Note
Cisco ASR 9000 Series Aggregation Services Router System Monitoring Configuration Guide, Release 4.2.x
28
Page 45

Implementing and Monitoring Alarms and Alarm Log Correlation
SUMMARY STEPS
show logging events buffer all-in-buffer
1.
clear logging events delete timestamp-lo-limit hh : mm : ss [ month ] [ day ] [ year ]
2.
clear logging events delete event-hi-limit severity event-lo-limit severity
3.
clear logging events delete location node-id
4.
clear logging events delete first event-count
5.
clear logging events delete last event-count
6.
clear logging events delete message message-code
7.
clear logging events delete group message-group
8.
clear logging events reset all-in-buffer
9.
show logging events buffer all-in-buffer
10.
DETAILED STEPS
Clearing Alarm Event Records and Resetting Bistate Alarms
Step 1
Step 2
Step 3
Step 4
show logging events buffer all-in-buffer
Example:
RP/0/RSP0/CPU0:router# show logging events
buffer all-in-buffer
clear logging events delete timestamp-lo-limit hh
: mm : ss [ month ] [ day ] [ year ]
Example:
RP/0/RSP0/CPU0:router# clear logging events
delete timestamp-lo-limit 20:00:00 april
01 2004
clear logging events delete event-hi-limit severity
event-lo-limit severity
Example:
RP/0/RSP0/CPU0:router# clear logging events
delete event-hi-limit warnings
event-lo-limit informational
clear logging events delete location node-id
Example:
RP/0/RSP0/CPU0:router# clear logging events
delete location 0/2/CPU0
PurposeCommand or Action
It retains the messages before the specified time and displayed the
messages after the timestamp. The timestamp-lo-limit specifies the
lower time limit. Similarly timestamp-hi-limit specifies the higher
time limit of a time window. All events within this time window will
be displayed. The default value of the timestamp-lo-limit is the
timestamp of the earliest event in the buffer. The timestamp-hi-limit
is the timestamp of the latest event in the buffer.
It retains the messages before the specified time and deletes the
messages after the timestamp. The timestamp-lo-limit specifies the
lower time limit. Similarly timestamp-hi-limit specifies the higher
time limit of a time window. All events within this time window will
be deleted. The default value of the timestamp-lo-limit is the
timestamp of the earliest event in the buffer. The timestamp-hi-limit
is the timestamp of the latest event in the buffer.
(Optional) Deletes logging events within a range of severity levels
for logging alarm messages.
In this example, all events with a severity level of warnings,
•
notifications, and informational are deleted.
(Optional) Deletes logging events from the logging events that have
occurred on a particular node.
The location of the node is specified in the format
•
rack/slot/module.
Cisco ASR 9000 Series Aggregation Services Router System Monitoring Configuration Guide, Release 4.2.x
29
Page 46

Defining SNMP Correlation Buffer Size
Implementing and Monitoring Alarms and Alarm Log Correlation
PurposeCommand or Action
Step 5
Step 6
Step 7
Step 8
Step 9
clear logging events delete first event-count
Example:
RP/0/RSP0/CPU0:router# clear logging events
delete first 10
clear logging events delete last event-count
Example:
RP/0/RSP0/CPU0:router# clear logging events
delete last 20
clear logging events delete message message-code
Example:
RP/0/RSP0/CPU0:router# clear logging events
delete message sys
clear logging events delete group message-group
Example:
RP/0/RSP0/CPU0:router# clear logging events
delete group config_i
clear logging events reset all-in-buffer
Example:
(Optional) Deletes logging events beginning with the first event in
the logging events buffer.
In this example, the first 10 events in the logging events buffer
•
are cleared.
(Optional) Deletes logging events beginning with the last event in
the logging events buffer.
In this example, the last 20 events in the logging events buffer
•
are cleared.
(Optional) Deletes logging events that contain the specified message
code.
In this example, all events that contain the message code SYS
•
are deleted from the logging events buffer.
(Optional) Deletes logging events that contain the specified message
group.
In this example, all events that contain the message group
•
CONFIG_I are deleted from the logging events buffer.
(Optional) Clears all bistate alarms in the SET state from the logging
events buffer.
RP/0/RSP0/CPU0:router# clear logging events
reset all-in-buffer
Step 10
Example:
RP/0/RSP0/CPU0:router# show logging events
buffer all-in-buffer
(Optional) Displays all messages in the logging events buffer.show logging events buffer all-in-buffer
Defining SNMP Correlation Buffer Size
This task explains how to define correlation buffer size for SNMP traps.
SUMMARY STEPS
configure
1.
snmp-server correlator buffer-size bytes
2.
commit
3.
Cisco ASR 9000 Series Aggregation Services Router System Monitoring Configuration Guide, Release 4.2.x
30
Page 47

Implementing and Monitoring Alarms and Alarm Log Correlation
DETAILED STEPS
Defining SNMP Rulesets
PurposeCommand or Action
Step 1
Step 2
Step 3
configure
snmp-server correlator buffer-size bytes
Example:
RP/0/RSP0/CPU0:router(config)# snmp-server
correlator buffer-size 600
commit
Defining SNMP Rulesets
This task defines a ruleset that allows you to group two or more rules into a group. You can apply the specified
group to a set of hosts or all of them.
SUMMARY STEPS
configure
1.
snmp-server correlator ruleset name rulename name
2.
commit
3.
Defines the buffer size that can store SNMP correlation traps.
The default size is 64KB. You can clear the correlation buffers
manually or the buffer wraps automatically, wherein the oldest
correlations are purged to accommodate the newer correlations.
DETAILED STEPS
Step 1
Step 2
Step 3
configure
snmp-server correlator ruleset name rulename name
Example:
RP/0/RSP0/CPU0:router(config)# snmp-server correlator
ruleset rule1 rulename rule2 host ipv4 address 1.2.3.4
host ipv4 address 2.3.4.5 port 182
commit
Configuring SNMP Correlation Rules
This task explains how to configure SNMP correlation rules.
PurposeCommand or Action
Specifies a ruleset that allows you to group two
or more rules into a group and apply that group
to a set of hosts.
Cisco ASR 9000 Series Aggregation Services Router System Monitoring Configuration Guide, Release 4.2.x
31
Page 48

Applying SNMP Correlation Rules
SUMMARY STEPS
DETAILED STEPS
Implementing and Monitoring Alarms and Alarm Log Correlation
The purpose of configuring SNMP trap correlation rules is to define the correlation rules or non-correlation
rules and apply them to specific trap destinations.
configure
1.
snmp-server correlator rule rule_name { nonrootcause trap trap_oid varbind vbind_OID { index |
2.
value } regex line | rootcause trap trap_oid varbind vbind_OID { index | value } regex line | timeout
}
commit
3.
PurposeCommand or Action
Step 1
Step 2
Step 3
configure
snmp-server correlator rule rule_name {
nonrootcause trap trap_oid varbind vbind_OID
{ index | value } regex line | rootcause trap
trap_oid varbind vbind_OID { index | value }
regex line | timeout }
Example:
RP/0/RSP0/CPU0:router(config)#
snmp-server correlator rule test
rootcause A
varbind A1 value regex RA1
varbind A2 index regex RA2
timeout 5000
nonrootcause
trap B
varbind B1 index regex RB1
varbind B2 value regex RB2
trap C
varbind C1 value regex RC1
varbind C2 value regex RC2
commit
Configures a SNMP correlation rule. You can specify the numeric
rootcause trap OID or non-rootcause trap matching definitions.
Specifies a numeric non-rootcause trap OID and, optionally, one
•
or more numeric varbinds specific to the non-rootcause trap that
must ALL also be matched to have found a valid non-rootcause
for this rule. The POSIX regexp specifies a regular expression that
the value that the vbind index or value must match.
Specifies a numeric rootcause trap OID and, optionally, one or
•
more numeric varbinds specific to the rootcause trap that must
ALL also be matched to have found a valid rootcause for this rule.
The POSIX regexp specifies a regular expression that the vbind
index or value must match.
Note
You can specify the timeout for detection of a correlation after
receipt of first rootcause or non-rootcause in this specified rule.
The range is from 1 to 600000 milliseconds.
Note
All OID values for traps and varbinds are verified and rejected,
if they do not match valid OIDs supported by IOS XR.
Applying SNMP Correlation Rules
The purpose of this task is to apply the SNMP trap correlation rules to specific trap destinations.
Cisco ASR 9000 Series Aggregation Services Router System Monitoring Configuration Guide, Release 4.2.x
32
Page 49

Implementing and Monitoring Alarms and Alarm Log Correlation
SUMMARY STEPS
configure
1.
snmp-server correlator apply rule rule-name [ all-hosts | host ipv4 address address [ port ]
2.
commit
3.
DETAILED STEPS
Applying SNMP Correlation Ruleset
PurposeCommand or Action
Step 1
Step 2
configure
snmp-server correlator apply rule rule-name [ all-hosts
| host ipv4 address address [ port ]
Example:
RP/0/RSP0/CPU0:router# snmp-server correlator
apply rule ifupdown host ipv4 address 1.2.3.4
host ipv4 address 2.3.4.5 port 182
Step 3
commit
Applying SNMP Correlation Ruleset
The purpose of this task is to apply the set of two SNMP trap correlation rules or more rules as a group to
specific trap destinations.
SUMMARY STEPS
configure
1.
snmp-server correlator apply ruleset ruleset-name [ all-hosts | host ipv4 address address [ port ]
2.
commit
3.
Applies the SNMP trap correlation rules to specific trap
destinations. You have an option of applying the rule to
traps destined for all trap hosts, or to a specific subset by
specifying individual IP addresses and optional ports.
DETAILED STEPS
Step 1
Step 2
configure
snmp-server correlator apply ruleset ruleset-name [
all-hosts | host ipv4 address address [ port ]
Example:
RP/0/RSP0/CPU0:router# snmp-server correlator
apply ruleset ruleset_1 host ipv4 address
1.2.3.4 host ipv4 address 2.3.4.5 port 182
Cisco ASR 9000 Series Aggregation Services Router System Monitoring Configuration Guide, Release 4.2.x
PurposeCommand or Action
Applies the SNMP trap correlation ruleset to specific trap
destinations. You have an option of applying the set of two
or more SNMP trap correlation rules to traps destined for
all trap hosts, or to a specific subset by specifying individual
IP addresses and optional ports.
33
Page 50

Configuration Examples for Alarm Management and Logging Correlation
Implementing and Monitoring Alarms and Alarm Log Correlation
PurposeCommand or Action
Step 3
commit
Configuration Examples for Alarm Management and Logging
Correlation
This section provides these configuration examples:
Increasing the Severity Level for Alarm Filtering to Display Fewer Events and Modifying the Alarm Buffer Size and Capacity Threshold: Example
This configuration example shows how to set the capacity threshold to 90 percent, to reduce the size of the
logging events buffer to 10,000 bytes from the default, and to increase the severity level to errors:
!
logging events threshold 90
logging events buffer-size 10000
logging events level errors
!
Increasing the severity level to errors reduces the number of alarms that are displayed in the logging events
buffer, because only alarms with a severity of errors or higher are displayed. Increasing the threshold capacity
to 90 percent reduces the time interval between the threshold crossing and wraparound events; the logging
events buffer thus does not generate a threshold-crossing alarm until it reaches 90 percent capacity. Reducing
the size of the logging events buffer to 10,000 bytes decreases the number of alarms that are displayed in the
logging events buffer and reduces the memory requirements for the component.
Configuring a Nonstateful Correlation Rule to Permanently Suppress Node Status Messages: Example
This example shows how to configure a nonstateful correlation rule to permanently suppress node status
messages:
logging correlator rule node_status type nonstateful
timeout 4000
rootcause PLATFORM INVMGR NODE_STATE_CHANGE
nonrootcause
alarm PLATFORM SYSLDR LC_ENABLED
alarm PLATFORM ALPHA_DISPLAY CHANGE
!
!
logging correlator apply rule node_status
all-of-router
!
In this example, three similar messages are identified as forwarded to the syslog process simultaneously after
a card boots:
Cisco ASR 9000 Series Aggregation Services Router System Monitoring Configuration Guide, Release 4.2.x
34
Page 51

Implementing and Monitoring Alarms and Alarm Log Correlation
Configuring a Nonstateful Correlation Rule to Permanently Suppress Node Status Messages: Example
PLATFORM-INVMGR-6-NODE_STATE_CHANGE : Node: 0/1/CPU0, state: IOS XR RUN
PLATFORM-SYSLDR-5-LC_ENABLED : LC in slot 1 is now running IOX
PLATFORM-ALPHA_DISPLAY-6-CHANGE : Alpha display on node 0/1/CPU0 changed to IOX RUN in
state default
These messages are similar. To see only one message appear in the logs, one of the messages is designated
as the root cause message (the one that appears in the logs), and the other messages are considered
non-root-cause messages.
The root-cause message is typically the one that arrives earliest, but that is not a requirement.
logging correlator rule node_status type nonstateful
timeout 4000
rootcause PLATFORM INVMGR NODE_STATE_CHANGE
nonrootcause
alarm PLATFORM SYSLDR LC_ENABLED
alarm PLATFORM ALPHA_DISPLAY CHANGE
!
!
In this example, the correlation rule named node_status is configured to correlate the PLATFORM INVMGR
NODE_STATE_CHANGE alarm (the root-cause message) with the PLATFORM SYSLDR LC_ENABLED
and PLATFORM ALPHA_DISPLAY CHANGE alarms. The updown correlation rule is applied to the entire
router.
logging correlator apply rule node_status
all-of-router
!
After a card boots and sends these messages:
PLATFORM-INVMGR-6-NODE_STATE_CHANGE : Node: 0/1/CPU0, state: IOS XR RUN
PLATFORM-SYSLDR-5-LC_ENABLED : LC in slot 1 is now running IOX
PLATFORM-ALPHA_DISPLAY-6-CHANGE : Alpha display on node 0/1/CPU0 changed to IOX RUN in
state default
the correlator forwards the PLATFORM-INVMGR-6-NODE_STATE_CHANGE message to the syslog
process, while the remaining two messages are held in the logging correlator buffer.
In this example, the show sample output from the show logging events buffer all-in-buffer command displays
the alarms stored in the logging events buffer after the 4-second time period expires for the node_status
correlation rule:
RP/0/RSP0/CPU0:router# show logging events buffer all-in-buffer
#ID :C_id:Source :Time :%CATEGORY-GROUP-SEVERITY-MESSAGECODE: Text
#76 :12 :RP/0/0/CPU0:Aug 2 22:32:43 : invmgr[194]:
%PLATFORM-INVMGR-6-NODE_STATE_CHANGE : Node: 0/1/CPU0, state: IOS XR RUN
The show logging correlator buffer correlation ID command generates the following output after the one
minute interval expires. The output displays the alarms assigned correlation ID 12 in the logging correlator
buffer.
RP/0/RSP0/CPU0:router# show logging correlator buffer correlationID 46
#C_id.id:Rule Name:Source :Time : Text
#12.1 :nodestatus:RP/0/0/CPU0:Aug 2 22:32:43 : invmgr[194]:
%PLATFORM-INVMGR-6-NODE_STATE_CHANGE : Node: 0/1/CPU0, state: IOS XR RUN
#12.2 :nodestatus:RP/0/0/CPU0:Aug 2 22:32:43 : sysldr[336]: %PLATFORM-SYSLDR-5-LC_ENABLED
: LC in slot 1 is now running IOX
Cisco ASR 9000 Series Aggregation Services Router System Monitoring Configuration Guide, Release 4.2.x
35
Page 52

Implementing and Monitoring Alarms and Alarm Log Correlation
Configuring a Stateful Correlation Rule for LINK UPDOWN and SONET ALARM Alarms: Example
#12.3 :nodestatus:RP/0/0/CPU0:Aug 2 22:32:44 : alphadisplay[102]:
%PLATFORM-ALPHA_DISPLAY-6-CHANGE : Alpha display on node 0/1/CPU0 changed to IOX RUN in
state default
Because this rule was defined as nonstateful, these messages are held in the buffer
indefinitely.
Configuring a Stateful Correlation Rule for LINK UPDOWN and SONET ALARM
Alarms: Example
This example shows how to configure a correlation rule for the LINK UPDOWN and SONET ALARM
messages:
!
logging correlator rule updown type stateful
timeout 10000
rootcause PKT_INFRA LINK UPDOWN
nonrootcause
alarm L2 SONET ALARM
!
!
logging correlator apply rule updown
all-of-router
!
In this example, suppose that two routers are connected. When the correlator receives a root-cause message,
the correlator sends it directly to the syslog process. Subsequent PKT_INFRA-LINK- UPDOWN or
L2-SONET-ALARM messages matching the rule are considered leaf messages and are stored in the logging
correlator buffer. If, for any reason, a leaf message (such as the L2-SONET-ALARM alarm in this example)
is received first, the correlator does not send it to the logging events buffer immediately; the correlator, instead,
waits until the timeout interval expires. After the timeout, if the root message is never received, all messages
in the logging correlator buffer received during the timeout interval are forwarded to the syslog process.
In this example, the correlation rule named updown is configured to correlate the
PKT_INFRA-LINK-UPDOWN alarm (the root message) and L2-SONET-ALARM alarms (leaf messages
associated with PKT_INFRA-LINK-UPDOWN alarms).
logging correlator rule updown type stateful
timeout 10000
rootcause PKT_INFRA LINK UPDOWN
nonrootcause
alarm L2 SONET ALARM
In this example, the updown correlation rule is applied to the entire router:
logging correlator apply rule updown
all-of-router
This example shows sample output from the show logging events buffer all-in-buffer command. The output
displays the alarms stored in the logging events buffer after the one minute time period expires for the updown
correlation rule configured:
RP/0/RSP0/CPU0:router# show logging events buffer all-in-buffer
#ID :C_id:Source :Time :%CATEGORY-GROUP-SEVERITY-MESSAGECODE: Text
#144 :46 :LC/0/7/CPU0:Jan 30 16:35:39 2004:ifmgr[130]: %PKT_INFRA-LINK-3-UPDOWN :
Interface POS0/7/0/0, changed state to Down
Only the first LINK UPDOWN root message is forwarded to the syslog process during the timeout interval.Note
Cisco ASR 9000 Series Aggregation Services Router System Monitoring Configuration Guide, Release 4.2.x
36
Page 53

Implementing and Monitoring Alarms and Alarm Log Correlation
The following example shows output from the show logging correlator buffer correlationID command
generated after the one-minute interval expires. The output displays the alarms assigned correlation ID 46 in
the logging correlator buffer. In the example, the PKT_INFRA-LINK-UPDOWN root-cause message and
L2-SONET-ALARM leaf messages generated during the timeout interval assigned correlation ID 46 are
displayed:
RP/0/RSP0/CPU0:router# show logging correlator buffer correlationID 46
#C_id.id:Rule Name:Source :Time : Text
#46.1 :updown :LC/0/7/CPU0:Jan 30 16:35:39 2004:ifmgr[130]: %PKT_INFRA-LINK-3-UPDOWN :
Interface POS0/7/0/0, changed state to Down
#46.2 :updown :LC/0/7/CPU0:Jan 30 16:35:41 2004:DI_Partner[50]: %L2-SONET-4-ALARM :
SONET0_7_0_0: SLOS
Additional References
Note
The subsequent PKT_INFRA-LINK-UPDOWN and L2-SONET-ALARM leaf messages generated during
the timeout interval remain in the logging correlator buffer because they are leaf messages.
This example shows output from the show logging correlator buffer correlationID command. The output
displays the alarms assigned to correlation IDs 46 and 47, the correlation IDs associated with the
PKT_INFRA-LINK-UPDOWN and L2-SONET-ALARM root-cause messages:
RP/0/RSP0/CPU0:router# show logging correlator buffer correlationID 46
NO records matching query found
Additional References
The following sections provide references related to implementing and monitoring alarm logs and logging
correlation on the Cisco ASR 9000 Series Router.
Related Documents
Alarm and logging correlation commands
Document TitleRelated Topic
Alarm Management and Logging Correlation
Commands module in the Cisco ASR 9000 Series
Aggregation Services Router System Monitoring
Command Reference
Logging services commands
Onboard Failure Logging (OBFL) configuration tasks
Cisco ASR 9000 Series Aggregation Services Router System Monitoring Configuration Guide, Release 4.2.x
Logging Services Commands module in the
Cisco ASR 9000 Series Aggregation Services Router
System Monitoring Command Reference
Implementing Logging Services module in the
Cisco ASR 9000 Series Aggregation Services Router
System Monitoring Command Reference
37
Page 54

Additional References
Implementing and Monitoring Alarms and Alarm Log Correlation
Document TitleRelated Topic
Onboard Failure Logging (OBFL) commands
Cisco IOS XR software XML API material
Cisco IOS XR software getting started material
Information about user groups and task IDs
Standards
No new or modified standards are supported by this
feature, and support for existing standards has not
been modified by this feature.
MIBs
Onboard Failure Logging Commands module in the
Cisco ASR 9000 Series Aggregation Services Router
System Monitoring Command Reference
Cisco IOS XR XML API Guide
Cisco ASR 9000 Series Aggregation Services Router
Getting Started Guide
Configuring AAA Services module in the
Cisco ASR 9000 Series Aggregation Services Router
System Security Configuration Guide
TitleStandards
—
—
RFCs
No new or modified RFCs are supported by this
feature, and support for existing RFCs has not been
modified by this feature.
MIBs LinkMIBs
To locate and download MIBs using Cisco IOS XR
software, use the Cisco MIB Locator found at the
following URL and choose a platform under the Cisco
Access Products menu: http://cisco.com/public/
sw-center/netmgmt/cmtk/mibs.shtml
TitleRFCs
—
Cisco ASR 9000 Series Aggregation Services Router System Monitoring Configuration Guide, Release 4.2.x
38
Page 55

Implementing and Monitoring Alarms and Alarm Log Correlation
Technical Assistance
Additional References
LinkDescription
The Cisco Technical Support website contains
thousands of pages of searchable technical content,
including links to products, technologies, solutions,
technical tips, and tools. Registered Cisco.com users
can log in from this page to access even more content.
http://www.cisco.com/cisco/web/support/index.html
Cisco ASR 9000 Series Aggregation Services Router System Monitoring Configuration Guide, Release 4.2.x
39
Page 56

Additional References
Implementing and Monitoring Alarms and Alarm Log Correlation
Cisco ASR 9000 Series Aggregation Services Router System Monitoring Configuration Guide, Release 4.2.x
40
Page 57

CHAPTER 2
Configuring and Managing Embedded Event Manager Policies
The Cisco IOS XR Software Embedded Event Manager (EEM) functions as the central clearing house for
the events detected by any portion of the Cisco IOS XR Software processor failover services. The EEM is
responsible for detection of fault events, fault recovery, and process reliability statistics in a Cisco IOS XR
Software system. The EEM events are notifications that something significant has occurred within the system,
such as:
Operating or performance statistics outside the allowable values (for example, free memory dropping
•
below a critical threshold).
Online insertion or removal (OIR).
•
Termination of a process.
•
The EEM relies on software agents or event detectors to notify it when certain system events occur. When
the EEM has detected an event, it can initiate corrective actions. Actions are prescribed in routines called
policies. Policies must be registered before an action can be applied to collected events. No action occurs
unless a policy is registered. A registered policy informs the EEM about a particular event that is to be
detected and the corrective action to be taken if that event is detected. When such an event is detected, the
EEM enables the corresponding policy. You can disable a registered policy at any time.
The EEM monitors the reliability rates achieved by each process in the system, allowing the system to detect
the components that compromise the overall reliability or availability.
This module describes the new and revised tasks you need to configure and manage EEM policies on your
the Cisco ASR 9000 Series Router and write and customize the EEM policies using Tool Command Language
(Tcl) scripts to handle Cisco IOS XR Software faults and events.
Note
For complete descriptions of the event management commands listed in this module, see the Related
Documents, on page 92 section of this module.
Cisco ASR 9000 Series Aggregation Services Router System Monitoring Configuration Guide, Release 4.2.x
41
Page 58

Prerequisites for Configuring and Managing Embedded Event Manager Policies
Feature History for Configuring and Managing Embedded Event Manager Policies
ModificationRelease
This feature was introduced.Release 4.0.0
Prerequisites for Configuring and Managing Embedded Event Manager Policies, page 42
•
Information About Configuring and Managing Embedded Event Manager Policies, page 42
•
How to Configure and Manage Embedded Event Manager Policies, page 55
•
Configuration Examples for Event Management Policies , page 80
•
Configuration Examples for Writing Embedded Event Manager Policies Using Tcl , page 82
•
Additional References, page 92
•
Embedded Event Manager Policy Tcl Command Extension Reference, page 93
•
Configuring and Managing Embedded Event Manager Policies
Prerequisites for Configuring and Managing Embedded Event
Manager Policies
You must be in a user group associated with a task group that includes the proper task IDs. The command
reference guides include the task IDs required for each command. If you suspect user group assignment is
preventing you from using a command, contact your AAA administrator for assistance.
Information About Configuring and Managing Embedded Event Manager Policies
Event Management
Embedded Event Management (EEM) in the Cisco IOS XR Software system essentially involves system
event management. An event can be any significant occurrence (not limited to errors) that has happened within
the system. The Cisco IOS XR Software EEM detects those events and implements appropriate responses.
The EEM can also be used to prevent or contain faults and to assist in fault recovery.
The EEM enables a system administrator to specify appropriate action based on the current state of the system.
For example, a system administrator can use EEM to request notification by e-mail when a hardware device
needs replacement.
The EEM also maintains reliability metrics for each process in the system.
System Event Detection
The EEM interacts with routines, “event detectors,” that actively monitor the system for events. The EEM
relies on an event detector that it has provided to syslog to detect that a certain system event has occurred. It
Cisco ASR 9000 Series Aggregation Services Router System Monitoring Configuration Guide, Release 4.2.x
42
Page 59

Configuring and Managing Embedded Event Manager Policies
uses a pattern match with the syslog messages. It also relies on a timer event detector to detect that a certain
time and date has occurred.
Policy-Based Event Response
When the EEM has detected an event, it can initiate actions in response. These actions are contained in routines
called policy handlers. While the data for event detection is collected, no action occurs unless a policy for
responding to that event has been registered. At registration, a policy informs the EEM that it is looking for
a particular event. When the EEM detects the event, it enables the policy.
Reliability Metrics
The EEM monitors the reliability rates achieved by each process in the system. These metrics can be used
during testing to determine which components do not meet their reliability or availability goals so that corrective
action can be taken.
System Event Processing
Embedded Event Manager Management Policies
When the EEM receives an event notification, it takes these actions:
Checks for established policy handlers:
•
If a policy handler exists, the EEM initiates callback routines (EEM handlers) or runs Tool
◦
Command Language (Tcl) scripts (EEM scripts) that implement policies. The policies can include
built-in EEM actions.
If a policy handler does not exist, the EEM does nothing.
◦
Notifies the processes that have subscribed for event notification.
•
Note
Records reliability metric data for each process in the system.
•
Provides access to EEM-maintained system information through an application program interface (API).
•
A difference exists between scripts with policy actions and scripts that subscribe to
receive events. Scripts with policy actions are expected to implement a policy. They are
bound by a rule to prevent recursion. Scripts that subscribe to notifications are not bound
by such a rule.
Embedded Event Manager Management Policies
When the EEM has detected an event, it can initiate corrective actions. Actions are prescribed in routines
called policies. Policies are defined by Tcl scripts (EEM scripts) written by the user through a Tcl API. (See
the Embedded Event Manager Scripts and the Scripting Interface (Tcl), on page 44.) Policies must be
registered before any action can be applied to collected events. No action occurs unless a policy is registered.
A registered policy informs the EEM about a particular event to detect and the corrective action to take if that
event is detected. When such an event is detected, the EEM runs the policy. You can disable a registered
policy at any time.
Cisco ASR 9000 Series Aggregation Services Router System Monitoring Configuration Guide, Release 4.2.x
43
Page 60

Configuring and Managing Embedded Event Manager Policies
Embedded Event Manager Scripts and the Scripting Interface (Tcl)
Embedded Event Manager Scripts and the Scripting Interface (Tcl)
EEM scripts are used to implement policies when an EEM event is published. EEM scripts and policies are
identified to the EEM using the event manager policy configuration command. An EEM script remains
available to be scheduled by the EEM until the no event manager policy command is entered.
The EEM uses these two types of EEM scripts:
Regular EEM scripts identified to the EEM through the eem script CLI command. Regular EEM scripts
•
are standalone scripts that incorporate the definition of the event they will handle.
EEM callback scripts identified to the EEM when a process or EEM script registers to handle an event.
•
EEM callback scripts are essentially named functions that are identified to the EEM through the C
Language API.
This example shows the usage for the CLI in scripts:
sjc-cde-010:/tftpboot/cnwei/fm> cat test_cli_eem.tcl
::cisco::eem::event_register_syslog occurs 1 pattern $_syslog_pattern maxrun 90
namespace import ::cisco::eem::*
namespace import ::cisco::lib::*
set errorInfo ""
# 1. query the information of latest triggered fm event
array set arr_einfo [event_reqinfo]
if {$_cerrno != 0} {
set result [format "component=%s; subsys err=%s; posix err=%s;\n%s" \
$_cerr_sub_num $_cerr_sub_err $_cerr_posix_err $_cerr_str]
error $result
}
set msg $arr_einfo(msg)
set config_cmds ""
# 2. execute the user-defined config commands
if [catch {cli_open} result] {
error $result $errorInfo
} else {
array set cli1 $result
}
if [catch {cli_exec $cli1(fd) "config"} result] {
error $result $errorInfo
}
if {[info exists _config_cmd1]} {
if [catch {cli_exec $cli1(fd) $_config_cmd1} result] {
error $result $errorInfo
}
append config_cmds $_config_cmd1
}
if {[info exists _config_cmd2]} {
if [catch {cli_exec $cli1(fd) $_config_cmd2} result] {
error $result $errorInfo
}
append config_cmds "\n"
append config_cmds $_config_cmd2
}
if [catch {cli_exec $cli1(fd) "end"} result] {
error $result $errorInfo
Cisco ASR 9000 Series Aggregation Services Router System Monitoring Configuration Guide, Release 4.2.x
44
Page 61

Configuring and Managing Embedded Event Manager Policies
}
if [catch {cli_close $cli1(fd) $cli1(tty_id)} result] {
error $result $errorInfo
}
action_syslog priority info msg "Ran config command $_config_cmd1 $_config_cmd2
Script Language
The scripting language is Tool Command Language (Tcl) as implemented within the Cisco IOS XR Software.
All Embedded Event Manager scripts are written in Tcl. This full Tcl implementation has been extended by
Cisco, and an eem command has been added to provide the interface between Tcl scripts and the EEM.
Tcl is a string-based command language that is interpreted at run time. The version of Tcl supported is Tcl
version 8.3.4, plus added script support. Scripts are defined using an ASCII editor on another device, not on
the networking device. The script is then copied to the networking device and registered with EEM. Tcl scripts
are supported by EEM. As an enforced rule, Embedded Event Manager policies are short-lived, run-time
routines that must be interpreted and executed in less than 20 seconds of elapsed time. If more than 20 seconds
of elapsed time are required, the maxrun parameter may be specified in the event_register statement to specify
any desired value.
EEM policies use the full range of the Tcl language's capabilities. However, Cisco provides enhancements to
the Tcl language in the form of Tcl command extensions that facilitate the writing of EEM policies. The main
categories of Tcl command extensions identify the detected event, the subsequent action, utility information,
counter values, and system information.
EEM allows you to write and implement your own policies using Tcl. Writing an EEM script involves:
Embedded Event Manager Scripts and the Scripting Interface (Tcl)
Selecting the event Tcl command extension that establishes the criteria used to determine when the
•
policy is run.
Defining the event detector options associated with detecting the event.
•
Choosing the actions to implement recovery or respond to the detected event.
•
Regular Embedded Event Manager Scripts
Regular EEM scripts are used to implement policies when an EEM event is published. EEM scripts are
identified to the EEM using the event manager policy configuration command. An EEM script remains
available to be scheduled by the EEM until the no event manager policy command is entered.
The first executable line of code within an EEM script must be the eem event register keyword. This keyword
identifies the EEM event for which that script should be scheduled. The keyword is used by the event manager
policy configuration command to register to handle the specified EEM event.
EEM scripts may use any of the EEM script services listed in Embedded Event Manager Policy Tcl Command
Extension Categories, on page 46.
When an EEM script exits, it is responsible for setting a return code that is used to tell the EEM whether to
run the default action for this EEM event (if any) or no other action. If multiple event handlers are scheduled
for a given event, the return code from the previous handler is passed into the next handler, which can leave
the value as is or update it.
An EEM script cannot register to handle an event other than the event that caused it to be scheduled.Note
Cisco ASR 9000 Series Aggregation Services Router System Monitoring Configuration Guide, Release 4.2.x
45
Page 62

Embedded Event Manager Scripts and the Scripting Interface (Tcl)
Embedded Event Manager Callback Scripts
EEM callback scripts are entered as a result of an EEM event being raised for a previously registered EEM
event that specifies the name of this script in the eem_handler_spec.
When an EEM callback script exits, it is responsible for setting a return code that is used to tell the EEM
whether or not to run the default action for this EEM event (if any). If multiple event handlers are scheduled
for a given event, the return code from the previous handler is passed into the next handler, which can leave
the value as is or update it.
Configuring and Managing Embedded Event Manager Policies
Note
EEM callback scripts are free to use any of the EEM script services listed in Table 3: Embedded Event
Manager Tcl Command Extension Categories, on page 46, except for the eem event register keyword,
which is not allowed in an EEM callback script.
Embedded Event Manager Policy Tcl Command Extension Categories
This table lists the different categories of EEM policy Tcl command extensions.
Note
The Tcl command extensions available in each of these categories for use in all EEM policies are described
in later sections in this document.
Table 3: Embedded Event Manager Tcl Command Extension Categories
DefinitionCategory
EEM event Tcl command extensions(three types:
event information, event registration, and event
publish)
These Tcl command extensions are represented by
the event_register_xxx family of event-specific
commands. There is a separate event information Tcl
command extension in this category as well:
event_reqinfo. This is the command used in policies
to query the EEM for information about an event.
There is also an EEM event publish Tcl command
extension event_publish that publishes an
application-specific event.
EEM action Tcl command extensions
These Tcl command extensions (for example,
action_syslog) are used by policies to respond to or
recover from an event or fault. In addition to these
extensions, developers can use the Tcl language to
implement any action desired.
EEM utility Tcl command extensions
These Tcl command extensions are used to retrieve,
save, set, or modify application information, counters,
or timers.
Cisco ASR 9000 Series Aggregation Services Router System Monitoring Configuration Guide, Release 4.2.x
46
Page 63

Configuring and Managing Embedded Event Manager Policies
Embedded Event Manager Scripts and the Scripting Interface (Tcl)
DefinitionCategory
EEM system information Tcl command extensions
These Tcl command extensions are represented by
the sys_reqinfo_xxx family of system-specific
information commands. These commands are used
by a policy to gather system information.
EEM context Tcl command extensions
These Tcl command extensions are used to store and
retrieve a Tcl context (the visible variables and their
values).
Cisco File Naming Convention for Embedded Event Manager
All EEM policy names, policy support files (for example, e-mail template files), and library filenames are
consistent with the Cisco file-naming convention. In this regard, EEM policy filenames adhere to the following
specifications:
• An optional prefix—Mandatory.—indicating, if present, that this is a system policy that should be
registered automatically at boot time if it is not already registered; for example, Mandatory.sl_text.tcl.
A filename body part containing a two-character abbreviation (see table below) for the first event
•
specified; an underscore part; and a descriptive field part that further identifies the policy.
A filename suffix part defined as .tcl.
•
EEM e-mail template files consist of a filename prefix of email_template, followed by an abbreviation that
identifies the usage of the e-mail template.
EEM library filenames consist of a filename body part containing the descriptive field that identifies the usage
of the library, followed by _lib, and a filename suffix part defined as .tcl.
Table 4: Two-Character Abbreviation Specification
SpecificationTwo-Character Abbreviation
event_register_applap
event_register_counterct
event_register_statst
event_register_noneno
event_register_oiroi
event_register_processpr
event_register_rfrf
event_register_syslogsl
Cisco ASR 9000 Series Aggregation Services Router System Monitoring Configuration Guide, Release 4.2.x
47
Page 64

Embedded Event Manager Built-in Actions
Embedded Event Manager Built-in Actions
EEM built-in actions can be requested from EEM handlers when the handlers run.
This table describes each EEM handler request or action.
Table 5: Embedded Event Manager Built-In Actions
Configuring and Managing Embedded Event Manager Policies
SpecificationTwo-Character Abbreviation
event_register_timertm
event_register_timer_subscriberts
event_register_wdsysmonwd
DescriptionEmbedded Event Manager Built-In Action
Log a message to syslog
Execute a CLI command
Generate a syslog message
Manually run an EEM policy
Publish an application-specific event
Reload the Cisco IOS software
Request system information
Sends a message to the syslog. Arguments to this
action are priority and the message to be logged.
Writes the command to the specified channel handler
to execute the command by using the cli_exec
command extension.
Logs a message by using the action_syslog Tcl
command extension.
Runs an EEM policy within a policy while the event
manager run command is running a policy in EXEC
mode.
Publishes an application-specific event by using the
event_publish appl Tcl command extension.
Causes a router to be reloaded by using the EEM
action_reload command.
Represents the sys_reqinfo_xxx family of
system-specific information commands by a policy
to gather system information.
Send a short e-mail
Sends the e-mail out using Simple Mail Transfer
Protocol (SMTP).
Modifies a counter value.Set or modify a counter
Cisco ASR 9000 Series Aggregation Services Router System Monitoring Configuration Guide, Release 4.2.x
48
Page 65

Configuring and Managing Embedded Event Manager Policies
Application-specific Embedded Event Management
EEM handlers require the ability to run CLI commands. A command is available to the Tcl shell to allow
execution of CLI commands from within Tcl scripts.
Application-specific Embedded Event Management
Any Cisco IOS XR Software application can define and publish application-defined events. Application-defined
events are identified by a name that includes both the component name and event name, to allow application
developers to assign their own event identifiers. Application-defined events can be raised by a Cisco IOS XR
Software component even when there are no subscribers. In this case, the EEM dismisses the event, which
allows subscribers to receive application-defined events as needed.
An EEM script that subscribes to receive system events is processed in the following order:
1
This CLI configuration command is entered: event manager policy scriptfilename username username.
2
The EEM scans the EEM script looking for an eem event event_type keyword and subscribes the EEM
script to be scheduled for the specified event.
3
The Event Detector detects an event and contacts the EEM.
4
The EEM schedules event processing, causing the EEM script to be run.
5
The EEM script routine returns.
Event Detection and Recovery
Events are detected by routines called event detectors. Event detectors are separate programs that provide an
interface between other Cisco IOS XR Software components and the EEM. They process information that
can be used to publish events, if necessary.
These event detectors are supported:
An EEM event is defined as a notification that something significant has happened within the system. Two
categories of events exist:
System EEM events
•
Application-defined events
•
System EEM events are built into the EEM and are grouped based on the fault detector that raises them. They
are identified by a symbolic identifier defined within the API.
Some EEM system events are monitored by the EEM whether or not an application has requested monitoring.
These are called built-in EEM events. Other EEM events are monitored only if an application has requested
EEM event monitoring. EEM event monitoring is requested through an EEM application API or the EEM
scripting interface.
Some event detectors can be distributed to other hardware cards within the same secure domain router (SDR)
or within the administration plane to provide support for distributed components running on those cards.
General Flow of EEM Event Detection and Recovery
EEM is a flexible, policy-driven framework that supports in-box monitoring of different components of the
system with the help of software agents known as event detectors. The relationship is between the EEM server,
Cisco ASR 9000 Series Aggregation Services Router System Monitoring Configuration Guide, Release 4.2.x
49
Page 66

Event Detection and Recovery
the core event publishers (event detectors), and the event subscribers (policies). Event publishers screen events
and publish them when there is a match on an event specification that is provided by the event subscriber.
Event detectors notify the EEM server when an event of interest occurs.
When an event or fault is detected, Embedded Event Manager determines from the event publishers—an
example would be the OIR events publisher —if a registration for the encountered fault or event has occurred.
EEM matches the event registration information with the event data itself. A policy registers for the detected
event with the Tcl command extension event_register_xxx. The event information Tcl command extension
event_reqinfo is used in the policy to query the Embedded Event Manager for information about the detected
event.
System Manager Event Detector
The System Manager Event Detector has four roles:
Records process reliability metric data.
•
Screens for processes that have EEM event monitoring requests outstanding.
•
Publishes events for those processes that match the screening criteria.
•
Configuring and Managing Embedded Event Manager Policies
Asks the System Manager to perform its default action for those events that do not match the screening
•
criteria.
The System Manager Event Detector interfaces with the System Manager to receive process startup and
termination notifications. The interfacing is made through a private API available to the System Manager. To
minimize overhead, a portion of the API resides within the System Manager process space. When a process
terminates, the System Manager invokes a helper process (if specified in the process.startup file) before calling
the Event Detector API.
Processes can be identified by component ID, System Manager assigned job ID, or load module pathname
plus process instance ID. POSIX wildcard filename pattern support using *, ?, or [...] is provided for load
module pathnames. Process instance ID is an integer assigned to a process to differentiate it from other
processes with the same pathname. The first instance of a process is assigned an instance ID value of 1, the
second 2, and so on.
The System Manager Event Detector handles EEM event monitoring requests for the EEM events shown in
this table.
Table 6: System Manager Event Detector Event Monitoring Requests
DescriptionEmbedded Event Manager Event
Normal process termination EEM event—built in
Occurs when a process matching the screening criteria
terminates.
Abnormal process termination EEM event—built in
Occurs when a process matching the screening criteria
terminates abnormally.
Process startup EEM event—built in
Occurs when a process matching the screening criteria
starts.
Cisco ASR 9000 Series Aggregation Services Router System Monitoring Configuration Guide, Release 4.2.x
50
Page 67

Configuring and Managing Embedded Event Manager Policies
When System Manager Event Detector abnormal process termination events occur, the default action restarts
the process according to the built-in rules of the System Manager.
The relationship between the EEM and System Manager is strictly through the private API provided by the
EEM to the System Manager for the purpose of receiving process start and termination notifications. When
the System Manager calls the API, reliability metric data is collected and screening is performed for an EEM
event match. If a match occurs, a message is sent to the System Manager Event Detector. In the case of
abnormal process terminations, a return is made indicating that the EEM handles process restart. If a match
does not occur, a return is made indicating that the System Manager should apply the default action.
Timer Services Event Detector
The Timer Services Event Detector implements time-related EEM events. These events are identified through
user-defined identifiers so that multiple processes can await notification for the same EEM event.
The Timer Services Event Detector handles EEM event monitoring requests for the Date/Time Passed EEM
event. This event occurs when the current date or time passes the specified date or time requested by an
application.
Event Detection and Recovery
Syslog Event Detector
The syslog Event Detector implements syslog message screening for syslog EEM events. This routine interfaces
with the syslog daemon through a private API. To minimize overhead, a portion of the API resides within the
syslog daemon process.
Screening is provided for the message severity code or the message text fields. POSIX regular expression
pattern support is provided for the message text field.
The Syslog Event Detector handles EEM event monitoring requests for the events are shown in this table.
Table 7: Syslog Event Detector Event Monitoring Requests
Syslog message EEM event
Process event manager EEM event—built in
DescriptionEmbedded Event Manager Event
Occurs for a just-logged message. It occurs when
there is a match for either the syslog message severity
code or the syslog message text pattern. Both can be
specified when an application requests a syslog
message EEM event.
Occurs when the event-processed count for a specified
process is either greater than or equal to a specified
maximum or is less than or equal to a specified
minimum.
None Event Detector
The None Event Detector publishes an event when the Cisco IOS XR Software event manager run CLI
command executes an EEM policy. EEM schedules and runs policies on the basis of an event specification
that is contained within the policy itself. An EEM policy must be identified and registered to be permitted to
run manually before the event manager run command will execute.
Cisco ASR 9000 Series Aggregation Services Router System Monitoring Configuration Guide, Release 4.2.x
51
Page 68

Event Detection and Recovery
Event manager none detector provides user the ability to run a tcl script using the CLI. The script is registered
first before running. Cisco IOS XR Software version provides similar syntax with Cisco IOS EEM (refer to
the applicable EEM Documentation for details), so scripts written using Cisco IOS EEM is run on Cisco IOS XR
Software with minimum change.
Watchdog System Monitor Event Detector
Watchdog System Monitor (IOSXRWDSysMon) Event Detector for Cisco IOS XR Software
The Cisco IOS XR Software Watchdog System Monitor Event Detector publishes an event when one of the
following occurs:
CPU utilization for a Cisco IOS XR Software process crosses a threshold.
•
Memory utilization for a Cisco IOS XR Software process crosses a threshold.
•
Configuring and Managing Embedded Event Manager Policies
Note
Cisco IOS XR Software processes are used to distinguish them from Cisco IOS XR Software Modularity
processes.
Two events may be monitored at the same time, and the event publishing criteria can be specified to require
one event or both events to cross their specified thresholds.
The Cisco IOS XR Software Watchdog System Monitor Event Detector handles the events as shown in this
table.
Table 8: Watchdog System Monitor Event Detector Requests
DescriptionEmbedded Event Manager Event
Process percent CPU EEM event—built in
Occurs when the CPU time for a specified process is
either greater than or equal to a specified maximum
percentage of available CPU time or is less than or
equal to a specified minimum percentage of available
CPU time.
Total percent CPU EEM event—built in
Occurs when the CPU time for a specified processor
complex is either greater than or equal to a specified
maximum percentage of available CPU time or is less
than or equal to a specified minimum percentage of
available CPU time.
Process percent memory EEM event—built in
Occurs when the memory used for a specified process
has either increased or decreased by a specified value.
Total percent available Memory EEM event—built
in
Occurs when the available memory for a specified
processor complex has either increased or decreased
by a specified value.
Cisco ASR 9000 Series Aggregation Services Router System Monitoring Configuration Guide, Release 4.2.x
52
Page 69

Configuring and Managing Embedded Event Manager Policies
Embedded Event Manager Event Scheduling and Notification
DescriptionEmbedded Event Manager Event
Total percent used memory EEM event—built in
Watchdog System Monitor (WDSysMon) Event Detector for Cisco IOS XR Software Modularity
The Cisco IOS XR Software Software Modularity Watchdog System Monitor Event Detector detects infinite
loops, deadlocks, and memory leaks in Cisco IOS XR Software Modularity processes.
Distributed Event Detectors
Cisco IOS XR Software components that interface to EEM event detectors and that have substantially
independent implementations running on a distributed hardware card should have a distributed EEM event
detector. The distributed event detector permits scheduling of EEM events for local processes without requiring
that the local hardware card to the EEM communication channel be active.
These event detectors run on a Cisco IOS XR Software line card:
System Manager Fault Detector
•
Wdsysmon Fault Detector
•
Counter Event Detector
•
OIR Event Detector
•
Occurs when the used memory for a specified
processor complex has either increased or decreased
by a specified value.
Statistic Event Detector
•
Embedded Event Manager Event Scheduling and Notification
When an EEM handler is scheduled, it runs under the context of the process that creates the event request (or
for EEM scripts under the Tcl shell process context). For events that occur for a process running an EEM
handler, event scheduling is blocked until the handler exits. The defined default action (if any) is performed
instead.
The EEM Server maintains queues containing event scheduling and notification items across client process
restarts, if requested.
Reliability Statistics
Reliability metric data for the entire processor complex is maintained by the EEM. The data is periodically
written to checkpoint.
Hardware Card Reliability Metric Data
Reliability metric data is kept for each hardware card in a processor complex. Data is recorded in a table
indexed by disk ID.
Cisco ASR 9000 Series Aggregation Services Router System Monitoring Configuration Guide, Release 4.2.x
53
Page 70

Reliability Statistics
Data maintained by the hardware card is as follows:
Most recent start time
•
Most recent normal end time (controlled switchover)
•
Most recent abnormal end time (asynchronous switchover)
•
Most recent abnormal type
•
Cumulative available time
•
Cumulative unavailable time
•
Number of times hardware card started
•
Number of times hardware card shut down normally
•
Number of times hardware card shut down abnormally
•
Process Reliability Metric Data
Configuring and Managing Embedded Event Manager Policies
Reliability metric data is kept for each process handled by the System Manager. This data includes standby
processes running on either the primary or backup hardware card. Data is recorded in a table indexed by
hardware card disk ID plus process pathname plus process instance for those processes that have multiple
instances.
Process terminations include the following cases:
• Normal termination—Process exits with an exit value equal to 0.
• Abnormal termination by process—Process exits with an exit value not equal to 0.
• Abnormal termination by QNX—Neutrino operating system aborts the process.
• Abnormal termination by kill process API—API kill process terminates the process.
Data to be maintained by process is as follows:
Most recent process start time
•
Most recent normal process end time
•
Most recent abnormal process end time
•
Most recent abnormal process end type
•
Previous ten process end times and types
•
Cumulative process available time
•
Cumulative process unavailable time
•
Cumulative process run time (the time when the process is actually running on the CPU)
•
Number of times started
•
Number of times ended normally
•
Number of times ended abnormally
•
Number of abnormal failures within the past 60 minutes
•
Cisco ASR 9000 Series Aggregation Services Router System Monitoring Configuration Guide, Release 4.2.x
54
Page 71

Configuring and Managing Embedded Event Manager Policies
How to Configure and Manage Embedded Event Manager Policies
Number of abnormal failures within the past 24 hours
•
Number of abnormal failures within the past 30 days
•
How to Configure and Manage Embedded Event Manager
Policies
Configuring Environmental Variables
EEM environmental variables are Tcl global variables that are defined external to the policy before the policy
is run. The EEM policy engine receives notifications when faults and other events occur. EEM policies
implement recovery, based on the current state of the system and actions specified in the policy for a given
event. Recovery actions are triggered when the policy is run.
Environment Variables
SUMMARY STEPS
DETAILED STEPS
By convention, the names of all environment variables defined by Cisco begin with an underscore character
to set them apart; for example, _show_cmd.
Spaces may be used in the var-value argument of the event manager environment command. The command
interprets everything after the var-name argument to the end of the line to be part of the var-value argument.
Use the show event manager environment command to display the name and value of all EEM environment
variables after they have been set using the event manager environment command.
show event manager environment
1.
configure
2.
event manager environment var-name var-value
3.
Repeat Step 3 for every environment value to be reset.
4.
commit
5.
show event manager environment
6.
PurposeCommand or Action
Step 1
Step 2
show event manager environment
Example:
RP/0/RSP0/CPU0:router# show event manager
environment
configure
Cisco ASR 9000 Series Aggregation Services Router System Monitoring Configuration Guide, Release 4.2.x
Displays the names and values of all EEM environment
variables.
55
Page 72

Registering Embedded Event Manager Policies
Configuring and Managing Embedded Event Manager Policies
PurposeCommand or Action
Step 3
Step 4
Step 5
Step 6
event manager environment var-name var-value
Example:
RP/0/RSP0/CPU0:router(config)# event manager
environment _cron_entry 0-59/2 0-23/1 * * 0-7
Repeat Step 3 for every environment value to be reset.
commit
show event manager environment
Example:
RP/0/RSP0/CPU0:router# show event manager
environment
Resets environment variables to new values.
The var-name argument is the name assigned to the EEM
•
environment configuration variable.
The var-value argument is the series of characters,
•
including embedded spaces, to be placed in the
environment variable var-name.
By convention, the names of all environment variables
•
defined by Cisco begin with an underscore character to
set them apart; for example, _show_cmd.
Spaces may be used in the var-value argument. The
•
command interprets everything after the var-name
argument to the end of the line to be part of the var-value
argument.
—
Displays the reset names and values of all EEM environment
variables; allows you to verify the environment variable names
and values set in Step 3.
What to Do Next
After setting up EEM environment variables, find out what policies are available to be registered and then
register those policies, as described in the Registering Embedded Event Manager Policies, on page 56.
Registering Embedded Event Manager Policies
Register an EEM policy to run a policy when an event is triggered.
Embedded Event Manager Policies
Registering an EEM policy is performed with the event manager policy command in global configuration
mode. An EEM script is available to be scheduled by the EEM until the no form of this command is entered.
Prior to registering a policy, display EEM policies that are available to be registered with the show event
manager policy available command.
The EEM schedules and runs policies on the basis of an event specification that is contained within the policy
itself. When the event manager policy command is invoked, the EEM examines the policy and registers it
to be run when the specified event occurs.
Cisco ASR 9000 Series Aggregation Services Router System Monitoring Configuration Guide, Release 4.2.x
56
Page 73

Configuring and Managing Embedded Event Manager Policies
Username
To register an EEM policy, you must specify the username that is used to run the script. This name can be
different from the user who is currently logged in, but the registering user must have permissions that are a
superset of the username that will run the script. Otherwise, the script is not registered and the command is
rejected. In addition, the username that will run the script must have access privileges to the commands run
by the EEM policy being registered.
Registering Embedded Event Manager Policies
Note
AAA authorization (such as the aaa authorization eventmanager command) must be configured before
EEM policies can be registered. See the Configuring AAA Services module of Configuring AAA Services
on Cisco IOS XR Software for more information about AAA authorization configuration.
Persist-time
An optional persist-time keyword for the username can also be defined. The persist-time keyword defines
the number of seconds the username authentication is valid. When a script is first registered, the configured
username for the script is authenticated. After the script is registered, the username is authenticated again each
time a script is run. If the AAA server is down, the username authentication can be read from memory. The
persist-time keyword determines the number of seconds this username authentication is held in memory.
If the AAA server is down and the persist-time keyword has not expired, then the username is
•
authenticated from memory and the script runs.
If the AAA server is down, and the persist-time keyword has expired, then user authentication will fail
•
and the script will not run.
The following values can be used for the persist-time keyword.
The default persist-time is 3600 seconds (1 hour). Enter the event manager policy command without
•
the persist-time keyword to set the persist-time to 1 hour.
Enter 0 to stop the username authentication from being cached. If the AAA server is down, the username
•
will not authenticate and the script will not run.
Enter infinite to stop the username from being marked as invalid. The username authentication held in
•
the cache will not expire. If the AAA server is down, the username will be authenticated from the cache.
System or user keywords
If you enter the event manager policy command without specifying either the system or user keyword, the
EEM first tries to locate the specified policy file in the system policy directory. If the EEM finds the file in
the system policy directory, it registers the policy as a system policy. If the EEM does not find the specified
policy file in the system policy directory, it looks in the user policy directory. If the EEM locates the specified
file in the user policy directory, it registers the policy file as a user policy. If the EEM finds policy files with
the same name in both the system policy directory and the user policy directory, the policy file in the system
policy directory takes precedence and is registered as a system policy.
Once policies have been registered, their registration can be verified through the show event manager policy
registered command. The output displays registered policy information in two parts. The first line in each
policy description lists the index number assigned to the policy, the policy type (system or user), the type of
event registered, the time when the policy was registered, and the name of the policy file. The remaining lines
of each policy description display information about the registered event and how the event is to be handled,
and come directly from the Tcl command arguments that make up the policy file.
Cisco ASR 9000 Series Aggregation Services Router System Monitoring Configuration Guide, Release 4.2.x
57
Page 74

Registering Embedded Event Manager Policies
SUMMARY STEPS
show event manager policy available [ system | user ]
1.
configure
2.
event manager policy policy-name username username [ persist-time { seconds | infinite }] | type {
3.
system | user }
Repeat Step 3 for every EEM policy to be registered.
4.
commit
5.
show event manager policy registered
6.
DETAILED STEPS
Configuring and Managing Embedded Event Manager Policies
PurposeCommand or Action
Step 1
Step 2
Step 3
system | user ]
Example:
RP/0/RSP0/CPU0:router# show event
manager policy available
configure
event manager policy policy-name
username username [ persist-time { seconds
| infinite }] | type { system | user }
Example:
RP/0/RSP0/CPU0:router(config)# event
manager policy cron.tcl username tom
type user
Displays all EEM policies that are available to be registered.show event manager policy available [
Entering the optional system keyword displays all available system
•
policies.
Entering the optional user keyword displays all available user
•
policies.
Registers an EEM policy with the EEM.
An EEM script is available to be scheduled by the EEM until the no
•
form of this command is entered.
Enter the required username keyword and argument, where username
•
is the username that runs the script.
Enter the optional persist-time keyword to determine how long the
•
username authentication is held in memory:
Enter the number of seconds for the persist-time keyword.
◦
Enter the infinite keyword to make the authentication
◦
permanent (the authentication will not expire).
Entering the optional type system keywords registers a system policy
•
defined by Cisco.
Entering the optional type user keywords registers a user-defined
•
policy.
Note
AAA authorization (such as aaa authorization eventmanager)
must be configured before EEM policies can be registered. See
the Configuring AAA Services module of Cisco ASR 9000 Series
Aggregation Services Router System Security Configuration Guide
for more information about AAA authorization configuration.
Cisco ASR 9000 Series Aggregation Services Router System Monitoring Configuration Guide, Release 4.2.x
58
Page 75

Configuring and Managing Embedded Event Manager Policies
How to Write Embedded Event Manager Policies Using Tcl
PurposeCommand or Action
Step 4
Repeat Step 3 for every EEM policy to be
—
registered.
Step 5
Step 6
commit
show event manager policy registered
Displays all EEM policies that are already registered, allowing verification
of Step 3.
Example:
RP/0/RSP0/CPU0:router# show event
manager policy registered
How to Write Embedded Event Manager Policies Using Tcl
This section provides information on how to write and customize Embedded Event Manager (EEM) policies
using Tool Command Language (Tcl) scripts to handle Cisco IOS XR Software faults and events.
This section contains these tasks:
Registering and Defining an EEM Tcl Script
Perform this task to configure environment variables and register an EEM policy. EEM schedules and runs
policies on the basis of an event specification that is contained within the policy itself. When an EEM policy
is registered, the software examines the policy and registers it to be run when the specified event occurs.
SUMMARY STEPS
Before You Begin
A policy must be available that is written in the Tcl scripting language. Sample policies are provided in the
Sample EEM Policies, on page 64. Sample policies are stored in the system policy directory.
show event manager environment [ all | environment-name]
1.
configure
2.
event manager environment var-name [ var-value ]
3.
Repeat Step 3, on page 60 to configure all the environment variables required by the policy to be registered
4.
in Step 5, on page 60.
event manager policy policy-name username username [ persist-time [ seconds | infinite ] | type [
5.
system | user ]]
commit
6.
Cisco ASR 9000 Series Aggregation Services Router System Monitoring Configuration Guide, Release 4.2.x
59
Page 76

How to Write Embedded Event Manager Policies Using Tcl
DETAILED STEPS
Configuring and Managing Embedded Event Manager Policies
PurposeCommand or Action
Step 1
Step 2
Step 3
show event manager environment [ all |
environment-name]
Example:
RP/0/RSP0/CPU0:router# show event manager
environment all
configure
event manager environment var-name [ var-value ]
Example:
RP/0/RSP0/CPU0:router(config)# event manager
environment _cron_entry 0-59/2 0-23/1 * * 0-7
(Optional) Displays the name and value of EEM environment
variables.
The all keyword displays all the EEM environment
•
variables.
The environment-name argument displays information about
•
the specified environment variable.
Resets environment variables to new values.
The var-name argument is the name assigned to the EEM
•
environment configuration variable.
The var-value argument is the series of characters, including
•
embedded spaces, to be placed in the environment variable
var-name .
By convention, the names of all environment variables
•
defined by Cisco begin with an underscore character to set
them apart; for example, _show_cmd.
Spaces may be used in the var-value argument. The
•
command interprets everything after the var-name argument
to the end of the line to be part of the var-value argument.
Step 4
Step 5
Step 6
Repeat Step 3, on page 60 to configure all the
environment variables required by the policy to be
registered in Step 5, on page 60.
event manager policy policy-name username
username [ persist-time [ seconds | infinite ] | type [
system | user ]]
Example:
RP/0/RSP0/CPU0:router(config)# event manager
policy tm_cli_cmd.tcl username user_a type
system
commit
—
Registers the EEM policy to be run when the specified event
defined within the policy occurs.
Use the system keyword to register a system policy defined
•
by Cisco.
Use the user keyword to register a user-defined system
•
policy.
Use the persist-time keyword to specify the length of time
•
the username authentication is valid.
In this example, the sample EEM policy named tm_cli_cmd.tcl is
registered as a system policy.
Cisco ASR 9000 Series Aggregation Services Router System Monitoring Configuration Guide, Release 4.2.x
60
Page 77

Configuring and Managing Embedded Event Manager Policies
Displaying EEM Registered Policies
Perform this optional task to display EEM registered policies.
SUMMARY STEPS
show event manager policy registered [ event-type type ] [ system | user ] [ time-ordered | name-ordered
1.
]
DETAILED STEPS
How to Write Embedded Event Manager Policies Using Tcl
PurposeCommand or Action
Step 1
type ] [ system | user ] [ time-ordered |
name-ordered ]
Example:
RP/0/RSP0/CPU0:router# show event manager
policy registered system
Unregistering EEM Policies
Perform this task to remove an EEM policy from the running configuration file. Execution of the policy is
canceled.
SUMMARY STEPS
show event manager policy registered [ event-type type ] [ system | user ] [ time-ordered | name-ordered
1.
]
configure
2.
no event manager policy policy-name
3.
commit
4.
Repeat Step 1, on page 61to ensure that the policy has been removed.
5.
Displays information about currently registered policies.show event manager policy registered [ event-type
The event-type keyword displays the registered policies for a
•
specific event type.
The time-ordered keyword displays information about currently
•
registered policies sorted by time.
The name-ordered keyword displays the policies in alphabetical
•
order by the policy name.
DETAILED STEPS
Step 1
type ] [ system | user ] [ time-ordered | name-ordered
]
Cisco ASR 9000 Series Aggregation Services Router System Monitoring Configuration Guide, Release 4.2.x
PurposeCommand or Action
Displays information about currently registered policies.show event manager policy registered [ event-type
The event-type keyword displays the registered
•
policies for a specific event type.
61
Page 78

How to Write Embedded Event Manager Policies Using Tcl
Example:
RP/0/RSP0/CPU0:router# show event manager policy
registered system
Configuring and Managing Embedded Event Manager Policies
PurposeCommand or Action
The time-ordered keyword displays information
•
about currently registered policies sorted by time.
The name-ordered keyword displays the policies in
•
alphabetical order by the policy name.
Step 2
Step 3
Step 4
Step 5
configure
no event manager policy policy-name
Example:
RP/0/RSP0/CPU0:router(config)# no event manager
policy tm_cli_cmd.tcl
commit
Repeat Step 1, on page 61to ensure that the policy has
been removed.
Suspending EEM Policy Execution
Perform this task to immediately suspend the execution of all EEM policies. Suspending policies, instead of
unregistering them, might be necessary for reasons of temporary performance or security.
SUMMARY STEPS
show event manager policy registered [event-type type] [system | user] [time-ordered | name-ordered
1.
]
configure
2.
event manager scheduler suspend
3.
commit
4.
Removes the EEM policy from the configuration, causing
the policy to be unregistered.
—
DETAILED STEPS
Step 1
Cisco ASR 9000 Series Aggregation Services Router System Monitoring Configuration Guide, Release 4.2.x
62
type] [system | user] [time-ordered | name-ordered
]
Example:
RP/0/RSP0/CPU0:router# show event manager
policy registered system
PurposeCommand or Action
Displays information about currently registered policies.show event manager policy registered [event-type
The event-type keyword displays the registered policies
•
for a specific event type.
The time-ordered keyword displays information about
•
currently registered policies sorted by time.
The name-ordered keyword displays the policies in
•
alphabetical order by the policy name.
Page 79

Configuring and Managing Embedded Event Manager Policies
How to Write Embedded Event Manager Policies Using Tcl
PurposeCommand or Action
Step 2
configure
Step 3
Example:
RP/0/RSP0/CPU0:router(config)# event manager
scheduler suspend
Step 4
commit
Managing EEM Policies
Perform this task to specify a directory to use for storing user library files or user-defined EEM policies.
This task applies only to EEM policies that are written using Tcl scripts.Note
SUMMARY STEPS
1.
2.
3.
4.
Immediately suspends the execution of all EEM policies.event manager scheduler suspend
show event manager directory user [library | policy]
configure
event manager directory user {library path | policy path}
commit
DETAILED STEPS
Step 1
Step 2
Step 3
show event manager directory user [library |
policy]
Example:
RP/0/RSP0/CPU0:router# show event manager
directory user library
configure
event manager directory user {library path | policy
path}
PurposeCommand or Action
Displays the directory to use for storing EEM user library or
policy files.
The optional library keyword displays the directory to
•
use for user library files.
The optional policy keyword displays the directory to use
•
for user-defined EEM policies.
Specifies a directory to use for storing user library files or
user-defined EEM policies.
Cisco ASR 9000 Series Aggregation Services Router System Monitoring Configuration Guide, Release 4.2.x
63
Page 80

Configuring and Managing Embedded Event Manager Policies
How to Write Embedded Event Manager Policies Using Tcl
PurposeCommand or Action
Use the path argument to specify the absolute pathname
•
to the user directory.
Step 4
Example:
RP/0/RSP0/CPU0:router(config)# event manager
directory user library disk0:/usr/lib/tcl
commit
Displaying Software Modularity Process Reliability Metrics Using EEM
Perform this optional task to display reliability metrics for Cisco IOS XR Software processes.
SUMMARY STEPS
DETAILED STEPS
Step 1
show event manager metric process {all | job-id |
process-name} location {all | node-id}
Example:
RP/0/RSP0/CPU0:router# show event manager
environment
Sample EEM Policies
show event manager metric process {all | job-id | process-name} location {all | node-id}
1.
PurposeCommand or Action
Displays the reliability metric data for processes. The system
keeps a record of when processes start and end, and this data
is used as the basis for reliability analysis.
Cisco IOS XR Software contains some sample policies in the images that contain the EEM. Developers of
EEM policies may modify these policies by customizing the event for which the policy is to be run and the
options associated with logging and responding to the event. In addition, developers may select the actions
to be implemented when the policy runs.
The Cisco IOS XR Software includes a set of sample policies (see Sample EEM Policy Descriptions table).
The sample policies can be copied to a user directory and then modified. Tcl is currently the only scripting
language supported by Cisco for policy creation. Tcl policies can be modified using a text editor such as
Emacs. Policies must execute within a defined number of seconds of elapsed time, and the time variable can
be configured within a policy. The default is 20 seconds.
Sample EEM policies can be seen on the router using the CLI
Show event manager policy available system
This table describes the sample EEM policies.
Cisco ASR 9000 Series Aggregation Services Router System Monitoring Configuration Guide, Release 4.2.x
64
Page 81

Configuring and Managing Embedded Event Manager Policies
Table 9: Sample EEM Policy Descriptions
How to Write Embedded Event Manager Policies Using Tcl
DescriptionName of Policy
periodic_diag_cmds.tcl
periodic_proc_avail.tcl
periodic_sh_log.tcl
sl_sysdb_timeout.tcl
tm_cli_cmd.tcl
This policy is triggered when the _cron_entry_diag
cron entry expires.Then, the output of this fixed set
is collect for the fixed set of commands and the output
is sent by email.
This policy is triggered when the
_cron_entry_procavail cron entry expires. Then the
output of this fixed set is collect for the fixed set of
commands and the output is sent by email.
This policy is triggered when the _cron_entry_log
cron entry expires, and collects the output for the
show log command and a few other commands. If the
environment variable _log_past_hours is configured,
it collects the log messages that are generated in the
last _log_past_hours hours. Otherwise, it collects the
full log.
This policy is triggered when the script looks for the
sysdb timeout ios_msgs and obtains the output of the
show commands. The output is written to a file named
after the blocking process.
This policy runs using a configurable CRON entry.
It executes a configurable CLI command and e-mails
the results.
SUMMARY STEPS
tm_crash_hist.tcl
This policy runs at midnight each day and e-mails a
process crash history report to a specified e-mail
address.
For more details about the sample policies available and how to run them, see the EEM Event Detector Demo:
Example , on page 82.
show event manager policy available [system | user]
1.
configure
2.
event manager directory user {library path | policy path}
3.
event manager policy policy-name username username [persist-time [seconds | infinite] | type [system
4.
| user]]
commit
5.
Cisco ASR 9000 Series Aggregation Services Router System Monitoring Configuration Guide, Release 4.2.x
65
Page 82

How to Write Embedded Event Manager Policies Using Tcl
DETAILED STEPS
Configuring and Managing Embedded Event Manager Policies
PurposeCommand or Action
Step 1
Step 2
Step 3
Step 4
Step 5
show event manager policy available [system | user]
Example:
RP/0/RSP0/CPU0:router# show event manager policy
available
configure
event manager directory user {library path | policy path}
Example:
RP/0/RSP0/CPU0:router(config)# event manager directory
user library disk0:/user_library
event manager policy policy-name username username
[persist-time [seconds | infinite] | type [system | user]]
Example:
RP/0/RSP0/CPU0:router(config)# event manager policy
test.tcl username user_a type user
commit
Displays EEM policies that are available to be
registered.
Specifies a directory to use for storing user
library files or user-defined EEM policies.
Registers the EEM policy to be run when the
specified event defined within the policy occurs.
Programming EEM Policies with Tcl
Perform this task to help you program a policy using Tcl command extensions. We recommend that you copy
an existing policy and modify it. There are two required parts that must exist in an EEM Tcl policy: the
event_register Tcl command extension and the body. All other sections shown in the Tcl Policy Structure and
Requirements, on page 66 are optional.
Tcl Policy Structure and Requirements
All EEM policies share the same structure, shown in Figure 2: Tcl Policy Structure and Requirements , on
page 67. There are two parts of an EEM policy that are required: the event_register Tcl command extension
Cisco ASR 9000 Series Aggregation Services Router System Monitoring Configuration Guide, Release 4.2.x
66
Page 83

Configuring and Managing Embedded Event Manager Policies
and the body. The remaining parts of the policy are optional: environmental must defines, namespace import,
entry status, and exit status.
Figure 2: Tcl Policy Structure and Requirements
How to Write Embedded Event Manager Policies Using Tcl
The start of every policy must describe and register the event to detect using an event_register Tcl command
extension. This part of the policy schedules the running of the policy. For a list of the available EEM
event_register Tcl command extensions, see the Embedded Event Manager Event Registration Tcl Command
Extensions, on page 94. The following example Tcl code shows how to register the event_register_timer
Tcl command extension:
::cisco::eem::event_register_timer cron name crontimer2 cron_entry $_cron_entry maxrun 240
The following example Tcl code shows how to check for, and define, some environment variables:
# Check if all the env variables that we need exist.
# If any of them does not exist, print out an error msg and quit.
if {![info exists _email_server]} {
set result \
"Policy cannot be run: variable _email_server has not been set"
error $result $errorInfo
}
if {![info exists _email_from]} {
set result \
"Policy cannot be run: variable _email_from has not been set"
error $result $errorInfo
}
if {![info exists _email_to]} {
set result \
"Policy cannot be run: variable _email_to has not been set"
error $result $errorInfo
)
The namespace import section is optional and defines code libraries. The following example Tcl code shows
how to configure a namespace import section:
namespace import ::cisco::eem::*
namespace import ::cisco::lib::*
The body of the policy is a required structure and might contain the following:
The event_reqinfo event information Tcl command extension that is used to query the EEM for
•
information about the detected event. For a list of the available EEM event information Tcl command
extensions, see the Embedded Event Manager Event Information Tcl Command Extension, on page
129.
Cisco ASR 9000 Series Aggregation Services Router System Monitoring Configuration Guide, Release 4.2.x
67
Page 84

How to Write Embedded Event Manager Policies Using Tcl
The action Tcl command extensions, such as action_syslog, that are used to specify actions specific to
•
EEM. For a list of the available EEM action Tcl command extensions, see the Embedded Event Manager
Action Tcl Command Extensions, on page 150.
The system information Tcl command extensions, such as sys_reqinfo_routername, that are used to
•
obtain general system information. For a list of the available EEM system information Tcl command
extensions, see the Embedded Event Manager System Information Tcl Command Extensions, on page
167.
Use of the SMTP library (to send e-mail notifications) or the CLI library (to run CLI commands) from
•
a policy. For a list of the available SMTP library Tcl command extensions, see the SMTP Library
Command Extensions, on page 178. For a list of the available CLI library Tcl command extensions, see
the CLI Library Command Extensions, on page 181.
The context_save and con text_retrieve Tcl command extensions that are used to save Tcl variables
•
for use by other policies.
The following example Tcl code shows the code to query an event and to log a message as part of the body
section:
Configuring and Managing Embedded Event Manager Policies
EEM Entry Status
# Query the event info and log a message.
array set arr_einfo [event_reqinfo]
if {$_cerrno != 0} {
set result [format "component=%s; subsys err=%s; posix err=%s;\n%s" \
$_cerr_sub_num $_cerr_sub_err $_cerr_posix_err $_cerr_str]
error $result
}
global timer_type timer_time_sec
set timer_type $arr_einfo(timer_type)
set timer_time_sec $arr_einfo(timer_time_sec)
# Log a message.
set msg [format "timer event: timer type %s, time expired %s" \
$timer_type [clock format $timer_time_sec]]
action_syslog priority info msg $msg
if {$_cerrno != 0} {
set result [format "component=%s; subsys err=%s; posix err=%s;\n%s" \
$_cerr_sub_num $_cerr_sub_err $_cerr_posix_err $_cerr_str]
error $result
}
The entry status part of an EEM policy is used to determine if a prior policy has been run for the same event,
and to determine the exit status of the prior policy. If the _entry_status variable is defined, a prior policy has
already run for this event. The value of the _entry_status variable determines the return code of the prior
policy.
Entry status designations may use one of three possible values:
0 (previous policy was successful)
•
EEM Exit Status
Cisco ASR 9000 Series Aggregation Services Router System Monitoring Configuration Guide, Release 4.2.x
68
Not=0 (previous policy failed),
•
Undefined (no previous policy was executed).
•
When a policy finishes running its code, an exit value is set. The exit value is used by the EEM to determine
whether or not to apply the default action for this event, if any. A value of zero means that the default action
Page 85

Configuring and Managing Embedded Event Manager Policies
should not be performed. A value of nonzero means that the default action should be performed. The exit
status is passed to subsequent policies that are run for the same event.
EEM Policies and Cisco Error Number
Some EEM Tcl command extensions set a Cisco Error Number Tcl global variable _cerrno. Whenever _cerrno
is set, the other Tcl global variables are derived from _cerrno and are set along with it (_cerr_sub_num,
_cerr_sub_err, _cerr_posix_err, and _cerr_str).
For example, the action_syslog command in the following example sets these global variables as a side effect
of the command execution:
action_syslog priority warning msg "A sample message generated by action_syslog"
if {$_cerrno != 0} {
set result [format "component=%s; subsys err=%s; posix err=%s;\n%s" \
$_cerr_sub_num $_cerr_sub_err $_cerr_posix_err $_cerr_str]
error $result
}
_cerrno: 32-Bit Error Return Values
How to Write Embedded Event Manager Policies Using Tcl
The _cerrno set by a command can be represented as a 32-bit integer of the following form:
XYSSSSSSSSSSSSSEEEEEEEEPPPPPPPPP
For example, the following error return value might be returned from an EEM Tcl command extension:
862439AE
This number is interpreted as the following 32-bit value:
10000110001001000011100110101110
This 32-bit integer is divided up into the five variables shown in this table.
Table 10: _cerrno: 32-Bit Error Return Value Variables
DescriptionVariable
XY
The error class (indicates the severity of the error).
This variable corresponds to the first two bits in the
32-bit error return value; 10 in the preceding case,
which indicates CERR_CLASS_WARNING:
See Table 11: Error Class Encodings, on page 70
for the four possible error class encodings specific to
this variable.
SSSSSSSSSSSSSS
Cisco ASR 9000 Series Aggregation Services Router System Monitoring Configuration Guide, Release 4.2.x
The subsystem number that generated the most recent
error(13 bits = 8192 values). This is the next 13 bits
of the 32-bit sequence, and its integer value is
contained in $_cerr_sub_num.
69
Page 86

How to Write Embedded Event Manager Policies Using Tcl
Configuring and Managing Embedded Event Manager Policies
DescriptionVariable
EEEEEEEE
PPPPPPPP
Error Class Encodings for XY
The first variable, XY, references the possible error class encodings shown in this table.
Table 11: Error Class Encodings
The subsystem specific error number (8 bits = 256
values). This segment is the next 8 bits of the 32-bit
sequence, and the string corresponding to this error
number is contained in $_cerr_sub_err.
The pass-through POSIX error code (9 bits = 512
values). This represents the last of the 32-bit
sequence, and the string corresponding to this error
code is contained in $_cerr_posix_err.
Error ClassError Return Value
CERR_CLASS_SUCCESS00
CERR_CLASS_INFO01
CERR_CLASS_WARNING10
An error return value of zero means SUCCESS.
CERR_CLASS_FATAL11
Cisco ASR 9000 Series Aggregation Services Router System Monitoring Configuration Guide, Release 4.2.x
70
Page 87

Configuring and Managing Embedded Event Manager Policies
SUMMARY STEPS
show event manager policy available [system | user]
1.
Cut and paste the contents of the sample policy displayed on the screen to a text editor.
2.
Define the required event_register Tcl command extension.
3.
Add the appropriate namespace under the ::cisco hierarchy.
4.
Program the must defines section to check for each environment variable that is used in this policy.
5.
Program the body of the script.
6.
Check the entry status to determine if a policy has previously run for this event.
7.
Check the exit status to determine whether or not to apply the default action for this event, if a default
8.
action exists.
Set Cisco Error Number (_cerrno) Tcl global variables.
9.
Save the Tcl script with a new filename, and copy the Tcl script to the router.
10.
configure
11.
event manager directory user {library path | policy path}
12.
event manager policy policy-name username username [persist-time [seconds | infinite] | type [system
13.
| user]]
commit
14.
Cause the policy to execute, and observe the policy.
15.
Use debugging techniques if the policy does not execute correctly.
16.
How to Write Embedded Event Manager Policies Using Tcl
DETAILED STEPS
Step 1
[system | user]
Example:
RP/0/RSP0/CPU0:router# show event
manager policy available
Step 2
Cut and paste the contents of the sample
policy displayed on the screen to a text
editor.
Step 3
Define the required event_register Tcl
command extension.
PurposeCommand or Action
Displays EEM policies that are available to be registered.show event manager policy available
—
Choose the appropriate event_register Tcl command extension for the event that
you want to detect, and add it to the policy. The following are valid Event
Registration Tcl Command Extensions:
event_register_appl
•
event_register_counter
•
event_register_stat
•
event_register_wdsysmon
•
event_register_oir
•
Cisco ASR 9000 Series Aggregation Services Router System Monitoring Configuration Guide, Release 4.2.x
71
Page 88

How to Write Embedded Event Manager Policies Using Tcl
PurposeCommand or Action
Configuring and Managing Embedded Event Manager Policies
event_register_process
•
event_register_syslog
•
event_register_timer
•
event_register_timer_subscriber
•
event_register_hardware
•
event_register_none
•
Step 4
Add the appropriate namespace under
the ::cisco hierarchy.
Policy developers can use the new namespace ::cisco in Tcl policies to group all
the extensions used by Cisco IOS XR EEM. There are two namespaces under
the ::cisco hierarchy. The following are the namespaces and the EEM Tcl
command extension categories that belongs under each namespace:
::cisco::eem
•
EEM event registration
◦
EEM event information
◦
EEM event publish
◦
EEM action
◦
EEM utility
◦
EEM context library
◦
EEM system information
◦
CLI library
◦
::cisco::lib
•
SMTP library
◦
Note
Ensure that the appropriate namespaces are imported, or use the
qualified command names when using the preceding commands.
Step 5
72
Program the must defines section to
check for each environment variable
that is used in this policy.
This is an optional step. Must defines is a section of the policy that tests whether
any EEM environment variables that are required by the policy are defined before
the recovery actions are taken. The must defines section is not required if the
policy does not use any EEM environment variables. EEM environment variables
for EEM scripts are Tcl global variables that are defined external to the policy
before the policy is run. To define an EEM environment variable, use the EEM
configuration command event manager environment . By convention, all Cisco
EEM environment variables begin with "_" (an underscore). To avoid future
conflict, customers are urged not to define new variables that start with "_".
Note
You can display the Embedded Event Manager environment variables
set on your system by using the show event manager environment
command in EXEC mode.
Cisco ASR 9000 Series Aggregation Services Router System Monitoring Configuration Guide, Release 4.2.x
Page 89

Configuring and Managing Embedded Event Manager Policies
How to Write Embedded Event Manager Policies Using Tcl
PurposeCommand or Action
For example, EEM environment variables defined by the sample policies include
e-mail variables. The sample policies that send e-mail must have the following
variables set in order to function properly. The following are the e-mail-specific
environment variables used in the sample EEM policies.
• _email_server—A Simple Mail Transfer Protocol (SMTP) mail server
used to send e-mail (for example, mailserver.example.com)
• _email_to—The address to which e-mail is sent (for example,
engineering@example.com)
• _email_from—The address from which e-mail is sent (for example,
devtest@example.com)
• _email_cc—The address to which the e-mail must be copied (for example,
manager@example.com)
Step 6
Step 7
Step 8
Check the entry status to determine if
a policy has previously run for this
event.
Check the exit status to determine
whether or not to apply the default
action for this event, if a default action
exists.
In this section of the script, you can define any of the following:Program the body of the script.
The event_reqinfo event information Tcl command extension that is used
•
to query the EEM for information about the detected event.
The action Tcl command extensions, such as action_syslog, that are used
•
to specify actions specific to EEM.
The system information Tcl command extensions, such as
•
sys_reqinfo_routername, that are used to obtain general system
information.
The context_save and context_retrieve Tcl command extensions that are
•
used to save Tcl variables for use by other policies.
Use of the SMTP library (to send e-mail notifications) or the CLI library
•
(to run CLI commands) from a policy.
If the prior policy is successful, the current policy may or may not require
execution. Entry status designations may use one of three possible values: 0
(previous policy was successful), Not=0 (previous policy failed), and Undefined
(no previous policy was executed).
A value of zero means that the default action should not be performed. A value
of nonzero means that the default action should be performed. The exit status is
passed to subsequent policies that are run for the same event.
Step 9
Step 10
Set Cisco Error Number (_cerrno) Tcl
global variables.
and copy the Tcl script to the router.
Cisco ASR 9000 Series Aggregation Services Router System Monitoring Configuration Guide, Release 4.2.x
Some EEM Tcl command extensions set a Cisco Error Number Tcl global variable
_cerrno. Whenever _cerrno is set, four other Tcl global variables are derived
from _cerrno and are set along with it (_cerr_sub_num, _cerr_sub_err,
_cerr_posix_err, and _cerr_str).
Embedded Event Manager policy filenames adhere to the following specification:Save the Tcl script with a new filename,
73
Page 90

How to Write Embedded Event Manager Policies Using Tcl
PurposeCommand or Action
For more details, see theCisco File Naming Convention for Embedded Event
Manager, on page 47.
Copy the file to the flash file system on the router—typically disk0:.
Configuring and Managing Embedded Event Manager Policies
• An optional prefix—Mandatory.—indicating, if present, that this is a system
policy that should be registered automatically at boot time if it is not already
registered. For example: Mandatory.sl_text.tcl.
A filename body part containing a two-character abbreviation (see Table
•
4: Two-Character Abbreviation Specification, on page 47) for the first
event specified, an underscore character part, and a descriptive field part
further identifying the policy.
A filename suffix part defined as .tcl.
•
Step 11
Step 12
Step 13
Step 14
Step 15
Step 16
configure
event manager directory user
{library path | policy path}
Example:
RP/0/RSP0/CPU0:router(config)#
event manager directory user
library disk0:/user_library
event manager policy policy-name
username username [persist-time
[seconds | infinite] | type [system |
user]]
Example:
RP/0/RSP0/CPU0:router(config)#
event manager policy test.tcl
username user_a type user
commit
Cause the policy to execute, and
observe the policy.
Use debugging techniques if the policy
does not execute correctly.
Specifies a directory to use for storing user library files or user-defined EEM
policies.
Registers the EEM policy to be run when the specified event defined within the
policy occurs.
—
—
Creating an EEM User Tcl Library Index
Perform this task to create an index file that contains a directory of all the procedures contained in a library
of Tcl files. This task allows you to test library support in EEM Tcl. In this task, a library directory is created
to contain the Tcl library files, the files are copied into the directory, and an index tclIndex) is created that
Cisco ASR 9000 Series Aggregation Services Router System Monitoring Configuration Guide, Release 4.2.x
74
Page 91

Configuring and Managing Embedded Event Manager Policies
contains a directory of all the procedures in the library files. If the index is not created, the Tcl procedures are
not found when an EEM policy that references a Tcl procedure is run.
SUMMARY STEPS
On your workstation (UNIX, Linux, PC, or Mac) create a library directory and copy the Tcl library files
1.
into the directory.
tclsh
2.
auto_mkindex directory_name *.tcl
3.
Copy the Tcl library files from Step 1, on page 75and the tclIndex file from Step 3, on page 76to the
4.
directory used for storing user library files on the target router.
Copy a user-defined EEM policy file written in Tcl to the directory used for storing user-defined EEM
5.
policies on the target router.
configure
6.
event manager directory user library path
7.
event manager directory user policy path
8.
event manager policy policy-name username username [persist-time [seconds | infinite] | type [system
9.
| user]]
event manager run policy [argument]
10.
commit
11.
How to Write Embedded Event Manager Policies Using Tcl
DETAILED STEPS
Step 1
On your workstation (UNIX, Linux, PC, or Mac)
create a library directory and copy the Tcl library
files into the directory.
Step 2
Example:
workstation% tclsh
PurposeCommand or Action
The following example files can be used to create a tclIndex on a
workstation running the Tcl shell:
lib1.tcl
proc test1 {} {
puts "In procedure test1"
}
proc test2 {} {
puts "In procedure test2"
}
lib2.tcl
proc test3 {} {
puts "In procedure test3"
}
Enters the Tcl shell.tclsh
Cisco ASR 9000 Series Aggregation Services Router System Monitoring Configuration Guide, Release 4.2.x
75
Page 92

How to Write Embedded Event Manager Policies Using Tcl
Configuring and Managing Embedded Event Manager Policies
PurposeCommand or Action
Step 3
auto_mkindex directory_name *.tcl
Example:
workstation% auto_mkindex eem_library
*.tcl
Use the auto_mkindex command to create the tclIndex file. The
tclIndex file contains a directory of all the procedures contained in
the Tcl library files. We recommend that you run auto_mkindex
inside a directory, because there can be only a single tclIndex file in
any directory and you may have other Tcl files to be grouped together.
Running auto_mkindex in a directory determines which Tcl source
file or files are indexed using a specific tclIndex.
The following sample TclIndex is created when the lib1.tcl and lib2.tcl
files are in a library file directory and the auto_mkindex command
is run:
tclIndex
# Tcl autoload index file, version 2.0
# This file is generated by the "auto_mkindex" command
# and sourced to set up indexing information for one or
# more commands. Typically each line is a command that
# sets an element in the auto_index array, where the
# element name is the name of a command and the value is
# a script that loads the command.
set auto_index(test1) [list source [file join $dir
lib1.tcl]]
set auto_index(test2) [list source [file join $dir
lib1.tcl]]
set auto_index(test3) [list source [file join $dir
lib2.tcl]]
Step 4
Step 5
Copy the Tcl library files from Step 1, on page
75and the tclIndex file from Step 3, on page 76to
the directory used for storing user library files on
the target router.
Tcl to the directory used for storing user-defined
EEM policies on the target router.
—
The directory can be the same directory used in Step 4, on page 76.Copy a user-defined EEM policy file written in
The following example user-defined EEM policy can be used to test
the Tcl library support in EEM:
libtest.tcl
::cisco::eem::event_register_none
namespace import ::cisco::eem::*
namespace import ::cisco::lib::*
global auto_index auto_path
puts [array names auto_index]
if { [catch {test1} result]} {
puts "calling test1 failed result = $result $auto_path"
}
if { [catch {test2} result]} {
puts "calling test2 failed result = $result $auto_path"
}
if { [catch {test3} result]} {
Cisco ASR 9000 Series Aggregation Services Router System Monitoring Configuration Guide, Release 4.2.x
76
Page 93

Configuring and Managing Embedded Event Manager Policies
How to Write Embedded Event Manager Policies Using Tcl
PurposeCommand or Action
puts "calling test3 failed result = $result $auto_path"
}
Step 6
Step 7
Step 8
Step 9
Step 10
configure
event manager directory user library path
Example:
RP/0/RSP0/CPU0:router(config)# event
manager directory user library
disk2:/eem_library
event manager directory user policy path
Example:
RP/0/RSP0/CPU0:router(config)# event
manager directory user policy
disk2:/eem_policies
event manager policy policy-name username
username [persist-time [seconds | infinite] | type
[system | user]]
Example:
RP/0/RSP0/CPU0:router(config)# event
manager policy libtest.tcl username user_a
event manager run policy [argument]
Specifies the EEM user library directory; this is the directory to which
the files in Step 4, on page 76 were copied.
Specifies the EEM user policy directory; this is the directory to which
the file in Step 5, on page 76was copied.
Registers a user-defined EEM policy.
Manually runs an EEM policy.
Example:
RP/0/RSP0/CPU0:router(config)# event
manager run libtest.tcl
Step 11
commit
Creating an EEM User Tcl Package Index
Perform this task to create a Tcl package index file that contains a directory of all the Tcl packages and version
information contained in a library of Tcl package files. Tcl packages are supported using the Tcl package
keyword.
Tcl packages are located in either the EEM system library directory or the EEM user library directory. When
a package require Tcl command is executed, the user library directory is searched first for a pkgIndex.tcl
file. If the pkgIndex.tcl file is not found in the user directory, the system library directory is searched.
In this task, a Tcl package directory—the pkgIndex.tcl file—is created in the appropriate library directory
using the pkg_mkIndex command to contain information about all the Tcl packages contained in the directory
along with version information. If the index is not created, the Tcl packages are not found when an EEM
policy that contains a package require Tcl command is run.
Cisco ASR 9000 Series Aggregation Services Router System Monitoring Configuration Guide, Release 4.2.x
77
Page 94

How to Write Embedded Event Manager Policies Using Tcl
Using the Tcl package support in EEM, users can gain access to packages such as XML_RPC for Tcl. When
the Tcl package index is created, a Tcl script can easily make an XML-RPC call to an external entity.
Packages implemented in C programming code are not supported in EEM.Note
SUMMARY STEPS
On your workstation (UNIX, Linux, PC, or Mac) create a library directory and copy the Tcl package files
1.
into the directory.
tclsh
2.
pkg_mkindex directory_name *.tcl
3.
Copy the Tcl package files from Step 1 and the pkgIndex file from Step 3 to the directory used for storing
4.
user library files on the target router.
Copy a user-defined EEM policy file written in Tcl to the directory used for storing user-defined EEM
5.
policies on the target router.
configure
6.
event manager directory user library path
7.
event manager directory user policy path
8.
event manager policy policy-name username username [persist-time [seconds | infinite] | type [system
9.
| user]]
event manager run policy [argument]
10.
commit
11.
Configuring and Managing Embedded Event Manager Policies
DETAILED STEPS
Step 1
On your workstation (UNIX, Linux, PC, or Mac)
create a library directory and copy the Tcl package
files into the directory.
Step 2
Example:
workstation% tclsh
Step 3
pkg_mkindex directory_name *.tcl
Example:
workstation% pkg_mkindex eem_library *.tcl
PurposeCommand or Action
—
Enters the Tcl shell.tclsh
Use the pkg_mkindex command to create the pkgIndex file. The
pkgIndex file contains a directory of all the packages contained in
the Tcl library files. We recommend that you run the pkg_mkindex
command inside a directory, because there can be only a single
pkgIndex file in any directory and you may have other Tcl files to
be grouped together. Running the pkg_mkindex command in a
directory determines which Tcl package file or files are indexed
using a specific pkgIndex.
Cisco ASR 9000 Series Aggregation Services Router System Monitoring Configuration Guide, Release 4.2.x
78
Page 95

Configuring and Managing Embedded Event Manager Policies
How to Write Embedded Event Manager Policies Using Tcl
PurposeCommand or Action
The following example pkgIndex is created when some Tcl package
files are in a library file directory and the pkg_mkindex command
is run:
pkgIndex
# Tcl package index file, version 1.1
# This file is generated by the "pkg_mkIndex" command
# and sourced either when an application starts up or
# by a "package unknown" script. It invokes the
# "package ifneeded" command to set up package-related
# information so that packages will be loaded
automatically
# in response to "package require" commands. When this
# script is sourced, the variable $dir must contain the
# full path name of this file's directory.
package ifneeded xmlrpc 0.3 [list source [file join $dir
xmlrpc.tcl]]
Step 4
Step 5
Step 6
Step 7
Copy the Tcl package files from Step 1 and the
pkgIndex file from Step 3 to the directory used for
storing user library files on the target router.
Copy a user-defined EEM policy file written in Tcl
to the directory used for storing user-defined EEM
policies on the target router.
configure
event manager directory user library path
Example:
—
The directory can be the same directory used in Step 4, on page
79.
The following example user-defined EEM policy can be used to
test the Tcl library support in EEM:
packagetest.tcl
::cisco::eem::event_register_none maxrun 1000000.000
#
# test if xmlrpc available
#
#
# Namespace imports
#
namespace import ::cisco::eem::*
namespace import ::cisco::lib::*
#
package require xmlrpc
puts "Did you get an error?"
Specifies the EEM user library directory; this is the directory to
which the files in Step 4, on page 79were copied.
RP/0/RSP0/CPU0:router(config)# event manager
directory user library disk2:/eem_library
Cisco ASR 9000 Series Aggregation Services Router System Monitoring Configuration Guide, Release 4.2.x
79
Page 96

Configuration Examples for Event Management Policies
Configuring and Managing Embedded Event Manager Policies
PurposeCommand or Action
Step 8
Step 9
Step 10
Step 11
event manager directory user policy path
Example:
RP/0/RSP0/CPU0:router(config)# event manager
directory user policy disk2:/eem_policies
event manager policy policy-name username
username [persist-time [seconds | infinite] | type
[system | user]]
Example:
RP/0/RSP0/CPU0:router(config)# event manager
policy packagetest.tcl username user_a
event manager run policy [argument]
Example:
RP/0/RSP0/CPU0:router(config)# event manager
run packagetest.tcl
commit
Specifies the EEM user policy directory; this is the directory to
which the file in Step 5, on page 79was copied.
Registers a user-defined EEM policy.
Manually runs an EEM policy.
Configuration Examples for Event Management Policies
Environmental Variables Configuration: Example
This configuration sets the environment variable cron_entry:
RP/0/RSP0/CPU0:router# configure
RP/0/RSP0/CPU0:router#(config)# event manager environment _cron_entry 0-59/2 0-23/1 * * 0-7
User-Defined Embedded Event Manager Policy Registration: Example
This configuration registers a user-defined event management policy:
RP/0/RSP0/CPU0:router# configure
RP/0/RSP0/CPU0:router(config)# event manager policy cron.tcl username tom user
Cisco ASR 9000 Series Aggregation Services Router System Monitoring Configuration Guide, Release 4.2.x
80
Page 97

Configuring and Managing Embedded Event Manager Policies
Display Available Policies: Example
This is the sample output from the show event manager policy available command displaying available
policies:
RP/0/RSP0/CPU0:router# show event manager policy available
No. Type Time Created Name
1 system Mon Mar 15 21:32:14 2004 periodic_diag_cmds.tcl
2 system Mon Mar 15 21:32:14 2004 periodic_proc_avail.tcl
3 system Mon Mar 15 21:32:16 2004 periodic_sh_log.tcl
4 system Mon Mar 15 21:32:16 2004 tm_cli_cmd.tcl
5 system Mon Mar 15 21:32:16 2004 tm_crash_hist.tcl
Display Embedded Event Manager Process: Example
Reliability metric data is kept for each process handled by the System Manager. This data includes standby
processes running on either the primary or backup hardware card. Data is recorded in a table indexed by
hardware card disk ID plus process pathname plus process instance for those processes that have multiple
instances. This is the sample output from the show event manager metric process command displaying
reliability metric data:
Display Available Policies: Example
RP/0/RSP0/CPU0:router# show event manager metric process all location 0/1/CPU0
=====================================
job id: 78, node name: 0/1/CPU0
process name: wd-critical-mon, instance: 1
-------------------------------last event type: process start
recent start time: Mon Sep 10 21:36:49 2007
recent normal end time: n/a
recent abnormal end time: n/a
number of times started: 1
number of times ended normally: 0
number of times ended abnormally: 0
most recent 10 process start times:
-------------------------Mon Sep 10 21:36:49 2007
--------------------------
most recent 10 process end times and types:
cumulative process available time: 59 hours 33 minutes 42 seconds 638 milliseconds
cumulative process unavailable time: 0 hours 0 minutes 0 seconds 0 milliseconds
process availability: 1.000000000
number of abnormal ends within the past 60 minutes (since reload): 0
number of abnormal ends within the past 24 hours (since reload): 0
number of abnormal ends within the past 30 days (since reload): 0
=====================================
job id: 56, node name: 0/1/CPU0
process name: dllmgr, instance: 1
-------------------------------last event type: process start
recent start time: Mon Sep 10 21:36:49 2007
recent normal end time: n/a
recent abnormal end time: n/a
number of times started: 1
number of times ended normally: 0
number of times ended abnormally: 0
most recent 10 process start times:
-------------------------Mon Sep 10 21:36:49 2007
--------------------------
Cisco ASR 9000 Series Aggregation Services Router System Monitoring Configuration Guide, Release 4.2.x
81
Page 98

Configuring and Managing Embedded Event Manager Policies
Configuration Examples for Writing Embedded Event Manager Policies Using Tcl
most recent 10 process end times and types:
cumulative process available time: 59 hours 33 minutes 42 seconds 633 milliseconds
cumulative process unavailable time: 0 hours 0 minutes 0 seconds 0 milliseconds
process availability: 1.000000000
number of abnormal ends within the past 60 minutes (since reload): 0
number of abnormal ends within the past 24 hours (since reload): 0
number of abnormal ends within the past 30 days (since reload): 0
=====================================
Configuration Examples for Writing Embedded Event Manager
Policies Using Tcl
EEM Event Detector Demo: Example
This example uses the sample policies to demonstrate how to use Embedded Event Manager policies. Proceed
through the following sections to see how to use the sample policies:
EEM Sample Policy Descriptions
The configuration example features one sample EEM policy. The tm_cli_cmd.tcl runs using a configurable
CRON entry. This policy executes a configurable CLI command and e-mails the results.
Event Manager Environment Variables for the Sample Policies
Event manager environment variables are Tcl global variables that are defined external to the EEM policy
before the policy is registered and run. The sample policies require three of the e-mail environment variables
to be set; only _email_cc is optional. Other required and optional variable settings are outlined in the following
tables.
This table describes a list of the e-mail variables.
Table 12: E-mail-Specific Environmental Variables Used by the Sample Policies
_email_server
(SMTP) mail server used to send
e-mail.
ExampleDescriptionEnvironment Variable
example.comThe default domain name._domainname
mailserver.example.comSimple Mail Transfer Protocol
engineering@example.comAddress to which e-mail is sent._email_to
devtest@example.comAddress from which e-mail is sent._email_from
_email_cc
be copied.
Cisco ASR 9000 Series Aggregation Services Router System Monitoring Configuration Guide, Release 4.2.x
82
manager@example.comAddress to which the e-mail must
Page 99

Configuring and Managing Embedded Event Manager Policies
This table describes the EEM environment variables that must be set before the sl_intf_down.tcl sample policy
is run.
Table 13: Environment Variables Used in the sl_intf_down.tcl Policy
EEM Event Detector Demo: Example
ExampleDescriptionEnvironment Variable
_config_cmd1
interface gigabitEthernet1/0/5/0First configuration command that
is run.
_config_cmd2
no shutdownSecond configuration command
that is run. This variable is optional
and need not be specified.
_syslog_pattern
.*UPDOWN.*FastEthernet0/0.*Regular expression pattern match
string that is used to compare
syslog messages to determine when
the policy runs.
This table describes the EEM environment variables that must be set before the tm_cli_cmd.tcl sample policy
is run.
Table 14: Environment Variables Used in the tm_cli_cmd.tcl Policy
ExampleDescriptionEnvironment Variable
_cron_entry
0-59/1 0-23/1 * * 0-7CRON specification that
determines when the policy will
run.
_show_cmd
show versionCLI command to be executed when
the policy is run.
This table describes the EEM environment variables that must be set before the tm_crash_reporter.tcl sample
policy is run.
Table 15: Environment Variables Used in the tm_crash_reporter.tcl Policy
ExampleDescriptionEnvironment Variable
_crash_reporter_debug
1Value that identifies whether debug
information for
tm_crash_reporter.tcl will be
enabled. This variable is optional
and need not be specified.
Cisco ASR 9000 Series Aggregation Services Router System Monitoring Configuration Guide, Release 4.2.x
83
Page 100

EEM Event Detector Demo: Example
Configuring and Managing Embedded Event Manager Policies
ExampleDescriptionEnvironment Variable
_crash_reporter_url
http://www.example.com/fm/interface_tm.cgiURL location to which the crash
report is sent.
This table describes the EEM environment variables that must be set before the tm_fsys_usage.tcl sample
policy is run.
Table 16: Environment Variables Used in the tm_fsys_usage.tcl Policy
ExampleDescriptionEnvironment Variable
_tm_fsys_usage_cron
0-59/1 0-23/1 * * 0-7CRON specification that is used in
the event_register Tcl command
extension. If unspecified, the
tm_fsys_usage.tcl policy is
triggered once per minute. This
variable is optional and need not
be specified.
_tm_fsys_usage_debug
1When this variable is set to a value
of 1, disk usage information is
displayed for all entries in the
system. This variable is optional
and need not be specified.
_tm_fsys_usage_freebytes
_tm_fsys_usage_percent
Registration of Some EEM Policies
Some EEM policies must be unregistered and then reregistered if an EEM environment variable is modified
after the policy is registered. The event_register_ xxx statement that appears at the start of the policy contains
some of the EEM environment variables, and this statement is used to establish the conditions under which
the policy is run. If the environment variables are modified after the policy has been registered, the conditions
specific prefixes. If free space falls
below a given value, a warning is
displayed. This variable is optional
and need not be specified.
Disk usage percentage thresholds
for systems or specific prefixes. If
the disk usage percentage exceeds
a given percentage, a warning is
displayed. If unspecified, the
default disk usage percentage is 80
percent for all systems. This
variable is optional and need not
be specified.
disk2:98000000Free byte threshold for systems or
nvram:25
disk2:5
Cisco ASR 9000 Series Aggregation Services Router System Monitoring Configuration Guide, Release 4.2.x
84
 Loading...