

Page 1
QUICK START GUIDE
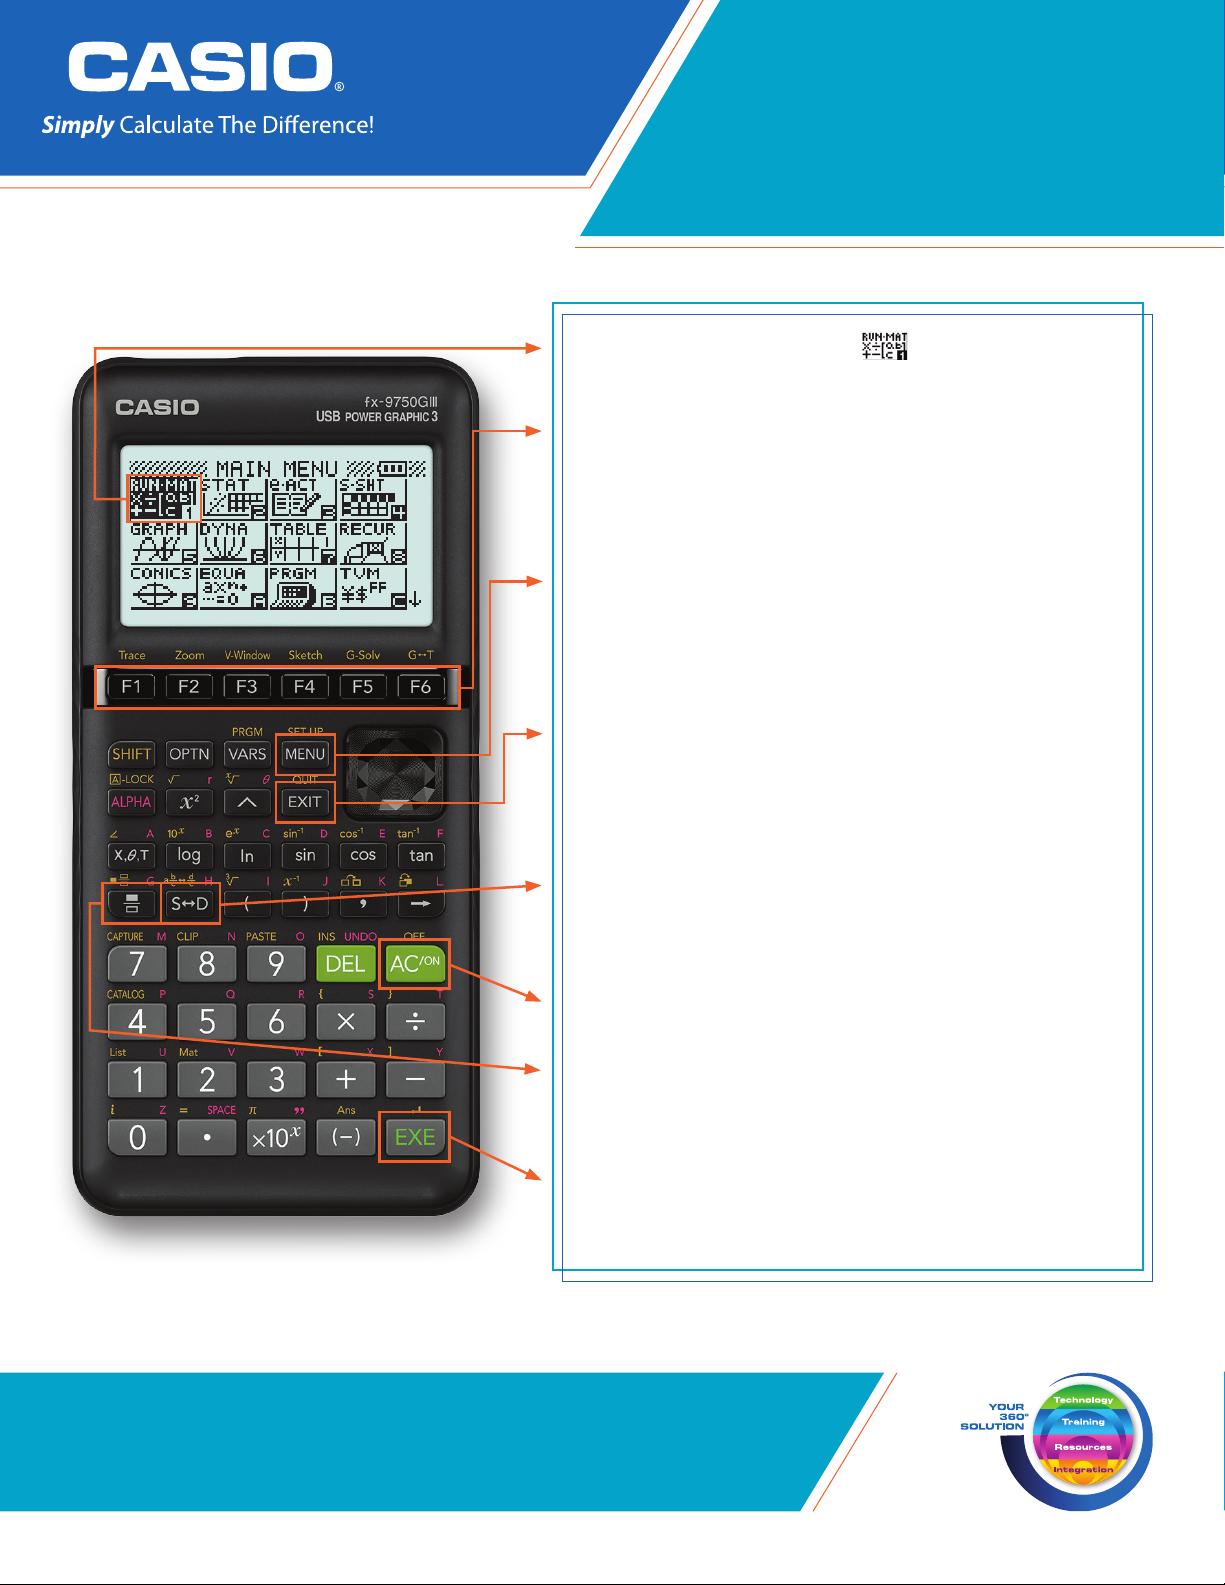
fx-9750GIII
Selecting the RUN-MATRIX icon will allow you to
perform general computations and arithmetic.
The function keys allow you to access the tab (soft
key) menus that will come up at the bottom of the
screen. When an u appears above the u key,
selecting u will offer more on-screen choices.
The p key displays every mode the calculator has.
To select a mode, you may $B to the desired icon
and press l or press the number or letter in the
lower right hand corner of the icon.
The d key operates like the back arrow on a web
browser; it will take you back one screen each time
you select it. The d key will not take you to the icon
menu.
The v key is a toggle key that will change answers
or entered numbers back and forth from decimal to
standard form.
The O key will power the unit on. To turn the unit
off, press LO.
The b key is used to obtain a fraction bar. To obtain
a mixed number, press Lb.
The l key executes operations. When data is
entered, the l button must be pressed to store the
data.
www.casioeducation.com
Page 2
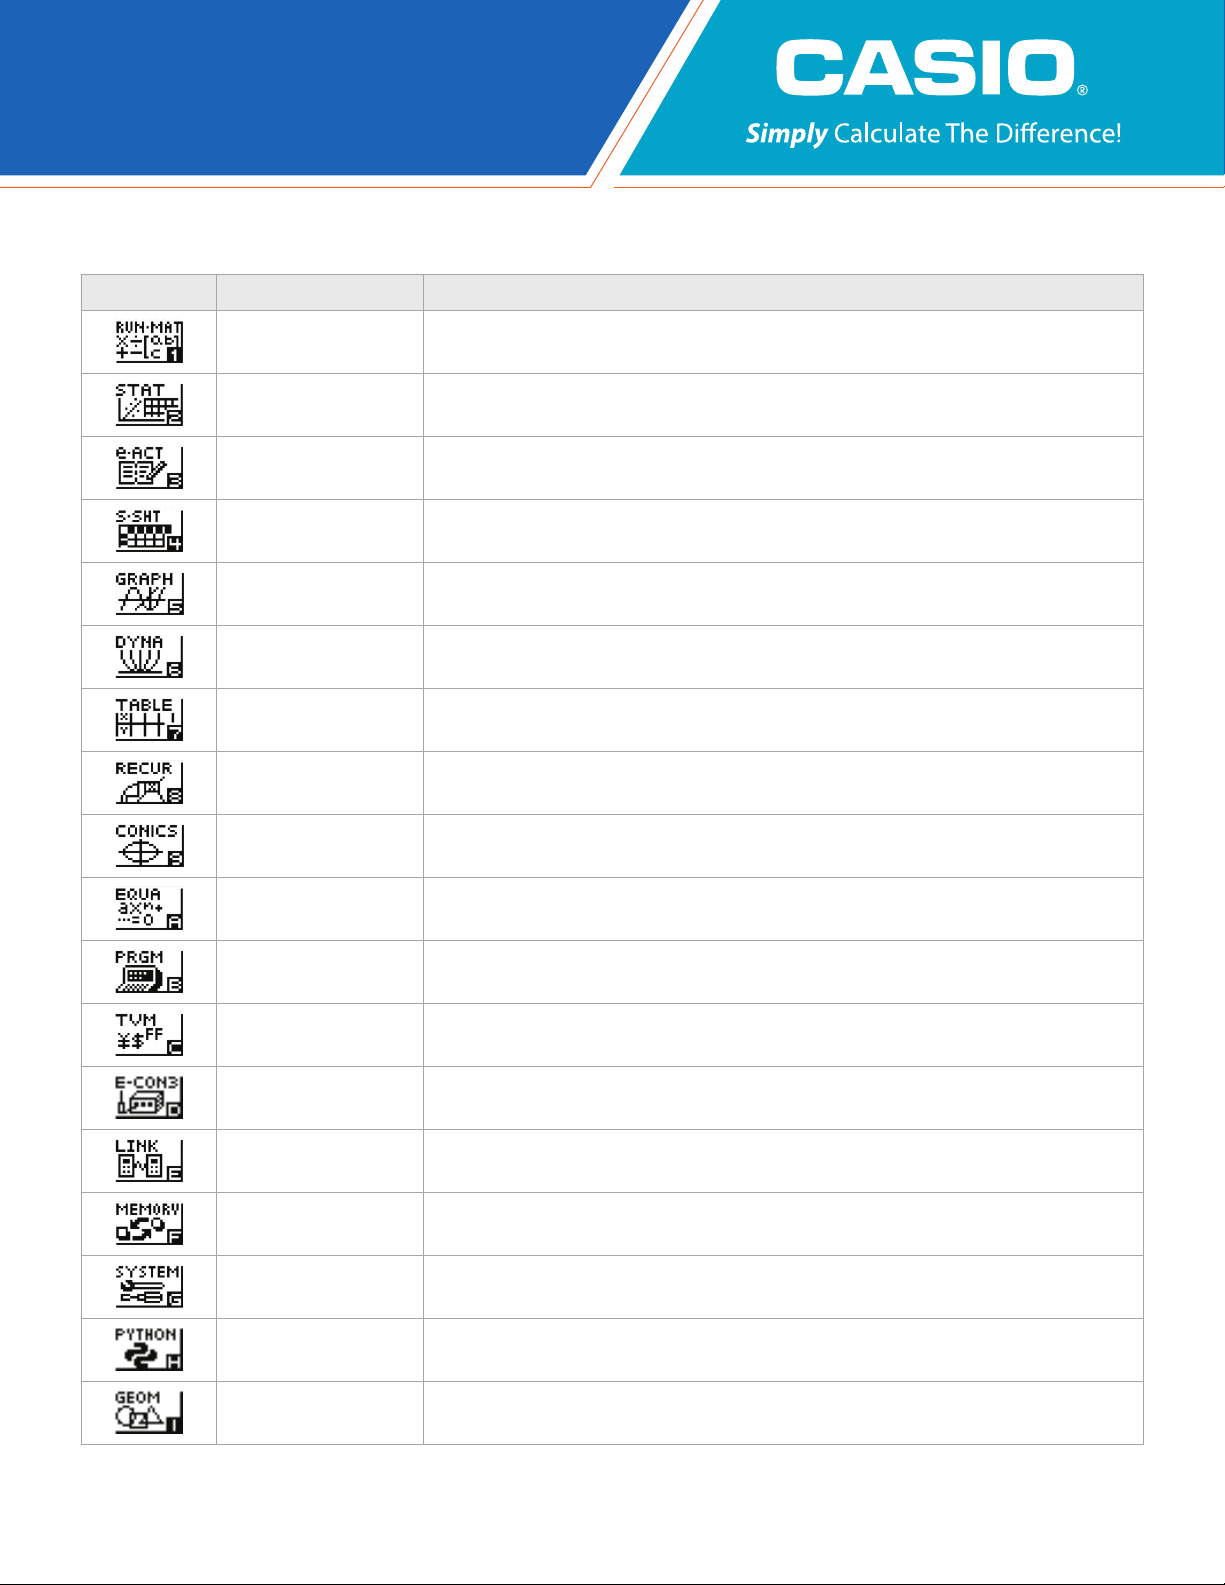
The following explains the meaning of each icon on the fx-9750GIII icon menu
ICON MENU NAME DESCRIPTION
RUN-MATRIX
STATISTICS
eACTIVITY
SPREADSHEET This icon menu is used for creating spreadsheets.
GRAPH
DYNAMIC GRAPH This icon menu is used to draw multiple versions of a graph by changing certain values in the function.
TABLE
RECURSION
CONICS
EQUATION
This icon menu is used for general computations, including absolute value, logs of any base, summation,
derivatives, integrals, and matricies.
This icon menu is used to perform single-variable (standard deviation) and paired variable (regression)
statistical calculations, to perform tests, to analyze data and to draw statistical graphs.
eActivity allows for the input of text, math expressions, and other data in a notebook-like interface. Use this
mode when you want to store text, formulas, or built-in application data in a file.
This icon menu is used to quickly draw, store and calculate information of functions. Can graph polar,
parametric, x=, and inequality graphs on the same screen.
This icon menu is used to store functions, to generate a numeric table of different solutions as the values
assigned to variables in a function change, and to draw graphs.
This icon menu is used to store recursive formulas, to generate a numeric table of different solutions as the
values assigned to the variables in a function change, and to draw graphs.
This icon menu is used to graph parabolas, circles, ellipses, and hyperbolas. You can input a rectangular or
polar coordinate function or a parametric function for graphing.
This icon menu is used to solve linear equations with two through six unknowns, and higher-order equations
from 2nd to 6th degree.
PROGRAM This icon menu is used to store programs in the program area and to run programs.
TIME VALUE OF MONEY This icon menu is used to perform financial calculations and to create cash flow and other types of graphs.
DATA ANALYZER LINK
LINK
MEMORY This icon menu is used to manage data stored in memory.
SYSTEM
PYHON This icon menu is used to create Python programming mode scripts and execute them.
GEOMETRY This icon menu is used to draw, analyze and animate geometric objects.
2
This icon menu is used to control the optionally available CLAB Data Analyzer. For information about this icon
menu, download the E-CON3 manual from http://edu.casio.com.
This icon menu is used to transfer memory contents, back-up data to another unit or PC, and enter Exam
Mode.
This icon menu is used to initialize memory, adjust contrast, reset memory, and to manage other system
settings.
fx-9750GIII Quick Start Guide
Page 3
RUN-MAT
This section is an overview of the RUN-MAT Icon. To select an icon from the icon menu system,
use the !$BN to highlight the desired icon, then press l or press the number/letter in the
lower right corner of the icon. For the RUN menu, press 1 to display the initial screen.
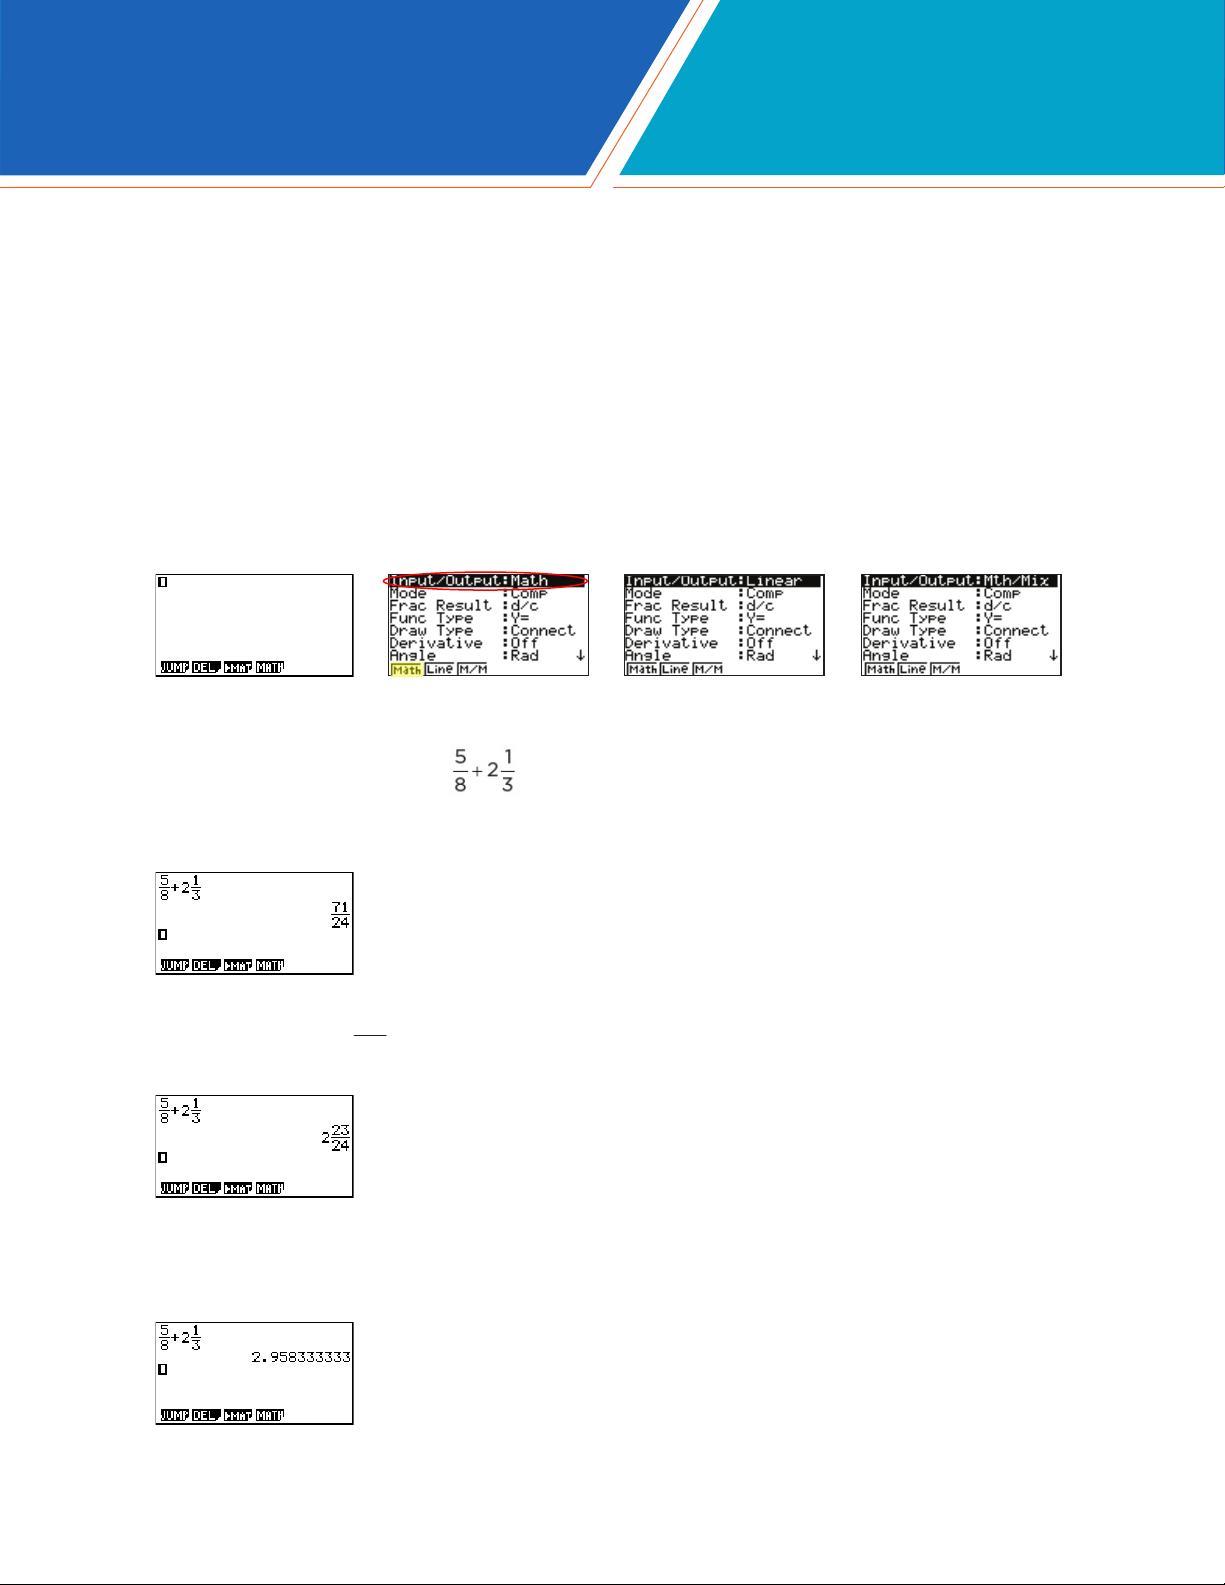
Note: All operations in this handout will utilize the “Math” input/output mode, which allows natural input and
display of certain functions, just as they appear in a textbook. To make sure your calculator is in “Math” mode,
press Lpqd from the RUN menu. Linear Input & Output allows for single line input and display of
certain functions. Math/Mix mode allows for natural input and single line display of radical functions. This is a
combination of the Math and Linear modes. In Math/Mix, fractions are still displayed as they would appear in a
textbook.
1. When performing general computations, you can press b to enter fractions and mixed
numbers. To solve the problem, input the following:
• b5$8$+Lb2$1$3l
2. To change the answer,
3. To change the answer to a decimal approximation, press v. v is a toggle key that will switch
entered data or answers from standard form to its decimal approximation and back.
71
, to a mixed number, press LvX.
24
fx-9750GIII Quick Start Guide
3
Page 4
RUN-MAT
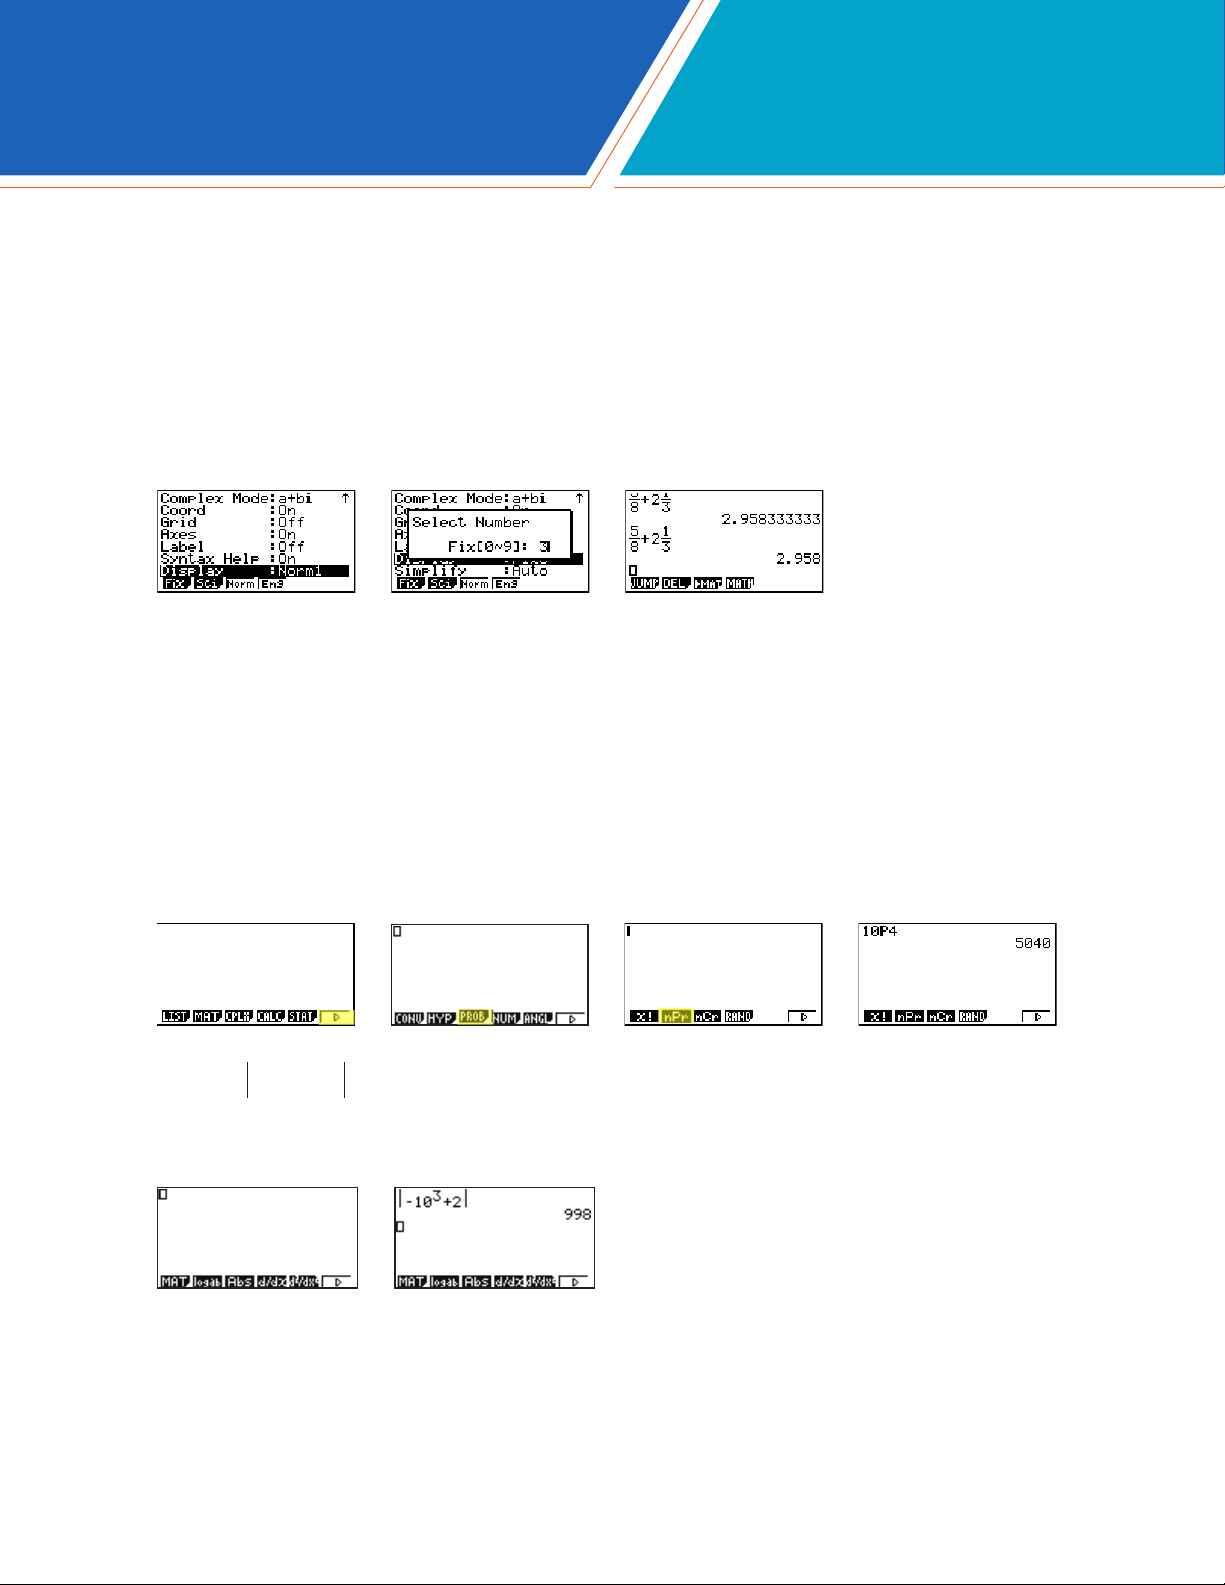
4. To change the displayed number of decimal places, enter the SET UP menu by pressing
Lp. N to Display, select q(Fix) and enter the desired amount of decimal places followed by
l. For this example, 3 decimal places are used.
Note: Every icon’s SET UP menu is accessed in the same manner.
• LpNNNNNNNNNNNq3ldlv
From the RUN menu, many calculations can be performed by selecting i. For example:
hyperbolic, probability/distribution, numeric (including differential and integration), conversion, engineering, complex number and binary, octal, decimal and hexadecimal calculations.
5. To calculate the number of different arrangements of 10 items when choosing 4 at a time, enter
the following from the initial RUN screen:
• iue10w4l
6. To calculate -103 + 2 , enter the following from the initial RUN screen:
• ren10^3$+2l
4
fx-9750GIII Quick Start Guide
Page 5
RUN-MAT
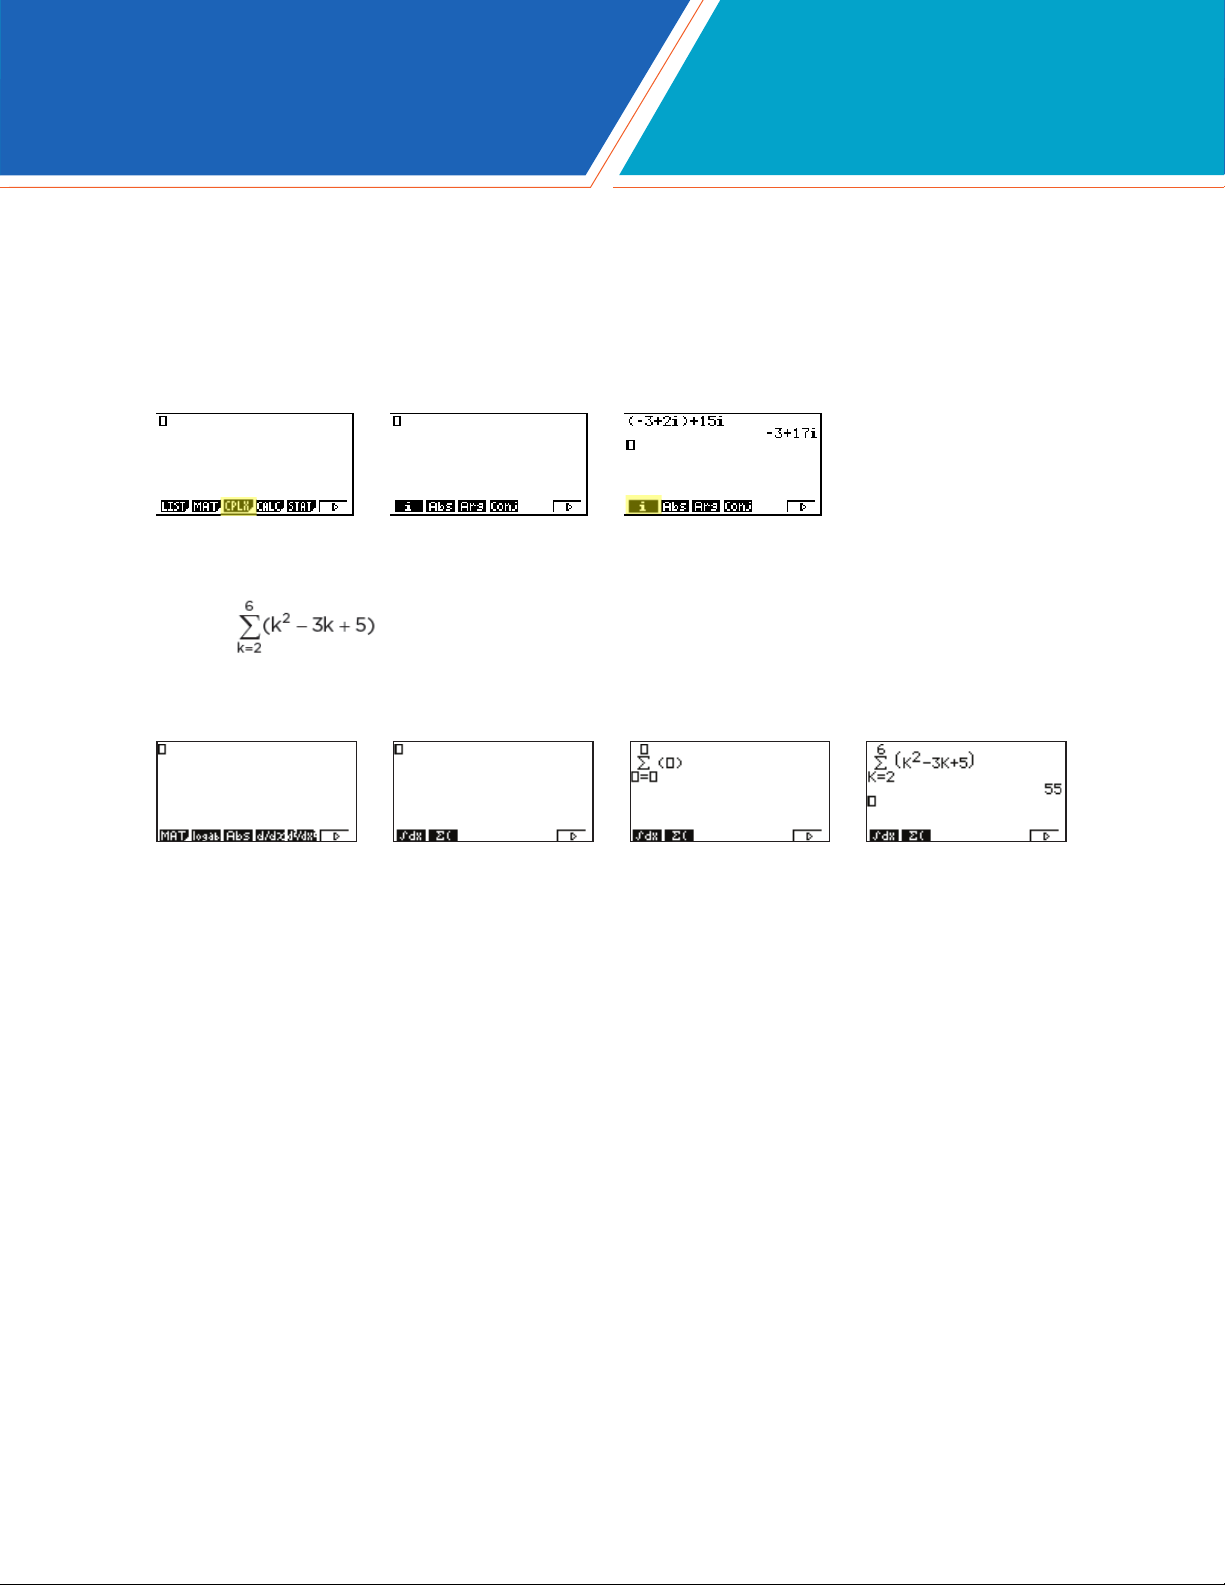
Calculations can be performed with complex numbers and answers can be displayed in a+bi form.
7. To calculate (-3 + 2i ) + 15i; enter the following:
• ie(n3+2q)+15ql
Sigma calculations can also be performed in the RUN menu.
8. To calculate ; enter the following:
• ruwa,s-3a,+5$a,$2$6l
fx-9750GIII Quick Start Guide
5
Page 6
GRAPH
This section is an overview of the GRAPH Icon and will highlight some basic features of this mode.
To enter the Graph menu, highlight the icon and press l or press 5.
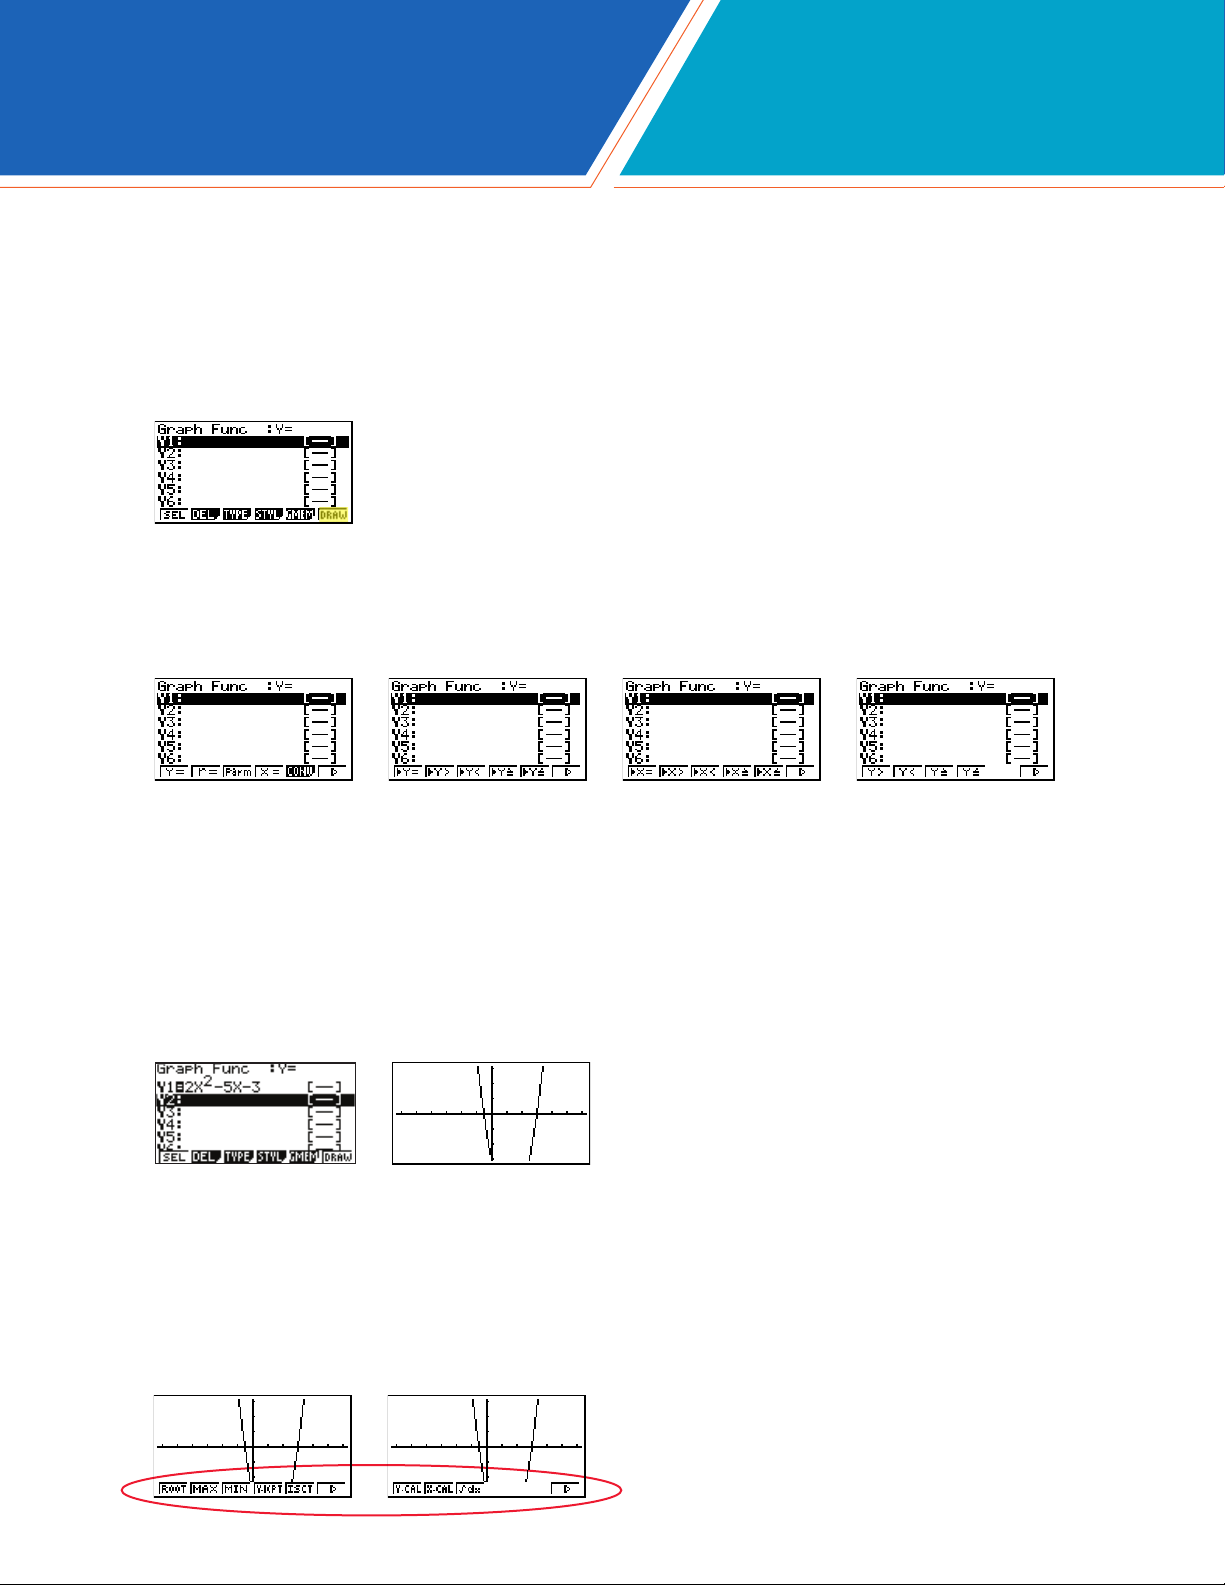
The initial screen is the function/relation editor. Enter a function in Y1 and press l to store it. To
draw the function, press u(DRAW).
You can change the type of graph (r = polar coordinates, parametric functions, x =, and
inequalities) by pressing e(TYPE), then selecting the corresponding TYPE button. Press $ to
begin inputting.
Note: When the TYPE of graph is changed, it only affects the current line and entries below
it. Functions already stored are unchanged.
1. To draw the graph of the function y = 2x2 - 5x - 3 from the Graph Editor screen, input the
following:
• 2fs-5f-3lu
To quickly change your window, you can utilize the arrow buttons. Specic changes can be made to
the viewing window by selecting e(V-Window).
To analyze features of this graph (roots, maximum and minimums, y-intercepts, intersections,
determine coordinates, and integrals), select y(G-Solv).
6
fx-9750GIII Quick Start Guide
Page 7

GRAPH
2. q(Root):
Note: The left-most root will always display rst. To display the next root, simply press $.
3. e(Minimum):
Note: As long as the x-value of your vertex is in the viewable domain; you do not need to see
the vertex to calculate the minimum value. However, you can change the viewing window by
selecting e(V-Window) in the graph window.
4. r(y-intercept):
5. q(y-calculation): What is the value of y when x is -5?
6. w(x-calculation): What is the value(s) of x when y is 1?
7. e(integral): Determine the integral value from (0, 3) for the function Y1= 2x2 - 5x - 3.
fx-9750GIII Quick Start Guide
7
Page 8

TABLE
This section is an overview of the TABLE Icon. To select this icon, highlight it and press l or press
7.
Note: Functions previously entered in Graph will appear in Table.
1. To see a table for the function , highlight Y1: and input the following:
• b2$3$f-4l
2. The default setting for tables is: X starts at 1, ends at 5, and increases by increments of 1. You
change this by pressing y(SET). When complete, press d, then u(TABL).
3. However, you can manually enter a number anywhere in the x-column of the table and press l
to see the corresponding y-value (including fractions, decimals, even π). You can insert and
delete rows in this view by pressing e(ROW). This is a quick way to customize your table.
8
fx-9750GIII Quick Start Guide
Page 9

TABLE
4. From the table view screen, you can press y(G-CON) to see a connected plot graph or u
(G-PLT) to see a plot graph for the function you entered.
5. To see a split screen of your table and graph, press Lp to enter the SET UP menu for the
TABLE icon. Scroll down to Dual Screen, select q(T + G), d, then u(TABL).
If you manually entered values to the previous table that you still want displayed, you can re-enter
them here, then press l to see the graph of that table.
To generate a differential number table, press Lp to enter the SET UP menu for the TABLE
icon and N to Derivative, select q(On), then d.
6. For this example, enter YI: 3x2 - 2 and Y2: x2. Press u(TABL) to view the differential number
table.
Note: Moving the cursor to a differential coefcient displays “dy/dx” in the top line, which
indicates differential.
fx-9750GIII Quick Start Guide
9
Page 10

STATISTICS
This section is an overview of the STAT Icon; it will highlight just a few of the features for singlevariable data and paired-variable data. To select this icon, highlight it and press l or press 2.
The initial List Editor Screen allows input of statistical data and performs numerous statistical
calculations. To input a list of single-variable data, highlight the rst cell under List 1 and enter each
number followed by l.
1. For this example, input this set of data:
2. From this screen you can display various statistical graphs depending on whether you have
single or paired-variable data (scatterplot, line, normal probability, histogram, median box, mean
box, normal distribution, broken line, and regression: linear, quadratic, cubic, quartic, logarithmic,
exponential, power, sinusoidal and logistic).
10
fx-9750GIII Quick Start Guide
Page 11

STATISTICS
3. The initial default graph is a scatterplot. To change the type of graph you would like to use, press
q(GRPH), u(SET), and arrow down to Graph Type. For this set of data, we will make a
histogram, press u, and then q for histogram.
4. Press d to return to your list of data, select q(GPH1)l to see your graph.
5. The following screenshots show one-variable calculations that can be obtained by
pressing q(1-VAR).
6. To delete this set of data, press d until you return to the initial List Editor screen. Select u for
more options, select r(Del-A), then q(Yes).
fx-9750GIII Quick Start Guide
11
Page 12

STATISTICS
7. For paired variable data, use the following:
Enter List 1 rst, and then $ to begin entering List 2. The cursor will automatically move to the
beginning of the next list.
8. To see a scatterplot of these data, go through and change GPH 1 back, using the process above,
or select w(GPH 2) from the List Editor screen whose default is also a scatterplot.
9. From the scatterplot screen, pressing q(CALC) will show all the calculations that can be
obtained from this set of data.
10. To calculate a linear regression for these data, select w(X) from the rst set of options and
then press q or w for the preferred form. For this example, we will use y = ax + b.
11. From this screen, select y(COPY) to copy and then paste the regression equation into the
initial Graph screen or select u(DRAW) to show the linear regression.
12
fx-9750GIII Quick Start Guide
Page 13

EQUATION
This section is an overview of the EQUATION Icon. To select this icon, highlight it and press l or
press f.
The initial Equation Editor screen has three modes to choose from, Simultaneous, Polynomial, and
Solver; this section will give an overview of each mode.
The Simultaneous mode allows you to solve simultaneous linear equations that contain two to six
unknowns.
1. Solve the following system of equations:
Press q(SIML) to select the Simultaneous mode and press w(3) for three unknowns. The
calculator will display a matrix where the coefcients and constants can be entered in, as long as
each equation is in standard form. To enter this system of equations (already in standard form),
input the following:
• 4 l 1 l n 2 l n 1 l
• 1 l 6 l 3 l 1 l
• n 5 l 4 l 1 l n 7 l
There are four options at the bottom of the screen, press q(SOLV). The solution to this system is
(1, -1, 2).
fx-9750GIII Quick Start Guide
13
Page 14

EQUATION
Press q(REPT) to edit this problem or continue solving simultaneous equations with three
unknowns. To edit just one of the numbers in the system, arrow to the number to be edited and
press r(EDIT) or highlight the number to be edited, enter the new number, and press l.
Press d until the initial Equation Editor screen is displayed. The second mode is Polynomial (w)
and can be used to solve higher-order equations (in standard form), from the second to sixth
degree.
2. To solve the equation x3 – 2x2 – x + 2 = 0, input the following:
• w(POLY)w(3)1ln2ln1l2lq(SOLV)
3. To change the equation to x3 + 2x2 + 3x + 2 = 0, select q(REPT) and change the b- value
to 2, the c-value to 3 and press q(SOLV).
4. The default setting is for real numbers; to change the display to a+bi form, press Lp for the
Equation SET UP menu, highlight Complex Mode, select w(a+bi), d, then q(SOLV).
14
fx-9750GIII Quick Start Guide
Page 15

EQUATION
Solver is the third function and allows you to determine the value of any variable in a formula or
equation. You can input any formula exactly as it appears using a for any variables. In this example,
we will solve a linear equation and a formula.
5. To nd the value of x in the following equation, 2(x - 5) = -3x + 2, input the following, starting from
the initial Equation Editor Screen:
• e(SOLV)2(f-5)L.n3f+2lu(SOLV)
Note: In the last screen, “Lft” and “Rgt” represent the values of the left and right sides
of the equation using the value of the solution; this is the calculator’s way of checking the
solution.
You can also enter a formula, assign values, and solve for a specic variable using the Solver
function of the Equation Editor.
Note: Selecting q(REPT) will take you back to the previous screen where you can edit and
re-solve the previous equation or begin a new problem.
6. Find the radius (to the nearest hundredth) of a sphere, whose volume is 3705.97 cm3. To enter
the formula , input the following into the calculator:
• q(REPT)Ba2L.b4$3$Lza6^3l
• Highlight V= and enter 3705.97l
• Press u(SOLV)
fx-9750GIII Quick Start Guide
15
Page 16

CONICS
This section is an overview of the CONICS Icon. To select this icon, highlight it and press l or
press 9.
The initial CONICS screen allows you to choose from various conic functions, including rectangular,
polar or parametric form. You may use BN to select the equation of the function in accordance
with the type of graph you want to draw. Once you have chosen the conic function you would like to
graph, press l. Enter the coefcients of the function and press u(DRAW).
1. To view the graph of the conic: y = 2x2 - 5x - 3, select the Y = AX2 + BX + C form from the Conics
formula menu. Enter the coefcients and press u(DRAW).
In the Conics modes, when you press y(G-Solv), although you are still graphing a parabola like in
the Graph mode, notice how the vocabulary and options have changed to be conic specic.
2. For example, you can now examine the line of symmetry for this parabola and the equation of
that line will be displayed. To see the line of symmetry, press w(SYM).
You can continue to analyze different areas of this graph and the line of symmetry will continue to
be displayed.
16
fx-9750GIII Quick Start Guide
Page 17

NOTES
fx-9750GIII Quick Start Guide
17
Page 18

NOTES
18
fx-9750GIII Quick Start Guide
Page 19

NOTES
fx-9750GIII Quick Start Guide
19
Page 20

See the complete line of Casio calculators
www.casioeducation.com
fx-9750GIII Quick Start Guide
 Loading...