

Page 1
BECKMAN COULTER
™
AC•T™ 5diff Hematology Analyzer
Operator’s Guide
PN 4237615B (July 2000)
COULTER CORPORATION
A Beckman Coulter Company
Miami, Florida 33196-2500 USA
Page 2

READ ALL PRODUCT MANUALS AND CONSULT WITH BECKMAN COULTER-TRAINED PERSONNEL
BEFORE ATTEMPTING TO OPERATE INSTRUMENT.
HAZARDS AND OPERATIONAL PRECAUTIONS AND LIMITATIONS
WARNINGS, CAUTIONS, and IMPORTANTS alert you as follows:
WARNING - Might cause injury.
CAUTION - Might cause damage to the instrument.
IMPORTANT - Might cause misleading results.
CAUTION System integrity might be compromised and operational failures might occur if:
r This equipment is used in a manner other than specified. Operate the instrument as instructed in the Product
Manuals.
r You introduce software that is not authorized by Beckman Coulter into your computer. Only operate your system’s
computer with software authorized by Beckman Coulter.
r You install software that is not an original copyrighted version. Only use software that is an original copyrighted
version to prevent virus contamination.
Beckman Coulter, Inc. urges its customers to comply with all national health and safety standards such as the use of barrier
protection. This may include, but it is not limited to, protective eyewear, gloves, and suitable laboratory attire when
operating or maintaining this or any other automated laboratory analyzer.
WARNING Risk of operator injury if all covers are not secured in place prior to instrument operation or you attempt to
replace a part without carefully reading the replacement instructions. Do not attempt to replace any component until you
carefully read the instructions for replacing the component.
IMPORTANT If you purchased this product from anyone other than Beckman Coulter or an authorized Beckman Coulter
distributor, and, if it is not presently under a Beckman Coulter service maintenance agreement, Beckman Coulter cannot
guarantee that the product is fitted with the most current mandatory engineering revisions or that you will receive the most
current information bulletins concerning the product. If you purchased this product from a third party and would like
further information concerning this topic, call your Beckman Coulter Representative.
Page 3

Initial Issue, 03/00
Software version 0.11
Issue B, 07/00
Software version 1.0
REVISION STATUS
This document applies to the latest software listed and higher versions. When a subsequent software version changes the
information in this document, a new issue will be released.
PN 4237615B
iii
Page 4

REVISION STATUS
iv
PN 4237615B
Page 5

REVISION STATUS
INTRODUCTION, xvii
C
HOW TO USE YOUR A
•T 5diff HEMATOLOGY ANALYZER MANUALS, xvii
ABOUT THIS MANUAL, xvii
CONVENTIONS, xix
GRAPHICS, xix
SYMBOLS, xx
Safety Symbols, xx
Tab Symbols, xx
MENU TREE, xxi
1 USE AND FUNCTION, 1-1
1.1 INTENDED USE, 1-1
General, 1-1
Purpose, 1-1
Instrument Description, 1-1
Control Panel, 1-3
Back Panel, 1-4
Warning and Caution Labels, 1-4
Modes, 1-5
Parameters, 1-5
CBC Mode, 1-5
CBC/DIFF Mode, 1-6
Features, 1-6
Reports, 1-6
CONTENTS
1.2 CONTROLS AND CALIBRATORS, 1-7
Cell Controls, 1-7
Calibrator, 1-7
1.3 REAGENTS, 1-7
C
A
•T 5diff Diluent, 1-8
C
A
•T 5diff Fix, 1-8
C
A
•T 5diff WBC Lyse, 1-8
C
A
•T 5diff Hgb Lyse, 1-8
C
A
•T 5diff Rinse, 1-8
Waste Handling Procedures, 1-9
Neutralizing the Waste and Treating for Biohazards, 1-9
Handling Expired Reagents, 1-10
1.4 PRINTER, 1-10
1.5 RANGES, 1-10
PN 4237615B
v
Page 6

CONTENTS
1.6 WORKING WITH THE SOFTWARE, 1-11
Moving the Cursor, 1-11
Selecting Menu Items, 1-11
Erasing Saved Text, 1-12
Selecting/De-selecting Software Fields, 1-12
1.7 PRESENTING SAMPLES TUBES (OR VIALS) AND STARTING ANALYSIS, 1-13
1.8 ORDERING MATERIAL SAFETY DATA SHEETS (MSDS), 1-13
2 OPERATION PRINCIPLES, 2-1
2.1 OVERVIEW, 2-1
2.2 MEASUREMENT PRINCIPLES, 2-1
Coulter Principle, 2-1
Aperture Sensor System, 2-1
Applying the Coulter Principle, 2-2
2.3 A
C
V TECHNOLOGY, 2-3
Dual Focused Flow (DFF), 2-3
Flowcell, 2-3
Focused Flow Impedance, 2-3
Absorbance Cytochemistry, 2-4
Signal Processing, 2-4
Thresholds, 2-4
2.4 WBC/BASO METHODOLOGY, 2-5
2.5 SAMPLE ANALYSIS OVERVIEW, 2-5
Aspiration, 2-5
Dilution, 2-6
CBC Mode, 2-7
CBC/DIFF Mode, 2-7
Delivery, 2-7
2.6 SAMPLE ANALYSIS, 2-8
RBC and Platelet Analysis, 2-8
Parameter Results Obtained from the RBC/Plt Dilution, 2-9
Hgb Measurement, 2-9
WBC Count and Differential, 2-10
Parameter Results Obtained from the WBC/BASO Dilution, 2-11
Differential, 2-11
Parameter Results Obtained from the DIFF Dilution, 2-12
Dilution Summary, 2-13
vi
PN 4237615B
Page 7

2.7 PARAMETER DEVELOPMENT, 2-13
RBC Parameters, 2-13
RBC Count, 2-13
RBC Histogram, 2-14
Parameter Results Obtained Using the RBC Histogram, 2-14
MCH and MCHC Calculations, 2-15
Plt Parameters, 2-15
Interference on the Lower End of the Platelet Distribution Curve, 2-15
Microcytic Interferences on the Upper End of the Platelet Distribution Curve, 2-16
Parameter Results Obtained Using the Plt Histogram, 2-16
Hgb Determination, 2-17
WBC Count, BASO Count, and DiffPlot Development, 2-17
WBC Count, 2-17
BASO Count, 2-17
DiffPlot Development, 2-18
3 SPECIFICATIONS/CHARACTERISTICS, 3-1
3.1 INSTRUMENT SPECIFICATIONS, 3-1
Dimensions and Weight, 3-1
Power, 3-1
Supply, 3-1
Consumption, 3-1
Installation Category, 3-1
Grounding Requirements, 3-1
Temperature, Ambient Operating, 3-1
Altitude Range, 3-2
Recommended Location, 3-2
Electromagnetic Environment Check, 3-2
Recommended Reagents, 3-2
Recommended Controls, 3-2
Recommended Calibrator, 3-2
Recommended Anticoagulant, 3-2
Sample Volume Aspirated, 3-2
Dilution Ratios, 3-2
Throughput, 3-3
Sample Stability, 3-3
Sample Identification, 3-3
Output, 3-3
Measurements and Computation, 3-4
Counting Aperture Diameters, 3-4
Reagent Consumption, 3-4
Environmental Protection, 3-4
CONTENTS
3.2 PERFORMANCE SPECIFICATIONS, 3-5
Reproducibility, 3-5
Linearity, 3-5
Accuracy, 3-5
Carryover, 3-6
Reportable Range, 3-6
PN 4237615B
vii
Page 8

CONTENTS
3.3 PERFORMANCE CHARACTERISTICS, 3-7
Reproducibility, 3-7
Accuracy, 3-8
Carryover, 3-8
3.4 LIMITATIONS, 3-8
Maintenance, 3-8
Blood Specimens, 3-8
3.5 INTERFERING SUBSTANCES, 3-9
4 PRECAUTIONS/HAZARDS, 4-1
4.1 DEFINITIONS, 4-1
Warnings, 4-1
Cautions, 4-1
Importants, 4-1
Attention, 4-1
4.2 SAFETY PRECAUTIONS, 4-1
Electronic, 4-1
Biological, 4-1
Moving Parts, 4-1
4.3 OPERATIONAL HAZARDS, 4-2
5 RUNNING SAMPLES, 5-1
5.1 BEFORE ANALYSIS, 5-1
Waste Container Level Check, 5-1
Printer Check, 5-1
Startup, 5-2
Startup During Power Up, 5-2
Startup After Power Up, 5-3
Specimen Collection and Mixing, 5-5
Running Cell Controls to Verify Calibration, 5-5
5.2 ANALYSIS, 5-8
Running Whole-Blood Samples, 5-8
5.3 AFTER ANALYSIS, 5-10
Results, 5-10
Printing Results for Last Sample Analyzed, 5-10
Auto-Clean, 5-11
5.4 SHUTDOWN, 5-11
5.5 ENTERING THE SAMPLE IDENTIFICATION (ID), 5-11
Auto-Numbering, 5-11
Manual Sample ID, 5-12
Scanning the Sample ID with the Barcode Reader, 5-13
viii
PN 4237615B
Page 9

6 REVIEWING RESULTS, 6-1
6.1 GENERAL, 6-1
6.2 FLAGS AND INTERPRETIVE MESSAGES, 6-1
Flags, 6-1
Definition, 6-1
Types of Flags, 6-1
Types of Flag Printout Formats, 6-1
Interpretive Messages, 6-2
Definition, 6-2
6.3 FLAGS GENERATED BY THE INSTRUMENT, 6-2
Results Exceeding Instrument Capacity, 6-2
Hemoglobin Errors, 6-2
Hgb Blank Error, 6-2
Hgb Read Error, 6-2
Voteout Flag, 6-3
WBC Count Flag, 6-3
DiffPlot Flags, 6-3
CBC Flags, 6-8
Suspect or Detailed Flag Format, 6-11
Suspect Flag Format, 6-11
Detailed Flag Format, 6-12
Patient Ranges and Action Ranges, 6-12
CONTENTS
6.4 INTERPRETIVE MESSAGES, 6-12
WBC Interpretive Messages, 6-13
RBC Interpretive Messages, 6-13
Plt Interpretive Messages, 6-14
Combination WBC/RBC/Plt Interpretive Messages, 6-14
7CALIBRATION,7-1
7.1 GENERAL, 7-1
Recommended Calibration Conditions, 7-1
When to Calibrate, 7-1
When to Verify Calibration, 7-1
7.2 PRE-CALIBRATION CHECKS, 7-1
7.3 AUTO-CALIBRATION, 7-3
Calibration Setup, 7-3
Running Calibration, 7-5
Interpreting Calibration Results, 7-9
Forced Calibration, 7-9
7.4 MANUAL CALIBRATION FACTOR ADJUSTMENT, 7-11
7.5 PRINTING CALIBRATION FACTORS, 7-14
PN 4237615B
ix
Page 10

CONTENTS
8 DIAGNOSTICS, 8-1
8.1 GENERAL MAINTENANCE, 8-1
8.2 MAINTENANCE SCHEDULE, 8-1
8.3 CLEANING PROCEDURES, 8-2
Cleaning the Outside of the Instrument, 8-2
Cleaning the Inside of the Instrument, 8-2
Extended Cleaning Procedure, 8-2
Auto-Clean, 8-4
Shutdown, 8-5
System Cleaning, 8-5
8.4 SYSTEM RESET CYCLE, 8-9
8.5 COMPONENT LOCATIONS, 8-10
8.6 SYSTEM TROUBLESHOOTING PROCEDURES, 8-12
Diluter System, 8-12
Backflush, 8-12
Bath and Flowcell Rinse, 8-13
Draining the Baths and/or the Diluent Reservoir, 8-14
Hardware System, 8-15
Hardware Reset, 8-15
Checking the Valves, 8-15
Checking the Motors, 8-15
8.7 REPLACEMENT PROCEDURES, 8-15
Replacing Reagents, 8-15
Viewing Reagent Levels, 8-16
Replacing the Diluent Reagent, 8-17
Replacing Fix, WBC Lyse, Hgb Lyse, and Rinse Reagents, 8-21
Priming the Reagents, 8-26
Replacing the Waste Container, 8-27
Replacing the Flowcell Lamp, 8-29
8.8 SYSTEM ERRORS, 8-34
What Error Messages Mean, 8-34
8.9 TROUBLESHOOTING GUIDES, 8-36
A INSTRUMENT SETUP, A-1
A.1 INSTALLATION, A-1
A.2 DEFAULT CONFIGURATION, A-1
A.3 CHANGES TO INSTRUMENT SETUP, A-2
A.4 LANGUAGE AND USA FIELD SELECTION, A-2
A.5 PASSWORD SETUP, A-3
x
PN 4237615B
Page 11

A.6 DATE/TIME SETUP, A-4
Date Setup, A-4
Selecting the Date Format, A-4
Selecting the Time Format, A-5
Setting a New Date and Time, A-5
A.7 REPORTING UNIT SELECTION, A-7
A.8 LABORATORY LIMITS SETUP, A-8
Patient Ranges, A-8
Changing CBC Patient Ranges, A-9
Changing DIFF Patient Ranges, A-11
Action Ranges, A-13
Changing CBC Action Ranges, A-13
Changing DIFF Action Ranges, A-15
A.9 SETTING FLAG SENSITIVITY AND THRESHOLDS, A-17
A.10 PRINTER CONFIGURATION, A-18
Configuring the Instrument’s Printer Settings, A-18
Printing Options, A-20
CONTENTS
A.11 ENTERING/EDITING THE INSTITUTIONAL HEADER, A-21
A.12 PRINTING A SYSTEM SETUP REPORT, A-22
A.13 CALIBRATION SETUP, A-23
Changing CV% Limits, A-23
Defining the Operator, A-25
A.14 SELECTING THE SAMPLE IDENTIFICATION (ID) MODE, A-27
A.15 DISPLAYING DIFF # OR DIFF %, A-28
A.16 ENABLING ATL, IMM, PCT, AND PDW, A-28
A.17 RESETTING THE MANUAL SAMPLE ID NUMBER AND INSTRUMENT SEQUENCE
NUMBER TO “1”,A-29
A.18 SELECTING BARCODE WITH CHECKSUM, A-30
A.19 AUTO-CLEAN FREQUENCY SETTING, A-31
A.20 CHANGING THE DAILY WORKLOAD, A-32
A.21 REAGENT VOLUMES SETUP, A-33
A.22 VIEWING THE CYCLE COUNT, A-34
PN 4237615B
xi
Page 12

CONTENTS
B LOG SHEETS, B-1
ACTION LOG, B-2
MAINTENANCE LOG, B-3
REAGENT LOG, B-4
CMANUAL CALIBRATION,C-1
C.1 ANALYSIS PROCEDURE, C-1
C.2 CALCULATIONS PROCEDURE, C-2
C.3 CALCULATING NEW CALIBRATION FACTORS, C-3
Calibration Worksheet, C-4
D TROUBLESHOOTING FLOWCHART, D-1
D.1 TROUBLESHOOTING FLOWCHART, D-1
E TRAINING CHECKLIST, E-1
E.1 INSTALLATION, E-1
E.2 GENERAL, E-1
E.3 SAMPLE HANDLING, E-1
E.4 INSTRUMENT COMPONENTS, E-1
E.5 SOFTWARE MENU, E-1
E.6 REAGENTS, E-1
E.7 INSTRUMENT SETUP/CUSTOMIZATION, E-2
E.8 CALIBRATION, E-2
E.9 CONTROLS, E-2
E.10 SYSTEM OPERATION OVERVIEW, E-2
E.11 DAILY PROCEDURES, E-2
E.12 SPECIAL PROCEDURES, E-3
E.13 MAINTAINING AND SERVICING THE INSTRUMENT, E-3
E.14 PAPERWORK, E-3
F BARCODE SPECIFICATIONS, F-1
F.1 OVERVIEW, F-1
Definition, F-1
xii
PN 4237615B
Page 13

F.2 BARCODE LABELS, F-1
Symbologies, F-1
F.3 BARCODE SPECIFICATIONS, F-1
F.4 BARCODE LABEL TEST PAGES, F-3
F.5 BARCODE SCANNER CONFIGURATION, F-4
F.6 CODE 39 AND CODABAR BARCODE SCANNER OPTIONS, F-5
F.7 I 2-OF-5 PROGRAMMING OPTIONS AND TEST LABELS, F-7
REFERENCES, REFERENCES-1
LIST OF REFERENCES, REFERENCES-1
GLOSSARY, GLOSSARY-1
DEFINITIONS, GLOSSARY-1
CONTENTS
ABBREVIATIONS, ABBREVIATIONS-1
LIST OF ABBREVIATIONS, ABBREVIATIONS-1
INDEX, INDEX-1
TRADEMARKS
ILLUSTRATIONS
1.1 AC•T 5diff Analyzer, 1-1
1.2 Outside View of the Instrument, 1-2
1.3 Control Panel Buttons, 1-3
1.4 Back Panel, 1-4
1.5 Warning and Caution Labels on the Instrument, 1-4
2.1 Coulter Principle, 2-2
2.2 Dual Focused Flow Process, 2-3
2.3 Signal Processing, 2-4
2.4 BASO Thresholds, 2-5
2.5 Sample Partitions Inside the Probe - CBC/DIFF Mode, 2-6
2.6 Sample Partitions Inside the Probe - CBC Mode, 2-6
2.7 Bath Assembly, 2-6
2.8 Sample Delivery Using Tangential Flow, 2-7
2.9 Bath Assembly, 2-8
2.10 Bath Assembly, 2-10
2.11 Flowcell Operation, 2-11
2.12 DiffPlot Regions, 2-12
2.13 Typical RBC Histogram, 2-14
2.14 Typical Plt Histogram, 2-15
2.15 Area of the Plt Histogram Used to Determine the PDW Parameter Result, 2-16
2.16 Areas Used to Determine WBC and BASO Parameter Results, 2-17
2.17 DiffPlot Regions, 2-18
PN 4237615B
xiii
Page 14

CONTENTS
3.1 Instrument Dimensions and Weight, 3-1
3.2 Sample Report, 3-3
5.1 Sample Report, 5-10
6.1 WBC/BASO Histogram Flags: CBC Mode, 6-8
6.2 WBC/BASO Histogram Flags: CBC/DIFF Mode, 6-8
6.3 MICRO and MACRO Regions on RBC Histogram, 6-9
6.4 Plt Flags, 6-10
6.5 Mobile Threshold Positioned in the Standard Regions (Between 18fL and 25fL), 6-10
6.6 Mobile Threshold Cannot Be Positioned in the Standard Region, 6-10
6.7 Mobile Threshold Cannot Be Positioned, 6-10
7.1 Out of Range Calibration Factors, 7-9
8.1 View of the Pneumatics Area (Right Side), 8-10
8.2 Bath Assembly, 8-11
8.3 View Behind Motherboard (Left Side), 8-11
8.4 Motherboard, 8-12
8.5 Reagent Bottle Location, 8-16
8.6 Waste Sensor Alarm Unit Location, 8-27
A.1 Sample Results Report: Areas Defined, A-19
D.1 Troubleshooting Flowchart, D-1
TABLES
1.1 CBC Parameters, 1-5
1.2 CBC/DIFF Parameters, 1-6
2.1 A
2.2 Technical Characteristics for Obtaining RBC and Platelet Counts, 2-8
2.3 Technical Characteristics for the Measurement of the Hemoglobin, 2-9
2.4 Characteristics Required to Obtain WBC/BASO Results, 2-10
2.5 Technical Characteristics for Acquisition of the DiffPlot, 2-12
2.6 Summary of Dilutions, 2-13
2.7 DiffPlot Regions Defined, 2-19
2.8 Immature White Blood Cells, 2-20
3.1 Reagent Consumption by Cycle in mL, 3-4
3.2 Reproducibility Specifications, 3-5
3.3 Linearity Specifications, 3-5
3.4 Accuracy Specifications, 3-5
3.5 Carryover Specifications, 3-6
3.6 Reportable Range, 3-6
3.7 Reproducibility Characteristics From a Normal Sample with a Low Normal WBC Count, 3-7
3.8 Reproducibility Characteristics From a Normal Sample with a High Normal WBC Count, 3-7
3.9 Accuracy Characteristics, 3-8
3.10 Carryover Characteristics, 3-8
3.11 Interfering Substances, 3-9
6.1 Definition of DIFF Flags, 6-4
6.2 CBC Histogram Flags, 6-8
6.3 Patient Range and Action Range Flags, 6-12
6.4 WBC Interpretive Messages from Action Ranges, 6-13
6.5 WBC Interpretive Messages from DiffPlot, 6-13
6.6 RBC Interpretive Messages from Action Ranges, 6-13
6.7 RBC Interpretive Messages from Flag Sensitivity, 6-14
C
•T 5diff Analyzer: Measurement Technologies, 2-1
xiv
PN 4237615B
Page 15

6.8 Plt Interpretive Messages from Action Ranges, 6-14
6.9 Plt Interpretive Messages from the Plt Histogram, 6-14
6.10 Interpretive Messages from a Combination of WBC/RBC/Plt Action Ranges, 6-14
6.11 NRBCs and PLATELET AGGREGATES Interpretive Messages, 6-15
7.1 Calibration Factors Range, 7-13
8.1 Maintenance Schedule, 8-1
8.2 Error Messages, 8-34
8.3 Troubleshooting Guide, 8-36
A.1 Instrument Default Settings, A-1
A.2 Reporting Unit Format, A-7
A.3 CBC Default Patient Ranges, A-9
A.4 DIFF Default Patient Ranges, A-11
A.5 CBC Default Action Ranges, A-13
A.6 DIFF Default Action Ranges, A-15
A.7 Default CV Limits, A-23
A.8 Daily Workload Runs by Mode, A-32
A.9 Default Reagent Volumes, A-33
F.1 Default Barcode Settings, F-2
F.2 Test Labels With the Check Digit (Checksum), F-3
F.3 Test Labels Without the Check Digit, F-3
F.4 Barcode Scanner Configuration Sheet, F-4
F.5 Code 39 Barcode Scanner Options, F-5
F.6 Codabar Barcode Scanner Options, F-6
F.7 Interleaved 2-of-5 Options With Fixed Length Characters Test Labels, F-7
CONTENTS
PN 4237615B
xv
Page 16

CONTENTS
xvi
PN 4237615B
Page 17

This introductory section contains the following topics:
r HOW TO USE YOUR AC•T 5diff HEMATOLOGY ANALYZER MANUALS,
r ABOUT THIS MANUAL,
r CONVENTIONS,
r GRAPHICS
r SYMBOLS, and
r MENU TREE.
HOW TO USE YOUR AC•T 5diff HEMATOLOGY ANALYZER MANUALS
Use this Operator’s Guide to find information about:
r Getting started,
r Running your instrument,
r Reviewing results,
r Performing special procedures, such as cleaning, replacing, or adjusting an instrument
component,
r Troubleshooting problems,
INTRODUCTION
r Determining what the instrument does,
r Understanding how to safely operate the instrument,
r Powering up the instrument,
r Customizing the setup, and
r Running controls and samples.
Use the Host Transmission Specification manual (PN 4277065) to find out information about
interfacing your A
ABOUT THIS MANUAL
The information in this manual is organized as follows:
r Chapter 1, USE AND FUNCTION
Contains the intended use of the instrument, a brief history of the methods used by the
instrument, the reagents, calibrators, and controls used, a brief description of the major
components, and how to work with the software.
r Chapter 2, OPERATION PRINCIPLES
Contains the descriptions for cell counting and voting and how the parameters are
derived.
r Chapter 3, SPECIFICATIONS/CHARACTERISTICS
Details instrument specifications, characteristics, and interfering substances.
C
•T 5diff analyzer to your laboratory’s host computer.
PN 4237615B
r Chapter 4, PRECAUTIONS/HAZARDS
Provides information about key safety issues and contains information on biological
hazards and hazards pertaining to moving parts.
r Chapter 5, RUNNING SAMPLES
Provides information on how to run patient blood samples.
xvii
Page 18

INTRODUCTION
ABOUT THIS MANUAL
r Chapter 6, REVIEWING RESULTS
Provides information on reviewing flagged sample results.
r Chapter 7, CALIBRATION
Provides procedures for calibrating the instrument, including manually adjusting the
calibration factors.
r Chapter 8, DIAGNOSTICS
Provides information about special procedures and troubleshooting procedures for the
instrument. Includes topics such as a maintenance schedule, cleaning and replacement
procedures, and what error messages mean.
r Appendix A, INSTRUMENT SETUP
Provides procedures on customizing the instrument’s settings, such as date/time,
reporting units, laboratory limits, and others.
r Appendix B, LOG SHEETS
Contains log sheets for your laboratory’s use.
r Appendix C, MANUAL CALIBRATION
Provides a procedure for manually calibrating the instrument.
r Appendix D, TROUBLESHOOTING FLOWCHART
Provides supplemental troubleshooting information.
r Appendix E, TRAINING CHECKLIST
Summarizes what must be done after the instrument is installed.
r Appendix F, BARCODE SPECIFICATIONS
Defines the specifications that barcode labels must meet for use with the instrument.
r REFERENCES
Lists references used in this manual.
r GLOSSARY
Defines terminology used in this manual.
r ABBREVIATIONS
Defines abbreviations used in this manual.
r INDEX
Provides page numbers for indexed information.
xviii
PN 4237615B
Page 19
CONVENTIONS
This manual uses the following conventions:
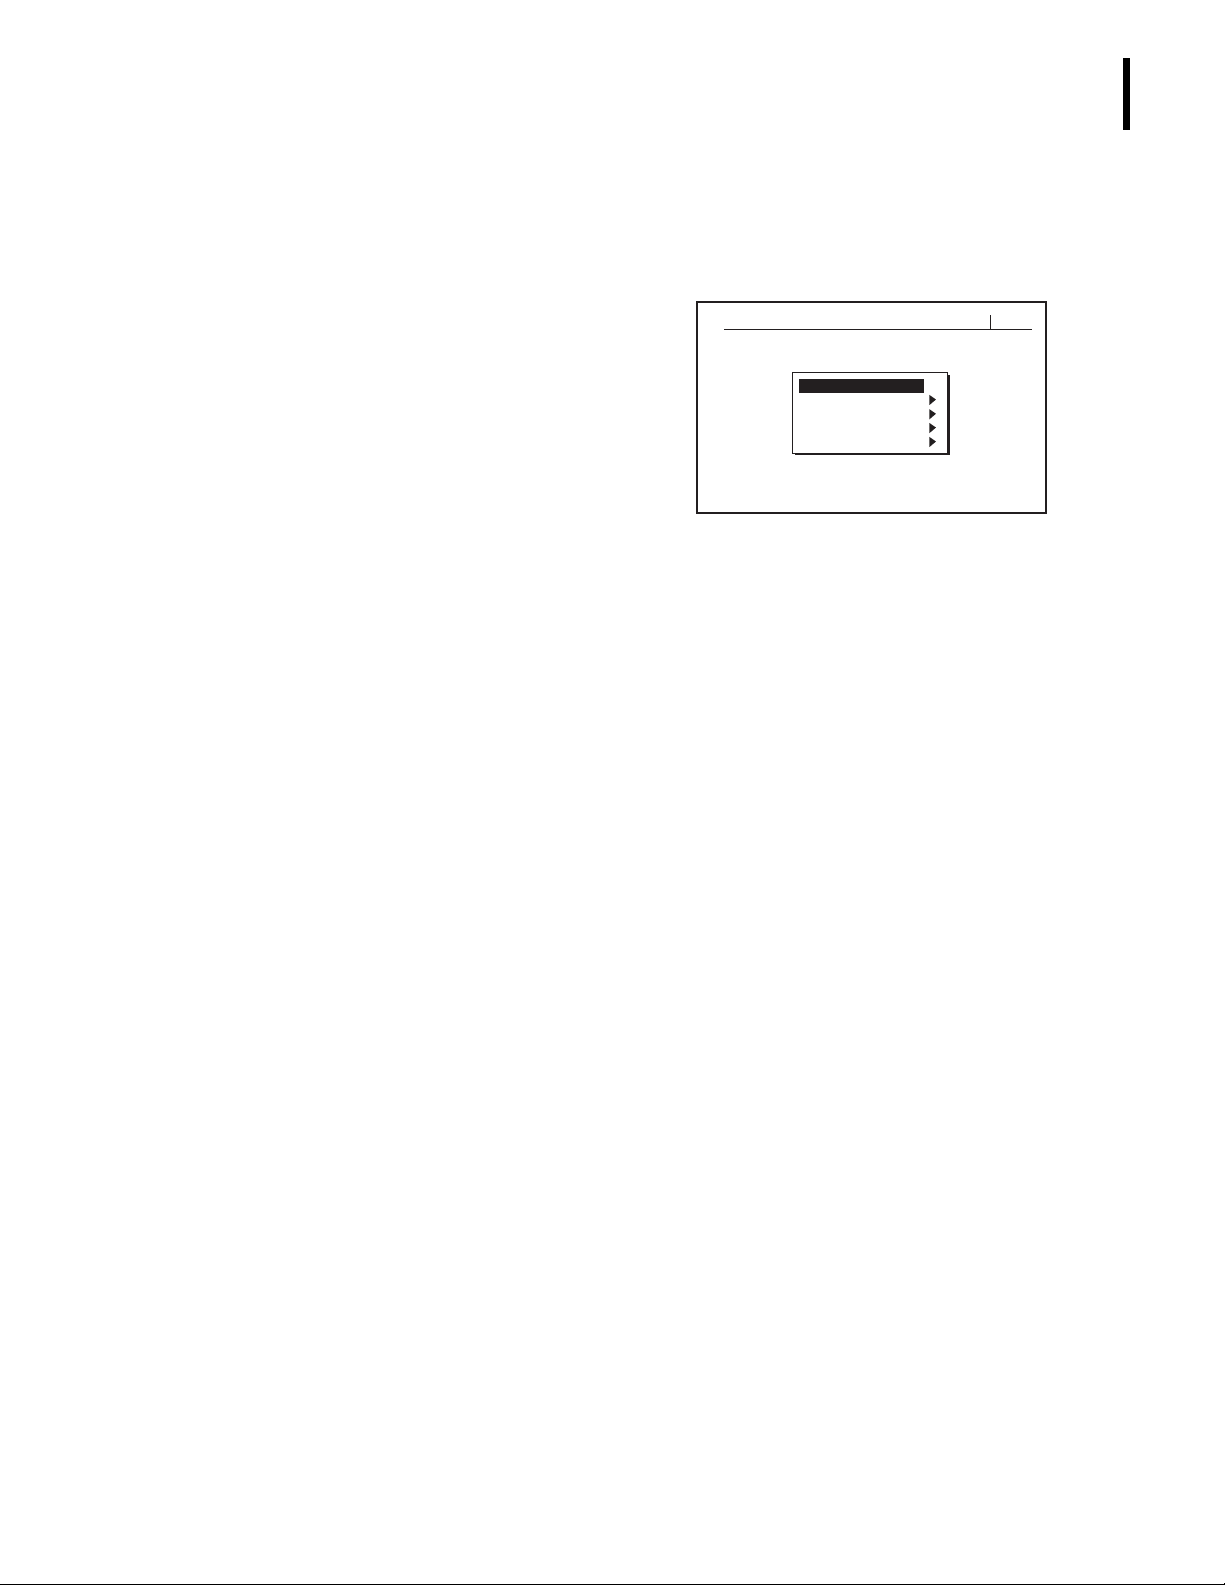
r Main Menu refers to the initial menu
r When instructed to make a menu selection, the text appears in bold with two symbols
INTRODUCTION
CONVENTIONS
displayed on the instrument after
16:0512/07/99MAIN MENU
Startup.
1 - RUN SAMPLES
2 - CALIBRATION
3 - REAGENTS
4 - DIAGNOSTICS
5 - SETUP
to distinguish the menu path. For example, if instructed to choose Calibration, then
Autocalibration, the text will appear as
CALIBRATION
AUTOCALIBRATION.
tt
GRAPHICS
r
Bold font
indicates a menu option, such as
SETUP
.
r Italics font indicates screen text displayed on the instrument, such as
Calibration Passed.
Bold, italics font
r
be instructed to do the Startup procedure, which would appear as “Do
r Instrument refers to the A
indicates a heading name within this document. For example, you may
Startup
”.
C
•T 5diff hematology analyzer.
r A Note contains information that is important to remember or helpful when
performing a procedure.
r Motherboard refers to the main card (board) in the instrument.
r RBC bath is sometimes referred to as RBC/Plt bath.
C
r A
r A
r A
r A
r A
•T 5diff Rinse reagent is sometimes referred to as Rinse.
C
•T 5diff Fix reagent is sometimes referred to as Fix.
C
•T 5diff Hgb Lyse reagent is sometimes referred to as Hgb Lyse.
C
•T 5diff WBC Lyse reagent is sometimes referred to as WBC Lyse.
C
•T 5diff Diluent reagent is sometimes referred to as Diluent.
All graphics, including screens and printouts, are for illustration purposes only and must not
be used for any other purpose.
PN 4237615B
xix
Page 20
INTRODUCTION
SYMBOLS
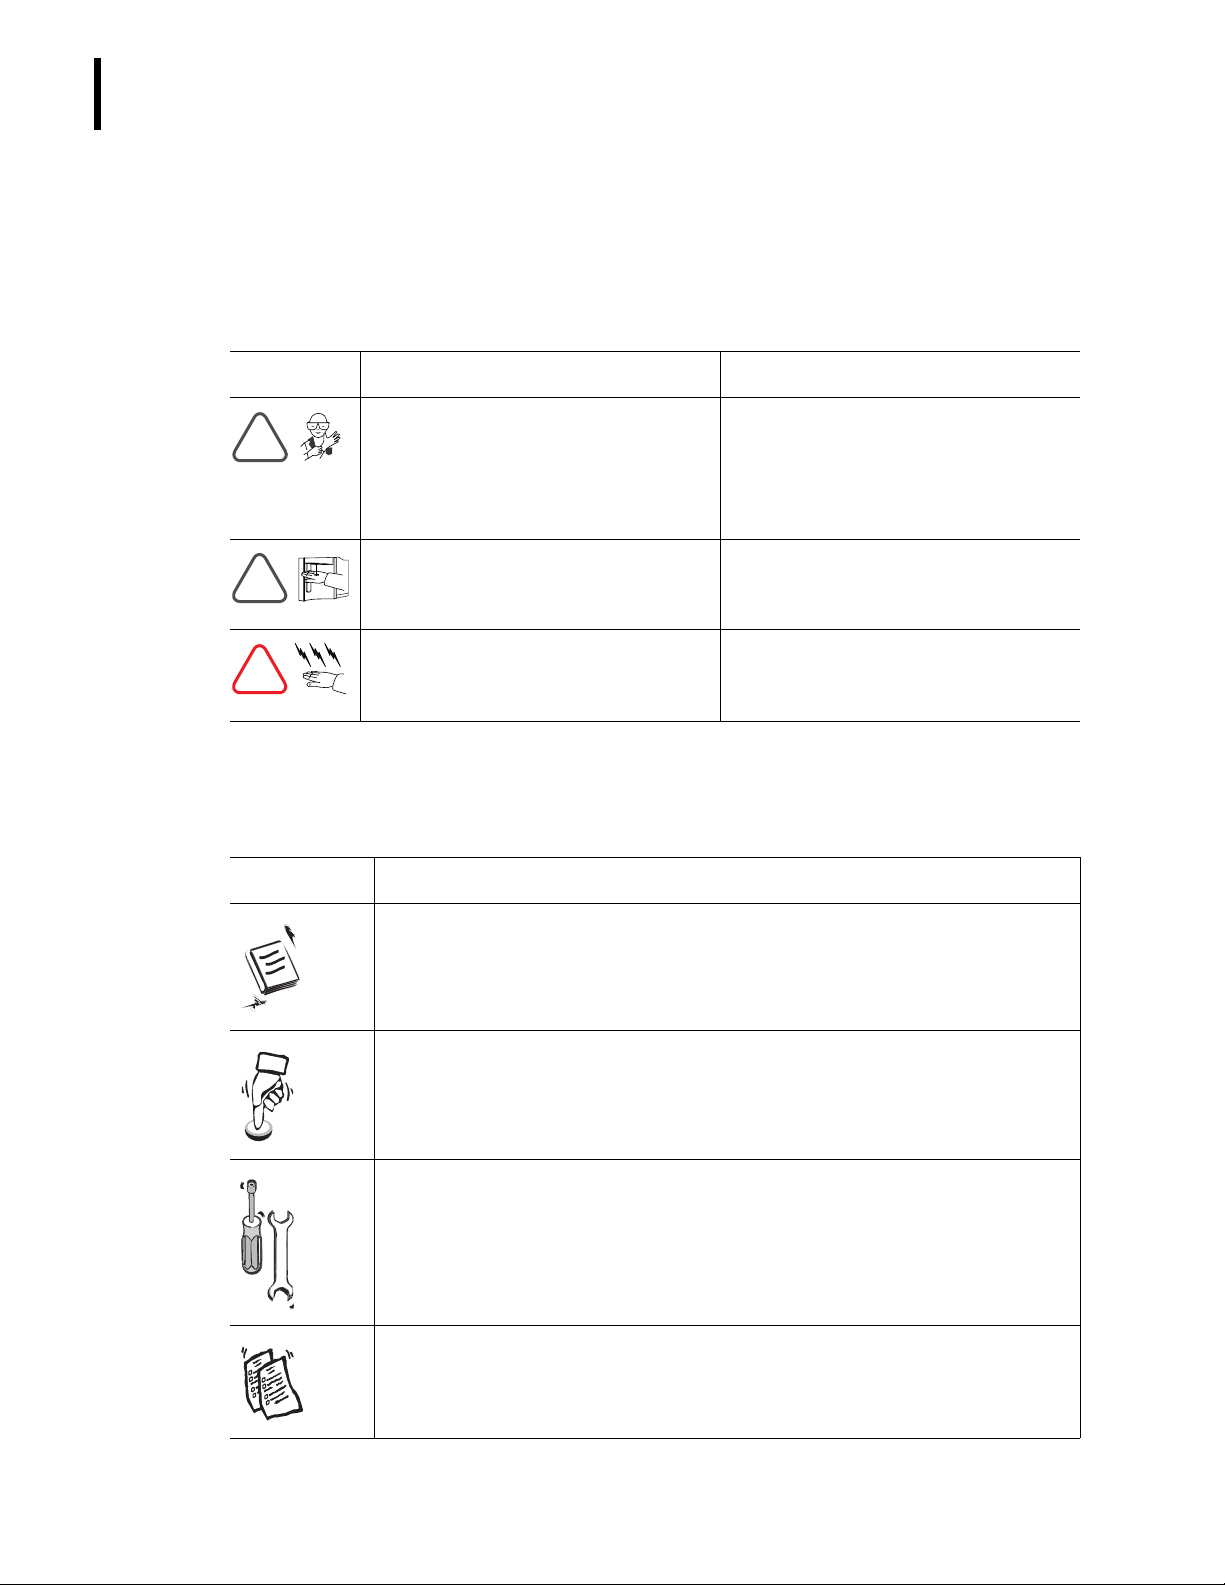
SYMBOLS
Safety Symbols
Safety symbols alert you to potentially dangerous conditions. These symbols, together with
text, apply to specific procedures and appear as needed throughout this manual.
Symbol Warning Condition
Biohazard
!
!
!
(specimens, reagents, controls, and
calibrators, and so forth) and areas
these materials come into contact
with as being potentially infectious.
Probe hazard.
may contain biohazardous materials,
such as controls and calibrators.
Electrical shock hazard
electrical shock when instrument is
plugged in to the power source.
.
Consider all materials
The probe is sharp and
.
Possibility of
Action
Wear standard laboratory attire and
follow safe laboratory procedures
when handling any material in the
laboratory.
Avoid any unnecessary contact with
the probe and probe area.
Before continuing, unplug the
C
A
•T 5diff analyzer from the
electrical outlet.
Tab Symbols
Tabs divide this document into four sections: reference, operation, special procedures and
troubleshooting, and appendices. Each tab reflects a unique symbol.
Symbol Definition
Identifies the reference section.
xx
Identifies the operating instructions section.
Identifies the special procedures and troubleshooting section.
Identifies the appendices section.
PN 4237615B
Page 21
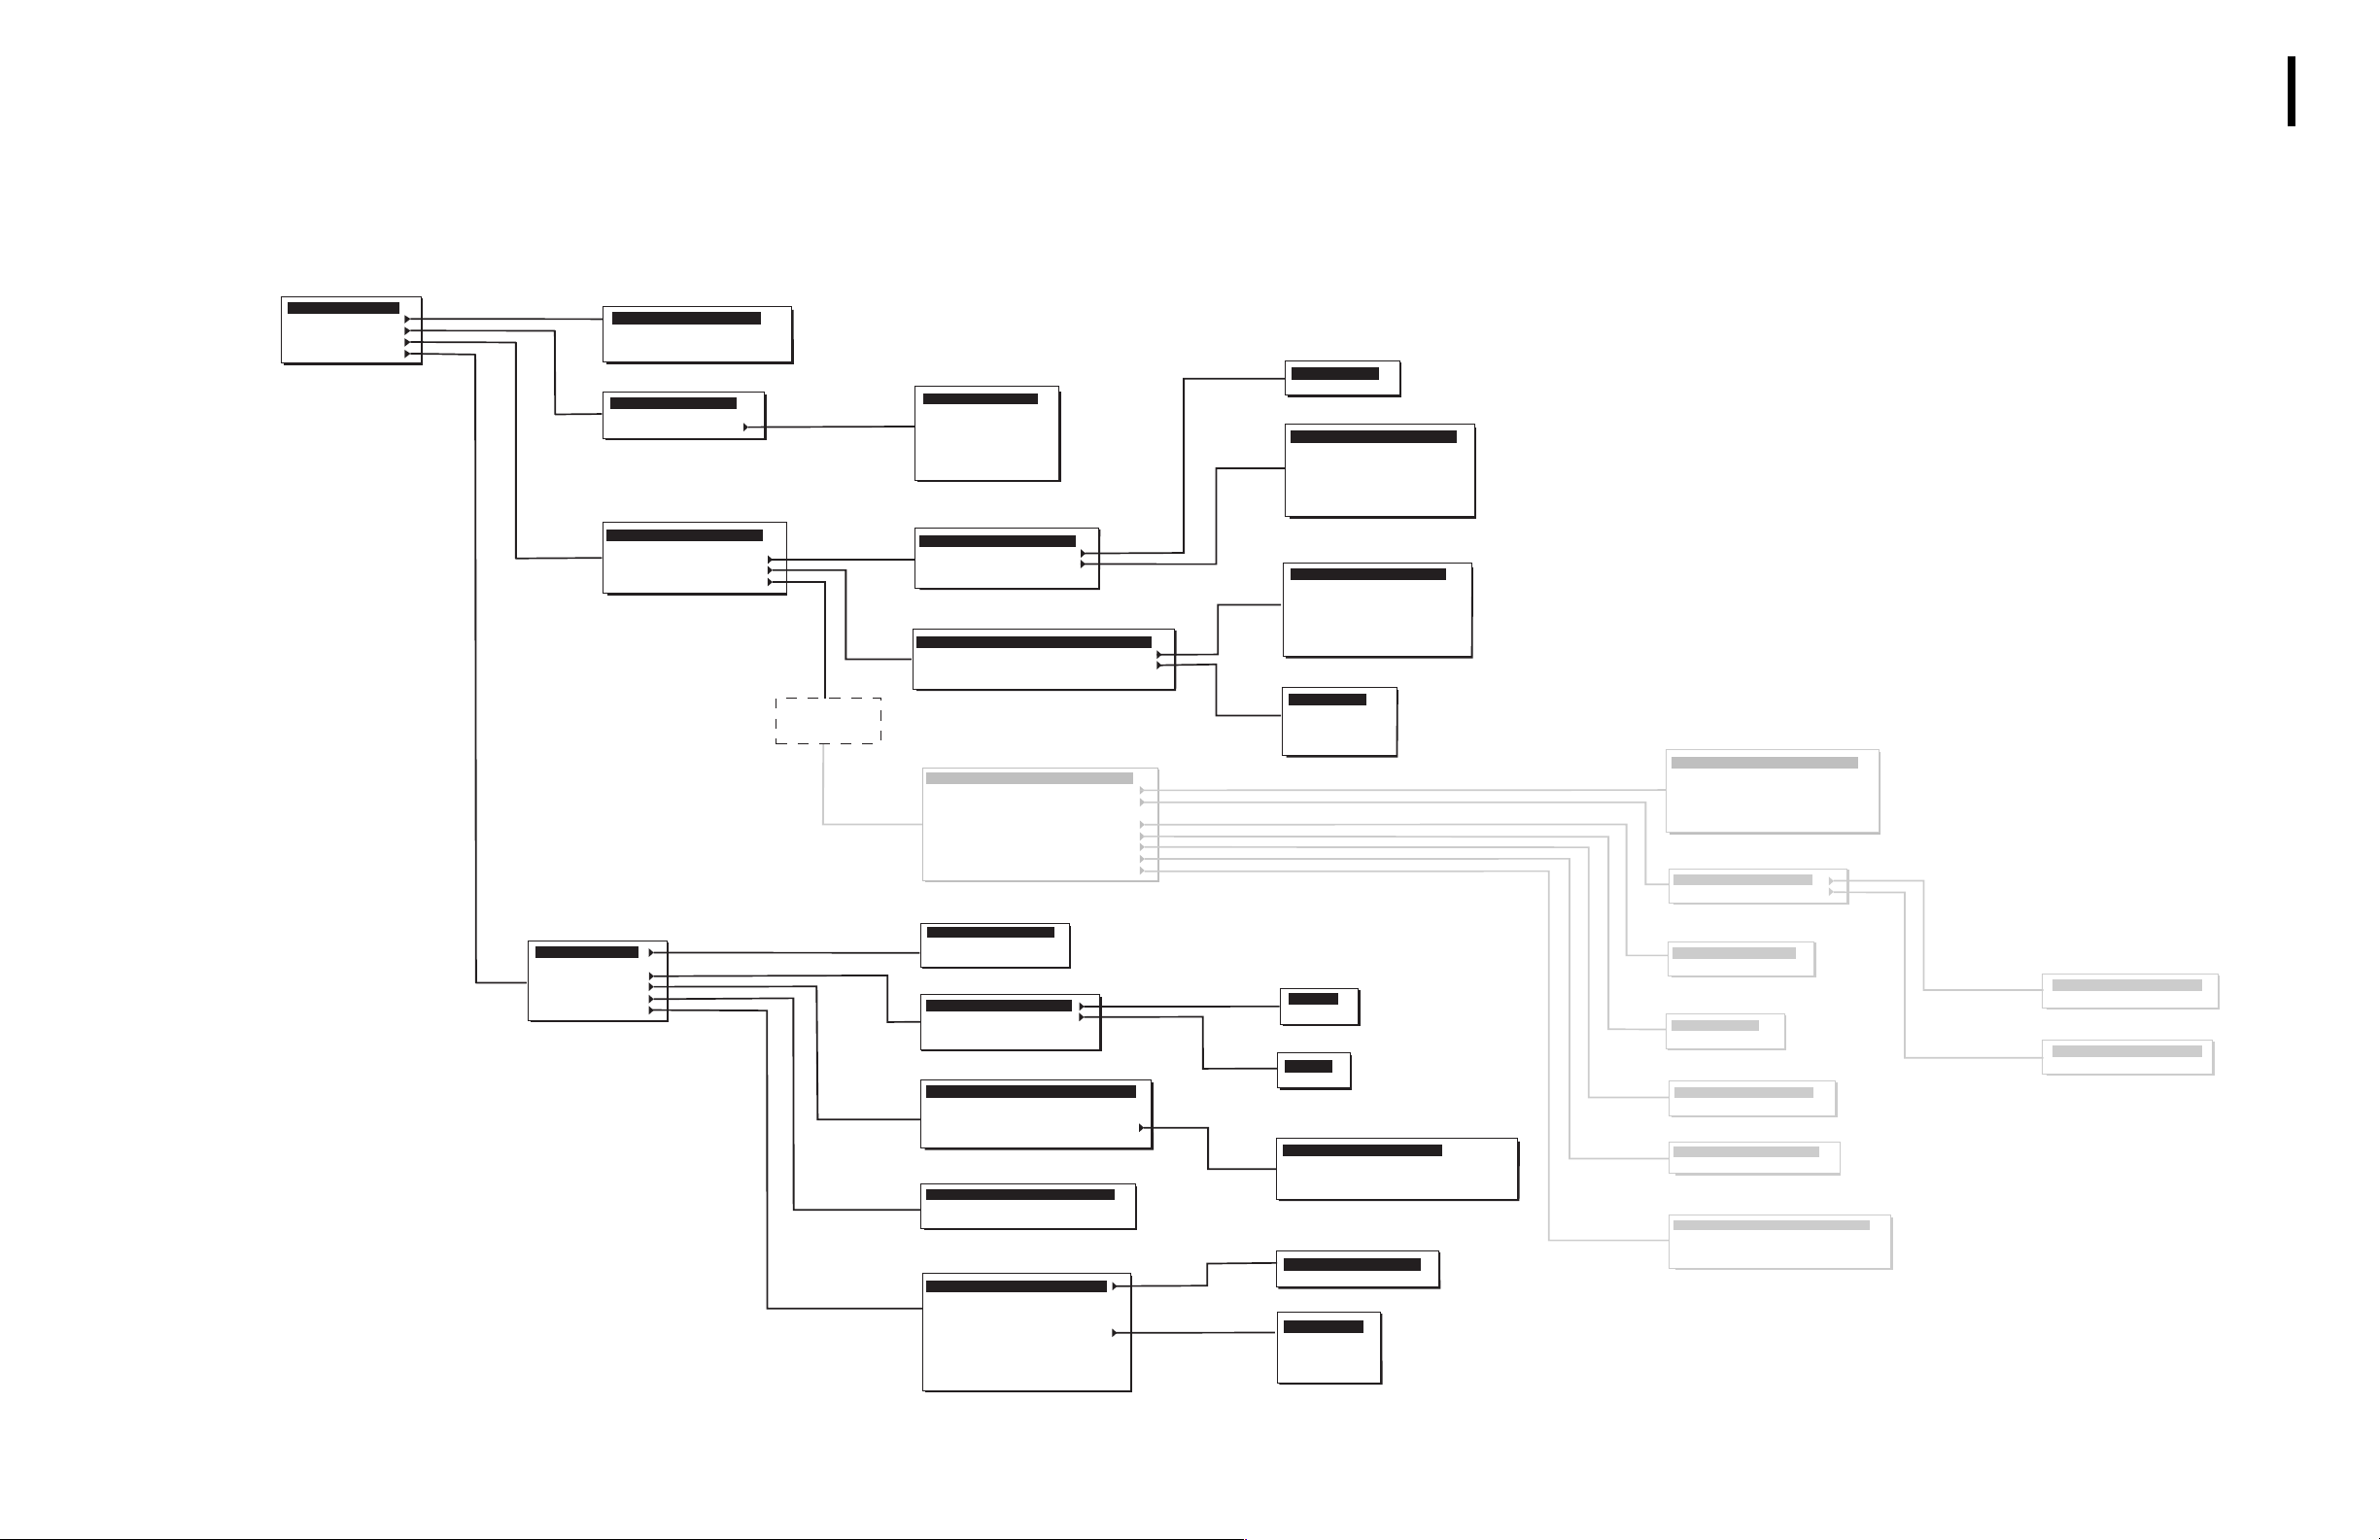
MENU TREE
The functions of the instrument are programmed into its software.
MENU TREE
MAIN MENU
1 - RUN SAMPLES
2 - CALIBRATION
3 - REAGENTS
4 - DIAGNOSTICS
5 - SETUP
SETUP
1 - DATE / TIME
2 - UNITS
3 - LAB. LIMITS
4 - HOST SETUP
5 - PRINTER
6 - OTHERS
* Consult a Beckman Coulter
representative before selecting this
option.
Service password required
CALIBRATION
1 - AUTOCALIBRATION
2 - CAL FACTORS
3 - PRINT CAL FACTORS
4 - REPRODUCIBILITY
REAGENTS
1 - LEVEL-CHANGE
2 - DAILY WORKLOAD
3 - PRIME
DIAGNOSTICS
1-SYSTEM RESET CYCLE
2-MINI PRIME
3-DILUTER SYSTEMS
4-HARDWARE SYSTEMS
5-SERVICE
SERVICE
PASSWORD
REQUIRED
PRIME
1- DILUENT
2 - FIX
3 - WBC LYSE
4 - HGB LYSE
5 - RINSE
6 - ALL REAGENTS
7 - UNPRIME ALL
DILUTER SYSTEMS
1-BACKFLUSH
2-RINSE
3-DRAIN BATHS
4-EXTENDED CLEANING
HARDWARE SYSTEMS
1-HARDWARE RESET
2-MOTORS *
3-VALVES *
4-TRAVERSE SERVICE POSITION
SERVICE
1 - DILUTION
2 - MEASUREMENT
3 - HEATING SYSTEMS
4 - MIXING
5 - SENSOR CHECK
6 - VACUUM CHECK
7 - BURN-IN
8 - FLOWCELL WBC CALIBRATION
9 - OTHERS
SET DATE / TIME
1 - TIME FORMAT
2 - DATE FORMAT
3 - SET DATE & TIME
LAB. LIMITS
1 - PATIENT RANGES
2 - ACTION RANGES
3 - FLAGS SENSITIVITY
4 - THRESHOLDS
HOST SETUP
1 - HOST SETUP CONFIGURATION
2 - SENDING CONFIGURATION
3 - SENDING OPTIONS
4 - VARIABLE FORMAT SETUP
5 - SEND LATEST RESULT
PRINTER
1 - PRINTER CONFIGURATION
2 - INSTITUTIONNAL HEADER
3 - PRINT LATEST RESULT
OTHERS
1 - CALIBRATION
2 - IDENTIFICATION MODE
3 - AUTOCLEAN FREQUENCY
4 - CHANGE PASSWORD
5 - LANGUAGE
6 - REAGENT VOLUMES
7 - CYCLE COUNTS
8 - PRINT SYSTEM SETUP
9 - SEND SETUP
RINSE
1 - BATHS
2 - FLOWCELL
DRAIN BATHS
1 - RINSE
2 - FIRST DILUTION
3 - DIFF
4 - WBC / BASO
5 - RBC / PLT
6 - ALL BATHS
7 - DILUENT RESERVOIR
MOTORS
1 - SAMPLING PROBE
2 - TRAVERSE
3 - SAMPLING SYRINGE
4 - DRAINING SYRINGE
5 - COUNTING SYRINGE
6 - FLOWCELL SYRINGES
7 - DILUTION SYRINGES
VALVES
1 - 1 TO 11
2 - 12 TO 16
3 - 17 AND 18
4 - 20 TO 26
5 - 27 TO 31
PATIENT RANGES
1 - CBC
2 - DIFF
ACTION RANGES
1 - CBC
2 - DIFF
VARIABLE FORMAT SETUP
1 - NUMERICAL RESULTS
2 - FLAGS AND MESSAGES
3 - HISTOGRAMS AND THRESHOLDS
4 - PATIENT FILE
CALIBRATION
1 - CV% L I M I TS
2 - DEFINE OPERATOR
LANGUAGE
1 - ENGLISH
2 - FRENCH
3 - GERMAN
4 - SPANISH
5 - ITALIAN
MEASURMENT
1 - HGB BLANK ADJUSTMENT
2 - APERTURE CURRENT
3 - RBC / PLT GAIN
4 - WBC / BASO GAIN
5 - DIFF ADJUSTMENT
6 - PULSE ADJUSTMENT
HEATING SYSTEMS
1 - HEATING COIL
2 - BATH ENCLOSURE
SENSOR CHECK
1 - DRAINING
2 - DIFF TRANSFER
VACUUM CHECK
1 - COUNTING
2 - DRAINING
BURN - IN
1 - BURN - IN CYCLES
2 - ANALYSIS CYCLES
FLOWCELL WBC CALIBRATION
1 - AUTOCALIBRATION
2 - CAL FACTORS
OTHERS
1 - USER MODE
2 - CYCLE COUNTS
3 - PARK SYRINGES
4 - RESET TO DEFAULT VALUES
HEATING COIL
1 - ADJUSTMENT
2 - REFERENCE
BATH ENCLOSURE
1 - ADJUSTMENT
2 - REFERENCE
7615022B
PN 4237615B
xxi
Page 22

MENU TREE
xxii
xxii
PN 4237615B
Page 23
1.1 INTENDED USE
General
USE AND FUNCTION
1
1
C
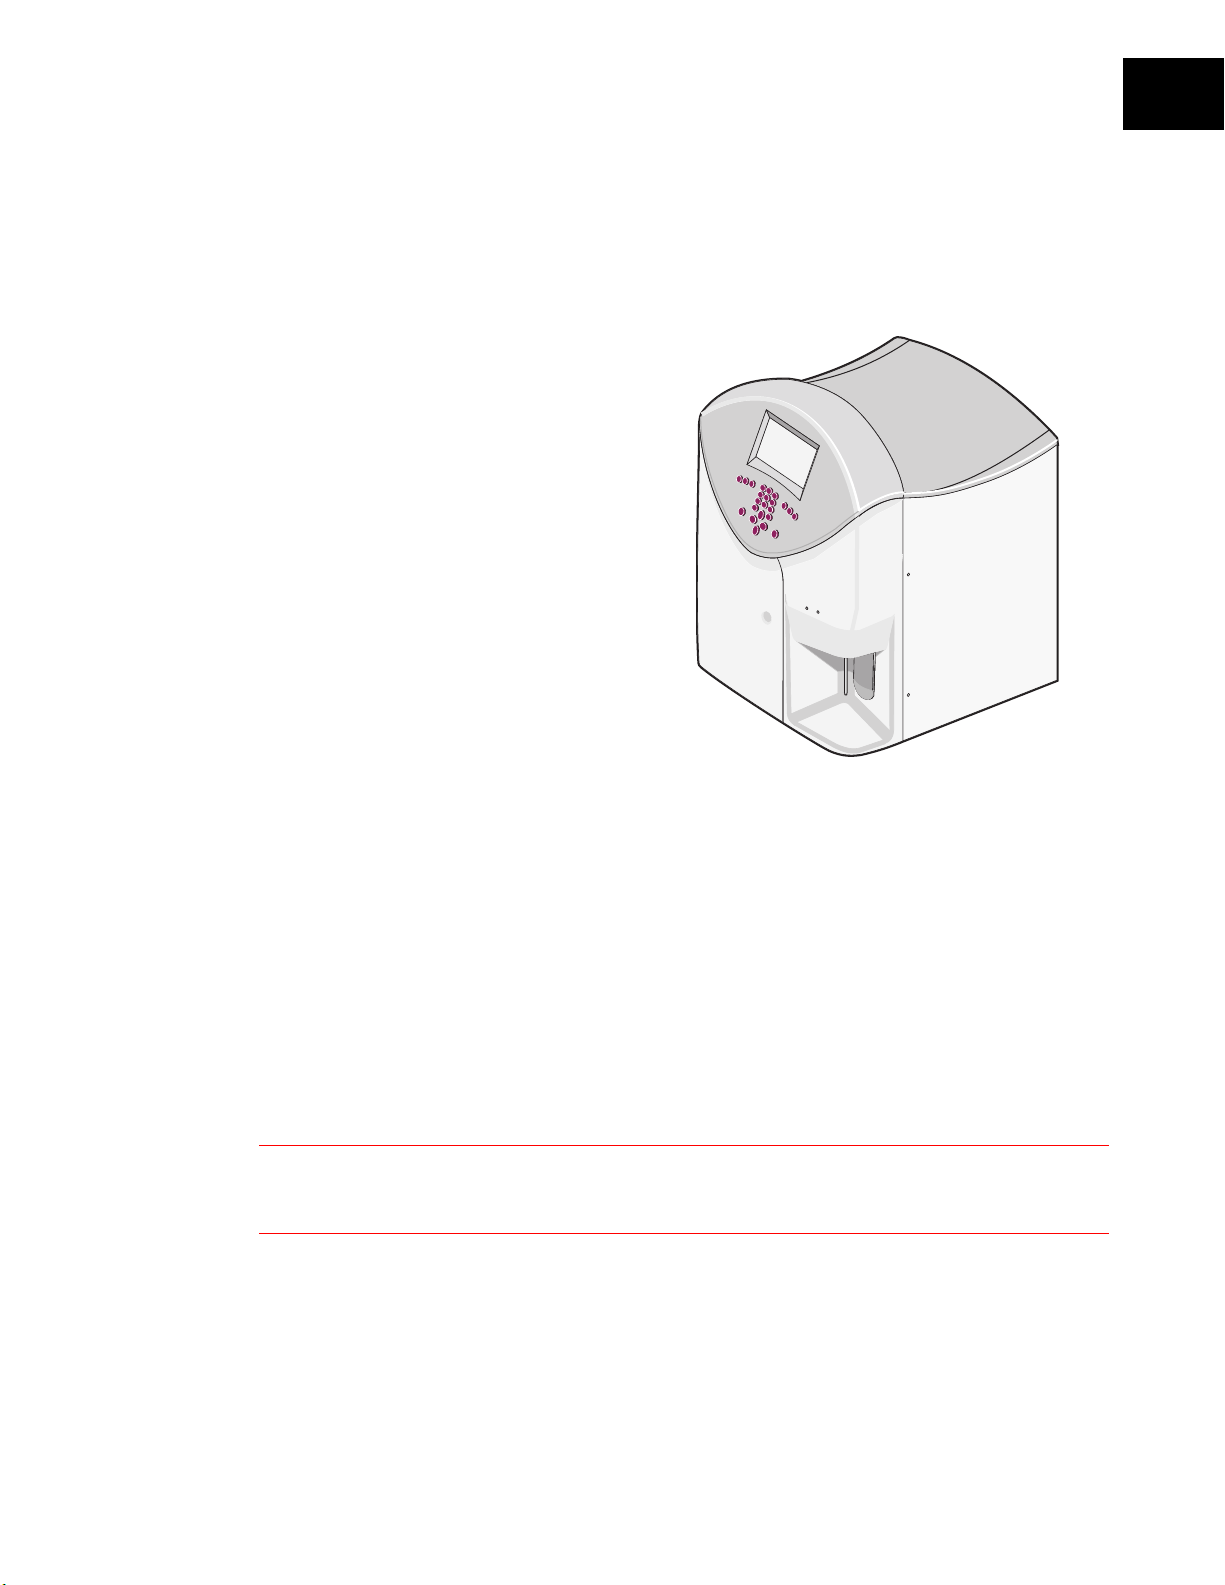
The Beckman Coulter A
hematology analyzer (Figure 1.1) is a
26-parameter, fully automated hematology
analyzer, including a five-part leukocyte
differential counter.
Of the 26 reported parameters:
r 20 parameters are
Diagnostic Use
MCV, MCH, MCHC, RDW, Plt, MPV,
NE%, NE#, LY%, LY#, MO%, MO#,
EO%, EO#, BA%, and BA#.
r 6 parameters are qualitative and are
For Research Use Only. Not for use in
diagnostic procedures
IMM%, IMM#, ATL%, and ATL#.
•T 5diff
For In Vitro
: WBC, RBC, Hgb, Hct,
.: Pct, PDW,
Figure 1.1 AC•T 5diff Analyzer
Purpose
The purpose of the AC•T 5diff hematology analyzer is to identify normal patient results with
all normal system-generated parameters and to flag or identify patient results that require
additional studies.
PN 4237615B
Instrument Description
r Figure 1.2 shows the outside of the instrument.
r Figure 1.3 shows the control panel.
r Figure 1.4 shows the back panel.
r Figure 1.5 shows the warning and caution labels on the instrument.
WARNING
operate the instrument. Ensure that all covers and doors are closed and secured before operating the
instrument.
Risk of operator injury when covers and doors are not closed and secured in place before you
1-1
Page 24
USE AND FUNCTION
g
1
INTENDED USE
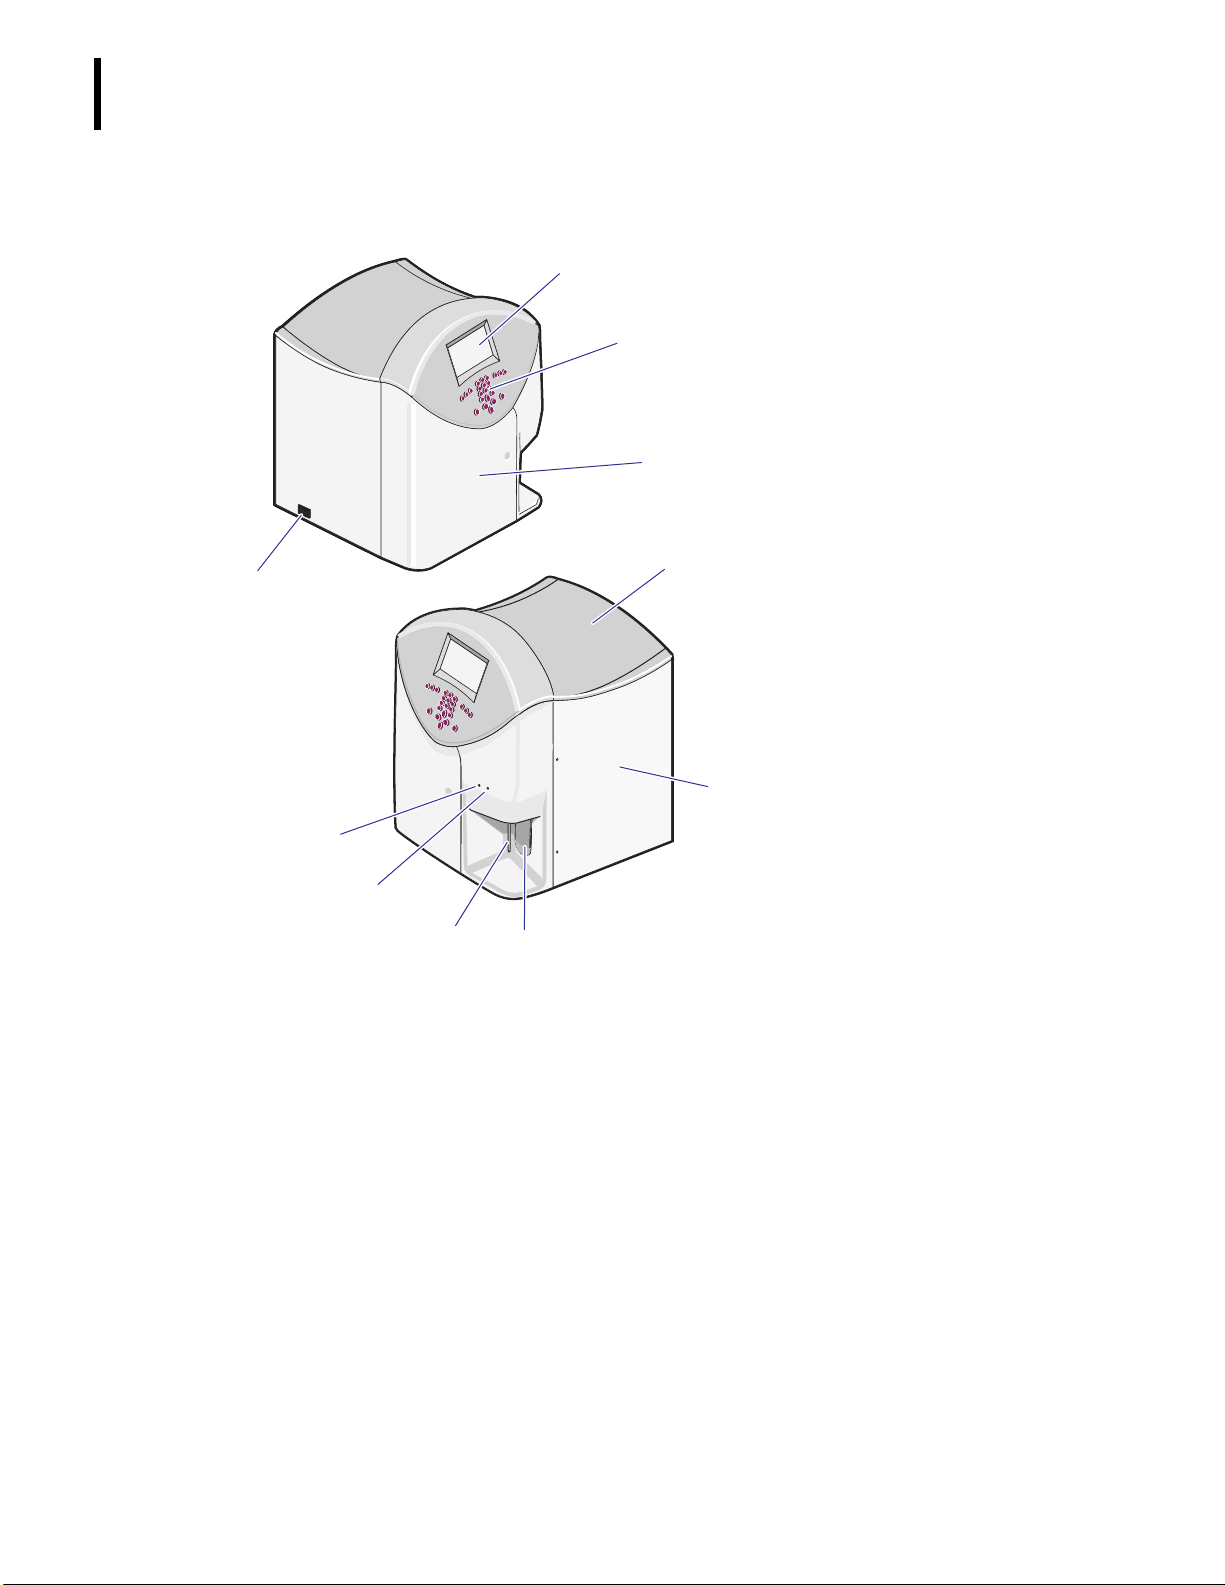
Figure 1.2 Outside View of the Instrument
)
b
c
d
e
LCD (liquid crystal display) screen
b
Control panel: allows you to
c
interface with the instrument. See
Control Panel
Door to reagents: allows you to
d
access the reagent bottles on
board.
Top cover
e
Door to pneumatics: allows you to
f
access the hydraulic parts for
maintenance procedures.
: The system will not operate
Note
when this door is open.
Aspirate switch: allows you to
g
start an analysis cycle.
for details.
Aspirate (sample) probe: aspirates
h
sample or control material from
tubes or vials.
Green LED (light-emitting diode):
i
f
j
i
indicates the instrument is ready.
Red LED: indicates the instrument
j
is busy.
ON/OFF switch
1)
h
1-2
PN 4237615B
Page 25
USE AND FUNCTION
Control Panel
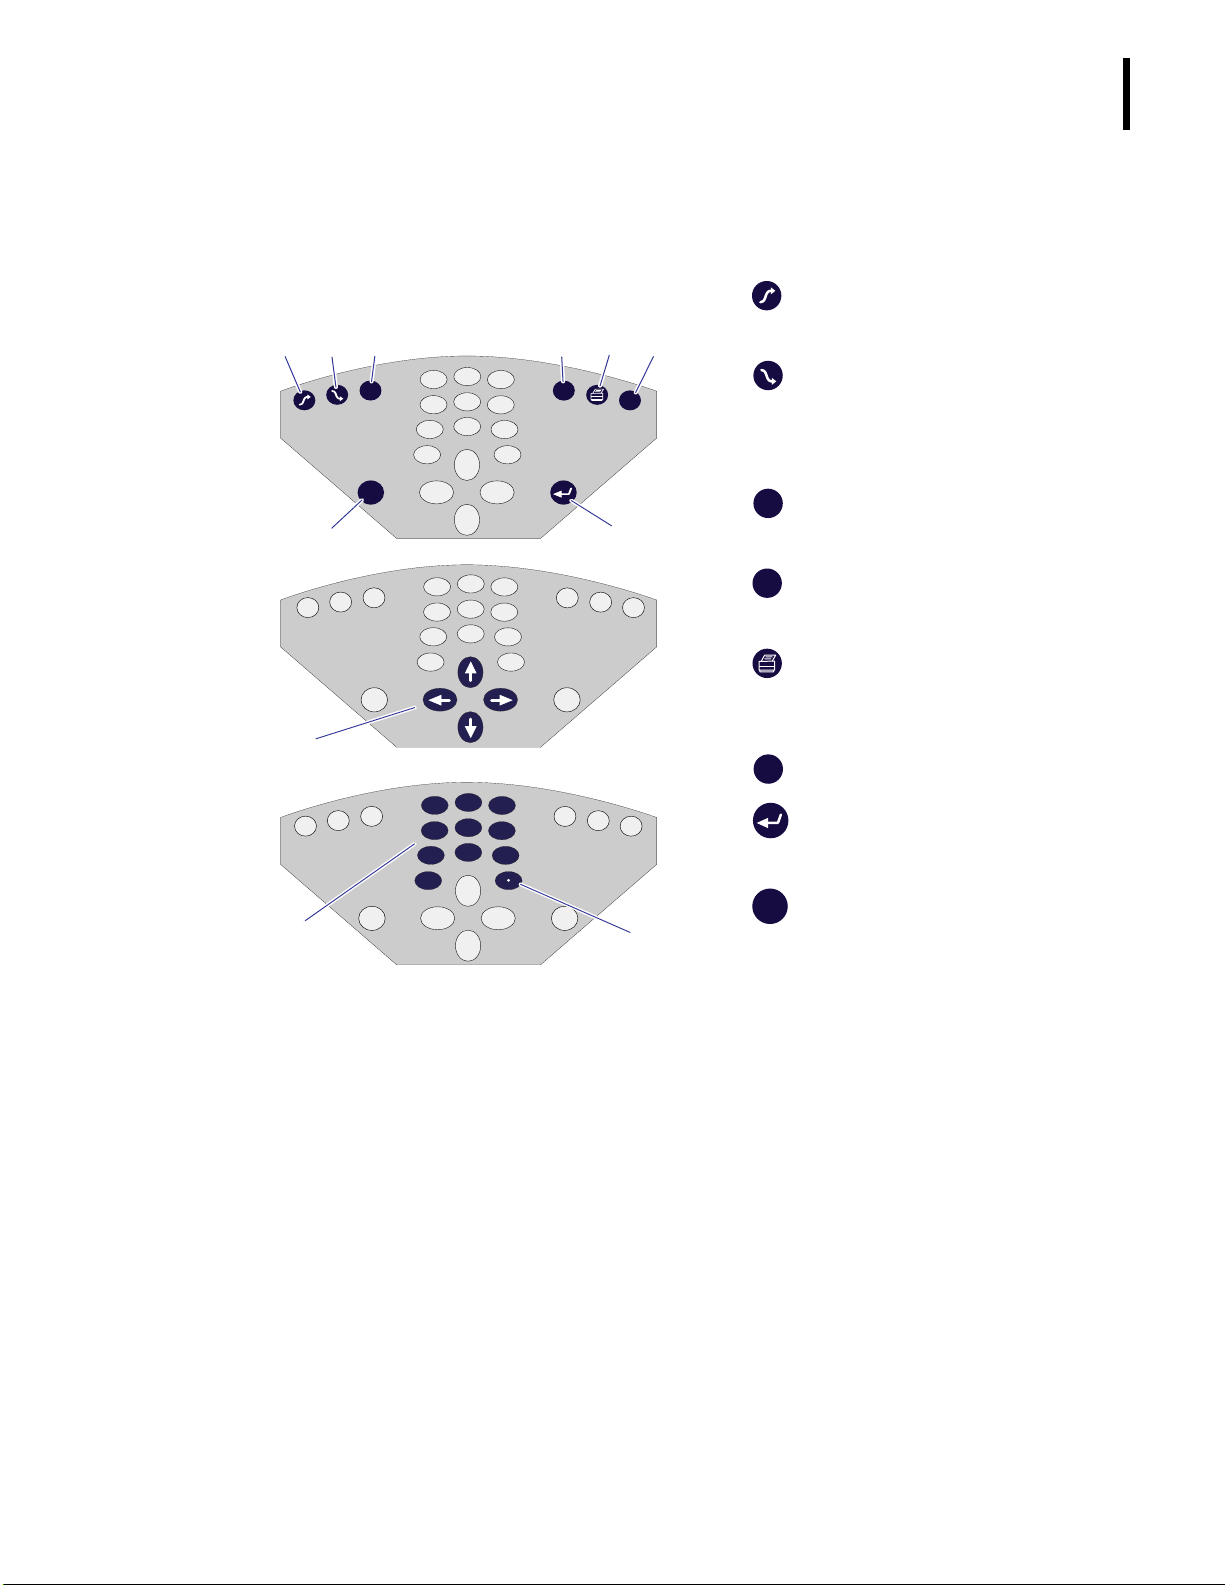
Use the control panel buttons (Figure 1.3) to setup and operate the instrument.
INTENDED USE
1
Figure 1.3 Control Panel Buttons
bcd efg
2
ESC
RANGE
1
4
7
0
3
5
6
8
CBC
DIFF
9
DEL
hi
2
1
4
7
0
3
5
6
8
9
j
2
1
4
7
0
1)
3
5
6
8
9
1!
7615006A
b
procedure, followed by a background count.
performs a prime and rinsing
Startup
c
Shutdown
typically done at the end of the day. The
instrument remains in stand-by mode with
the Rinse.
d
ESC
Escape
executing it and goes to the previous screen.
CBC
e
DIFF
Mode
CBC/DIFF modes.
performs a cleaning,
exits a function without
allows you to select CBC and
f
allows you to print the last sample
Print
result, calibration results, laboratory limits,
and so forth.
g
DEL
deletes the entered information.
Delete
h
executes a function or enters
Enter
data.
i
RANGE
used.
Cursor keys
j
and allow you to scroll through the alphabet
when entering information.
selects the flagging range to be
Range
move the cursor on the screen
PN 4237615B
Numeric keypad
1)
allows you to enter
numbers for dates, values, limits, sample
IDs, and to select menu items.
. Allows you to enter the decimal
Period
1!
number separator and to select/de-select
software options.
1-3
Page 26
USE AND FUNCTION
INTENDED USE
Back Panel
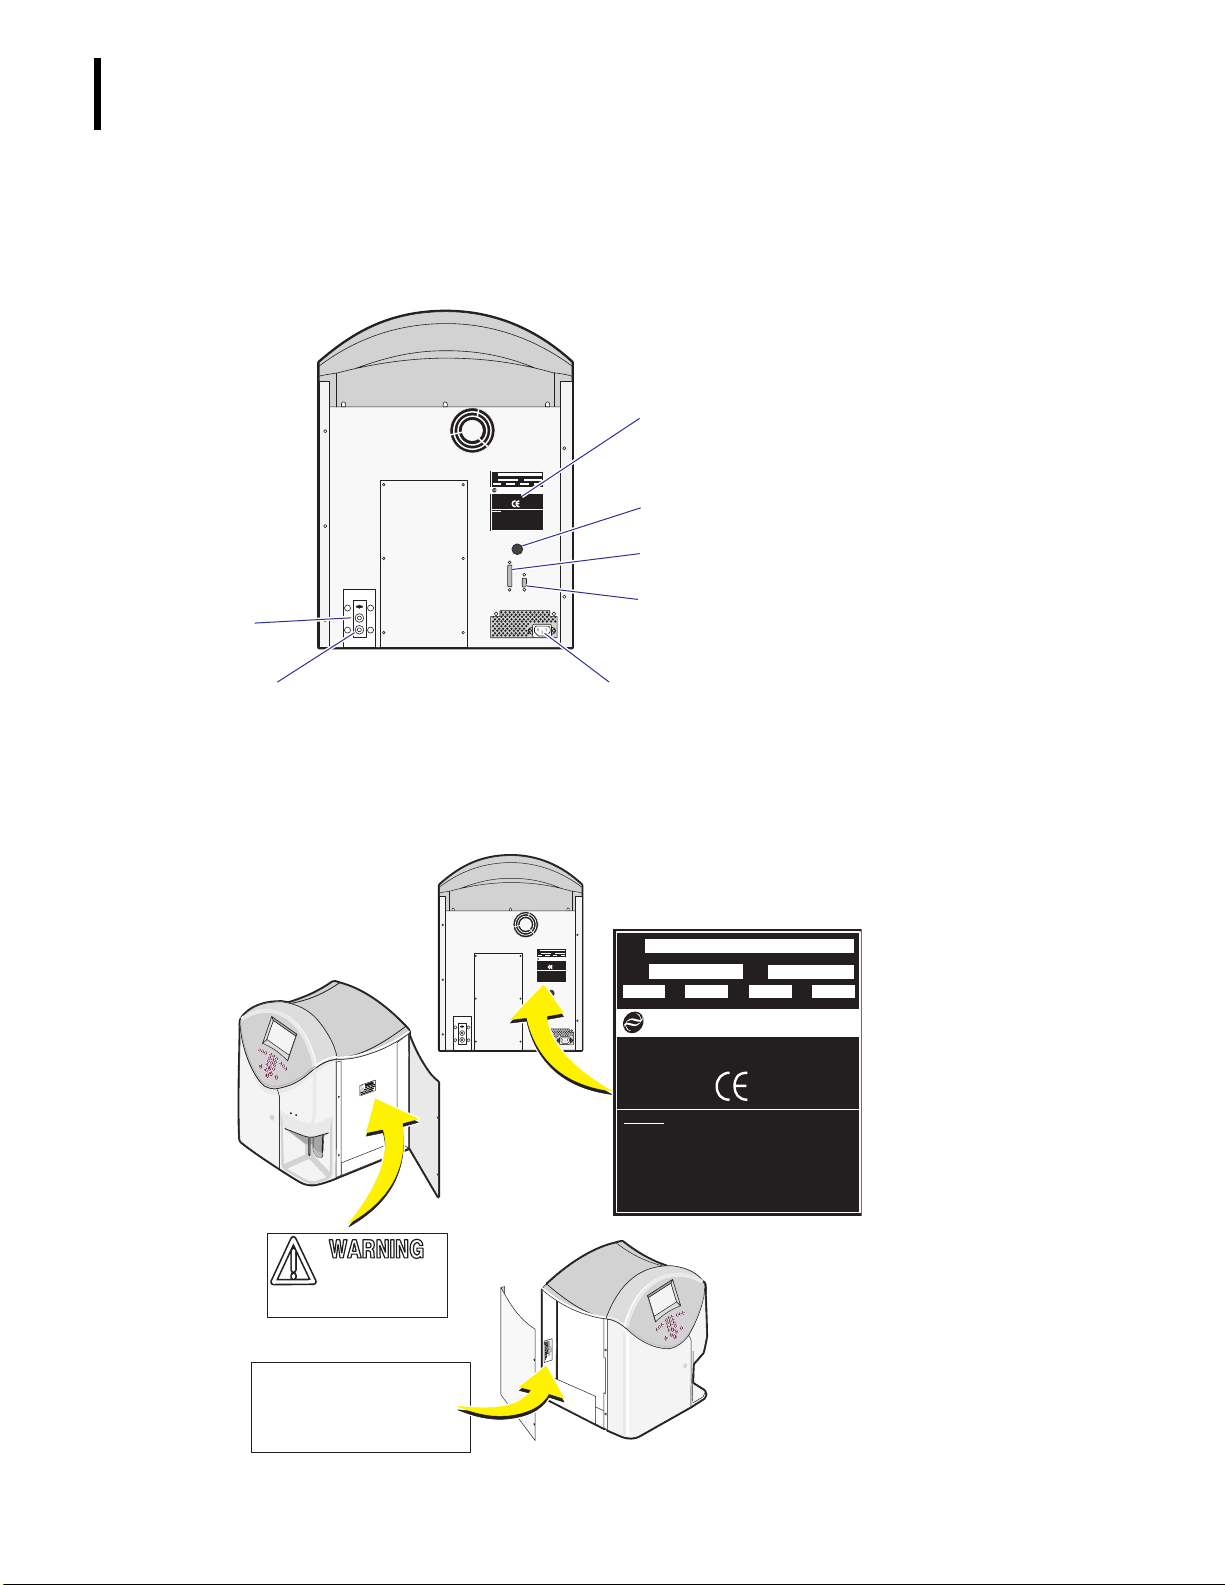
Figure 1.4 shows the instrument’s back panel.
Figure 1.4 Back Panel
MOD
NO.
ASSY
S/N
xxxxxx
xxxxxx
NO.
50/60100-240
VOLTS
HZ AMPS
MANUFACTURED BY COULTER CORPORATION
A BECKMAN COULTER COMPANY
B
ECKMAN
11800 SW 147 AVENUE, MIAMI, FLORIDA 33196-2500 U.S.A.
OULTER
C
PATTENTS ISSUED AND/OR PENDING
AUTOMATED DIFFERENTIAL CELL COUNTER
FOR IN VITRO DIAGNOSTIC USE
CAUTION:
TO REDUCE THE RISK OF ELECTRICAL SHOCK DO NOT REMOVE THE COVER
OR BACK.
REFER SERVICING TO QUALIFIED SERVICE PERSONNEL.
ELECTRIC SHOCK HAZARD. DISCONNECT UNIT FROM POWER SOURCE
PRIOR TO SERVICING.
FOR CONTINUED PROTECTION AGAINSTR FIRE HAZARD, REPLACE ONLY
WITH SAME TYPE AND RATING OF FUSE.
FOR SAFETY REASONS, EQUIPMENT REQUI4RES CONNECTION TO
PROTECTIVE EARTH GROUND.
Serial number label
b
Barcode reader connector
c
b
Printer connector
d
WATTS
c
d
Host RS 232 C Output connector
e
Power supply cord connector
f
Waste output connector
g
e
Diluent input connector
h
h
g
Warning and Caution Labels
Pay close attention to the labels on the instrument (Figure 1.5).
Figure 1.5 Warning and Caution Labels on the Instrument
MOD
NO.
ASSY
xxxxxx
NO.
VOLTS
B
ECKMAN
C
OULTER
AUTOMATED DIFFERENTIAL CELL COUNTER
FOR IN VITR O D IAG N O ST IC US E
CAUTION:
TO REDUCE THE RISK OF ELECTRICAL SHOCK DO NOT REMOVE THE COVER
OR BACK.
REFER SERVICING TO QUALIFIED SERVICE PERSONNEL.
ELECTRIC SHOCK HAZARD. DISCONNECT UNIT FROM POWER SOURCE
PRIOR TO SERVICING.
FOR CONTINUED PROTECTION AGAINSTR FIRE HAZARD, REPLACE ONLY
WITH SA M E TYPE A ND RA T IN G OF FUS E.
FOR SAFETY REASONS, EQUIPMENT REQUI4RES CONNECTION TO
PROTECTIVE EARTH GROUND.
f
MOD
c
T 5diff
A
•
S/N
xxxxxx
50/60100-240
WATTS
HZ AMPS
MANUFACTURED BY COULTER CORPORATION
A BECKMAN COULTER COMPANY
11800 SW 147 AVENUE, MIAMI, FLORIDA 33196-2500 U.S.A.
PATTENTS ISSUED AND/OR PENDING
NO.
ASSY
xxxxxx
NO.
VO LTS
CAUTIO N:
T O R E D U C E TH E R IS K O F E LE C T R IC A L S H O C K D O N O T R E M O V E T H E C O V E R
OR BACK.
REFER SERVICING TO QUALIFIED SERVICE PERSONNEL.
ELECTRIC SHOCK HAZARD. DISCONNECT UNIT FROM POW ER SOURCE
PRIO R TO SERVICING .
FOR CONTINUED PROTECTION AG AINSTR FIRE HAZARD, REPLACE O NLY
W IT H S A M E T Y P E A N D R A T IN G O F F U S E .
FOR SA FETY REASO NS, EQUIPMEN T REQU IRES CONNECTIO N TO
PROTECTIVE EARTH G ROUND.
50-60100-240
B
ECKMAN
C
OULTER
AUTOMATED DIFFERENTIA L CELL CO UNTER
F O R IN V IT R O D IA G N O S T IC U S E
S/N
xxxxxx
0.9-2.0 200
HZ AMPS
MANUFACTURED FOR BECKMAN COULTER INC.
11800 SW 147 AVENUE, MIAMI, FLORIDA 33196-2500 U.S.A.
PATENTS ISSUED AND/OR PENDING
MADE IN FRANCE
WATTS
1-4
T H IS A R E A M A Y C O N T A IN
B IO H A Z A R D O U S M A T E R IA L
REFER TO PRODUICT REFERENCE
MANUAL FOR PROPER HANDLING
ALL CO VER S/PANELS M UST BE
SECUR ED IN PLACE PRIO R TO
INSTRUM ENT OPER ATIO N.
REFER TO PRODUCT REFERENCE
MANUAL FOR PROPER INSTALLATIO N.
2429555
CAUTIO N
PN 4237615B
Page 27

USE AND FUNCTION
Modes
The instrument has two modes of analysis: CBC and CBC/DIFF. For information on the
parameters of each mode, see
Parameters
.
Parameters
CBC Mode
Table 1.1 lists the 12 parameters analyzed in the CBC mode.
Table 1.1 CBC Parameters
Parameter Definition
WBC White Blood Cell or leukocyte count
RBC Red Blood Cell or erythrocyte count
Hgb Hemoglobin concentration
Hct Hematocrit (relative volume of erythrocytes within the whole-blood
sample)
INTENDED USE
1
MCV Mean Corpuscular (erythrocyte) Volume
MCH Mean Corpuscular (erythrocyte) Hemoglobin
MCHC Mean Corpuscular (erythrocyte) Hemoglobin Concentration
RDW Red Cell (erythrocyte) Distribution Width
Plt Platelet or thrombocyte count
MPV Mean Platelet Volume
†
PDW
†
Pct
†
Pct and PDW are derived parameters and are For Research Use Only. Not for use in diagnostic procedures.
Platelet Distribution Width
Plateletcrit
PN 4237615B
1-5
Page 28

USE AND FUNCTION
INTENDED USE
CBC/DIFF Mode
Table 1.2 lists the 26 parameters analyzed in the CBC/DIFF mode:
Table 1.2 CBC/DIFF Parameters
Parameter Definition
WBC White Blood Cell or leukocyte count
NE%: Neutrophil percentage
NE#: Neutrophil number,
LY%: Lymphocyte percentage,
LY#: Lymphocyte number,
MO%: Monocyte percentage,
MO#: Monocyte number
EO%: Eosinophil percentage,
EO#: Eosinophil number,
BA%: Basophil percentage,
BA#: Basophil number
†
IMM%
IMM#
ATL%
ATL#
: Immature cell percentage
†
: Immature cell number
†
: Atypical lymphocyte percentage
†
: Atypical lymphocyte number
RBC Red Blood Cell or erythrocyte count
Hgb Hemoglobin concentration
Hct Hematocrit (relative volume of erythrocytes within the whole-blood sample)
MCV Mean Corpuscular (erythrocyte) Volume
MCH Mean Corpuscular (erythrocyte) Hemoglobin
MCHC Mean Corpuscular (erythrocyte) Hemoglobin Concentration
RDW Red Cell (erythrocyte) Distribution Width
Plt Platelet or thrombocyte count
MPV Mean Platelet (thrombocyte) Volume
PDW
Pct
†
†
Platelet Distribution Width
Plateletcrit
†
Derived parameters are For Research Use Only. Not for use in diagnostic procedures.
Features
Features of the instrument include automated calibration, one-button aspiration with probe
wipe, 12- or 26-parameter analysis with histograms and DiffPlots, and alphanumeric or
barcode patient sample identification.
Reports
Patient sample reports are printed based on your instrument setup.
1-6
PN 4237615B
Page 29

1.2 CONTROLS AND CALIBRATORS
Cell Controls
AC•T 5diff Control is available in three levels (low, normal, and high) to provide a stable
reference control for use with this instrument.
Calibrator
AC•T 5diff Cal Calibrator is a recommended alternative to the whole-blood reference method
of calibration and is traceable to reference methods and materials. Use A
Calibrator to ensure accurate instrument measurements for WBC, RBC, Plt, Hct, and Hgb.
1.3 REAGENTS
Beckman Coulter recommends these reagents:
C
r A
r A
r A
r A
r A
•T 5diff Diluent,
C
•T 5diff Fix,
C
•T 5diff WBC Lyse,
C
•T 5diff Hgb Lyse, and
C
•T 5diff Rinse.
USE AND FUNCTION
CONTROLS AND CALIBRATORS
C
•T 5diff Cal
1
These reagents are:
r Registered by the AFSSAPS (Agence Francaise de sécurité sanitaire des produits de
santé) and are For In Vitro Diagnostic Use.
r Manufactured by Coulter Corporation, Inc., Miami, Florida USA, and distributed by
Beckman Coulter France, SA 33 rue des Vanesses BP 50359 Villepinte 95942 Roissy CDG
Cedex.
All stated performance characteristics in this manual are based on the use of the A
C
•T 5diff
analyzer with the above-referenced reagents. Refer to the reagent’s bottle/container label for
detailed information, such as stability, before using the reagent.
ATTENTION:
The open container stability on the reagent labeling applies only to the reagent
when connected to the instrument with approved reagent pickups and caps.
For information on handling reagent waste, see
Waste Container
.
Waste Handling Procedures
Replacing the
and
PN 4237615B
1-7
Page 30

USE AND FUNCTION
REAGENTS
AC•T 5diff Diluent
WARNING
water. Sodium azide preservative may form explosive compounds in metal drain lines. [See National
Institute for Occupational Safety and Health Bulletin: Explosive Azide Hazards (8/16/76).] When disposing
of reagents down the drain, flush with large volumes of water.
Risk of explosion if sodium azide is not properly flushed down the drain with large volumes of
Used for counting and differentiating blood cells, AC•T 5diff Diluent is clear and odorless.
Composed of stabilized saline solution containing an organic buffer and less than 0.1%
sodium azide, A
Dilutes whole-blood samples,
r
Stabilizes cell membranes for accurate counting and sizing,
r
Conducts aperture current, and
r
Rinses instrument components between analyses.
r
C
•T 5diff Diluent:
Handle as indicated in this manual. To be used at ambient temperature from 18°C to 25ºC up
to the expiration date indicated on the packaging.
AC•T 5diff Fix
Used to lyse erythrocytes, fix leukocytes, and differentially stain granules of monocytes,
neutrophils, and eosinophils, A
alcohol. A
C
•T 5diff Fix is composed of an alcohol solution containing propylene-glycol, a
formic dye, buffers, alkaline salts, wetting agents, and an aldehyde preservative.
C
•T 5diff Fix is a deep blue aqueous solution that smells like
Handle as indicated in this manual. To be used at ambient temperature from 18°C to 25ºC up
to the expiration date indicated on the packaging.
AC•T 5diff WBC Lyse
Used to lyse red blood cells for the leukocyte count and to differentiate poly-nuclear
basophils, A
C
•T 5diff WBC Lyse is a colorless, aqueous solution. It is composed of an acidic
solution containing a lytic agent.
Handle as indicated in this manual. To be used at ambient temperature from 18°C to 25ºC up
to the expiration date indicated on the packaging.
AC•T 5diff Hgb Lyse
Used to lyse blood cells and to determine hemoglobin concentration, AC•T 5diff Hgb Lyse is a
clear, aqueous solution and is composed of potassium cyanide at 0.035, a quarternary
ammonium salt, and a saline phosphate buffer containing less than 0.1% sodium azide.
Handle as indicated in this manual. To be used at ambient temperature from 18°C to 25ºC up
to the expiration date indicated on the packaging.
AC•T 5diff Rinse
Used as a rinsing agent, AC•T 5diff Rinse is a transparent liquid composed of an enzymatic
solution with proteolytic action.
1-8
Handle as indicated in this manual. To be used at ambient temperature from 18°C to 25ºC up
to the expiration date indicated on the packaging.
PN 4237615B
Page 31

USE AND FUNCTION
Waste Handling Procedures
Consult the material safety data sheets (MSDS) for additional reagent information. To order
an MSDS, see
Neutralizing the Waste and Treating for Biohazards
Do this procedure before capping the waste container for disposal.
Heading 1.8, ORDERING MATERIAL SAFETY DATA SHEETS (MSDS)
.
REAGENTS
1
WARNING
neutralized before the waste container is capped.
Non-neutralized waste contents may produce
gas, which can build up pressure in a capped
container. Neutralize waste contents after
removing the waste container and before
capping it for disposal.
1
2
Risk of personal injury if waste is not
For 20L of waste liquid, add the
following to the waste container:
a. 50mL of Sodium Hydroxide
solution 200g/L to prevent gas
from forming.
b. 250mL of Sodium Hypochlorite
solution (12% available chlorine)
to treat waste for biohazards.
Cap the waste container and firmly
tighten the cap to prevent waste
contents from escaping.
PN 4237615B
Dispose of the waste container
3
according to your laboratory’s
guidelines.
1-9
Page 32

USE AND FUNCTION
PRINTER
Handling Expired Reagents
Do this procedure to eliminate cyanides from expired A
1
2
For 1L of reagent, add:
a. 50mL of Sodium Hydroxide
solution 200g/L.
b. 100mL of freshly prepared
Ammonium Persulfate solution
500g/L or 50mL of Sodium
Hydroxide solution 500g/L.
c. 500mL of Sodium Hypochlorite
solution (30% available chlorine).
Dispose of expired reagents according
to your laboratory’s guidelines.
C
•T 5diff Hgb Lyse.
1.4 PRINTER
Use the printer supplied or approved by Beckman Coulter.
1.5 RANGES
The instrument provides the ability to define three separate sets of flagging criteria.
r Range 1 selects Patient Range 1 and Action Range 1.
r Range 2 selects Patient Range 2 and Action Range 2.
r Range 3 selects Patient Range 3 and Action Range 3.
This means that if you select Range 2, the sample results will be reported and flagged
according to Patient Range 2 and Action Range 2.
Remember these range associations when establishing your laboratory limits and when
selecting a range for analysis.
1-10
PN 4237615B
Page 33

1.6 WORKING WITH THE SOFTWARE
When working with the instrument’s software, be sure you understand the basics of:
r Moving the Cursor,
r Selecting Menu Items,
r Erasing Saved Text, and
r Selecting/De-selecting Software Fields.
Moving the Cursor
To move the software cursor, press the appropriate cursor key: , , , or .
Selecting Menu Items
There are two ways to select a menu item:
USE AND FUNCTION
WORKING WITH THE SOFTWARE
1
r Press the number on the numeric
keypad that corresponds to the menu
item you want to select.
For example, to select
from the Main Menu, press
CALIBRATION
C
at
the numeric keypad.
OR
r Highlight the menu item by pressing
or , then press .
For example, to select
CALIBRATION
from the Main Menu,
press and .
16:0512/07/99MAIN MENU
1 - RUN SAMPLES
2 - CALIBRATION
3 - REAGENTS
4 - DIAGNOSTICS
5 - SETUP
PN 4237615B
1-11
Page 34

USE AND FUNCTION
WORKING WITH THE SOFTWARE
Erasing Saved Text
There may be times when you need to erase saved text.
Move the cursor to the line of text
1
where you want to delete information.
Press .
2
The cursor becomes a flashing
underscore, which means you can now
edit the field.
Move the underscore to the character
3
you want to delete.
Press to backspace and delete.
4
Press to save the changes.
5
DEL
Selecting/De-selecting Software Fields
Some software screens allow you to select (activate) or de-select (deactivate) certain software
features.
Move the cursor to the desired field.
1
1-12
PN 4237615B
Page 35

Press .
2
For example, 7001 is selected on the
Autocalibration screen shown here.
:
Note
USE AND FUNCTION
PRESENTING SAMPLES TUBES (OR VIALS) AND STARTING ANALYSIS
16:0502/27/00AUTOCALIBRATION
7001
OP2
OP3
OP4
WBC
HCT
LOT # CX294
EXP. DATE 04/05/00
TARGET VALUES
10.4
36.7
RBC
PLT
4.40
255
HGB
13.6
1
= selected.
CONTINUE
= not selected.
1.7 PRESENTING SAMPLES TUBES (OR VIALS) AND STARTING ANALYSIS
Some procedures in this manual require you to present a tube (or vial) to the instrument and
start analysis. The following information describes how.
Present the tube (or vial) to the aspirate probe.
B
Ensure that the probe is well inside the tube (or
C
b
c
vial) contents, and press the aspirate switch.
During aspiration, the red and green LEDs flash.
When the red LED remains illuminated,
r
remove the tube (or vial) from the probe.
When the green LED remains illuminated,
r
the instrument is ready for the next analysis.
1.8 ORDERING MATERIAL SAFETY DATA SHEETS (MSDS)
To obtain an MSDS for reagents used on the AC•T 5diff analyzer:
1. In the USA, either call Beckman Coulter Customer Operations (800.526.7694) or write:
Beckman Coulter, Inc.
Attn: MSDS Requests
P.O. Box 169015
Miami, FL 33116-9015
2. Outside the USA, contact a Beckman Coulter representative.
PN 4237615B
1-13
Page 36

USE AND FUNCTION
ORDERING MATERIAL SAFETY DATA SHEETS (MSDS)
1-14
PN 4237615B
Page 37

2.1 OVERVIEW
The AC•T 5diff analyzer is a fully automated hematology analyzer providing a complete WBC
five-part differential, which is determined simultaneously by the A
Cytochemistry and Volume) Technology and WBC/BASO methodologies.
C
The A
WBC/BASO methodology uses differential lysis, impedance technology, and differential
thresholds. See Table 2.1.
Table 2.1 AC•T 5diff Analyzer: Measurement Technologies
V Technology uses absorbance, cytochemistry, and focused flow impedance. The
Fluid Dynamics Technology Measurements Output
OPERATION PRINCIPLES
2
C
V (Absorbance
2
Dual Focused Flow
Volume aperture Differential lysis using the
Volume aperture Coulter Principle Volume and count RBC count, platelet count,
C
A
V Technology
Coulter Principle
2.2 MEASUREMENT PRINCIPLES
Coulter Principle
In the AC•T 5diff analyzer, the Coulter Principle1 is used to analyze the final RBC/Plt dilution
and the WBC/BASO dilution. This electronic method of counting and sizing particles is based
on the fact that cells, which are poor conductors of electricity, will interrupt a current flow.
The impedance variation generated by the passage of non-conductive cells through a small,
calibrated aperture is used to determine the count (number of particles) and size (volume) of
the particles passing through the aperture within a given time period.
Aperture Sensor System
The RBC/Plt aperture sensor system determines the cell count and size of red blood cells and
platelets. The WBC/BASO aperture sensor system determines the cell count and size of white
blood cells. Additionally, the differentiation between basophils and other white blood cells is
related to the A
WBC/BASO bath.
C
•T 5diff WBC Lyse-specific lytic action on the white blood cells in
Light absorbance of
cytochemically-stained
cells
Volume and count WBC count, basophil
Lymphocytes, monocytes,
neutrophils, eosinophils,
immature cells, and atypical
lymphocytes
percentage, and basophil
count
and hematocrit
PN 4237615B
To sense particles using the Coulter Principle (Figure 2.1), a current flow is established so
changes in that flow can be monitored. In this sensing system, an electrode is placed on each
side of the aperture. The most visible electrode is referred to as the counting head. These
electrodes are the conductive metallic housings attached to the front of the RBC and
WBC/BASO baths. The second electrode, referred to as the bath electrode, is not as
conspicuous. This electrode is located inside the bath. The aperture is located between the
counting head and the bath electrode.
2-1
Page 38

OPERATION PRINCIPLES
V
MEASUREMENT PRINCIPLES
Figure 2.1 Coulter Principle
Solution to be analyzed
Vacuum
constant
Current
costant
olts
Pulse
Electrodes
Time
Analyzing
electronic
circuit
7616035A
When the count circuit is activated and an electronically conductive reagent is in the RBC or
WBC/BASO bath, an electric current continuously passes through the aperture. Current
moving between the two electrodes establishes the electronic flow through the aperture.
Once a sample is aspirated, an aliquot of that aspirated sample is diluted with reagent (an
electrolyte) and is delivered to the RBC or WBC/BASO bath using tangential flow, which
ensures proper mixing of the dilution. When the cells suspended in the conductive reagent
are pulled through a calibrated aperture, the electrical resistance between the two electrodes
increases proportionately with the cell volume (Figure 2.1).
The resistance creates a pulse that is sensed and counted as a particle by the instrument. The
amount of resistance (amplitude of each pulse) is directly related to the size of the particle
that produced it.
The generated pulses have a very low voltage, which the amplification circuit increases so
that the electronic system can better analyze the pulses and eliminate the background noise.
Applying the Coulter Principle
The AC•T 5diff analyzer makes several dilutions of an aspirated whole-blood sample. The
RBC/Plt dilution begins in the First Dilution/Hgb bath but is actually analyzed in the RBC
bath. The final dilution in the RBC bath is used to determine the cell count and size of red
blood cells and platelets.
The WBC/BASO aperture sensor system is directly responsible for determining the cell count
and size of white blood cells. The differentiation between basophils and other white blood
cells is also related to the A
cells.
Thresholds, which are electronically set size limits, exclude unwanted particles, such as
debris, from the analysis. Particles above the threshold are analyzed, and particles below the
threshold are excluded.
2-2
C
•T 5diff WBC Lyse-specific lytic action on these white blood
PN 4237615B
Page 39

2.3 ACV TECHNOLOGY
In the DIFF bath, 25µL of whole blood is mixed with 1,000µL of AC•T 5diff Fix reagent for
12 seconds, then stabilized with 1,000µL of A
This reaction lyses the red blood cells, preserves the leukocytes at their original size, and
differentially stains the lymphocytes, monocytes, neutrophils, and eosinophils, with
eosinophils staining most intensely. The instrument maintains the reagents and reaction at a
regulated temperature of 35°C (95°F).
The lymphocytes, monocytes, neutrophils, and eosinophils each have a unique nuclear and
morphologic structure and staining intensity, and therefore, absorb light differently. Each
stained cell is individually focused by the Dual Focused Flow (DFF) system and transported
through the flowcell using sample pressure and diluent sheath flow.
Dual Focused Flow (DFF)
DFF (Figure 2.2) fluid dynamics uses a hydrodynamic focusing process to focus individual
cells or particles in a stream of diluent. The focused sample stream of the A
is about 40µm in diameter.
OPERATION PRINCIPLES
C
•T 5diff Diluent for an additional 3 seconds.
C
V TECHNOLOGY
A
C
•T 5diff analyzer
2
DFF uses the sheath fluid to surround and force cells suspended in diluent to pass one at a
time through the center of the flowcell. The first sheath flow focuses the sample through the
impedance aperture. The second sheath flow maintains the focused flow of cells as they exit
the aperture into the optical flowcell. Hydrodynamic focusing in the flowcell enables accurate
and rapid cell-by-cell measurements on a large number of individual cells.
Figure 2.2 Dual Focused Flow Process
Flowcell
Sequential analyses for cell volume (impedance) and light absorbance are performed in the
flowcell. A total of 72µL of sample is injected through the flowcell for 15 seconds. The
flowcell incorporates a 60µm aperture for cellular volume analysis and a 42µm measurement
area for light absorbance.
PN 4237615B
Focused Flow Impedance
Focused flow impedance technology measures the electrical resistance of a cell as it passes
through the aperture in the flowcell. The change in resistance is directly proportional to the
volume of the cell.
2-3
Page 40

OPERATION PRINCIPLES
C
V TECHNOLOGY
A
Absorbance Cytochemistry
As a cell passes through the optical portion of the flowcell, light is scattered in all directions.
A sensor detects only forward scattered light. The optical measurement is derived as a
function of the amount of light lost due to diffraction and absorbance, as compared to full
transmission when no cell is present.
The collected signals are converted into voltage pulses and are processed. The magnitude of
the voltage pulses are proportional to the physical and chemical characteristics of the cells
being analyzed. Light absorbance is related to cellular contents (granularity, nuclear content,
and so forth) after cytochemical staining. These measurements provide the information for
lymphocytes, monocytes, neutrophils, and eosinophils, and their precursors.
Signal Processing
The signals from the flowcell aperture and from the optical measurement are correlated by a
window of time. The optical pulse must be detected within 100 to 300 microseconds of the
impedance pulse, otherwise, the signal is rejected.
The output signals from the focused flow impedance and the light absorbance measurements
are combined to define the WBC differential population clusters. See Figure 2.3.
Figure 2.3 Signal Processing
Thresholds
Most of the population partition thresholds are fixed and give the limits of the morphological
normality of leukocytes. Changes in the morphology of a population are expressed on the
DiffPlot by a shifting of the corresponding population. Volume and absorbance thresholds are
used to detect shifting populations.
2-4
PN 4237615B
Page 41

2.4 WBC/BASO METHODOLOGY
In the WBC/BASO bath, 10µL of whole blood is mixed with 2,000µL of AC•T 5diff WBC Lyse
reagent. This reaction lyses the red blood cells and specifically differentiates between the
basophils and other leukocytes by volume. The instrument maintains the reagents and
reaction at a regulated temperature of 35°C (95°F).
Using a constant vacuum, the instrument then pulls the sample through an 80µm aperture.
As each cell passes through the aperture, a pulse is generated proportional to the cellular
volume. The total leukocyte count and basophil percentage are determined by specific
thresholds on the WBC/BASO histogram (Figure 2.4.).
Figure 2.4 BASO Thresholds
OPERATION PRINCIPLES
WBC/BASO METHODOLOGY
2
2.5 SAMPLE ANALYSIS OVERVIEW
Aspiration
When the sample probe is immersed in a whole-blood sample and the aspirate switch is
pressed, sample is pulled from the tube into the sample probe. Depending on the selected
mode of operation, the A
(CBC/DIFF mode) of sample.
The volume of sample aspirated into the sample probe is sufficient to make all the dilutions
needed to develop parameter results in the selected mode of operation. The aspirated sample
is then partitioned as it is distributed into the designated baths.
Figure 2.5 shows the sample partitioning that occurs in the CBC/DIFF mode. Notice there are
three aliquots of the aspirated whole-blood sample that will be used to make dilutions.
Figure 2.6 shows the sample partitioning that occurs in the CBC mode. Notice there are only
two aliquots of the aspirated whole-blood sample that will be used to make dilutions in this
mode of operation. (The DIFF aliquot is not needed in the CBC mode.)
To ensure sample integrity, the sample aliquot at the tip of the probe is never used to make a
dilution; it is discarded into the Rinse bath.
C
•T 5diff analyzer aspirates either 30µL (CBC mode) or 53µL
PN 4237615B
2-5
Page 42

OPERATION PRINCIPLES
SAMPLE ANALYSIS OVERVIEW
Figure 2.5 Sample Partitions Inside the Probe CBC/DIFF Mode
Diluent
Air bubble
Not used
DIFF dilution
WBC/BASO dilution
RBC/PLT/HGB first dilution
Not used
7616001A
Figure 2.6 Sample Partitions Inside the Probe CBC Mode
Diluent
Air bubble
Not used
WBC/BASO dilution
RBC/PLT/HGB first dilution
Not used
7616056A
Dilution
Using the Sequential Dilution System (SDS) technique, the instrument makes a series of
dilutions in a series of baths (Figure 2.7).
Figure 2.7 Bath Assembly
Rinse bath
b
First Dilution/Hgb bath
c
DIFF bath
d
RBC bath
e
WBC/BASO bath
f
2-6
PN 4237615B
Page 43

OPERATION PRINCIPLES
A
SAMPLE ANALYSIS OVERVIEW
CBC Mode
After aspiration in the CBC mode, aliquots of the whole-blood sample are distributed as
follows (Figure 2.5):
r The 3µL sample aliquot at the tip of the probe is discarded into the Rinse bath as the
exterior of the sample probe is rinsed, ensuring sample integrity.
r 10µL of sample is delivered to the First Dilution/Hgb bath for use in preparing the
primary RBC/Plt dilution and for measuring the Hgb value.
r 10µL of sample is delivered to the WBC/BASO bath for the WBC/BASO count.
r 7µL of remaining sample is discarded into the Rinse bath.
CBC/DIFF Mode
After aspiration in the CBC/DIFF mode, aliquots of the whole-blood sample are distributed as
follows (Figure 2.6):
r The 3µL sample aliquot at the tip of the probe is discarded into the Rinse bath as the
exterior of the sample probe is rinsed, ensuring sample integrity.
r 10µL of sample is delivered to the First Dilution/Hgb bath for use in preparing the
primary RBC/Plt dilution and for measuring the Hgb value.
2
r 10µL of sample is delivered to the WBC/BASO bath for the WBC/BASO count.
r 25µL of sample is delivered to the DIFF bath for development of the DiffPlot.
r 5µL of remaining sample is discarded into the Rinse bath.
Delivery
In the CBC and the CBC/DIFF modes, each aliquotted sample is delivered to its appropriate
bath using a tangential flow (Figure 2.8) of reagent, which mixes the diluted sample and
minimizes viscosity problems.
Figure 2.8 Sample Delivery Using Tangential Flow
Probe
Reagent
input
Tangential flow
PN 4237615B
Mixing bath
7616002
2-7
Page 44

OPERATION PRINCIPLES
SAMPLE ANALYSIS
2.6 SAMPLE ANALYSIS
RBC and Platelet Analysis
The RBC/Plt dilution analyzes red blood cells and platelets. This dilution is prepared in two
stages – the primary (first) dilution and the secondary (last) dilution.
The primary dilution is made in the First Dilution/Hgb bath, and the secondary dilution is
made in the RBC bath (Figure 2.9). Table 2.2 summarizes the technical characteristics
required to obtain RBC and Platelet results.
Figure 2.9 Bath Assembly
Rinse bath
b
First Dilution/Hgb bath
c
DIFF bath
d
RBC bath
e
WBC/BASO bath
f
Table 2.2 Technical Characteristics for Obtaining RBC and Platelet Counts
Dilution Characteristics
Primary Dilution for RBC and Plt:
Initial volume of whole-blood 10µL
Volume A
Primary dilution ratio 1:170
Secondary Dilution for RBC and Plt
Volume of primary dilution 42.5µL
Volume A
Secondary dilution ratio 1:58.8
Final dilution for RBC and Plt results 1:170 x 1:58.8 = 1:10,000
Reaction temperature 35°C (95°F)
C
•T 5diff diluent
C
•T 5diff diluent
:
1700µL
2500µL
2-8
Measurement Characteristics
Method of analysis Coulter Principle
Aperture diameter 50µm
Count vacuum 200mb (5.9in. Hg)
Count period 2x5 seconds
PN 4237615B
Page 45

OPERATION PRINCIPLES
SAMPLE ANALYSIS
Parameter Results Obtained from the RBC/Plt Dilution
This final 1:10,000 RBC/Plt dilution is used to:
r Determine the RBC count,
r Develop the RBC histogram, which is needed to obtain the Hct, MCV, and RDW results,
r Determine Plt count,
r Develop the Plt histogram, which is needed to obtain MPV, Pct, and PDW results.
Hgb Measurement
Hemoglobin is determined from the dilution in the First Dilution/Hgb bath (Figure 2.9). This
dilution is prepared in two stages – the primary (first) dilution and the secondary (last)
dilution.
The primary dilution is made and 42.5µL of that dilution is removed for making the RBC/Plt
dilution. A
dilution.
The Hgb concentration is based on the transmittance of light through the optical part of the
First Dilution/Hgb bath using a spectrophotometric technique at a wavelength of 550nm. The
transmittance of the sample dilution is compared to the transmittance of a reagent blank. The
system calculates the Hgb using the blank and sample readings.
C
•T 5diff Hgb Lyse and additional Diluent are added to make the final 1:250
2
Table 2.3 summarizes the technical characteristics required for measuring hemoglobin.
Table 2.3 Technical Characteristics for the Measurement of the Hemoglobin
Dilution Characteristics
Volume of whole-blood 10µL
Volume A
Preliminary dilution ratio 1:170
Volume of the 1:170 dilution removed
(for making the RBC/Plt dilution)
Additional volume of A
Volume of A
Final dilution for Hgb determination 1:250
Reaction temperature 35°C (95°F)
Measurement Characteristics
Method of analysis Spectrophotometry
Wavelength 550nm
C
•T 5diff diluent
C
•T 5diff Hgb Lyse
C
•T 5diff diluent
1700µL
42.5µL
400µL
400µL
PN 4237615B
2-9
Page 46

OPERATION PRINCIPLES
SAMPLE ANALYSIS
WBC Count and Differential
The WBC count is determined twice using two different methodologies:
r The reference WBC count is the count obtained in the WBC/BASO bath (Figure 2.10).
The WBC count and the BASO count are determined simultaneously.
r A second WBC count is determined in the flowcell during acquisition of the DiffPlot.
The dilution analyzed in the flowcell is prepared in the DIFF bath (Figure 2.10).
The WBC counts from the two methodologies are compared, and, if they exceed the defined
limits, will be flagged.
Figure 2.10 Bath Assembly
Rinse bath
b
First Dilution/Hgb bath
c
DIFF bath
d
RBC bath
e
WBC/BASO bath
f
Table 2.4 summarizes the technical characteristics required to obtain WBC and BASO results.
Table 2.4 Characteristics Required to Obtain WBC/BASO Results
Dilution Characteristics
Volume of whole-blood 10µL
Volume A
Dilution ratio 1:200
Reaction temperature 35°C (95°F)
Measurement Characteristics
Method of analysis Coulter Principle
Aperture diameter 80µm
C
•T 5diff WBC Lyse
2,000µL
2-10
Count vacuum 200mb (5.9in. Hg)
Count period 2x6 seconds
PN 4237615B
Page 47

OPERATION PRINCIPLES
SAMPLE ANALYSIS
Parameter Results Obtained from the WBC/BASO Dilution
The final 1:200 dilution is used to:
r Determine the WBC count, and
r Develop the WBC/BASO histogram, which is needed to obtain the BASO count.
Differential
Twenty-five microliters (25µL) of whole blood is delivered to the DIFF bath in a flow of
C
•T 5diff Fix reagent, which lyses the red blood cells, stabilizes the WBC in their native
A
forms, and differentially stains the lymphocytes, monocytes, neutrophils, and eosinophils,
with eosinophils staining most intensely.
The solution is then stabilized with Diluent for three seconds and transferred to the
measuring bath. See Figure 2.11. Each cell is measured in absorbance (cytochemistry) and
resistivity (volume).
Figure 2.11 Flowcell Operation
2) Second focused flow for optical detection
2
PN 4237615B
1) Primary focused flow for impedance
2-11
Page 48

OPERATION PRINCIPLES
SAMPLE ANALYSIS
Table 2.5 summarizes the technical characteristics required for acquisition of the DiffPlot.
Table 2.5 Technical Characteristics for Acquisition of the DiffPlot
Dilution Characteristics
Volume of whole-blood 25µL
Volume A
Volume A
Final dilution ratio 1:80
Reaction temperature 35°C (95°F)
Incubation duration 12 seconds
Measurement Characteristics
Method of analysis Impedance with hydrofocus
Aperture diameter 60µm
Diameter of the flow 42µm
C
•T 5diff Fix
C
•T 5diff Diluent
1000µL
1000µL
Injection duration 15 seconds
Data accumulated 12 seconds
Volume injected 72µL
Parameter Results Obtained from the DIFF Dilution
From these measurements, a DiffPlot is developed with optical transmission (absorbance) on
the X-axis and volume on the Y-axis. Figure 2.12 shows the DiffPlot regions.
From the DiffPlot, four out of five leukocyte (white blood cell) populations are determined:
lymphocytes, monocytes, neutrophils, and eosinophils.
In a typical whole-blood sample, the basophil population (determined in the WBC/BASO
bath) is very small compared to the other four white blood cell populations.
Figure 2.12 DiffPlot Regions
2-12
PN 4237615B
Page 49

OPERATION PRINCIPLES
PARAMETER DEVELOPMENT
Dilution Summary
Table 2.6 summarizes the dilution characteristics required to obtain CBC and CBC/DIFF
parameter results.
Table 2.6 Summary of Dilutions
2
Technical
Characteristics
WBC Count and BASO
Count
(in the WBC/BASO
bath)
Differential Acquisition
with Differential WBC
Count
(in the DIFF bath)
Hgb Measurement
(in the First
Dilution/Hgb bath)
RBC and Plt Count
(in the RBC bath)
The primary
Note:
dilution (1:170) is made
in the First Dilution/Hgb
bath.
Whole-Blood
Volume Reagent(s)
10µL
25µL
10µL
42.5µL of the
1:170 dilution
(from the
First
Dilution/Hgb
bath)
C
A
•T 5diff WBC Lyse
C
A
•T 5diff Fix
C
•T 5diff Diluent
A
C
A
•T 5diff Diluent
After removing
42.5 µL of the 1:170
dilution:
C
A
•T 5diff Diluent
C
•T 5diff Hgb Lyse
A
C
A
•T 5diff Diluent
Reagent
Volume
2,000µL Final
1,000µL
1,000µL
1700µL
400µL
400µL
2,500µL Secondary
Dilution
Ratio
1:200
Final
1:80
Preliminary
1:170
Final
1:250
1:58.8
1:170 x
1:58.8 =
Final
1:10,000
Reaction
Temperature
35°C (95°F)
35°C (95°F)
35°C (95°F)
35°C (95°F)
2.7 PARAMETER DEVELOPMENT
RBC Parameters
RBC Count
C
The A
proprietary flagging information to confirm the parameter result prior to reporting it. To
obtain an RBC count result, the instrument compares the data from the two 5-second count
periods then votes and rejects any questionable data.
RBC count = Number of cells counted per unit volume x Calibration coefficient
The RBC count is displayed and printed as: RBC = N x 10
(
UNIT SELECTION
PN 4237615B
•T 5diff hematology analyzer uses duplicate counting criteria, voting criteria, and
: cells/µL is the US unit format. Other formats are available. See
Note
.)
6
cells/µL.
Heading A.7, REPORTING
2-13
Page 50

OPERATION PRINCIPLES
A
PARAMETER DEVELOPMENT
RBC Histogram
In addition to being counted, red blood cells are categorized according to size (from 30 fL to
300 fL) by a 256-channel pulse-height analyzer. The pulse-height analyzer uses a number of
thresholds to sort the particles into several size (volume) categories and to develop a size
distribution curve of the particles. The RBC distribution curve shows cells in their native size.
Figure 2.13 is an example of an RBC histogram with a normal RBC size distribution.
Figure 2.13 Typical RBC Histogram
30 300
7616036
Parameter Results Obtained Using the RBC Histogram
r Hct measurement: The height of the pulse generated by the passage of a cell through the
aperture is directly proportional to the volume of the analyzed red blood cell. The
hematocrit (Hct) is the sum of all the digitized pulses. Hct is displayed and printed as %
(percentage). (Note: % is the US unit format. Other formats are available. See
A.7, REPORTING UNIT SELECTION
.)
Heading
r MCV calculation: The MCV (Mean Cell Volume) is calculated using the Hct and the RBC
count. The MCV is displayed and printed in femtoliters (fL). (Note: fL is the US unit
format. Other formats are available. See
Heading A.7, REPORTING UNIT SELECTION
.)
r RDW calculation: The RDW (Red cell Distribution Width) is an index of the variation or
spread in the size of the red blood cells. The study of the RBC distribution detects
erythrocyte anomalies linked to anisocytosis and enables the clinician to follow the
evolution of the width of the curve relative to the cell number and average volume.
Displayed and printed as a percentage, RDW is calculated using the standard deviation
(SD) of the RBC population and the MCV.
RDW(%)
K SD
--------------=
MCV
where:
K = System constant
2-14
SD = Calculated standard deviation based on the red cell distribution
MCV = Mean Cell Volume of the red cells
PN 4237615B
Page 51

OPERATION PRINCIPLES
PARAMETER DEVELOPMENT
MCH and MCHC Calculations
r MCH calculation: The MCH (Mean Cell Hemoglobin) is calculated from the Hgb value
and the RBC count and describes the average weight of hemoglobin in a red cell. The
calculation for MCH is:
Hgb
MCH (pg)
(
: pg is the US unit format. Other formats are available. See
Note
UNIT SELECTION
r MCHC calculation: The MCHC (Mean Cell Hemoglobin Concentration) is calculated
using the Hgb and Hct values and describes the average concentration of hemoglobin in
the red blood cells. The calculation for MCHC is:
MCHC (g/dL)
(
: g/dL is the US unit format. Other formats are available. See
Note
REPORTING UNIT SELECTION
-----------RBC
.)
Hgb
---------Hct
10×=
Heading A.7, REPORTING
100×=
Heading A.7,
.)
Plt Parameters
Platelet counting and sizing is also done in the RBC bath. Thresholds separate the platelet
pulses, which are much smaller, from the red blood cell pulses. Platelets are also categorized
according to size by a 256-channel pulse-height analyzer. A pulse-height analyzer uses a
number of thresholds to sort the particles into several size (volume) categories and to develop
a size distribution curve of the particles. The Plt distribution curve shows cells in their native
size. Figure 2.14 is an example of a Plt histogram with a normal Plt size distribution.
2
Figure 2.14 Typical Plt Histogram
Interference on the Lower End of the Platelet Distribution Curve
Particles that are approximately platelet size can interfere with the platelet histogram and
count. Small particles, such as micro-bubbles or dust, can interfere at the low end. If the
number of pulses in the 2 to 3 fL region is higher than the predefined limits, an SCL flag
appears to alert the operator that a significant number of small cells or interference, such as
micro-bubbles, are present.
PN 4237615B
2-15
Page 52

OPERATION PRINCIPLES
PARAMETER DEVELOPMENT
Microcytic Interferences on the Upper End of the Platelet Distribution Curve
Microcytic red blood cells can intrude at the upper end of the platelet distribution curve. If
the sample contains microcytes, the A
the influence of this interference by repositioning the variable threshold and excluding the
microcytes.
Parameter Results Obtained Using the Plt Histogram
r Plt Count: The A
criteria, and proprietary flagging information to confirm the parameter result prior to
reporting it. To obtain a Plt count result, the instrument compares the data from the two
5-second count periods then votes and rejects any questionable data.
Plt count = Number of cells counted per unit volume x Calibration coefficient.
Plt count is displayed and printed as Plt = Nx10
(Note: µL is the US unit format. Other formats are available. See
UNIT SELECTION
r MPV Measurement: The MPV (Mean Platelet Volume) is measured directly from analysis
of the platelet distribution curve. The MPV is displayed and printed in femtoliters (fL).
C
•T 5diff analyzer may be able to successfully eliminate
C
•T 5diff hematology analyzer uses duplicate counting criteria, voting
3
cells/µL.
Heading A.7, REPORTING
.)
r Pct Calculation: The Pct (plateletcrit) is calculated according to the formula:
3
Pct%
Plt 10
------------------------- ----------------------------- ---------=
/µL()MPV (fL)×
10 000,
r PDW Calculation: PDW (Platelet Distribution Width) is calculated from the Plt
histogram as the width of the curve between S1 and S2.
As shown in Figure 2.15, S1 and S2 are placed so that:
t 15% of the platelets occur between 2fL and S1.
t 15% of the platelets occur between S2 and the variable upper threshold.
t The PDW result is determined on the platelets between S1 and S2.
Figure 2.15 Area of the Plt Histogram Used to Determine the PDW Parameter Result
2-16
15%
PDW
S1 S2
15%
7615002A
PN 4237615B
Page 53

OPERATION PRINCIPLES
PARAMETER DEVELOPMENT
Hgb Determination
The hemoglobin (Hgb) released by the lysis of the red blood cells combines with the
potassium cyanide to form a stable cyanmethemoglobin compound.
This compound is measured through the optical part of the First Dilution/Hgb bath using a
spectrophotometric technique at a wavelength of 550nm. Transmittance of the sample
dilution is compared with the transmittance of a reagent blank. The system calculates the Hgb
using both the blank and sample readings.
The final Hgb result represents: absorbance value obtained x coefficient of calibration.
Hgb is displayed and printed as Hgb = N g/dL.
(
: g/dL is the US unit format. Other formats are available. See
Note
UNIT SELECTION
.)
Heading A.7, REPORTING
WBC Count, BASO Count, and DiffPlot Development
WBC Count
C
The A
proprietary flagging information to confirm the parameter result prior to reporting it. To
obtain a WBC count result, the instrument compares the data from the two 5-second count
periods then votes and rejects any questionable data. This is the reference WBC count, which
is reported.
•T 5diff hematology analyzer uses duplicate counting criteria, voting criteria, and
2
A second WBC count is determined in the flowcell during acquisition of the DiffPlot.
WBC count: number of cells per unit volume x coefficient of calibration.
BASO Count
Differentiation between basophils and other leukocytes is obtained by means of the
C
A
•T 5diff WBC Lyse-specific lytic action. See Figure 2.16.
In Figure 2.16, basophils are located in the area between the thresholds labeled
hundred percent (100%) of the leukocytes is represented by the total number of nucleated
particles plus the basophils within the area between the thresholds labeled
The basophil percentage is calculated from the number of particles existing in the area
between the thresholds labeled
Figure 2.16 Areas Used to Determine WBC and BASO Parameter Results
c
and d (Figure 2.16).
c
b
and d.
and d. One
bc d
basophilsWBC
PN 4237615B
2-17
Page 54

OPERATION PRINCIPLES
PARAMETER DEVELOPMENT
BASO count: number of cells per unit volume x coefficient of calibration in percentage
relative to the number of counted cells (BASO plus WBC nuclei).
BASO count
DiffPlot Development
The DiffPlot analysis on the A
principles:
r Dual Focused Flow (DFF) fluid dynamics, which is a process by which individual cells
or particles are focused in a stream of diluent (hydrodynamic focusing).
r The volume measurement (Coulter Principle).
r The measurement of transmitted light with zero degree (0°) angle, which permits a
response proportional to the internal structure of each cell and its absorbance.
From these measurements, a DiffPlot is developed with optical transmission (absorbance) on
the X-axis and volume on the Y-axis. See Figure 2.17.
BASO%
---------------------WBC%
WBC count×=
C
•T 5diff hematology analyzer is based on three essential
Figure 2.17 DiffPlot Regions
The study of the DiffPlot permits the clear differentiation of four out of five leukocyte
populations. In a typical whole-blood sample, the basophil population is very small when
compared with the other four white cell populations.
2-18
PN 4237615B
Page 55

OPERATION PRINCIPLES
PARAMETER DEVELOPMENT
Table 2.7 defines the DiffPlot regions. Table 2.8 defines immature white blood cells.
Table 2.7 DiffPlot Regions Defined
Region Definition
2
Neutrophil
(Neut)
Lymphocyte
(Lymph)
Monocyte
(Mono)
Eosinophil
(Eos)
Neutrophils, with their cytoplasmic granules and segmented nuclei, scatter light
according to their morphological complexity. A hypersegmented neutrophil
gives an increased optical response when compared to a young neutrophil
population. The higher the complexity of the cell, the further to the right they
appear in the DiffPlot (Figure 2.17).
Lymphocytes, typically being small with regular shape are smaller in volume
and lower in absorbance than the other cells, and are positioned in the lower
region of the DiffPlot (Figure 2.17). Normal lymphocyte populations typically
have a homogeneous volume with a Gaussian (bell-shaped) distribution.
Large lymphocytes, reactive lymphoid forms, stimulated lymphocytes and
plasma cells are found in the upper portion of the lymphocyte region
(Figure 2.17).
The lower area of the lymphocyte zone is normally empty; however, when small
lymphocytes are present, a population may exist in this area (Figure 2.17).
The presence of platelet aggregates is indicated by a distribution pattern that
moves from the DiffPlot origin into the lymphocyte region (Figure 2.17).
NRBC cytoplasmic membranes lyse like those of mature erythrocytes. The
small nuclei that remain appear in the debris and small lymphocyte regions
(Figure 2.17).
Monocytes are typically large cells with a kidney-shaped nucleus and agranular
cytoplasm. These cells neither scatter nor absorb large amounts of light and,
therefore, are positioned in the lower end of the absorbance axis. Due to their
size, the monocytes are clearly positioned high on the volume axis
(Figure 2.17).
Very large monocytes may be found in the IMM (immature cell) region.
With the reagent action, eosinophils are the most intensely stained for optical
separation. Due to the staining and their size, the eosinophils will show higher
absorbance than the neutrophils, but will be of similar volume (Figure 2.17).
PN 4237615B
Debris Platelets and debris from erythrocyte lysis represent the background debris
population located in the lower region of the DiffPlot.
2-19
Page 56

OPERATION PRINCIPLES
PARAMETER DEVELOPMENT
Table 2.8 Immature White Blood Cells
Immature Cell Type Definition
Immature Granulocytes Immature granulocytes are detected by their larger volume and by the presence
Band Cells Band cells are typically larger or of similar size to the neutrophils; however, due
Blast Cells Blast cells are generally larger than monocytes and have similar absorbance.
of granules that increase the intensity of the scattered light.
Due to their increased volume and similar absorbance, promyelocytes,
myelocytes, and metamyelocytes are located above the neutrophil population
and are typically counted as IMM cells. IMM cells are included in the reported
neutrophil value.
to their low level of cellular complexity, they absorb less light. As a result, band
cells tend to appear in the region between the neutrophils and the monocytes.
When blast cells are present, they are generally located above the monocytes,
which means they will be included in the IMM cell count.
Small blasts will be located between the normal lymphocyte and monocyte
populations.
2-20
PN 4237615B
Page 57

3.1 INSTRUMENT SPECIFICATIONS
Dimensions and Weight
See Figure 3.1.
SPECIFICATIONS/CHARACTERISTICS
3
3
WARNING
handles, and it weighs more than one person should lift. Therefore, to prevent injury, at least two people
following necessary safety precautions should lift the instrument together.
Figure 3.1 Instrument Dimensions and Weight
23 in.
58 cm
Risk of operator injury if only one person lifts the instrument. The instrument has no lifting
81.0 lb.
37.0 Kg
17.5 in.
44.4 cm
19.75 in.
50.10 cm
Power
Supply
From 100 Vac to 240 Vac. From 50 Hz to 60 Hz.
PN 4237615B
Consumption
200 watts maximum.
Installation Category
The instrument is designed to be safe for transient voltages according to Installation
Category II and Pollution Degree 2.
Grounding Requirements
To protect against electrical shock, the wall ground (earth) plug must be correctly connected
to the laboratory grounding electricity installation.
Temperature, Ambient Operating
The ambient operating temperature is 16°C to 34°C (61°F to 93°F). If you keep the
instrument at a temperature less than 10°C (50°F), allow the instrument to remain at the
ambient operating temperature for one hour before use.
3-1
Page 58

SPECIFICATIONS/CHARACTERISTICS
INSTRUMENT SPECIFICATIONS
Altitude Range
The instrument can be operated at any altitude up to 3,000 meters (9,800 feet).
Recommended Location
Place the instrument on a clean, level bench, allowing at least 20cm (8 in.) of space behind
the instrument for ventilation.
Electromagnetic Environment Check
The instrument produces less than the acceptable level of electromagnetic interference when
properly placed. Electromagnetic interferences are limited to levels that allow the correct
operation of other instruments conforming to their placement.
If there is a problem, ensure that the instrument is not placed near electromagnetic fields or
short wave emissions (such as radar, X-ray machines, scanners, and so forth).
Recommended Reagents
Beckman Coulter recommends these reagents:
C
r A
r A
r A
r A
r A
•T 5diff Diluent,
C
•T 5diff Fix,
C
•T 5diff WBC Lyse,
C
•T 5diff Hgb Lyse, and
C
•T 5diff Rinse.
Heading 1.3, REAGENTS
See
for additional information about these reagents.
Recommended Controls
AC•T 5diff Control is the recommended control. See
for additional information.
Heading 1.2, CONTROLS AND CALIBRATORS
Recommended Calibrator
AC•T 5diff Cal Calibrator is the recommended calibrator. See
CALIBRATORS
for additional information.
Heading 1.2, CONTROLS AND
Recommended Anticoagulant
The recommended anticoagulant is K3EDTA with the proper proportion of blood to
anticoagulant as specified by the tube manufacturer.
Sample Volume Aspirated
r 30 µL of whole blood is aspirated in the CBC mode.
r 53 µL of whole blood is aspirated in the CBC/DIFF mode.
Dilution Ratios
WBC/BASO: 1/200
DIFF: 1/80
RBC/Plt: 1/10,000
Hgb: 1/250
3-2
PN 4237615B
Page 59

SPECIFICATIONS/CHARACTERISTICS
INSTRUMENT SPECIFICATIONS
Throughput
The instrument can process up to 60 samples per hour in either mode – CBC or CBC/DIFF.
The instrument achieves nominal throughput when used in a routine laboratory environment
with samples having normal hematology parameters. Depending on sample mix and
workflow conditions, slightly higher or lower throughput might be observed.
Sample Stability
Sample stability is based on an average of 20 clinical normal and abnormal whole-blood
samples.
r CBC parameters are stable up to 48 hours at room temperature.
r DIFF parameters are stable up to 24 hours at room temperature.
Sample Identification
You can enter a sample ID using the instrument’s control panel, setup the instrument to
autonumber the IDs, or scan the tube’s barcode label with the optional hand-held barcode
reader.
3
Output
The instrument can transmit startup, sample, and control data to a host computer. The
Sample Results screen shows the sample identification number, sample results, and any result
flags.
The instrument prints a report (Figure 3.2).
Figure 3.2 Sample Report
PN 4237615B
3-3
Page 60

SPECIFICATIONS/CHARACTERISTICS
INSTRUMENT SPECIFICATIONS
Measurements and Computation
r Impedance for WBC, Plt, RBC, and BA.
r Photometry for Hgb using cyanmethemoglobin method with 550nm diode light source.
r Impedance and light absorbance for NE, LY, MO, EO, ATL, and IMM.
r Computation from stored data that was directly measured for Hct, MCV, MCH, MCHC,
RDW, MPV, Pct, and PDW.
Counting Aperture Diameters
WBC/BASO: 80 µm
DIFF: 60 µm
RBC/Plt: 50 µm
Reagent Consumption
Table 3.1 shows the instrument’s reagent consumption by cycle.
Table 3.1 Reagent Consumption by Cycle in mL
Approximate
Cycle Reagent
Diluent WBC Lyse Rinse Fix Hgb Lyse
CBC 20.5 2.1 0.9 – 0.4 60 sec
CBC/DIFF 25.6 2.1 0.9 1.0 0.4 60 sec
†
Startup
Shutdown 25.5 – 14 – 1.0 2 min 45 sec
Prime Diluent 35.5 ––––2 min 30 sec
Prime Rinse ––25.8 –– 1 min 20 sec
Prime Fix –––25.8 – 1 min 30 sec
Prime WBC Lyse – 25.8 ––– 1 min 20 sec
Prime Hgb Lyse 2.5 –––4.2 1 min
Prime All Reagents 23.7 16.0 16.0 16.0 4.2 3 min 20 sec
Autoclean 12.5 – 6.0 –– 1 min 35 sec
System Reset Cycle 24.0 – 1.4 – 1.0 1 min 25 sec
62.0 2.1 3.7 1.0 1.4 3 min 40 sec
†
For one background count only. The maximum is three.
– indicates not applicable.
Duration
3-4
Environmental Protection
Removal and recycling of this instrument must be done by a properly qualified laboratory in
accordance with local legislation.
PN 4237615B
Page 61

3.2 PERFORMANCE SPECIFICATIONS
The stated performance specifications apply to an instrument that has been properly
maintained as indicated in
reagents listed in
Recommended Reagents
Reproducibility
Reproducibility (Table 3.2) is based on 20 consecutive replicate runs from one normal, fresh
whole-blood sample without flags.
Table 3.2 Reproducibility Specifications
Parameter CV% Test Level
Chapter 8, DIAGNOSTICS
SPECIFICATIONS/CHARACTERISTICS
PERFORMANCE SPECIFICATIONS
3
, and one that uses only the recommended
.
WBC <2.0%
RBC <2.0%
Hgb <1.0% 15.0 g/dL
Hct <2.0% 45.0%
Plt <5.0%
10.0x10
5.00x10
300.0x10
3
6
/µL
/µL
3
/µL
Linearity
Linearity (Table 3.3) is assessed on serially diluted material. Each dilution is analyzed four
times.
Table 3.3 Linearity Specifications
Difference
Parameter Units Linearity Range
WBC
RBC
Plt
Hgb g/dL 0 to 22.9 ±0.3 or ±2%
Hct % 1.8 to 55.9
10
10
10
3
/µL
6
/µL
3
/µL
0.4 to 90.0 ±0.2 or ±3%
0.23 to 7.70 ±0.05 or ±2%
4 to 1,000 ±10 or ±6%
56.0 to 63.8
(Whichever is Greater)
±2 or ±3%
±5 or ±5%
PN 4237615B
Accuracy
Accuracy (Table 3.4) is assessed by duplicate analysis of clinical specimens when compared
to an automated hematology analyzer that has been properly calibrated and maintained
according to the manufacturer’s recommendation.
Table 3.4 Accuracy Specifications
Parameter Correlation r
WBC >0.95
RBC >0.95
Hgb >0.95
3-5
Page 62

SPECIFICATIONS/CHARACTERISTICS
PERFORMANCE SPECIFICATIONS
Table 3.4 Accuracy Specifications (Continued)
Parameter Correlation r
Hct >0.95
Plt >0.95
Carryover
Carryover (Table 3.5) is assessed by analyzing whole blood with high values followed by a
whole blood sample with low values. Each sample is run consecutively in triplicate.
Carryover is calculated as follows:
Table 3.5 Carryover Specifications
Parameter Carryover
Carryover
Low 1 - Low 3
----------------------- --------------High 1 - Low 3
100×=
WBC <2.0%
RBC <2.0%
Plt <2.0%
Hgb <2.0%
Reportable Range
The reportable range (Table 3.6) is the range of results that the instrument displays, prints,
and transmits. Results between the linear range and the reportable range will be flagged.
Table 3.6 Reportable Range
Parameter Units Reportable Range
WBC
RBC
Plt
Hct % 0.0 – 80.0
Hgb g/dL 0.0 - 30.0
10
10
10
3
6
3
/µL
/µL
/µL
0.0 – 100.0
0.00 – 10.00
0.0 – 1500.0
3-6
PN 4237615B
Page 63

3.3 PERFORMANCE CHARACTERISTICS
Reproducibility
Reproducibility was measured twice to show precision at two levels of WBC counts – one
relatively lower than the other:
r Table 3.7 shows the precision values based on 20 replicate samples that were analyzed
consecutively on the same instrument from one normal, fresh, whole-blood sample with
a low, normal WBC and without flags.
r Table 3.8 shows the precision values based on 20 replicate samples analyzed
consecutively on the same instrument from one normal, fresh, whole-blood sample with
a high, normal WBC and without flags.
Table 3.7 Reproducibility Characteristics From a Normal Sample with a Low Normal WBC Count
Parameter Mean Standard Deviation (SD) CV%
WBC 6.40 0.09 1.42
RBC 4.39 0.03 0.59
SPECIFICATIONS/CHARACTERISTICS
PERFORMANCE CHARACTERISTICS
3
Hgb 13.80 0.06 0.44
Hct 38.60 0.25 0.66
Plt 288.40 7.86 2.73
NE% 60.8 0.73 1.21
LY% 27.3 0.55 2.02
MO% 8.10 0.49 6.09
EO% 3.30 0.32 9.64
BA% 0.60 0.12 20.21
Table 3.8 Reproducibility Characteristics From a Normal Sample with a High Normal WBC Count
Parameter Mean Standard Deviation (SD) CV%
WBC 12.50 0.18 1.41
RBC 5.17 0.03 0.61
Hgb 16.80 0.06 0.33
Hct 48.90 0.32 0.64
Plt 173.60 4.05 2.33
NE% 85.20 0.31 0.36
LY% 7.70 0.37 4.80
MO% 5.30 0.17 3.30
PN 4237615B
EO% 0.90 0.14 15.10
BA% 0.90 0.10 10.59
3-7
Page 64

SPECIFICATIONS/CHARACTERISTICS
LIMITATIONS
Accuracy
Accuracy (Table 3.9) for the CBC and DIFF parameters was defined as agreement between
the comparator instrument and the A
expected range of performance.
Table 3.9 Accuracy Characteristics
Parameter Correlation r
WBC 0.99
RBC 0.99
Hgb 0.99
Hct 0.99
Plt 0.98
NE% 0.99
LY% 0 .9 9
MO% 0.88
C
•T 5diff analyzer using clinical specimens covering the
EO% 0.98
Carryover
Carryover (Table 3.10) was assessed by analyzing whole blood with high values followed by a
whole-blood sample with low values. Each sample was run consecutively in triplicate.
Carryover is calculated as follows:
Table 3.10 Carryover Characteristics
Parameter Units Low Level High Level Carryover %
WBC
RBC
Plt
Hgb g/dL 6.3 25.4 0.26%
3.4 LIMITATIONS
Maintenance
Failure to properly execute the maintenance procedures in
compromise the instrument’s reliability.
10
10
10
3
6
3
/µL
/µL
/µL
Low 1 - Low 3
Carryover
1.5 54.6 0.00%
2.0 8.1 0.16%
35.5 818.0 0.45%
----------------------- --------------High 1 - Low 3
100×=
Chapter 8, DIAGNOSTICS
may
3-8
Blood Specimens
If any abnormal test result (including flagged results or results outside the normal range)
occur, use reference methods or other standard laboratory procedures to verify the results.
For additional information, see
Heading 3.5, INTERFERING SUBSTANCES
.
PN 4237615B
Page 65

3.5 INTERFERING SUBSTANCES
Table 3.11 shows a list of known limitations of automated blood cell counters that use
impedance and light absorbance as measurement principles.
Table 3.11 Interfering Substances
Parameter Interfering Substance
WBC Unlysed RBCs: In rare instances, the erythrocytes in the blood sample may not completely
lyse and are detected on the WBC histogram with an *WBC flag or as an elevated baseline on
the lymphocytes. Non-lysed RBCs will cause a falsely elevated WBC count.
Multiple myeloma: The precipitation of proteins in multiple myeloma patients may cause
elevated WBC counts.
Leukemia: A very low WBC count may result in this disease state due to the possible fragility
of the leukocytes; some of these cells may be destroyed during counting. WBC fragments
will also interfere with the WBC DIFF parameters.
Chemotherapy: Cytotoxic and immunosuppressive drugs may increase the fragility of the
leukocytes, which may cause low WBC counts.
Cryoglobulins: Increased levels of cryoglobulin that may be associated with myeloma,
carcinoma, leukemia, macroglobulinemia, lymphoproliferative disorders, metastic tumors,
autoimmune disorders, infections, aneurysm, pregnancy, thromboembolic phenomena,
diabetes, and so forth, which can elevate the WBC, RBC, or Plt counts and the Hgb
concentration. The specimen must be warmed to 37°C (99°F) in a water bath for 30 minutes
and reanalyzed immediately (analyzer or manual method).
Agglutinated WBCs: Leukoagglutination.
†
RBC
Hgb Turbidity of the blood sample: Any number of physiologic and/or therapeutic factors may
Agglutinated RBCs: May cause a falsely low RBC count. Blood samples containing the
agglutinated RBCs may be suspected by elevated MCH and MCHC values and shown by
examination of the stained blood film.
Cold agglutinins: IgM immunoglobulins elevated in cold agglutinin disease may lower RBC
and Plt counts and increase MCV.
produce falsely elevated Hgb results. To obtain accurate Hgb results when increased
turbidity of the blood sample occurs, determine the cause of the turbidity and follow the
appropriate method below:
Elevated WBC: An extremely elevated WBC will cause excessive light scatter. If this
r
occurs:
1. Use the reference (manual) methods.
2. Centrifuge the diluted sample.
3. Measure the supernatant fluid with a spectrophotometer.
Elevated lipids: Elevated lipids in the blood sample will give the plasma a milky
r
appearance. This condition can occur with hyperlipidemia, hyperproteinemia (as in
gammapathies), and hyperbilirubinemia. Accurate hemoglobin determinations can be
achieved by using reference (manual) methods and a plasma bank.
Increased turbidity: This may be seen in cases where the RBCs are resistant to lysing.
r
This condition will cause a falsely elevated Hgb result but may be detected by
observing the abnormal MCH, MCHC values, and the increased baseline on the leading
edge of the WBC histogram. Erroneous Hgb results will cause the results of MCH and
MCHC to also be erroneous.
Fetal bloods: The mixing of fetal and maternal blood may produce a falsely elevated
r
Hgb value.
SPECIFICATIONS/CHARACTERISTICS
INTERFERING SUBSTANCES
3
PN 4237615B
3-9
Page 66

SPECIFICATIONS/CHARACTERISTICS
INTERFERING SUBSTANCES
Table 3.11 Interfering Substances (Continued)
Parameter Interfering Substance
Hct RBC agglutination: May produce erroneous Hct and MCV values. RBC agglutination may be
detected by observing abnormal MCH and MCHC values, and by examining the stained blood
film. Use the manual method to obtain an accurate Hct value.
MCV RBC agglutination: May produce an erroneous MCV value. RBC agglutination may be
detected by observing abnormal MCH and MCHC values, and by examining the stained blood
film. Use the manual method to obtain an accurate MCV value.
Excessive numbers of large platelets: This condition and/or the presence of an excessively
high WBC count may interfere with the accurate determination of the MCV value. Carefully
examine the stained blood film to detect the problem.
MCH MCH is determined according to the Hgb value and the RBC count, which means that
anything listed as an interfering substance for Hgb and/or RBC will impact MCH and may
cause erroneous MCH values.
MCHC MCHC is determined according to the Hgb and Hct values, which means that anything listed
as an interfering substance for Hgb and/or Hct will impact MCHC and may cause erroneous
MCHC values.
RDW RDW is determined according to the RBC count and may be impacted by the following
conditions:
Agglutinated RBCs: May cause a falsely low RBC count and erroneous RDWs. Blood
r
samples containing the agglutinated RBC may be detected by observing abnormal MCH
and MCHC values and by examining the stained blood film.
Nutritional deficiency or blood transfusion: May cause elevated RDW results due to
r
iron, cobalamin, and/or folate deficiencies.
Plt Very small RBCs (microcytes), RBC fragments (schizocytes), and WBC fragments: May
interfere with the proper counting of platelets and cause elevated Plt counts.
Agglutinated RBCs: May trap platelets, causing an erroneously low Plt count. The presence
of agglutinated RBCs may be detected by observing abnormal MCH and MCHC values and by
examining the stained blood film.
Excessive numbers of large platelets: May cause an erroneously low Plt count since these
large platelets may exceed the upper threshold for the Plt parameter are not counted.
Chemotherapy: Cytotoxic and immunosuppressive drugs may increase the fragility of these
cells, which may cause low Plt counts. Use the manual (reference) method to obtain an
accurate Plt count.
Hemolysis: Hemolysed specimens contain RBC stroma which may elevate Plt count.
ACD (acid-citrate-dextrose) blood: Blood anticoagulated with ACD may contain clumped Plt
which could depress the Plt count.
Plt Agglutination: Clumped platelets may cause a decreased Plt count and/or elevated WBC
count; *WBC, SL, and SL1 flags may be generated. Reanalyze the specimen as follows:
3-10
1. Recollect the specimen in sodium citrate anticoagulant to prevent platelet
agglutination.
2. Reanalyze the specimen for only the Plt count.
3. Correct the final Plt result for the effect of the sodium citrate dilution.
PN 4237615B
Page 67

Table 3.11 Interfering Substances (Continued)
Parameter Interfering Substance
SPECIFICATIONS/CHARACTERISTICS
INTERFERING SUBSTANCES
3
‡
MPV
NE#, NE% The neutrophil count is derived from the WBC count. The presence of excessive eosinophils,
LY#, LY% The lymphocyte count is derived from the WBC count. The presence of erythroblasts, certain
MO#, MO% The mononuclear cell count absolute is derived from the WBC count. The presence of large
EO#, EO% The eosinophil cell count is derived from the WBC count. The presence of abnormal granules
Giant platelets: May exceed the upper threshold of the Plt parameter and may not be counted
as platelets. Consequently, these larger platelets will not be included in the instrument’s
calculation of MPV.
Very small RBCs (microcytes), RBC fragments (schizocytes), and WBC fragments: May
interfere with the proper counting of platelets.
Agglutinated RBCs: May trap platelets, causing an erroneous MPV result. You may be able to
detect the presence of agglutinated RBCs by observing abnormal MCH and MCHC values and
by examining the stained blood film.
Chemotherapy: May also affect the sizing of platelets.
metamyelocytes, myelocytes, promyelocytes, blasts, and plasma cells may interfere with an
accurate neutrophil count.
parasites, and RBCs that are resistant to lysis may interfere with an accurate LY count.
Interfering substances pertaining to WBC also pertain to the LY# and LY%.
lymphocytes, atypical lymphocytes, blasts, and an excessive number of basophils may
interfere with an accurate monocyte count. Interfering substances pertaining to WBC also
pertain to the MO# and MO%.
(degranulated areas, toxic granules, and so forth) may interfere with the eosinophil count.
Interfering substances pertaining to WBC also pertain to the EO# and EO%.
BA#, BA% The basophil cell count is derived from the WBC count. Interfering substances pertaining to
WBC also pertain to the BA# and BA%.
†
The RBC dilution contains all formed elements in the blood, erythrocytes, leukocytes, and platelets. During the counting of the RBCs,
‡
Blood samples collected in EDTA will not maintain a stable MPV because platelets swell depending on the time post-collection and
platelets are not counted if their size falls below the RBC minimum threshold.
storage temperature.
PN 4237615B
3-11
Page 68

SPECIFICATIONS/CHARACTERISTICS
INTERFERING SUBSTANCES
3-12
PN 4237615B
Page 69

4.1 DEFINITIONS
Warnings
Anything that can cause user injury is considered a hazard and is noted in the text as
WARNING. Warnings appear where needed throughout this manual.
Cautions
Anything that can cause instrument damage is considered a caution and is noted in the text as
CAUTION. Cautions appear where needed throughout this manual.
Importants
Anything that can cause misleading results or data corruption is considered an important and
is noted in the text as IMPORTANT. Importants appear where needed throughout this
manual.
Attention
An ATTENTION provides additional information to be considered when performing a
procedure.
PRECAUTIONS/HAZARDS
4
4
4.2 SAFETY PRECAUTIONS
Electronic
WARNING
To prevent possible injury or shock, do not tamper with the instrument and do not remove any components
(covers, doors, panels, and so on) unless otherwise instructed within this document.
Biological
WARNING
servicing the instrument, you may become injured or contaminated. To prevent possible injury or biological
contamination, you must wear proper laboratory attire, including gloves, a laboratory coat, and eye
protection.
Use care when working with pathogenic materials. Be sure that you have a procedure
available to decontaminate the instrument, provide ventilation, and dispose of waste liquid
and sharps. Refer to the following publications for further guidance on decontamination.
r Biohazards Safety Guide, 1974, National Institute of Health.
r Classifications of Etiological Agents on the Basis of Hazards, 3d ed., June 1974, Center
Risk of personal injury from electronic shock. Electronic components can shock and injure you.
Risk of personal injury or contamination. If you do not properly shield yourself while using or
for Disease Control, U.S. Public Health Service.
PN 4237615B
Moving Parts
WARNING
personal injury. When you operate the instrument, be sure all covers and doors are closed.
Risk of personal injury. Operating the instrument with doors and/or covers open can cause
4-1
Page 70

PRECAUTIONS/HAZARDS
OPERATIONAL HAZARDS
4.3 OPERATIONAL HAZARDS
Safety symbols alert you to potentially dangerous conditions. These symbols, together with
text, apply to specific procedures and appear as needed throughout this manual.
Symbol Warning Condition Action
Biohazard
!
(specimens, reagents, controls,
calibrators, and so forth)
.
Consider all materials
and areas
Wear standard laboratory attire and follow safe
laboratory procedures when handling any
material in the laboratory.
these materials come into
contact with
infectious.
Probe hazard.
!
!
and may contain biohazardous
materials, such as controls and
calibrators.
Electrical shock hazard
of electrical shock when
instrument is plugged into the
power source.
as being potentially
The probe is sharp
.
Possibility
Avoid any unnecessary contact with the probe
and probe area.
Before continuing, unplug the A
analyzer from the electrical outlet.
C
•T 5diff
4-2
PN 4237615B
Page 71

5.1 BEFORE ANALYSIS
Do the following procedures:
Waste Container Level Check
r
Printer Check
r
Startup
r
Specimen Collection and Mixing
r
Running Cell Controls to Verify Calibration
r
Waste Container Level Check
At the beginning of each day, check the waste container to determine if it needs to be
replaced. If so, do
Printer Check
At the beginning of each day, be sure the printer is ready to print.
,
,
,
, and
.
Replacing the Waste Container
RUNNING SAMPLES
5
.
5
1
Be sure there is an adequate paper
supply in the printer.
r If so, go to step 2.
r If not, add paper according to the
printer’s user manual.
2
Press the printer’s ON/OFF switch until
the control LEDs are on.
3
Be sure the printer is properly
configured. See
CONFIGURATION
Heading A.10, PRINTER
for details.
PN 4237615B
5-1
Page 72

RUNNING SAMPLES
BEFORE ANALYSIS
Startup
Startup During Power Up
When you turn on the instrument, Startup is automatically done if the unit has been put in
Shutdown. If you want to do Startup again, do
1
Turn the instrument on.
The instrument performs the Startup
routine (a rinse cycle followed by a
background count, which is an analysis
cycle on reagent without any blood
specimen).
Upon completion of the Startup cycle,
the instrument displays and prints the
results.
Startup After Power Up
.
16:05
IMPORTANT
Risk of erroneous results if the
instrument’s heating devices have not reached
35°C (95°F). Allow the instrument to warm to
35°C (95°F). This may take several minutes to
do. Keep the right door closed.
Review the Startup results.
2
r If Startup passed, go to
Collection and Mixing
Specimen
.
r If Startup failed, go to step 3.
BACKGROUND COUNT IN PROGRESS
10%
5-2
PN 4237615B
Page 73

If the background counts are not
3
within acceptable limits after the first
Startup cycle, the instrument
automatically performs Startup up to
two more times. If Startup fails after the
third attempt, a STARTUP FAILED
message appears on the screen and on
the report for every cycle.
: The background count limits are:
Note
3
/µL
3
/µL
3
WBC = 0.3 x 10
RBC = 0.03 x 10⁶/µL
Hgb = 0.3 g/dL
Plt = 7.0 x 10
a. Do
b. If Startup continues to fail, contact
Startup After Power Up
a Beckman Coulter representative.
RUNNING SAMPLES
BEFORE ANALYSIS
3
3
.
5
If the system determines that there is
insufficient reagent to complete the
day’s work, a REAGENT LOW LEVEL
message appears.
r Identify the low reagent and
change it according to the
procedures in
OR
r Continue and change the reagent
when the specific reagent low
message is displayed.
Startup After Power Up
Do this procedure if you want to run Startup after the instrument has already gone through
the initial Startup routine at power up.
Press .
1
Replacing Reagents
.
PN 4237615B
5-3
Page 74

RUNNING SAMPLES
BEFORE ANALYSIS
2
Review the Startup results.
r If Startup passed, go to
Collection and Mixing
.
r If Startup failed, go to step 3.
If the background counts are not
3
within acceptable limits after the first
Startup cycle, the instrument
automatically performs Startup up to
two more times. If Startup fails after the
third attempt, a STARTUP FAILED
message appears on the screen and on
the report for every cycle.
Note: The background count limits are:
WBC = 0.3 x 10
3
/µL
RBC = 0.03 x 10⁶/µL
Hgb = 0.3 g/dL
3
/µL
3
a. Do
Plt = 7.0 x 10
Startup After Power Up
b. If Startup continues to fail, contact
a Beckman Coulter representative.
If the system determines that there is
insufficient reagent to complete the
day’s work, a REAGENT LOW LEVEL
message appears.
Specimen
3
3
.
5-4
r Identify the low reagent and
change it according to
Reagents
.
Replacing
OR
r Continue and change the reagent
when the specific reagent low
message is displayed.
PN 4237615B
Page 75

Specimen Collection and Mixing
!
RUNNING SAMPLES
BEFORE ANALYSIS
5
IMPORTANT
specimen collection tube is not filled to the
quantity required by the tube manufacturer. Fill
the specimen collection tube as required.
Using K3EDTA as the anticoagulant,
1
collect the required amount of venous
specimen according to the tube
manufacturer’s requirements.
Note:
microcontainer with a minimum
volume of 100µL for analysis on this
instrument.
Mix the blood specimen gently and
2
thoroughly before analysis.
Risk of erroneous results if the
You can collect blood into a
PN 4237615B
Running Cell Controls to Verify Calibration
Before analyzing patient samples, ensure that the system is within acceptable operating limits
by analyzing three levels (low, normal, and high) of cell control material.
The cell control for the A
C
•T 5diff hematology analyzer is AC•T 5diff Control.
!
CBC
Press to select the desired analysis
1
mode (CBC or CBC/DIFF). The mode
selected appears on the screen.
DIFF
5-5
Page 76

RUNNING SAMPLES
BEFORE ANALYSIS
2
Enter the cell control number as the
sample ID.
!
Mix each control according to the
3
instructions in the cell control package
insert.
Inspect the vial’s contents to ensure
that all cells are uniformly distributed;
if not, repeat this step.
!
Present the cell control vial to the
4
sample probe, and press the aspirate
switch.
The LEDs flash during sample
aspiration.
b
c
5-6
When the red LED illuminates, remove
5
the cell control tube from the probe.
When the green LED remains
illuminated, the instrument is ready for
the next analysis.
PN 4237615B
Page 77

Repeat steps 1 through 5 until you have
6
run all three levels of cell control.
Review the control results to ensure
7
they are within the acceptable ranges.
r If so, then you are ready to analyze
patient samples. See
ANALYSIS
r If not, go to step 8.
When control results are not within the
8
acceptable ranges:
.
Heading 5.2,
RUNNING SAMPLES
BEFORE ANALYSIS
5
a. Rerun the control. If results are
still outside the acceptable ranges,
do step b.
b. Clean the system. See
System
c. Rerun the control. If the results are
still outside the acceptable ranges,
do step d.
d. Analyze a new cell control vial. If
the results are still outside the
acceptable ranges, do step e.
e. Recalibrate the system. See
Heading 7.3, AUTO-CALIBRATION
rerun the control.
r If the results are still outside
r If your cell control results are
.
the acceptable ranges, contact
a Beckman Coulter
representative.
within the acceptable ranges,
you are ready to analyze
patient samples in
Heading 5.2, ANALYSIS
Diluter
and
.
PN 4237615B
5-7
Page 78

RUNNING SAMPLES
ANALYSIS
5.2 ANALYSIS
Running Whole-Blood Samples
!
Verify that the sample ID in the Next
1
ID field is correct.
r If so, go to step 2.
r If not, enter the sample ID as
instructed in
Heading 5.5, ENTERING
THE SAMPLE IDENTIFICATION (ID)
.
If you want to change the sample
2
analysis mode from what is currently
CBC
selected, press .
DIFF
The current analysis mode and range
are displayed on the bottom right of the
screen.
If you want to change the Range from
3
what is currently selected, press
until the desired flagging range
appears.
Mix the sample according to your
4
laboratory’s protocol.
RANGE
ID 1007
RBC
4.62
HGB
13.4
HCT
40.5
MCV
88
MCH
29.1
MCHC
33.1
RDW
13.
PLT
280
ANALYZING
NEXT ID 1008
WBC
NE
LY
MO
EO
BA
12 / 07 / 99
12.3 H
64.1
27.8
5.6
1.8
0.7
16:05
CBC/DIFF 1
5-8
PN 4237615B
Page 79

Remove the cap from the sample tube
5
according to your laboratory’s protocol.
!
Present the sample to the probe and
6
press the aspirate switch.
The LEDs flash during sample
aspiration.
b
RUNNING SAMPLES
ANALYSIS
c
5
When the red LED remains
7
illuminated, remove the tube from the
probe.
When the green LED remains
illuminated, the instrument is ready for
the next analysis.
The sample results appear on the
8
screen and print according to
instrument setup.
ID 1007
RBC
4.62
HGB
13.4
HCT
40.5
MCV
88
MCH
29.1
MCHC
33.1
RDW
13.
PLT
280
ANALYZING
NEXT ID 1008
WBC
NE
LY
MO
EO
BA
12 / 07 / 99
12.3 H
64.1
27.8
5.6
1.8
0.7
16:05
CBC/DIFF 1
PN 4237615B
5-9
Page 80

RUNNING SAMPLES
AFTER ANALYSIS
If Autonumbering is on, the instrument
9
is ready to run the next sample.
If Autonumbering is off, enter the next
sample ID manually or with the
optional barcode reader.
5.3 AFTER ANALYSIS
Results
When analysis is completed, the instrument displays the results and prints the report.
Figure 5.1 is an example of a sample report.
If flags appear on the results, see
Figure 5.1 Sample Report
Chapter 6, REVIEWING RESULTS
.
5-10
Printing Results for Last Sample Analyzed
There are two ways you can print results for the last sample analyzed:
r If the run screen is displayed, press .
r If the run screen is not displayed, beginning at the Main menu, select
PRINT LATEST RESULT
tt
.
SETUP
tt
PRINTER
PN 4237615B
Page 81

Auto-Clean
An auto-clean (automatic cleaning) is performed by the instrument after a specified number
of samples is analyzed. You can set the frequency from 1 to 75; see
FREQUENCY SETTING
5.4 SHUTDOWN
At the end of each day, do this procedure to rinse the instrument and place it in a stand-by
mode.
Press .
1
The instrument cycles Rinse reagent for
cleaning and goes into a stand-by
mode.
RUNNING SAMPLES
SHUTDOWN
Heading A.19, AUTO-CLEAN
.
5
When Shutdown is complete:
2
r Allow the instrument to remain in
stand-by mode,
OR
r Turn the instrument off.
: After doing Shutdown, you must
Note
do a
Startup
instrument again.
before operating the
5.5 ENTERING THE SAMPLE IDENTIFICATION (ID)
Three methods are available for entering sample IDs on this instrument: auto-numbering,
manual, and barcode (optional). For details on selecting the sample ID mode, see
Heading A.14, SELECTING THE SAMPLE IDENTIFICATION (ID) MODE
ATTENTION:
analysis cycle will not start.
Auto-Numbering
If your instrument is configured to the Autonumbering ID mode, the instrument
automatically assigns a sample ID (from 1 to 99999) and increments the number before each
analysis.
If the system is set up for a manual ID and no sample ID has been entered, the
.
PN 4237615B
If you want to override the current autonumber and enter another sample ID, do this
procedure.
5-11
Page 82

RUNNING SAMPLES
ENTERING THE SAMPLE IDENTIFICATION (ID)
!
Enter the sequence number in the
1
Next ID field.
Press when the ID is complete.
2
Running Whole-Blood Samples
Do
3
.
The ID of the current sample appears in
the upper left corner of the screen, and
the ID of the next sample appears in
the Next ID field.
Manual Sample ID
If your instrument is configured for Manual ID entry, do this procedure to enter a sample
identification. You can enter up to 16 alphanumeric characters in the sample ID.
!
Press or to scroll through the
1
available alpha characters, or enter the
number at the numeric keypad.
5-12
Move the cursor by pressing or
2
.
PN 4237615B
Page 83

Repeat steps 1 and 2 until you have
3
entered the sample ID.
Press when the ID is complete.
4
The ID of the current sample appears in
the Analyzing field, and the ID of the
next sample appears in the Next ID
field.
Running Whole-Blood Samples
Do
5
RUNNING SAMPLES
ENTERING THE SAMPLE IDENTIFICATION (ID)
.
5
Scanning the Sample ID with the Barcode Reader
The barcode reader is optional. If your system is equipped with a barcode reader, you can scan
the sample ID into the system.
ATTENTION:
correct sample identification.
Beckman Coulter recommends that you verify each barcode reading to ensure
!
Locate the barcode on the sample tube
1
label.
PN 4237615B
5-13
Page 84

RUNNING SAMPLES
ENTERING THE SAMPLE IDENTIFICATION (ID)
IMPORTANT
the entire barcode is not captured with the barcode
reader, especially with Interleaved 2-of-5 barcode
format. Position the barcode reader over the label
to capture the entire barcoded sample ID.
Otherwise, part of the sample ID may not be
scanned, resulting in mis-identification. Pass the
barcode reader over the barcode label on the
sample tube.
Pass the barcode reader over the
2
Risk of sample mis-identification if
barcode label on the sample tube.
The ID of the current sample appears in
the Analyzing field, and the ID of the
next sample appears in the Next ID
field.
Verify each barcode reading to ensure
3
correct sample identification.
5-14
PN 4237615B
Page 85

6.1 GENERAL
Patient sample results are generated from sample analysis. There may be instances when a
patient sample result is flagged or a parameter number is replaced by a flag.
Carefully review all patient sample results, especially results with flags and/or messages. For
details, see
MESSAGES
Heading 6.3, FLAGS GENERATED BY THE INSTRUMENT
.
REVIEWING RESULTS
6
Heading 6.4, INTERPRETIVE
and
6
IMPORTANT
rare instances, especially for samples where fibrin or other debris is likely to occur (such as pediatric or
oncology samples), a transient or partial blockage may not be detected by the instrument. Therefore, verify
flagged results for accuracy and review any result that exceeds your laboratory’s limits.
Risk of result inaccuracy if a transient or partial blockage is not detected by the instrument. In
6.2 FLAGS AND INTERPRETIVE MESSAGES
Flags
Definition
A flag is a symbol, set of symbols, or letters generated by the instrument to signal that a
certain parameter requires additional attention. Flags can be:
r Linked to a result when it exceeds the normal limits.
r Linked to a problem in the morphology of the blood cell population.
r Linked to instrument operation.
For details, see
Types of Flags
This instrument uses two types of flags – replacement and non-replacement flags.
Heading 6.3, FLAGS GENERATED BY THE INSTRUMENT
.
PN 4237615B
r Replacement flags, also called codes, replace a parameter’s numeric results.
r Non-replacement flags appear next to the parameter results. Up to two of these flags can
be displayed for a parameter.
Types of Flag Printout Formats
The system provides two printout formats for reporting the DiffPlot and histogram flags on
the patient report –
r If the DIFFPLOT AND HISTROGRAM FLAGS print option is
flagged using the
r If the DIFFPLOT AND HISTOGRAM FLAGS print option is selected, samples are flagged
using the
For additional information on print options, see
additional information on flag printout formats, see
Suspect
Detailed
and
Suspect
format.
Detailed
format.
.
: This is the default setting.
Note
Configuring the Instrument’s Printer Settings
Suspect or Detailed Flag Format
selected, samples are
not
.
. For
6-1
Page 86

REVIEWING RESULTS
FLAGS GENERATED BY THE INSTRUMENT
Interpretive Messages
Definition
Interpretive messages are triggered from the flagging limits established by your laboratory.
These messages indicate possible pathological disorders. For details, see
INTERPRETIVE MESSAGES
.
6.3 FLAGS GENERATED BY THE INSTRUMENT
The following sections define these general instrument-generated flags:
r Results Exceeding Instrument Capacity,
r Hemoglobin Errors,
r Voteout Flag,
r WBC Count Flag,
r DiffPlot Flags,
r CBC Flags, and
r Patient Ranges and Action Ranges.
Heading 6.4,
Results Exceeding Instrument Capacity
If a result exceeds instrument capacity, the result will be indicated as follows:
r If the result is below the lower limits of the instrument, the result will be reported as 0.
For example, if the WBC is less than 0.1x10
r If the result is outside the limits at which the parameter can be calculated, the result is
replaced by
r If the result is above the instrument’s linear range, the result is flagged with
result is above the instrument’s reportable range, the result is replaced by
In addition, related parameters may also be flagged or replaced.
. . . .
.
3
/µL, WBC is reported as 0.0.
+
, or if the
++++
Hemoglobin Errors
Hgb Blank Error
The instrument establishes a reference blank reading and compares each sample blank to the
reference result. If the blank differs from the reference by more than an allowable amount, the
Hgb, MCH, and MCHC results are flagged with a review “ R” flag.
If three consecutive samples produce a Hgb blank error, the Hgb, MCH, and MCHC results
are replaced by
. . . .
on the third sample.
.
6-2
Hgb Read Error
The instrument reads each sample three times. If the difference among the three readings
exceeds a predefined limit, the Hgb, MCH, and MCHC results are flagged with a voteout “V”
flag.
PN 4237615B
Page 87

REVIEWING RESULTS
FLAGS GENERATED BY THE INSTRUMENT
Voteout Flag
The instrument performs two counts on the WBC, RBC, Hct, and Plt. If the results for the two
counts differ by more than a predefined limit, the WBC, RBC, Hct, and Plt results are flagged
with a voteout “V” flag.
r If the WBC result is flagged with a V, then the DIFF number results are also flagged with
a V.
r If the RBC result is flagged with a V, then the MCV, MCH, MCHC, and RDW results are
replaced by
r If the Hct result is flagged with a V, then the MCV and MCHC results are replaced by
.
. . . .
r If the Plt counts votes out, then the Plt result is flagged with a V.
. . . .
.
WBC Count Flag
During the data collection for the DiffPlot, the instrument also determines the WBC count
from the flowcell.
The WBC flag DIFF- or DIFF+ is reported:
6
r If the WBC count from the flowcell exceeds the WBC count from the WBC/BASO bath
by more than a predefined amount, DIFF+ is displayed.
r If the WBC count from the flowcell is less than the WBC count from the WBC/BASO
bath by more than a predefined amount, DIFF- is displayed.
r When a DIFF- or a DIFF+ flag occurs, the WBC count and all DIFF parameters are
flagged with an
: The comparison between the WBC count from the WBC/BASO bath and the WBC
Note
count from the flowcell will not be performed when the sample is analyzed in the CBC mode
or when this option is disabled in setup.
.
*
DiffPlot Flags
When populations in the DiffPlot exceed the limits set for that region, a review (R) flag will
occur on the DIFF parameter related to that region.
If the R flag occurs on a DIFF parameter, further investigate the result.
Twelve different flags may occur related to the position of the populations within the DiffPlot:
Reject r UM (upper monocyte)
r
r DB (debris) r LN (lower neutrophil)
r SL (small lymphocytes) r UN (upper neutrophil)
PN 4237615B
r SL1 (small lymphocytes 1) r NE (neutrophil/eosinophil)
r NL (neutrophil/lymphocyte) r ATL (atypical lymphocytes)
r MN (monocyte/neutrophil) r IMM (immature cells)
See Table 6.1 for additional information.
6-3
Page 88

REVIEWING RESULTS
FLAGS GENERATED BY THE INSTRUMENT
Table 6.1 Definition of DIFF Flags
DiffPlot
Region
Flag DiffPlot Region Affected Description Flags
Suspected
Abnormalities
DB
The system
detects a problem
with volume and
absorbance
measurements in
the flowcell.
More than 50% of
the pulses were
rejected.
Occurs when the
number of pulses
in the DB region
exceeds the DB#
limit.
Default values:
100% or 120
particles.
next to all
R
DIFF
parameters.
is displayed
DB
and printed in
WBC flag area.
Plt aggregates
Increased Plt count
RBCs resistant to
lysis (stroma)
NRBCs
Reagent
contamination
SL
Occurs when the
number of
particles that are
counted in the SL
region is higher
than the SL# limit.
Default values:
100% or 50
particles.
next to:
R
NE%, NE#,
LY%, LY#,
MO%, MO#,
EO%, EO#,
ATL%, ATL#,
IMM%, IMM#.
displayed
SL
and printed in
WBC flag area.
Small lymphocytes
Plt aggregates
NRBCs
RBCs resistant to
lysis (stroma)
6-4
PN 4237615B
Page 89

FLAGS GENERATED BY THE INSTRUMENT
Table 6.1 Definition of DIFF Flags (Continued)
DiffPlot
Region
Flag DiffPlot Region Affected Description Flags
REVIEWING RESULTS
6
Suspected
Abnormalities
SL1
NL
Occurs when the
number of
particles in the SL
region is higher
than the SL1
number limit
when the
percentage of
particles in the SL
region, relative to
the lymphocyte
region, exceeds
the SL1
percentage limit.
Default values: 5%
or 45 particles.
Occurs when the
number of
particles in the NL
separation region
is above the limits
set.
Default values: 3%
or 120 particles.
and
May trigger
interpretive
messages.
NRBCs, Plt
aggregates, and
NRBCs plus Plt
aggregates
is displayed
SL1
and printed in
the WBC flag
area.
next to:
R
NE%, NE#,
LY%, and LY#.
is displayed
NL
and printed in
WBC flag area.
Plt aggregates
NRBCs
RBCs resistant to
lysis (stroma)
Small abnormal
lymphocytes
Small Neutrophils
without granules
and/or slight
nuclear
segmentation
Lymphocytes with
segment nuclei
Neutrophils with
weak membranes
(smudge/smear
cells)
PN 4237615B
MN
Occurs when the
number of
particles in the MN
separation region
is above the limits
set.
Default values:
100% or 120
particles.
next to:
R
ATL%, ATL#,
IMM%, and
IMM#.
Replaces NE%,
NE#, MO%, and
MO# with
. . . .
.
is displayed
MN
and printed in
WBC flag area.
Monocytes with
granules or
hyperbasophilic
monocytes
Immature
neutrophils with
non-segmented
nuclei (band cells)
6-5
Page 90

REVIEWING RESULTS
FLAGS GENERATED BY THE INSTRUMENT
Table 6.1 Definition of DIFF Flags (Continued)
DiffPlot
Region
Flag DiffPlot Region Affected Description Flags
Suspected
Abnormalities
UM
LN
Occurs when the
number of
particles in UM
region is above the
limits set.
Default values:
1.1% or 999
particles.
Occurs when the
number of
particles in the LN
region is above the
limits set.
Default values:
2.5% or 999
particles.
next to:
R
NE%, NE#,
MO%, MO#,
IMM%, and
IMM#.
displayed
UM
and printed in
WBC flag area.
next to all
R
WBC DIFF
parameters.
is displayed
LN
and printed in
WBC flag area.
Large monocytes
Hyperbasophilic
monocytes
Myelocytes
Promyelocytes
Large blasts
Neutrophil
degradation due to
improper storage or
sample age
Plt aggregates
RBCs resistant to
lysis (stroma)
Reagent
contamination
UN
Occurs when the
number of
particles in the UN
region is above the
limits set.
Default values:
1.1% or 999
particles.
next to:
R
NE%, NE#,
IMM%, IMM#
is displayed
UN
and printed in
WBC flag area.
Large neutrophils
Immature
granulocytes:
Metamyelocytes
r
Myelocytes
r
Promyelocytes
r
6-6
PN 4237615B
Page 91

FLAGS GENERATED BY THE INSTRUMENT
Table 6.1 Definition of DIFF Flags (Continued)
DiffPlot
Region
Flag DiffPlot Region Affected Description Flags
REVIEWING RESULTS
6
Suspected
Abnormalities
NE
ATL
Occurs when the
number of
particles the NE
separation region
is above the limits
set.
Default values:
1.1% or 60
particles.
Occurs when a
significantly large
population is
located in the ATL
region.
ATL flag is
triggered from the
Patient Limits, and
the interpretive
message (
Lymphocyte
triggered from the
Action Limits.
Default values: 2%
or 0.2x10
Atypical
) is
9
/L.
next to:
R
IMM% and
IMM#.
Replaces NE%,
NE#, EO%, and
EO# with
. . . .
.
is displayed
NE
and printed in
WBC flag area.
is displayed
ATL
and printed in
WBC flag area.
May be
displayed and
printed as
ATL% and
ATL#.
Young eosinophils
Giant
hypersegmented
neutrophils
Eosinophils with
low
intracytoplasmic
material (agranular
eosinophils)
Large lymphocytes
Reactive
lymphocytes
Stimulated
lymphocytes
Plasma cells
PN 4237615B
IMM
Occurs when a
significantly large
population of cells
is located in UN,
UM, and channel
127 regions.
IMM flag is
triggered from the
Patient Limits, and
the interpretive
message (
Immature Cell
triggered from the
Action Limits.
Default values: 2%
or 0.2x10
Large
9
/L.
) is
is
IMM
displayed and
printed in WBC
flag area.
May be
displayed and
printed as
IMM% and
IMM#.
Large monocytes
Hyperbasophilic
monocytes
Myelocytes,
metamyelocytes,
promyelocytes
Large blasts
Large neutrophils
6-7
Page 92

REVIEWING RESULTS
FLAGS GENERATED BY THE INSTRUMENT
CBC Flags
There are three types of CBC flags:
r WBC/BASO histogram flags,
r RBC histogram flags, and
r Plt histogram flags.
See Table 6.2 for additional information.
Table 6.2 CBC Histogram Flags
Histogram Flag Illustrations of Histogram Flags Description
WBC/BASO
*WBC Figure 6.1 WBC/BASO Histogram Flags:
CBC Mode
WBC
BA1 BA2 BA3
MB
(Mono
Figure 6.2 WBC/BASO Histogram Flags:
CBC/DIFF Mode
Baso)
BA1 BA2 BA3
BASO+
BASO
Determined from the ratio of the cells
counted between the 0 channel and
BA1.
Indicates the presence of an
abnormal number of cells in
comparison to leukocytes. Plt
aggregates and NRBCs may be found
in this region.
Default value: 3.5% or 999 particles.
Generated when the percentage of
basophils found in the BA channel is
above the percentage of the
LY/MO/NE raw count found on the
DIFF channel.
If the BASO% exceeds 50%, a
BASO+ flag is generated. The
basophils are not taken away from
the DiffPlot LY/MO/NE populations.
is displayed and printed instead
. . . .
of the BA% and BA#.
6-8
PN 4237615B
Page 93

FLAGS GENERATED BY THE INSTRUMENT
Table 6.2 CBC Histogram Flags (Continued)
Histogram Flag Illustrations of Histogram Flags Description
REVIEWING RESULTS
6
RBC
MICRO
and/or
MACRO
Figure 6.3 MICRO and MACRO Regions
on RBC Histogram
RBC2
RBC1
%MICRO
%MACRO
MICRO and MACRO flags are
generated when the percentage of
cells counted in the microcytic
(MICRO) and macrocytic (MACRO)
regions compared to the total
number of RBCs are above the
established limits set by your
laboratory.
Thresholds RBC1 and RBC2 define
the MICRO and MACRO regions and
are calculated based on the standard
deviation of a normal RBC
population.
Default value: 5% for MICRO and
7.5% for MACRO.
: MICRO and MACRO flags will
Note
be activated in software version 1.0
and higher.
PN 4237615B
6-9
Page 94

REVIEWING RESULTS
FLAGS GENERATED BY THE INSTRUMENT
Table 6.2 CBC Histogram Flags (Continued)
Histogram Flag Illustrations of Histogram Flags Description
Plt
MIC
and
SCH
Figure 6.4 Plt Flags
3
25µ
30
Figure 6.5 Mobile Threshold Positioned
in the Standard Regions (Between 18fL
and 25fL)
2
18
25µ
30
Figure 6.6 Mobile Threshold Cannot Be
Positioned in the Standard Region
3
18
25µ
30
The Plt histogram has 256 channels
between 2fL and 30fL. A mobile
threshold (at 25fL by default)
(Figure 6.4) moves according to the
presence of microcytic RBCs present
in the Plt analysis region. Plt flags
generate when the following three
conditions occur.
1. If the mobile threshold can be
positioned in the standard region,
between 18fL and 25fL, the MIC
(Microcytes) flag will be shown in
the Plt alarm region. See
Figure 6.5.
The Plt result is reliable.
2. If a valley is not detected by the
18fL threshold, the threshold is
placed at the 18fL position and a
MIC flag is generated. If the
interference is significant, the Plt
count will also be flagged.
3. If the mobile threshold cannot be
positioned between 18fL and
25fL, the threshold is placed at
the 18fL position, an SCH
(schistocytes) flag is generated,
and the Plt count is flagged.
Suspected abnormalities include
the presence of schistocytes
and/or the presence of Plt
aggregates. See Figure 6.7
The Plt result is not reliable.
Verify the result by an alternative
method.
6-10
Figure 6.7 Mobile Threshold Cannot Be
Positioned
25µ18
2
30
PN 4237615B
Page 95

FLAGS GENERATED BY THE INSTRUMENT
Table 6.2 CBC Histogram Flags (Continued)
Histogram Flag Illustrations of Histogram Flags Description
REVIEWING RESULTS
6
Plt
(continued)
SCL
23
An SCL (small cell) flag indicates the
presence of small cells in the 2fL and
3fL regions.
Rerun the sample and verify the
results.
Suspect or Detailed Flag Format
As described in
and
Detailed
Suspect Flag Format
If the DIFFPLOT AND HISTOGRAM FLAGS option is not selected (default setting) on the
instrument’s printer configuration screen, the flags are reported (displayed and printed) in the
Suspect
format as follows:
r DB prints as DB.
r The DIFF flag replaces the SL, SL1, NL, MN, UM, LN, UN, and NE flags.
Types of Flag Printout Formats
formats.
, the two types of flag printout formats are
Suspect
r IMM prints as IMM.
r ATL pr in ts as ATL .
r The WBC/BA flag replaces the DIFF+, DIFF-, *WBC, MB, and BASO+ flags.
r The HISTO flag replaces the MICRO, MACRO, SCL, MIC, and SCH flags.
r The flags will be printed on the patient report in the area labeled “SUSPECT”.
For example, when the option is not selected, flags on the patient sample report may be
shown as:
SUSPECT:
WBC: WBC/BA DB DIFF IMM ATL
RBC: HISTO
PLT: HISTO
For additional information about the DIFFPLOT AND HISTOGRAM FLAGS print option, see
Configuring the Instrument’s Printer Settings
.
PN 4237615B
6-11
Page 96

REVIEWING RESULTS
INTERPRETIVE MESSAGES
Detailed Flag Format
If the DIFFPLOT AND HISTOGRAM FLAGS option is selected on the instrument’s printer
configuration screen, the DiffPlot and histogram flags are reported (displayed and printed) in
the detailed format.
For example, when the option is selected, flags on the patient sample report may be shown as:
FLAGS
WBC: *WBC DB SL UM IMM ATL
RBC: MICRO
PLT: MIC
For additional information about the DIFFPLOT AND HISTOGRAM FLAGS print option, see
Configuring the Instrument’s Printer Settings
Patient Ranges and Action Ranges
Table 6.3 shows the four flags that can be generated based on patient ranges and action
ranges.
Table 6.3 Patient Range and Action Range Flags
.
Flag Description
H
Result is above the patient limit set by your laboratory and may generate an
interpretive message on the printout.
L
Result is below the patient limit set by your laboratory and may generate an
interpretive message on the printout.
HH
Result is above the action limit set by your laboratory and may generate an
interpretive message on the printout.
LL
Result is below the action limit set by your laboratory and may generate an
interpretive message on the printout.
6.4 INTERPRETIVE MESSAGES
ATTENTION:
for assisting with quickly and efficiently screening abnormal samples and for diagnosis. It is
recommended that your laboratory use suitable reference methods to confirm diagnoses.
The interpretive messages print in the flag area on the patient report. Tables 6.4 through 6.11
list interpretive messages and triggering conditions.
Only one DIFF interpretive message can be displayed for each DIFF parameter. The message
generated from the absolute count for that parameter takes priority. For example, if a relative
LYMPHOPENIA (LY% < LY% LL) and an absolute LYMPHOCYTOSIS (LY# > LY# HH) occur,
only the LYMPHOCYTOSIS message will be displayed.
Interpretive messages indicate a possible pathological disorder and should be used
6-12
The following sections define:
r WBC Interpretive Messages,
r RBC Interpretive Messages,
r Plt Interpretive Messages, and
r Combination WBC/RBC/Plt Interpretive Messages.
PN 4237615B
Page 97

WBC Interpretive Messages
r Table 6.4 lists WBC interpretive messages from Action Ranges.
r Table 6.5 lists WBC interpretive messages from the DiffPlot.
Table 6.4 WBC Interpretive Messages from Action Ranges
Printed Message Triggering Condition
REVIEWING RESULTS
INTERPRETIVE MESSAGES
6
LEUCOCYTOSIS
LEUCOPENIA
LYMPHOCYTOSIS
LYM PH OP EN IA
NEUTROPHILIA
NEUTROPENIA
EOSINOPHILIA
MONOCYTOSIS
BASOPHILIA
LARGE IMMATURE
CELLS
ATYPICAL
LYM PH OC YT E
MYELEMIA
BLASTS
Table 6.5 WBC Interpretive Messages from DiffPlot
WBC > WBC HH
WBC < WBC LL
LY# > LY# HH, or LY % > LY% HH
LY# < LY# LL, or LY% < LY% LL
NE# > NE# HH, or NE% > NE% HH
NE# < NE# LL, or NE% < NE% LL
EO# > EO# HH, or EO% > EO% HH
MO# > MO# HH, or MO% > MO% HH
BA# > BA# HH, or BA% > BA% HH
IMM# > IMM# HH, or IMM% > IMM% HH
ATL# > ATL# HH, or ATL% > ATL% HH
NE% > NE% HH
BA# > BA# HH
IMM# > IMM# HH
and
IMM# > IMM# HH
and
and
UM
H means above the patient range.
HH means above the action range.
LL means below the action range.
PN 4237615B
Message Triggering Condition
LEFT SHIFT
MN or NL
and
UN
RBC Interpretive Messages
r Table 6.6 lists RBC interpretive messages from Action Ranges.
r Table 6.7 lists RBC interpretive messages from Flag Sensitivity.
Table 6.6 RBC Interpretive Messages from Action Ranges
Message Triggering Condition
ANEMIA
ANISOCYTOSIS
HYPOCHROMA
COLD AGGLUTININ
MICROCYTOSIS
Hgb < Hgb LL
RDW > RDW HH
MCHC < MCHC LL
MCHC > MCHC HH
MCV < MCV LL
6-13
Page 98

REVIEWING RESULTS
INTERPRETIVE MESSAGES
Table 6.6 RBC Interpretive Messages from Action Ranges (Continued)
Message Triggering Condition
MACROCYTOSIS
ERYTHROCYTOSIS
MCV > MCV HH
RBC > RBC HH
Table 6.7 RBC Interpretive Messages from Flag Sensitivity
Message Triggering Condition
MICROCYTE
MACROCYTE
MICRO% > MICRO% Flag Sensitivity limit
MACRO% > MACRO% Flag Sensitivity limit
Plt Interpretive Messages
r Table 6.8 lists platelet interpretive messages from Action Ranges.
r Table 6.9 lists platelet interpretive messages from the Plt histogram.
Table 6.8 Plt Interpretive Messages from Action Ranges
Message Triggering Condition
THROMBOCYTOSIS
THROMBOCYTOPENIA
MACROPLATELETS
Plt > Plt HH
Plt < Plt LL
MPV > 11
HH means above the action range.
LL means below the action range.
HH means above the action range.
LL means below the action range.
6-14
Table 6.9 Plt Interpretive Messages from the Plt Histogram
MESSAGE Triggering Condition
MICROCYTOSIS
SCHISTOCYTE
SMALL CELL
Derived from Plt histogram
Derived from Plt histogram
Derived from Plt histogram
Combination WBC/RBC/Plt Interpretive Messages
r Table 6.10 lists interpretive messages from a combination of WBC/RBC/Plt Action
Ranges.
r Table 6.11 lists conditions causing NRBCS and PLATELET AGGREGATES interpretive
messages.
Table 6.10 Interpretive Messages from a Combination of WBC/RBC/Plt Action Ranges
Message Triggering Condition
PANCYTOPENIA
WBC < WBC LL
RBC < RBC LL
and
Plt < Plt LL
and
HH means above the action range.
LL means below the action range.
PN 4237615B
Page 99

Table 6.11 NRBCs and PLATELET AGGREGATES Interpretive Messages
Message Triggering Condition
REVIEWING RESULTS
INTERPRETIVE MESSAGES
6
PLT AGGREGATES
NRBCS
NRBCS & PLATELET
AGGREGATES
3
Plt < 150x10
DB and PDW > 20, or
DB and MPV > 10, or
DB and Plt < 150x10
DB and WBC Voteout
*WBC and PDW > 20, or
*WBC and MPV > 10, or
*WBC and Plt < 150x10
SL, or
SL and WBC Voteout, or
*WBC and WBC Voteout, or
SL1 and WBC Voteout
If none of the individual conditions defined for
AGGREGATES
/mm3
occur
WBC voteout
and
3
/mm3, or
3
3
/mm
*WBC or SL1 or WBC Voteout occur.
and
NRBCS
or
PLATELET
PN 4237615B
6-15
Page 100

REVIEWING RESULTS
INTERPRETIVE MESSAGES
6-16
PN 4237615B
 Loading...