

ZyXEL Communications ZYWALL USG 300 UNIFIED SECURITY GATEWAY, ZYWALL USG 100 UNIFIED SECURITY GATEWAY, ZYWALL USG 1000 UNIFIED SECURITY GATEWAY, ZYWALL USG 200 UNIFIED SECURITY GATEWAY User Manual

Vantage Report
Default Login Details
IP Address http://{Vantage
Report server’s IP
address}:8080/
vrpt
User Name root
Password root
Software Version 3.5
Edition 1, 2/2010
www.zyxel.com
www.zyxel.com
Copyright © 2010
ZyXEL Communications Corporation


About This User's Guide
About This User's Guide
Intended Audience
This manual is intended for people who want to configure the Vantage Report
using the web configurator. You should have at least a basic knowledge of TCP/IP
networking concepts and topology.
Related Information
• Download software and documentation (User’s Guide, Quick Start Quide,
Datasheet, Support Notes) from one of the FTP sites:
Europe: ftp://ftp.zyxel.dk/Vantage_Report
Rest of World: ftp://ftp.zyxel.com/Vantage_Report
• Vantage Report Online Help
Embedded web help for descriptions of individual screens and supplementary
information.
•ZyXEL Glossary and Web Site
Please refer to www.zyxel.com
additional support documentation.
for an online glossary of networking terms and
Documentation Feedback
Send your comments, questions or suggestions to: techwriters@zyxel.com.tw
Thank you!
The Technical Writing Team, ZyXEL Communications Corp.,
6 Innovation Road II, Science-Based Industrial Park, Hsinchu, 30099, Taiwan.
Vantage Report User’s Guide
3

About This User's Guide
Need More Help?
More help is available at www.zyx el.com.
• Download Library
Search for the latest product updates and documentation from this link. Read
the Tech Doc Overview to find out how to efficiently use the User Guide, Quick
Start Guide and Command Line Interface Reference Guide in order to better
understand how to use your product.
• Knowledge Base
If you have a specific question about your product, the answer may be here.
This is a collection of answers to previously asked questions about ZyXEL
products.
•Forum
This contains discussions on ZyXEL prod ucts. Learn from others who use ZyXEL
products and share your experiences as well.
Customer Support
Should problems arise that cannot be solved by the methods listed above, you
should conta ct your vendor. If you cannot contact your vendo r, then contact a
ZyXEL office for the region in which you bought the device.
See http://www.zyxel.com/web/contact_us.php for contact information. Please
have the following informatio n ready when you contact an office.
• Product model and serial number.
•Warranty Information.
• Date that you received your device.
• Brief description of the problem and the steps you took to solve it.
4
Vantage Report User’s Guide

Document Conventions
Document Conventions
Warnings and Notes
These are how warnings and notes are shown in this User’s Guide.
Warnings tell you about things that could harm you or your device.
Note: Notes tell you other important information (for example, other things you may
need to configure or helpful tips) or recommendations.
Syntax Conventions
• The version number on the title page is the version of Vantage Report that is
documented in this User’s Guide.
• Enter means for you to type one or more characters and press the carriage
return. Select or Choose means for you to use one of the predefined choices.
• The choices of a menu item are in Bold Arial font.
• Mouse action sequences are denoted using a right angle bracket (>). For
example, click Report > Traffic > WEB > Top Hosts means first click the
Report main menu and then Traffic, WEB and finally click Top Hosts.
Icons Used in Figures
Figures in this User’s Guide may use the following generic icons.
Computer Server Prestige Device
ZyWALL Device User Internet
VPN Tunnel
Vantage Report User’s Guide
5

Document Conventions
Your product is marked with this symbol, which is known as the WEEE
mark. WEEE stands for Waste Electronics and Electrical Equipment. It
means that used electrical and electronic products should not be mixed with
general waste. Used electrical and electronic equipment should be treated
separately.
6
Vantage Report User’s Guide

Contents Overview
Contents Overview
Introduction ............................................................................................................................17
Introducing Vantage Report ....................................................................................................... 19
The Vantage Report Server .......................................................................................................23
The Web Configurator ...............................................................................................................31
Monitors, Reports and Logs .................................................................................................59
Monitor ...................................... ....................... ...................... ....................... ............................. 61
Traffic .................................................................. .................................................... ...................79
VPN .........................................................................................................................................167
Network Attack ........................................................................................................................ 249
Security Policy ......................................................................................................................... 317
Event .......................................................................................................................................369
EPS ......................................................................................................................................... 379
Schedule Report .............................. ... ... ... ... .... ... ... ... .... ...........................................................383
Logs ....................................... .................................................... .............................................. 401
System Setting, User Management and Troubleshooting ...............................................421
System Setting ......................................... ... .... ............................................. ... ... .... ... ... ...........423
User Management . ... ... ... .... ... ... ... ................................................. ... ... ... .................................. 451
Troubleshooting ..................................................... .................................................................. 459
Appendices and Index .........................................................................................................463
Vantage Report User’s Guide
7

Contents Overview
8
Vantage Report User’s Guide

Table of Contents
Table of Contents
About This User's Guide..........................................................................................................3
Document Conventions............................................................................................................5
Contents Overview ...................................................................................................................7
Table of Contents......................................................................................................................9
Part I: Introduction................................................................................. 17
Chapter 1
Introducing Vantage Report...................................................................................................19
1.1 Introduction ......................... ... .... ... ... ... ............................................. .... ... ... ... .... ... ... .............19
1.2 License Versions .......... ... ... ... .... ... ... .................................................................................... 20
1.3 Hardware Requirements ..................................... ................................. ................................20
Chapter 2
The Vantage Report Server....................................................................................................23
2.1 Starting and Stopping the Vantage Report Server .................................. .............................23
2.2 E-Mail in the Vantage Report Server ................................................................................... 24
2.3 Time in the Vantage Report Server ......................................................................................25
2.4 ZyXEL Device Configuration and Source Data .................... ... ... .......................................... 25
2.5 Common Terms ............... ... ... .... ... ... ... ............................................. .... ... ... ... .... ... ................ 28
2.6 Common Icons .......................................... ... ............................................. ... .... ... ... ... ... ....... 29
Chapter 3
The Web Configurator............................................................................................................31
3.1 Web Configurator Requirements ......................................................................................... 31
3.2 Web Configurator Access ....................................................................................................31
3.3 Main Menu Bar .................................................................................................................... 34
3.3.1 The About Screen ........................ .... ... ... ... .... ... ... ... .... ................................................ 34
3.4 Device Window ............................. ... ... ... .... ... ... ... .... ... ..........................................................34
3.5 Menu Panel ............................................... ... ... ... .............................................. ... ... ... .......... 38
3.6 Report and Setting Window ................................................................................................. 47
3.6.1 Device Information Screen ............................... .......................................... ................ 48
3.6.2 Monitors and Statistical Reports .......................................... ... .... ... ... .......................... 49
3.6.3 View Logs ..................... .... ............................................. ... ... ... .................................... 53
3.7 System Dashboard .................................... ... ... ... .... ... ... ... ............................................. ....... 54
Vantage Report User’s Guide
9

Table of Contents
Part II: Monitors, Reports and Logs..................................................... 59
Chapter 4
Monitor.....................................................................................................................................61
4.1 Monitor (Folder) ................................................................................................................... 61
4.1.1 Customize the Column Fields ................ ... .... ... ... ... .... ................................................ 62
4.2 Dashboard Configuration ........... ... ... .................................................................................... 63
4.3 Dashboard Configured ....................................... .... ... ... ... .... ... ... ... ... .... ... ... .......................... 65
4.4 Bandwidth Monitor ........................... ... ... .... ... ... ... .... ............................................................. 66
4.5 CPU Usage Monitor ............... .... ... ... ... ... .... ... ... ... ................................................. ... ... ..........67
4.6 Memory Usage Monitor ................ ... ... ... ................................................. ... ... .... ... ... ... ... .... ...68
4.7 Session Usage Monitor .......................................................................................... ... ... .......69
4.8 Port Usage Monitor ................ .... ... ... ... ... .... ... ... ... ................................................. ... ... ..........70
4.9 Interface Usage Monitor ......................................................................................................71
4.10 Service Monitor .................................................................................................................. 73
4.11 Attack Monitor .................................................................................................................... 74
4.12 Intrusion Monitor ................................................................................................................ 75
4.13 Anti-Virus Monitor .............................................................................................................. 76
4.14 Anti-Spam Monitor ............................................................................................................. 77
Chapter 5
Traffic.......................................................................................................................................79
5.1 Bandwidth ........................... ... .............................................. ... ... ... ... .... ... ............................. 79
5.1.1 Bandwidth Summary ........... ................................................ ... .... ................................ 79
5.1.2 Bandwidth Summary Drill-Down ................................................................................ 83
5.1.3 Bandwidth Top Protocols ............................................................................................ 84
5.1.4 Bandwidth Top Protocols Drill-Down .......................................................................... 88
5.1.5 Top Bandwidth Hosts ................................................................................................. 90
5.1.6 Top Bandwidth Hosts Drill-Down ................................................................................ 94
5.1.7 Top Bandwidth Users .................................................................................................96
5.1.8 Top Bandwidth Users Drill-Down ................................................................................ 99
5.1.9 Top Bandwidth Destinations ..................................................................................... 101
5.1.10 Top Bandwidth Destinations Drill-Down ......................... ... ... .................................. 105
5.2 Web Traffic .............................................................. ... ... ... .... ... ... ........................................ 107
5.2.1 Top Web Sites .......................................................................................................... 107
5.2.2 Top Web Sites Drill-Down .........................................................................................110
5.2.3 Top Web Hosts ..........................................................................................................112
5.2.4 Top Web Hosts Drill-Down ........................................................................................115
5.2.5 Top Web Users .........................................................................................................117
5.2.6 Top Web Users Drill-Down .......................................................................................120
5.3 FTP Traffic ................................................................. ... ... .... ... ........................................... 122
5.3.1 Top FTP Sites ...........................................................................................................122
5.3.2 Top FTP Sites Drill-Down .........................................................................................125
10
Vantage Report User’s Guide

Table of Contents
5.3.3 Top FTP Hosts ......................................................................................................... 127
5.3.4 Top FTP Hosts Drill-Down ........................................................................................ 130
5.3.5 Top FTP Users .........................................................................................................132
5.3.6 Top FTP Users Drill-Down ........................................................................................ 135
5.4 Mail Traffic .................................................................................... ... .... ... ... ... .... ... ..............137
5.4.1 Top Mail Sites ...........................................................................................................137
5.4.2 Top Mail Sites Drill-Down ......................................................................................... 140
5.4.3 Top Mail Hosts ..........................................................................................................142
5.4.4 Top Mail Hosts Drill-Down ........................................................................................145
5.4.5 Top Mail Users ......................................................................................................... 147
5.4.6 Top Mail Users Drill-Down ....................................................................................... 150
5.5 Other Traffic ..... ... ... ... .... ............................................. ... ... .... .............................................. 152
5.5.1 Platform Selection ............................................... ............................................. ... .... . 152
5.5.2 Service Settings ......................................................................................................153
5.5.3 Top Destinations of Other Traffic .............................................................................. 154
5.5.4 Top Destinations of Other Traffic Drill-Down ............................................................ 156
5.5.5 Top Sources of Other Traffic .................................................................................... 158
5.5.6 Top Sources of Other Traffic Drill-Down ................................................................... 160
5.5.7 Top Other Traffic Users ............................................................................................ 162
5.5.8 Top Users of Other Traffic Drill-Down ....................................................................... 164
Chapter 6
VPN.........................................................................................................................................167
6.1 VPN Site-to-Site .................................................................................. ... ... ... .... ... ... ...........167
6.1.1 VPN Link Status ....................................................................................................... 167
6.1.2 VPN Traffic Monitor .................................................................................................. 169
6.1.3 Top VPN Peer Gateways ......................................................................................... 170
6.1.4 Top VPN Peer Gateways Drill-Down ........................................................................ 172
6.1.5 Top VPN Sites .......................................................................................................... 174
6.1.6 Top VPN Sites Drill-Down ........................................................................................177
6.1.7 Top VPN Tunnels ..................................................................................................... 179
6.1.8 Top VPN Tunnels Drill-Down .................................................................................... 182
6.1.9 Top VPN Protocols ................................................................................................... 184
6.1.10 Top VPN Protocols Drill-Down ............................................................................... 187
6.1.11 Top VPN Hosts ........................... .............................................. ... ... ... .... ................. 189
6.1.12 Top VPN Hosts Drill-Down ..................................................................................... 192
6.1.13 Top VPN Users ....................................................................................................... 194
6.1.14 Top VPN Users Drill-Down ..................................................................................... 197
6.1.15 Top VPN Destinations ............................................................................................ 198
6.1.16 Top VPN Destinations Drill-Down ............................. ............ ............. ................ ..... 201
6.2 VPN Remote Access (IPSec) ............................................................................................ 203
6.2.1 VPN User Status ...................................................................................................... 203
6.2.2 VPN User Status Drill-Down .....................................................................................206
Vantage Report User’s Guide
11

Table of Contents
6.2.3 Top VPN Protocols ................................................................................................... 208
6.2.4 Top VPN Protocols Drill-Down ..................................................................................211
6.2.5 Top VPN Destinations .............................................................................................. 213
6.2.6 Top VPN Destinations Drill-Down ............................................................................. 216
6.2.7 VPN Top Users .........................................................................................................218
6.2.8 VPN Top Users Drill-Down .......................................................................................221
6.3 VPN Remote Access (SSL) ............................................................................................... 223
6.3.1 VPN User Status ...................................................................................................... 223
6.3.2 VPN User Status Drill-Down .....................................................................................226
6.3.3 Top VPN Protocols ................................................................................................... 227
6.3.4 Top VPN Protocols Drill-Down ............................................. 230
6.3.5 Top VPN Destinations .............................................................................................. 231
6.3.6 Top VPN Destinations Drill-Down ............................................................................. 234
6.3.7 Top VPN Applications ............................................................................................... 236
6.3.8 Top VPN Applications Drill-Down .............................................................................239
6.3.9 VPN Top Users .........................................................................................................241
6.3.10 VPN Top Users Drill-Down ..................................................................................... 243
6.4 Xauth ............... ... ... ... .... ... ............................................. ... .... ... ... ... ... .................................. 245
6.4.1 VPN Successful Login .............................................................................................. 245
6.4.2 VPN Failed Login ..................................................................................................... 247
Chapter 7
Network Attack......................................................................................................................249
7.1 Attack ........... .... ............................................. ... ... .... ... ........................................................249
7.1.1 Attack Summary ............................................................................ ... ... .... ... ... ... ... .....249
7.1.2 Attack Summary Drill-Down .......................................................... ... ... .... ... ... ... ... .... . 252
7.1.3 Top Attacks ................... .... ... ... ... ............................................. .... .............................. 253
7.1.4 Top Attacks Drill-Down ..... ... ... ... ... .............................................. ... ... ... .... ... ... ........... 256
7.1.5 Top Attack Sources ..................................................................................................257
7.1.6 Top Attack Sources Drill-Down ................................................................................. 260
7.1.7 Attack Types .................................................. ... ... ... .... ... ... ........................................262
7.1.8 Attack Types Drill-Down ......................... ............................................. .... ... ... ... ... .... . 264
7.2 Intrusion .............................. ... .... ... ... ... ... .... ... ... ... ...............................................................265
7.2.1 Intrusion Summary .... ... .... ... ... ... ... .... ........................................................................ 265
7.2.2 Intrusion Summary Drill-Down ................................................................................. 268
7.2.3 Top Intrusion Signatures ........................................................ .... ... ... ... ..................... 2 70
7.2.4 Top Intrusion Signatures Drill-Down .................................... ... .... .............................. 273
7.2.5 Top Intrusion Sources ................................................ ... ... ... ... .................................. 275
7.2.6 Top Intrusion Sources Drill-Down .................................. ... ... ... .... ... ... ... .... ................. 278
7.2.7 Top Intrusion Destinations ................................... ... .... ... ........................................... 280
7.2.8 Top Intrusion Destinations Drill-Down ...................................................................... 283
7.2.9 Intrusion Severities .......................... ... ... ... .... ........................................................... 285
7.2.10 Intrusion Severities Drill-Down ............................................................................... 288
12
Vantage Report User’s Guide

Table of Contents
7.3 AntiVirus ...... .... ... ... ... .............................................. ... ... ... .... .............................................. 289
7.3.1 Virus Summary .................... ... ... ... .... ............................................. ... ... .... ... ... ... ........289
7.3.2 Virus Summary Drill-Down ....................................................................................... 292
7.3.3 Top Viruses ...................................................... ... ... .... ... ...........................................293
7.3.4 Top Viruses Drill-Down ............................................................................................. 296
7.3.5 Top Virus Sources .................................................................................................... 297
7.3.6 Top Virus Sources Drill-Down .................................................................................300
7.3.7 Top Virus Destinations ............................................................................................. 302
7.3.8 Top Virus Destinations Drill-Down ............................................................................ 304
7.4 AntiSpam ...................................... ............................................. ... ... .... .............................. 305
7.4.1 Spam Summary ................................................... ... .... ............................................. . 305
7.4.2 Spam Summary Drill-Down .................................... .... .............................................. 308
7.4.3 Top Spam Senders ........................... ... ............................................. ... .... ... ... ... ... .... . 309
7.4.4 Top Spam Sources ................................. ... .... ... ............................................. ... ... .... . 312
7.4.5 Spam Scores ....................... ............................................. ... ... .... ... ... ... ..................... 315
Chapter 8
Security Policy......................................................................................................................317
8.1 Firewall Access Control .....................................................................................................317
8.1.1 Top Users Blocked ...................... .............................................. ... ... ... .... ................. 317
8.1.2 Top Packets Blocked ................................................................................................ 320
8.2 Application Access Control ................................................................................................ 322
8.2.1 Top Applications Blocked ......................................................................................... 322
8.2.2 Top Users Blocked .................... ............................................. .... ... ... ... ..................... 325
8.2.3 Top Applications Allowed .........................................................................................328
8.3 Blocked Web Accesses ...................................... .... ... ... ... .... ... ........................................... 331
8.3.1 Web Block Summary ................................................................................................331
8.3.2 Web Block Summary Drill-Down ..............................................................................333
8.3.3 Top Blocked Web Sites ............................................................................................335
8.3.4 Top Blocked Web Sites Drill-Down ........................................................................... 338
8.3.5 Top Blocked Web Hosts ........................................................................................... 339
8.3.6 Top Blocked Web Hosts Drill-Down .......................................................................... 342
8.3.7 Top Blocked Web Users ........................................................................................... 343
8.3.8 Top Blocked Web Users Drill-Down ......................................................................... 346
8.3.9 Blocked Web Categories .......................................................................................... 347
8.3.10 Blocked Web Categories Drill-Down ...................................................................... 3 50
8.4 Allowed Web Accesses ..................................................................................................... 351
8.4.1 Web Allowed Summary ............................................................................................ 351
8.4.2 Web Allowed Summary Drill-Down .......................................................................... 353
8.4.3 Top Allowed Web Sites ............................................................................................ 355
8.4.4 Top Allowed Web Sites Drill-Down ........................................................................... 358
8.4.5 Top Allowed Web Hosts ........................................................................................... 359
8.4.6 Top Allowed Web Hosts Drill-Down ..................... ... .... ... ........................................... 362
Vantage Report User’s Guide
13

Table of Contents
8.4.7 Top Allowed Web Users ........................................................................................... 363
8.4.8 Top Allowed Web Users Drill-Down ......................................................................... 366
Chapter 9
Event......................................................................................................................................369
9.1 Successful Logins ............ .................................................................................................. 369
9.2 Failed Logins ............ .... ... ... ... .... ............................................. ... ... ... .... ... ... ........................ 371
9.3 Top Sessions Per Host .......... .... ... ... ... ... .... ... .....................................................................372
9.4 Top Sessions Per User ....................................... .... ... ... ... .... ..............................................375
Chapter 10
EPS.........................................................................................................................................379
10.1 Overview .......................................................................................................................... 379
10.1.1 What Endpoint Security Can Check .......................................................................379
10.2 EPS Summary ................................................................................................................. 380
10.3 View Logs ........................................................................................................................ 381
Chapter 11
Schedule Report ...................................................................................................................383
11.1 Scheduled Report Summary Screen ............................................................................... 383
11.2 Customize Daily Report Screen ....................................................................................... 384
11.3 Customize Weekly Report Screen ................................................................................... 391
11.4 Customize Overtime Report Screen ................................................................................ 393
11.5 Configure Template List ...................................................................................................395
11.6 Template Add/Edit ............................................................................................................ 396
11.7 Logo Template ................................................................................................................. 396
11.8 Logo Template Add/Edit ................................................................................................... 397
Chapter 12
Logs .......................................................................................................................................401
12.1 Log Viewer ................... ... ... .... ............................................. ... ... ... .... ... ... ........................ 401
12.2 Log Receiver ................................................................................................................... 405
12.2.1 By Day (Summary) ................................................................................................. 405
12.3 By Device ....................................................................................................................... 408
12.3.1 Log Receiver > By Device > By Category Screen ................................................. 410
12.4 VRPT System Logs .........................................................................................................410
12.5 Log Archiving ................................................................................................................... 413
12.5.1 File Archiving Settings ................................. ............. ............ ............. .......... ........... 413
12.5.2 View Archived Files ................................................................................................ 416
12.5.3 Log Transfer ........................................................................................................... 418
12.6 Log Remove ....................................................................................................................419
14
Vantage Report User’s Guide

Table of Contents
Part III: System Setting, User Management and Troubleshooting .. 421
Chapter 13
System Setting......................................................................................................................423
13.1 General Configuration Screen ......................................................................................... 423
13.1.1 Configuring for Hostname Reverse ........................................................................ 425
13.2 Server Configuration Screen ........................................................................................... 428
13.3 Data Maintenance Screens ............................................................................................. 429
13.3.1 Data Backup and Data Restore Screen ................................................................. 429
13.3.2 Device List Screen ................................................................................................. 430
13.4 Upgrade Screen .............................................................................................................. 431
13.5 Registration Screens .......................................................................................................432
13.5.1 Registration Summary Screen ............................................................................... 433
13.5.2 Registration > Upgrade Screen ................................ ......................... ..................... 434
13.6 Notification ....................................................................................................................... 435
13.6.1 Add/Edit a Notification ................................. .......................................... ................. 437
13.7 Rule-Based Alert ............................................................................................................. 439
13.7.1 Add/Edit a Rule-based Alert ...................................................................................440
Chapter 14
User Management.................................................................................................................451
14.1 Group Screen .................................................................................................................. 451
14.1.1 Group > Add/Edit Group Screen ............................................................................452
14.2 Account Screen ............................................................................................................... 453
14.2.1 Account > Add/Edit User Account Screen ............................................................. 454
Chapter 15
Troubleshooting....................................................................................................................459
Part IV: Appendices and Index ........................................................... 463
Appendix A Product Specifications.......................................................................................465
Appendix B Setting up Your Computer’s IP Address............................................................473
Appendix C ZyNOS Log Descriptions..................................................................................481
Appendix D ZyWALL 1050 and ZyWALL USG Series Log Descriptions..............................507
Appendix E Open Software Announcements.......................................................................553
Appendix F Legal Information ..............................................................................................591
Index.......................................................................................................................................593
Vantage Report User’s Guide
15

Table of Contents
16
Vantage Report User’s Guide

PART I
Introduction
Introducing Vantage Report (19)
The Vantage Report Server (23)
The Web Configurator (31)
17

18

CHAPTER 1
Introducing Vantage Report
Please see the Quick Start Guide for Vantage Report setup requirements,
installation, and access. This chapter introduces Vantage Report. See Appendix A
on page 465 for a list of key features.
1.1 Introduction
Vantage Report is a cost-effective, browser-based global management solution
that allows an administrator from any location to easily manage, monitor and
gather statistics on ZyXEL devices located worldwide. With Vantage Report, you
can monitor network access, enhance security, and anticipate future bandwidth
needs. A typical applica t ion is illustrated in Figure 1.
Figure 1 Typical Vantage Report Application
A
C
B
In this example, you use the web configurator (A) to set up the Vantage
Report server (B). You also configure the ZyXEL devices (C) to send their logs
and traffic statistics to the Vantage Report Server. The Vantage Report server
collects this information. Then, you can
• monitor the whole network
• look at historical reports about network performance and events
• examine device logs
Vantage Report User’s Guide
19

Chapter 1 Introducing Vantage Repo rt
The Vantage Report server can also send statistical reports to you by e-mail.
1.2 License Versions
This is independent from the version number, 3.1 for example. There are two
versions of Vantage Report, the basic version and the full version. When you
install Vantage Report, you get the basic version. The full version requires a
license key, which you usually have to purchase.
Note: This User’s Guide discusses the features in the full version.
The following table shows differences between the basic and full versions.
Table 1 Differences Between Basic Version and Full Version
FEATURE BASIC FULL
Number of supported devices 1 up to 100
Supported formats for scheduled reports PDF PDF, HTML
Drill-down reports 1 layer 2 layers
Reverse DNS lookup no yes
Reverse Hostname lookup no yes
Web usage by category no yes
AntiVirus no yes
AntiSpam no yes
Dashboard no yes
Number of scheduled reports 20 20 per device
Customizable scheduled report templates no yes
Schedule Report Format PDF PDF, HTML
Reports for the ZyWALL 1050/Z yWALL USG
series
no yes
There is also a free trial of the full version. The trial version is the same as the full
version except that it only supports one device. You can get the trial version by
registering Vantage Report. See Section 13.5 on page 432 for more information.
1.3 Hardware Requirements
Minimum hardware requirements:
• Intel Pentium 4 processor 1 GHz
• 512 Mb RAM
20
Vantage Report User’s Guide

Chapter 1 Introducing Vantage Report
• 8 GB free hard disk space
The following table shows the recommended hardware specifications. The more
powerful your computer, the more devices you can manage.
Table 2 Hardware Specification Recommendations
NUMBER
OF
DEVICES
0 - 5 0 - 75 Intel P4 2.6
5 - 50 75 - 750 Intel P4 2.6
50 - 100 750 - 1500 Intel P4 3.2
LOG HANDLING
CAPABILITY (LOGS/
SEC)
CPU SPEC
(GHZ)
GHz
GHz
GHz
MEMOR
Y
SPEC
512 MB 0 - 1
1 GB 1 - 12
1 GB 12 - 24
LOG SPACE
REQUIRED (GB/
DAY)
Vantage Report User’s Guide
21

Chapter 1 Introducing Vantage Repo rt
22
Vantage Report User’s Guide

CHAPTER 2
The Vantage Report Server
This chapter explains several characteristics of the Vantage Report server.
2.1 Starting and Stopping the Vantage Report
Server
Note: Make sure the port Vantage Report uses for web services is not used by other
applications, especially web servers.
The Vantage Report server runs as a service on the Vantage Report server. By
default, this service starts automatically when you log in to the Vantage Report
server. You can use the services management screen to start, stop, or configure
this service. To open this screen,ì
1 In Windows 2000, click Start > Settings > Control Panel > Administrative
Tools > Services. The Services screen opens.
2 In Windows XP, click Start > Control Panel > Performance and Maintenance
> Administrative Tools > Services. The Services screen opens.
Vantage Report User’s Guide
23

Chapter 2 The Vantage Report Server
3 In Windows Vista or Windows 7, click Start > Control Panel > Administrative
Tools > Services. The Services screen opens.
4 Right-click on Vantage Report. A menu appears.
5 Select Start or Stop to start or stop the Vantage Report service. Select
Properties to configure the service.
2.2 E-Mail in the Vantage Report Server
Note: Before the Vantage Report server can send e-mail to anyone, you have to
configure the SMTP mail server. See Section 13.2 on page 428 for more
information.
The Vantage Report server can use e-mail to send information in several
situations. In some situations, it sends e-mail to the e-mail address that is
associated with a specific user (see Section 13.3 on page 429). In other
situations, it sends e-mail to any valid e-mail address.
• scheduled report - The Vantage R eport server can send one or more statist ical
reports regularly or one-time to any valid e-mail address. See Chapter 11 on
page 383 for more information.
• system notifications - When certain system parameters cross a threshold
(minimum or maximum) value, the Vantage Report server sends e-mail to the
Vantage Report administrator (the e-mail address associated with the root
account). Some of these messages are warnings; in some situations, however,
the Vantage R e port server starts or stops receive logs. See Appendix A on page
465 for a list of parameters and threshold values. One of the threshold values
can be configured. See Section 13.1 on page 423.
24
Vantage Report User’s Guide

Chapter 2 The Vantage Report Server
• forgotten password - A user clicks Forget Password? in the Login screen.
In this case, the Vantage Report server sends the account information to the email address associated with the specified user name. See Section 3.2 on page
31 for an example of the Login screen.
• test message - The Vantage Report administrator tests the SMTP mail server
settings. The Vantage Report server sends an e-mail message to the e-mail
address associated with the root account. See Section 13.2 on page 428 for
more information.
2.3 Time in the Vantage Report Server
• In Vantage Report, clock time is the time the Vantage Report server receives
information (log entries or traffic statistics) from the ZyXEL devices, not the
time the device puts in the entry . As soon as the V antage R eport server receives
information, it replaces device times with the current time in the Vantage Report
server.
• The Vantage Report server processes log entries and traffic statistics b efore the
information is available in any screen (including log viewers). For performance
reasons, the Vantage Report server does not process this information right
away. Instead, the processing time depend s on the way the information is used
in Vantage Report. See the following table for processing times for each menu
item.
Table 3 Processing Times by Menu Item
MENU ITEM TIME (MIN)
Monitor 5
Report (Traffic, Network Attack, Security Policy, Authentication) 5
Logs (Log Viewer) 5
2.4 ZyXEL Device Configuration and Source Data
The following table identifies the configuration required in ZyXEL devices for each
screen in Vantage Report.
Table 4 ZyNOS-based ZyWALL Configuration Requirements by Menu Item
VANTAGE REPORT MENU ITEM(S)
Monitor > Bandwidth traffic statistics -- -Monitor > Service traffic statistics -- -Monitor > Attack log entries Attack -Monitor > Intrusion log entries IDP IDP >
Vantage Report User’s Guide
ZYNOS-BASED ZYWALL
SOURCE
DATA
LOG
SETTINGS*
ADDITIONAL
Signature
25

Chapter 2 The Vantage Report Server
Table 4 ZyNOS-based ZyWALL Configuration Requirements by Menu Item
VANTAGE REPORT MENU ITEM(S)
Monitor > AntiVirus log entries Anti-Virus Anti-Virus >
Monitor > AntiSpam log entries Anti-Spam -Report > Traffic traffic statistics -- -Report > VPN log entries IPSec -Report > Network Attack > Attack log entries Attack -Report > Network Attack > Intrusion log entries IDP IDP >
Report > Network Attack > AntiVirus log entries Anti-Virus Anti-Virus >
Report > Network Attack > AntiSpam log entries A nti-Spam -Report > Security Policy > Firewall
Access Control
Report > Security Policy > Application
Access Control
Report > Security Policy > WEB Blocked log entries Blocked Web
Report > Security Policy > WEB Allowed log entries Forward Web
Report > Event > Login log entries System
Report > Event > Session Per Host log entries Access
Report > EPS N/A N/A N/A
Logs > Log Viewer log entries ** **
ZYNOS-BASED ZYWALL
SOURCE
DATA
log entries Access
N/A N/A N/A
LOG
SETTINGS*
Control
Sites
Sites
Maintenance
Control
ADDITIONAL
General
Signature
General
--
--
--
--
--
* - The names of categories may be different for different devices. Use the category that is appropriate for each
device.
** - The log viewers display whatever log entries the ZyXEL devices record, including log entries that may not
be used in other reports.
Table 5 ZLD-based ZyWALL Configuration Requirements by Menu Item
VANTAGE REPORT MENU ITEM(S)
Monitor > CPU Usage traffic
Monitor > Memory Usage traffic
Monitor > Session Usage traffic
26
ZLD-BASED ZYWALL
SOURCE
DATA
statistics
statistics
statistics
LOG
SETTINGS*
-- --
-- --
-- --
Vantage Report User’s Guide
ADDITIONAL

Chapter 2 The Vantage Report Server
Table 5 ZLD-based ZyWALL Configuration Requirements by Menu Item
ZLD-BASED ZYWALL
VANTAGE REPORT MENU ITEM(S)
Monitor > Port Usage traffic
Monitor > Interface Usage traffic
Monitor > Service traffic
Monitor > Attack log entries IDP -Monitor > Intrusion log entries IDP IDP > Signature
Monitor > AntiVirus N/A N/A N/A
Monitor > AntiSpam N/A N/A N/A
Report > Traffic traffic
Report > VPN log entries IPSec, User -Report > VPN > Remote Access (SSL) log entries SSL VPN,
Report > Network Attack > Attack log entries IDP -Report > Network Attack > Intrusion log entries IDP IDP > Signature
Report > Network Attack > AntiVirus N/A N/A N/A
Report > Network Attack > AntiSpam N/A N/A N/A
Report > Security Policy > Firewall Access
Control
Report > Security Policy > Application
Access Control
Report > Security Policy > WEB Blocked log entries Blocked web
Report > Security Policy > WEB Allowed log entries Forward
Report > Event > Login log entries User -Report > Event > Session Per Host log entries Sessions
Report > EPS log entries EPS, Auth.
Logs > Log Viewer log entries ** **
SOURCE
DATA
statistics
statistics
statistics
statistics
log entries
log entries Firewall --
log entries Application
LOG
SETTINGS*
-- --
-- --
-- --
-User
User
Patrol
sites
web sites
Limit, User
Policy, SSL
VPN
ADDITIONAL
--
--
--
--
--
--
* - The names of categories may be different for different devices. Use the category that is appropriate for each
device.
** - The log viewers display whatever log entries the ZyXEL devices record, including log entries that may not
be used in other reports.
Vantage Report User’s Guide
27
Chapter 2 The Vantage Report Server
• Source Data - Some screens use log entries; some screens use traffic
statistics. Some ZyXEL devices do not track traffic statistics. If Vantage Report
does not get one of these, the screens are empty. See the Quick Start Guide for
detailed instructions.
• Log Settings - If ZyXEL devices do not record some categories of log entries,
Vantage R eport does not ha v e any information to displa y either. For example, if
you want to look at VPN traffic for a particular device, the device has to record
log entries for IPSec.
For most devices, go to the Logs > Log Settings screen, and select the
appropriate categories. You may also use the command-line interface.
• Additional - In some cases, it is possible to control what log entries are
recorded in even more detail. For example, in some ZyXEL devices, it is possible
to control what attack types are logged.
For most devices, go to the screen indicated to select the appropriate log
entries. You may also use the command-line interface.
2.5 Common Terms
The following table describes the terms that appear frequently in this document.
Table 6 Common Terms
TERM DESCRIPTION
ZLD-based ZyXEL
Devices
ZyNOS-based ZyXEL
Devices
Drill-down Report Click a link in a report to display details in another screen. For
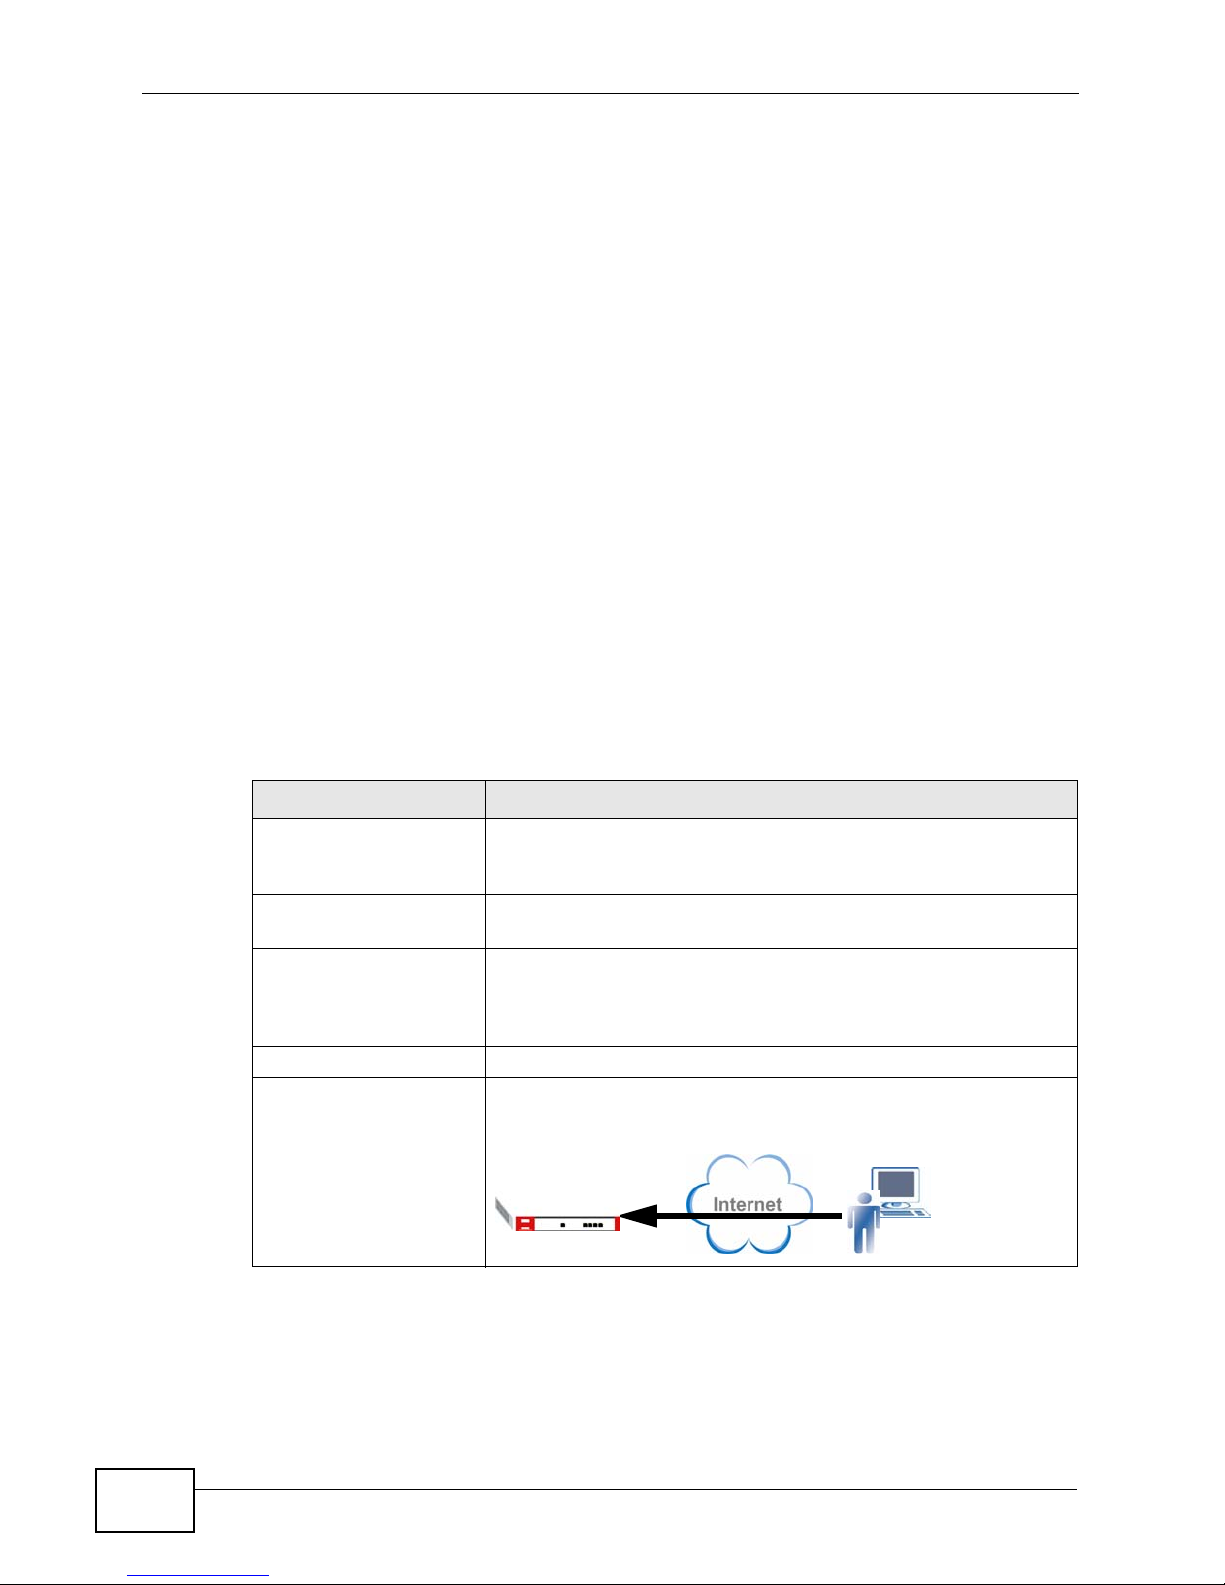
Host A host represents a computer with an IP address.
Remote User A user login the device with a legal user’s account.
ZLD (ZyXEL Linux Distribution) is ZyXEL's platform based on
Linux. ZLD models include ZyWALL 1050 and ZyWALL USG
series.
ZyNOS is ZyXEL's Networking Operating Sy stem. ZyNOS
models include ZyWALL 5, ZyWALL 35, and ZyWALL 70, etc.
example, click VPN > Remote Access (IPSec) > User
Status, then click a user’s link to display a report of the
services for which the user sent the most traffic.
Figure 2 Remote User
28
Vantage Report User’s Guide

Chapter 2 The Vantage Report Server
TERM DESCRIPTION
Remote VPN User A VPN user is a user who is allowed to send traffic through VPN
tunnel.
Figure 3 Remote VPN User
Incoming VPN Traffic A diagram is referred to in following figure. In this example,
incoming VPN traffic is encrypted data that the ZyXEL Device
receives from VPN tunnels (A) and the traffic sent back (B).
Figure 4 Incoming VPN Traffic
A
Outgoing VPN Traffic A diagram is referred to in following figure. In this example,
outgoing VPN traffic is encrypted data that the ZyXEL Device
forwards through VPN tunnels (A) and the returned traffic (B).
Figure 5 Outgoing VPN Traffic
2.6 Common Icons
The following table describes common icons.
Table 7 Common Icons
ICON DESCRIPTION
The View Detail icon (in the Dashboard) lets you focus on an individual
monitor report.
The Settings icons open a screen where you can modify the report display
settings.
The Print icon opens a screen for printing the screen.
B
A
B
Vantage Report User’s Guide
29

Chapter 2 The Vantage Report Server
Table 7 Common Icons
ICON DESCRIPTION
The Pie View icon displays the statistical report in a pie chart.
The Bar View icon displays the statistical report in a bar chart.
The Refresh icon updates the information in the screen.
30
Vantage Report User’s Guide

CHAPTER 3
The Web Configurator
This chapter provides the minimum requirements to use the web configurator,
describes how to access the web configurator, and explains each part of the main
screen in the web configurator.
3.1 Web Configurator Requirements
The web configurator is a browser-based interface that you can use to set up,
manage, and use Vantage Report. You can run it on the Vantage Report server or
on a different computer. Your web browser should meet the following
requirements:
• Internet Explorer 6.0 or later, Firefox 1.07 or later (local or remote)
• JavaScript enabled
• Macromedia Flash Player 9 or later
• Recommended screen resolution: 1024 x 768 pixels
3.2 Web Configurator Access
To access the web configurator, follow these steps:
1 Make sure Vantage Report is installed and running properly. (See the Quick Start
Guide.)
2 Open a browser window, and go to http://a.b.c.d
• a.b.c.d
configurator on the same computer on which you installed Vantage Report,
enter localhost.
is the IP address of the Vantage Report server. If you open the web
:xxxxx/vrpt, where
Vantage Report User’s Guide
31

Chapter 3 The Web Configurator
• xxxxx is the port number you entered during installation (default is 8080).
For example, you might enter http://localhost:8080/vrpt or http://
212.100.9.161:9090/vrpt.
In either case, the web configurator Login screen displays.
Figure 6 Web Configurator Login Screen
Note: If you forget your password, enter your user name, and click Forget
Password?. Vantage Report sends your password to the e-mail address (if
any) for your User Name. See Section 2.2 on page 24 for more information
about e-mail in Vantage Report and Section 13.3 on page 429 for more
information about SMTP configuration.
3 Enter the User Name (default: root) and Password (default: root).
Note: See Section 13.3 on page 429 to change the password.
4 Click the Login button. The System Dashboard screen appears. See Section
3.6.1 on page 48 for the field descriptions in this screen.
Figure 7 Dashboard
32
Vantage Report User’s Guide

Chapter 3 The Web Configurator
5 Manually add a device to Vantag e Report . See Table 9 on page 35 for how to add a
device.
6 Select the device from the device list on the left of the screen and click a menu
(for example, Monitor) on the top of the screen. The main screen in Vantage
Report appears.
Figure 8 Web Configurator Main Screen
A
D
B C
The main screen is divided into four parts:
•The main menu bar (A) - contains main menus and some icons that are useful
anytime.
•The device window (B) - displays and organizes the ZyXEL devices that can
provide information to Vantage Report.
•The submenu window (C) - lists the reports you can generate and organizes
these reports into categories. It als o lis ts th e configuration menus used to
manage and maintain the Vantage Report.
•The report and setting window (D) - shows the selected report for the
selected device(s) or the related setting screens.
Note: For security reasons, Vantage Report automatically times out after fifteen
minutes of inactivity. Log in again if this happens.
The rest of this section discusses each part of the main screen in more detail.
Vantage Report User’s Guide
33

Chapter 3 The Web Configurator
3.3 Main Menu Bar
The main menu bar has three icons. These icons are explained in the table below.
Table 8 Icons in the Main Menu Bar
ICON DESCRIPTION
The Help icon opens the help page for the current screen in Vantage
Report.
The About icon opens a screen with the version of Vantage Report.
The Logout icon logs you out of Vantage Report.
3.3.1 The About Screen
Use this screen to get the current release and copyright for Vantage Report.
Figure 9 About
3.4 Device Window
Use the device window to select which device(s) you want to include in a report,
add devices to Vantage Report, and remove devices from Vantage Report.
Note: You have to add the device to the device window if you want Vantage Report to
store log or traffic information from this device. If the Vantage Report server
receives logs or traffic information from a device that is not in this list, it discards
the logs.
In the device window, you can also look at basic information about each device,
edit the information about the device, and search for devices in Vantage Report
using this information. This chapter explains how to do these things.
34
Vantage Report User’s Guide

Chapter 3 The Web Configurator
2
The device window is located on the left side of the main screen in the web
configurator. Figure 10 shows an example.
Figure 10 Device Window
1
3
4
Each numbered section above is described in the following table.
Table 9 Device Window
SECTION DESCRIPTION
1 To add a device to Vantage Report,
• right click on root, and select Add Device. The Add De vice screen
appears in the device window. (See Figure 11.)
To add a folder to Vantage Report,
• right click on root, and select Add Folder. The Add Folder screen appears
in the device window. (See Figure 11.)
2 To update the device window,
• click the Refresh button.
Vantage Report User’s Guide
35

Chapter 3 The Web Configurator
Table 9 Device Window
SECTION DESCRIPTION
3 To move a device in the device tree,
• right -click on the device, and select Cut it. Then right -click the destination
folder and select Paste to.
To select which device is included in a report,
• click on the device.
To look at the basic information about a device,
• cli ck on the d evice. The Device Information screen appears in the report
and setting window. (See Figure 11.)
To edit the basic information about a device,
• right -click on the device, and select Edit Device. The Edit Device screen
appears in the device window. (See Figure 11.)
To edit the basic information about a folder,
• right-click on the folder, and select Edit Folder. The Edit Folder screen
appears in the device window. (See Figure 11.)
To remove a device from Vantage Report,
• right-click on the device, and select Delete Device. Vantage Report
confirms you want to delete it before doing so.
To remove a folder from Vantage Report,
• right-click on the folder, and select Delete Folder. Vantage Report
confirms you want to delete it before doing so.
4 To search for a device,
• type an y part of th e name, MAC address, or note and click the magnifying
glass. If a match is found, Vantage Report highlights the device in the
device window, but the report and setting window does not change. If a
match is not found, you get a message. Y ou can click the magnifying glass
again to look for another match.
When you add a device to Vantage Report, you can specify the name, MAC
address, type, and any notes for the device. When you click on the device, this
information is displayed in the report and setting window (see Section 3.6.1 on
page 48). When you edit a device, however, you can only edit the name and the
notes. If you want to update the MAC address or device type, you have to delete
36
Vantage Report User’s Guide

Chapter 3 The Web Configurator
the current device and add it again. These screens are discussed in more detail
together in Figure 11 on page 37.
Figure 11 Add/Edit Device and Add/Edit Folder Screens
Each field is explained in the following table.
Table 10 Add/Edit Device and Add/Edit Folder Screen Fields
LABEL DESCRIPTION
Name Enter the name of the device or folder you want to add to Vantage Report.
The device name can consist of alphanumeric characters, underscores(
periods(.), or dashes(-), and it must be 1-28 characters long. This name is
used to refer to the device (or folder) in Vantage Report, and it has to be
different than other device (or folder) names in Vantage R eport. Y ou can use
the system name of a device as the name for that device.
MAC This field is not available in the Edit Device screen. Enter the LAN MAC
address of the device you want to add. For the ZyWALL 1050, use the first
(lowest) LAN MAC address. Once you add the device, you cannot change the
MAC address anymore.
Type This field is not available in the Edit Device screen. Select the model type
of the device you want to add. Choices are: ZyNOS ZyWALL, ZyWALL
1050, USG 100, USG 200, USG 300, USG 1000, USG 2000, IDP 10
and Prestige.
_),
Not all reports (and fields in reports) are available with all models. See Table
209 on page 467 for a list of which items Vantage Report supports with
various firmware versions of various devices.
Note Enter any additional notes you want to make for the device or folder here.
Add This field is available in the Add Device screen. Click this to add the device
to Vantage R eport. It takes time before V antage R eport displays information
received from this device.
Save This field is available in the Edit Device screen. Click this to save your
changes to Vantage Report.
You can also right-click in the device window. If you do not right-click on a device
or folder, the following menu appears. If you right-click on a device or folder, you
can see the following menu items at the end of the menu.
Figure 12 Device Window Right-Click Menu
Vantage Report User’s Guide
37

Chapter 3 The Web Configurator
Click About Adobe Flash Player 9... to get information about the current
version of Flash.
3.5 Menu Panel
Use the menu panel to select which monitor, statistical report, or screen you want
to open.
Note: You have to select a device before you can open a monitor or statistical report.
These screens are organized into menus. Click on each top-level menu item to
look at the second-level menu items. If a small triangle appears on the right side
next to the menu item, then click on the second-level menu item to look at the
third-level menu items. Otherwise, click on the monitor, statistical report, or
screen you want to open. This is demonstrated in Figure 13
Figure 13 Menu Panel
Note: You can only open one second-level and one third-level menu at one time. If
you open another one, the first one automatically closes.
Table 11 expands the menu panel and introduces each monitor, statistical report,
and screen. In addition, it also indicates if you can drill down into each statistical
report.
38
Vantage Report User’s Guide

Chapter 3 The Web Configurator
Note: Not every report (or fields in a report) is available with every model of device
and firmware version. See Table 209 on page 467 for a list of which items
Vantage Report supports with various firmware versions of various devices.
Table 11 Menu Panel
LEVEL 1/2 LEVEL 3 FUNCTION
Monitor Use monitors to check the status of ZyXEL devices.
Dashboard The dashboard gives a quick top level summary of activity across
devices that you pre-configured. The dashboard is available with
the full version of Vantage Report.
CPU Usage Use this report to monitor the CPU usage on the selected device.
Memory
Usage
Session
Usage
Port Usage Use this report to monitor the throughput statistics on a selected
Interface
Usage
Bandwidth Use this report to monitor the total amount of traffic handled by
Service Use this report to monitor the amount of traffic generated by web,
Attack Use this report to monitor the number of Denial-of-Service (DoS)
Intrusion Use this report to monitor the number of intrusions detected by
AntiVirus Use this report to monitor the number of virus occurrences
AntiSpam Use this report to monitor the number of spam messages stopped
Report Use reports to view various and detailed statistic report of ZyXEL
Traffic Use these reports to look at how much traffic was handled by
Use this report to monitor the memory usage on the selected
device.
Use this report to monitor the number of sessions change status
on the selected device.
device’s port.
Use this report to monitor the throughput statistics on a selected
device’s interface.
the selected device.
FTP, mail, or VPN services in the selected device.
attacks detected by the selected device’s firewall.
the selected device’s IDP feature.
prevented by the selected device.
by the selected device.
devices.
ZyXEL devices or who used the most bandwidth in a ZyXEL
device. You can also look at traffic in various directions.
Vantage Report User’s Guide
39

Chapter 3 The Web Configurator
Table 11 Menu Panel
LEVEL 1/2 LEVEL 3 FUNCTION
Bandwidth Summary Use this report to look at the amount of traffic handled by the
selected device by time interval. You can also use this report to
look at the top services in a specific time interval.
Top Protocol Use this report to look at the top services generating traffic
through the selected device. You can also use this report to look
at the top sources of traffic for any top service.
Top Hosts Use this report to look at the top sources of traffic in the selected
device. You can also use this report to look at the top services for
any top source.
Top Users Use this report to look at the top users generating traffic through
the selected device. You can also use this report to look at the top
services used by any top bandwidth user.
Top
Destinations
WEB Top Sites Use this report to look at the top destinations of web traffic. You
Top Hosts Use this report to look at the top sources of web traffic. You can
Top Users Use this report to look at the top sources of web traffic by user.
FTP Top Sites Use this report to look at the top destinations of FTP traffic. You
Top Hosts Use this report to look at the top sources of FTP traffic. You can
Top Users Use this report to look at the top sources of FTP traffic by user.
MAIL Top Sites Use this report to look at the top destinations of mail traffic. You
Top Hosts Use this report to look at the top sources of mail traffic. You can
Top Users Use this report to look at the top sources of mail traffic by user.
Use this report to look at the top destinations of traffic in the
selected device. You can also use this report to look at the
services that were used the most to access the top destination IP
addresses.
can also use this report to look at the top sources of web traffic
for any top destination.
also use this report to look at the top destinations of web traffic
for any top source.
You can also use this report to look at the top destinations of web
traffic for any top user.
can also use this report to look at the top sources of FTP traffic for
any top destination.
also use this report to look at the top destinations of FTP traffic for
any top source.
You can also use this report to look at the top destinations of FTP
traffic for any top user.
can also use this report to look at the top sources of mail traffic
for any top destination.
also use this report to look at the top destinations of mail traffic
for any top source.
You can also use this report to look at the top destinations of mail
traffic for any top user.
40
Vantage Report User’s Guide

Chapter 3 The Web Configurator
Table 11 Menu Panel
LEVEL 1/2 LEVEL 3 FUNCTION
Customizatio
n
VPN Use these reports to look at the top sources and destinations of
Site-to-Site Link Status Use this report to see which of the device’s VPN tunnels are
Remote
Access
(IPSec)
Top
Destinations
Top Sources Use this report to look at the top sources of traffic for other
Top Users Use this report to look at the top sources of traffic for other
Traffic Monitor Use this report to m onitor the total amount of traffic handled by a
Top Sites Use this report to look at the peer IPSec routers with the most
Top Tunnels Use this report to look at the VPN tunnels with the most VPN
Top Protocols Use this report to look at the top services generating VPN traffic
Top Hosts Use this report to look at the top sources of VPN traffic. You can
Top Users Use this report to look at the users that send or receive the most
Top
Destinations
User Status Use this report to see which of the device’s remote access users
Top Protocols Use this report to display which services the remote access users
Top
Destinations
Top Users Use this report to look at the remote VPN users who sent the most
Use this report to look at the top destinations of traffic for other
services. You can also use this report to look at the top sources of
traffic for other services for any top destination.
services. You can also use this report to look at the top
destinations of traffic for other services for any top source.
services. You can also use this report to look at the top
destinations of other services’ traffic for any top user. The service
is selected in the main report.
traffic in VPN tunnels.
connected.
device’s VPN tunnels.
VPN traffic. Y ou can also use this report to look at the top sources
of VPN traffic for any top destination.
traffic. You can also use this report to look at the top senders or
receivers of VPN traffic for a top VPN tunnel.
through the selected device. You can also use this report to look
at the top senders or receivers of any top service through VPN.
also use this report to look at the top destinations of VPN traffic
for any top source.
VPN traffic. You can also use this report to look at the services
sent through VPN from or to a top user.
Use this report to see to where the device sent the most VPN
traffic. You can also use this report to look at the services sent
through VPN from or to a top destination.
are connected.
used the most. You can also use this report to look at the top
remote access senders or receivers of any top service.
Use this report to look at where the remote VPN users sent the
most traffic. You can also use this report to look at the remote
access hosts that sent the most traffic to the selected top
destination.
VPN traffic. You can also use this report to look at the services
sent through VPN from or to a top user.
Vantage Report User’s Guide
41

Chapter 3 The Web Configurator
Table 11 Menu Panel
LEVEL 1/2 LEVEL 3 FUNCTION
Remote
Access
(SSL)
Xauth Successful
Network
Attack
Attack Summary Use this report to look at the number of DoS attacks by time
User Status Use this report to see which of the device’s remote access users
are connected.
Top Protocols Use this report to display which services the remote access users
used the most. You can also use this report to look at the top
remote access senders or receivers of any top service.
Top
Destinations
Top
Applications
Top Users Use this report to look at the users that send or receive the most
Login
Failed Login Use this report to monitor the total number of users that have
Top Attacks Use this report to look at the top kinds of DoS attacks by number
Top Sources Use this report to look at the top sources of DoS attacks by
By Type Use this report to look at the top categories of DoS attacks by
Use this report to look at where the remote SSL VPN users sent
the most traffic. Y ou can also use this report to look at the remote
access hosts that sent the most traffic to the selected top
destination.
Use this report to display which SSL VPN applications the remote
access users accessed the most. You can also use this report to
look at the top remote access senders or receivers of any top
application.
VPN traffic. You can also use this report to look at the services
sent through VPN from or to a top user.
Use this report to monitor the total number of users that have
successfully logged in to use one of the device’s VPN tunnels.
made unsuccessful attempts to log in to use one of the device’s
VPN tunnels.
Use these reports to look at Denial-of-Service (DoS) attacks that
were detected by the ZyXEL device’s firewall.
interval. Y ou can also use this report to look at the top categories
of DoS attacks in a specific time interval.
of attacks. You can also use this report to look at the top
categories of DoS attacks for any top source.
number of attacks. You can also use this report to look at the top
categories of DoS attacks for any top source.
number of attacks. You can also use this report to look at the top
sources of DoS attacks for any top category.
42
Vantage Report User’s Guide

Chapter 3 The Web Configurator
Table 11 Menu Panel
LEVEL 1/2 LEVEL 3 FUNCTION
Intrusion Summary Use this report to look at the number of intrusions by time
interval. You can also use this report to look at the top intrusion
signatures in a specific time interval.
Top Intrusions Use this report to look at the top intrusion signatures by number
of intrusions. You can also use this report to look at the top
sources of intrusions for any top signature.
Top Sources Use this report to look at the top sources of intrusions by number
of intrusions. You can also use this report to look at the top
intrusion signatures for any top source.
Top
Destinations
By Severity Use this report to look at the top severities (significance) of
AntiVirus Summary Use this report to look at the number of virus occurrences by time
Top Viruses Use this report to look at the top viruses by number of
Top Sources Use this report to look at the top sources of virus occurrences by
Top
Destination
AntiSpam Summary Use this report to look at the number of spam messages by time
Top Senders Use this report to look at the top combinations of senders and
Top Sources Use this report to look at the top sources (last mail relay) of spam
Security
Policy
Firewall
Access
Control
Top Users
Blocked
Top Packets
Blocked
Use this report to look at the top destinations of intrusions by
number of intrusions. You can also use this report to look at the
top intrusion signatures for any top destination.
intrusions by number of intrusions. The levels of severity, in
decreasing order of significance, are Emergency (system is
unusable), Alert (immediate action is required), Critical, Error,
Warning, Notice, Informational, and Debug. You can also use this
report to look at the top intrusion signatures for any severity.
interval. Y ou can also use this report to look at the top viruses in a
specific time interval.
occurrences. You can also use this report to look at the top
sources of any top virus.
number of occurrences. You can also use this report to look at the
top viruses for any top source.
Use this report to look at the top destinations of virus occurrences
by number of occurrences. You can also use this report to look at
the top viruses for any top destination.
interval. You can also use this report to look at the top
combinations of senders and first SMTP servers to which the spam
was sent in a specific time interval.
first SMTP servers to which the spam was sent by number of
messages.
messages by number of messages.
Use these reports to look at the top sources and destinations of
traffic that is forwarded or blocked based on each device’s content
filtering settings. You can also look at the amount of traffic
forwarded or blocked by time interval.
Use this report to look at the users from which the device blocked
the most traffic.
Use this report to look at the firewall rule that blocked the most
packets.
Vantage Report User’s Guide
43

Chapter 3 The Web Configurator
Table 11 Menu Panel
LEVEL 1/2 LEVEL 3 FUNCTION
Application
Access
Control
WEB Blocked Summary Use this report to look at the number of attempts to access
WEB Allowed Summary Use this report to look at the number of attempts to access
Event
Login Successful
Top
Applications
Blocked
Top Users
Blocked
Top
Applications
Allowed
Top Sites Use this report to look at the top destinations in attempts to
Top Hosts Use this report to look at the top sources of attempts to access
Top Users Use this report to look at the users for which the device blocked
By Category Use this report to look at the top categories of destinations in
Top Sites Use this report to look at the top destinations of attempts to
Top Hosts Use this report to look at the top sources of attempts to access
Top Users Use this report to look at the top users for which the device
Login
Failed Login Use this screen to look at who tried to log in into the ZyXEL device
Use this report to look at the applications for which the device
blocked the most connections.
Use this report to look at the users for which the device blocked
the most connections.
Use this report to look at the applications for which the device allowed the
most connections.
blocked web sites by time interval. Y ou can also use this report to
look at the top sources of attempts to access blocked web sites in
a specific time interval.
access blocked web sites by number of attempts. You can also use
this report to look at the top sources of attempts to access
blocked web sites for any top destination.
blocked web sites by number of attempts. You can also use this
report to look at the top destinations in attempts to access
blocked web sites for any top source.
the most web site access attempts. You can also look at the top
destinations for any user for which the device blocked the most
web site access attempts.
attempts to access blocked web sites by number of attempts. You
can also use this report to look at the top destinations in attempts
to access blocked web sites for any top category.
allowed web sites by time interval. Y ou can also use this report to
look at the top sources of attempts to access allowed web sites in
a specific time interval.
access allowed web sites by number of attempts. Y ou can also use
this report to look at the top sources of attempts to access
allowed web sites for any top destination.
allowed web sites by number of attempts. You can also use this
report to look at the top destinations in attempts to access
allowed web sites for any top source.
forwarded web traffic. You can also use this report to look at the
top destinations for any top source of forwarded web traffic.
Use this screen to look at who successfully logged into the ZyXEL
device (for management or monitoring purposes).
(for management or monitoring purposes) but failed.
44
Vantage Report User’s Guide

Chapter 3 The Web Configurator
Table 11 Menu Panel
LEVEL 1/2 LEVEL 3 FUNCTION
Session Per
Host
Top Hosts Use this screen to see which hosts have most frequently gone
Top Users Use this screen to see which users have most frequently gone
EPS Use this screen to see which users’ computers complied or failed
Schedule
Report
Summary Use this screen to set up and maintain daily , weekly , and overtime
Configure
Template
Logo
Template
Log
Log Viewer Use this screen to query and look at log entries for the selected
Log Receiver Use these screens to look at the total number of logs that V antage
VRPT System
Logs
Log Archiving Use these screens to archive historical logs regularly and store in
Log Remove Use this screen to remove historical logs collected within a
System Setting The root account can use all of the following screens. Other
General
Configuration
Server
Configuration
Data
Maintenance
Upgrade Use this screen to install new releases of Vantage Report. Do not
Configuration You can use this screen to backup or restore the settings in the
Device List You can use this screen to export the current device window to an
A device can limit a user’s maximum number of NA T sessions. Use
these screens to see who has exceeded the maximum number of
NAT sessions the most often.
over the maximum number of NAT sessions per host.
over the maximum number of NAT sessions per host.
to comply with defined corporate policies before they can access
the network.
(one-time) reports that Vantage Report sends by e-mail.
Use this screen to add and edit report templates.
Use this screen to configure the title name and logo shown on all
reports.
ZyXEL device.
Report has received per day or per device.
Use this screen to look at the Vantage Report’s system logs.
a preferred locaton. The location includes local directory in the
Vantage Report server, an FTP server or a NAS (Network Archived
Storage) device.
specified period.
users can use the About screen and some features in User
Management.
Use this screen to maintain global reporting settings, such as how
many days of logs to keep and default chart type.
Use this screen to set up the SMTP mail server that Vantage
Report uses for notifications and scheduled reports.
General Configuration, and Server Configuration screens.
(The format is XML.)
XML file, or you can add devices stored in XML format to V antage
Report.
use this screen to upgrade to the full version.
Vantage Report User’s Guide
45

Chapter 3 The Web Configurator
Table 11 Menu Panel
LEVEL 1/2 LEVEL 3 FUNCTION
Registration Use this screen to get the trial version, upgrade to the full
version, or increase the number of devices Vantage Report
supports.
User
Management
Group Use this screen to manage (create, delete, edit) groups. You can
Account Use this screen to manage (create, delete, edit) user accounts.
The Vantage Report supports multiple groups and users.
also specify folders and devices this group users are allowed to
view and manage.
The following table lists the differences in the functions for the basic and full
versions.
Table 12 Function differences for Basic and Full Versions
FEATURE BASIC FULL NOTES
Bandwidth Report by Direction ALL Incoming
Outgoing
ALL
LAN-WAN
LAN-DMZ
LAN-LAN
WAN-WAN
WAN-DMZ
WAN-LAN
DMZ-WAN
DMZ-DMZ
DMZ-LAN
Report > Traffic > Bandwidth Yes Yes Bandwidth monitor is
available for basic version.
Report > Traffic > WEB Yes Yes
Report > Traffic > FTP Yes Yes
Report > Traffic > MAIL Yes Yes
Report > Traffic > Customization Yes Yes
Report > VPN > Site-to-Site > Top
Hosts
Report > VPN others No Yes
Report > Network Attack >Attack Yes Yes
Report > Network Attack > Intrusion
(Report for IDP10)
Yes* Yes
Yes Yes A vailable for 2.00(XA0) and
later.
46
Vantage Report User’s Guide

Chapter 3 The Web Configurator
Table 12 Function differences for Basic and Full Versions
FEATURE BASIC FULL NOTES
Report > Network Attack > Intrusion
(Report for ZyNOS-based and ZLD-
based ZyWALL models)
Report > Network Attack > AntiVirus No Yes Available for 4.00 or later
Report > Network Attack > AntiSpam No Yes A v ailable for 4.00 or later
Report > Security Policy > Firewall
Access Control
Report > Security Policy >
Application Access Control
Report > Security Policy > WEB
Blocked > By Category
Report > Security Policy > WEB
Blocked others
Report > Security Policy > WEB
Allowed
Report > Event > Login Yes Yes
Report > Session Per Host No Yes
Report > EPS No Yes
No Yes Available for 4.00 or later
for ZyNOS-based ZyWALL
models.
Available for 1.01 or later
for the ZLD-based ZyWALL
models.
for ZyNOS-based ZyWALL
models.
for ZyNOS-based ZyWALL
models.
No Yes
No Yes
No Yes
Yes Yes
Yes Yes
* - For ZyNOS-based devices, this function is available with the basic version. For ZLD-based devices, this
function is available with full version.
You can also right-click in the menu panel. The following menu appears.
Figure 14 Menu Panel Right-Click Menu
Click About Adobe Flash Player 9... to get information about the current
version of Flash.
3.6 Report and Setting Window
The report and setting window displays the monitor, statistical report, or screen
that you select in the device window and the menu panel.
Vantage Report User’s Guide
47

Chapter 3 The Web Configurator
3.6.1 Device Information Screen
When you first click on a device in the device window, the information you
configured for the device displays in the report and setting window. See Section
3.4 on page 34 for how to add and edit device information.
Figure 15 Device Information Screen
Each field is explained in the following table.
Table 13 Device Information Screen Fields
LABEL DESCRIPTION
Device
Path
MAC This is the LAN MAC address of the device. For the ZyWALL 1050, this is the
System
Name
System Up
Time
Model
Name
Firmware
Version
You can create multiple layers of folders for devices. This field displays the
name used to refer to the device in Vantage Report and the folders that the
device is in. For example, if the device path is “folder1/folder2/myZW5”,
“folder1” is in the root folder, “folder2” is in folder1 and “myZW5” is the
name of the device and it is in folder2.
first (lowest) LAN MAC address.
This is the name of the device you configured.
This is the total amount of time the ZyXEL device has been running since it
last restarted.
This is the model type of the device. See Table 209 on page 467 for a list of
which items Vantage Report supports with various firmware versions of
various devices.
This is the firmware version the ZyXEL device currently uses.
48
Vantage Report User’s Guide

3.6.2 Monitors and Statistical Reports
The layout in the report and setting window is similar for all monitors. Similarly,
the layout is similar for all statistical reports. For other screens, the layout is
different for each one. Typical examples of monitors and statistical reports are
shown in Figure 16.
Figure 16 Report and Setting Window: Monitor and Statistical Report Examples
Chapter 3 The Web Configurator
Monitor
Statistical Report
Vantage Report User’s Guide
49

Chapter 3 The Web Configurator
3.6.2.1 Monitor Layout
A typical monitor is shown in Figure 10.
Figure 17 Typical Monitor Layout
1
3
4
5
6
Each numbered section above is described in the following table.
2
Table 14 Typical Monitor Features
SECTION DESCRIPTION
1 Device Path, MAC: These fields display the path you added the ZyXEL
device in the Vantage Report and the device’s MAC address.
2 Print icon: Click this icon to print the current screen.
3 This field shows the menu items you selected to open this monitor.
4 This field displays the title of the monitor.
5 Start Time: the time of the earliest traffic information in the graph
End Time: the time of the latest traffic information in the graph.
Refresh icon: Click this icon to update the screen immediately.
6 The graph shows how the status changes over time. The X-axis (horizontal) is
time. See Section 2.3 on page 25 for more information about clock time in
Vantage Report. The Y-axis (vertical) depends on the type of monitor you
select. In Figure 17, the Y-axis is the amount of traffic in kilobytes the ge1
Ethernet interface has transmitted and received in the past one hour. See
Section 2.4 on page 25 for more information about the source data used by
the monitor.
50
Vantage Report User’s Guide

You can also right-click on monitors. In some places, you see the standard
browser menu. In other places (especially on graphs), the following menu
appears.
Figure 18 Report and Setting Window Right-Click Menu
Click Settings... if you want to change the Flash settings on the Vantage Report
server. In most cases, this is unnecessary. Click About Adobe Flash Player 9...
to get information about the current version of Flash.
3.6.2.2 Statistical Report Layout
A typical statistical report is shown in Figure 19.
Figure 19 Typical Statistical Report Layout
Chapter 3 The Web Configurator
7
1
2
3
4
5
6
Vantage Report User’s Guide
51

Chapter 3 The Web Configurator
Each numbered section above is described in the following table.
Table 15 Typical Statistical Report Features
SECTION DESCRIPTION
1 Device Path, MAC: These fields display the path you added the ZyXEL
device in the Vantage Report and the device’s MAC address.
2 Print icon: Click this icon to print the current screen.
3 This field shows the menu items you selected to open this statistical report.
4 This field displays the title of the statistical report. The title includes the
date(s) you specified in section 5.
5 Last, Settings icon: Use one of these fields to specify what historical
information is included in the report.
• Select how many days, ending (and including toda y), in the Last field.
• Click the Settings icon, the Report Display Settings screen appears.
The date range can be up to 30 days long. You can select custom.. in the
Last field and then select a specific Start Date and End Date.
When you change any of these fields, the report updates automatically.Both
the Last and Settings fields reset to the default values when you click a
menu item in the menu panel (including the menu item for the same report).
They do not reset when you open or close drill-down reports.
These fields are not available in drill-down reports because these reports use
the same historical information as the main report.
See Section 2.3 on page 25 for more information about time in Report
screens.
6 The graph displays the specified report visually.
• Click the Pie View or the Bar View icon. You can specify the Default
Chart Type in System Setting > General Configuration. See Section
13.1 on page 423.
• Move your mouse over a slice in the pie chart or a bar in the bar chart to
display its identification.
• Click on a slice in the pie chart to move it away from the pie chart a little.
See Section 2.4 on page 25 for more information about the source data used
by the statistical report.
7 In the table,
• Click on a link to drill down into the report. The current report is replaced
by a detailed report for the selected record. The detailed report uses the
same historical information you select in #5.
•If DNS Reverse is enabled in System Setting > General
Configuration, the table displays the domain name, if identifiable, with IP
addresses (for example, “www.yahoo.com/200.100.20.10”). See Section
13.1 on page 423.
• Some reports provide extra information (for example, number of traffic
events) in the table. See each report for more information.
• Click a view logs icon to display the logs related to the individual record.
See Section 2.4 on page 25 for more information about the source data used
by the statistical report.
52
Vantage Report User’s Guide

You can also right-click on statistical reports. In some places, you see the
standard browser menu. In other places (especially on graphs), the following
menu appears.
Figure 20 Report and Setting Window Right-Click Menu
Click Settings... if you want to change the Flash settings on the Vantage Report
server. In most cases, this is unnecessary. Click About Adobe Flash Player 9...
to get information about the current version of Flash.
3.6.3 View Logs
The Logs > Log Viewer screen displays the logs related to an i ndividual record in
a statistical report. See Appendix C on page 481 and Appendix D on page 507 for
information on the logs.
Figure 21 View Logs
Chapter 3 The Web Configurator
See Table 169 on page 402 for the description of each field in this screen.
Vantage Report User’s Guide
53

Chapter 3 The Web Configurator
3.7 System Dashboard
When you log into the Vantage Report, the System Dashboard is the first screen
displayed. The screen summarizes the Vantage Report system, license, log
received and system settings information. Y ou can also click the Dashboard button
at the right top corner to open this screen when you are in another screen.
Figure 22 System Dashboard
Each field is described in the following table.
Table 16 System Dashboard
LABEL DESCRIPTION
Refresh Now Click this to get this screen updated immediately.
Server Information
Software Version This field displays the Vantage Report version.
Release Date This field displays the date the Vantage Report software version is
released.
Free Disk Space This field displays the available disk space in the computer your
Vantage Report is installed.
Max JVM Memory
Size
T otal JVM Memory
Size
Used JVM Memory
Size
This field displays the maximum memory size the Vantage Report’s
Java Virtual Machine (JVM) can allocate on the computer where the
Vantage Report is installed. You can configure the memory size
according to the computer’s RAM (Random Access Memory) size. Java
applications request memory to the computer through the JVM.
This field displays the total amount of memory the computer has
allocated for the Vantage Report’s JVM.
This field displays the amount of memory size the Java applications
are using.
54
Vantage Report User’s Guide

Chapter 3 The Web Configurator
Table 16 System Dashboard
LABEL DESCRIPTION
Free JVM Memory
Size
Log Receiver Information
Total Log Number This field displays the total number of log entries the Vantage Report
Total Number of
Today
Max Log Number
of Single Device
Average Speed of
Receiver
License Information
Status This field displays the status or the version type (Full Version or
Account on
myzyxel.com
Authentication
Code
Max Supported
Devices
License Allowed
Devices
Managed Devices This field displays the number of ZyXEL devices you can manage in
Copyright This field displays the copyright of the Vantage Report.
System Settings
Alive Log Days Thi s field display s the number of days the V a ntage Rep ort stores logs.
SMTP Server This field displays the mail server you configured for the Vantage
This field displays the amount of memory size available for Java
applications.
stores.
This field displays the total number of log entries the Vantage Report
has received today.
This field displays the number of a device’s log entries and the
device’s name which sends the most number of logs to the V antage
Report.
This field displays the average time in seconds the Vantage Report
received a log entry since it is last started.
Basic Version) of the Vantage Report license. Click the hyperlink to
view more information about the license status in the System
Setting > Registration screen.
This field displays the user account you used to register your Vantage
Report to the www.zyxel.com website. Click the myzyxel.com
hyperlink to take you to the website. www.myzyxel.com is a central
product registration website owned by ZyXEL.
This field displays the string generated during the registration of your
Vantage Report to www.zyxel.com.
This field displays the maximum number of ZyXEL devices your
Vantage Report version supports.
This field displays the maximum ZyXEL devices you are allowed to
manage in the Vantage Report. The number depends on the license
you have entered in the System Setting > Registration. See
Section 13.5.1 on page 433.
the Vantage Report. Click the Add Device icon to add more devices
in the Vantage Report.
The Vantage Report automatically deletes logs over this configured
days.
Report to send reports through emails. Click the edit icon to take you
to the System Setting > Server Configuration screen where you
can configure the related settings.
Vantage Report User’s Guide
55

Chapter 3 The Web Configurator
Table 16 System Dashboard
LABEL DESCRIPTION
Web Port This field displays the port number the Vantage Report listens for
Archived Log
Location
user’s web interface access. Click the edit icon to take you to the
System Setting > Server Configuration screen where you can
change the setting.
This field displays the location where the Vantage Report stores its
archived logs currently. Click the edit icon to take you to the Logs >
Log Archiving > File Archiving Settings screen where you can
configure the related settings.
56
Vantage Report User’s Guide

Chapter 3 The Web Configurator
Vantage Report User’s Guide
57

Chapter 3 The Web Configurator
58
Vantage Report User’s Guide

PART II
Monitors, Reports
and Logs
Monitor (61)
Traffic (79)
VPN (167)
Network Attack (249)
Security Policy (317)
Event (369)
EPS (379)
Schedule Report (383)
Logs (401)
59

60

CHAPTER 4
Monitor
Use monitor screens to check the status of ZyXEL devices. See Section 2.3 on
page 25 for a related discussion about time.
Note: The available Monitor sub-menus may vary depending on your selected ZyXEL
device model.
4.1 Monitor (Folder)
Click a folder to open this screen. This screen provides a summary table to
monitor the current CPU and memory usage, the number of sessions, total
amount of traffic handled by each device under the folder.
Figure 23 Monitor (Folder)
Each field is described in the following table.
Table 17 Monitor (Folder)
LABEL DESCRIPTION
Refresh
Interval
Device This field displays the name of a device under the selected folder configured
CPU This field displays the current CPU usage in percentage on the device.
Select how often (1 Minute, 5 Minutes, 10 Minutes) the Vantage Report
updates the information in this screen. Select None to not to update this
screen. Click Refresh Now to update the screen immediately.
when the device was registered in the Vantage Report.
Vantage Report User’s Guide
61

Chapter 4 Monitor
Table 17 Monitor (Folder)
LABEL DESCRIPTION
Memory This field displays the current memory usage in percentage on the device.
Session This field displays the number of sessions the device is currently handling.
4.1.1 Customize the Column Fields
Click a folder and then click the Setting ( ) icon at the top-right corner of the
screen to open this screen. Use this screen to customize the column fields in the
Monitor (Folder) screen (see Figure 23 on page 61). Vantage Report monitors
the CPU usage, memory usage and the number of concurrent sessions by default
for devices under a folder.
Figure 24 Customize the Column Fields
Each field is described in the following table.
Table 18 Customize the Column Fields
LABEL DESCRIPTION
Monitor Select a category to monitor device(s) under the folder.
Port This field is available when you select Port Usage in the Monitor
field. Select a port to monitor.
Direction This field is available when you select Port Usage or Interface
Usage in the Monitor field. Select transmission (Tx), receiving (Rx)
or both (Tx+Rx) for the traffic direction to monitor.
Interface Type This field is available when you select Interface Usage in the
Monitor field. Select the type of the interface to monitor.
Interface This field is available when you select Interface Usage in the
Monitor field. The available options in this field may vary depending
on the Interface Type you select. Select an interface to monitor.
Service This field is available when you select Service Monitor in the
Monitor field. Select a service type to monitor.
Monitor Name Type up to 29 alphanumeric characters for the name of the monitor
item. Underscore (_) is allowed.
Add Click this to add the monitor item to the list table below and save the
changes to the Vantage Report.
62
Vantage Report User’s Guide

Table 18 Customize the Column Fields
LABEL DESCRIPTION
# This field displays the index number of the monitor item.
Monitor Name This field displays the name of the monitor item.
Monitor This field displays the category of the monitor item.
Parameter This field displays the additional parameters of the monitor item. N/A
displays if no additional parameters for the monitor item.
Back Click this to go back to the previous screen.
4.2 Dashboard Configuration
The dashboard gives a quick top level summary of activity for each device. Click a
device and then click the Monitor menu to open the screen for the device. Y ou get
to pre-configure a list of reports or monitors you want the Vantage Report to
display first. The dashboard is available with the full version of Vantage Report.
Chapter 4 Monitor
Click the here link if it is the first time you co nf igure the dashboard for a device.
Figure 25 Dashboard Initial View
Vantage Report User’s Guide
63

Chapter 4 Monitor
Then it takes you to the following screen where you can configure up to 4
monitors and/or reports shown in the device dashboard at one time.
Figure 26 Dashboard Configuration
Select a monitor or summary report to display for each.
Note: The available monitor and summary report options shown in the list box may
vary depending on the selected ZyXEL device.
Figure 27 Dashboard Select Device and Monitor or Summary
64
Vantage Report User’s Guide

4.3 Dashboard Configured
The dashboard looks as follows when you finish configuring it.
Click the magnifying glass icon at the right bottom of each monit or or report to go
to the corresponding monitor screen. The dashboard is available with the full
version of Vantage R eport. See Section 3.6.1 on pag e 48 for t he field descri pti ons
shown in the screen.
Figure 28 Dashboard Configured
Chapter 4 Monitor
If you want to change a dashboard monitor or report, click the icon at the top
right corn. See Figure 26 on page 64.
If you want to print the screen, click the icon.
Vantage Report User’s Guide
65

Chapter 4 Monitor
4.4 Bandwidth Monitor
Click Monitor > Bandwidth to open this screen. Use this screen to monitor the
total amount of traffic handled by the select ed device.
Figure 29 Monitor > Bandwidth
Each field is described in the following table.
Table 19 Monitor > Bandwidth
LABEL DESCRIPTION
Period Select the length of time for which Vantage Report should display
statistics.
Start Time This field displays the date and time of the earliest traffic statistics in
the graph. Vantage Report automatically calculates the start time
depending on the period you selected in the Period field.
End Time This field displays the date and time of the latest traffic statistics in
the graph.
The Refresh icon updates the information in the screen.
graph The graph shows how the status changes over time.
Y-axis (vertical): displays how much traffic is handled by the device.
X-axis (horizontal): displays a date or time depending on the length
of time you choose in the Period field.
66
Vantage Report User’s Guide

4.5 CPU Usage Monitor
Click Monitor > CPU Usage to open this screen. Use this screen to monitor CPU
usage in the selected device.
Figure 30 Monitor > CPU Usage
Chapter 4 Monitor
Each field is described in the following table.
Table 20 Monitor > CPU Usage
LABEL DESCRIPTION
Period Select the length of time for which Vantage Report should display
statistics.
Start Time This field displays the date and time of the earliest traffic statistics in
the graph. The V antage R eport automatically calculates the start time
depending on the period you selected in the Period field.
End Time This field displays the date and time of the latest traffic statistics in
the graph.
The Refresh icon updates the information in the screen.
graph The graph shows how the status changes over time.
Y-axis (vertical): displays the percentage of CPU usage on the
selected device at various times.
X-axis (horizontal): displays a date or time depending on the length
of time you choose in the Period field.
Vantage Report User’s Guide
67

Chapter 4 Monitor
4.6 Memory Usage Monitor
Click Monitor > Memory Usage to open this screen. Use this screen to monitor
memory usage in the selected device.
Figure 31 Monitor > Memory Usage
Each field is described in the following table.
Table 21 Monitor > Memory Usage
LABEL DESCRIPTION
Period Select the length of time for which Vantage Report should display
statistics.
Start Time This field displays the date and time of the earliest traffic statistics in
the graph. The V antage R eport automatically calculates the start time
depending on the period you selected in the Period field.
End Time This field displays the date and time of the latest traffic statistics in
the graph.
The Refresh icon updates the information in the screen.
graph The graph shows how the status changes over time.
Y-axis (vertical): displays the percentage of memory usage on the
selected device at various times.
X-axis (horizontal): displays a date or time depending on the length
of time you choose in the Period field.
68
Vantage Report User’s Guide

4.7 Session Usage Monitor
Click Monitor > Session Usage to open this screen. Use this screen to monitor
the number of sessions change at various times through the selected ZyXEL
device. A session is a TCP/IP connection through the selected ZyXEL device.
Figure 32 Monitor > Session Usage
Chapter 4 Monitor
Each field is described in the following table.
Table 22 Monitor > Session Usage
LABEL DESCRIPTION
Period Select the length of time for which Vantage Report should display
statistics.
Start Time This field displays the date and time of the earliest traffic statistics in
the graph. Vantage Report automatically calculates the start time
depending on the period you selected in the Period field.
End Time This field displays the date and time of the latest traffic statistics in
the graph.
The Refresh icon updates the information in the screen.
graph The graph shows how the status changes over time.
Y-axis (vertical): displays the number of sessions at a specific time or
date.
X-axis (horizontal): displays a date or time depending on the length
of time you choose in the Period field.
Vantage Report User’s Guide
69

Chapter 4 Monitor
4.8 Port Usage Monitor
Click Monitor > Port Usage to open this screen. Use this screen to monitor the
throughput statistics on a selected device’s port.
Figure 33 Monitor > Port Usage
Each field is described in the following table.
Table 23 Monitor > Port Usage
LABEL DESCRIPTION
Port Select a port to display the throughput statistics of the corresponding
port.
Direction Select the direction of the traffic for which you want to show
throughput statistics in this graph.
Select Tx to display transmitted traffic throughput statistics and
select Rx to display received traffic throughput statistics in KBytes
per second. Alternatively, select Tx-Rx to display both.
Period Select the length of time for which Vantage Report should display
statistics.
Start Time This field displays the date and time of the earliest traffic statistics in
the graph. The V antage R eport automatically calculates the start time
depending on the period you selected in the Period field.
End Time This field displays the date and time of the latest traffic statistics in
the graph.
70
Vantage Report User’s Guide

Table 23 Monitor > Port Usage
LABEL DESCRIPTION
The Refresh icon updates the information in the screen.
graph The graph shows how the status changes over time.
Y-axis (vertical): the number of traffic through the selected port.
X-axis (horizontal): The X - axis displays a date or time depending on
the length of time you choose in the Period field.
4.9 Interface Usage Monitor
Click Monitor > Interface Usage to open this screen. Use this screen to monitor
the throughput statistics on a selected device’s interface.
Figure 34 Monitor > Interface Usage
Chapter 4 Monitor
Vantage Report User’s Guide
71

Chapter 4 Monitor
Each field is described in the following table.
Table 24 Monitor > Port Usage
LABEL DESCRIPTION
Interface Select a type of interfaces to display the throughput statistics of the
Interface Name Select an interface for which you want to display the throughput
Direction Select the direction of the traffic you want to show throughput
Period Select the length of time for which Vantage Report should display
Start Time This field displays the date and time of the earliest traffic statistics in
End Time This field displays the date and time of the latest traffic statistics in
corresponding interface type. The available options may vary
depending on the selected device.
The possible options are Ethernet, VLAN, PPP, bridge, dial-
backup, 3G, Wireless.
statistics of the corresponding interface. The available options of this
field vary depending on the type of interface you selected in the
Interface field. See the corresponding device’s User’s Guide for more
information.
statistics in this graph.
Select Tx to display transmitted traffic throughput statistics and
select Rx to display received traffic throughput statistics in KBytes
per second. Alternatively, select Tx-Rx to display both.
statistics.
the graph. The V antage R eport automatically calculates the start time
depending on the period you selected in the Period field.
the graph.
The Refresh icon updates the information in the screen.
graph The graph shows how the status changes over time.
Y-axis (vertical): displays the number of traffic through the selected
interface.
X-axis (horizontal): displays a date or time depending on the length
of time you choose in the Period field.
72
Vantage Report User’s Guide

4.10 Service Monitor
Click Monitor > Service to open this screen. Use this screen to monitor the
amount of traffic generated by web, FTP, mail, or VPN services in the selected
device.
Figure 35 Monitor > Service
Chapter 4 Monitor
Each field is described in the following table.
Table 25 Monitor > Service
LABEL DESCRIPTION
Service Type Select the service whose traffic you want to look at. Choices are:
WEB - Look at the amount of traffic generated by HTTP/HTTPS
services.
FTP - Look at the amount of traffic generated by FTP services.
MAIL - Look at the amount of traffic generated by POP3/SMTP
services.
VPN or IPSec VPN - Look at the amount of traffic generated by
IPSec/VPN services.
SSL VPN - Look at the amount of traffic generated by SSL/VPN
services.
Period Select the length of time for which Vantage Report should display
statistics.
Start Time This field displays the date and time of the earliest traffic statistics in
the graph. Vantage Report automatically calculates the start time
depending on the period you selected in the Period field.
End Time This field displays the date and time of the latest traffic statistics in
the graph.
Vantage Report User’s Guide
73

Chapter 4 Monitor
Table 25 Monitor > Service
LABEL DESCRIPTION
The Refresh icon updates the information in the screen.
graph The graph shows how the status changes over time.
Y- axis (vertical): displays the number of the selected service traffic is
handled by the selected device at various time.
X-axis (horizontal): displays a date or time depending on the length
of time you choose in the Period field.
4.11 Attack Monitor
Click Monitor > Attack to open this screen. Use this screen to monitor the
number of Denial-of-Service (DoS) attacks detected by the selected device’s
firewall.
Figure 36 Monitor > Attack
Each field is described in the following table.
Table 26 Monitor > Attack
LABEL DESCRIPTION
Period Select the length of time for which Vantage Report should display
statistics.
Start Time This field displays the date and time of the earliest traffic statistics in
the graph. Vantage Report automatically calculates the start time
depending on the period you selected in the Period field.
74
Vantage Report User’s Guide

Table 26 Monitor > Attack
LABEL DESCRIPTION
End Time This field displays the date and time of the latest traffic statistics in
the graph.
The Refresh icon updates the information in the screen.
graph The graph shows how the status changes over time.
Y-axis (vertical): displays the number of Denial-of-Service (DoS)
attacks detected by the selected device’s firewall at various times.
X-axis (horizontal): displays a date or time depending on the length
of time you choose in the Period field.
4.12 Intrusion Monitor
Click Monitor > Intrusion to open this screen. Use this screen to monitor the
number of intrusions detected by the selected device’s IDP feature.
Chapter 4 Monitor
Figure 37 Monitor > Intrusion
Each field is described in the following table.
Table 27 Monitor > Intrusion
LABEL DESCRIPTION
Period Select the length of time for which Vantage Report should display
statistics.
Start Time This field displays the date and time of the earliest traffic statistics in
the graph. Vantage Report automatically calculates the start time
depending on the period you selected in the Period field.
Vantage Report User’s Guide
75

Chapter 4 Monitor
Table 27 Monitor > Intrusion
LABEL DESCRIPTION
End Time This field displays the date and time of the latest traffic statistics in
the graph.
The Refresh icon updates the information in the screen.
graph The graph shows how the status changes over time.
Y-axis (vertical): displays the number of intrusions detected by the
selected device’s IDP feature at various times.
X-axis (horizontal): displays a date or time depending on the length
of time you choose in the Period field.
4.13 Anti-Virus Monitor
Click Monitor > AntiVirus to open this screen. Use this screen to monitor the
number of virus occurrences prevented by the selected device.
Figure 38 Monitor > AntiVirus
Each field is described in the following table.
Table 28 Monitor > AntiVirus
LABEL DESCRIPTION
Period Select the length of time for which Vantage Report should display
statistics.
Start Time This field displays the date and time of the earliest traffic statistics in
the graph. Vantage Report automatically calculates the start time
depending on the period you selected in the Period field.
76
Vantage Report User’s Guide

Table 28 Monitor > AntiVirus
LABEL DESCRIPTION
End Time This field displays the date and time of the latest traffic statistics in
the graph.
The Refresh icon updates the information in the screen.
graph The graph shows how the status changes over time.
Y-axis (vertical): displays the number of virus occurrences prevented
by the selected device at various times.
X-axis (horizontal): displays a date or time depending on the length
of time you choose in the Period field.
4.14 Anti-Spam Monitor
Click Monitor > AntiSpam to open this screen. Use this screen to monitor the
number of spam messages stopped and recorded by the selected device.
Chapter 4 Monitor
Figure 39 Monitor > AntiSpam
Each field is described in the following table.
Table 29 Monitor > AntiSpam
LABEL DESCRIPTION
Period Select the length of time for which Vantage Report should display
statistics.
Start Time This field displays the date and time of the earliest traffic statistics in
the graph. Vantage Report automatically calculates the start time
depending on the period you selected in the Period field.
Vantage Report User’s Guide
77

Chapter 4 Monitor
Table 29 Monitor > AntiSpam
LABEL DESCRIPTION
End Time This field displays the date and time of the latest traffic statistics in
graph The graph shows how the status changes over time.
the graph.
The Refresh icon updates the information in the screen.
Y-axis (vertical): displays the number of spam messages stopped by
the selected device at various times.
X-axis (horizontal): displays a date or time depending on the length
of time you choose in the Period field.
78
Vantage Report User’s Guide

CHAPTER 5
Traffic
This chapter discusses how you can check the reports for the top sources and
destinations of traffic for web, FTP, POP3/SMTP, and other protocols.
5.1 Bandwidth
These reports look at how much traffic was handled by ZyXEL devices, who used
the most bandwidth in a ZyXEL device, and which protocols were used. You can
also look at traffic in various directions.
5.1.1 Bandwidth Summary
Use this report to look at the amount of traffic handled by the selected device by
time interval.
Vantage Report User’s Guide
79

Chapter 5 Traffic
Click Report > Traffic > Bandwidth > Summary to open this screen.
Figure 40 Report > Traffic > Bandwidth > Summary
80
Vantage Report User’s Guide

Chapter 5 Traffic
Each field is described in the following table.
Table 30 Report > Traffic > Bandwidth > Summary
LABEL DESCRIPTION
Interface Select the logical interface for which you want to view bandwidth
usage. This field is not available with all models.
Direction Select which kind of traffic, by direction, you want to look at.
Bi-dir - all traffic, regardless of direction
Rx - all traffic received on the device
Tx - all traffic sent from the device
For models where no Interface field displays, there are options for
traffic going to and from specific device interfaces. In addition, the
following options may appear.
All - all traffic, regardless of direction
INBOUND - all traffic routed from the WAN
OUTBOUND - all traffic routed to the WAN
Last ... Days Use this field or Settings to specify what historical information is
included in the report. Select how many days, ending (and including)
today, you want to include.
When you change this field, the report updates automatically . Y ou can
see the current date range in the title.
This field resets to its default value when you click a menu item in the
menu panel (including the menu item for the same report). It does
not reset when you open or close drill-down reports.
Vantage Report User’s Guide
81

Chapter 5 Traffic
Table 30 Report > Traffic > Bandwidth > Summary
LABEL DESCRIPTION
Settings Use these fields or Last ... Days to specify what historical information
is included in the report. Click the settings icon. The Report Display
Settings screen appears.
Select a specific Start Date and End Date. The date range can be up
to 30 days long, but you cannot include days that are older than
Store Log Days in System > General Configuration. Click Apply
to update the report immediately , or click Cancel to close this screen
without any changes.
The Interface and Direction fields are the same as in the main
screen.
You can display the report sorting by the MBytes Transferred,
Sessions or Date/Time fields selected from the Sorting By field.
These fields reset to their default values when you click a menu item
in the menu panel (including the menu item for the same report). It
does not reset when you open or close drill-down reports.
graph The graph displays the information in the table visually.
• Click the Pie View or the Bar View icon. You can specify the
Default Chart Type in System > General Configuration.
• Move your mouse over a slice in the pie chart or a bar in the bar
chart to display its identification.
• Click on a slice in the pie chart to move it away from the pie chart
a little.
Hour (Day) This field displays the time intervals sorting by the amout of traffic
transmitted in the period accordingly. If you select one day of
historical information or less (in the Last ... Days or Settings field)
and it is in the last seven days (today is day one), the time interv al is
hours (in 24-hour format). Otherwise, the time interval is days.
Click on a time interval to look at the top services by amount of traffic
in the selected time interval.
Color This field displays what color represents each record (time interval) in
the graph.
Sessions This field displays the number of traffic events in each interval.
% of Sessions This field displays what percentage each record’s number of traffic
events makes out of the total number of traffic events that match the
settings you displayed in this report.
MBytes
Transferred
This field displays how much traffic (in megabytes) the device
handled in each time interval.
82
Vantage Report User’s Guide

Table 30 Report > Traffic > Bandwidth > Summary
LABEL DESCRIPTION
% of MBytes
Transferred
View Logs Click this icon to see the logs that go with the record.
Total This entry displays the totals for the records above.
This field displays what percentage each record’s amount of traffic
makes out of the total amount of traffic that matches the settings you
displayed in this report.
5.1.2 Bandwidth Summary Drill-Down
Use this report to look at the top services in a specific time interval.
Click on a specific time interval in Report > Traffic > Bandwidth > Summary
to open this screen.
Figure 41 Report > Traffic > Bandwidth > Summary > Drill-Down
Chapter 5 Traffic
Vantage Report User’s Guide
83

Chapter 5 Traffic
Each field is described in the following table.
Table 31 Report > Traffic > Bandwidth > Summary > Drill-Down
LABEL DESCRIPTION
graph The graph displays the information in the table visually.
Protocol This field displays the top services in the selected time interval,
Color This field displays what color represents each service in the graph.
Sessions This field displays the number of traffic events for each service in the
% of Sessions This field displays what percentage each service’s number of traffic
MBytes
Transferred
% of MBytes
Transferred
View Logs Click this icon to see the logs that go with the record.
Total This entry displays the totals for the services above. If the number of
Back Click this to return to the main report.
• Click the Pie View or the Bar View icon. You can specify the
Default Chart Type in System > General Configuration.
• Move your mouse over a slice in the pie chart or a bar in the bar
chart to display its identification.
• Click on a slice in the pie chart to move it away from the pie chart
a little.
sorted by the amount of traffic attributed to each one. These services
may be different than the ones you manage in the Service Settings
screen.
selected time interval.
events makes out of the time interval’s total number of traffic events.
This field displays how much traffic (in megabytes) the device
handled for each service in the selected time interval.
This field displays what percentage of the time interval’s total traffic
belonged to each service.
services in the selected time interval is greater than the maximum
number of records displayed in this table, this total might be a little
lower than the total in the main report.
5.1.3 Bandwidth Top Protocols
Use this report to look at the top services generating traffic through the selected
device.
84
Vantage Report User’s Guide

Chapter 5 Traffic
Click Report > Traffic > Bandwidth > Top Protocols to open this screen.
Figure 42 Report > Traffic > Bandwidth > Top Protocols
Vantage Report User’s Guide
85

Chapter 5 Traffic
Each field is described in the following table.
Table 32 Report > Traffic > Bandwidth > Top Protocols
LABEL DESCRIPTION
Interface Select the logical interface for which you want to view bandwidth
Direction Select which kind of traffic, by direction, you want to look at.
Last ... Days Use this field or Settings to specify what historical information is
usage. This field is not available with all models.
Bi-dir - all traffic, regardless of direction
Rx - all traffic received on the device
Tx - all traffic sent from the device
For models where no Interface field displays, there are options for
traffic going to and from specific device interfaces. In addition, the
following options may appear.
All - all traffic, regardless of direction
INBOUND - all traffic routed from the WAN
OUTBOUND - all traffic routed to the WAN
included in the report. Select how many days, ending (and including)
today, you want to include.
When you change this field, the report updates automatically . Y ou can
see the current date range in the title.
This field resets to its default value when you click a menu item in the
menu panel (including the menu item for the same report). It does
not reset when you open or close drill-down reports.
86
Vantage Report User’s Guide

Chapter 5 Traffic
Table 32 Report > Traffic > Bandwidth > Top Protocols
LABEL DESCRIPTION
Settings Use these fields or Last ... Days to specify what historical information
is included in the report. Click the settings icon. The Report Display
Settings screen appears.
Select a specific Start Date and End Date. The date range can be up
to 30 days long, but you cannot include days that are older than
Store Log Days in System > General Configuration. Click Apply
to update the report immediately , or click Cancel to close this screen
without any changes.
The Interface and Direction fields are the same as in the main
screen.
Select MBytes Transferred to sort the records by the amount of
traffic. Select Sessions to sort by the number of sessions.
TopN: select the number of records that you want to display. For
example, select 10 to display the first 10 records.
Keyword: Enter part or all of any value you want to look for in the
Protocol field. Y ou can use any printable ASCII char acters except the
’ and %. The search is case-insensitive.
These fields reset to the default values when you click a menu item in
the menu panel (including the menu item for the same report). It
does not reset when you open or close drill-down reports.
graph The graph displays the information in the table visually.
• Click the Pie View or the Bar View icon. You can specify the
Default Chart Type in System > General Configuration.
• Move your mouse over a slice in the pie chart or a bar in the bar
chart to display its identification.
• Click on a slice in the pie chart to move it away from the pie chart
a little.
Protocol This field displays the top services generating traffic through the
selected device, sorted by the amount of traffic for each one. If the
number of services is less than the maximum number of records
displayed in this table, every service is displayed. These services may
be different than the ones you manage in the Service Settings
screen.
Color This field displays what color represents each service in the graph.
Vantage Report User’s Guide
Click on a service to look at the top sources of traffic for the selected
service.
87

Chapter 5 Traffic
Table 32 Report > Traffic > Bandwidth > Top Protocols
LABEL DESCRIPTION
Sessions This field displays the number of traffic events for each service.
% of Sessions This field displays what percentage each service’s number of traffic
events makes out of the total number of traffic events that match the
settings you displayed in this report.
MBytes
Transferred
% of MBytes
Transferred
View Logs Click this icon to see the logs that go with the record.
Total This entry displays the totals for the services above.
This field displays how much traffic (in megabytes) each service
generated through the selected device.
This field displays what percentage each record’s amount of traffic
makes out of the total amount of traffic that matches the settings you
displayed in this report.
5.1.4 Bandwidth Top Protocols Drill-Down
Use this report to look at the top sources of traffic for any top service.
88
Vantage Report User’s Guide

Chapter 5 Traffic
Click on a specific service in Report > Traffic > Bandwidth > Top Protocols to
open this screen.
Figure 43 Report > Traffic > Bandwidth > Top Protocol > Drill-Down
Each field is described in the following table.
Table 33 Report > Traffic > Bandwidth > Top Protocol > Drill-Down
LABEL DESCRIPTION
graph The graph displays the information in the table visually.
Host This field displays the top sources of traffic for the selected service,
Color This field displays what color represents each source in the graph.
Vantage Report User’s Guide
• Click the Pie View or the Bar View icon. You can specify the
Default Chart Type in System > General Configuration.
• Move your mouse over a slice in the pie chart or a bar in the bar
chart to display its identification.
• Click on a slice in the pie chart to move it away from the pie chart
a little.
sorted by the amount of traffic generated by each one.
Each source is identified by its IP address. If Hostname Reverse is
enabled in System > General Configuration, the table displays the
host name, if identifiable, with the IP address.
89

Chapter 5 Traffic
Table 33 Report > Traffic > Bandwidth > Top Protocol > Drill-Down
LABEL DESCRIPTION
Sessions This field displays the number of traffic events each source generated
using the selected service.
% of Sessions This field displays what percentage of the selected service’s total
number of traffic events came from each source.
MBytes
Transferred
% of MBytes
Transferred
View Logs Click this icon to see the logs that go with the record.
Total This entry displays the totals for the sources above. If the number of
Back Click this to return to the main report.
This field displays how much traffic (in megabytes) each source
generated using the selected service.
This field displays what percentage of the selected service’s total
traffic came from each source.
sources generating traffic using the selected service is greater than
the maximum number of records displayed in this table, this total
might be a little lower than the total in the main report.
5.1.5 Top Bandwidth Hosts
Use this report to look at the top sources of traffic in the selected device.
90
Vantage Report User’s Guide

Chapter 5 Traffic
Click Report > Traffic > Bandwidth > Top Hosts to open this screen.
Figure 44 Report > Traffic > Bandwidth > Top Hosts
Vantage Report User’s Guide
91

Chapter 5 Traffic
Each field is described in the following table.
Table 34 Report > Traffic > Bandwidth > Top Hosts
LABEL DESCRIPTION
Interface Select the logical interface for which you want to view bandwidth
Direction Select which kind of traffic, by direction, you want to look at.
Last ... Days Use this field or Settings to specify what historical information is
usage. This field is not available with all models.
Bi-dir - all traffic, regardless of direction
Rx - all traffic received on the device
Tx - all traffic sent from the device
For models where no Interface field displays, there are options for
traffic going to and from specific device interfaces. In addition, the
following options may appear.
All - all traffic, regardless of direction
INBOUND - all traffic routed from the WAN
OUTBOUND - all traffic routed to the WAN
included in the report. Select how many days, ending (and including)
today, you want to include.
When you change this field, the report updates automatically . Y ou can
see the current date range in the title.
This field resets to its default value when you click a menu item in the
menu panel (including the menu item for the same report). It does
not reset when you open or close drill-down reports.
92
Vantage Report User’s Guide

Chapter 5 Traffic
Table 34 Report > Traffic > Bandwidth > Top Hosts
LABEL DESCRIPTION
Settings Use these fields or Last ... Days to specify what historical information
is included in the report. Click the settings icon. The Report Display
Settings screen appears.
Select a specific Start Date and End Date. The date range can be up
to 30 days long, but you cannot include days that are older than
Store Log Days in System > General Configuration. Click Apply
to update the report immediately , or click Cancel to close this screen
without any changes.
The Interface and Direction fields are the same as in the main
screen.
Select MBytes Transferred to sort the records by the amount of
traffic. Select Sessions to sort by the number of sessions.
TopN: select the number of records that you want to display. For
example, select 10 to display the first 10 records.
Keyword: Enter part or all of any value you want to look for in the
Host field. You can use any printable ASCII characters except the ’
and %. The search is case-insensitive.
These fields reset to the default values when you click a menu item in
the menu panel (including the menu item for the same report). It
does not reset when you open or close drill-down reports.
graph The graph displays the information in the table visually.
• Click the Pie View or the Bar View icon. You can specify the
Default Chart Type in System > General Configuration.
• Move your mouse over a slice in the pie chart or a bar in the bar
chart to display its identification.
• Click on a slice in the pie chart to move it away from the pie chart
a little.
Host This field displays the top sources of traffic in the selected device,
sorted by the amount of traffic for each one. If the number of sources
is less than the maximum number of records displayed in this table,
every source is displayed.
Vantage Report User’s Guide
Each source is identified by its IP address. If Hostname Reverse is
enabled in System > General Configuration, the table displays the
host name, if identifiable, with the IP address.
Click on a source to look at the top services by amount of traffic for
the selected source.
93

Chapter 5 Traffic
Table 34 Report > Traffic > Bandwidth > Top Hosts
LABEL DESCRIPTION
Color This field displays what color represents each source in the graph.
Sessions This field displays the number of traffic events for each source.
% of Sessions This field displays what percentage each source’s number of traffic
events makes out of the total number of traffic events that match the
settings you displayed in this report.
MBytes
Transferred
% of MBytes
Transferred
View Logs Click this icon to see the logs that go with the record.
Total This entry displays the totals for the sources above.
This field displays how much traffic (in megabytes) each source
generated through the selected device.
This field displays what percentage each record’s amount of traffic
makes out of the total amount of traffic that matches the settings you
displayed in this report.
5.1.6 Top Bandwidth Hosts Drill-Down
Use this report to look at the top services used by any top source.
94
Vantage Report User’s Guide

Chapter 5 Traffic
Click on a specific source in Report > Traffic > Bandwidth > Top Hosts to
open this screen.
Figure 45 Report > Traffic > Bandwidth > Top Hosts > Drill-Down
Each field is described in the following table.
Table 35 Report > Traffic > Bandwidth > Top Hosts > Drill-Down
LABEL DESCRIPTION
graph The graph displays the information in the table visually.
Protocol This field displays the top services used by the selected source, sorted
Color This field displays what color represents each service in the graph.
Sessions This field displays the number of traffic events the selected source
Vantage Report User’s Guide
• Click the Pie View or the Bar View icon. You can specify the
Default Chart Type in System > General Configuration.
• Move your mouse over a slice in the pie chart or a bar in the bar
chart to display its identification.
• Click on a slice in the pie chart to move it away from the pie chart
a little.
by the amount of traffic attributed to each one. These services may
be different than the ones you manage in the Service Settings
screen.
generated using each service.
95

Chapter 5 Traffic
Table 35 Report > Traffic > Bandwidth > Top Hosts > Drill-Down
LABEL DESCRIPTION
% of Sessions This field displays what percentage of the selected source’s total
number of traffic events belong to each service.
MBytes
Transferred
% of MBytes
Transferred
View Logs Click this icon to see the logs that go with the record.
Total This entry displays the totals for the services above. If the number of
Back Click this to return to the main report.
This field displays how much traffic (in megabytes) the selected
source generated using each service.
This field displays what percentage of the selected source’s total
traffic belongs to each service.
services used by the selected source is greater than the maximum
number of records displayed in this table, this total might be a little
lower than the total in the main report.
5.1.7 Top Bandwidth Users
Use this report to look at the selected device’s logged-in users with the most
traffic.
Click Report > Traffic > Bandwidth > Top Users to open this screen.
Figure 46 Report > Traffic > Bandwidth > Top Users
96
Vantage Report User’s Guide

Chapter 5 Traffic
Each field is described in the following table.
Table 36 Report > Traffic > Bandwidth > Top Users
LABEL DESCRIPTION
Interface Select the logical interface for which you want to view bandwidth
usage.
Direction Select which kind of traffic, by direction, you want to look at.
Bi-dir - all traffic, regardless of direction
Rx - all traffic received on the device
Tx - all traffic sent from the device
Last ... Days Use this field or Settings to specify what historical information is
included in the report. Select how many days, ending (and including)
today, you want to include.
When you change this field, the report updates automatically . Y ou can
see the current date range in the title.
This field resets to its default value when you click a menu item in the
menu panel (including the menu item for the same report). It does
not reset when you open or close drill-down reports.
Vantage Report User’s Guide
97

Chapter 5 Traffic
Table 36 Report > Traffic > Bandwidth > Top Users
LABEL DESCRIPTION
Settings Use these fields to specify what historical information is included in
the report. Click the settings icon. The Report Display Settings
screen appears.
Select a specific Start Date and End Date. The date range can be up
to 30 days long, but you cannot include days that are older than
Store Log Days in System > General Configuration. Click Apply
to update the report immediately , or click Cancel to close this screen
without any changes.
The Interface and Direction fields are the same as in the main
screen.
Select MBytes Transferred to sort the records by the amount of
traffic. Select Sessions to sort by the number of sessions.
TopN: select the number of records that you want to display. For
example, select 10 to display the first 10 records.
Keyword: Enter part or all of any value you want to look for in the
User field. You can use any printable ASCII characters except the ’
and %. The search is case-insensitive.
These fields reset to the default values when you click a menu item in
the menu panel (including the menu item for the same report). It
does not reset when you open or close drill-down reports.
graph The graph displays the information in the table visually.
• Click the Pie View or the Bar View icon. You can specify the
Default Chart Type in System > General Configuration.
• Move your mouse over a slice in the pie chart or a bar in the bar
chart to display its identification.
• Click on a slice in the pie chart to move it away from the pie chart
a little.
User This field displays the users with the most traffic in the selected
device, sorted by the amount of traffic for each one. If the number of
users is less than the maximum number of records displayed in this
table, every user is displayed.
Color This field displays what color represents each user in the graph.
98
Each user is identified by user name.
Click a user name to look at the top services by amount of traffic for
the selected user.
Vantage Report User’s Guide

Table 36 Report > Traffic > Bandwidth > Top Users
LABEL DESCRIPTION
Sessions This field displays the number of traffic events for each user.
% of Sessions This field displays what percentage each user’s number of traffic
events makes out of the total number of traffic events that match the
settings you displayed in this report.
MBytes
Transferred
% of MBytes
Transferred
View Logs Click this icon to see the logs that go with the record.
Total This entry displays the totals for the users above.
This field displays how much traffic (in megabytes) each user
generated through the selected device.
This field displays what percentage each user’s amount of traffic
makes out of the total amount of traffic that matches the settings you
displayed in this report.
5.1.8 Top Bandwidth Users Drill-Down
Use this report to look at the top services used by any top bandwidth user.
Chapter 5 Traffic
Vantage Report User’s Guide
99

Chapter 5 Traffic
Click on a specific user in Report > Traffic > Bandwidth > Top Users to open
this screen.
Figure 47 Report > Traffic > Bandwidth > Top Users > Drill-Down
100
Each field is described in the following table.
Table 37 Report > Traffic > Bandwidth > Top Users > Drill-Down
LABEL DESCRIPTION
graph The graph displays the information in the table visually.
• Click the Pie View or the Bar View icon. You can specify the
Default Chart Type in System > General Configuration.
• Move your mouse over a slice in the pie chart or a bar in the bar
chart to display its identification.
• Click on a slice in the pie chart to move it away from the pie chart
a little.
Protocol This field displays the top services used by the selected user, sorted
by the amount of traffic attributed to each one. These services may
be different than the ones you manage in the Service Settings
screen.
Color This field displays what color represents each service in the graph.
Sessions This field displays the number of traffic events the selected user
generated using each service.
Vantage Report User’s Guide
 Loading...