

Page 1

NetAtlas Workgroup
Ethernet Switch Manager
User’s Guide
Version 1.03
1/2007
Edition 1
www.zyxel.com
Page 2

Page 3

About This User's Guide
About This User's Guide
Intended Audience
This manual is intended for people who want to configure the EMS using the web
configurator. You should have at least a basic knowledge of TCP/IP networking concepts and
topology.
Related Documentation
• Quick Start Guide
The Quick Start Guide is designed to help you get up and running right away. It contains
information on setting up your software.
" It is recommended you use the web configurator to configure the EMS.
• Supporting Disk
Refer to the included CD for support documents.
• ZyXEL Web Site
Please refer to www.zyxel.com
certifications.
User Guide Feedback
Help us help you. Send all User Guide-related comments, questions or suggestions for
improvement to the following address, or use e-mail instead. Thank you!
The Technical Writing Team,
ZyXEL Communications Corp.,
6 Innovation Road II,
Science-Based Industrial Park,
Hsinchu, 300, Taiwan.
E-mail: techwriters@zyxel.com.tw
for additional support documentation and product
NetAtlas Workgroup User’s Guide
3
Page 4

Document Conventions
Document Conventions
Warnings and Notes
These are how warnings and notes are shown in this User’s Guide.
1 Warnings tell you about things that could harm you or your device.
" Notes tell you other important information (for example, other things you may
need to configure or helpful tips) or recommendations.
Syntax Conventions
• The NetAtlas Workgroup may be referred to as the “EMS” or the “system” in this User’s
Guide.
• Product labels, screen names, field labels and field choices are all in bold font.
• A key stroke is denoted by square brackets and uppercase text, for example, [ENTER]
means the “enter” or “return” key on your keyboard.
• “Enter” means for you to type one or more characters and then press the [ENTER] key.
“Select” or “choose” means for you to use one of the predefined choices.
• A right angle bracket ( > ) within a screen name denotes a mouse click. For example,
Maintenance > Log > Log Setting means you first click Maintenance in the navigation
panel, then the Log sub menu and finally the Log Setting tab to get to that screen.
• Units of measurement may denote the “metric” value or the “scientific” value. For
example, “k” for kilo may denote “1000” or “1024”, “M” for mega may denote “1000000”
or “1048576” and so on.
• “e.g.,” is a shorthand for “for instance”, and “i.e.,” means “that is” or “in other words”.
4
NetAtlas Workgroup User’s Guide
Page 5
Icons Used in Figures
Figures in this User’s Guide may use the following generic icons.
Computer Notebook computer Telephone
Server DSLAM Firewall
Switch Router
Document Conventions
NetAtlas Workgroup User’s Guide
5
Page 6

Document Conventions
6
NetAtlas Workgroup User’s Guide
Page 7

Contents Overview
Contents Overview
Introduction ............................................................................................................................27
Introduction ................................................................................................................................ 29
Main EMS Screen ...................................................................................................................... 33
Switch Manager ...................................................................................................................... 41
Switch Manager ......................................................................................................................... 43
Map ............................................................................................................................................ 53
View ........................................................................................................................................... 57
Template ................................................................................................................................... 77
Provisioning ............................................................................................................................... 85
Performance .............................................................................................................................. 89
Fault ......................................................................................................................................... 101
Maintenance ............................................................................................................................ 107
Tools .........................................................................................................................................119
Switch Configuration and Troubleshooting ......................................................................123
Device Menu Overview ............................................................................................................ 125
System Configuration .............................................................................................................. 131
Switch Configuration ................................................................................................................ 143
VLAN ....................................................................................................................................... 157
Ethernet Port Configuration ..................................................................................................... 163
Multicast Configuration ............................................................................................................ 179
Configuration .......................................................................................................................... 191
IP Configuration ....................................................................................................................... 199
Troubleshooting ....................................................................................................................... 221
Appendices and Index ......................................................................................................... 225
NetAtlas Workgroup User’s Guide
7
Page 8

Contents Overview
8
NetAtlas Workgroup User’s Guide
Page 9

Table of Contents
Table of Contents
About This User's Guide ..........................................................................................................3
Document Conventions............................................................................................................4
Contents Overview ...................................................................................................................7
Table of Contents......................................................................................................................9
List of Figures .........................................................................................................................17
List of Tables...........................................................................................................................23
Part I: Introduction................................................................................. 27
Chapter 1
Introduction ............................................................................................................................. 29
1.1 Overview .............................................................................................................................. 29
1.1.1 EMS Components ...................................................................................................... 29
1.1.2 SNMPc Network Manager .......................................................................................... 30
1.1.3 Device Firmware Versions Supported ........................................................................ 30
1.2 System Requirements and EMS Installation ....................................................................... 30
1.3 Accessing EMS ................................................................................................................... 31
Chapter 2
Main EMS Screen.................................................................................................................... 33
2.1 Main Screen Overview ........................................................................................................ 33
2.2 Access Log .......................................................................................................................... 34
2.3 Database Management ....................................................................................................... 35
2.3.1 Database Synchronization ......................................................................................... 35
2.3.2 Filename Convention ................................................................................................. 35
2.3.3 Database Backup and Restore .................................................................................. 36
2.3.4 Database Log Storage Configuration ......................................................................... 36
2.3.5 Database Scheduled Backup Configuration .............................................................. 37
2.4 SNMP Operation Mode ....................................................................................................... 38
2.5 Accessing the Switch Manager Screen ............................................................................... 39
Part II: Switch Manager ......................................................................... 41
NetAtlas Workgroup User’s Guide
9
Page 10

Table of Contents
Chapter 3
Switch Manager.......................................................................................................................43
3.1 Switch Manager Overview ................................................................................................... 43
3.2 Device List and Icon Colors ................................................................................................. 44
3.3 System Message Panel Alarm Status ................................................................................. 45
3.4 System Message Panel Port Status .................................................................................... 45
3.5 Menu Shortcut Buttons ........................................................................................................ 45
3.6 EMS Main Menu Summary .................................................................................................. 46
3.7 Common EMS Command Buttons ...................................................................................... 48
3.8 View the Switch ................................................................................................................... 48
3.9 Switch Information .............................................................................................................. 48
3.10 Configuration Save ............................................................................................................ 50
Chapter 4
Map........................................................................................................................................... 53
4.1 Root Subnet and Device Mapping ....................................................................................... 53
4.1.1 Adding a Submap or Device ...................................................................................... 54
4.1.2 Editing a Node ............................................................................................................ 55
4.1.3 Finding an Object ....................................................................................................... 55
4.1.4 Deleting a Submap ..................................................................................................... 55
4.1.5 Deleting a Device ....................................................................................................... 56
4.1.6 Updating Device Map ................................................................................................. 56
4.1.7 Synchronizing Device Map Database ........................................................................ 56
4.2 Exit ....................................................................................................................................... 56
Chapter 5
View.......................................................................................................................................... 57
5.1 Hardware Status .................................................................................................................. 57
5.2 STP/RSTP ......................................................................................................................... 59
5.2.1 STP Terminology ........................................................................................................ 59
5.2.2 STP Port States ..........................................................................................................59
5.2.3 STP Status ................................................................................................................. 60
5.3 VLAN Status ........................................................................................................................ 61
5.4 Port Status ........................................................................................................................... 62
5.5 802.1D ................................................................................................................................. 64
5.5.1 MAC Table .................................................................................................................. 64
5.5.2 ARP Table .................................................................................................................. 65
5.6 Multicast Status ................................................................................................................... 67
5.7 Ethernet Port Status ............................................................................................................ 67
5.8 IP Application Status ............................................................................................................ 69
5.8.1 Routing Table Status .................................................................................................. 69
5.8.2 IP Table Status ........................................................................................................... 70
5.8.3 DHCP Server Status .................................................................................................. 71
10
NetAtlas Workgroup User’s Guide
Page 11

Table of Contents
5.8.4 VRRP Status ..............................................................................................................72
5.8.5 OSPF Status ..............................................................................................................73
5.9 Interface Status .................................................................................................................... 75
5.10 Firmware Version ............................................................................................................... 76
Chapter 6
Template .................................................................................................................................77
6.1 Template Overview .............................................................................................................. 77
6.2 VLAN Template .................................................................................................................... 77
6.2.1 Creating a New VLAN Template ................................................................................ 79
6.3 IGMP Filtering Profile Template ........................................................................................... 79
6.3.1 Configuring an IGMP Filter Template ......................................................................... 80
6.4 Static Multicast Group Template .......................................................................................... 82
6.4.1 Configuring a Multicast Template ............................................................................... 83
Chapter 7
Provisioning ............................................................................................................................85
7.1 Overview .............................................................................................................................. 85
7.2 Applying an IGMP Filter Profile ........................................................................................... 85
7.3 Removing an IGMP Filter Profile ......................................................................................... 87
Chapter 8
Performance............................................................................................................................ 89
8.1 Interface Performance ......................................................................................................... 89
8.2 RMON Ethernet Statistics .................................................................................................... 90
8.3 RMON History Data ............................................................................................................. 92
8.4 Table Menu Bar ................................................................................................................... 94
8.4.1 Editing a Table Entry .................................................................................................. 95
8.4.2 Expand Dialog Box ..................................................................................................... 96
8.5 Graph Menu Bar Icons ........................................................................................................ 97
8.5.1 Graph Styles ............................................................................................................... 98
8.5.2 Chart Format Display Variable ................................................................................... 98
8.5.3 Graph Labels .............................................................................................................. 99
Chapter 9
Fault .......................................................................................................................................101
9.1 Event Log .......................................................................................................................... 101
9.2 Loopback Test ................................................................................................................... 102
9.3 Ping Test ............................................................................................................................ 103
9.4 Traceroute Test .................................................................................................................. 105
Chapter 10
Maintenance ..........................................................................................................................107
NetAtlas Workgroup User’s Guide
11
Page 12

Table of Contents
10.1 Firmware Upgrade ........................................................................................................... 107
10.1.1 Procedure to Update Firmware .............................................................................. 107
10.2 Device Reset ................................................................................................................... 108
10.3 NE Configuration Backup and Restore ............................................................................ 109
10.4 Load Factory Default ........................................................................................................110
10.5 Scheduled Network Element Configuration Backup .........................................................111
10.5.1 Configuring Scheduled NE Configuration Backup ..................................................112
10.5.2 Removing a Scheduled NE Configuration Backup ..................................................113
10.6 Scheduled Device Configuration Restore .........................................................................113
10.6.1 Schedule Content Screen .......................................................................................114
10.6.2 Schedule Content Screen .......................................................................................115
10.7 Scheduled FW Upgrade ...................................................................................................116
Chapter 11
Tools....................................................................................................................................... 119
11.1 Accessing the Switch ........................................................................................................119
11.1.1 Telnet .......................................................................................................................119
11.1.2 Web Access ........................................................................................................... 120
11.2 Ping .................................................................................................................................. 120
Part III: Switch Configuration and Troubleshooting ......................... 123
Chapter 12
Device Menu Overview.........................................................................................................125
12.1 Device Menu Summary ................................................................................................... 125
12.2 Property Configuration ..................................................................................................... 125
12.3 Introducing the Device Configuration Window ................................................................. 126
12.3.1 Port List Multiple Port Configuration ....................................................................... 127
12.3.2 The Copy to.. Button .............................................................................................. 128
Chapter 13
System Configuration...........................................................................................................131
13.1 System Info ...................................................................................................................... 131
13.2 SNMP .............................................................................................................................. 131
13.2.1 Configuring SNMP ................................................................................................. 132
13.3 Remote Management ...................................................................................................... 133
13.4 Time Setup ...................................................................................................................... 135
13.5 Syslog Setup ................................................................................................................... 136
13.5.1 Configuring a Syslog Server .................................................................................. 137
13.6 RADIUS ........................................................................................................................... 138
13.7 Boot Config ...................................................................................................................... 138
12
NetAtlas Workgroup User’s Guide
Page 13

Table of Contents
13.8 IP Setup ........................................................................................................................... 139
13.8.1 Configuring an IP Interface .................................................................................... 141
Chapter 14
Switch Configuration............................................................................................................143
14.1 Switch Setup .................................................................................................................... 143
14.2 Priority Queue .................................................................................................................. 145
14.3 Multiple/ Rapid STP Configuration .................................................................................. 147
14.4 Link Aggregation .............................................................................................................. 148
14.4.1 Dynamic Link Aggregation ..................................................................................... 149
14.4.2 Link Aggregation ID ................................................................................................ 149
14.4.3 Configuring Link Aggregation ................................................................................. 149
14.5 GARP Timer .................................................................................................................... 151
14.6 Filtering ............................................................................................................................ 152
14.6.1 Creating a New Filter ............................................................................................. 152
14.7 MAC Forwarding .............................................................................................................. 153
14.7.1 Configuring a Static MAC Address Entry ............................................................... 154
14.8 Mirroring .......................................................................................................................... 155
Chapter 15
VLAN ......................................................................................................................................157
15.1 Introduction to VLANs ...................................................................................................... 157
15.2 Configuring 802.1Q VLAN ............................................................................................... 157
15.2.1 Configuring an 802.11Q VLAN ............................................................................... 159
15.2.2 Removing a VLAN .................................................................................................. 160
15.3 Introduction to Port-based VLANs ................................................................................... 160
15.3.1 Configuring Port Based VLAN ................................................................................ 161
Chapter 16
Ethernet Port Configuration.................................................................................................163
16.1 Overview .......................................................................................................................... 163
16.2 Port Setup ........................................................................................................................ 163
16.3 Port VLAN ........................................................................................................................ 165
16.4 Port Link Aggregation ...................................................................................................... 166
16.5 Port STP .......................................................................................................................... 167
16.6 Port 802.1x ...................................................................................................................... 168
16.7 Port Mirroring ................................................................................................................... 169
16.8 VLAN Stacking ................................................................................................................. 170
16.9 Queue Method ................................................................................................................. 171
16.10 Protocol VLAN ............................................................................................................... 172
16.10.1 Configuring a Protocol VLAN ............................................................................... 173
16.11 Port Security .................................................................................................................. 174
16.12 Bandwidth Control ......................................................................................................... 175
NetAtlas Workgroup User’s Guide
13
Page 14

Table of Contents
16.13 Broadcast Storm Control ............................................................................................... 176
16.14 DiffServ .......................................................................................................................... 177
Chapter 17
Multicast Configuration........................................................................................................179
17.1 Overview .......................................................................................................................... 179
17.1.1 IP Multicast Addresses ........................................................................................... 179
17.1.2 IGMP Snooping ..................................................................................................... 179
17.2 Multicast Settings ............................................................................................................ 180
17.2.1 Configuring Port Multicast Settings ........................................................................ 181
17.2.2 Applying a Multicast Template ................................................................................ 182
17.2.3 Displaying IGMP Filter Profile ................................................................................ 183
17.3 MVR ................................................................................................................................. 184
17.3.1 Types of MVR Ports ............................................................................................... 185
17.3.2 MVR Modes ........................................................................................................... 185
17.3.3 Viewing MVR Settings ............................................................................................ 185
17.3.4 Creating a New Multicast VLAN ............................................................................. 186
17.3.5 Creating a New MVR Group .................................................................................. 188
Chapter 18
Configuration .......................................................................................................................191
18.1 RMON Overview .............................................................................................................. 191
18.2 History Config .................................................................................................................. 191
18.2.1 Configuring an RMON History ................................................................................ 192
18.3 Event Config .................................................................................................................... 193
18.3.1 Configuring an RMON Event .................................................................................. 194
18.4 Alarm Config .................................................................................................................... 195
18.4.1 Configuring an RMON Alarm ................................................................................. 197
18.4.2 RMON Alarm Event Log ......................................................................................... 198
Chapter 19
IP Configuration.................................................................................................................... 199
19.1 Static Route ..................................................................................................................... 199
19.1.1 Configuring a Static Route ..................................................................................... 200
19.2 DiffServ ............................................................................................................................ 201
19.3 DSCP Setting .................................................................................................................. 202
19.4 IGMP ............................................................................................................................... 203
19.5 DHCP .............................................................................................................................. 204
19.5.1 DHCP modes ........................................................................................................ 204
19.5.2 Configuring DHCP Server .................................................................................... 204
19.5.3 Configuring DHCP Relay ....................................................................................... 206
19.6 DVMRP ............................................................................................................................ 208
19.7 RIP ................................................................................................................................... 209
14
NetAtlas Workgroup User’s Guide
Page 15

Table of Contents
19.8 OSPF ............................................................................................................................... 210
19.8.1 OSPF Autonomous Systems and Areas .................................................................211
19.8.2 Interfaces and Virtual Links .....................................................................................211
19.8.3 Configuring Basic OSPF Settings ...........................................................................211
19.8.4 Configuring a New OSPF Area .............................................................................. 213
19.8.5 Configuring a New OSPF Virtual Link .................................................................... 214
19.8.6 Configuring a New OSPF Interface ........................................................................ 215
19.9 VRRP ............................................................................................................................... 217
19.9.1 Configuring Interface VRRP Settings ..................................................................... 217
19.9.2 Configuring a VRRP Interface ................................................................................ 218
19.10 IP Multicast .................................................................................................................... 220
Chapter 20
Troubleshooting....................................................................................................................221
20.1 Installation Problems ....................................................................................................... 221
20.2 Problems Accessing the EMS ......................................................................................... 221
20.3 Problems Finding a Device .............................................................................................. 222
20.4 Uninstalling the EMS ....................................................................................................... 222
Part IV: Appendices and Index ........................................................... 225
Appendix A SNMPc Network Manager ................................................................................227
Appendix B Alarm Types and Causes.................................................................................. 231
Appendix C Legal Information ..............................................................................................233
Appendix D Customer Support............................................................................................. 235
Index.......................................................................................................................................239
NetAtlas Workgroup User’s Guide
15
Page 16

Table of Contents
16
NetAtlas Workgroup User’s Guide
Page 17

List of Figures
List of Figures
Figure 1 EMS Network Example ........................................................................................................... 29
Figure 2 EMS Server and Remote Clients ............................................................................................ 30
Figure 3 SNMPc: Switch Device List Icon .............................................................................................. 31
Figure 4 NetAtlas Main Screen .......................................................................................................... 31
Figure 5 EMS: Main Screen .................................................................................................................. 32
Figure 6 Main Screen ........................................................................................................................... 33
Figure 7 Admin: Access Log ................................................................................................................... 34
Figure 8 Admin: Database Management: Backup/Restore ................................................................... 36
Figure 9 Admin: Database Management: Log Storage .......................................................................... 37
Figure 10 Admin: Database Management: Scheduled Backup .............................................................. 38
Figure 11 Admin: SNMP Operation Mode ............................................................................................. 39
Figure 12 Switch Manager: Main Screen .............................................................................................. 40
Figure 13 EMS Main Screen Overview .................................................................................................. 43
Figure 14 Device List and Icon Colors: Example ................................................................................... 44
Figure 15 EMS Main Screen Shortcut Bar ............................................................................................ 45
Figure 16 Switch View ........................................................................................................................... 48
Figure 17 Configuration: System Configuration: System Info. ............................................................... 49
Figure 18 Configuration Save ................................................................................................................ 50
Figure 19 Configuration Save: Result .................................................................................................... 51
Figure 20 Submaps and Device Mapping .............................................................................................. 53
Figure 21 Map: Add Submap/Device ...................................................................................................... 54
Figure 22 Map: Edit Node ....................................................................................................................... 55
Figure 23 Map: Find Object .................................................................................................................... 55
Figure 24 Map: Delete Warning .............................................................................................................. 56
Figure 25 View: Hardware Status .......................................................................................................... 57
Figure 26 View: STP Status .................................................................................................................... 60
Figure 27 View: VLAN Status ................................................................................................................. 61
Figure 28 View: Port Status ................................................................................................................... 63
Figure 29 View: 802.1d: MAC Table ...................................................................................................... 64
Figure 30 View: 802.1d: ARP Table ........................................................................................................ 66
Figure 31 View: Multicast Status ........................................................................................................... 67
Figure 32 View: Ethernet Status ............................................................................................................ 68
Figure 33 View: IP Application Status: Routing Table Status ................................................................. 69
Figure 34 View: IP Application Status: IP Table Status .......................................................................... 70
Figure 35 View: IP Application Status: DHCP Server Status ................................................................. 72
Figure 36 View: IP Application Status: VRRP Status ............................................................................. 73
Figure 37 View: IP Application Status: OSPF Status ............................................................................. 74
Figure 38 View: Interface Status ............................................................................................................ 75
NetAtlas Workgroup User’s Guide
17
Page 18

List of Figures
Figure 39 View: Firmware Version ......................................................................................................... 76
Figure 40 Template: VLAN Template ..................................................................................................... 78
Figure 41 Template: IGMP Filtering Profile Template ............................................................................ 80
Figure 42 Template: New IGMP Filter ................................................................................................... 81
Figure 43 Template: Multicast Template ................................................................................................ 82
Figure 44 Template: New Multicast ....................................................................................................... 83
Figure 45 Provisioning: IGMP Filter ....................................................................................................... 86
Figure 46 Provisioning: IGMP Filter: Apply to Devices .......................................................................... 86
Figure 47 Provisioning: IGMP Filter: Apply to Devices: Successful ...................................................... 86
Figure 48 Provisioning: IGMP Filter: Remove From Devices ................................................................. 87
Figure 49 Provisioning: IGMP Filter: Remove From Devices: Select Device ........................................ 88
Figure 50 Provisioning: IGMP Filter: Remove From Devices: Successful ............................................. 88
Figure 51 Performance: Interface ........................................................................................................... 89
Figure 52 Performance: RMON: Ethernet Statistics ..............................................................................91
Figure 53 Performance: RMON: History Data ....................................................................................... 93
Figure 54 Table Menu Bar Icons ............................................................................................................. 94
Figure 55 Edit Table Entry ..................................................................................................................... 95
Figure 56 Expand Field ......................................................................................................................... 97
Figure 57 Graph Menu Bar ..................................................................................................................... 97
Figure 58 Cell Properties Select ............................................................................................................. 98
Figure 59 Chart Color Codes and Line Styles ........................................................................................ 98
Figure 60 Graph Variables ..................................................................................................................... 99
Figure 61 Fault: Event Log ................................................................................................................... 101
Figure 62 Fault: Loopback Test .......................................................................................................... 103
Figure 63 fault: Loopback: Result ........................................................................................................ 103
Figure 64 Fault: Ping and TraceRoute Test: Ping ................................................................................ 104
Figure 65 Fault: Ping and TraceRoute Test: Trace Route ................................................................... 105
Figure 66 Maintenance: Firmware Upgrade ......................................................................................... 108
Figure 67 Maintenance: Firmware Upgrade: Result ............................................................................ 108
Figure 68 Maintenance: Device Reset ................................................................................................. 109
Figure 69 Maintenance: Device Reset: Result .................................................................................... 109
Figure 70 Maintenance: Configuration Backup/Restore ........................................................................110
Figure 71 Maintenance: Load Factory Defaults ..................................................................................... 111
Figure 72 Maintenance: Scheduled NE Config Backup ........................................................................111
Figure 73 Maintenance: Scheduled NE Config Backup: Add Devices .................................................113
Figure 74 Maintenance: Scheduled Device Configuration Restore ......................................................114
Figure 75 Maintenance: Scheduled Device Configuration Restore: Add/Modify ..................................115
Figure 76 Maintenance: Scheduled Device Configuration Restore: Add/Modify ..................................116
Figure 77 Maintenance: Scheduled FW Upgrade ................................................................................116
Figure 78 Tool: Telnet .......................................................................................................................... 120
Figure 79 Tool: Web Access ................................................................................................................. 120
Figure 80 Tool: Ping ............................................................................................................................. 121
Figure 81 Device Panel List Menus ...................................................................................................... 125
18
NetAtlas Workgroup User’s Guide
Page 19

List of Figures
Figure 82 Configuration Window .......................................................................................................... 126
Figure 83 Configuration Window: Port List: Multiple Port Select ......................................................... 127
Figure 84 Applied Results .................................................................................................................... 127
Figure 85 Copy Switch Setting: Example ............................................................................................. 128
Figure 86 Switch Configuration Copy: Success ..................................................................................129
Figure 87 Copy Port Setting: Example ................................................................................................. 129
Figure 88 Copy Successful ................................................................................................................... 130
Figure 89 SNMP Management Model .................................................................................................. 131
Figure 90 System Configuration: SNMP Conf. .....................................................................................133
Figure 91 System Configuration: Remote Management ...................................................................... 134
Figure 92 System Configuration: Time Setup ...................................................................................... 135
Figure 93 System Configuration: Syslog Setup ................................................................................... 136
Figure 94 System Configuration: Syslog Setup: Add .......................................................................... 137
Figure 95 System Configuration: RADIUS .......................................................................................... 138
Figure 96 System Configuration: Boot Config ..................................................................................... 139
Figure 97 System Configuration: Boot Config ..................................................................................... 139
Figure 98 System Configuration: IP Setup .......................................................................................... 140
Figure 99 System Configuration: IP Setup: Add .................................................................................. 141
Figure 100 Switch Configuration: Switch Setup ................................................................................. 143
Figure 101 Switch Configuration: Priority Queue ................................................................................. 146
Figure 102 Switch Configuration: STP Conf. ....................................................................................... 147
Figure 103 Switch Configuration: Link Aggregation ............................................................................ 150
Figure 104 Switch Configuration: GARP Timer ...................................................................................151
Figure 105 Switch Configuration: Filtering ........................................................................................... 152
Figure 106 Switch Configuration: Filtering: Add ................................................................................. 153
Figure 107 Switch Configuration: MAC Forwarding ............................................................................. 154
Figure 108 Switch Configuration: MAC Forwarding: Add .................................................................... 155
Figure 109 Switch Configuration: Mirroring ......................................................................................... 156
Figure 110 Selecting a VLAN Type ...................................................................................................... 157
Figure 111 VLAN Configuration: 802.1Q ............................................................................................. 158
Figure 112 VLAN Configuration: 802.1Q: New or Modify .................................................................... 159
Figure 113 VLAN Configuration: Port Based ....................................................................................... 161
Figure 114 Ethernet Port Configuration: Port Setup ............................................................................163
Figure 115 Ethernet Port Configuration: Port VLAN ............................................................................ 165
Figure 116 Ethernet Port Configuration: Port Link Aggregation ........................................................... 166
Figure 117 Ethernet Port Configuration: Port STP ...............................................................................167
Figure 118 Ethernet Port Configuration: Port 802.1x ............................................................................168
Figure 119 Ethernet Port Configuration: Port Mirroring ........................................................................ 169
Figure 120 Ethernet Port Configuration: VLAN Stacking .................................................................... 170
Figure 121 Ethernet Port Configuration: Queue Method .................................................................... 171
Figure 122 Ethernet Port Configuration: Protocol VLAN ..................................................................... 173
Figure 123 Ethernet Port Configuration: Protocol VLAN Add .............................................................. 174
Figure 124 Ethernet Port Configuration: Port Security ......................................................................... 175
NetAtlas Workgroup User’s Guide
19
Page 20

List of Figures
Figure 125 Ethernet Port Configuration: Bandwidth Ctrl. .................................................................... 176
Figure 126 Ethernet Port Configuration: Broadcast Storm Ctrl. .......................................................... 177
Figure 127 Ethernet Port Configuration: DiffServ ................................................................................ 178
Figure 128 Multicast Configuration: Multicast Settings ........................................................................180
Figure 129 Multicast Configuration: Multicast Settings: Modify ........................................................... 181
Figure 130 Multicast Configuration: Multicast Settings: Load Template .............................................. 183
Figure 131 Multicast Configuration: Multicast Settings: View Profile ................................................... 184
Figure 132 Multicast Configuration: MVR ............................................................................................ 185
Figure 133 Multicast Configuration: MVR: Add MVLAN ...................................................................... 187
Figure 134 Multicast Configuration: MVR: Add MVLAN: Result .......................................................... 187
Figure 135 Multicast Configuration: MVR: Select MVLAN .................................................................. 188
Figure 136 Multicast Configuration: MVR: Add ................................................................................... 188
Figure 137 Multicast Configuration: MVR: Add MVR Group: Result ................................................... 189
Figure 138 RMON Configuration: History Config. ............................................................................... 192
Figure 139 RMON Configuration: History Config.: New ...................................................................... 193
Figure 140 RMON Configuration: Event Config. .................................................................................. 194
Figure 141 RMON Configuration: Event Config.: New ........................................................................ 195
Figure 142 RMON Configuration: Alarm Config. ................................................................................. 196
Figure 143 RMON Configuration: Alarm Config.: New ........................................................................ 197
Figure 144 RMON Configuration: Alarm Config.: New: Browse ........................................................... 197
Figure 145 RMON Configuration: Alarm Config.: Show Log ............................................................... 198
Figure 146 IP Configuration: Static Route ........................................................................................... 199
Figure 147 Routing Configuration: Static Route: Add .......................................................................... 200
Figure 148 IP Configuration: DiffServ .................................................................................................. 201
Figure 149 IP Configuration: DiffServ .................................................................................................. 202
Figure 150 IP Configuration: IGMP ..................................................................................................... 203
Figure 151 IP Configuration: DHCP: Server ........................................................................................ 205
Figure 152 IP Configuration: DHCP: Server: New .............................................................................. 206
Figure 153 IP Configuration: DHCP: Relay ......................................................................................... 207
Figure 154 IP Configuration: DVMRP .................................................................................................. 209
Figure 155 IP Configuration: RIP ......................................................................................................... 210
Figure 156 IP Configuration: OSPF ..................................................................................................... 212
Figure 157 IP Configuration: OSPF: New OSPF Setting ..................................................................... 214
Figure 158 IP Configuration: OSPF: New Virtual Link ......................................................................... 215
Figure 159 IP Configuration: OSPF: New Interface ............................................................................. 216
Figure 160 IP Configuration: VRRP ..................................................................................................... 217
Figure 161 IP Configuration: VRRP: New ........................................................................................... 219
Figure 162 IP Configuration: IP Multicast ............................................................................................ 220
Figure 163 EMS: Remove .................................................................................................................... 222
Figure 164 EMS: Remove: Select Application .................................................................................... 223
Figure 165 Automatic Startup ............................................................................................................... 227
Figure 166 SNMPc Main Windows ....................................................................................................... 228
Figure 167 SNMPc Main Button Bar Icons ........................................................................................... 230
20
NetAtlas Workgroup User’s Guide
Page 21

List of Figures
Figure 168 SNMPc Edit Button Bar Icons ............................................................................................ 230
NetAtlas Workgroup User’s Guide
21
Page 22

List of Figures
22
NetAtlas Workgroup User’s Guide
Page 23

List of Tables
List of Tables
Table 1 Device Firmware Versions Supported ....................................................................................... 30
Table 2 Main Screen Menu Overview .................................................................................................... 33
Table 3 Admin: Access Log ................................................................................................................... 34
Table 4 Admin: Database Management: Backup/Restore ..................................................................... 36
Table 5 Admin: Database Management: Log Storage ........................................................................... 37
Table 6 Admin: Database Management: Scheduled Backup ................................................................ 38
Table 7 Admin: SNMP Operation ........................................................................................................... 39
Table 8 EMS Main Screen Overview ..................................................................................................... 44
Table 9 System Message Panel Alarm Status ....................................................................................... 45
Table 10 EMS Navigation Panel Sub-link Descriptions ......................................................................... 46
Table 11 Common EMS Command Buttons .......................................................................................... 48
Table 12 Configuration: Switch Configuration: System Info. .................................................................. 49
Table 13 Map: Add Submap/Device ...................................................................................................... 54
Table 14 Status: Hardware Status ......................................................................................................... 58
Table 15 STP Path Costs ...................................................................................................................... 59
Table 16 STP Port States ...................................................................................................................... 59
Table 17 View: STP Status .................................................................................................................... 60
Table 18 View: VLAN Status .................................................................................................................. 62
Table 19 View: Port Status ..................................................................................................................... 63
Table 20 View: 802.1d: MAC Table ........................................................................................................ 64
Table 21 View: 802.1d: ARP Table ........................................................................................................ 66
Table 22 View: Multicast Status ............................................................................................................. 67
Table 23 View: Ethernet Status .............................................................................................................. 68
Table 24 View: IP Application Status: Routing Table Status .................................................................. 70
Table 25 View: IP Application Status: IP Table Status ........................................................................... 71
Table 26 View: IP Application Status: DHCP Server Status ................................................................... 72
Table 27 View: IP Application Status: VRRP Status .............................................................................. 73
Table 28 View: IP Application Status: OSPF Status ............................................................................... 74
Table 29 View: Interface Status ............................................................................................................. 75
Table 30 View: Firmware Version .......................................................................................................... 76
Table 31 Template: VLAN ...................................................................................................................... 78
Table 32 Template: IGMP Filter Template .............................................................................................. 80
Table 33 Template: New IGMP Filter ..................................................................................................... 81
Table 34 Template: Multicast ................................................................................................................. 82
Table 35 Template: New Multicast ......................................................................................................... 83
Table 36 Performance: Interface ........................................................................................................... 89
Table 37 Performance: RMON: Ethernet Statistics ................................................................................ 91
Table 38 Performance: RMON: History Data ......................................................................................... 93
NetAtlas Workgroup User’s Guide
23
Page 24

List of Tables
Table 39 Edit Table Entry ....................................................................................................................... 95
Table 40 Variable Types ........................................................................................................................ 97
Table 41 Edit Table Entry ....................................................................................................................... 98
Table 42 Edit Style Dialog Box ............................................................................................................... 99
Table 43 Graph Variables ...................................................................................................................... 99
Table 44 Fault: Event Log .................................................................................................................... 101
Table 45 Fault: Ping and TraceRoute Test: Ping ................................................................................. 104
Table 46 Fault: Ping and TraceRoute Test: Ping ................................................................................. 105
Table 47 Maintenance: Configuration Backup/Restore ........................................................................110
Table 48 Maintenance: Scheduled NE Config Backup .........................................................................112
Table 49 Maintenance: Scheduled Device Configuration Restore .......................................................114
Table 50 Maintenance: Scheduled Device Configuration Restore: Add/Modify ...................................115
Table 51 Maintenance: Scheduled Device Configuration Restore: Add/Modify ...................................116
Table 52 Maintenance: Scheduled FW Upgrade ..................................................................................117
Table 53 Configuration Window ........................................................................................................... 126
Table 54 Copy Port Setup .................................................................................................................... 130
Table 55 SNMP Commands ................................................................................................................ 132
Table 56 System Configuration: SNMP Conf. ...................................................................................... 133
Table 57 System Configuration: Remote Management ....................................................................... 134
Table 58 System Configuration: Time Setup ....................................................................................... 135
Table 59 System Configuration: Syslog Setup .................................................................................... 136
Table 60 System Configuration: Syslog Setup: Add ............................................................................ 137
Table 61 System Configuration: RADIUS ............................................................................................ 138
Table 62 System Configuration: IP Setup ............................................................................................ 140
Table 63 System Configuration: IP Setup: Add ................................................................................... 141
Table 64 Switch Configuration: Switch Setup ...................................................................................... 144
Table 65 Switch Configuration: Priority Queue .................................................................................... 146
Table 66 Switch Configuration: Multiple STP Conf. .............................................................................147
Table 67 Aggregation ID Local Switch ................................................................................................. 149
Table 68 Aggregation ID Peer Switch .................................................................................................. 149
Table 69 Switch Configuration: Link Aggregation ................................................................................ 150
Table 70 Switch Configuration: GARP Timer ....................................................................................... 151
Table 71 Switch Configuration: Filtering .............................................................................................. 152
Table 72 Switch Configuration: Filtering: Add ...................................................................................... 153
Table 73 Switch Configuration: MAC Forwarding ................................................................................ 154
Table 74 Switch Configuration: MAC Forwarding: Add ........................................................................ 155
Table 75 Switch Configuration: Mirroring ............................................................................................. 156
Table 76 VLAN Configuration: 802.1Q ................................................................................................ 158
Table 77 VLAN Configuration: 802.1Q: Modify .................................................................................... 159
Table 78 VLAN Port Type Descriptions ............................................................................................... 160
Table 79 VLAN Configuration: Port Based .......................................................................................... 162
Table 80 Ethernet Port Configuration: Port Setup ............................................................................... 164
Table 81 Ethernet Port Configuration: Port VLAN ...............................................................................166
24
NetAtlas Workgroup User’s Guide
Page 25

List of Tables
Table 82 Ethernet Port Configuring: Port Link Aggregation ................................................................. 167
Table 83 Ethernet Port Configuration: Port STP .................................................................................. 167
Table 84 Ethernet Port Configuration: Port 802.1x .............................................................................. 169
Table 85 Ethernet Port Configuration: Port Mirroring ........................................................................... 170
Table 86 Ethernet Port Configuration: VLAN Stacking ........................................................................ 171
Table 87 Ethernet Port Configuration: Queue Method ......................................................................... 172
Table 88 Ethernet Port Configuration: Protocol VLAN ......................................................................... 173
Table 89 Ethernet Port Configuration: Protocol VLAN ......................................................................... 174
Table 90 Ethernet Port Configuration: Port Security ............................................................................ 175
Table 91 Ethernet Port Configuration: Bandwidth Ctrl. ........................................................................ 176
Table 92 Ethernet Port Configuration: Broadcast Storm Ctrl. .............................................................. 177
Table 93 Multicast Configuration: Multicast Settings ........................................................................... 180
Table 94 Multicast Configuration: Multicast Settings: Modify ............................................................... 182
Table 95 Multicast Configuration: Multicast Settings: Load Template .................................................. 183
Table 96 Multicast Configuration: Multicast Settings: View Profile ...................................................... 184
Table 97 Multicast Configuration: MVR ............................................................................................... 186
Table 98 Supported RMON Groups ..................................................................................................... 191
Table 99 RMON Configuration: History Config. ................................................................................... 192
Table 100 RMON Configuration: History Config.: New ........................................................................ 193
Table 101 RMON Configuration: Event Config. ...................................................................................194
Table 102 RMON Configuration: Event Config.: New .......................................................................... 195
Table 103 RMON Configuration: Alarm Config. ...................................................................................196
Table 104 RMON Configuration, Alarm Config., New .......................................................................... 197
Table 105 RMON Configuration: Alarm Config.: Show Log ................................................................. 198
Table 106 Routing Configuration: Static Route .................................................................................... 200
Table 107 Routing Configuration: Static Route: Add or Modify ............................................................ 200
Table 108 DiffServ: DSCP Setting ....................................................................................................... 202
Table 109 Default DSCP-IEEE802.1p Mapping .................................................................................. 202
Table 110 DiffServ: DSCP Setting ....................................................................................................... 203
Table 111 IP Configuration: IGMP ........................................................................................................ 204
Table 112 IP Configuration: DHCP: Server .......................................................................................... 205
Table 113 IP Configuration: DHCP: Server: New ................................................................................ 206
Table 114 IP Configuration: DHCP: Relay ........................................................................................... 208
Table 115 IP Configuration: DVMRP ................................................................................................... 209
Table 116 IP Configuration: RIP .......................................................................................................... 210
Table 117 OSPF vs. RIP .......................................................................................................................211
Table 118 IP Configuration: OSPF ....................................................................................................... 212
Table 119 IP Configuration: OSPF: New OSPF Setting ...................................................................... 214
Table 120 IP Configuration: OSPF: New Virtual Link .......................................................................... 215
Table 121 IP Configuration: OSPF: New Interface .............................................................................. 216
Table 122 IP Configuration: VRRP ...................................................................................................... 218
Table 123 IP Configuration: VRRP: New ............................................................................................. 219
Table 124 IP Configuration: IP Multicast .............................................................................................. 220
NetAtlas Workgroup User’s Guide
25
Page 26

List of Tables
Table 125 General Installation Problems ............................................................................................. 221
Table 126 Problems Accessing the EMS ............................................................................................. 221
Table 127 Problems Accessing the EMS ............................................................................................. 222
Table 128 SNMPc Main Window ......................................................................................................... 228
Table 129 Selection Tool ...................................................................................................................... 229
Table 130 Alarm Types and Causes .................................................................................................... 231
26
NetAtlas Workgroup User’s Guide
Page 27

PART I
Introduction
• Introduction (29)
• Main EMS Screen (33)
27
Page 28

28
Page 29
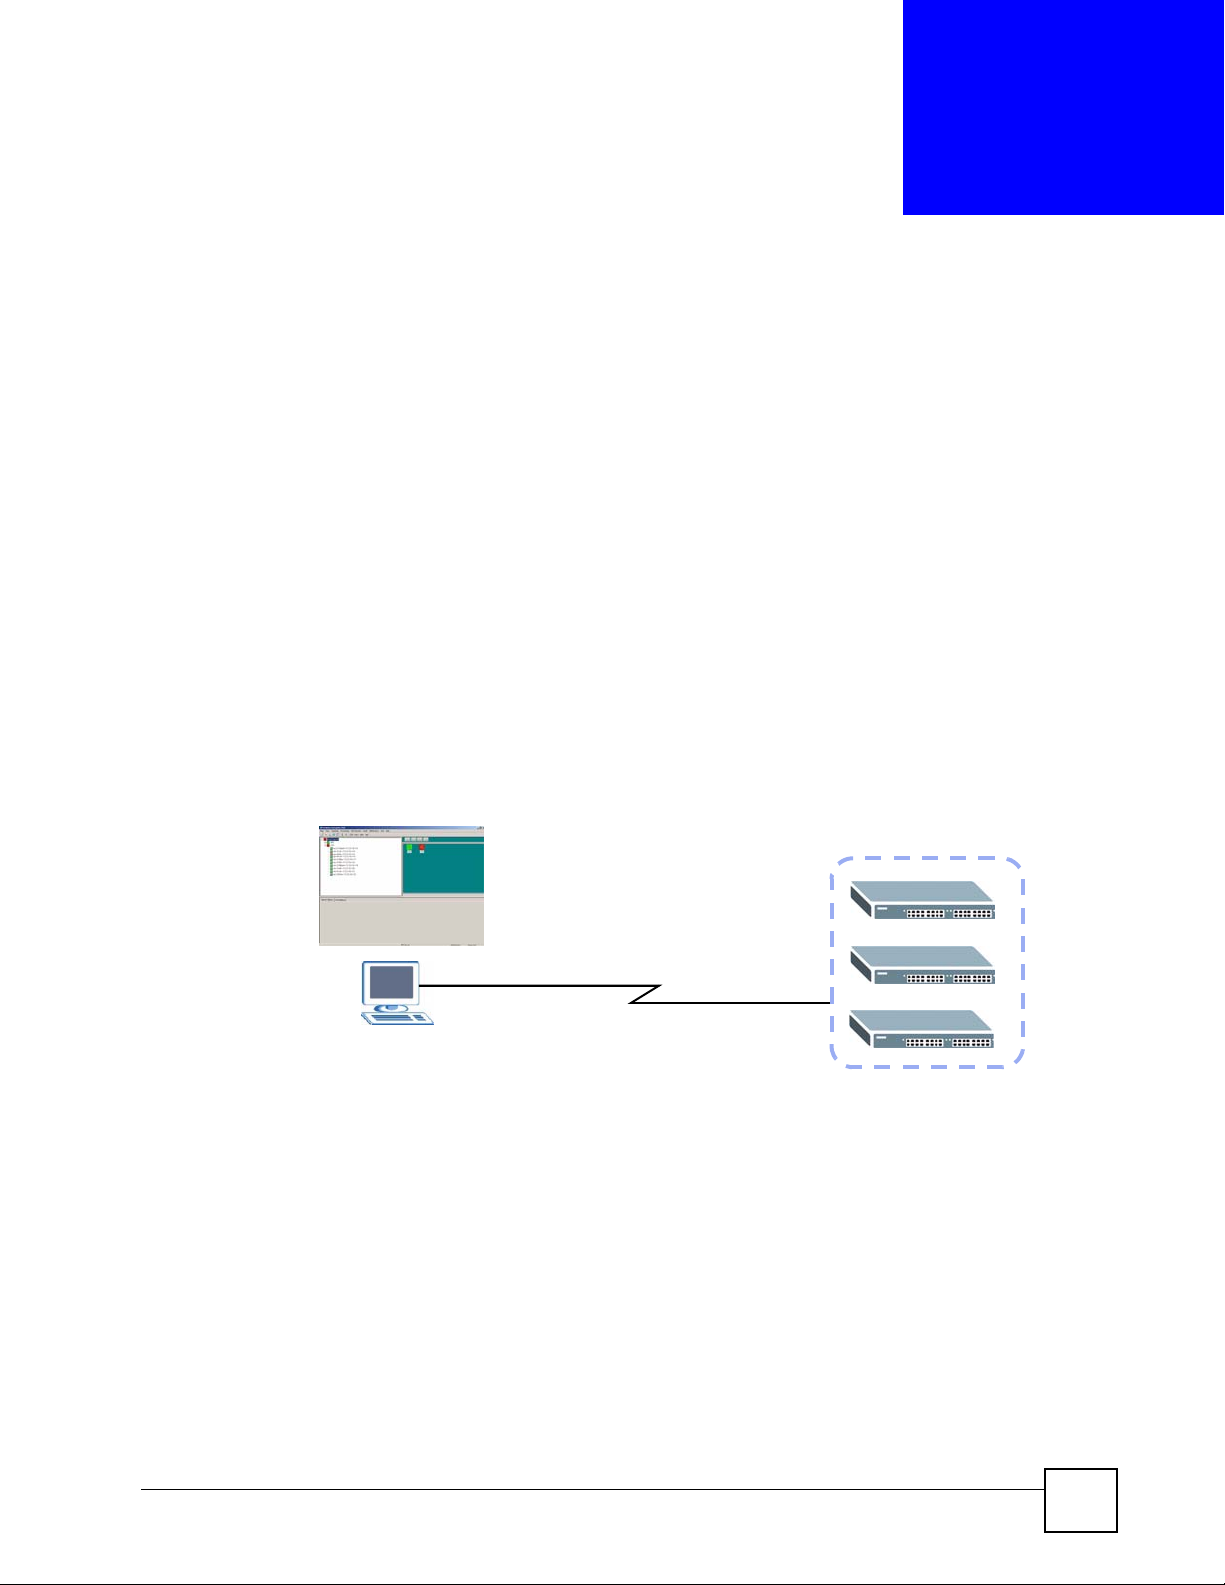
CHAPTER 1
Introduction
This chapter introduces and shows you how to access the EMS (Element Management
System).
1.1 Overview
The Element Management System (EMS) retrieves management information from switches
using SNMP protocol.
An EMS is composed of Network Elements (NE) that represent resources in a Network
Management System (NMS). The network elements can represent a physical piece of
equipment on the network, the components of a device on the network, or parts of the network
itself.
The following figure shows a network example.
Figure 1 EMS Network Example
1.1.1 EMS Components
The EMS consists of two components: the EMS server and the EMS remote client. You must
install the EMS server, which provides all the functions to use the EMS. You can install the
EMS remote client on other computers if you want to use EMS on them as well.
You can send SNMP messages to managed devices from an EMS remote client (RC) or
through the EMS server (S). The following figure shows a network example.
NetAtlas Workgroup User’s Guide
29
Page 30
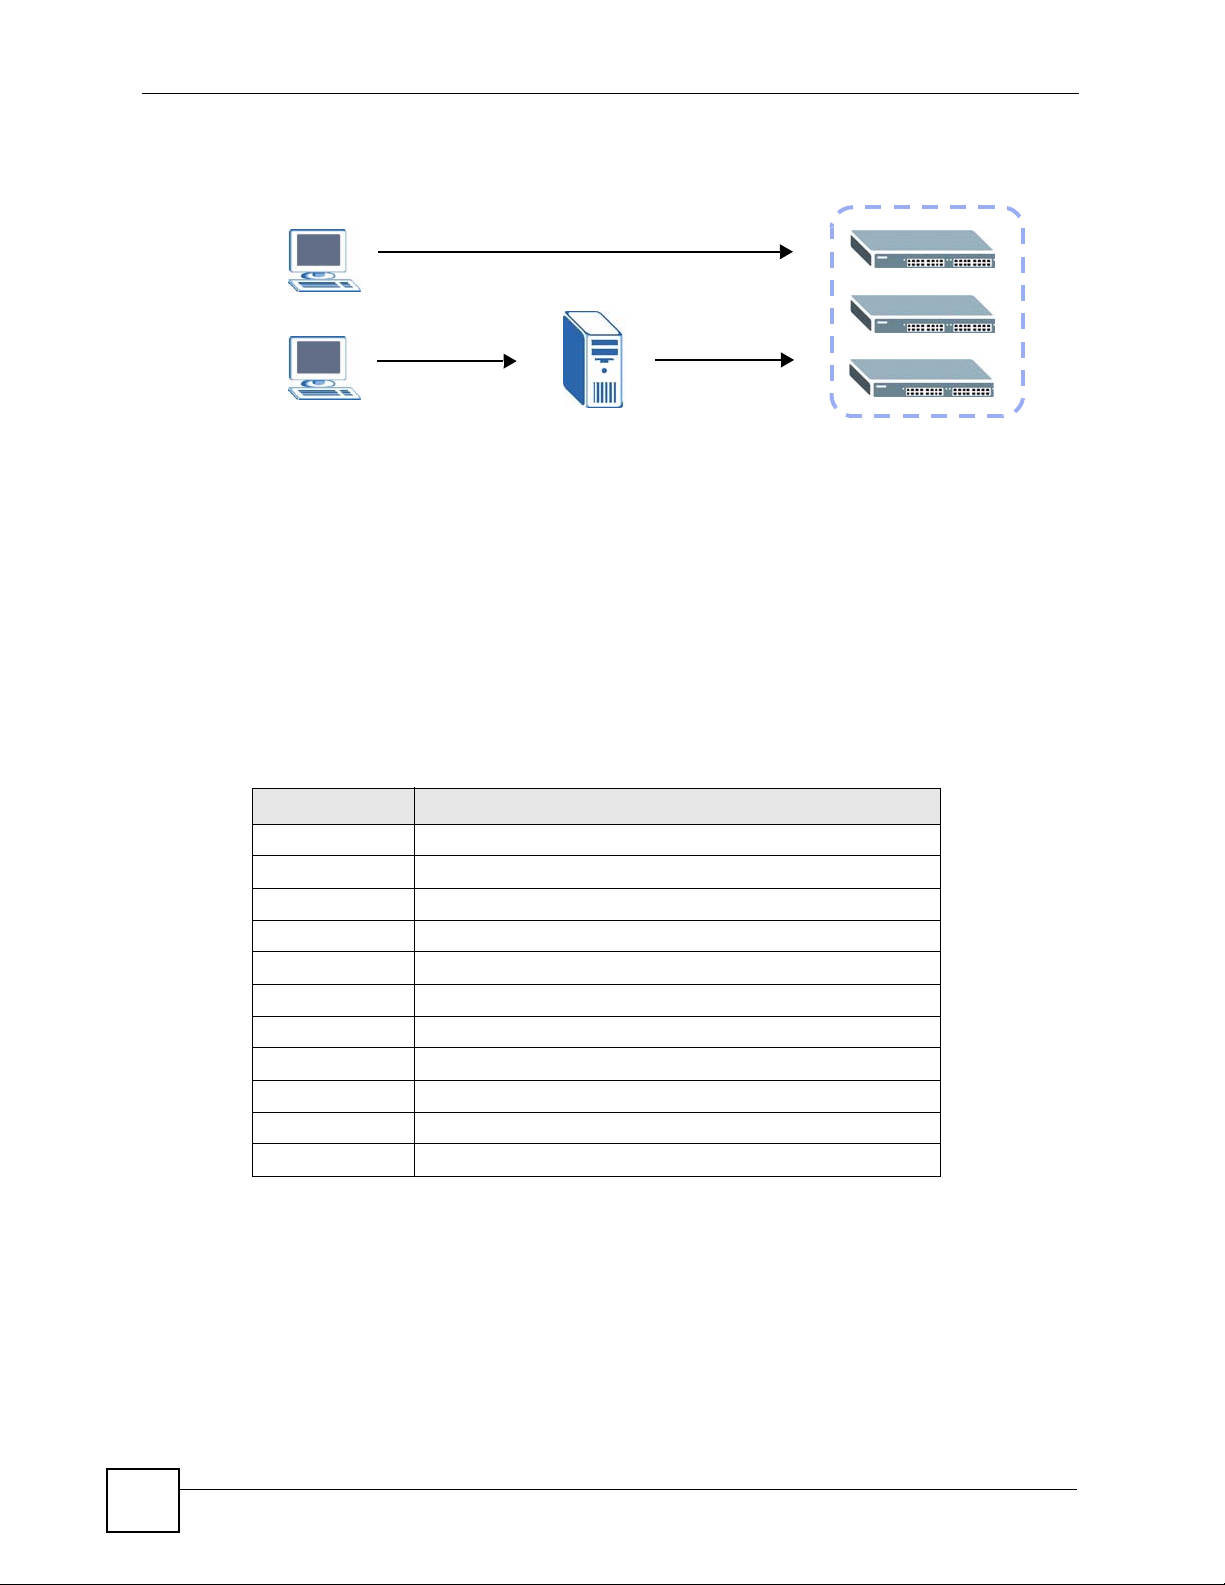
Chapter 1 Introduction
Figure 2 EMS Server and Remote Clients
RC S
1.1.2 SNMPc Network Manager
SNMPc is network management software produced by Castle Rock.
You must have SNMPc properly installed before you can use the EMS. Refer to the appendix
in this User’s Guide; go to the Castle Rock web site at www.castlerock.com or see your
SNMPc user's guide.
1.1.3 Device Firmware Versions Supported
The EMS supports the devices and device firmware versions as listed in the following tale.
Table 1 Device Firmware Versions Supported
MODEL FIRMWARE VERSION
ES-2108 360ABK2C0/370ABK0C0 or later versions
ES-2108G 360ABL2C0/370ABL0C0 or later versions
ES-2108PWR 360ABS2C0/370ABS1C0 or later versions
ES-2024A 360TX1C0/370TX0C0 or later versions
GS-2024 360LT1C0 or later versions
ES-3124 360TP3C0/370TP1C0 or later versions
ES-3124PWR 360TY4C0/370TY0C0 or later versions
ES-3148 360TZ1C0/370TZ0C0 or later versions
GS-4012 360TS3C0/370TS0C0 or later versions
GS-4024 360LL3C0/370LL0C0 or later versions
ES-4124 360AIC0C0/370AIC0C0 or later versions
1.2 System Requirements and EMS Installation
30
Refer to the quick start guide for a list of system requirements and the installation procedure
for EMS.
NetAtlas Workgroup User’s Guide
Page 31

1.3 Accessing EMS
Follow the steps below to access EMS.
1 In the SNMPc main screen, double-click the switch icon.
Figure 3 SNMPc: Switch Device List Icon
2 Click the Switch Manager icon to display the main EMS screen.
Figure 4 NetAtlas Main Screen
Chapter 1 Introduction
NetAtlas Workgroup User’s Guide
31
Page 32

Chapter 1 Introduction
Figure 5 EMS: Main Screen
32
NetAtlas Workgroup User’s Guide
Page 33

CHAPTER 2
Main EMS Screen
This chapter describes the main screens you use to view access logs and maintain databases.
2.1 Main Screen Overview
In SNMPc, double-click on a device icon to display the main screen as shown.
Figure 6 Main Screen
The following table describes the options in the switch manager screen.
Table 2 Main Screen Menu Overview
LABEL SUB-MENU DESCRIPTION
Window Exit Click Exit to close the switch
Admin Access Log Use this screen to display
Database Management Backup and Restore (EMS &
NetAtlas Workgroup User’s Guide
SNMPc DB)
Log Storage Configuration
(EMS DB)
Scheduled Backup
Configuration (EMS & SNMPc
DB)
manager screen.
logs.
Use this screen to backup or
restore a switch’s
configuration to the EMS and
SNMPc database.
Use this screen to enable
logging and specify how
many logs to store in the
EMS database.
Use this screen to specify
when to store logs in the
EMS and SNMPc database.
33
Page 34

Chapter 2 Main EMS Screen
Table 2 Main Screen Menu Overview (continued)
LABEL SUB-MENU DESCRIPTION
SNMP Operation Mode Use this screen to specify
Help On-line Help Click On-line Help to display
2.2 Access Log
To view access logs, click Admin > Access Log.
Figure 7 Admin: Access Log
whether SNM P messages
can be sent directly from an
EMS remote client computer
or through the EMS server.
an EMS help file.
34
The following table describes the fields in this screen.
Table 3 Admin: Access Log
LABEL DESCRIPTION
Log Filter
Port Select a port or All Ports for which you want to view switch login data via the EMS.
Log Type Select the type of logs which you want to view for the selected switch and port(s).
Login User Select All Users to view logs for all access attempts to a switch via the EMS. Select
Administrator to view only the EMS administrator access attempts.
Sorted by Select By Device Name to sort the logs displayed in alphabetical order according to the
names of the switch(es). Select Log Time to sort the logs displayed according to the
times received on the switch(es).
NetAtlas Workgroup User’s Guide
Page 35

Chapter 2 Main EMS Screen
Table 3 Admin: Access Log (continued)
LABEL DESCRIPTION
Date Select a start date and end date from the list boxes to display logs for that period.
Apply Click Apply to display logs with the criteria set above.
Index This field displays the log number.
Target This field displays a reason for the generated log.
Device
Name
Log Type This field displays the type of log the switch generated.
Log Time This field displays the time a log was generated by a switch.
Login User This field displays the EMS user that logged into the switch
Slot This field is currently not supported.
Port This field displays the selected switch port number on which the log was generated.
Description This field displays further information about the log.
Delete Click Delete to delete a selected log from the list of log entries.
Close Click Close to close this screen.
This field displays name of the switch that generated the log(s).
2.3 Database Management
The following information is stored in the EMS database.
• Event and access logs
• EMS configuration
• Device configuration and status information
Use the Database Management screens to back up logs and EMS and SNMPc configurations
and restore selected backed up files.
2.3.1 Database Synchronization
The EMS is able to synchronize the device tree and device status information with SNMPc.
This means that when you add a device in EMS, the same change also applies in SNMPc and
the new device icon is created in both the EMS and SNMPc screens. In addition, device status
changes are reflected in both the EMS and the SNMPc screens.
EMS database is synchronized:
• when you launch the Switch Manager screen.
• when you click Map > Sync Map DB in EMS.
• automatically everyday at mid-night (this schedule is not configurable).
2.3.2 Filename Convention
The EMS follows a pre-defined naming convention for backup files. Data is backed up in plain
text format with a “txt” filename extension. The general structure of the filename is
<type>.txt (for example, AccessLog.txt).
NetAtlas Workgroup User’s Guide
35
Page 36

Chapter 2 Main EMS Screen
2.3.3 Database Backup and Restore
Use the Database Backup/Restore screen to back up current EMS and SNMPc databases or
restore the database information. Backup data is stored as a series of files in the specified
directory on your computer.
Click Admin > Database Management > Backup/Restore (EMS & SNMPc DB) to display
the configuration screen.
Figure 8 Admin: Database Management: Backup/Restore
The following table describes the fields in this screen.
Table 4 Admin: Database Management: Backup/Restore
LABEL DESCRIPTION
Backup Select Backup to transfer the database file from the EMS to the computer.
Restore Select Restore to transfer the backed up files from your computer to the EMS.
SNMPc Backup
Name
Directory This field displays the default directory to back up or restore database files. Specify
Existing
Backups
Delete Click Delete to remove the selected backup file.
Apply Click Apply to backup or restore the database files.
Close Click Close to close the screen.
Specify a backup file name for the SNMPc database to store on your computer.
Enter a descriptive name for identification purposes.
the location you wish the EMS to restore from or back up to on your computer or
click Browse to locate it.
This field is applicable when you select the Restore option.
This field displays the list of backup files available for restore.
2.3.4 Database Log Storage Configuration
Use the Database Log Storage Configuration screen to maintain logs on the EMS.
Click Admin > Database Management > Log Storage Configuration (EMS DB) to display
the following screen.
36
NetAtlas Workgroup User’s Guide
Page 37

Chapter 2 Main EMS Screen
Figure 9 Admin: Database Management: Log Storage
The following table describes the fields in this screen.
Table 5 Admin: Database Management: Log Storage
LABEL DESCRIPTION
Storage
Configuration
Cleared Records
Backup
Backup the cleared
records
Backup Directory Type the path and file name of the record file you wish to back up to your
User info for
Windows
Account Enter the account user name to log into your Windows computer.
Password Enter a password in this field for the administrator Account above.
Apply Click Apply to save changes to the EMS.
Close Click Close to close the screen.
Configure the following fields to retain daily records.
Select the first radio button and a number (in thousands) from the drop-down
list box to retain that number of records. All records prior to these records are
cleared every 24 hours.
Or
Select the second radio button and a number (from 7 to 365) in the field
provided. All records up to the start of the period selected are cleared every 24
hours.
If you do not configure this section, all records (excluding the latest reserved
records) will be cleared after 24 hours and therefore cannot be retrieved later.
Select the check box and type the path and file name or click Browse to locate
the folder you wish to save all records after 24 hours. The records are cleared
but saved in the backup file.
computer in the Backup Directory text box or click Browse to locate it.
2.3.5 Database Scheduled Backup Configuration
Use this screen to schedule regular backups for database files. The EMS creates a scheduled
task on your Windows computer for this action. To look at scheduled tasks in Windows 2000,
click Start > Settings >
of Windows.
NetAtlas Workgroup User’s Guide
Control Panel > Scheduled Tasks. The steps are similar for other versions
37
Page 38

Chapter 2 Main EMS Screen
Click Admin > Database Management > Backup and Restore (EMS & SNMPc DB) to
display the following screen.
Figure 10 Admin: Database Management: Scheduled Backup
The following table describes the fields in this screen.
Table 6 Admin: Database Management: Scheduled Backup
LABEL DESCRIPTION
Backup Schedule
Frequency Scheduled backups can be performed Daily, Weekly or Monthly. Select a
Starting date Specify the starting date to begin database backup for the selected device(s).
Starting time Specify the starting time to begin database backup for the selected device(s).
Backup Directory Type the path to which you wish to back up the database files on your
User info for Windows
Account Specify a Windows administrator login account user name.
Password Enter a password in this field for the administrator Account above.
Apply Click Apply to save changes to the EMS.
Close Click Close to close the screen.
radio button to schedule database backups starting from the date and time
specified below. The default setting is No Backup.
Select a date from the drop-down list box.
Select a time from the selection box or enter a time (hh:mm:ss AM/PM
format).
computer in the Backup Directory text box or click Browse to locate it.
2.4 SNMP Operation Mode
When you install EMS remote client on a computer, you can use the SNMP Operation Mode
screen to specify whether you want to allow the EMS remote client computer to send SNMP
messages directly to managed ZyXEL devices or through the EMS server.
Click Admin > SNMP Operation Mode to display the screen as shown.
38
NetAtlas Workgroup User’s Guide
Page 39

Chapter 2 Main EMS Screen
Figure 11 Admin: SNMP Operation Mode
The following table describes the fields in this screen.
Table 7 Admin: SNMP Operation
LABEL DESCRIPTION
Client Sends SNMP
Operation via Server
Client Sends SNMP
Operation itself
OK Click OK to save changes to the EMS.
Cancel Click Cancel to discard the change and close the screen.
Select this option to set the EMS remote client computer(s) to send SNMP
messages to managed ZyXEL devices through the EMS server.
Select this option if the remote client computer(s) is not in the same subnet as
the managed devices.
Select this option to allow the EMS remote client computer(s) to send SNMP
messages directly to managed ZyXEL devices.
Select this option if the remote client computer(s) is in the same subnet as the
managed devices.
2.5 Accessing the Switch Manager Screen
To display the EMS main screen, click on the device icon in the main screen.
The EMS polls for all the available switches. Select a device icon to display a graphic of the
switch in the Device Panel. You can only display one switch in the Device Panel at one time.
NetAtlas Workgroup User’s Guide
39
Page 40

Chapter 2 Main EMS Screen
Figure 12 Switch Manager: Main Screen
40
NetAtlas Workgroup User’s Guide
Page 41

PART II
Switch Manager
• Switch Manager (43)
• Map (53)
• View (5 7)
• Template (77)
• Provisioning (85)
• Performance (89)
• Fault (101)
• Maintenance (107)
• Tools (119)
41
Page 42

42
Page 43

CHAPTER 3
Switch Manager
This chapter describes the Switch Manager screens and shows you some basic features.
3.1 Switch Manager Overview
To display the Switch Manager screen, double-click the Switch Manager icon in the main
NetAtlas Enterprise EMS screen.
The EMS main screen varies depending on the selected switch model.
Figure 13 EMS Main Screen Overview
1
3
2
5
The following table describes the elements in the EMS screen.
NetAtlas Workgroup User’s Guide
4
43
Page 44

Chapter 3 Switch Manager
Table 8 EMS Main Screen Overview
ELEMENT FUNCTION
1 Menu Shortcut Bar Use these buttons to execute common commands quickly. Hold the
2 Device List Panel View devices in a tree structure. The colors of the device icons indicate
3 Alarm Severity Icons These icons indicate the presence of any alarm/event logs. Click on an
4 Device Panel This is a graphical device display. Double-click on a switch to display
5 System Message Panel View the alarm status
A. Not available on all models at the time of writing.
cursor over an icon to see a tool tip.
The CRI, MAJ, MIN and INF buttons are colored if a related event log
has not been acknowledged yet. The event status is updated every 30
seconds.
the status of the devices. Refer to the document that comes with
SNMPc for more information.
Click on a device to retrieve updated information from the device.
Double-click on a device to update device information to the EMS
database.
active icon to view the Event Log screen.
the EMS GUI management window for the switch.
A
and port status of the selected switch.
3.2 Device List and Icon Colors
In the Device List and Device panels, the colors of the device indicate the status of the
represented devices stored in the database. The colors and the event status correspond to the
settings in SNMPc. To update the device status, double-click on a device icon.
Figure 14 Device List and Icon Colors: Example
44
NetAtlas Workgroup User’s Guide
Page 45
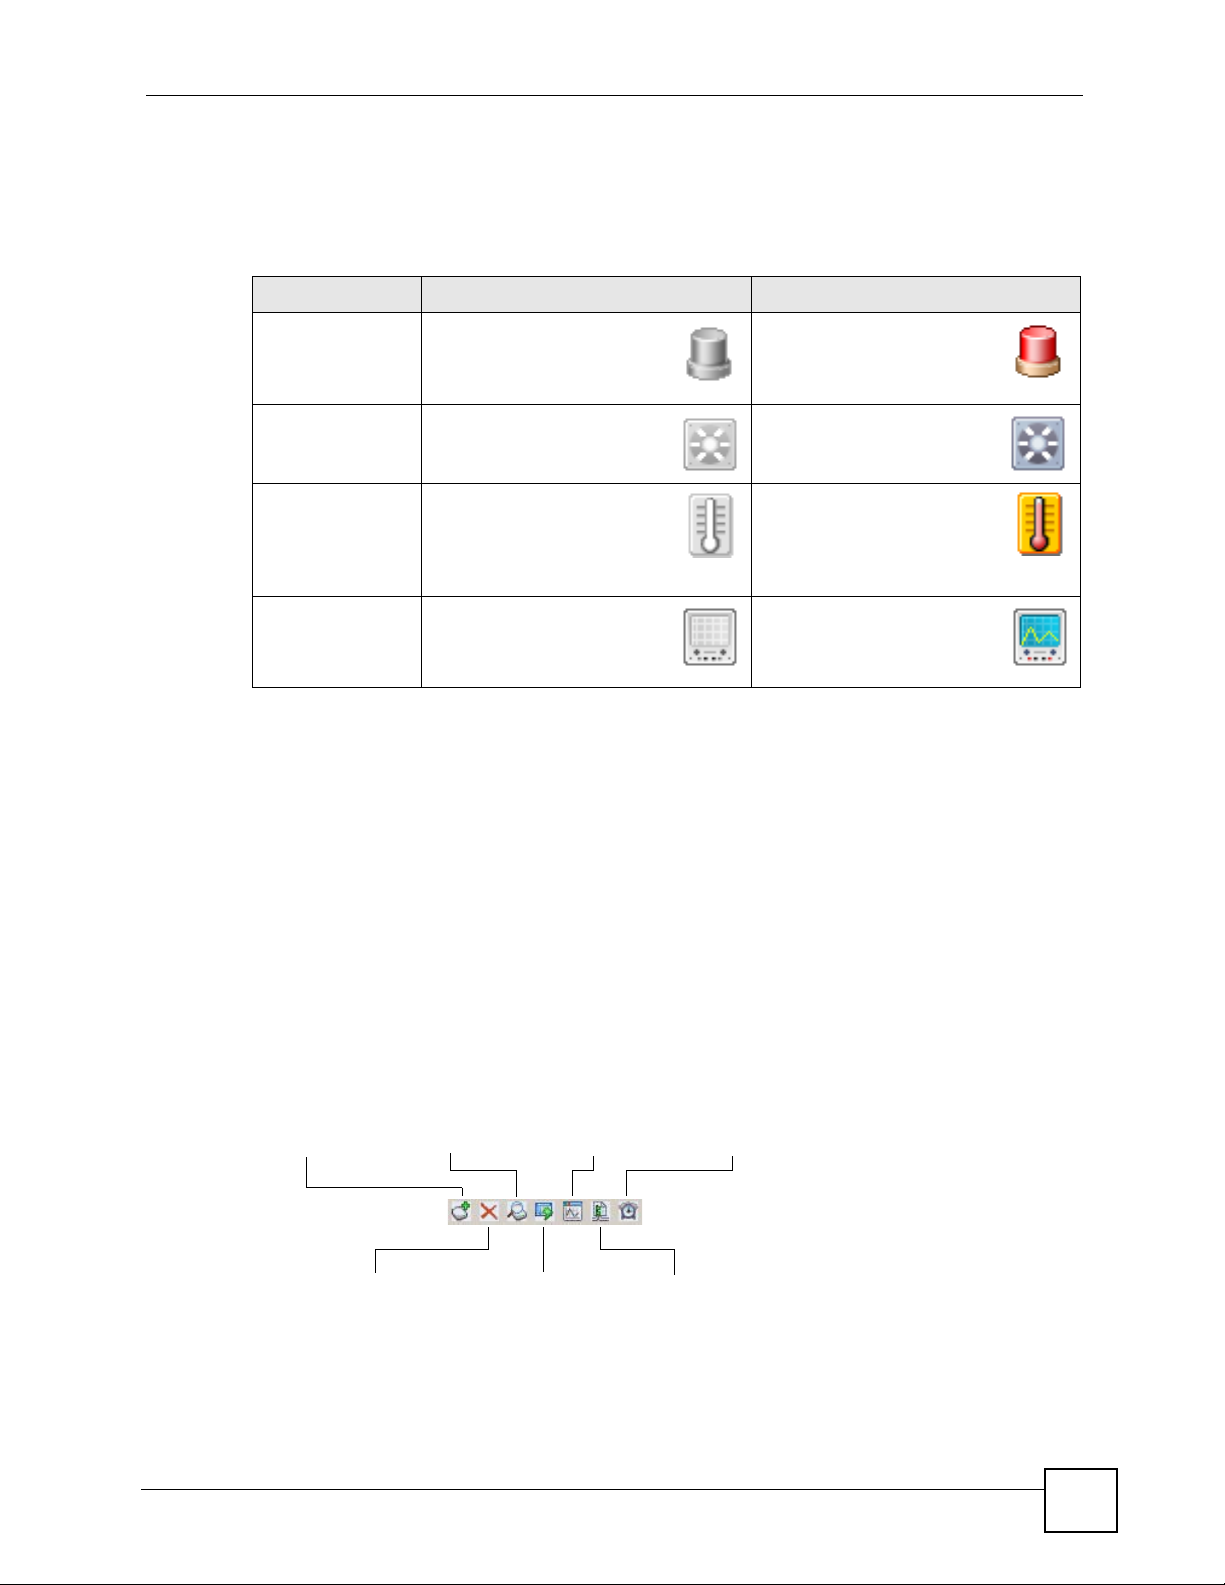
3.3 System Message Panel Alarm Status
The colors of the alarm icons (in the System Message Panel) indicate the real-time status of
the current selected device. The following table describes the alarm states used.
Table 9 System Message Panel Alarm Status
PANEL ALARMS ALARM OFF ALARM ON
ALARM When this icon is grayed out,
the device fan, temperature
or voltage alarm is off.
FAN When this icon is grayed out,
the device fans are
functioning properly.
Chapter 3 Switch Manager
The fan, temperature and
voltage alarms are all on. A
serious hardware problem
exists.
One or more of the device
fans has a problem.
TEMP When this icon is grayed out,
temperatures at all sensor
points in the switch are within
the threshold temperature
range.
VOL When this icon is grayed out,
the power supply at all
sensor points in the switch is
within the tolerance range.
If an alarm turns on, click the Port Status tab in the System Message Panel or proceed to
Section 5.1 on page 57 for hardware troubleshooting.
3.4 System Message Panel Port Status
Proceed to Section 5.4 on page 62 for information on the details displayed in this screen.
3.5 Menu Shortcut Buttons
The following is a brief overview of the menu shortcut buttons.
Figure 15 EMS Main Screen Shortcut Bar
The temperature at a sensor
point in the switch has risen
above or below the threshold
temperature range.
The power supply at a sensor
point in the switch has fallen
out of the tolerance range.
Add Submap/
Device
Delete Submap/
Device
Find Object
NetAtlas Workgroup User’s Guide
Interface
Performance
Refresh Map Port Status
Event Log
45
Page 46

Chapter 3 Switch Manager
3.6 EMS Main Menu Summary
Map
Fault Maintenance
View
Template
Provisioning
Tool
Performance
Help
The following table summarizes the sub-links in the navigation panel.
" Screens, screen labels and fields vary depending on your switch model.
Table 10 EMS Navigation Panel Sub-link Descriptions
LABEL DESCRIPTION
MAP
Add Submap/Device Select this to add a device or a submap folder to the EMS Device List Panel.
Edit Node Select this to edit device or sub-map folder properties.
Search Node Select this to search for a device or a submap folder.
Delete Select this to delete a submap folder or devices within a folder.
Refresh Map Select this to update the device status in the EMS device map.
Sync MAP DB Select this to synchronize the submaps and switches in the EMS with the
folders and switches in SNMPc Network Manager.
Exit Select this to close the Switch Manager screen.
View
Hardware Status Select this to view the hardware status of a device.
STP Status Select this to view the Spanning Tree Protocol (STP) status of a device.
VLAN Status Select this to view the VLAN status of a device.
Port Status Select this to view the port status of a device.
46
NetAtlas Workgroup User’s Guide
Page 47

Chapter 3 Switch Manager
Table 10 EMS Navigation Panel Sub-link Descriptions (continued)
LABEL DESCRIPTION
802.1d Select this to view the MAC addresses (and types) of devices attached to
what ports and VLAN IDs or view the MAC addresses – IP address
resolution table.
Multicast Status Select this to view the multicast traffic status of a device.
Ethernet Status Select this view Ethernet port statistics.
IP Application
Status
Interface Status Select this to view IP routing interface status.
Firmware Version Select this to view the firmware versions of the managed devices.
Te mp l a te
VLAN Template Select this to configure a VLAN template for upload to multiple devices.
IGMP Filtering
Profile Template
Multicast Template Select this to configure a multicast template for upload to multiple devices.
Provisioning
IGMP Filtering
Provisioning
Performance
Interface Select this to configure interface performance graphs and tables.
RMON Select this to view RMON Ethernet and history statistics.
Fault
Event Log Select this to configure an alarm filter.
Loopback Test Select this to perform a loopback test.
Ping and Traceroute Select this to test connections using a ping or traceroute test.
Maintenance
Firmware Upgrade Select this to perform a device firmware upgrade.
Device Reset Select this to reboot a device.
NE Configuration
Backup and Restore
Load Factory
Default
Scheduled NE
Config Backup
Scheduled NE
Config Restore
Scheduled FW
Upgrade
To ol
Telnet This link takes you to a screen where you can access a device Telnet
Web Access This link takes you to a screen where you can access a device Web
Select this to view IP routing domain status.
Select this to configure an IGMP filter template for upload to multiple
devices.
Select this to apply IGMP filtering templates.
Select this to back up or restore device configuration.
Select this to reset a device back to the factory default settings.
Select this when you want to configure a schedule to back up a switch
configuration file.
Select this when you want to configure a schedule to restore a switch
configuration file.
Select this when you want to configure a schedule to perform firmware
upgrade on a switch.
service.
configurator.
NetAtlas Workgroup User’s Guide
47
Page 48

Chapter 3 Switch Manager
Table 10 EMS Navigation Panel Sub-link Descriptions (continued)
LABEL DESCRIPTION
Ping This link takes you to a screen where you can ping a device directly through
the EMS.
Help
About This link takes you to a screen where you can view the version number of
the EMS.
On-line Help This link opens the EMS user’s guide in PDF format.
3.7 Common EMS Command Buttons
The following table shows common command buttons found on most EMS screens.
Tabl e 11 Common EMS Command Buttons
LABEL DESCRIPTION
Apply Click Apply to save the changes back to the switch.
OK Click OK to save your changes and close the screen.
Cancel Click Cancel to discard all changes and close the screen.
Close Click Close to close the screen.
3.8 View the Switch
To display the selected switch, double-click the appropriate switch graphic in the Device List
Panel or on the switch icon in the Device Panel. You can only display one switch in the device
Panel window at a time. Refer to the appropriate chapters or sections for the descriptions of
each menu screen.
The following figure shows an example.
Figure 16 Switch View
3.9 Switch Information
Follow the steps to display information on a switch.
1 Right-click on the switch icon in the Device List Panel.
2 Click Configuration > System > System Info. The switch information window displays
as shown next.
3 Choose a switch from the list located on the left-hand side of the screen.
48
NetAtlas Workgroup User’s Guide
Page 49

Figure 17 Configuration: System Configuration: System Info.
Chapter 3 Switch Manager
The following table describes the labels in this screen.
Table 12 Configuration: Switch Configuration: System Info.
LABEL DESCRIPTION
Device Name This field displays the descriptive name of a device.
Device IP This field displays the IP address of a device
Name Enter a descriptive name for identification purposes. If you want to change the
name, enter up to 32 printable characters; spaces are not allowed.
Contact Enter the name (up to 32 characters) of the person in charge of the selected
switch.
Location Enter the geographic location (up to 32 characters) of the selected switch.
Ethernet Address This field displays the switch Ethernet MAC address in six hexadecimal character
pair format.
OS FW Version This field displays the firmware version of the selected switch.
HW Version This field displays the hardware version of the selected switch.
Serial No. This field displays the unique device serial number.
Apply Click Apply to save the changes back to the switch.
Close Click Close to close the screen.
NetAtlas Workgroup User’s Guide
49
Page 50

Chapter 3 Switch Manager
3.10 Configuration Save
You must save the current configuration in the EMS to the selected switch(es) to make the
changes take effect.
" If an administrator is currently logged into the device via the console port or the
CLI (Command Line Interface), you cannot save the device settings from the
EMS. Do NOT turn off the switch during the updating process, as it may corrupt the
firmware and make your switch unusable.
1 To save the current switch configuration, select and right-click on the switch icon in the
Device List Panel.
2 Click Configuration Save.
3 Choose a switch from the list in the screen. You can select more than one switch by
pressing [CTRL] and click at the same time. Note that switches that are online are
displayed in green. Off line switches are displayed in red.
Figure 18 Configuration Save
4 Click Apply to save the current configuration. All settings configured on the EMS will
be saved to the selected switch(es).
5 A screen displays showing the configuration save result. Click Done to close the screen.
50
NetAtlas Workgroup User’s Guide
Page 51

Figure 19 Configuration Save: Result
Chapter 3 Switch Manager
NetAtlas Workgroup User’s Guide
51
Page 52

Chapter 3 Switch Manager
52
NetAtlas Workgroup User’s Guide
Page 53

CHAPTER 4
Map
This chapter describes the Map screens you use to add, edit or delete device mappings in the
EMS.
4.1 Root Subnet and Device Mapping
The EMS mapping displays logical hierarchy for the ZyXEL switch(es) in the EMS. When
started, the EMS automatically synchronizes device map information with SNMPc and creates
the Root Subnet and the icons for your ZyXEL switch(es) in the Device List Panel.
You can add device or submaps in EMS or SNMPc.
The following figure shows the “Root Subnet” folder. The managed devices are mapped to the
“Root Subnet” folder.
Figure 20 Submaps and Device Mapping
" You cannot create, edit or delete the Root Subnet.
NetAtlas Workgroup User’s Guide
53
Page 54

Chapter 4 Map
4.1.1 Adding a Submap or Device
To add a new submap or a new device, select the Root Subnet or a submap icon in the Device
List Panel.
Click Map > Add Submap/Device to display the following screen.
Figure 21 Map: Add Submap/Device
The following table describes the labels in this screen.
Table 13 Map: Add Submap/Device
LABEL DESCRIPTION
Properties These options are not applicable when you edit the properties of an existing
submap or device.
Select the Submap or Device radio button to add a new submap or device icon to
the Device List Panel.
If you select Submap, only the Name and Description fields display are
applicable; all other fields appear as read-only.
Name Enter a descriptive name (up to 30 characters) for identification purposes.
IP Address This field is not applicable when you select Submap.
Enter the IP address of the device.
Login Name Enter the administrator account user name to log into the switch.
Password Enter the administrative password (up to 30 characters) you use to log in to the
Description Enter a description (up to 30 characters) about the device.
Get Community Enter the get community, which is the password for the incoming Get- and GetNext-
Set Community Enter the set community, which is the password for incoming Set- requests from the
Trap Community Enter the trap community, which is the password sent with each trap to the SNMP
switch. This password is used by the EMS administrator for device firmware
upload.
requests from the management station.
management station.
manager.
54
NetAtlas Workgroup User’s Guide
Page 55

Table 13 Map: Add Submap/Device (continued)
LABEL DESCRIPTION
OK Click OK to save the changes and close the screen.
Cancel Click Cancel to discard the changes and close the screen.
4.1.2 Editing a Node
Select a device or submap icon in the Device List Panel and then click Map > Edit Node.
Figure 22 Map: Edit Node
Chapter 4 Map
Refer to Table 13 on page 54 for the field descriptions.
4.1.3 Finding an Object
To find or locate a device (or node), click Map > Find Object.
Figure 23 Map: Find Object
Enter a descriptive text (for example, the node name) in the Find What field and click OK to
start the search.
4.1.4 Deleting a Submap
To delete a submap, select the submap icon in the Device List Panel and click Map > Delete.
NetAtlas Workgroup User’s Guide
55
Page 56

Chapter 4 Map
Figure 24 Map: Delete Warning
" If you delete a submap, all devices under a submap will be removed.
4.1.5 Deleting a Device
To remove a device from the Device List Panel, select the device icon and click Map > Delete.
4.1.6 Updating Device Map
Click Map > Refresh Map to update information in the device panel from the EMS database.
4.1.7 Synchronizing Device Map Database
Click Map > Synch MAP DB to synchronize the device map information in EMS with the
device map information in SNMPc database.
4.2 Exit
Click Map > Exit to close the Switch Manager screen.
56
NetAtlas Workgroup User’s Guide
Page 57

CHAPTER 5
View
This chapter describes the various View screens.
5.1 Hardware Status
View fan speeds, voltage levels and temperatures of a selected switch in the Hardware
Monitor screen.
Click View > Hardware Status and select a switch from the device list located on the left-
hand side of the screen. The device hardware status displays.
" It may take a few seconds to update the screen.
Figure 25 View: Hardware Status
The following table describes the labels in this screen.
NetAtlas Workgroup User’s Guide
57
Page 58

Chapter 5 View
Table 14 Status: Hardware Status
LABEL DESCRIPTION
Device Name This field displays the descriptive name of a device.
Device IP This field displays the IP address of a device
Fan RPM
(RPM)
Voltage (V) The power supply for each voltage has a sensor that is capable of detecting and
Temperature The switch has temperature sensors that are capable of detecting and reporting if
Polling The text box displays how often (in seconds) this screen refreshes. You may change
Close Click Close to close the screen.
A properly functioning fan is an essential component (along with a sufficiently
ventilated, cool operating environment) in order for the device to stay within the
temperature threshold. Each fan has a sensor that is capable of detecting and
reporting if the fan speed falls below the threshold shown.
Index This field displays the fan number.
Current This field displays this fan’s current speed in Revolutions Per Minute (RPM).
Max This field displays this fan’s maximum speed recorded in Revolutions Per Minute
(RPM).
Min This field displays this fan’s minimum speed recorded in Revolutions Per Minute
(RPM).
Threshold This field displays the minimum speed at which a normal fan should work.
Status NORMAL indicates that this fan is functioning above the minimum speed. ERROR
indicates that this fan is functioning below the minimum speed.
reporting if the voltage falls out of the tolerance range.
Index This field displays the first voltage sensor number.
Current This is the current voltage reading in volts.
Max This field displays the maximum voltage recorded at this sensor in volts.
Min This field displays the minimum voltage recorded at this sensor in volts.
Threshold This field displays the minimum voltage percentage at which the switch should work.
Status NORMAL indicates that the voltage is within an acceptable operating range at this
point; otherwise ERROR is displayed. ABSENT indicates that there is no power
reading at a sensor(s).
the temperature rises above the threshold. You may choose the temperature unit (in
degrees Celsius or Fahrenheit).
Celsius Select this option to display the temperature in degrees Centigrade.
Fahrenheit Select this option to display the temperature in degrees Fahrenheit.
Index This field displays the temperature sensor number.
Current This shows the current temperature at this sensor.
Max This field displays the maximum temperature recorded at this sensor.
Min This field displays the minimum temperature recorded at this sensor.
Threshold This field displays the upper temperature limit at this sensor.
Status This field displays NORMAL for temperatures below the threshold and ERROR for
those above.
the refresh interval by typing a new number in the text box and then clicking the
Apply button.
58
NetAtlas Workgroup User’s Guide
Page 59

5.2 STP/RSTP
(R)STP detects and breaks network loops and provides backup links between switches,
bridges or routers. It allows a switch to interact with other (R)STP -compliant switches in your
network to ensure that only one path exists between any two stations on the network.
" In this user’s guide, “STP” refers to both STP and RSTP.
5.2.1 STP Terminology
The root bridge is the base of the spanning tree; it is the bridge with the lowest identifier value
(MAC address).
Path cost is the cost of transmitting a frame onto a LAN through that port. It is assigned
according to the speed of the link to which a port is attached. The slower the media, the higher
the cost - see the next table.
Table 15 STP Path Costs
LINK SPEED RECOMMENDED VALUE RECOMMENDED RANGE ALLOWED RANGE
4Mbps 250 100 to 1000 1 to 65535
10Mbps 100 50 to 600 1 to 65535
16Mbps 62 40 to 400 1 to 65535
100Mbps 19 10 to 60 1 to 65535
1Gbps 4 3 to 10 1 to 65535
10Gbps 2 1 to 5 1to 65535
Chapter 5 View
On each bridge, the root port is the port through which this bridge communicates with the root.
It is the port on this switch with the lowest path cost to the root (the root path cost). If there is
no root port, then this switch has been accepted as the root bridge of the spanning tree
network.
For each LAN segment, a designated bridge is selected. This bridge has the lowest cost to the
root among the bridges connected to the LAN.
5.2.2 STP Port States
STP assigns five port states (see next table) to eliminate packet looping. A bridge port is not
allowed to go directly from blocking state to forwarding state so as to eliminate transient
loops.
Table 16 STP Port States
PORT STATE DESCRIPTION
Disabled STP is disabled (default).
Blocking Only configuration and management BPDUs are received and processed.
Listening All BPDUs are received and processed.
NetAtlas Workgroup User’s Guide
59
Page 60

Chapter 5 View
Table 16 STP Port States
PORT STATE DESCRIPTION
Learning All BPDUs are received and processed. Information frames are submitted to the
Forwarding All BPDUs are received and processed. All information frames are received and
5.2.3 STP Status
View current STP information in the STP Status screen. Click Status > STP Status and select
a switch from the device list located on the left-hand side of the screen. The STP status
displays in the table on the right.
Figure 26 View: STP Status
learning process but not forwarded.
forwarded.
The following table describes the labels in this screen.
Table 17 View: STP Status
LABEL DESCRIPTION
Device Name This field displays the descriptive name of a device.
Device IP This field displays the IP address of a device
Tree Select the index number of the spanning tree whose status you want to display.
Bridge Root refers to the base of the spanning tree (the root bridge).
Bridge ID This is the unique identifier for this bridge, consisting of bridge priority plus MAC
address.
Hello Time
(second)
Max Age (second) This is the maximum time (in seconds) a switch can wait without receiving a
Forwarding Delay
(second)
Cost to Bridge This is the path cost from the root port on this switch to the root switch.
Port ID This is the priority and number of the port on the switch through which this switch
This is the time interval (in seconds) at which the root device transmits a
configuration message. The root bridge determines Hello Time, Max Age and
Forwarding Delay
configuration message before attempting to reconfigure.
This is the time (in seconds) the root switch will wait before changing states (that
is, listening to learning to forwarding).
must communicate with the root of the spanning tree.
60
NetAtlas Workgroup User’s Guide
Page 61

Chapter 5 View
Table 17 View: STP Status (continued)
LABEL DESCRIPTION
Topology
Changed Times
Time Since Last
Change
Polling The text box displays how often (in seconds) this screen refreshes. You may
Close Click Close to close the screen.
This is the number of times the spanning tree has been reconfigured.
This is the time since the spanning tree was last reconfigured.
change the refresh interval by typing a new number in the text box and then
clicking the Apply button.
5.3 VLAN Status
Follow the steps below to view the VLAN status of a switch.
" The VLAN Status screen only displays static IEEE 802.1q VLAN information.
1 Click View > VLAN Status.
2 Choose a switch from the list located on the left-hand side of the screen.
Figure 27 View: VLAN Status
NetAtlas Workgroup User’s Guide
61
Page 62

Chapter 5 View
The following table describes the labels in this screen.
Table 18 View: VLAN Status
LABEL DESCRIPTION
Device Name This field displays the descriptive name of a device.
Device IP This field displays the IP address of a device
VLAN ID This field displays the identification number of the VLAN.
Name This field displays a unique number for identification purposes.
Elapsed Time This field displays the time since the VLAN was created.
Status This field displays Static if the VLAN is active and will remain so after the next reset
Previous Page Click Previous Page to display the previous VLAN ID screen.
Next Page Click Next Page to display the next VLAN ID screen.
Current Page This field displays the current page number.
VLANs/Page This field displays the number of VLAN entries to display in one page.
Port List This table displays port VLAN settings. A tagged port is marked T, an untagged port is
Polling The text box displays how often (in seconds) this screen refreshes. You may change
Close Click Close to close the screen.
of the device. This field displays GVRP if the VLAN is active and will remain so until
removed by GVRP. This field is Other if the VLAN is active, but is not permanent or
created by GVRP.
Enter a number and click Show Page to display that page.
Enter a number (1-99) and click Show Page to display that number of VLAN entries
in a page.
marked U and a port not participating in a VLAN is marked -.
the refresh interval by typing a new number in the text box and then clicking the
Apply button.
5.4 Port Status
Follow the steps below to view the port status of a switch.
1 Click View > Port Status.
2 To view the port status of a switch choose a switch from the list located on the left-hand
side of the screen.
62
NetAtlas Workgroup User’s Guide
Page 63

Figure 28 View: Port Status
Chapter 5 View
The following table describes the labels in this screen.
Table 19 View: Port Status
LABEL DESCRIPTION
Device Name This field displays the descriptive name of a device.
Device IP This field displays the IP address of a device
Port This identifies the Ethernet port.
Link Speed This field displays the speed (either 10M for 10Mbps, 100M for 100Mbps or 1000M
for 1000Mbps).
State This field displays the STP state of the port. See the Spanning Tree Protocol
chapter for details on STP port states.
LACP This field displays whether LACP is activated.
PD This field displays the power device (PD) module status on the switch. If N/A is
displayed, the switch does not include a PD module.
This field displays On if the switch has a PD and it is in use.
This field displays Off if the switch has a PD, but it is not in use.
TxPkts This field shows the number of transmitted frames on this port.
RxPkts This field shows the number of received frames on this port.
Errors This field shows the number of received errors on this port.
Polling The text box displays how often (in seconds) this screen refreshes. You may
Close Click Close to close the screen.
change the refresh interval by typing a new number in the text box and then clicking
the Apply button.
NetAtlas Workgroup User’s Guide
63
Page 64

Chapter 5 View
5.5 802.1D
Use the 802.1D screens to view a table of MAC address entries or to view a table of IP address
mappings.
5.5.1 MAC Table
Follow the steps below to view the MAC table.
1 Click View > 802.1d.
2 To view the MAC table of a switch choose a switch from the list located on the left-hand
side of the screen.
3 Click the MAC Table tab.
Figure 29 View: 802.1d: MAC Table
64
The following table describes the labels in this screen.
Table 20 View: 802.1d: MAC Table
LABEL DESCRIPTION
Device Name This field displays the descriptive name of a device.
Device IP This field displays the IP address of a device
Sort by Click one of the following buttons to display and arrange the data according to that
button type. The information is then displayed in the summary table below.
MAC Click this button to display and arrange the data according to MAC address.
VID Click this button to display and arrange the data according to VLAN group.
Port Click this button to display and arrange the data according to port number.
Index This is the incoming frame index number.
MAC Address This is the MAC address of the device from which this incoming frame came.
VID This is the VLAN group to which this MAC address belongs.
NetAtlas Workgroup User’s Guide
Page 65

Chapter 5 View
Table 20 View: 802.1d: MAC Table (continued)
LABEL DESCRIPTION
Port This is the port from which the above MAC address was learned.
Type This shows whether the MAC address is dynamic (learned by the switch) or static
MAC Amount This field displays the number of MAC address entries in the MAC table.
Previous Page Click Previous Page to display the previous screen.
Next Page Click Next Page to display the next screen.
Current Page This field displays the current page number.
MACs/Page This field displays the number of MAC address entries to display in one page.
Polling The text box displays how often (in seconds) this screen refreshes. You may
Close Click Close to close the screen.
(manually entered in the Static MAC Forwarding screen).
Enter a number and click Show Page to display that page.
Enter a number (1-99) and click Show Page to display that number of MAC
address entries in a page.
change the refresh interval by typing a new number in the text box and then
clicking the Apply button.
5.5.2 ARP Table
Address Resolution Protocol (ARP) is a protocol for mapping an Internet Protocol address (IP
address) to a physical machine address, also known as a Media Access Control or MAC
address, on the local area network.
Follow the steps below to view the ARP table.
1 Click View > 802.1d.
2 To view the ARP table of a switch choose a switch from the list located on the left-hand
side of the screen.
3 Click the ARP Table tab.
NetAtlas Workgroup User’s Guide
65
Page 66

Chapter 5 View
Figure 30 View: 802.1d: ARP Table
The following table describes the labels in this screen.
Table 21 View: 802.1d: ARP Table
LABEL DESCRIPTION
Device Name This field displays the descriptive name of a device.
Device IP This field displays the IP address of a device
Index This is the ARP table entry number.
IP Address This is the learned IP address of a device connected to a switch port with
corresponding MAC address below.
MAC Address This is the MAC address of the device with corresponding IP address above.
VID This is the VLAN group to which this ARP entry belongs.
Type This shows whether the MAC address is dynamic (learned by the switch) or static
Previous Page Click Previous Page to display the previous screen.
Next Page Click Next Page to display the next screen.
Current Page This field displays the current page number.
ARPs/Page This field displays the number of ARP entries to display in one page.
Polling The text box displays how often (in seconds) this screen refreshes. You may change
Close Click Close to close the screen.
(manually entered in the Static MAC Forwarding screen).
Enter a number and click Show Page to display that page.
Enter a number (1-99) and click Show Page to display that number of ARP entries in
a page.
the refresh interval by typing a new number in the text box and then clicking the Apply
button.
66
NetAtlas Workgroup User’s Guide
Page 67

5.6 Multicast Status
View the IGMP multicast group membership information in the Multicast Status screen.
Click View > Multicast Status to display the screen as shown. Select a switch model in the
device list to display the multicast group membership information.
Figure 31 View: Multicast Status
Chapter 5 View
The following table describes the labels in this screen.
Table 22 View: Multicast Status
LABEL DESCRIPTION
Device Name This field displays the descriptive name of a device.
Device IP This field displays the IP address of a device
Index This field displays the index number.
VID This field displays the multicast VLAN ID.
Port This field displays the port number(s) that belongs to the multicast group.
Multicast Group This field displays the multicast group address.
Polling The text box displays how often (in seconds) this screen refreshes. You may
Close Click Close to close the screen.
change the refresh interval by typing a new number in the text box and then
clicking the Apply button.
5.7 Ethernet Port Status
You can view Ethernet port statistics in the Ethernet Status screen.
Click View > Ethernet Status and select a device to display the information.
NetAtlas Workgroup User’s Guide
67
Page 68

Chapter 5 View
Figure 32 View: Ethernet Status
The following table describes the labels in this screen.
Table 23 View: Ethernet Status
LABEL DESCRIPTION
Device Name This field displays the descriptive name of a device.
Device IP This field displays the IP address of a device
Index This field displays the index number.
Alignment Errors This field displays the number of frames received with alignment errors.
FCS Errors This field displays the number of frames received with Frame Check Sequence
Single Collision
Frames
Multiple Collision
Frames
SQE Test Errors This field displays the number of frames with Signal Quality Error (SQC) errors.
Deferred
Transmissions
Late Collisions A late collision is counted when a device detects a collision after it has sent the
Excessive
Collisions
Mac Transmission
Errors
Carrier Sense
Errors
Frame Too Longs This field displays the number of frames dropped because they were bigger than
Mac Receive
Errors
(FCS) errors.
This field displays the number of frames with 1 collision detected.
This field displays the number of frames with 2 to 15 collisions detected.
This field displays the number of frames that were delayed due to deferred
transmission.
512th bit of its frame. This field displays the number of times such a collision is
detected.
This field displays the number of packets with in excess of 15 collisions detected.
This field displays the number of packets with internet MAC sublayer transmission
error.
This field displays the number of times a carrier sense error occurred.
the maximum frame size.
This field displays the number of frames received with MAC address errors.
68
NetAtlas Workgroup User’s Guide
Page 69

Table 23 View: Ethernet Status (continued)
LABEL DESCRIPTION
Ether Chip Set This field identifies the Ethernet chipset used for the interface.
Polling The text box displays how often (in seconds) this screen refreshes. You may
change the refresh interval by typing a new number in the text box and then
clicking the Apply button.
Close Click Close to close the screen.
5.8 IP Application Status
Use the IP Application Status screens to view the routing table, IP table, DHCP server,
VRRP and OSPF status on layer3 switches (the GS or ES 4000 series).
5.8.1 Routing Table Status
Follow the steps below to view the routing table of a selected device.
1 Click View > IP Application Status.
2 Select a switch from the list located on the left-hand side of the screen.
3 Click the Routing Table Status tab.
Chapter 5 View
Figure 33 View: IP Application Status: Routing Table Status
NetAtlas Workgroup User’s Guide
69
Page 70

Chapter 5 View
The following table describes the labels in this screen.
Table 24 View: IP Application Status: Routing Table Status
LABEL DESCRIPTION
Device
Name
Device IP This field displays the IP address of a device
Index This field displays the index number.
Destination This field displays the destination IP routing domain.
Gateway This field displays the IP address of the gateway device.
Interface This field displays the IP interface to which this route belongs.
Metric This field displays the cost of the route.
Type This field displays the method used to learn the route.
Polling The text box displays how often (in seconds) this screen refreshes. You may change
Close Click Close to close the screen.
This field displays the descriptive name of a device.
the refresh interval by typing a new number in the text box and then clicking the Apply
button.
5.8.2 IP Table Status
Follow the steps below to view the IP table of a selected device.
1 Click View > IP Application Status.
2 Select a switch from the list located on the left-hand side of the screen.
3 Click the IP Table Status tab.
Figure 34 View: IP Application Status: IP Table Status
70
NetAtlas Workgroup User’s Guide
Page 71

Chapter 5 View
The following table describes the labels in this screen.
Table 25 View: IP Application Status: IP Table Status
LABEL DESCRIPTION
Device
Name
Device IP This field displays the IP address of a device
Sort by Click one of the following buttons to display and arrange the data according to that
IP Click this button to display and arrange the data according to IP address.
VID Click this button to display and arrange the data according to VLAN group.
Port Click this button to display and arrange the data according to port number.
Index This field displays the index number.
IP Address This is the IP address of the device from which the incoming packets came.
VID This is the VLAN group to which the packet belongs.
Port This is the port from which the above IP address was learned. This field displays CPU to
Type This shows whether the IP address is dynamic (learned by the switch) or static
Polling The text box displays how often (in seconds) this screen refreshes. You may change the
Close Click Close to close the screen.
This field displays the descriptive name of a device.
button type. The information is then displayed in the summary table below.
indicate the IP address belongs to the switch.
(belonging to the switch).
refresh interval by typing a new number in the text box and then clicking the Apply
button.
5.8.3 DHCP Server Status
Follow the steps below to view the DHCP server status of a selected device.
1 Click View > IP Application Status.
2 Select a switch from the list located on the left-hand side of the screen.
3 Click the DHCP Server Status tab.
NetAtlas Workgroup User’s Guide
71
Page 72

Chapter 5 View
Figure 35 View: IP Application Status: DHCP Server Status
The following table describes the labels in this screen.
Table 26 View: IP Application Status: DHCP Server Status
LABEL DESCRIPTION
Device Name This field displays the descriptive name of a device.
Device IP This field displays the IP address of a device
Index This is the index number.
VID This field displays the ID number of the VLAN group to which this DHCP settings
Server Status This field displays the starting DHCP client IP address.
IP Pool Size This field displays the size of the DHCP client IP address pool.
Polling The text box displays how often (in seconds) this screen refreshes. You may
Close Click Close to close this screen.
5.8.4 VRRP Status
Follow the steps below to view the VRRP status of a selected device.
1 Click View > IP Application Status.
2 Select a switch from the list located on the left-hand side of the screen.
3 Click the VRRP Status tab.
apply.
change the refresh interval by typing a new number in the text box and then
clicking Apply.
72
NetAtlas Workgroup User’s Guide
Page 73

Figure 36 View: IP Application Status: VRRP Status
Chapter 5 View
The following table describes the labels in this screen.
Table 27 View: IP Application Status: VRRP Status
LABEL DESCRIPTION
Device Name This field displays the descriptive name of a device.
Device IP This field displays the IP address of a device
Index This field displays the index number of a rule.
Network This field displays the IP address and the subnet mask bits of an IP routing domain
that is associated to a virtual router.
VRID This field displays the ID number of the virtual router.
VR Status This field displays the status of the virtual router.
This field is Master indicating that this switch functions as the master router.
This field is Backup indicating that this switch functions as a backup router.
This field displays Init when this switch is initiating the VRRP protocol or when the
Uplink Status field displays Dead.
Uplink Status This field displays the status of the link between this switch and the uplink gateway.
This field is Alive indicating that the link between this switch and the uplink gateway is
up. Otherwise, this field is Dead.
This field displays Probe when this switch is check for the link state.
Polling The text box displays how often (in seconds) this screen refreshes. You may change
the refresh interval by typing a new number in the text box and then clicking Apply.
Close Click Close to close this screen.
5.8.5 OSPF Status
Follow the steps below to view the OSPF status of a selected device.
NetAtlas Workgroup User’s Guide
73
Page 74

Chapter 5 View
Figure 37 View: IP Application Status: OSPF Status
1 Click View > IP Application Status.
2 Select a switch from the list located on the left-hand side of the screen.
3 Click the OSPF Status tab.
The following table describes the labels in this screen.
Table 28 View: IP Application Status: OSPF Status
LABEL DESCRIPTION
Device Name This field displays the descriptive name of a device.
Device IP This field displays the IP address of a device
OSPF This field displays whether the OSPF feature is active or not.
Interface This field displays the OSPF interface status on the switch.
Neighbor
Neighbor ID This field displays the router ID of the neighbor.
Pri This field displays the priority of the neighbor. This number is used in the designated
router election.
State This field displays the state of the neighbor (backup or DR (designated router)).
Dead Time This field displays the dead time in seconds.
Address This field displays the IP address of a neighbor.
Interface This field displays the MAC address of a device.
RXmtL This field displays the count of LS (Link State) retransmits.
RqstL This field displays the count of LS (Link State) requests.
DBsmL This field displays the count of DB (Database) summary.
74
NetAtlas Workgroup User’s Guide
Page 75

Table 28 View: IP Application Status: OSPF Status (continued)
LABEL DESCRIPTION
Link State
Database
Polling The text box displays how often (in seconds) this screen refreshes. You may change
Close Click Close to close this screen.
This field displays the link state database information such as the number of links.
the refresh interval by typing a new number in the text box and then clicking Apply.
5.9 Interface Status
Follow the steps below to view the IP interface status of a selected device.
1 Click View > Interface Status.
2 Select a switch from the list located on the left-hand side of the screen.
Figure 38 View: Interface Status
Chapter 5 View
The following table describes the labels in this screen.
Table 29 View: Interface Status
LABEL DESCRIPTION
Device Name This field displays the descriptive name of a device.
Device IP This field displays the IP address of a device
Index This field displays the index number of an entry.
IP Address This field displays IP address of the switch in the IP domain.
IP Subnet Mask This field displays the subnet mask of the switch in the IP domain.
VID This field displays the VLAN identification number of the IP domain on the switch.
NetAtlas Workgroup User’s Guide
75
Page 76

Chapter 5 View
Table 29 View: Interface Status (continued)
LABEL DESCRIPTION
Polling The text box displays how often (in seconds) this screen refreshes. You may
change the refresh interval by typing a new number in the text box and then
clicking Apply.
Close Click Close to close this screen.
5.10 Firmware Version
You can view the firmware version of all managed devices in the Firmware Version screen.
You can also view firmware version for a single device in the System Info screen (see Figure
17 on page 49).
Click View > Firmware Version to display the screen.
Figure 39 View: Firmware Version
76
The following table describes the labels in this screen.
Table 30 View: Firmware Version
LABEL DESCRIPTION
Device Name This field displays the descriptive name of a device.
Device IP This field displays the IP address of a device
Firmware Version This field displays the version number of the firmware the device is currently using.
Cancel Click Cancel to close this screen.
NetAtlas Workgroup User’s Guide
Page 77

CHAPTER 6
Template
This chapter describes how to configure VLAN, IGMP filtering and multicast templates.
6.1 Template Overview
A template is a pre-configured set of configuration settings. Templates allow you to configure
device VLANs, IGMP filers and multicast groups efficiently. The template can then be
uploaded to one or more devices thus removing the need to configure the corresponding
settings for each device.
6.2 VLAN Template
Refer to Section 15.1 on page 157 for more background information on VLAN.
Click Templa te > VLAN Template to display the configuration screen. Use this screen to
configure, delete or view a VLAN template.
NetAtlas Workgroup User’s Guide
77
Page 78

Chapter 6 Template
Figure 40 Template: VLAN Template
The following table describes the labels in this screen.
Table 31 Template: VLAN
LABEL DESCRIPTION
Device Type Select a device for which you want to configure a VLAN template.
VLAN Identity
VLAN ID Enter a unique number to identify the VLAN.
VLAN Name Enter a descriptive name for identification purposes.
Egress Ports A port that is in the egress list in a VLAN. Only select this if the subscriber's DSL
modem or router supports IEEE 802.1Q VLAN.
Select the ports which you want to be egress ports from the list provided.
Forbidden Ports A port that is blocked from joining a VLAN group. No frames are transmitted through
this port.
A forbidden port cannot be an egress port and cannot add tags to outgoing traffic.
Select the ports which you want to be forbidden ports from the list provided.
Untag Ports A port that does not tag all outgoing frames transmitted.
An egress port can be untagged.
Select the ports which you want to be untagged ports from the list provided.
New Click New to create a new VLAN. You must enter a VLAN ID and a VLAN Name to
create a new VLAN. The new VLAN and name is displayed in the left-hand column
in this screen.
Delete Click on a VLAN in the left-hand column of this screen and then click the Delete
button to remove it from the VLAN template.
78
NetAtlas Workgroup User’s Guide
Page 79

Table 31 Template: VLAN (continued)
LABEL DESCRIPTION
Modify Click on a VLAN in the left-hand column of this screen. Change the VLAN Name or
change the configuration of the egress, forbidden and untagged ports. Click the
Modify button to save the changes to the switch.
If you want to change the VLAN ID of a VLAN configuration, you can only delete the
VLAN configuration or create a new VLAN configuration using a different VLAN ID.
Port List Click on a port in the Egress Ports list to add the selected port to the port list. If a
port is not selected from any of the three port lists, then it is a normal tagged port.
This table displays port VLAN settings. A tagged port is marked T, an untagged port
is marked U and a port not participating in a VLAN is marked -.
Close Click Close to close the screen.
6.2.1 Creating a New VLAN Template
Follow the steps below to create a new VLAN template for a switch.
1 Click Template > VLAN Template.
2 A screen displays. Select a switch model in the Device List field.
3 Enter a unique number (between 1 and 4094) in the VLAN ID field.
4 Enter a descriptive name (up to 12 characters) in the VLAN Name field for
identification purposes.
5 Configure the port VLAN settings. Select the port(s) in the Egress Ports, Forbidden
Ports and Untag Ports fields. The VLAN port settings automatically displays in the
Port List table.
6 Click New.
7 If the VLAN is created successfully, a screen displays. Click OK.
Chapter 6 Template
6.3 IGMP Filtering Profile Template
With IGMP filtering, you can control which IGMP groups a subscriber on a port can join. This
allows you to control the distribution of multicast services (such as content information
distribution) based on service plans and types of subscription.
You can set the switch to filter the multicast group join reports on a per-port basis by
configuring an IGMP filtering profile and associating the profile to a port.
Click Templa te > IGMP Filtering Profile Template to display the screen as shown.
NetAtlas Workgroup User’s Guide
79
Page 80

Chapter 6 Template
Figure 41 Template: IGMP Filtering Profile Template
The following table describes the labels in this screen.
Table 32 Template: IGMP Filter Template
LABEL DESCRIPTION
No. This field displays the index number.
IGMP Filter
Name
New/Add Click New/Add to create an IGMP filter profile.
Delete Click Delete to remove one or more selected IGMP filter profiles.
Modify Click Modify to edit a selected IGMP filter profile.
IGMP Filter
Parameters
Index This is the number of the IGMP filter profile.
Start IP This field displays the starting multicast IP address for a range of multicast IP
End IP This field displays the ending multicast IP address for a range of IP addresses to which
OK Click OK to save your changes.
This name identifies the IGMP filter profile.
This table displays the settings of the selected IGMP filter above.
addresses to which you want this IGMP filter profile to allow access.
you want this IGMP filter profile to allow access.
6.3.1 Configuring an IGMP Filter Template
Click New/Add in the IGMP Filtering Template screen to display the screen as shown.
80
NetAtlas Workgroup User’s Guide
Page 81

Figure 42 Template: New IGMP Filter
Chapter 6 Template
The following table describes the labels in this screen.
Table 33 Template: New IGMP Filter
LABEL DESCRIPTION
IGMP Filter Name Type a name (up to 31 printable characters) to identify the IGMP filter profile.
Start Address Enter the starting multicast IP address for a range of multicast IP addresses to
which you want this IGMP filter profile to allow access.
End Address Enter the ending multicast IP address for a range of IP addresses to which you
want this IGMP filter profile to allow access.
If you want to add a single multicast IP address, enter it in both the Start IP and
End IP fields.
Add Click Add to create a new IGMP filter.
Clear Click Clear to remove the selected IGMP filter template.
IGMP Filter
Parameters
Index This is the number of the IGMP filter profile. Double-click a profile’s index number
to edit the profile.
Start Address This field displays the starting multicast IP address for a range of multicast IP
addresses to which you want this IGMP filter profile to allow access.
End Address This field displays the ending multicast IP address for a range of IP addresses to
Close Click Close to close this screen.
which you want this IGMP filter profile to allow access.
NetAtlas Workgroup User’s Guide
81
Page 82

Chapter 6 Template
6.4 Static Multicast Group Template
Use the static multicast filter to allow incoming frames based on multicast MAC address(es)
that you specify. This feature can be used in conjunction with IGMP snooping to allow
multicast MAC address(es) that are not learned by IGMP snooping. Use the static multicast
filter to pass routing protocols, such as RIP and OSPF.
Click Templa te > Multicast Template to display the screen as shown.
Figure 43 Template: Multicast Template
82
The following table describes the labels in this screen.
Table 34 Template: Multicast
LABEL DESCRIPTION
Device Type Select a device from the drop-down list box to view the device’s VLAN configuration.
Te mp l a te
No. This field displays the index number.
Multicast Name This field displays the descriptive name for the multicast template.
New Click New to create a new multicast template.
Modify Click Modify to change the settings of the selected multicast template.
Delete Click Delete to remove the selected multicast template.
Port List
Port This field displays the port number.
Immed. Leave This field displays Tru e when the switch is set to remove this port from the multicast
tree when an IGMP version 2 leave message is received on this port.
This field displays False when the feature is disabled.
NetAtlas Workgroup User’s Guide
Page 83

Table 34 Template: Multicast (continued)
LABEL DESCRIPTION
Group Limit This field shows whether the switch limit the number of multicast groups this port is
allowed to join or not.
Once a port is registered in the specified number of multicast groups, any new IGMP
join report frame(s) is dropped on this port.
Max. Group
Number
IGMP Filtering This field displays the name of the IGMP filtering profile to use for this port.
IGMP Querier
Mode
Close Click Close to close this screen.
This field displays the number of multicast groups this port is allowed to join.
This field displays the IGMP querier mode for this port.
6.4.1 Configuring a Multicast Template
To create a new multicast template, click New in the Multicast Template screen.
Figure 44 Template: New Multicast
Chapter 6 Template
The following table describes the labels in this screen.
Table 35 Template: New Multicast
LABEL DESCRIPTION
Profile Name Enter a descriptive name for the new multicast template.
Port This field displays the port number.
Immed. Leave Double-click this field and specify whether the switch is to remove this port from the
multicast tree when an IGMP version 2 leave message is received on this port.
Select Tru e from the drop-down list box to activate the immediate leave feature.
Select False to disable this feature.
NetAtlas Workgroup User’s Guide
83
Page 84

Chapter 6 Template
Table 35 Template: New Multicast (continued)
LABEL DESCRIPTION
Group Limit Double-click to configure this field.
Max. Group
Number
IGMP Filter Double-click this field to select the name of the IGMP filtering profile to use for this
IGMP Querier
Mode
OK Click OK to save the settings and close this screen.
Cancel Click Cancel to discard all changes and close this screen.
Select True to limit the number of multicast groups this port is allowed to join. Once a
port is registered in the specified number of multicast groups, any new IGMP join
report frame(s) is dropped on this port.
Select False to disable this feature.
Double-click this field and enter a number to limit the number of multicast groups this
port is allowed to join. Once a port is registered in the specified number of multicast
groups, any new IGMP join report frame(s) is dropped on this port.
port.
The switch treats an IGMP query port as being connected to an IGMP multicast router
(or server). The switch forwards IGMP join or leave packets to an IGMP query port.
Select Auto to have the switch use the port as an IGMP query port if the port receives
IGMP query packets.
Select Fixed to have the switch always use the port as an IGMP query port. Select
this when you connect an IGMP multicast server to the port.
Select Edge to stop the switch from using the port as an IGMP query port. The switch
will not keep any record of an IGMP router being connected to this port. The switch
does not forward IGMP join or leave packets to this port.
84
NetAtlas Workgroup User’s Guide
Page 85

CHAPTER 7
Provisioning
This chapter shows you how to use the Provisioning screens to apply templates.
7.1 Overview
After you have created an IGMP filter profile (or template) in the Template screens, you can
use the Provisioning screens to apply or delete IGMP filter profiles to or from a device.
" You must first create IGMP filtering templates before you can apply them
using the Provisioning screen. Refer to the chapter on creating templates
for more information.
7.2 Applying an IGMP Filter Profile
Follow the steps below to apply an IGMP filter to a device.
1 Click Provisioning > IGMP Filter Provisioning to display the screen as shown.
2 Select Apply IGMP Filters under Action.
3 Select a profile you want to use on the left and click Add. You can view the profile
settings by clicking View IGMP Filter. Refer to the chapter on IGMP filter template
settings for field descriptions.
NetAtlas Workgroup User’s Guide
85
Page 86

Chapter 7 Provisioning
Figure 45 Provisioning: IGMP Filter
4 Click Apply To Devices to apply the selected IGMP filer profile(s).
5 A screen displays as shown. Select the device(s) to which you want to apply the IGMP
filter(s). To select more than one device, press [SHIFT] or [CTRL] and select at the same
time.
Figure 46 Provisioning: IGMP Filter: Apply to Devices
6 Click Apply to copy the IGMP filter profile settings to the selected device(s).
7 A screen displays showing the profile copy status. Click OK to close this screen.
Figure 47 Provisioning: IGMP Filter: Apply to Devices: Successful
86
NetAtlas Workgroup User’s Guide
Page 87

7.3 Removing an IGMP Filter Profile
Follow the steps below to remove an IGMP filter from a device.
1 Click Provisioning > IGMP Filter Provision to display the screen as shown.
2 Select Remove IGMP Filters under Action.
3 Select a profile you want to remove and click Add. You can view the profile settings by
clicking View IGMP Filter. Refer to the chapter on IGMP filter template settings for
field
Figure 48 Provisioning: IGMP Filter: Remove From Devices
Chapter 7 Provisioning
4 Click Apply To Devices.
5 A screen displays as shown. Select the device(s) from which you want to remove the
IGMP filter(s). To select more than one device, press [SHIFT] or [CTRL] and select at
the same time.
NetAtlas Workgroup User’s Guide
87
Page 88

Chapter 7 Provisioning
Figure 49 Provisioning: IGMP Filter: Remove From Devices: Select Device
6 Click OK to remove the IGMP filter profile settings from the selected device(s).
7 A Result screen displays showing the profile removal status. Click Close to close this
screen.
Figure 50 Provisioning: IGMP Filter: Remove From Devices: Successful
88
NetAtlas Workgroup User’s Guide
Page 89

CHAPTER 8
Performance
This chapter describes the interface performance screen, graph setup and table setup. View
Ethernet history statistics for your switch network.
8.1 Interface Performance
This section shows you how to configure what you want to display in a performance table or
graph.
Click Performance > Interface in the EMS main menu.
Figure 51 Performance: Interface
The following table describes the labels in this screen.
Table 36 Performance: Interface
LABEL DESCRIPTION
Device Name This field displays the descriptive name of a device.
Device IP This field displays the IP address of a device
Interface Select an interface (or port) from the drop-down list box.
NetAtlas Workgroup User’s Guide
89
Page 90

Chapter 8 Performance
Table 36 Performance: Interface (continued)
LABEL DESCRIPTION
Rx Counters The following fields display the types of packet counters received on this
Tx Counters This following fields display the types of packet counters transmitted on this
Octets Select this option to show the total number of octets received or transmitted.
Unicast Pkts Select this option to show the total number of good unicast packets received or
Non-unicast Pkts Select this option to show the total number of good non-unicast packets received
Discard Pkts Select this option to show the total number of packets received or transmitted that
Error Pkts Select this option to show the total number of error packets received or
Multicast Pkts Select this option to show the total number of good multicast packets received or
Broadcast Pkts Select this option to show the total number of good broadcast packets received or
HC-Unicast Pkts Select this option to show the number of unicast packets (High Capacity (HC) 64
HC-Multicast Pkts Select this option to show the number of multicast packets (High Capacity (HC) 64
HC-Broadcast
Pkts
Polling The text box displays how often (in seconds) this screen refreshes. You may
Close Click Close to close this screen.
Reset Counters Click Reset Counters to clear the counters.
Graph Click the Graph button to create a graph based on the above selections.
Table Click the Table button to create a table based on the above selections.
Close Click Close to close the screen.
interface.
interface.
transmitted that were dropped.
or transmitted that were dropped.
were dropped.
transmitted.
transmitted.
transmitted.
~ 1518 octets long) dropped because they either had a bad Frame Check
Sequence (FCS) or non-integer number of octets (alignment error).
~ 1518 octets long) dropped because they either had a bad Frame Check
Sequence (FCS) or non-integer number of octets (alignment error).
Select this option to show the number of broadcast packets (High Capacity (HC)
64 ~ 1518 octets long) dropped because they either had a bad Frame Check
Sequence (FCS) or non-integer number of octets (alignment error).
change the refresh interval by typing a new number in the text box and then
clicking Apply.
8.2 RMON Ethernet Statistics
Use this screen to look at network traffic on an Ethernet port since the last time the switch was
reset. To open this screen, click Performance > RMON > Ethernet Statistics.
90
NetAtlas Workgroup User’s Guide
Page 91

Figure 52 Performance: RMON: Ethernet Statistics
Chapter 8 Performance
The following table describes the labels in this screen.
Table 37 Performance: RMON: Ethernet Statistics
LABEL DESCRIPTION
Device Name This field displays the name of each switch. Select a switch to look at statistics for
one of its ports.
Device IP This field displays the corresponding IP address of the switch.
Port Select the port at whose statistics you want to look.
Polling Select how often you want the EMS to update the statistics it displays.
Basic Counters
Drop Events Select this to display the total number of packets that were dropped.
Octets Select this to display the total number of octets received.
Collisions Select this to display the total number of collisions occurred.
Total Packets Select this to display the total number of all good packets received.
Broadcast
Packets
Multicast
Packets
Packets of
Variable Size
0 ~ 64 Octets
(Undersize)
64 Octets Select this to display the number of packets (including bad packets) received that
65 ~ 127 Octets Select this to display the number of packets (including bad packets) received that
128 ~ 255
Octets
Select this to display the total number of good broadcast packets received.
Select this to display the total number of good multicast packets received.
Select this to display the number of packets (including bad packets) received that
were between 0 and 64 octets in length.
were 64 octets in length.
were between 65 and 127 octets in length.
Select this to display the number of packets (including bad packets) received that
were between 128 and 255 octets in length.
NetAtlas Workgroup User’s Guide
91
Page 92

Chapter 8 Performance
Table 37 Performance: RMON: Ethernet Statistics (continued)
LABEL DESCRIPTION
256 ~ 511
Octets
512 ~ 1023
Octets
1024 ~ 1518
Octets
1518 ~Octets
(Oversize)
Packets with
FCS/Alignment
Errors
CRCAlignErrors
(Normal
Packets,
64~1518)
Fragments
(Undersize
Packets)
Jabbers
(Oversize
Packets)
Graph Select this to create a graph based on the above selection(s).
Table Select this to create a table based on the above selection(s).
Close Click this to close the screen.
Select this to display the number of packets (including bad packets) received that
were between 256 and 511 octets in length.
Select this to display the number of packets (including bad packets) received that
were between 512 and 1023 octets in length.
Select this to display the number of untagged packets (including bad packets)
received that were between 1024 and 1518 octets in length. This number also
includes tagged packets received that were 1522 octets in size.
Select this to display the number of untagged packets (including bad packets)
received that were greater than 1518 octets in length.
Select this to display the number of packets (between 64 ~ 1518 octets long)
dropped because they either had bad Frame Check Sequence (FCS) or non-integral
number of octets (alignment error).
Select this to display the number of frames dropped because they were less than 64
octets long, and contained an invalid FCS, including non-integral and integral
lengths.
Select this to display the number of frames dropped because they were longer than
1518 octets and contained an invalid FCS, including alignment errors.
8.3 RMON History Data
Use this screen to look at historical network traffic on an Ethernet port. To open this screen,
click Performance > RMON > History Data.
92
NetAtlas Workgroup User’s Guide
Page 93

Figure 53 Performance: RMON: History Data
Chapter 8 Performance
The following table describes the labels in this screen.
Table 38 Performance: RMON: History Data
LABEL DESCRIPTION
Device Name This field displays the name of each IP DSLAM. Select an IP DSLAM to look at
statistics for one of its ports.
Device IP This field displays the corresponding IP address of the IP DSLAM.
History Control
Ta ble
Index This field displays the configuration index number.
Data Source This field displays the port of the IP DSLAM that the EMS will poll for data.
Bucket Granted This field displays the number of data samplings the probe allows to stores.
Interval (sec) This field displays the time between data samplings.
Polling Select how often you want the EMS to update the statistics it displays.
Basic Counters
Dropped
Events
Octets Select this to display the total number of octets received.
Collisions Select this to display the total number of collisions occurred.
Utilization Select this to display the utilization of the LAN ports.
Packet
Counters
Total Packets Select this to display the total number of all good packets received.
Broadcast
Packets
Select this to display the total number of packets that were dropped.
Select this to display the total number of good broadcast packets received.
NetAtlas Workgroup User’s Guide
93
Page 94

Chapter 8 Performance
Table 38 Performance: RMON: History Data (continued)
LABEL DESCRIPTION
Multicast
Packets
Undersize
Packets (less
than 64 octets)
Oversize
Packets (longer
than 1518
octets)
Packets with
FCS/Alignment
Errors
CRCAlignErrors
(Normal
Packets, 64
~1518 octets)
Fragments
(Undersize
Packets)
Jabbers
(Oversize
Packets)
Table Select this to create a table based on the above selection(s).
Close Click this to close the screen.
Select this to display the total number of good multicast packets received.
Select this to display the number of packets dropped because they were too short
(shorter than 64 octets).
Select this to display the number of packets dropped because they were too big
(bigger than the maximum frame size).
Select this to show the number of packets (between 64 ~ 1518 octets long) dropped
because they either had bad Frame Check Sequence (FCS) or non-integral number
of octets (alignment error).
Select this to display the number of frames dropped because they were less than 64
octets long, and contained an invalid FCS, including non-integral and integral
lengths.
Select this to display the number of frames dropped because they were longer than
1518 octets (non VLAN) or 1522 octets (VLAN) and contained an invalid FCS,
including alignment errors.
8.4 Table Menu Bar
The following figure displays the table menu bar icons. These icons are common to all screens
that display information in tabular format.
Figure 54 Table Menu Bar Icons
Edit Short Search Edit SNMPc
Controls Names Entry Help
Pause Switch Show Save to Poll
Polling Axis Graph File Interval
94
NetAtlas Workgroup User’s Guide
Page 95

Chapter 8 Performance
8.4.1 Editing a Table Entry
" You can edit a table entry in all screens that display information in tabular
format.
In any tabulated screen display, click the Edit icon in the menu bar icon to display the
Edit Table Entry screen and edit any field in a table. There is a set of variable names, value
and set button controls that operate on the fields of the selected table. There is also a set of
function control buttons on the right. For tables that have more than ten entries, the Edit Table
Entry screen supports multiple pages.
Figure 55 Edit Table Entry
Variable Name Variable Values Variable Set Button Previous and Next Page Buttons
Expand
First
Get
Next
Stop
Set All
Done
Help
The following table describes the labels in this screen.
Table 39 Edit Table Entry
COMMAND DESCRIPTION
Variable Names The first vertical column contains the variable names; these are the names of fields
in the selected table. These names are set by SNMPc and cannot be changed.
Some tables have variable names with an asterisk to the right of the name. These
variables are used as indices into the table. All index variables must be specified to
perform a Set operation.
Variable Values The second vertical column contains the variable values in pull down list boxes. You
can change the value by typing into the pull down edit box. If the variable has
integer aliases defined in the MIB, you can select an alias by clicking on the down
arrow and selecting an item from the drop down list. You must enter the variable
value in the proper format. Use the expand button (see next section) to view the
variable type.
NetAtlas Workgroup User’s Guide
95
Page 96

Chapter 8 Performance
Table 39 Edit Table Entry (continued)
COMMAND DESCRIPTION
Variable Set
Button
Previous/Next
Page Buttons
Expand Click the Expand button to expand the view of the active variable value edit box.
First Click the First button to obtain the first entry of the table from the node. The variable
Get Click the Get button to obtain the selected table entry. Enter all of the index values
Next Click the Next button to obtain the next entry of the table from the node, using an
Stop Click the Stop button to abort the current SNMP operation. This button can be used
Set All Click the Set All button to set all writable variable values to the node. You must enter
Done Click this button when you’re done editing this dialog box.
Help Click this button for online help.
Each variable value has a small Set button to the right. Click this Set button to
perform an SNMP set on only one variable. Set buttons are grayed for variables that
are read-only.
Each page shows up to ten variables. The page number and total number of pages
are displayed in the top right corner. Use the >> button to move to the next page and
click the << button to move to the previous page.
First click on the edit box, then select the Expand button.
values will be updated. You do not need to enter index values - they will be ignored.
to select a table entry. If you have already displayed an entry, and perhaps modified
the value boxes, you can Click the Get button to refresh the variable values.
SNMP GetNext operation. The variable values are updated. If there are no more
entries in the table, a message is displayed. You can specify a starting point for the
GetNext by entering index values. You do not need to enter all index values, but if
you enter the Nth index value, you must also enter the 1st through (N-1)th index
values.
to stop a command when a node is not responding and you don't want to wait for the
timeout period.
all of the index values (those with an asterisk to the right of the variable name) to
select the table entry. If you do not know the proper index values, you can first find
the entry you want to change by using the First and Get, Next buttons. Some nodes
do not allow set operations to all variables that are defined as writable in the MIB.
For these nodes, you will have to individually set table entry variables using the
variable Set buttons.
" You can only use the variable Set button (via the EMS) to update system
contact, system name, system location and the administrative status of each
port.
8.4.2 Expand Dialog Box
In the Edit Table Entry screen click the Expand button to expand the view of the active
variable value edit box. First click on the edit box, then click Expand.
96
NetAtlas Workgroup User’s Guide
Page 97

Chapter 8 Performance
Figure 56 Expand Field
The Expand screen shows the variable value in a larger edit box, so you can more easily enter
a long value. It also shows the variable type and a description from the MIB source file.
Possible variable types are shown in the following table.
Table 40 Variable Types
TYPE DESCRIPTION
Number This can be an INTEGER, COUNTER, GAUGE or Time Ticks. Data is normally
HexArr OCTET PRIM TYPE. Data is formatted as a list of two digit hexadecimal numbers,
ObjID OBJECT IDENTIFIER. Data is formatted in MIB dot format, optionally with a leading text
String This is OCTET PRIM TYPE with printable (ASCII string) data (DisplayString).
IP Addr IP ADDRESS PRIM TYPE in dotted decimal notation, for example, 128.9.118.0.
represented as a decimal number. However, in cases where INTEGER aliases are defined
in the MIB, an ASCII word will be displayed. For example, the value for ifOperStatus is
displayed as UP or DOWN.
representing one byte each, and separated by a single space, for example 22 3E 44 A1 10.
identifier, for example sysObjectID.0 or 1.3.6.1.2.1.1.2.0.
8.5 Graph Menu Bar Icons
These graphical menu bar icons are common to all screens that display information in
graphical format.
Figure 57 Graph Menu Bar
Restart Save to Bar Poll Paging Scroll
Graph File Chart Interval Controls Controls
Pause Line Pie Distribution Vertical
Graph Graph Chart Scale
NetAtlas Workgroup User’s Guide
97
Page 98

Chapter 8 Performance
8.5.1 Graph Styles
Use one of the style buttons to change the graph style to one of the following:
Table 41 Edit Table Entry
STYLE DESCRIPTION
Line Each variable is displayed as a line, with time as the horizontal axis. The vertical axis
represents the size of each polled value for each poll interval.
Bar The cumulative average value for each variable is displayed as a vertical bar.
Pie All variables are displayed as relative sized portions of a pie diagram. The entire display
represents a single poll interval.
Distribution Each variable is displayed as a stacked vertical bar. Each segment of the bar represents
the amount of time that the variable value is within a certain range (as a percent). The
legend on the right side of the display shows the corresponding range for each color. The
entire display represents a single poll interval.
8.5.2 Chart Format Display Variable
Choose which variables to display in chart format by doing one of the following:
1 Click a variable cell in a table and click the bar chart icon.
2 Display the chart menu and then deselect variables (all are displayed by default).
3 Right-click a variable’s cell and select Properties.
Figure 58 Cell Properties Select
4 A display properties dialog box opens. Select the Display check box.
Figure 59 Chart Color Codes and Line Styles
98
NetAtlas Workgroup User’s Guide
Page 99

You may also edit the color code and line style for a variable in the dialog box as described in
the following table.
Table 42 Edit Style Dialog Box
FIELD DESCRIPTION
Display Check Display to view information about this variable in chart format.
Color Choose a color from this drop down list.
Style Choose a line style from this drop down list.
Scale Select the scaling multiplier from this drop down list. This factor is applied to each value in
the line before it is displayed and can be used to keep all graph lines within a similar range
of values. The range is from 0.0001 to 1000.0.
8.5.3 Graph Labels
In the Interface screen click the Graph button to display the following screen.
Figure 60 Graph Variables
Chapter 8 Performance
The following table describes the labels in this screen.
Table 43 Graph Variables
LABEL DESCRIPTION
Style This is the line style discussed above.
Variable This is the variable being represented by the line style discussed above.
Scale This is the scaling multiplier.
Cur This is the current value of the variable.
Min This is the minimum value of the variable.
Max This is the maximum value of the variable.
Ave This is the average value of the variable.
Total This is the total value of the variable.
Baseline This is a measure of the typical variable behavior. After a learning period has transpired,
SNMPc can automatically generate baseline alarms when variable values exceed the
baseline.
NetAtlas Workgroup User’s Guide
99
Page 100

Chapter 8 Performance
100
NetAtlas Workgroup User’s Guide
 Loading...