

Page 1
YSI incorporated
YSI Profiler System
User’s Manual
Page 2

Table of Contents
Page
Section 1 Introduction
1.1 System Overview 1-1
1.2 System Description 1-1
1.3 Getting Started 1-4
Section 2 Profile Routine
2.1 Software Installation 2-1
2.2 Using Profile Wizard to Create a Profile Routine 2-4
2.3 How the CR10X Executes a Profile Routine 2-17
Section 3 Equipment Staging – Sonde & Components
3.2 Setting Sonde Parameters 3-1
3.3 Connecting & Checking Profiler Components 3-9
Section 4 Equipment Staging – PC / CR10X Communications
4.1 Introduction 4-1
4.2 Setting Up Communication from PC to Station 4-1
4.3 Downloading Program File to Station 4-10
Section 5 Pre-Deployment Testing
5.1 Setting Up LoggerNet for System Testing 5-1
5.2 Testing with Ports and Flags 5-6
5.3 Start a Profiling Sequence 5-12
Section 6 Deployment & Maintenance
6.1 Transporting Platform to Profile Location 6-1
6.2 Testing Communications 6-3
6.3 Maintenance – Servicing Sonde 6-4
6.4 Maintenance – Servicing Other System Components 6-5
6.5 Maintenance Schedule 6-7
Section 7 Data Collection & Analysis
7.1 Data Collection 7-1
7.2 YSI Profile Data Manager 7-1
7.3 Data Analysis 7-2
7.4 Automation Setup 7-6
7.5 FTP Site Test 7-13
3.1 Introduction 3-1
i
Page 3

Section 8 Appendices
A
B Software File Reports
C I/O Module Configuration
D YSI Parameter ID Numbers (CR10X)
E Required Notice
F Material Safety Data Sheet(s)
G Data File Array Numbers
H Supplementary Information
Warranty & Service Information
ii
Page 4

YSI Profiler System USER Manual
Section 1
Introduction
1.1 System Overview
The YSI Profiler is an integrated system of hardware and software, typically mounted to a
floating platform (pontoon or buoy). The Profiler is anchored at a predetermined site on a lake,
reservoir or bay, and used for vertical profiling a column of water. The system employs a YSI
sonde to periodically measure water parameters in the column. The user inputs information
through YSI Profile Wizard (PC-based) to create a program that is downloaded to a Campbell
Scientific CR10X data logger that resides on the Profiler platform. The CR10X controls the
Profiler winch to move the sonde up and down through the water column and command data from
sensors at specified intervals. The system may also include a depth sounder (or fixed reference
sonde), compass and meteorological sensors for collecting additional data at the site. The remote
data collection system operates on programmed software instructions, and when polled, it sends
data via a wireless communication link back to one or more base stations. LoggerNet™ is a PCbased program used to communicate with the CR10X data logger, which keeps track of the last
samples uploaded. The YSI Profile Data Manager™ is a PC-based program that may be used to
analyze and manage profile data.
1.2 System Description
The YSI Profiler pontoon version consists of the YSI 6960 Controller Assembly and the YSI
6955 Winch Assembly, both mounted to a T-Frame support. Figure 1-1 should help you to
visualize the hardware. The software programs are described in later sections.
Figure 1-1 Profiler Platform: On Boat Ramp for Pre-deployment Check (Panels Removed)
YSI Environmental 669523 Rev B Page 1-1
Page 5

YSI Profiler System USER Manual
The YSI Profiler System may be configured in a fixed station version as shown in Figure 1-2.
Here the YSI 6955 Winch Assembly is mounted to a pylon and the YSI 6961 Controller
Assembly is rail-mounted and housed inside a NEMA enclosure.
Figure 1-2 YSI Profiler Fixed Mount Version: mounted to pylon and guard rail
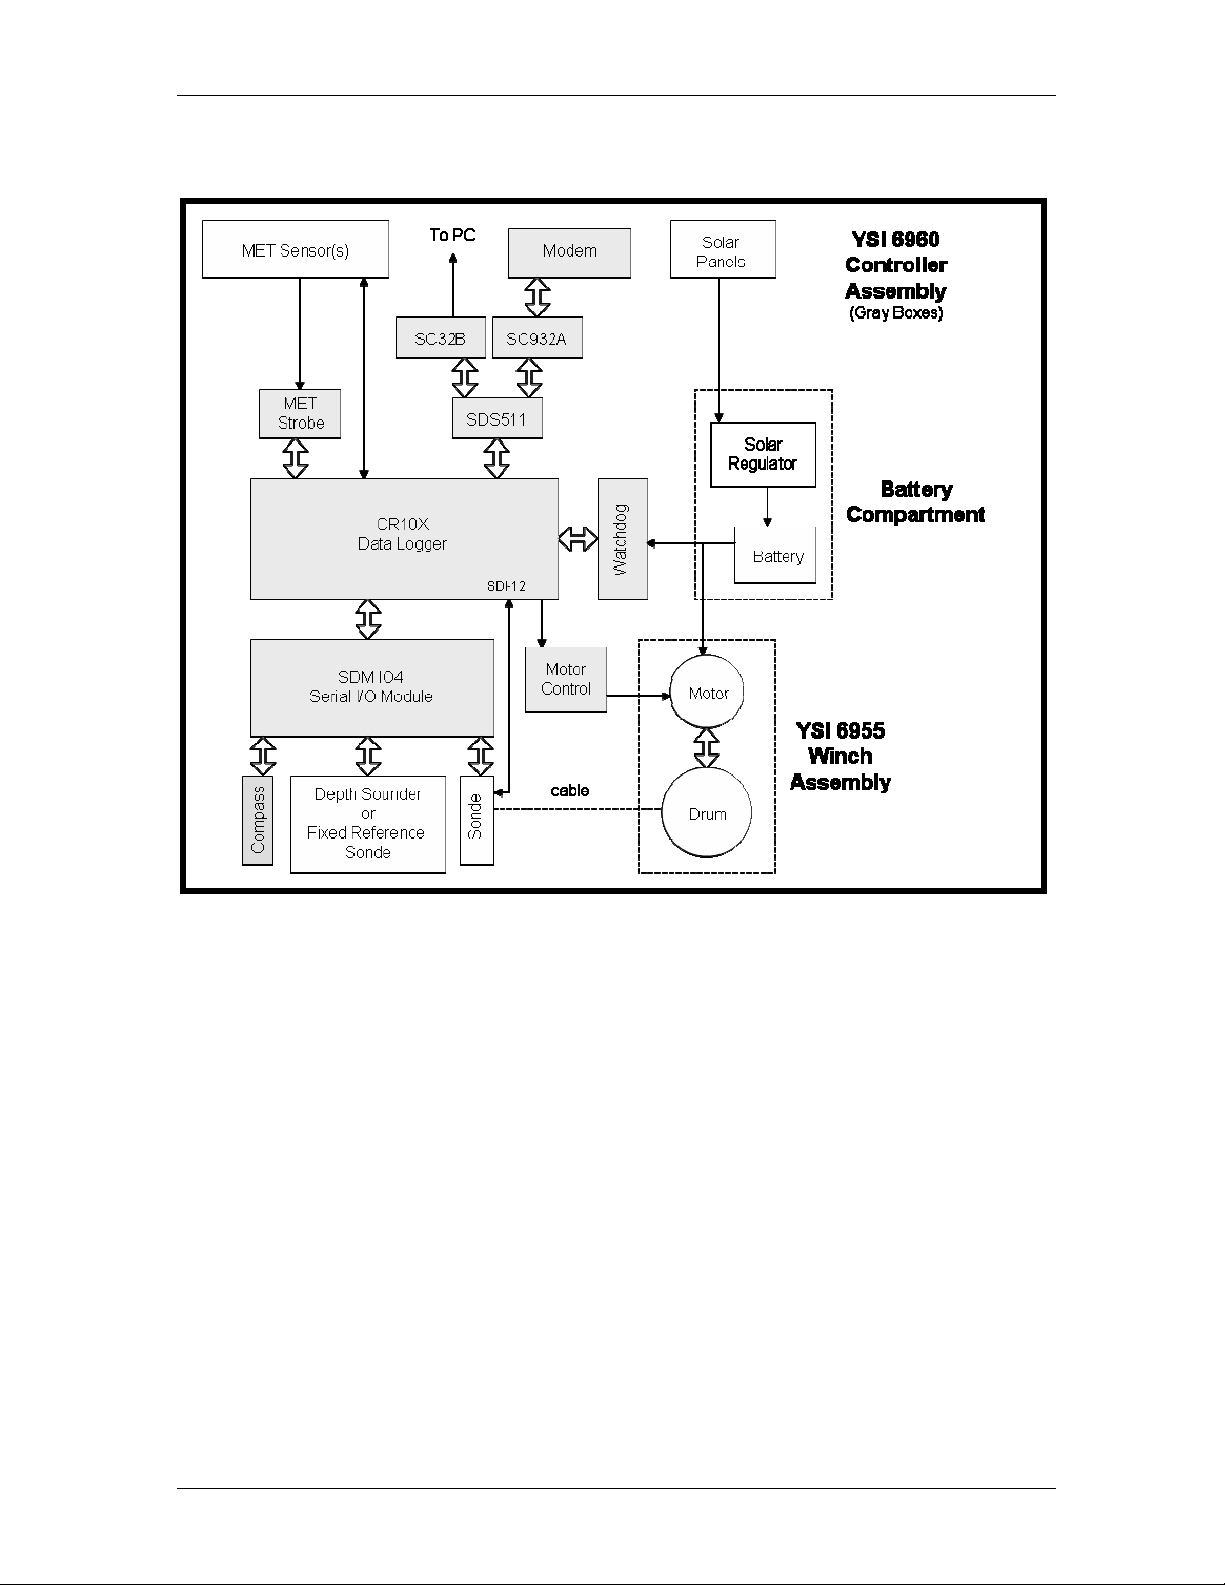
The YSI 6960 (or 6961) Controller is the heart of the system. It includes a Campbell Scientific
CR10X-2M data logger, an SDM SIO4 module, a motor control system (with two relays), a
watchdog timer and a communication module. These components are housed within a watertight
enclosure to protect the electronics from the environment. In Figure 1-4, gray shaded
components are those housed within the enclosure. Note that variable water depth can be
monitored by the Depth Sounder or a Fixed Reference Sonde depending on the deployment
requirements.
The CR10X program executes commands that collect information from the sonde and various
peripherals. This information is then used by the CR10X to strobe its I/O ports and performs
mechanical actions, such as energize the power relay that controls the winch motor to move the
sonde to a new location in the water column.
The YSI 6955 Winch Assembly is driven by a 12 VDC motor. The Winch Assembly includes a
reinforced Kevlar® sonde cable that is approximately 0.3 inch in diameter and 15 meters in
length for vented cables. For non-vented cables sonde cables the diameter is approximately 0.25
inch with lengths from 30 to 100 meters. The Winch Assembly is primarily composed of PVC
and Delrin® parts to maximize resistance to environmental damage. The motor is a small
horsepower motor geared down to lift the required weight of a YSI sonde (including attached
weight and cable). The total weight of the sonde in water is about 8 lbs. The motor is coupled to
the drum axle via a robust planetarium gear assembly that incorporates a 90 degree gear coupler.
The Motor Control Circuit Breaker module is controlled by the CR10X. It functions as the main
power OFF/ON to the motor and as a current limiter. In the event the motor draws excessive
power, the current increases. Once it reaches a set threshold the module terminates motor power.
YSI Environmental 669523 Rev B Page 1-2
Page 6
YSI Profiler System USER Manual
The program makes a second and third attempt to run the motor. If current threshold is still
exceeded, the program aborts to SETUP mode.
Figure 1-3 Block Diagram – YSI Profiler Control and Winch Assemblies
The Watch Dog circuit provides a 90 to 120 second power interrupt to the CR10X in the unlikely
event the program fails to execute as expected. It takes approximately 36 hours of no SDM I/O
port activity for the Watch dog to time out. After 36 hours the program will re-initialize to
SETUP mode which then requires manual operator intervention to restart the profiling program.
A belt-driven diamond screw and a V-roller suspension assembly help guide the sonde cable as it
moves in and out of the winch drum. This level wind mechanism is powered and synchronized
by the motor drive timing pulley. The design of the driving pulley, the speed reducing pulley,
and the reverse screw allows the cable carriage guide to move laterally at the correct speed to
properly lay the cable on the drum. See Section 3 for details.
Other components required for the system include a 12 volt battery, solar panels, and solar
charger/regulator. Optional equipment includes a depth sounder (or a fixed reference sonde) to
measure the water level, meteorological sensors, beacons, telemetry modules, antennas, compass,
and counter weights for stabilizing the platform.
YSI Environmental 669523 Rev B Page 1-3
Page 7

YSI Profiler System USER Manual
When connected the Winch and Controller assemblies perform the required steps to collect sonde
data from the water column. The sequence at which it collects data depends on how the software
program is set up. Information in the following sections provides step-by-step instructions that
take you through pre-deployment setup operations, some tips on deployment, and routine
maintenance of the Profiler system.
1.3 Getting Started
Core components of the YSI Profiler are assembled and tested at the factory. Some assembly will
be required after delivery depending on what you ordered and what arrangements you made when
the system was purchased. In addition, some components specific to your application may need
to be installed. Contact information for YSI and Endeco/YSI can be found in Appendix A.
Initial Inspection
Carefully unpack components and accessories of the system. Visually inspect all parts for
damage. Compare received parts with materials listed on the packing list included with your
system. If any parts or materials are missing or damaged, contact Endeco/YSI .
Sonde
The Profiler system requires the use of a YSI 6-Series Sonde with a depth sensor. Please refer to
the Operations Manual accompanying the sonde for configuration and calibration details. You
will be prompted to enter specific sonde information that can only be set in the sonde menu. To
communicate with the sonde you need a terminal emulator program on your PC such as YSI
EcoWatch™, Microsoft ® HyperTerminal, or the equivalent. You may also use the YSI 650
MDS handheld monitor. Specific instructions can be found in Section 3 of this manual. You will
be prompted by Profile Wizard to verify these sonde settings during pre-deployment
configuration.
Software
Three PC software programs are available with your system. In Section 2 there are specific
instructions for installing these programs on your PC. The first, YSI Profile Wizard provides you
with step-by-step screens that allow entry of key parameters that define your profiling routine.
These parameters are then used to configure the controlling software. If you have not done so,
take time to sketch out your vertical profiling objectives, including depths, parameters to be
measured, intervals, up/down or down/up preferences, and any other information you think
relevant. The second software program is LoggerNet™ (licensed from Campbell Scientific Inc.).
This program allows you to communicate with the CR10X data logger that resides on the Profiler
platform. It is used to download profile information that you defined in Profile Wizard.
LoggerNet™ comes with a separate manual. You should take time to review this manual prior to
setting up your system. The third software program is Profile Data Manager™. You use this
program for data analysis once data is collected. You will learn more about this program in
Section 7.
Hardware & Electronics
The major hardware/electronics components of the system are preassembled and tested at the
factory. Most of these components mount to the T-frame that you see in Figure 1-1. The T-frame
assembly is shipped to you, and must be mounted to the deck of the float. After factory testing
YSI Environmental 669523 Rev B Page 1-4
Page 8
YSI Profiler System USER Manual
some components are dismounted for safe shipping. These will need to be remounted. More
about hardware components are covered in Sections 3, 4 and the Appendix.
Once your software is installed, you are ready to proceed with a profile routine, equipment
staging, and pre-deployment checks. As always, the extra time you spend to verify that your
system is properly working prior to deployment, results in a successful working system after
deployment.
Examples of Deployed Profiler Systems
Below are examples of the most common Profiler deployments. In many setups meteorological
sensors are employed along with the sonde, especially in coastal applications. Anchoring
techniques vary with application. In Section 6, you will find information related to deploying a
Profiler system.
Figure 1-4 YSI Profiler with MET sensors on Pontoon Float
Figure 1-5 YSI Profiler at Fixed Station Figure 1-6 YSI Profiler on Buoy Float
YSI Environmental 669523 Rev B Page 1-5
Page 9

YSI Profiler System USER Manual
This Page Intentionally Left Blank
YSI Environmental 669523 Rev B Page 1-6
Page 10

YSI Profiler System USER Manual
Section 2
Profile Routine
2.1 Software Installation
The Floating Profiler System comes with three PC-based software programs. The minimum
required PC operating system is Windows 2000, however we recommend Windows XP. Install
all three programs on a single computer for optimal performance. The following instructions
assume that drive D: is a CD-ROM drive on the computer to which the software is being
installed. If your drive letter is different, substitute the appropriate CD-ROM drive letter into
the instructions below.
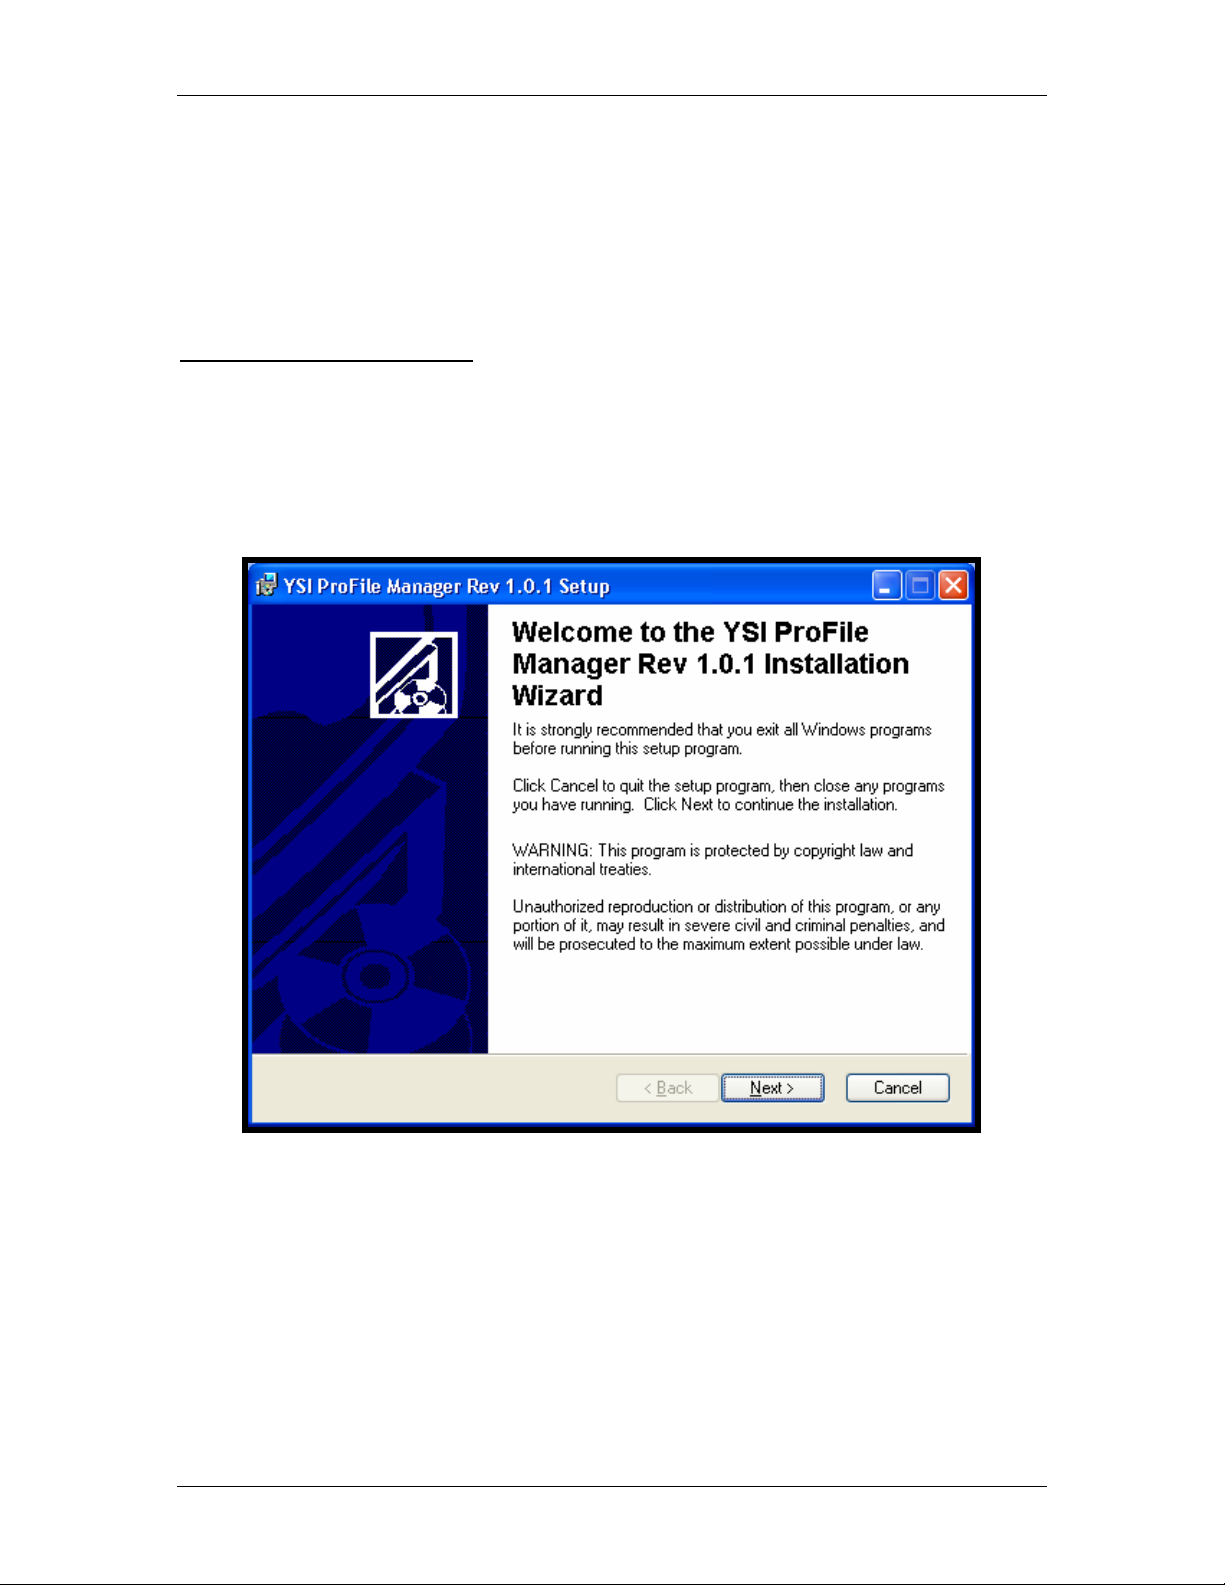
Profile Wizard
Load the installation disk into the CD-ROM drive. This activates the Profile Wizard
Installation Utility. Follow the prompts on the screen to complete the installation.
Figure 2-1 Opening Screen for Profile Wizard Installation
If the screen shown above does not appear, go to the Windows system menu. Select Start | Run.
Type D:\Setup.exe in the open field, and then press OK.
During installation items are added to your computer’s Start menu under Programs | YSI |
Profile Wizard that start the wizard. If the default directories are used, Profile Wizard
YSI Environmental 669523 Rev B Page 2-1
Page 11

YSI Profiler System USER Manual
executable files and help files are placed in the C:\Program Files\YSI\ Profile Wizard\
directory.
Once installed, Profile Wizard allows you to create a profiling routine. It contains simple
instructions (enhanced by graphics) that are easy to follow. If you enter inconsistent
information, pop-up messages provide messages to get you back on track. The end result is a
file that you name and save. This file contains specific profiling information that will be
downloaded to the CR10X data logger that resides on the floating platform.
LoggerNet™
Load the installation disk into the CD-ROM drive. This activates the LoggerNet™ Installation
Utility.
Figure 2-2 Opening Screen for LoggerNet™ Installation
Follow the prompts on the screen to complete the installation. You may need to access the
Internet to complete the installation. This activates the LoggerNet Installation Utility.
If the installation program does not start, then go to Windows system menu, select Start | Run.
Type D:\Disk1\Setup.exe in the open field or use the Browse button to access the CD-ROM
drive and select the setup executable file in Disk1 folder.
Items are added to your computer’s Start menu under Programs | LoggerNet that start the
Toolbar and other selected utilities. If the default directories are used, LoggerNet™ executable
files and help files are placed in the C:\ Program Files\ CampbellSci\ LoggerNet directory.
The directory C:\ CampbellSci\ LoggerNet is a working directory and contains the user
YSI Environmental 669523 Rev B Page 2-2
Page 12
YSI Profiler System USER Manual
programs and data files, along with files maintained by LoggerNet™ such as the binary data
cache and configuration files.
Once installed, LoggerNet™ allows you to communicate with the Campbell Scientific CR10X
Data Logger via RS-232 direct or wireless. Instructions from Profile Wizard will be downloaded
to the CR10X. Pre-deployment checks using LoggerNet™ may also be performed.
Profile Data Manager™
YSI Profile Data Manager is a third program that you may have purchased with your Profiler
system. Contact Endeco/YSI for pricing information if it was not included in your original
order.
Load the installation disk into the CD-ROM drive. This activates the Profile Wizard
Installation Utility. Follow the prompts on the screen to complete the installation.
Figure 2-3 Opening Screen for YSI Profile Data Manager Installation
If the install does not start, then go to Windows system menu, select Start | Run. Type
D:\Setup.exe in the open field or use the Browse button to access the CD-ROM drive and select
the setup executable file.
YSI Environmental 669523 Rev B Page 2-3
Page 13
YSI Profiler System USER Manual
Items are added to your computer’s Start menu under Programs | YSI | ProFile Manager that start
the program. If the default directories are used, Profile Data Manager executable files and help
files are placed in the C:\ Program Files\ YSI\ ProFile Manager Directory. YSI recommends a
separate subfolder for each deployment site.
Once installed, Profile Data Manager™ allows you to organize, report, and plot data from your
profiling routine. You will learn more about Profile Data Manager in later sections of this
manual.
Your PC-based programs should now be installed and ready to use. You will next create a file
that defines your profiling routine. In order to create this file using Profile Wizard, you will
need to verify that certain sonde parameters are set properly. Refer to instructions below that
describe how certain sonde parameters must be set. You may also refer to Section 3 in this
manual for more detail on these sonde settings.
2.2 Using Profile Wizard to Create a Profiling Routine
You are now ready to create a file with information that describes your profiling routine. Make
certain your YSI sonde is configured properly, and calibrated for parameters you wish to
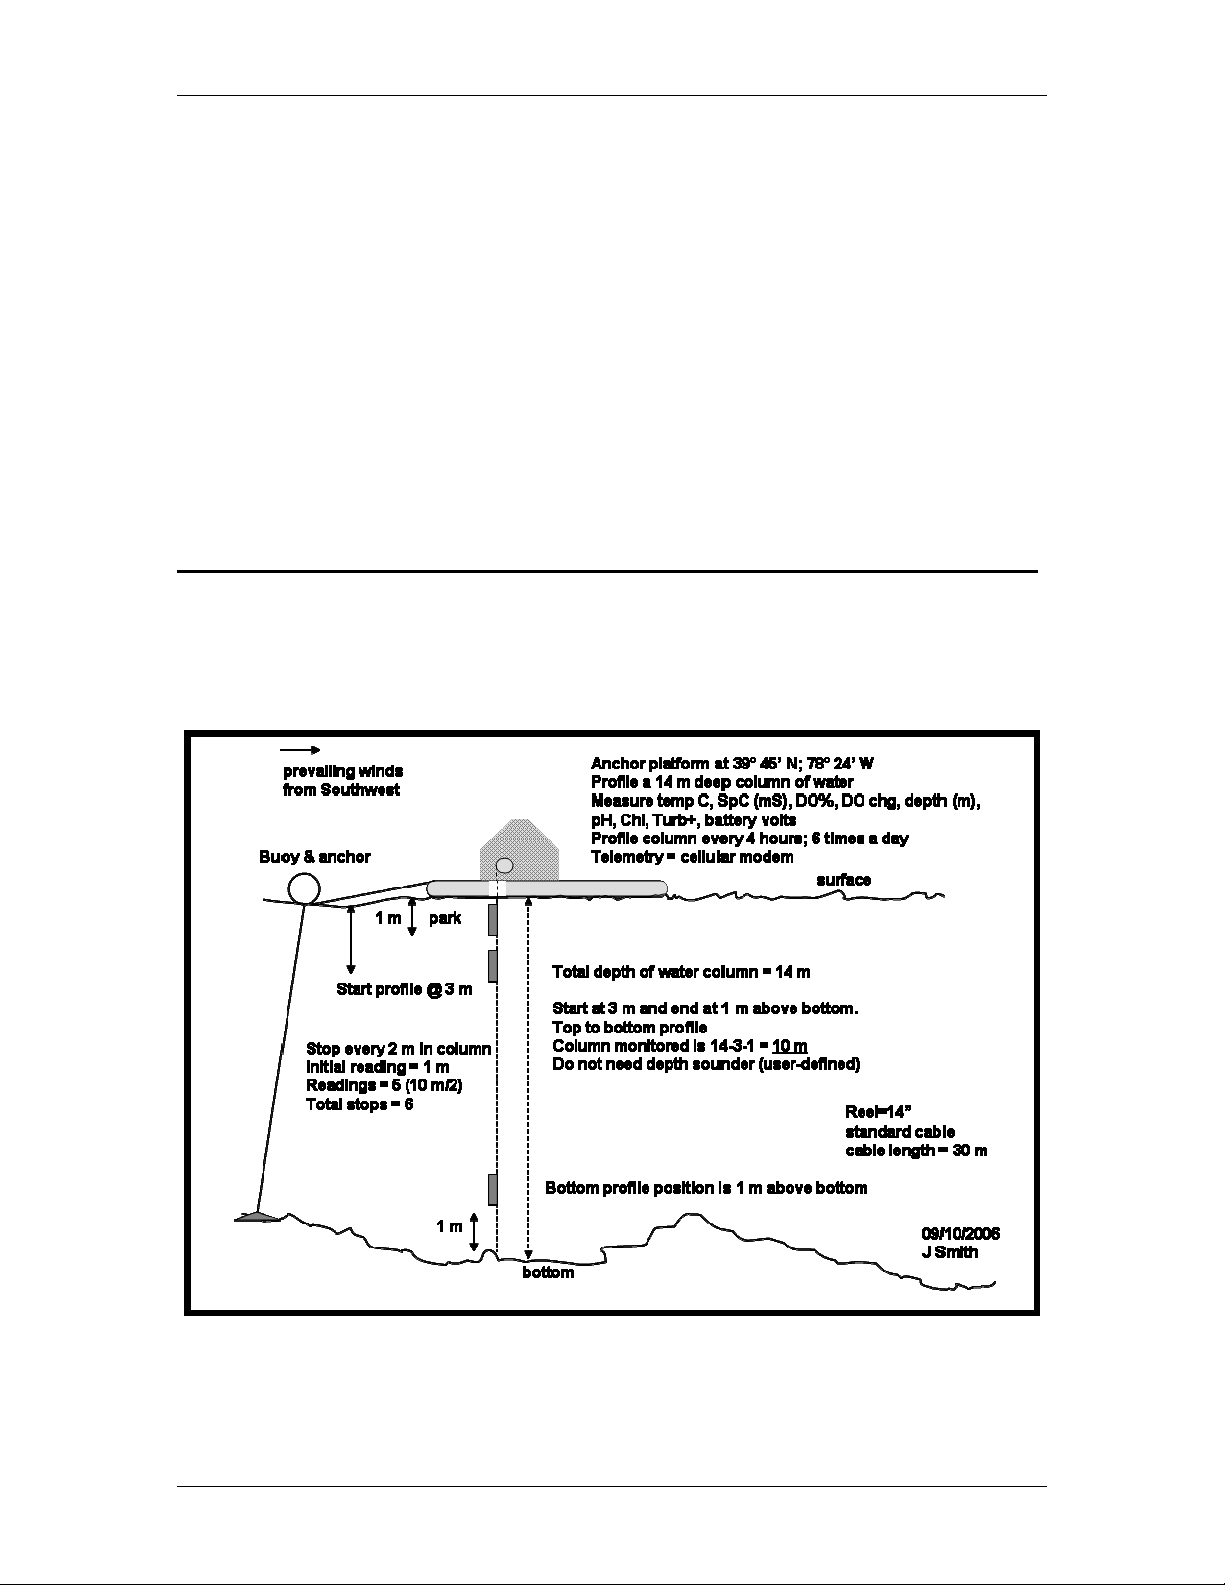
measure. It is recommended that you sketch out your profile plans. This will help you work
through Profile Wizard minimizing the need to backtrack and recalculate. See the example in
Figure 2-4.
Figure 2-4 Pre-Deployment Sketch; Information for Executing Profile Wizard
YSI Environmental 669523 Rev B Page 2-4
Page 14

YSI Profiler System USER Manual
SETTING UP A PROFILING ROUTINE
With basic configurations set in your sonde, use your notes on your profiling objectives to
proceed with Profile Wizard. There are several parts to setting up the file and each will be
discussed below. Following this description a step-by-step setup example will be described with
screen shots of each step of Profile Wizard. Below are some definitions of key terms used in the
setup. In addition to knowing the water depth at your profiling site, you also need to define the
column you want to profile and where you want to park the sonde between profile routines. You
will need to know where to START, where to END, and where to PARK. All must be defined in
units of meters relative to the surface of the water.
The PARK depth (required entry) can be anywhere in the water column. This is where the
sonde will reside when it is not actively profiling a water column.
The START position (required entry) is the first point in the water column where data is
collected. This can be close to the surface, near the bottom or anywhere in between. The Profile
Wizard program also requires an entry selection to profile from TOP TO BOTTOM or
BOTTOM TO TOP.
The END position (required entry) is the last step the Profiler can take. If the sonde goes any
further, it may come out of the water or hit bottom. The END step is the only step that will vary
in size from the other steps and is typically less than a full step size.
The PROFILE DURATION is the time it takes to go from PARK to START, perform all
measurements at each interval step, and then return to PARK.
Park position is where the sonde typically spends most of its time. For example, a profile may
take 45 minutes to complete. So if you configure your system to profile every four (4) hours
that would be six (6) times a day. If the profile takes 45 minutes, then the sonde resides in park
position (idle) for 3 hours and 15 minutes of each profile. So the sonde is idle about 80% of any
given day in this example.
If Profile Wizard is not open, do that next. Either double click on the Profile Wizard icon on
your Desktop; or click on Start | Open | and then Browse to search for YSI Profile Wizard.exe.
The opening screen (welcome screen) is shown below.
Note that there are two options in the welcome screen - Create new station and Modify existing
station. Since you are creating a new station in this example, verify the tick is in the Create box.
If you have a profiling routine defined by name, you may elect to open an existing file to modify
it by using the ‘Modify existing station’ option.
YSI Environmental 669523 Rev B Page 2-5
Page 15

YSI Profiler System USER Manual
Click on New… to view the Save As screen, and then type in a filename for your site. We
recommend creating a new folder for each site configuration. In this example assume that this is
Site 12 on Clark Reservoir. Click the ‘create new folder’ icon in upper right hand corner and
rename the folder ‘Site 12’. Open the new ‘Site 12’ folder and type in ‘CLK Res Site12’ for the
filename … click Save. The “.pfw” file will save in C:\ Program Files\ YSI\ Profile Wizard\
Shared\Site 12\.
YSI Environmental 669523 Rev B Page 2-6
Page 16

YSI Profiler System USER Manual
Once you click on Save the welcome screen reappears, this time with the Next … button active
to proceed to the next step in Profile Wizard. Note also that Units are Metric, which at this time
is the only option. English units (feet) can not be used in your calculations and setup. (One
meter is approximately 3.281 feet). Finally, take note that the directory path and filename you
assigned is shown near the bottom of the screen
Now Click on N
ext > to proceed to one of five ‘General Information Steps’. This is where you
will enter critical information to define your profiling routine. Have your notes on hand before
proceeding.
Information (Steps 1-5)
In the first Step (General Information), you must indicate if you will use a depth sounder or
fixed reference sonde in your operation. In this example assume there is no depth sounder
sensor or fixed sonde in the system. Below are examples of applications where you may choose
using a depth sounder or fixed sonde, including its advantages in those specific applications.
You must also indicate in Step 1 if you have meteorological (MET) sensors or a compass in your
system. If there were a solar radiation sensor, a constant will be provided by YSI. In this
example, assume there are no MET sensors in use.
YSI Environmental 669523 Rev B Page 2-7
Page 17

YSI Profiler System USER Manual
There are three bottom depth options: 1) user-defined; 2) using a depth sounder sensor; and 3)
using a fixed reference sonde. The descriptions and the table below should help you choose the
appropriate setup for your application.
User defined
applications are typically employed when the winch and electronics can be
mounted to a fixed structure. The water level should not change significantly in depth and
extreme bottom monitoring is not important.
Depth sounder
applications are often used to track the bottom of a body of water and adjust the
program to get within a specified distance from the bottom.
Fixed reference sonde
applications are used to track water level and adjust the program to a
specified distance from the bottom, but it is always used with fixed mount winch and electronics.
Type Mounted to Water dynamics Monitoring…
User defined
Pier
Bridge
Slow change in water level Near surface area only
Pilling
Float
Depth sounder
Pontoon
Float
Variable water depth Track bottom
Buoy
Fixed reference
sonde
Pier
Bridge
Pilling
Variable water depth Track water level
YSI Environmental 669523 Rev B Page 2-8
Page 18

YSI Profiler System USER Manual
In Step 2 (Winch Information) you must enter the reel size, cable type and length. The Reel
diameter of the Winch Assembly is 14 inch (35.56 cm) in this system and the Cable type is
Standard. These two questions have default answers at this time. Future options are planned.
The Cable length in this example is 30 meters. You order the cable length that best fits your
application. Typically there is at least one extra meter of cable shipped to allow some amount of
cable to remain on the reel at all times for proper winding. If you order 30 or 50 meter cable,
you will receive at least 33 meters or 53 meters, respectively.
In Step 3 (Site Information) enter your choice of profiling direction; ‘Bottom to Top’ or ‘Top to
Bottom’ profiling. Refer to your notes and you will see that ‘Top to Bottom’ was declared as
the Profiling direction in the example application.
The maximum depth of water in the profiling area is 14 meters. The predetermined park depth
was noted at one (1) meter below the surface. Type in these numbers and proceed by clicking on
N
ext >.
YSI Environmental 669523 Rev B Page 2-9
Page 19

YSI Profiler System USER Manual
Step 4 (Study Information), shown below, deals with defining the actual column length of water
to step through and the time interval at which you intend to monitor.
Since the sonde starts at three (3) meters below the surface and proceeds through five-plus steps,
stopping no further than one (1) meter above the bottom, the actual monitored column of water
is ten (10) meters, start at 3 meters and end at 13 meters below the surface. You must enter the
Start and End depths (relative to the surface
) in the appropriate boxes (see below).
In addition, you must enter the profiling step interval. In this example two (2) meter steps are
used, meaning the cable will complete one set of measurements, then pay out two meters, stop
and repeat these measurements. This will be repeated until it reaches the bottom of the profiling
column (13 meters below the surface). The last step is often less than the defined interval if the
profiling depth is not evenly divisible by the number of steps. In this case 10 meters divided by
2 meter intervals work out to be a whole number.
The Profiles per day are 6, indicating that a profiling routine will be initiated every four (4)
hours beginning with local time of 00:00:00 (midnight). Enter six (6) into the appropriate box.
YSI Environmental 669523 Rev B Page 2-10
Page 20

YSI Profiler System USER Manual
At this point you are ready to move to the next screen to verify specific information in the sonde
menu and then to assign sonde report parameters. However, before moving to these last two
screens, make note of how profile setup screens would differ if a Depth Sounder or a Fixed
Reference Sonde were used to determine sonde vertical position relative to the top or bottom of
the water column. After these examples, Profile Wizard setup screens will be displayed for the
original example application.
Depth Sounder Option
The General Information Step 1 screen would appear as follows, marking the Depth Sounder
with a click of the mouse. Step 2 and Step 3 related to cable/reel and site information,
respectively would remain unchanged. Step 4 takes on a very different look since the final depth
reading is referenced from the bottom. See figures below.
Fixed Reference Sonde Option
The General Information Step 1 screen would appear as follows, marking the Depth Sounder
with a click of the mouse. Step 2 and Step 3 related to cable/reel and site information,
respectively would remain unchanged. Step 4 takes on a very different look since the final depth
reading is referenced from the bottom.
On the next two pages see the differences in setup screens when using the depth tracking options
listed immediately above.
YSI Environmental 669523 Rev B Page 2-11
Page 21

YSI Profiler System USER Manual
NOTE:
Step 2 (Cable/Reel Information) and Step 3 (Site Information) screens would appear the
same as above in the User defined example. Steps 1 and 4 appear differently.
YSI Environmental 669523 Rev B Page 2-12
Page 22
YSI Profiler System USER Manual
NOTE:
Steps 2 (Cable/Reel Information) and Step 4 (Profile Information) screens would appear
the same as above in the Depth Sounder example. Steps 1 and 3 appear differently.
YSI Environmental 669523 Rev B Page 2-13
Page 23
YSI Profiler System USER Manual
Although infrequently used in this way the Fixed Sonde Reference may be positioned on the
bottom of the water column. In this case the Fixed Reference sonde distance is entered as zero
(0). If mounted above the bottom, you will need to determine a true measured distance from
bottom to the “fixed point”. This distance can be determined by lowering the sonde to the
bottom, record the instant depth reading, and then move the sonde to the desired fixed (or
attached) location. You then subtract the two values and enter the result in location (c) on the
screen.
IMPORTANT:
The Fixed Reference Sonde must be set to have only two Report parameters enabled:
Temp in C, and Depth in Meters. They must appear in the order shown and in the
units of measurement shown. Also, do not set date or time.
After completing the above steps for User defined depth, Depth sounder or Fixed Reference
Sonde, click on Next > and you will see a screen that asks you to verify that specific information
in the sonde configuration is entered as stated.
The boxes are not ‘checked’ when the screen appears. You must verify that these sonde
configurations have been set before the Next button becomes active. That is, you can not
proceed until you click on each box. Once you confirm the sonde settings, click N
ext > and
proceed to the final step in defining your profiling routine.
YSI Environmental 669523 Rev B Page 2-14
Page 24

YSI Profiler System USER Manual
In Step 5 (Sonde parameters) you must record in the box on the right all parameters you have
chosen to monitor. You probably have jotted these down in notes. If not, return to the sonde
menu and check the Report setup to make sure you have listed all parameters, in the same order
as in Step 5 of the setup wizard.. Depth in meters is a given, and in fact, is listed by default in
the Sonde report output column. You now click on each parameter and then click Add >> to add
it to the list on the right. You may do this one at a time, or you may press and hold the Control
key (Ctrl) on your keyboard and click on the appropriate parameters in the list on the left. The
Add button becomes active. Click Add >> and the list on the right appears as shown below for
this example. You may now need to rearrange the order of this list to match the sonde Report
setup.
It is essential that the list of parameters you create matches the parameters set in your sonde
(exact parameter, including units chosen and the order listed). For example, SpCond (mS/cm) is
not the same as SpCond (uS/cm) this does make a difference when the CR10X data logger and
sonde communicate during profiling routines. This makes a difference later on during post data
processing
The screen below shows an example list of parameters. There are nine (9) parameters total.
Depth in meters is a requirement. In Profile Wizard there is a maximum of twelve (12)
parameters that you may list, counting Depth in meters as one of the twelve.
IMPORTANT:
The order of parameters listed must match the Report setup in the sonde.
In the following figure Depth (meters) was moved so that it occurs after DO Chrg but before pH.
Parameters may be moved up and down the list by left clicking and dragging up or down.
YSI Environmental 669523 Rev B Page 2-15
Page 25

YSI Profiler System USER Manual
The final screen summarizes all information that you entered. Check this carefully, make
changes if necessary, and then click on Finish to complete the setup of your profile. Note the
parameter ID numbers in brackets just to the left of the parameters; this information will be
imbedded in the data file as Array 88.
YSI Environmental 669523 Rev B Page 2-16
Page 26

YSI Profiler System USER Manual
You should at this time also print the ‘*.rpt’ and ‘*.pfw’ files for your hard copy records. See
Appendix B for examples.
2.3 How the CR10X Executes the Profile Routine
Using Profile Wizard you have now created a profile routine file. In Section 3 you will learn to
send this file to the CR10X data logger using LoggerNet™ software. Once in the CR10X this
program controls the movement of the winch, sonde data collection, and other actions. Prior to
moving to Pre-Deployment checks, and in order to better understand how the ‘controller’
software executes the profile routine, consider the description and example below.
Since a depth sounder was not used in the example above, it will be considered part of the
routine below. In coastal applications, the tide can raise or lower the water level two or more
meters at times. The importance of knowing the total depth of the water column at all times is
essential. In tidal applications the use of a depth sounder is necessary if you intend to monitor
close to the bottom or to the surface.
EXAMPLE & DESCRIPTION OF PROFILE ROUTINE WITH DEPTH SOUNDER
For better understanding of the steps in a profiling routine, consider a new example where the
mean water depth is ten (10) meters and the daily tide is about two (2) meters. Assume the
system has a depth sounder and the Profile Wizard setup has been programmed accordingly.
The use of a depth sounder enables the system to track the overall water depth before the start of
a profile and again during the last 20% of the water column that is being profiled.
Profile Parameters
Profiles per day 4
Step Size 1 m
PARK (relative to surface) 5 m
START (relative to surface) 1 m
END (relative to bottom) 1 m
Top to Bottom Profile
In terms of ‘profile logic’, the CR10X goes through the following steps to ensure that depth and
parameters are measured as intended by the profile program. This is done through RS-232
communications using a serial I/O interface that connects to the CR10X to various sensors and
accessories.
Every six (6) hours starting at 00:00:00 (midnight) the program requests a PARAMeter check
from the sonde. This information is collected to insure that the sonde is operational and the
sonde parameters are unchanged. Once this information is received from the sonde and verified
as correct, the program requests a sonde water depth. The sonde should be in Park position five
(5) meters (+/- 0.2 m) below the surface. The information is collected, and then the overall
depth is measured by the depth sounder. The overall water depth is collected and recorded as a
reference to insure that the sonde will never hit the bottom during the profile.
The program next decides if the PARK to START move distance is greater than two (2) meters.
It turns the motor on to move up or down while monitoring the sonde depth to see how close it is
to the one meter depth (START). In this example the sonde was parked at 5 meters and was
moving up 4 meters to the start position. As a result the “move to” distance is 4 meters. If the
“move to” distance is less than two (2) meters, it calculates the time the motor needs to be
YSI Environmental 669523 Rev B Page 2-17
Page 27
YSI Profiler System USER Manual
powered to travel the required distance. It then powers the motor for the calculated time and
checks again to see if the sonde depth is within the +/- 0.2 meter tolerance. If not, the motor is
powered again until the sonde reaches the specified depth. The rate of movement is 0.1
meter/second, so a “step” may take a couple of minutes to reach its target.
Figure 2-5 Block Diagram: Sonde Control with Depth Sounder
When the sonde reports it is within the START depth position of one (1) meter +/- the tolerance,
it stops to stabilize for 60 seconds and then warms up for the specified DO warm-up time.
Depending on the sonde default DO warm-up time values are set at 40 or 60 seconds. After
about 100-120 seconds have expired, the CR10X sends an SDI-12 command directly to the
sonde to start parameter measurement. When completed, the CR10X stores the sample data in a
designated memory location. Therefore, all data in this memory array are SDI-12 measurements
taken directly from the sonde to the CR10X data logger memory. This array 105 includes the
Julian day, time stamp and sonde data. The time stamp indicates the end (not the beginning) of
the sample collection.
Once the data is stored in CR10X memory, a command turns the motor on for a calculated
period of time. This duration is the time it takes to move the sonde to the next step location (+/the specified tolerance). The sequence described above repeats until the END step is completed.
While profiling up or down the program keeps track of the sonde depth. When it reaches
approximately 80% of the overall water depth, the system checks the depth sounder again and
determines the distance to the bottom. From this point on the program continually checks depth
to insure it can do a full one meter step. Eventually, the step size of one meter is no longer
possible without hitting the bottom. At this point a calculation by the program determines a
partial step (typically 0.3 to 0.8 meters). When this step is completed, the CR10X issues the
command for the sonde to return to PARK position, where it waits for the next profile time.
Since this example location has a tidal influence, the overall depth will change from profile to
profile. The distance and/or steps may be more or less than a previous profile. Because this
sequence started at the surface, all of the steps are referenced from the surface down. The
opposite would be the case when starting at the bottom for a ‘bottom to top’ profile.
YSI Environmental 669523 Rev B Page 2-18
Page 28
YSI Profiler System USER Manual
The data collected into the CR10X memory is then uploaded by LoggerNet™ either as forced
upload or by the LoggerNet™ schedule. The data is archived in ASCII text, comma delimited
format. Profile Data Manager™ software can then be used to view or FTP the data.
Alternatively, you can import the ASCII text data file into a spreadsheet program like Microsoft
Excel® as comma separated values. See Figure 2-6 for example data. Using Excel’s filters you
can then display particular array numbers for quick data analysis. See Figure 2-7 for an example
with Array Number 60 (hourly MET reading). Refer to Appendix G for Data File Array
Descriptions.
99 2006 220 1000 10 5407 0 99 0
88 7 11 124 1 6 12 14 15 96 22 …
6 1 2 7.3 3 7.4 7.86 9 0
105 2006 220 1002 43.5 25.32 45.21 29.24 88.8 6.18 44.1
105 2006 220 1004 35.38 25.43 45.11 29.17 89.9 6.25 43.1
105 2006 220 1006 24 25.63 45.06 29.12 92.1 6.38 43.1
105 2006 220 1008 14.5 25.78 45.05 29.12 93.3 6.45 42
…
…
…
…
99 2006 220 1009 6.125 5407 0 99 0
99 2006 220 1030 9.88 5407 0 99 0
88 711691 61214159622…
6 1 2 7.1 3 7.1 7.56 9 0
105 2006 220 1032 36.88 25.34 45.18 29.22 90 6.26 43.1
105 2006 220 1034 28.63 25.53 45.08 29.15 90.1 6.25 44.1
105 2006 220 1036 27.75 25.76 45.05 29.11 92.5 6.39 43.1
105 2006 220 1038 15.38 25.83 45.05 29.11 93.3 6.44 43.1
99 2006 220 1039 17.38 5407 0 99 0
160 2006 220 1058 29.25 25.45 45.11 29.16 93.3 6.48 44.1
…
…
…
…
…
…
60 2006 220 1100 25.58 54.71 744 1016 5.668 357.7 0
Figure 2-6 Example data file imported into Microsoft Excel®
60 2006 220 1000 24.87 61.16 602.4 1016 5.542 0.68 0 13.76 0 1
60 2006 220 1100 25.58 54.71 744 1016 5.668 357.7 0 13.46 0 1
60 2006 220 1200 26.12 49.13 817 1016 4.021 356.8 0 13.45 0 1
60 2006 220 1300 26.73 44.6 760 1016 4.254 332.2 0 13.57 0 1
Figure 2-7 Example data file filtered for hourly MET data (Array 60)
YSI Environmental 669523 Rev B Page 2-19
Page 29

YSI Profiler System USER Manual
This Page Intentionally Left Blank
YSI Environmental 669523 Rev B Page 2-20
Page 30
YSI Profiler System USER Manual
Equipment Staging – Sonde & Platform
3.1 Introduction
In this section and the following section you will configure your sonde to insure proper
operation with the CR10X data logger, assemble components and connect cables (as required),
and manually verify operation of the Winch Assembly. In Section 4 you will establish
communication between LoggerNet™ and the CR10X and download your Profile Wizard file
with the profiling instructions.
You should proceed through the above mentioned steps in a stable environment if possible. If
you configure and test your profiling system in this manner, you are less likely to make an error
that would cost you valuable time once in the field.
3.2 Setting Sonde Parameters
The Campbell Scientific CR10X data logger program relies heavily on information obtained
from the YSI sonde both prior to the start of a profile, and during a profile sequence. Therefore,
it is imperative that you configure the YSI sonde correctly for successful winch operation. In
this section you will learn how to check for key settings in the sonde. These settings apply
primarily to proper configuration of the Profiler system. If required consult your YSI 6-series
sonde operations manual for more detailed information.
WARNING!
Do not disconnect the sonde from Profiler while it is actively running a profile sequence.
Wait for it to finish, or if necessary, disconnect power to Profiler.
You can access the sonde menu using any terminal emulator program, or if available the YSI
650 MDS handheld monitor. One such terminal emulator program is YSI EcoWatch™.
Common to most Windows-based computers is Microsoft ® HyperTerminal. If you use the YSI
650 make certain that you ‘escape’ all of the way out of the Sonde menu before
disconnecting the YSI 650 from the sonde.
A YSI sonde field cable is needed for connection to the YSI 650 MDS. A RS-232 cable with
MS-8 connector will be needed to connect from your PC COM port to the YSI sonde (YSI Part #
6067). An adapter may be needed, and in some cases a power supply if the sonde is not powered
by batteries. Refer to your 6-series sonde manual for cable connection details.
In the example below, a terminal emulator connection is described. Once you establish a
connection with the sonde you should see the # sign. You may type ‘ver’ <ENTER> to display
the version number of the sonde software; and in a similar manner, Esc to # and type ‘reset’
<ENTER> to display more detailed information about the sonde model and version number.
Refer to the displays below. Your sonde version number must be 2.25 or higher
.
YSI Environmental 669523 Rev B Page 3-1
Page 31

YSI Profiler System USER Manual
# ver
2.25
# reset
OK
YSI Water Quality Systems Model 6600
Version 2.25 07-01-2004 15:00:58
Copyright (c) 1992-2003 YSI Incorporated.
All rights reserved.
At the same # prompt type
Main menu.
-----------------Main-----------------1-Run 5-System
2-Calibrate 6-Report
3-File 7-Sensor
4-Status 8-Advanced
‘MENU’ <ENTER> to access the sonde menu. You should now see the
To navigate the menus, type ‘0’ or “Esc” to move back to previous levels, or type the number of
the submenu you desire to enter. In this section you will want to check, and possibly change,
settings in the Advanced, Sensor, Report, System and Status submenus. The displays below lead
you through the exercise of accessing each of these menus to check settings. Relevant
comments along the way should help you prepare your sonde for connection to Profiler.
First, check Sensor by typing in ‘7’. Remember that you may need up to twelve (12) sensors in
your setup. This depends on your sonde model and your profile. Sensors that are enabled have
an asterisk to their left. Verify that these are the measurement sensors that you need for your
profile routine. To enable or disable a sensor, type the character to the left of the name (1-9, AJ), making certain that an asterisk appears if you want that sensor enabled.
Under the sensor menu Time may be enabled
. However, in the Report menu, time and date must
be disabled to work with YSI Profiler. See more information below. Note also that the Pressure
sensor is present and enabled. This is the sensor that is used in measuring depth. A depth sensor
is required in the YSI Profiler application. Now type ‘0’ to return to the Main menu.
-----------------Main-----------------1-Run 5-System
2-Calibrate 6-Report
3-File 7-Sensor
4-Status 8-Advanced
Next, select 6-Report to view the parameters, including the units of measurement that you have
chosen. Make note of the three highlighted parameters. In the setup of the profiling routine,
both date and time must be disabled
. In addition, Depth in meters must be enabled. Profiler
software does not calculate properly when depth is set in feet. Double-check to make certain
that you have set these parameters as required. Now take a look at other parameters that are
enabled to be reported. Are these the parameters that you have chosen for your profiling
routine? If not, now is the time to change them. There is a maximum of twelve (12) parameters
for display and depth must be one of them. Another useful parameter to report is Battery volts.
YSI Environmental 669523 Rev B Page 3-2
Page 32

YSI Profiler System USER Manual
Since you depend on power to the sonde for proper calibration and measurements in the field,
we recommend this in the report choices.
-------------Report setup-------------1-( )Date B-(*)DOchrg
2-( )Time hh:mm:ss C-( )Press psig
3-(*)Temp C D-(*)Depth meters
4-(*)SpCond mS/cm E-(*)pH
5-(*)Cond mS/cm F-(*)pH mV
6-( )Resist G-(*)Turbid+ NTU
7-( )TDS H-(*)Chl ug/L
8-(*)Sal ppt I-(*)Fluor %FS
9-( )DOsat % J-(*)Battery volts
A-(*)DO mg/L
Next, type ‘0’ to return to the Main menu, and then select 5-System to check on the SDI-12
address. The sonde SDI-12 address must be set to 0 in order to communicate with the Profiler.
-----------------Main-----------------1-Run 5-System
2-Calibrate 6-Report
3-File 7-Sensor
4-Status 8-Advanced
-------------System setup-------------1-Date & time
2-Comm setup
3-Page length=25
4-Instrument ID=99F0932 AA
5-Circuit board SN:0001066E
6-GLP filename=0001066E
7-SDI-12 address=0
8-Language:English
While you are in System menu, check 2-Comm setup to make certain that the parameters Auto
baud and 9600 baud rate are enabled. Once you verify this, type ‘0’ two times to back out to the
Main menu.
--------------Comm setup--------------1-(*)Auto baud 5-( )2400 baud
2-( )300 baud 6-( )4800 baud
3-( )600 baud 7-(*)9600 baud
4-( )1200 baud 8-( )19200 baud
YSI Environmental 669523 Rev B Page 3-3
Page 33

YSI Profiler System USER Manual
-----------------Main-----------------1-Run 5-System
2-Calibrate 6-Report
3-File 7-Sensor
4-Status 8-Advanced
Next, select 4-Status to make certain that the sonde is not set for logging. Item number seven
should read Logging: Inactive
. Check your sonde manual for details on turning off the logging
activity, or see below during the final sonde menu checks. Normally the active logging
parameter would not be set.
----------------Status----------------1-Version:2.25
2-Date=11/17/05
3-Time=16:24:36
4-Bat volts:12.3
5-Bat life 20.0 days
6-Free bytes:295424
7-Logging:Inactive
Note that battery voltage for the sonde is 12.3 volts and has an expected battery life of more than 20 days
based on parameters that are set. Although you see Date and Time in this screen, this does not necessarily
mean that Report setup has date and time enabled. You confirmed that these parameters were turned off
when you displayed the Report setup menu above.
Next, type 0 to return to Main menu.
-----------------Main-----------------1-Run 5-System
2-Calibrate 6-Report
3-File 7-Sensor
4-Status 8-Advanced
Type 8-Advanced, to view a submenu that takes you into a variety of settings from calibration
constants to timing of activities. In addition to checking some of the timing settings, it is
important to verify that the Auto sleep function is enabled. This is one of the requirements of
monitoring in the Profiler routine.
---------------Advanced---------------1-Cal constants
2-Setup
3-Sensor
4-Data filter
YSI Environmental 669523 Rev B Page 3-4
Page 34

YSI Profiler System USER Manual
------------Advanced setup------------1-(*)VT100 emulation
2-( )Power up to Menu
3-( )Power up to Run
4-( )Comma radix
5-(*)Auto sleep RS232
6-(*)Auto sleep SDI12
7-( )Multi SDI12
8-( )Full SDI12
Note that both RS232 and SDI12 Auto sleep functions are enabled. If not, change these settings
by typing the number of the function to toggle on or off the asterisk. Next, return to the
Advanced menu and then type 3-Sensor.
---------------Advanced---------------1-Cal constants
2-Setup
3-Sensor
4-Data filter
Note in the Advanced sensor screen below that DO warm up time is set to 60 seconds, which is
the appropriate setting for the profiling routine. Since there are sensors with wiping mechanisms
in this sonde, keep in mind that the SDI12-M/wipe=1 means that the sensor will wipe before
each reading (turbidity or chlorophyll). If you set this number to two (2), a wipe will occur
before every other measurement. Choose the number appropriate for your water conditions.
------------Advanced sensor-----------1-TDS constant=0.65
2-Latitude=40
3-Altitude Ft=0
4-DO temp co %/C=1.1
5-DO warm up sec=60
6-( )Wait for DO
7-Wipes=1
8-Wipe interval=5
9-SDI12-M/wipe=1
A-Turb-6136 temp co %/C=0.6
B-(*)Turb-6136 spike filter
C-Chl temp co %/C=0
Next, make a quick check of other Advanced settings, specifically Data filter Cal and constants.
Type ‘0’ to return to Advanced.
---------------Advanced---------------1-Cal constants
2-Setup
3-Sensor
4-Data filter
YSI Environmental 669523 Rev B Page 3-5
Page 35

YSI Profiler System USER Manual
Select 4-Data filter, then select 3-Time constant… The time constants should resemble those
shown below for Turbidity and Chlorophyll sensors at 12 seconds, while Other defaults to 4
seconds.
-----------Data filter setup----------1-(*)Enabled
2-( )Wait for filter
3-Time constant...
4-Threshold...
-------------Time constant------------1-Turbid=12
2-Chl=12
3-Other=4
Return to Data filter setup and select 4-Threshold…
-----------Data filter setup----------1-(*)Enabled
2-( )Wait for filter
3-Time constant...
4-Threshold...
---------------Threshold--------------1-Turbid=0.01
2-Chl=1
3-Other=0.001
The above readings are typical and appropriate for the profiling routine. Please see the sonde
manual for additional information on this and other advanced settings. Next, type ‘0’ two times
to return to the Advanced menu.
---------------Advanced---------------1-Cal constants
2-Setup
3-Sensor
4-Data filter
Cal constants are shown in the next screen. For the sensors enabled the constants should appear
similar in value to those seen in this screen.
YSI Environmental 669523 Rev B Page 3-6
Page 36

YSI Profiler System USER Manual
-------------Cal constants------------1-Cond:4.99584
2-DO gain:1.01064
3-Pressure offset PSI:0.011
4-pH offset (pH-7)*K:19.7162
5-pH gain (pH-7)*K/mV:-5.12062
6-Turb-6136 Offset:7.01061
7-Turb-6136 A1:122.378
8-Turb-6136 M1:125.241
9-Turb-6136 A2:244.757
A-Turb-6136 M2:250.482
B-Chl Offset:-1.88556
C-Chl A1:100
D-Chl M1:69.9475
E-Chl A2:200
F-Chl M2:139.895
G-Fluor Offset:-0.44621
Type ‘0’ to back out to the Main menu.
-----------------Main-----------------1-Run 5-System
2-Calibrate 6-Report
3-File 7-Sensor
4-Status 8-Advanced
Now type 1-Run to view the Run setup options and then type 1-Discrete sample.
---------------Run setup--------------1-Discrete sample
2-Unattended sample
When you type 1-Start sampling you will now be able to view data from sonde sensor
measurements. Evaluate your data based on where the sonde resides at this time (air, bucket,
environmental water). Regardless of readings you can confirm that all sensors are working and
the sonde is actively measuring parameters in the correct units.
------------Discrete sample-----------1-Start sampling
2-Sample interval=0.5
3-File=
4-Site=
5-Open a file
Several lines of results are shown in the screen below.
YSI Environmental 669523 Rev B Page 3-7
Page 37

YSI Profiler System USER Manual
===============================================================
Temp SpCond Cond Sal DO DOchrg Depth pH pH Turbid+ Chl Fluor Battery
C mS/cm mS/cm ppt mg/L meters mV NTU ug/L %FS volts
----------------------------------------------------------------------------------------*** 1-LOG last sample 2-LOG ON/OFF, 3-Clean optics ***
Stabilizing:4 3 2 1
16.93 0.001 0.001 0.00 8.35 53.2 0.000 1.77 300.2 428.2 0.2 0.0 12.3
16.92 0.001 0.001 0.00 8.35 53.1 0.000 2.04 284.9 428.2 0.2 0.0 12.3
16.91 0.001 0.001 0.00 8.36 53.2 0.000 2.19 276.4 428.2 0.2 0.0 12.3
16.91 0.001 0.001 0.00 8.36 53.1 0.000 2.36 266.9 428.1 0.2 0.0 12.3
16.91 0.001 0.001 0.00 8.36 53.2 0.000 2.47 260.7 428.1 0.2 0.0 12.3
16.91 0.001 0.001 0.00 8.36 53.2 0.000 2.56 255.6 428.1 0.2 0.0 12.3
Type 2-Stop sampling to discontinue sampling data, then type ‘0’ several times until you return
to Main menu, and then finally to the # sign. You have now exited the sonde menu and you may
now disconnect the sonde from the cable to the PC.
-----------------Main-----------------1-Run 5-System
2-Calibrate 6-Report
3-File 7-Sensor
4-Status 8-Advanced
# xxxxxxxxxxxxxxxxxxxxxxxxxxxxxxxxxxxxx
You have now completed checking the YSI sonde for proper configuration. In addition, you have
become generally familiar with all submenus in the sonde Main menu. If you have yet to
calibrate the sonde, refer to your sonde user manual and use the 2-Calibrate function to enter the
submenus to complete this operation.
Once calibration setup is complete ensure
the sonde has new batteries installed and the
sensor guard has the provided standard
weight attached. The top of the weight,
inside the sensor guard, should be painted
black to ensure proper operation of the
optical sensors. Refer to Figure 3.1.
Figure 3-1 Sonde Sensor Guard with
standard weight
NOTE:
Sonde must be equipped with provided sonde weight for the YSI Profile system to work
properly.
YSI Environmental 669523 Rev B Page 3-8
Page 38

YSI Profiler System USER Manual
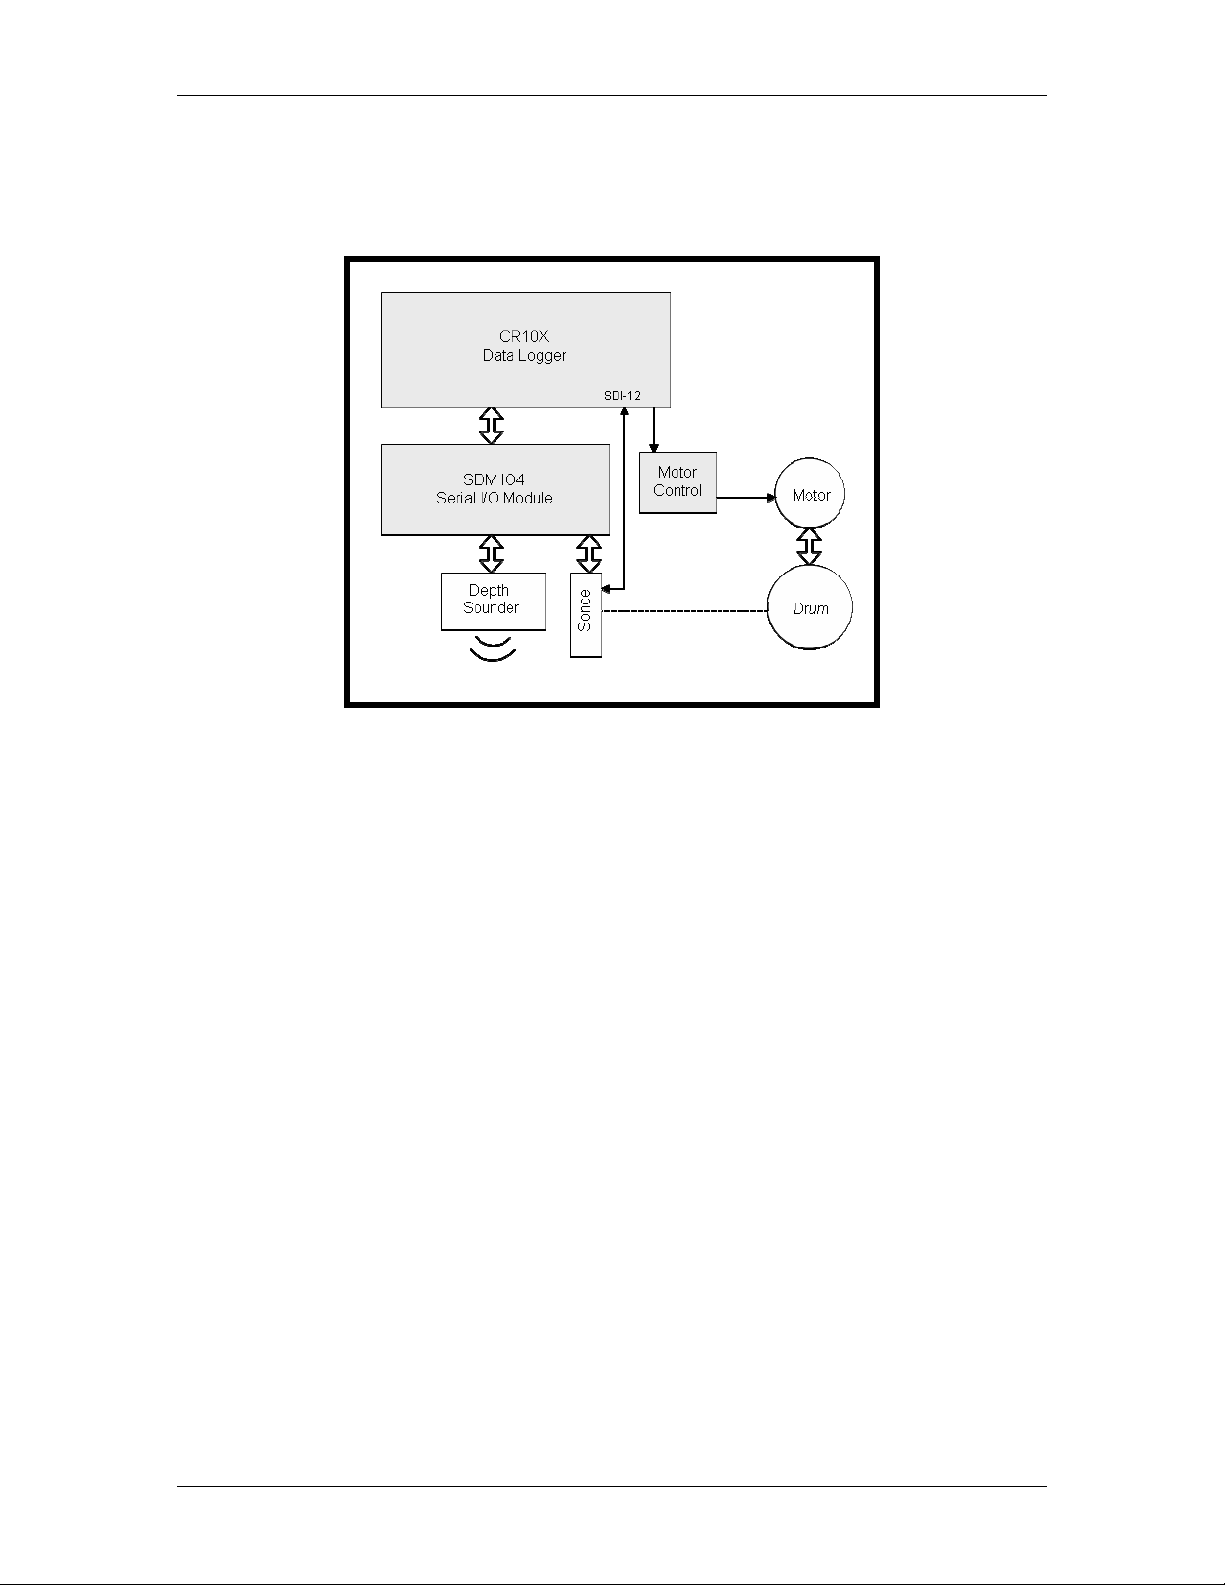
3.3 Connecting and Checking Profiler Components
The YSI Profiler Platform block diagram in Figure 3-1 depicts the major components in the
system. Except for the PC, all components are located on the floating platform. In gray boxes
are the Controller components, in addition to communication and power devices. These are all
located within the waterproof PVC cylindrical housing.
Figure 3-2 Block Diagram – YSI Profiler System
Now refer to the figures on the next several pages. The Winch Assembly, including drive motor,
is mounted on the bow side of the T-frame, while the Controller Assembly is mounted on the
stern side of the T-frame (See Figures 3-2, 3-3, 3-4). The battery and solar regulator are housed
in a separate waterproof compartment on the stern side of the float deck, just below the
Controller (Figure 3-6). Meteorological sensors, antenna, beacons and miscellaneous devices
may be mounted elsewhere on the platform, as determined by the configuration that you ordered.
The solar panels are mounted on both bow and stern faces of the two covers that protect all of
the assemblies (See Figure 3-9).
See Figure 3-2 below for a photograph of the floating platform during final assembling and predeployment testing.
YSI Environmental 669523 Rev B Page 3-9
Page 39

YSI Profiler System USER Manual
Figure 3-3 YSI Profiler Platform inside during Pre-Deployment Checkout
Figure 3-4 Winch Assembly mounted to T-frame; Winch motor to right of drum
The sonde cable from the controller connects to the drum on the left side in Figure 3-3 (not
visible in photo); while the winch motor/gear assembly is mounted to the right side. The orange
sonde cable routes through the opening in the deck. A diamond screw helps guide cable to wind
evenly on the drum. The cable passes through a V-roller suspension assembly that helps to
prevent possible snags or tangles as the sonde pays out or reels in during profiling.
YSI Environmental 669523 Rev B Page 3-10
Page 40

YSI Profiler System USER Manual
Figure 3-5 PVC Electronics Housing, correct orientation
The mounting orientation of the pressure case is critical when an internal compass is installed.
Figure 3-4 shows the correct orientation with the magnetic switch located at 11 O’Clock when
looking at the faceplate. Another easy orientation check is to make sure the antenna connector
(see white cap in Figure 3-4) is the closest connector to the T-Frame back plate. A secondary
benefit to this orientation is that the internal modem lights (if installed) will be perpendicular to
the deck for easy viewing (back side of housing).
Figure 3-6 PVC Electronic Housing; Port Locations
1
The T-frame Assembly should arrive largely assembled. You and/or your YSI representative
will need to mount the T-frame to the float deck. The Winch Assembly faces the bow of the
1
Port J6 in Fig 3-5. A second sonde connector may appear on this housing if a fixed reference sonde
(attached sonde) is used to establish depth relative to the bottom of the water column.
YSI Environmental 669523 Rev B Page 3-11
Page 41

YSI Profiler System USER Manual
float and the motor power cable connects to J2 of the Controller Assembly. The PVC cylindrical
housing (Controller Assembly) and the battery enclosure face the stern of the float. Depending
on your configuration, there may be several components that were disconnected and packaged
for safe shipping. You will need to make these connections to complete the assembly, however,
do not connect power to the system until you read the procedure in the next subsection below.
CONNECT POWER TO SYSTEM
Insure that the battery enclosure is secured to the T-frame and then install the battery. Measure
the battery voltage and confirm that it is charged. The voltage should be at least 12.0 VDC.
CAUTION!
Observe polarity when making power connections! Red to red. Black to black.
Connect the red and black leads from the Solar regulator (housed inside the battery enclosure) to
the battery posts. RED TO RED, and BLACK TO BLACK.
Figure 3-7 Battery and Solar Regulator: Connections
Next connect the Battery power cable to the PVC-housed Controller Assembly, J4 port
connector. This is a 3-pin connector. Then connect the Winch motor power cable to the
Controller Assembly, J2. This is a 4-pin connector. See Figure 3-7 below.
YSI Environmental 669523 Rev B Page 3-12
Page 42

YSI Profiler System USER Manual
Figure 3-8 Connect Winch Motor Cable to Controller (J2)
VERIFY WINCH OPERATION
First, verify that the motor power cable is connected to J2 of the Controller Assembly. After you
make the battery power connection to the controller, use the special magnetic slide switch to test
if the winch will pay out and reel in when the switch is activated. Placing the magnet side down
in the groove should result in movement of the winch drum. You should hear a click from the
relay contacts. The winch drum should move. Next slide the switch in the groove to control
direction of the cable movement. The sonde need not be attached for this test. To stop winch
movement, pull the magnetic slider away from the groove. This manual test verifies winch
movement. If the winch does not behave as described above, check all connections, check
battery voltage and repeat the procedure.
Figure 3-9 Magnetic Slide Switch to Test Winch System
YSI Environmental 669523 Rev B Page 3-13
Page 43

YSI Profiler System USER Manual
Figure 3-10 Housing with Solar Panel (one of two that mounts to T-frame)
CHECKING & Connecting OTHER COMPONENTS
SONDE
If you do not have the YSI sonde prior to receiving the YSI Profiler System, you will receive
your sonde separately. The YSI sonde pre-deployment configuration was described in Section
3.2, Setting Sonde Parameters. If not yet configured, you can easily check it with the YSI 650
MDS. Alternatively, you may use a PC and terminal emulator program as described in the
previous section. IMPORTANT: The sonde must be configured to work with the Profiler. If you
skipped the configuration steps, take time to read Section 3.2
Figure 3-11 Checking Sonde Configuration during Equipment Staging
ANTENNA
YSI Environmental 669523 Rev B Page 3-14
Page 44

YSI Profiler System USER Manual
The antenna will typically be shipped with the Profiler T-frame assembly. The antenna cable
will already be connected to the Controller System, Port J5 as shown in Figure 3-5. Unpack and
reattach the antenna base to the top plate of the T-frame. Mounting holes and hardware are
included.
Figure 3-12 Remounting the Cellular Antenna during Equipment Staging
DEPTH SOUNDER (optional)
The Depth Sounder is a sensor that periodically confirms water depth as directed by the profiling
program downloaded to the Campbell CR10X data logger. The sensor unit, if ordered, will be
mounted to the platform deck and the cable will be plugged into Port J6 on the Controller
Assembly (PVC cylindrical enclosure). Check to make certain the sensor unit is securely
fastened and the cable is appropriately routed and connected.
METEOROLOGICAL SENSORS (optional)
Some or the entire MET suite of sensors may be mounted to your Profiler System. Check that
the sensors you ordered are present and mounted. Some sensor units will need to be remounted
if they were separately packed for shipping. The MET suite cabling will typically require a PVC
breakout box to connect cables from separate units. One cable then plugs into Port J7 (installed
as needed) of the Controller Assembly. The cabling should be in place. Insure secure mounting
of sensor units and proper routing and connection of all cables. Live testing will be described
prior to final deployment.
Unless you have additional options for your Profiler platform, such as beacons or other optional
equipment, the indoor staging procedure is complete. The next step will be to setup and connect
the CR10X in the Controller Assembly via direct and/or wireless connection using the
LoggerNet™ software.
YSI Environmental 669523 Rev B Page 3-15
Page 45

YSI Profiler System USER Manual
This Page Intentionally Left Blank
YSI Environmental 669523 Rev B Page 3-16
Page 46

YSI Profiler System USER Manual
Section 4
Equipment Staging – PC / CR10X Communication
4.1 Introduction
You will now open LoggerNet™ and set up a connection between your PC and the CR10X data
logger. You will also set up your modem. Finally, you will proceed to download the program
(*.dld) that you created with YSI Profile Wizard. Communication with the CR10X will allow
you to perform important pre-deployment tests before locating the Profiler at a monitoring site.
To connect your PC to the CR10X (housed within the Profiler Controller Assembly) you will
need a Diagnostic Cable (provided with your system). One end is a 9-pin standard RS-232
connector; the other connector fits the Diagnostics port (J3) of the Controller. In addition, you
will learn to use LoggerNet™ to set up modem communication using the Setup function. The
most commonly used means of wireless communications in this system are either a cellular
modem or an IP address. Refer to your LoggerNet manual for detailed instructions. Below you
will see a sample setup.
You should proceed through the above mentioned steps in a stable environment if possible. If you
configure and test your profiling system in this manner, you are less likely to make an error that
would cost you valuable time once in the field.
4.2 Setting Up Communication from PC to Station (CR10X)
Use this section in conjunction with the LoggerNet™ manual. After installation, LoggerNet™
will appear in the Programs folder of the Start Menu or as an icon on Windows Desktop.
Double click the LoggerNet™ icon to open the following window.
Click Setup (far left button above) to open the Setup screen shown below. At any time you may
click the Undo button to reverse changes you have made.
Now proceed with the setup.
YSI Environmental 669523 Rev B Page 4-1
Page 47

YSI Profiler System USER Manual
SET UP MODEM CONNECTION
Use the Add Root… button and the Add… button on the Setup screen to ‘build’ a
communications tree in the left field of the screen. As you see below you begin with
ComPort_1. Highlight the port, click on A
screen, and then click on a device (PhoneBase). Click on A
You just established the first link in the communications setup. Notice at the bottom of the
screen it reads ‘Connect a PhoneBase to ComPort_1’.
dd… (green plus sign) to show the Add Device
dd Now… and the ‘tree grows’.
If multiple ComPorts are shown under Place to Add Device (right field on screen), then click the
port location you prefer before clicking A
YSI Environmental 669523 Rev B Page 4-2
dd Now. Click the Close button.
Page 48

YSI Profiler System USER Manual
The Setup screen now appears as shown below. It shows PhoneBase under ComPort_1 in the
left field (see tree diagram on next page). The software will automatically select Modem Type
to be <default modem>. Click the down arrow to the right of the field to change modems as
appropriate for your system.
Ensure that Communications Enabled is checked. To edit the modems available, click the Edit
Modem Database.... button. Set the Maximum Baud Rate to 9600 and the Extra Response
Time to 5 sec. Click Ap
ply to confirm any changes.
Now, click to highlight PhoneBase in the left field (tree) and click the A
dd… button just as
before to proceed with your setup.
YSI Environmental 669523 Rev B Page 4-3
Page 49

YSI Profiler System USER Manual
Now highlight PhoneRemote. Note that PhoneBase is now in the ‘Place to Add Device’. Click
the A
dd Now… button and then click Close to complete this step. Enter the Delay1 (ms) and
the appropriate phone number for your connection, then click on the Ap
ply… button.
1
5 ms is an appropriate delay time for the YSI Profiler system
YSI Environmental 669523 Rev B Page 4-4
Page 50

YSI Profiler System USER Manual
The final step is to connect the PhoneBase to the CR10X device listed in the pop-up screen. As
before, with PhoneBase highlighted, click on Add… (green plus sign) to complete the tree for
modem communications.
IMPORTANT:
Only one CR10X can be assigned to a PhoneRemote at a given time.
NOTE:
In the screen above, both ComPort_1 and PhoneRemote are choices to add the CR10X.
For direct line communications this is an option with a Diagnostics Cable.
YSI Environmental 669523 Rev B Page 4-5
Page 51

YSI Profiler System USER Manual
As you can see in the screen below you now have a path from PC to data logger represented by a
tree. Next you will enter or confirm some timing information.
Under the Hardware tab, ensure that Communications Enabled is checked.
Adjust the Maximum Time On-line and Extra Response Time to the desired interval (10 minutes
ON; 0 sec Extra).
Set the default Maximum Packet Size to 2048, and the Maximum Baud Rate to 9600.
More information regarding the Security Code and Call-Back ID can be found in the LoggerNet
user manual. Click the A
pply to confirm changes.
YSI Environmental 669523 Rev B Page 4-6
Page 52

YSI Profiler System USER Manual
You are now ready to move to the Schedule tab to enter information on collection intervals,
retries and related scheduling parameters. Your left field tree should remain with CR10X
highlighted. It is customary to rename ‘CR10X’ to something that helps you identify this field
station. Use the Ren
ame button or simply highlight the box and rename your station.
Although unchecked in the screen below, you would check the Scheduled Collection Enabled
box to set up automated data collection.
When using scheduled collection, set the Base Date & Time, Collection Interval, Primary Retry
Interval, and Number of Primary Retries (defaults shown below of one minute collection
interval, 5 minutes on retry interval, and 3 retries).
If you choose to use Secondary Retry Interval, check the box and set the interval in the field to
the right (1 day in this example).
Now check Collect Ports and Flags. This allows you to collect troubleshooting information.
Ports and Flags will be explained in more detail in the next section of this manual. Click A
to confirm changes. If required, click A
pply to other stations to confirm configurations to any
pply
other profilers on the system. In this example, there is just one CR10X.
Under the Final Storage Area 1 (FS Area 1) tab change the Output File Name (and path) from
the default value (shown below) to the station filename assigned when the DLD file was created.
YSI Environmental 669523 Rev B Page 4-7
Page 53

YSI Profiler System USER Manual
In addition, save this new DAT file to the same directory where the DLD file is located. For
example, if the station filename assigned during Profile Wizard setup was GSI-lab600.dld, then
the final storage filename would be GSI-lab600.dat; and it would be stored in the same directory
as the DLD file.
To learn more about information under the tabs Final Storage Area 1, Final Storage Area 2, and
Clock you should refer to you LoggerNet user manual.
Once all changes are made, click on the A
pply button to confirm changes. After confirming
changes, click on the X at the upper right of the window to close the setup screens.
YSI Environmental 669523 Rev B Page 4-8
Page 54

YSI Profiler System USER Manual
CONNECT PC TO CR10X DATA LOGGER
In the example below let us assume that you correctly set your connection path (see above) and
the profiling routine that you created with Profile Wizard resides in a directory. The remote
station is Clark Reservoir Site 12, which was defined in Section 2 of this manual. You have
renamed the CR10X station to be GSI-lab600 and there is a DLD file in the Profile Wizard
Shared directory (or site specific folder) by this name. You are able to directly connect
ComPort_1 to the data logger by the Diagnostic Cable and you are set to test the remote
connection via IP address information that was set in LoggerNet Setup.
Open the LoggerNet™ tool bar window. Click on the C
Screen.
onnect button to open the Connect
YSI Environmental 669523 Rev B Page 4-9
Page 55

YSI Profiler System USER Manual
Note that GSI-lab600 now appears with YSI Direct as CR10X options in the left field of the
screen. Highlight GSI-600lab. Assume the phone base is directed to an active cellular modem
or IP address.
Now click the C
onnect button. The image of ‘two cables aligned and ready to connect’ appears
in the lower left field. A space remains between the two connector images until the
communication link is established. Activity begins during dialing and then the connection
closes with a successful connection.
The button reading Connect changes to read Disconnect after the connection is completed.
Clock time may differ, but you can synchronize the station time to the PC time using the Set
Station Clock
button.
Note in particular that both the Data Collection and Program buttons are now active. If you have
not yet sent your DLD program that defines the profiling routine to the CR10X, then the S
end
button can be used to do this. If the DLD program has been sent, you may click on the Collect
N
ow button to query the data logger for information and data.
You will learn more about Ports and Flags in the next section of this manual.
Let us assume that you need to send the DLD program to the CR10X. Refer to instructions
below.
YSI Environmental 669523 Rev B Page 4-10
Page 56

YSI Profiler System USER Manual
4.3 Downloading Profile Program to Station
Before deployment, the file you created from YSI Profile Wizard must be sent to the profiling
system for proper system data collection to occur. Under the Program section you may see the
default setting (-Unknown-‘) if no program exists in the data logger. Click the S
You should now see a browse window open that allows you to locate the *.dld file that you
created in Profile Wizard. The file contains the information for the profiling routine, and must
be downloaded to the CR10X.
end button.
In the browse window, locate the folder where you saved the .dld file during the Profile Wizard
setup. The default directory is C:\ Program Files\ YSI\ Profile Wizard\ Shared. The .dld file will
have the same name as the station location created initially with Profile Wizard. Highlight the
file that will appear under Shared and click Open. The following warning should appear.
YSI Environmental 669523 Rev B Page 4-11
Page 57

YSI Profiler System USER Manual
Click OK to initiate the transfer of the file to the CR10X. This may take a couple of minutes. A
status screen appears showing you the status of the transfer and then the completion of
compiling of the program. After this a screen appears confirming that the file has been
‘downloaded to the station’ (CR10X).
Click OK to continue.
YSI Environmental 669523 Rev B Page 4-12
Page 58

YSI Profiler System USER Manual
The screen will now show the current Profiler setup filename under Program in the Connect
Screen window. The filename used in this example was GSI-lab600.
You have now successfully established communication between the PC (LoggerNet) and the
Station (CR10X data logger, residing within the Controller Assembly of the Profiler system.
In Section 5 you will perform pre-deployment tests that will test your system and prepare you
for taking a fully operational system to the field site.
YSI Environmental 669523 Rev B Page 4-13
Page 59

YSI Profiler System USER Manual
This Page Intentionally Left Blank
YSI Environmental 669523 Rev B Page 4-14
Page 60

YSI Profiler System USER Manual
Section 5
Pre-Deployment Testing
5.1 Setting Up LoggerNet™ for System Testing
In this section you will use LoggerNet™ control of the CR10X profiler program to test various
components of the Profiler System prior to deployment activities. The following components
will be tested, unless the component is optional and not present.
Sonde response (RS-232 and SDI-12)
Winch motor control
Depth sounder or Fixed reference sonde
Compass
Meteorological sensors
Communications
Before proceeding you should review operation of the Campbell Scientific CR10X Data Logger
and LoggerNet™ application software. Review the LoggerNet™ Quick Start Guide, and if
necessary, the LoggerNet™ user’s manual.
The procedure in this section assumes that you have completed LoggerNet™ Station
configuration and setup. If not, then refer to information in previous sections of this manual. In
particular, verify that the YSI 6-series sonde is set up as specified in Section 3.2, Setting Sonde
Parameters. Verify that the sonde is
Not set to log in Unattended Mode
Not set to report date and time in Report setup
Is set to SDI-12 address = 0
Is set to report depth in meters
Refer to Section 3 of this manual if you need to verify any of the above sonde parameters.
YSI Environmental 669523 Rev B Page 5-1
Page 61

YSI Profiler System USER Manual
Start LoggerNet. With the LoggerNet Toolbar on the screen, click on C
Connect Screen. From this screen click to highlight the Station (GSI-lab600)
the C
onnect... button near the cable icons (bottom left).
onnect to open the
1
, and then click on
Disconnect for now. Resume this operation in Section 5.2
NOTE:
If a station is not set up, return to Section 4 of this manual and refer to the LoggerNet
manual to set up a station.
1
Note in this example, GSI-600lab has been previously downloaded as seen in the Program
field.
YSI Environmental 669523 Rev B Page 5-2
Page 62

YSI Profiler System USER Manual
PORTS, FLAGS AND NUMERIC DISPLAYS
There are several windows in LoggerNet that you should now open. From the Connect Screen
you can open the Ports and Flags window. The Ports and Flags window depicts the status of
various functions and is interactive in that you can click on the circular icons to turn ON/OFF
various functions. The Numeric Display windows provide a table of cells where information on
the status of parameters, operations, memory locations and the like are displayed. All of these
windows may be displayed together at one time on your Desktop.
From the Connect Screen within Data Displays (bottom center) click on the P
orts and Flags…
button to open the Ports and Flags window (see screen below). You will use this window and
your mouse to turn functions ON and OFF in many of the tests later performed in this section.
The circular icons respond to mouse clicks. Green is ON (high) and blank is OFF (low). None
of the ‘switches’ shown below are active in this image.
Try to become familiar with the descriptions below at each Port and Flag location. This will be
helpful when you begin pre-deployment testing. YSI recommends entering these custom Port
and Flag names to help clarify the purpose of each. Click on the Port/Flag name field and type
in the custom names below. These will be retained the next time you open the Ports and Flags
dialogue.
YSI Environmental 669523 Rev B Page 5-3
Page 63

YSI Profiler System USER Manual
Within Data Displays, and just to the right of Numeric, click on the 1… button to open a blank
Numeric Display window. This window has three pairs of columns where you choose from a
pop-up list of memory locations that represent parameters or functions you would like to
monitor. The gray cells hold abbreviated descriptions, while the white cells exhibit values. An
example is shown below.
You will use the numeric display tables to assist in testing and/or troubleshooting the system.
Once you prompt actions, you can quickly visualize the profiler operation from the values in the
cells. When you first establish connection the values for each cell are typically blank, but fill in
once program execution begins, either by program or by prompting actions.
You build a Numeric table by highlighting a gray cell. When you click on the A
dd… button a
pop-up screen containing both Ports and Flags, and Memory locations will appear (see below).
Choose one of the options. Scroll and tag the location you want then ‘paste’ it into the cell(s) by
using the P
YSI Environmental 669523 Rev B Page 5-4
aste button. You may tag several locations at once to paste them into a particular
Page 64

YSI Profiler System USER Manual
column. It is customary to begin at the top left of the Display, but you have the option to choose
any cell in any order. You will find that it takes some time to become familiar with the
abbreviations, and the list of options is quite lengthy. The options chosen below will suit most
of your needs for pre-deployment testing. Become familiar with those in the Numeric Display
above for now and explore further parameters on the list as you have time.
See the Numeric Display table below. The pop-up list that offers a list of entries appears when
you click and highlight a specific gray cell and then click on the A
dd… button.
You may open up to three numeric displays at the same time. In the example above all of the
necessary information has been displayed on one numeric display (one window). Notice that
values are shown in the white cells to the right of the parameter. The interpretation of some of
these values will be used in the descriptions below.
Select only a few of the _SDI locations (_sdi_#), 12 locations maximum. If Meteorological
sensors are an option, select these as well. However, do not over-select since the data logger
may not be able to display all of the locations once the profile program starts. You may
experience a loss of connection in this case. If you lose the connection, the program continues to
execute, however, you will not see the updates.
Note that there are many parameters available to build the Numeric Displays. Of particular
interest in depth profiling using a YSI sonde are the sonde parameter ID numbers
2
See Appendix D in this manual for a complete list of these parameters.
YSI Environmental 669523 Rev B Page 5-5
2
.
Page 65

YSI Profiler System USER Manual
5.2 Testing
You are now ready to reconnect the CR10X and begin testing components of the Profiler
system. Do the following and verify that ports and flags behave as described below.
1. If necessary, power up the CR10X (Controller Assembly connector).
2. Wait about 10 seconds, and then press the C
3. If the CR10X was previously programmed, wait another 30 seconds for Flag 1 and Flag 2
to turn ON (green lights appear in icons).
4. Flag 1 will turn OFF after the CR10X initializes (a few seconds). At that moment you
should hear a relay click ON/OFF from within the Controller housing.
The Ports and Flags display should now have Flag 2 illuminated green to indicate that it is set
high or ON. This is Setup mode and the program remains idle until you prompt it.
onnect button.
NOTE:
If Flag 1 or Flag 2 does not turn ON, the program was not uploaded correctly.
NOTE:
If Flag 1 does not turn OFF after being on for a few seconds, the program was not
uploaded correctly.
After Flag 1 turns OFF, remain connected to verify that the numeric display starts to update.
Normally the updates occur every 10 to 20 seconds, starting approximately at the top of the
minute. (Installed Meteorological sensors update every 60 seconds.).
YSI Environmental 669523 Rev B Page 5-6
Page 66

YSI Profiler System USER Manual
NOTE:
When you select a Flag or a Port, it typically takes affect immediately. However, the
response may not appear right away because of ‘table repetition rates’.
At this point Flag 2 will stay on indefinitely. We recommend that all pre-deployment tests be
performed before you start the profiler program. The procedure to start the profiler program will
be described again below.
After pre-deployment testing you may start the profiler program by turning Flag 2 OFF and then
turn Flag 5 ON. This will force a profile sequence within about 60 seconds (the repetition rate
of the display).
Although the above Flag and Port names can be renamed to be more meaningful to you, we
recommend that you learn the terminology at first before making these changes. See Appendix
D for Sonde Parameter ID numbers, which may of particular interest in depth profiling
applications.
RECOMMENDED PRE-DEPLOYMENT TESTS
NOTE:
Leave Flag 2 ON during all pre-deployment testing. This is setup mode. The system will
not enter a programmed profiling routine until you invoke the command 3.
Use the parameters and values below in the Numeric Display along with explanations of each
pre-deployment test.
3
If you are confident that all is working, you may start the profiler. To do this turn Flag 2 OFF and then
turn Flag 5 ON.
YSI Environmental 669523 Rev B Page 5-7
Page 67

YSI Profiler System USER Manual
Test 1: Sonde Parameter ID Numbers
Select Flag 8 to view the sonde parameter locations. The list of _Loc_1 through _Loc_12
(shown above) will exhibit values relevant to sensor identification. When you click on Flag 8
for the first time, all of the ‘_Loc_x’ display –INF. You will need to wait about 60 seconds to
see the actual values.
The string above (1, 7, 12, 14, 15, 96, 22, 18, 37, and 28) represents the sensor ID’s. These
values provide the necessary information to the program so that each sonde parameter is known.
For example, the Sonde Depth in meters PARA (parameter) at location 7 is sensor ID 22. In
other words, Depth in meters is ID #22 and resides in memory location 7. See Appendix D for a
complete list of sonde parameter ID numbers. This test has limited value, but can be useful in
troubleshooting problems.
NOTE:
When you select a Flag the parameter value will not appear until the data logger clock
moves past the ‘00 second’ mark.
Test 2: Sonde RS-232 and SDI-12 Responses
This test should be executed to verify that communications from sonde to controller are fully
functional. Refer to the Numeric Display below during this explanation.
Set Flag 5
to read the sonde via the RS-232 communications port. The results to interpret
appear in the far left two columns above. The _CntRS232 refers to the counter for RS-232
readings. The counter increments about one time every second for 4 to 5 seconds. If the counter
exceeds 5, then the sonde is not responding. The reading in the Display does not exceed the
maximum of 6 counts.
YSI Environmental 669523 Rev B Page 5-8
Page 68

YSI Profiler System USER Manual
Set Flag 6 to read the sonde via the SDI-12 communication port. The results to interpret
appear in the left two columns as in the previous test. The _CSDIcntr refers to the counter for
SDI-12 readings. Approximately every 2.5 seconds the counter increments. The readings may
vary based on the DO warm up setting, but a typical count would be 17 to 18. The reading
above is 15.00, and is considered acceptable. In some applications where two wiping cycles are
required for optical probes, counts may exceed 18. Each wiper takes about 38 seconds, therefore
76 seconds for two optical wipes. This would result in a count that would exceed 30 even
though DO warm up remained 60 seconds. The maximum number allowable for this counter is
35.
Test 3: Depth Finder Reading Response
NOTE:
Perform this test only if your system has a Depth Finder or Fixed Reference sonde. If
you employ User Defined Depth, neither Flag 3 nor Port 7 will show a response.
This test should be executed to verify that the Depth Finder (depth sounder) sensor is working. In
order to observe any reasonable reading the depth finder must be in water. You can simulate this
inside with a bucket or barrel of water. The movement from water to air or vice versa can reveal
qualitatively if the depth finder is working.
Set Flag 3
to read the Depth Finder result. The results to interpret appear in the left columns of
the Display as in previous tests. The _DF_Max term designates the cell to look for results. The
result in this example is 0.00, indicating an operational depth finder. A faulty sensor or a sensor
in air only will likely read –INF.
If your system is configured with a Fixed Reference Sonde rather than a Depth Finder, then add
Location _92 RefTmp and _92RefDpt to the Numeric Screen. The information you need will be
displayed in these locations and in the __sdi_# column.
IMPORTANT:
The Fixed Reference Sonde must be set to have only two Report parameters enabled:
Temp in C, and Depth in Meters. They must appear in the order shown and in the
units of measurement shown.
Test 4: Winch Motor Responses
You should perform this test to verify that the winch motor is operating, and works in two
directions (pays out; reels in). First note that this is a Port set, not a Flag set
as in the previous
tests.
CAUTION:
Port 5 should be set OFF to perform this test for the first time. This will result in cable
paying out, not reeling in, which could cause problems if the sonde is not connected.
Set Port 6 ON to turn on the Winch motor. The motor should turn on and pay out cable. The
sonde does not need to be connected to perform this test. Help guide the cable with some hand
YSI Environmental 669523 Rev B Page 5-9
Page 69

YSI Profiler System USER Manual
tension on the cable if you perform this test without actually submersing the sonde. To turn the
motor off, click on Port 6 again to turn it OFF (no green light).
Set Port 5
ON to reverse the direction of the Winch motor. You should turn Port 6 OFF (stop
motor) then set Port 5 ON. Turn Port 6 ON again. You should observe the Winch reel in cable.
Again help put some tension on the cable with your hands if you perform this test without
actually submersing a sonde in water. Click Port 6 again to turn the motor OFF. The green light
should not be visible at Port 6 at this time.
Quick Guide to Sonde Movements
To move sonde down:
Verify that Port 5 is OFF
Turn Port 6 ON
To stop sonde motion (up or down):
Turn Port 6 OFF
To move sonde up:
Turn Port 5 ON
Turn Port 6 ON
In summary, all of the tests above must produce data and/or motor movements. Verify that the
data is reasonable as explained in each section. Verify that each command results in a certain
number of attempts before it ‘gives up’. For example if you see the SDI-12 counter exceed 18
this could mean that the DO warm-up time is set extremely long, or it could mean the sonde is
not responding to an SDI-12 command. A 60 second DO warm up time typically produces a
count of 18 or so, but may read higher if optical probe wipers are set to wipe each interval. A
second example, the Depth Finder obviously will vary with depth. Shallow water may result in
2 to 3 attempts, while deeper waters could mean 10 to 15 attempts. When you interpret counter
readings, consider your test conditions.
OTHER PRE-DEPLOYMENT TESTS
The tests you performed above provide valuable information related to functionality of your
system components and communication between these components. You may perform
additional tests that may be valuable. Some of these are for subsystems that are optional on your
YSI Profiler. For example, you may have meteorological sensors that you would like to confirm
working.
Refer to the tables below to understand what the Ports and Flags control. The tables differ
slightly depending on whether you are working in Setup Mode (Flag 2 ON) or Profiling
(Operational) Mode (Flag 2 OFF).
Many of the tests described above have explained the function of these ports and flags. The
tables below should help you further explore testing of interest. In addition use the Status
Monitor (shown below) to monitor system operation. Keep in mind that when the collection
schedule is enabled it has precedence over the Connect Screen.
YSI Environmental 669523 Rev B Page 5-10
Page 70

YSI Profiler System USER Manual
Refer also to the LoggerNet user’s manual for additional information. Many tests may be more
useful if something does not work as expected. Using port tests and flag tests are of particular
usefulness in troubleshooting problems.
SETUP MODE (Ports and Flags)
Ports Action and/or Response
C1 I/O module
C2 I/O module
C3 I/O module
C4 SDI-12 data line for sonde
C5 DPDT direction relay control for winch motor: Up (ON); Down (OFF)
C6 Powers winch motor: motor runs (ON)
C7 Powers depth finder: (ON)
C8 Powers MET sensors and compass; (ON)
Flags
F1 Reset – Initializes system variables: (ON); turns OFF automatically
F2 Setup Mode (ON); Profile/Run Mode (OFF)
F3 Depth Finder Reading/Fixed Ref Sonde: (ON)
DO NOT TURN ON during profile sequence.*
F4 Compass Output: (ON) DO NOT TURN ON during profile sequence.*
F5 RS-232 Reading of Sonde: (ON) DO NOT TURN ON during profile sequence.*
F6 SDI-12 Reading of Sonde: (ON). DO NOT TURN ON during profile sequence.*
F7 n/a
F8 Initializes C7 to OFF. DO NOT TURN ON during profile sequence.*
*If Ports are flickering ON and OFF, then system is probably in the middle of a profile sequence.
5.3 Start a Profiling Sequence
Once you are satisfied with the results of your pre-deployment tests in Setup Mode, you are
ready to start a profiling sequence. Presumably your sonde is in a simulated depth profiling
environment, whether it outside in the water or on a test setup inside.
To begin set Flag 2 OFF and set Flag 5 ON. You may leave the Ports and Flags screen up to
monitor activity. When communication takes place, these screens will provide updates.
Remember that actual events and the communication of these events may not be at the same
YSI Environmental 669523 Rev B Page 5-11
Page 71

YSI Profiler System USER Manual
time. You will not necessarily be watching real time updates since repetition rates of the
numeric displays delays results.
WHAT SHOULD YOU SEE?
Ports C1, C2, and C3 occasionally flicker on and off. This indicates active communication
between the CR10X and the SDM04 I/O module.
Port C4 should never come on. It is an I/O port dedicated for SDI-12 communication to and
from the sonde.
Port C5 and Port C6 are the motor control ports that indicate when motor is moving and what
direction it is moving.
Port C7 is the Depth Sounder power strobe line. The outputs are indicated at locations _DF_1,
_DF_2, _DF_Max, and _DF_Depth.
The Depth sounder collects two samples. Parameter _DF_1 is the first sample, and _DF_2 is the
second sample. The _DF_MAX is the greater of the two readings that then becomes
__DF_Depth +0.4.
Port C8 is reserved for MET sensors.
YSI Environmental maintains a parameter identification list for its internal use. When a YSI
device outputs a string of data, it usually does not have an identifier associated with it.
However, a command can be sent to a sonde to confirm the location.
Sonde PARA (parameter) identifiers were discussed above. A complete list of identifier number
can be found in Appendix D. In the Numeric Table two examples may be pointed out. First,
you will find in Appendix D that ID #1 is Temperature in Celsius. Second, you will find ID #22
is Depth in Meters. These Identifiers are “set in stone”; they do not change.
So, if we look at the _loc _# in the screen below we can tell that Temp is the first parameter in
the string of data, and the _sdi_1 reading is 23 (23 C). We can also tell that Depth in meters is in
th
the 7
location, and the _sdi_7 is displaying -0.08 meters. The PARA identifiers can vary from
sonde to sonde depending on the user application so the program uses the PARA command
repeatedly to ascertain the depth location in the sonde output data string. This is the only way the
program knows for certain which parameter is Depth in meters. If the sonde Depth is set to Feet,
the PARA command will not return a identifier of 22 and the program is forced to abort into
setup mode. Hence, this is the importance of verifying sonde parameters prior to creating a
profiling routine.
YSI Environmental 669523 Rev B Page 5-12
Page 72

YSI Profiler System USER Manual
Definitions for some Parameters chosen for the Numeric Table above.
_Loc_1,2,3….. Indicates PARA identifiers (See Appendix D for a list of all sonde parameters)
_DPT_LOC Indicates the YSI sonde depth location
_CntRS232 Indicates number of attempts to get data from the sonde via the RS232 port.
_CSDIcntr Indicates number of attempts to get data from the sonde via the SDI-12 port.
_DF_Max Max water depth for a profile
_MaxDpt Max water depth from the Profile Wizard configuration
_StarDpt Start water depth from the Profile Wizard configuration
ParkDpt Sonde Park depth from the Profile Wizard configuration
_CurrDpt Current water depth of the sonde in a profile
_MoveToD Water depth sonde will try to move to.
_EndDpt End depth of water the sonde can travel from the Profile Wizard configuration
_92Temp Fixed Reference Sonde first parameter (water temperature)
_92Depth Fixed Reference Sonde second and last parameter
YSI Environmental 669523 Rev B Page 5-13
Page 73

YSI Profiler System USER Manual
SERVICING THE SONDE
As previously mentioned when the time comes to disconnect the sonde from the winch for
calibration or service you must wait for the profile to end. If that’s not possible, then you must
turn power off to the winch.
Ideally sonde servicing should take place by rotating a spare sonde into service while the system
is in between profiles (idle at Park). When this is not possible and the sonde must be removed
for on-site calibration, then the system needs to be stopped temporarily.
Connect a lap top to the Controller Assembly using the Diagnostic Cable. Start LoggerNet™
and connect to the station. At this point Flag 2 should be OFF (low). No other flags or ports
should come ON except for Port 8 which will turn ON briefly every 60 seconds. If the Ports are
flickering ON and OFF, then the system is probably in the middle of a profile sequence.
Turn Flag 2 ON (high). This puts the Profiler system into Setup Mode keeping it in idle mode
for the duration of the service procedure.
Once sonde servicing is complete, connect the sonde to the winch cable and verify proper sonde
operation using the LoggerNet™ flags.
If you are satisfied with the tests, you can exit Setup mode by setting Flag 2 OFF (low). If you
want to start a profile immediately, then set Flag 5 ON (high). Otherwise the profiling routine
will be determined by the clock and you may be required to wait for some time.
IMPORTANT:
YSI recommends that after you service a sonde you should start a profile and verify
sequence operation before departing the remote site.
TESTING COMMUNICATIONS
YSI Profiler platforms may use a variety of wireless communications options. Each has its own
distinctive set of problems. In this section you learned to setup modem communications and we
touched on using a similar method with IP addresses. If you have a laptop computer, the system
can be tested prior to moving to the remote site. This test is worth the time, but is no substitute
for testing on site. With a cellular modem in the system and a cell phone, you could collaborate
with a colleague to check communications between remote and base sites. The methods for
testing are fairly standard and each user typically has their preferences.
If you have any problems with communications do not hesitate to call Endeco/YSI. The contact
information can be found in Appendix A.
In the following section of this manual a very general discussion for transporting and securing a
YSI Profiler to a remote site will be discussed.
YSI Environmental 669523 Rev B Page 5-14
Page 74

YSI Profiler System USER Manual
Deployment & Maintenance
6.1 Transporting Platform and Deployment Examples
After all pre-deployment testing is completed, you will now need a plan to transport your
Floating Platform system to it remote site. The pontoon version can normally be taken by trailer
to the water where final checkout of the system is recommended. The buoy version may require
a hoist or some other means to transfer it to the water. There are many ways to handle this.
Below are a few photographs of deployment procedures to give you some ideas. Do not hesitate
to contact Endeco/YSI if you need help. Contact information is in Appendix A of this manual.
Pontoon Platform on Inland Reservoir
Figure 6-1 Final checkout using Diagnostic
Cable and laptop PC to test system just prior
to launch onto an inland reservoir.
Figure 6-2 Panels in place, Profiler secured
to side of motor boat for transport to remote
site on reservoir.
The deployment shown above is seasonal. In late fall the platform is removed for cleaning and
maintenance. Routine maintenance is described below in this section.
YSI Environmental 669523 Rev B Page 6-1
Page 75

YSI Profiler System USER Manual
Pontoon Platform in Bay – Coastal waters with tide; Depth Sounder employed.
Figure 6-3 Profiler anchored (single point) in coastal waters. In addition to depth profiler,
equipped with meteorological suite for monitoring surface conditions. Counter-weights
employed for stability. Compass installed to correct for wind direction as pontoon rotates
with wave action. Depth finder mounted from support attached to deck to compensate for
tidal changes in depth.
Buoy Platform in Bay: Hoist required for Deployment
Figure 6-4 Buoy platform version near dock. Hoist required for setting in and taking out of
water.
YSI Environmental 669523 Rev B Page 6-2
Page 76

YSI Profiler System USER Manual
Fixed Mount Depth Profiler – Not a Floating Platform
Figure 6-5 Dock-mount Profiler (fixed mount version)
The YSI Profiler is occasionally used in a fixed mount configuration. The Winch Assembly is
separately attached. The Controller Assembly involves the same electronics, but packaged in a
standard NEMA enclosure. Solar panels may be replaced by regulator that is AC powered. PVC
pipe helps guide the sonde from the surface to the winch drum. Antenna (not visible) for RF or
cellular modem attached to pole.
Each deployment is slightly different. If you are unfamiliar with these types of deployments,
write down your requirements, environmental conditions during the season, concerns you may
have about stability, security and any other issues. Endeco/YSI should be able to help you with
your application and deployment. Call or write. Contact information is in Appendix A.
6.2 Testing Communications
YSI Floating Profiler platforms may use a variety of wireless communications options. Each has
its own distinctive set of issues.
In Section 5 you learned to set up modem communications and you learned some about using a
similar approach to set up communication through an IP address for Web access. If you have a
laptop computer, the system can be tested prior to moving to the remote site. This test is worth
the time, but is no substitute for testing on site. If possible, verify that your communications
equipment will work on site prior to pre-deployment checkout. Contact your cellular carrier or
RF radio manufacturer to inquire about reception at the remote site you intend to use.
YSI Environmental 669523 Rev B Page 6-3
Page 77

YSI Profiler System USER Manual
We recommend that you arrange some way to verify a working communications system on site.
With a cellular modem or any wireless setup in the Profiler system and a cell phone, you could
collaborate with a colleague to check communications between remote and base sites. The base
user can use LoggerNet to initiate actions that are prearranged. If there are problems, some
troubleshooting can be done on site by using cell phone vocal communication in combination.
If you have problems and they are not obvious, consult your communications manual and double
check setup configuration during configuration of your Profiler system.
6.3 Maintenance – Servicing the Sonde
Refer to your sonde manual for specific care and maintenance procedures. Care and
maintenance depend on both the sonde model and the sensors you have installed. Other than the
obvious visual inspections and cleaning, calibration frequency varies from sensor to sensor.
There are some specific concerns when servicing a sonde used in the YSI Profiler. These points
are made below.
As previously mentioned when the time comes to disconnect the sonde from the winch for
calibration or service you must wait for the profile to end. If that is not possible, then you must
turn power off to the winch motor.
Ideally sonde servicing should take place by rotating a spare sonde into service while the system
is in between profiles (idle at Park). When this is not possible and the sonde must be removed
for on-site calibration, then the system needs to be stopped temporarily.
Connect a lap top to the Controller Assembly using the Diagnostic Cable. Start LoggerNet™
and connect to the station. Use the Ports and Flags function to track activity. At this point Flag
2 should be OFF (low). No other flags or ports should come ON except for Port 8 which will
turn ON briefly every 20 seconds. If the Ports are flickering ON and OFF, then the system is
probably in the middle of a profile sequence. Do not disconnect the sonde if this is the case.
Turn Flag 2 ON (high). This puts the Profiler system into Setup Mode keeping it in idle mode
for the duration of the service procedure.
Once sonde servicing is complete, connect the sonde to the winch cable and verify proper sonde
operation using the LoggerNet™ flags
.
If you are satisfied with the tests, you can exit Setup mode by setting Flag 2 OFF (low). If you
want to start a profile immediately, then set Flag 5 ON (high). Otherwise the profiling routine
will be determined by the clock and you may be required to wait for some time.
IMPORTANT:
YSI recommends that after you service a sonde you should start a profile and verify
sequence operation before departing the remote site.
6.4 Maintenance – Servicing Other System Components
BASIC INSPECTION & PROCEDURES
YSI Environmental 669523 Rev B Page 6-4
Page 78

YSI Profiler System USER Manual
Use the following descriptions to check your system and then refer to the maintenance schedule
that follows. Use the manuals that accompany most components of the YSI Profiler System to
help guide you through care and maintenance. When in doubt about an issue contact
Endeco/YSI.
Winch Assembly:
Motor and motor gear:
1. No direct maintenance required.
2. Ensure motor mounts remain tight
3. Inspect housing/hardware for damage or corrosion
Axle
1. Check axle for excessive wear on the pillar blocks.
Drum:
1. Check drum flanges for damage and excessive wear.
Slip ring cover
1. Check tolerance fit.
2. Inspect O-ring and slip ring.
Other Components:
Desiccant Cartridge
1. Check for color changes.
Battery
1. Insure posts are corrosion-free
2. Check battery for secure connections
3. Check battery voltage capacity
Electronics Controller
1. Check all connectors and cables for proper fit.
2. Check seals
Antenna
1. Check cable and cable connectors for secure fit.
2. Check cables for damage
3. Check antenna rubber boots for damage
Solar Panel
1. Maintain panels free of dirt and debris.
2. Check output voltage.
Depth Finder
1. Check cable and depth sounder assembly for damage and wear.
Fixed Reference Sonde
1. Check cable, sonde, and sonde attachment for damage and wear.
2. Inspect sonde reference point periodically for proper distance from bottom.
YSI Environmental 669523 Rev B Page 6-5
Page 79

YSI Profiler System USER Manual
Float and/or Mooring
1. Check cable and depth sounder assembly for damage and wear.
2. Check mooring lines and buoys
YSI Environmental 669523 Rev B Page 6-6
Page 80

YSI Profiler System USER Manual
6.5 Maintenance Schedule
The table below shows times for periodic maintenance and/or inspection.
Component
Winch Motor Brushes √ √
Gear √ √
Couplings Set screws √ √
Spider √ √
Part
New
Installation
Inspection Period (months)
3 6 12
Winch Drum Flange
screws
Slip Ring
Cover & o-ring
Desiccant √ √
Sonde cable √ √
YSI sonde √ √
Battery √ √
Controller Assy √ √
Antenna √ √
Solar Panel(s) √ √
Depth Finder √
Fixed
Reference
Sonde
Float √ √
Mooring √ √
√ √
√ √
√ √
YSI Environmental 669523 Rev B Page 6-7
Page 81

YSI Profiler System USER Manual
This Page Intentionally Left Blank
YSI Environmental 669523 Rev B Page 6-8
Page 82

YSI Profiler System USER Manual
Section 7
Data Collection & Analysis
7.1 Data Collection
Refer to the Campbell Scientific, Inc. LoggerNet™ user’s manual for detailed information on the
collection and analysis of data. If data files are available, you may want to try the YSI Profile
Data Manager. See instructions on using this program in Section 7.2 of this manual.
7.2 YSI Profile Data Manager
Profile Data Manager™ is a data manager program intended for use with the YSI Profiler System.
It is used to analyze depth profile data, automate graphic creation, and set up graphic transmission
via FTP to a specified server or local drive. Note that in the main screen of Profile Data Manager
there are three distinct fields or panels. The first (labeled 1 in Figure 7-1) is related to data
analysis; 2 is related to set up automation for the profile parameters used in displaying graphs and
tables; and 3 is used to set up and test FTP settings related to the automation stations.
1
Figure 7-1 Main Screen of YSI Profile Data Manager
Data Analysis
In this section you can review the profile data in a graphical or table format. You can also review
any graphics created and rename the parameter labels that appear in the graphics. See Section 7.3
Data Analysis for detailed instructions and examples.
Automation Setup
In this section you can select profile parameters to graph and assign the number of profiles to
include in the graphs. You can also set up FTP settings or select a local drive for graphics
delivery. See Section 7.4 Automation Setup for detailed instructions and examples.
FTP Test
In the FTP Site Test section you can test your FTP settings for each of the Automated Stations
without going into the Automation section. See Section 7.5 FTP Settings for detailed
instructions.
2
3
YSI Environmental 669523 Rev B Page 7-1
Page 83

YSI Profiler System USER Manual
7.3 Data Analysis
Double click the Profile Data Manager icon on Windows Desktop to begin data analysis.
Alternatively, click on Start and locate Profile Data Manager under Start│Programs│YSI Profile
Manager. The screen shown in Figure 7-1 appears.
Click the Data Review & Export button in the upper left corner of the Main Screen. The Review
and Export window will appear as shown in Figure 7-2.
Figure 7-2 Data Review and Export Files Screen
At any time while in the Data Review & Export window, you may use either of two buttons in the
upper left corner of the screen. They are both active when this window is open. Click Return to
go back to the Profile Data Manager Main screen; click PrintScreen to send a screen image to
the default printer.
At the top right corner of the screen is a ‘folder’ icon.
Use this button to browse for files
that are stored in the Profile Wizard Shared directory. Any .DAT file may be opened from this
screen. When opened, the filename you choose appears in the File Name field.
YSI Environmental 669523 Rev B Page 7-2
Page 84

YSI Profiler System USER Manual
A blue status bar may briefly appear, and then you see a screen that has a ‘plot’ field on the left
side. Refer to these screens below and try to plot data from any .DAT file in the Shared directory.
Figure 7-3 Window showing Shared Directory *.dat files
Profile Data Manager opens the Shared folder under the YSI Profile Wizard as a default. If the
data file you collected is in a different directory path, use the pull down field at the top of the
window to locate the data file (see Figure 7-3). Click on the file of your choice to highlight it,
and then click the Open button.
Figure 7-4 Data file IP_Quabbin selected for analysis (top right)
YSI Environmental 669523 Rev B Page 7-3
Page 85

YSI Profiler System USER Manual
The file name and location now appear in the Select Dat File field at the top right corner. See
Figure 7-4. The Profile Start and Profile End fields can be modified by clicking the up and down
arrows to the left of each field, or by clicking the calendar icon
and selecting the time,
month, date and year. Under Data Channels for Profiles, select the desired parameters to graph.
As a default, depth is graphed along the y-axis. Choose Temp C and DO% as x-axis parameters.
Click Apply Changes. Dates and times of profiling data now appear in the Profile TimeStamps
box (lower left field in Figure 7-5).
Figure 7-5 Graph and Table time series and parameters selected.
Next click the white box next to the desired profile timestamp to plot it on the graph. An “X”
appears when the parameter is selected (see Figure 7-6). If more than one box is checked, more
than one date and time will be displayed. The color next to the box associates date/time with
graphed parameter.
Click the Apply Changes button again to graph the parameters or implement any changes made.
In the example below (Figure 7-6), temperature and dissolved oxygen have been plotted against
depth. The thin line + circles shows the first x-parameter (Temp C), while the thick line +
squares shows the second x-parameter (DO%).
We recommend that you choose a second date/time to add a second set of plots in a different
color to the graph. Simply check another box in the Profile TimeStamps field and click Apply
Changes again. The graph will refresh and you will see additional plots of Temp C and DO%
for another date and time.
To clear the data and start again place your mouse anywhere on the graph and right click to view
a box. One of the options is to Clear Graph. Left click on that option and the plots are cleared.
You may then return to start another analysis.
YSI Environmental 669523 Rev B Page 7-4
Page 86

YSI Profiler System USER Manual
If you would like to view the data in table (spreadsheet) format, find the tab labeled Table in the
upper right portion of the screen (just to the left of Profile Graph). Click on this tab to view the
table (see Figure 7-7).
Figure 7-6 Plot of Temp C and DO% as function of Depth in meters for date/time selected
Figure 7-7 Data in Table Format (note you can export table to a file)
YSI Environmental 669523 Rev B Page 7-5
Page 87

YSI Profiler System USER Manual
7.4 Automation Setup
In this section you will learn how to use Profile Data Manager to create graphics of the profile
parameters you have selected. You will also learn to configure FTP settings for graphics
transmission. If you are starting from Windows Desktop double click the Profile Data Manager
icon to view the Main screen as you did earlier in this section (see Figure 7-8). Alternatively,
click on Start and locate Profile Data Manager under Start│Programs│YSI Profile Manager to
view this screen.
Figure 7-8 Main Screen of Profile Data Manager
Click the Configure Automated button in the upper right field of the screen. The button is on the
left side of the field. The Configure Automated Stations window appears (Figure 7-9).
Figure 7-9 Configure Automated Stations
YSI Environmental 669523 Rev B Page 7-6
Page 88

YSI Profiler System USER Manual
Click either Insert New Above or Insert New Below button. The default “Basename1” will
appear in the Stations window on the left. Double-click the station name or click the Modify
Parameters button for the Configure Single Station window to appear.
You need to create a station to associate the graphics you are about to create. We recommend
naming the Automated Station with the same name as the station you setup in the LoggerNet
application. In this example the Quabbin Reservoir site will be used.
Figure 7-10 Configure Station Information screen
Setting up an automated station is a three (3) step process. You will use the three (3) tabs in the
screen above (Figure 7-10). The setup requires that you:
1. Set up General Station Information and associate a data file with that station.
2. Set up parameters that you want to plot in the graphs. (Graph Configuration)
3. Indicate where to transfer the graphics. (FTP Settings)
You will start with entering information about the station. First, rename the station. Next, associate the data
file you want this automated station to use by clicking the Import .dat file button or the browse
icon button and browse for the data file. Once the data file has been selected or imported, you may see a
blue status bar appear briefly
.
YSI Environmental 669523 Rev B Page 7-7
Page 89

YSI Profiler System USER Manual
NOTE: For the YSI Profile Data Manager to import the data file correctly, an associated .LVI file
needs to be in the same folder as data file. After browsing for the data file, if the OK, Apply and
Cancel buttons are grayed out, this indicates that the .LVI is missing or the name does not match
the data file.
Continue by entering a title and sub-title that you prefer to be displayed in all graphics created.
After you enter all of the general automation information, click on the Graph Configuration tab
for the following window to appear.
Figure 7-11 Graph Configuration
The Graph Configuration tab is composed of two sections. The top section (JPEG Graph List)
keeps track of the current list of graphs associated with selected data files. The bottom section,
JPG Graph Details, allows you to modify the parameters for the selected graphs. Since there is
no specified graph selected the Graph Detail section is gray.
Click the Insert New Above or Insert New below buttons to create a new graph description. The
order of the graphs on the Graph List determines the order the graphs are created and transmitted.
YSI Environmental 669523 Rev B Page 7-8
Page 90

YSI Profiler System USER Manual
Next name your graph in the Graph Name box, and then select the graph type from the Graph
Type dropdown menu. Alternatively, you can use the up/down arrows to the left of the Graph
Typed box to scroll through the following graph types:
WindStick
Plots wind direction and speed
Profile – Single channel
Plots Depth verses one additional Profile parameter.
Profile – Dual Channel
Plots Depth verses 2 additional Profile parameters.
As you select the different graph types a description of the selected graph type appears in the
Instructions window below it. Refer to Figure 7-12 for information described above. In this
example Temperature and DO% are plotted as a function of Depth.
Figure 7-12 JPG Graph Details
Next choose the number of Profiles (N) to plot in this graphic. In the above example 14 profiles
are entered. This number represents the last N profiles in your data file. The number you should
enter here will depend on your profile interval and what type of data you are trying to graph.
YSI Environmental 669523 Rev B Page 7-9
Page 91

YSI Profiler System USER Manual
For example, if you were trying to graph daily profiles and your profile interval is every 12 hours,
you would enter 2 for the (N) number of profiles to graph. Profile Data Manager will create a
graph with the last 2 profiles, and that should represent your daily profiles.
Create as many graphs as you need. Once all your graphics are setup click on the FTP Settings
tab to view the following window (Figure 7-13).
Figure 7-13 FTP Settings
The FTP Settings tab allows you to locate a folder on your local network (or on an FTP server) to
which you can transfer your graphics.
Selecting the JPG File Transfer text box shows the dropdown
menu. There are three (3) transfer options available.
Alternatively, you can use the arrows to the left to scroll
through the available options.
If you choose the ‘Send to FTP Site’ option click on that
option, and additional text boxes become active (See Figure 7-14).
YSI Environmental 669523 Rev B Page 7-10
Page 92

YSI Profiler System USER Manual
Figure 7-14 Send to FTP Site Option – Information required
Enter the FTP site address, the user name and your password in the appropriate text boxes. If you
know the starting path you can also enter it at this time or you can browse for the graphics folder.
Click on the Delete Local Copy checkbox to delete the local copy after file transfer.
Click Test FTP Site button and the FTP Browser window will appear.
Figure 7-15 Information for FTP Site Option
If the start path, user name and password have not been entered, do so at this time.
NOTE:
To access a remote FTP site you need the address of the site, the directory where the
files are going to be placed, a user name and a password with the appropriate security
YSI Environmental 669523 Rev B Page 7-11
Page 93

YSI Profiler System USER Manual
privileges to access that folder. To obtain this information you may need to contact your
IT manager or the person in charge of the FTP site.
Next click the Connect button to test the connection. If the connection fails, check the messages
displayed in the lower text window. The messages will identify the reason for failure. See Figure
7-16.
Figure 7-16 Test Connection for FTP Site
Once you are connected to the FTP site and you have appropriate privileges for the User Name
you entered, you can continue browsing for the correct folder path or create a new folder on the
FTP site by clicking the New Dir button.
Click the Return button to return to Configure Single Station window.
Then, click the OK button to return back to the Configure Automated Stations window. See
Figure 7-17 below and read the next text below to complete your setup.
Note: If any error occurred during the Automated Station setup a description of the error will
appear in the Error text window and the OK and Apply buttons would be disabled.
Now you have a station listed (Quabbin) and selected for automatic graphic creation. This is
shown by the check mark before the station name. You may want to turn off an individual station
from creating graphics when servicing the site or if an FTP server is down. To do so select the
individual station name and click the Turn ON/OFF button. If the station is offline the check
mark will disappear.
YSI Environmental 669523 Rev B Page 7-12
Page 94

YSI Profiler System USER Manual
Figure 7-17 Completion of Automations Stations setup
You now have the basic instructions, with examples, for configuration of an Automated Station.
7.5 FTP Site Test
Click the OK button once more to return to the YSI Profile Data Manager Main display. Next
toggle the Run Automated switch to ON. The LED light will turn green and you will see the
graphs being generated in the upper left corner of your display. Any error(s) that is encountered
during the graph generation process will appear in the Automated Error Information window.
Figure 7-18 FTP Test Function
You can toggle the Run Automated switch OFF if you want to stop all automated processes setup
earlier.
Next toggle the Run FTP switch ON. Again the LED light will turn green and file transfer will
occur if no errors occur.
YSI Environmental 669523 Rev B Page 7-13
Page 95

YSI Profiler System USER Manual
You can monitor the progress by looking at the FTP Status window which indicates the number
of graphics left to transfer (see Figure 7-18). Any errors during transfer are displayed in the FTP
Error Information window.
To stop the transfer of graphics click the Run FTP switch to the OFF position. Click on Clear
Errors to clear the window once you have interpreted the errors.
You now have learned the learned the basics through descriptions and examples of how to use
YSI Profile Data Manager. Once you are set up and running practice using the setup and run
screens to analyze and manage data collected during your YSI depth profile studies. If you have
questions do not hesitate to contact YSI (refer to Appendix A for contact information).
YSI Environmental 669523 Rev B Page 7-14
Page 96

YSI Profiler System USER Manual
Appendix A
Warranty & Service Information
The YSI Floating Profiling System is warranted for one (1) year from date of purchase by the end
user against defects in materials and workmanship. YSI 6-Series Sondes carry specific warranties
listed in the 6-Series Operations Manual. Within the warranty period YSI will repair or replace,
at its sole discretion, free of charge, any product that YSI determines to be covered by this
warranty.
To exercise this warranty, write or call your local YSI representative, or contact YSI Customer
Service in Yellow Springs, Ohio. Send the product and proof of purchase, transportation prepaid,
to the Authorized Service Center selected by YSI. Repair or replacement will be made and the
product returned transportation prepaid. Repaired or replaced products are warranted for the
balance of the original warranty period, or at least 90 days from date of repair or replacement.
LIMITATION OF WARRANTY
This Warranty does not apply to any YSI product damage or failure caused by:
1) failure to install, operate or use the product in accordance with YSI's written instructions;
2) abuse or misuse of the product;
3) failure to maintain the product in accordance with YSI's written instructions or standard
industry procedure;
4) any improper repairs to the product;
5) use by you of defective or improper components or parts in servicing or repairing the
product;
6) modification of the product in any way not expressly authorized by YSI.
THIS WARRANTY IS IN LIEU OF ALL OTHER WARRANTIES, EXPRESSED OR
IMPLIED, INCLUDING ANY WARRANTY OF MERCHANTABILITY OR FITNESS
FOR A PARTICULAR PURPOSE. YSI'S LIABILITY UNDER THIS WARRANTY IS
LIMITED TO REPAIR OR REPLACEMENT OF THE PRODUCT, AND THIS SHALL
BE YOUR SOLE AND EXCLUSIVE REMEDY FOR ANY DEFECTIVE PRODUCT
COVERED BY THIS WARRANTY. IN NO EVENT SHALL YSI BE LIABLE FOR ANY
SPECIAL, INDIRECT, INCIDENTAL OR CONSEQUENTIAL DAMAGES RESULTING
FROM ANY DEFECTIVE PRODUCT COVERED BY THIS WARRANTY.
YSI Environmental 669523 Rev B Page A-1
Page 97

YSI Profiler System USER Manual
Ordering & Technical Support
Telephone:
(800) 363-3269 (Monday through Friday, 8:00 AM to 5:00 PM Eastern Time)
Fax:
(937) 767-9353 (orders)
(937) 767-1058 (technical support)
Email:
environmental@ysi.com
Mail:
Endeco/YSI Incorporated
13 Atlantis Drive
Marion, MA 02738
Internet:
www.ysi.com/environmental
When placing an order please have the following information available:
1. YSI account number (if available)
2. Name and Phone Number
3. Purchase Order or Credit Card
4. Model Number or Brief Description
5. Billing and Shipping addresses
6. Quantity
Service Information
YSI has several authorized service centers throughout the United States and
Internationally. For the nearest service center information, please contact YSI Technical
Support (800-897-4151).
YSI Environmental 669523 Rev B Page A-2
Page 98

YSI Profiler System USER Manual
Appendix B
Software File Report Formats
PFW Format
The PFW consists of variables that are used to recreate the DLD program file.
The Pfw
[wizard]
pflType=5
unitType=0
reelType=0
cableType=0
cableLen=0
winchHeight=2.000000
waterCol=4.000000
stepNum=1
stepDist=0.800000
stepType=1
profileNum=24
[profiler]
PFL_Max_Run=700
PFL_Direction=1
PFL_Start_Depth_X=0.500000
PFL_End_Depth_X=0.500000
PFL_Park_Depth_X=2.000000
PFL_Step_Interval=8.000000
PFL_INTVL_Time=60
PFL_Cable_length=15
PFL_NO_DFinder_Depth=0.000000
MET_solarRadiationCoeff=90.099998
file=C:\profiler_testing\BIRD_ISLAND.dld
[labview]
FileType=0
N_Entries=2
Date="10/21/2004 12:12:43"
MetOrder=56,42,159,26,83,81,154,0,0,0,0,0,0,0,0,0,0,0,0,0,29,0,0,0,1000,0
ProfileOrder=1,6,4,12,14,15,96,22,18,17,203,193,28
hasMet=1
file=C:\Program Files\YSI\Profile Wizard\Shared\BIRD_ISLAND.lvi
LVI Format
The LVI is located within the directory Program Files\YSI\YSI Profile Wizard\Shared folder. This
file is used by Labview to assign the Parameters.
[Misc]
FileType=0
N_Entries=1
[ParseVar_1]
Date="03/20/2005 10:57:51"
MetOrder=0,0,0,0,0,0,0,0,0,0,0,0,0,0,0,0,0,0,0,29,0,0,0,1000,0
ProfileOrder=1,4,12,14,15,96,22,18,17,203,194,28
hasMet=0
YSI Environmental 669523 Rev B Page B-2
Page 99

YSI Profiler System USER Manual
DLD Format
The DLD is the actual CR10X program. This file resides in the Profile Wizard default directory or
wherever you may have directed the path during the Profile Wizard execution.
RPT Format
The RPT is the Profile Wizard summary report.
Program file: C:\Documents and Settings\jsmith\My Documents\ABC123.dld
Profiling Direction: Bottom to top
Cable Length: 15 meter(s)
Max Water Depth: 4.90 meter(s)
Start Depth: 4.50 meter(s) from water surface.
End Depth: 0.50 meter(s) from water surface.
Distance per profile step: 1.00 meter(s) (~4 steps)
Daily Profiles: 96 (every 15 minutes)
No MET sensors.
------------------------------ Estimated time per profile: ~10 (minutes)
Sonde parameter report output
Temp (C)
Cond (mS/cm)
Sal (PPT)
DOsat (%)
DO (mg/L)
DOChrg (DOchrg)
Depth (meters)
pH (pH)
pH (mV)
Turbid+ (NTU)
%Fluorescence (%FS)
Battery (volts)
YSI Environmental 669523 Rev B Page B-3
Page 100

YSI Profiler System USER Manual
Appendix C
I/O Module Configuration
The SDM SIO4 module needs configured before it can be used. Connect the I/O module to 12
VDC (either a battery or the 6960 main power). The STATUS indicator should turn on briefly after
power up. Connect a PC to the I/O module at Port 1. You will need a female/female null adapter.
Start Hyperterminal and then select the PC COM port. Set it to9600 baud. Press the SDMSIO reset
button, and the STATUS indicator should turn on. The unit will scroll SDMSIO4->. If these
letters do not appear, either the power is not on or there may be a faulty RS-232 connection to the
PC.
From the Hyperterminal menu select the Transfer button and then select SEND TEXT FILE.
Locate the SDM_info .txt file and send it. You should see the following:
…………………………………………..
portset 2 12 3 0 0 0 0
portset 3 11 3 0 0 0 0
portset 4 13 3 0 0 0 0
strst 1 " &0D&0A &0D&0A"
strst 3 "para&0D&0A"
strst 4 "exit&0D&0A"
strst 5 "data&0D&0A"
strst 9 "sleep&0D&0A"
strst 11 "run&0D&0A"
strst 12 "fltreset&0D&0A"
strst 15 "&1B&0D&0A"
strst 49 "&0D&0A&0D&0A&0D&0A"
strst 20 "*H&0D&0A"
strst 21 "*M&0D&0A"
strst 22 "*S&0D&0A"
strst 23 "*A&0D&0A"
strst 24 "*Q&0D&0A"
strst 25 "*C&0D&0A"
fltst 6 "fffffffffffffffffffffffff"
fltst 7 "zxt[$SDDBT,]t[,f,]FXz"
fltst 8 "xt[$SDDPT,]FXz"
fltst 10 "f"
fltst 50 "i[$]f"
fltst 51 "i[$]n6Fi[MfF]"
fltst 52 "F"
fltst 53 "FCF"
fltst 54 "zft[,]f"
fltst 55 "zfn1f"
fltst 56 "Ft[,]Ft[,]F"
fltst 57 "ft[,]ft[,]f"
exit
………………………………………………………
At this point press enter and then power cycle the Profiler unit. Press the reset button. The unit
should scroll the following header, SDMSIO4-> . Type Strrd 12 and press enter. You should see
the following response SDMSIO4-> fltreset .
Type exit escape (SDMSIO4->exit).
YSI Environmental 669523 Rev B Page C-2
 Loading...