

Page 1

User’s
Manual
WX101
DAQLOGGER
WX81
DAQLOGGER Client Package
IM WX101-01E
12th Edition
Page 2

Notes
Thank you for purchasing the DAQLOGGER or the DAQLOGGER Client Package.
This User’s Manual contains useful information about the operation of the DAQLOGGER
and the DAQLOGGER Client Package. To ensure correct use, please read this manual
thoroughly before operation, and keep it in a safe place for quick reference in the event a
question arises.
• The contents of this manual are subject to change without prior notice as a result of
continuing improvements to the software’s performance and functions.
• Every effort has been made in the preparation of this manual to ensure the accuracy
of its contents. However
contact your nearest YOKOGAWA dealer.
• Copying or reproducing all or any part of the contents of this manual without
YOKOGAW
• Use of this product (software and this manual) by more than one computers at the
same time is prohibited. Use by more than one user is also prohibited.
• Transfer or lending of this product to any third party is prohibited.
Yokogawa Electric Corporation provides no guarantees other than for physical
•
deciencies found on the original oppy disk or this manual upon opening the product
package.
•
Yokogawa Electric Corporation shall not be held responsible by any party for any
losses or damage, direct or indirect, caused by the use or any unpredictable defect of
the product.
The license number will not be reissued. Please keep the license number in a
•
safe place.
A’s permission is strictly prohibited.
, should you have any questions or nd any errors, please
Trademarks
• DAQWORX, DAQLOGGER, and DAQEXPLORER are registered trademarks or
trademarks of Yokogawa Electric Corporation.
• Microsoft, Windows, and Windows Vista are registered trademarks or trademarks of
Microsoft Corporation in the United States and/or other countries.
•
Adobe and Acrobat are registered trademarks or trademarks of
Incorporated.
• Company and product names that appear in this manual are registered trademarks or
trademarks of their respective holders.
• The company and product names used in this manual are not accompanied by the
registered trademark or trademark symbols (® and ™).
Revisions
• 1st Edition July 2003
• 2nd Edition December 2003
• 3rd Edition February 2005
• 4th Edition August 2005
• 5th Edition March 2006
• 6th Edition July 2006
• 7th Edition June 2007
• 8th Edition March 2008
• 9th Edition January 2009
• 10th Edition June 2010
• 11th Edition January 2011
• 12th Edition October 2011
12th Edition : October 2011 (YK)
All Rights Reserved, Copyright © 2003 Yokogawa Electric Corporation
Adobe Systems
IM WX101-01E
i
Page 3

Software License Agreement
IMPORTANT - PLEASE READ CAREFULLY BEFORE INSTALLING OR USING:
THANK YOU VERY MUCH FOR SELECTING SOFTWARE OF YOKOGAWA ELECTRIC CORPORATION ("YOKOGAWA"). BY INSTALLING OR OTHERWISE USING THE
SOFTWARE PRODUCT, YOU AGREE TO BE BOUND BY THE TERMS AND CONDITIONS OF THIS AGREEMENT. IF YOU DO NOT AGREE, DO NOT INSTALL NOR USE
THE SOFTWARE PRODUCT AND PROMPTLY RETURN IT TO THE PLACE OF PURCHASE FOR A REFUND, IF APPLICABLE.
Software License Agreement
1. Scope
This Agreement applies to the following software products and associated documentation of Yokogawa (collectively, "Software Product"). Unless otherwise provided by
Yokogawa, this Agreement applies to the updates and upgrades of the Software Product which may be provided by Yokogawa.
Software Product: DAQWORX (It is limited to each software that you bought).
2. Grant of License
2.1 Subject to the terms and conditions of this Agreement, Yokogawa hereby grants to you a non-exclusive and non-transferable right to use the Software Product on a
single or, the following specied number of, computer(s) and solely for your internal operation use, in consideration of full payment by you to Yokogawa of the license
fee separately agreed upon.
Granted number of License: 1 (one)
2.2 Unless otherwise agreed or provided by Yokogawa in writing, the following acts are prohibited:
a) to reproduce the Software Product, except for one archival copy for backup purpose, which shall be maintained with due care subject to this Agreement;
b) to sell, lease, distribute, transfer, pledge, sublicense, make available via the network or otherwise convey the Software Product or the license granted herein to any
other person or entity;
c) to use the Software Product on any unauthorized computer via the network;
d) to cause, permit or attempt to dump, disassemble, decompile, reverse-engineer, or otherwise translate or reproduce the Software Product into source code or other
human readable format, or to revise or translate the Software Product into other language and change it to other formats than that in which Yokogawa provided;
e) to cause, permit or attempt to remove any copy protection used or provided in the Software Product; or
f) to remove any copyright notice, trademark notice, logo or other proprietary notices or identication shown in the Software Product.
2.3 Any and all technology, algorithms, know-how and process contained in the Software Product are the property or trade secret of Yokogawa or licensors to Yokogawa.
Ownership of and all the rights in the Software Product shall be retained by Yokogawa or the licensors and none of the rights will be transferred to you hereunder.
2.4 You agree to maintain the aforementioned property and trade secret of Yokogawa or licensors and key codes in strict condence, not to disclose it to any party other
than your employees, ofcers, directors or similar staff who have a legitimate need to know to use the Software Product and agreed in writing to abide by the obligations
hereunder.
2.5 Upon expiration or termination of this Agreement, the Software Product and its copies, including extracts, shall be returned to Yokogawa and any copies retained in your
computer or media shall be deleted irretrievably. If you dispose of media in which the Software Product or its copy is stored, the contents shall be irretrievably deleted.
2.6 The Software Product may contain software which Yokogawa is granted a right to sublicense or distribute by third party suppliers, including afliates of Yokogawa ("Third
Party Software"). If suppliers of the Third Party Software ("Supplier") provide special terms and conditions for the Third Party Software which differ from this Agreement,
the special terms and conditions separately provided by Yokogawa shall prevail over this Agreement. Some software may be licensed to you directly by Supplier.
2.7 The Software Product may contain open source software ("OSS"), for which the special terms and conditions separately provided by Yokogawa shall take precedence
over this Agreement.
3. Restrictions on Application
3.1 Unless otherwise agreed in writing between you and Yokogawa, the Software Product is not intended, designed, produced or licensed for use in relation to aircraft
operation or control, ship navigation or marine equipment control, or ground facility or device for support of the aforesaid operation or control, or for use in relation
to rail facility, nuclear related facility, radiation-related equipment, or medical equipment or facility, or under any other circumstances which may require high safety
standards.
3.2 If the Software Product is used for the abovementioned purposes, neither Yokogawa nor Supplier assumes liability for any claim or damage arising from the said use
and you shall indemnify and hold Yokogawa, Supplier, their afliates, subcontractors, ofcers, directors, employees and agents harmless from any liability or damage
whatsoever, including any court costs and attorney's fees, arising out of or related to the said use.
4. Limited Warranty
4.1 The Software Product shall be provided to you on an "as is" basis at the time of delivery and except for physical damage to the recording medium containing the
Software Product, Yokogawa and Supplier shall disclaim all of the warranties whatsoever, express or implied, and all liabilities therefrom. If any physical defect is found
on the recording medium not later than twelve (12) months from delivery, Yokogawa shall replace such defective medium free of charge, provided that the defective
medium shall be returned to the service ofce designated by Yokogawa at your expense within the said twelve (12) months. THIS LIMITED WARRANTY PROVIDED
IN THIS CLAUSE IS IN LIEU OF ALL OTHER WARRANTIES OF ANY KIND WHATSOEVER AND YOKOGAWA HEREBY DISCLAIMS ALL OTHER WARRANTIES
RELATING TO THE SOFTWARE PRODUCT, WHETHER EXPRESSED OR IMPLIED, INCLUDING WITHOUT LIMITATION, ANY IMPLIED WARRANTIES OF
MERCHANTABILITY, FITNESS FOR ANY PARTICULAR PURPOSE, NON-INFRINGEMENT, QUALITY, FUNCTIONALITY, APPROPRIATENESS, ACCURACY,
RELIABILITY AND RECENCY. IN NO EVENT SHALL YOKOGAWA WARRANT THAT THERE IS NO INCONSISTENCY OR INTERFERENCE BETWEEN THE
SOFTWARE PRODUCT AND OTHER SOFTWARE NOR SHALL BE LIABLE THEREFOR. The warranty provisions of the applicable law are expressly excluded to the
extent permitted.
4.2 At the sole discretion of Yokogawa, Yokogawa may upgrade the Software Product to the new version number ("Upgrade") and make it available to you at your expense
or free of charge as Yokogawa deems t. In no event shall Yokogawa be obliged to upgrade the Software Product or make the Upgrade available to you.
4.3 Certain maintenance service may be available for some types of Software Product at Yokogawa's current list price. Scope and terms and conditions of the maintenance
service shall be subject to those separately provided by Yokogawa. Unless otherwise provided in Yokogawa catalogues or General Specications, maintenance services
will be available only for the latest version and the immediately preceding version. In no event will service for the immediately preceding version be available for more
than 5 years after the latest version has been released. In addition, no service will be provided by Yokogawa for the Software Product which has been discontinued for
more than 5 years. Notwithstanding the foregoing, maintenance service may not be available for non-standard Software Product. Further, in no event shall Yokogawa
provide any service for the Software Product which has been modied or changed by any person other than Yokogawa.
ii
IM WX101-01E
Page 4

Software License Agreement
5. Infringement
5.1 If you are warned or receive a claim by a third party that the Software Product in its original form infringes any third party's patent (which is issued at the time of delivery
of the Software Product), trade mark, copyright or other intellectual property rights ("Claim"), you shall promptly notify Yokogawa thereof in writing.
5.2 If the infringement is attributable to Yokogawa, Yokogawa will defend you from the Claim at Yokogawa's expense and indemnify you from the damages nally granted
by the court or otherwise agreed by Yokogawa out of court. The foregoing obligation and indemnity of Yokogawa shall be subject to that i) you promptly notify Yokogawa
of the Claim in writing as provided above, ii) you grant to Yokogawa and its designees the full authority to control the defense and settlement of such Claim and iii) you
give every and all necessary information and assistance to Yokogawa upon Yokogawa's request.
5.3 If Yokogawa believes that a Claim may be made or threatened, Yokogawa may, at its option and its expense, either a) procure for you the right to continue using the
Software Product, b) replace the Software Product with other software product to prevent infringement, c) modify the Software Product, in whole or in part, so that it
become non-infringing, or d) if Yokogawa believes that a) through c) are not practicable, terminate this Agreement and refund you the paid-up amount of the book value
of the Software Product as depreciated.
5.4 Notwithstanding the foregoing, Yokogawa shall have no obligation nor liability for, and you shall defend and indemnify Yokogawa and its suppliers from, the Claim, if the
infringement is arising from a) modication of the Software Product made by a person other than Yokogawa, b) combination of the Software Product with hardware or
software not furnished by Yokogawa, c) design or instruction provided by or on behalf of you, d) not complying with Yokogawa's suggestion, or e) any other causes not
attributable to Yokogawa.
5.5 This section states the entire liability of Yokogawa and its suppliers and the sole remedy of you with respect to any claim of infringement of a third party's intellectual
property rights. Notwithstanding anything to the contrary stated herein, with respect to the claims arising from or related to the Third Party Software or OSS, the special
terms and conditions separately provided for such Third Party Software or OSS shall prevail.
6. Limitation of Liability
6.1 EXCEPT TO THE EXTENT THAT LIABILITY MAY NOT LAWFULLY BE EXCLUDED IN CONTRACT, YOKOGAWA AND SUPPLIERS SHALL NOT BE LIABLE TO ANY
PERSON OR LEGAL ENTITY FOR LOSS OR DAMAGE, WHETHER DIRECT, INDIRECT, SPECIAL, INCIDENTAL, CONSEQUENTIAL OR EXEMPLARY DAMAGES,
OR OTHER SIMILAR DAMAGES OF ANY KIND, INCLUDING WITHOUT LIMITATION, DAMAGES FOR LOSS OF BUSINESS PROFITS, BUSINESS INTERRUPTION,
LOSS OR DESTRUCTION OF DATA, LOSS OF AVAILABILITY AND THE LIKE, ARISING OUT OF THE USE OR INABILITY TO USE OF THE SOFTWARE PRODUCT,
OR ARISING OUT OF ITS GENERATED APPLICATIONS OR DATA, EVEN IF ADVISED OF THE POSSIBILITY OF SUCH DAMAGES, WHETHER BASED IN
WARRANTY (EXPRESS OR IMPLIED), CONTRACT, STRICT LIABILITY, TORT (INCLUDING NEGLIGENCE), OR ANY OTHER LEGAL OR EQUITABLE GROUNDS.
IN NO EVENT YOKOGAWA AND SUPPLIER'S AGGREGATE LIABILITY FOR ANY CAUSE OF ACTION WHATSOEVER (INCLUDING LIABILITY UNDER CLAUSE
5) SHALL EXCEED THE DEPRECIATED VALUE OF THE LICENSE FEE PAID TO YOKOGAWA FOR THE USE OF THE CONCERNED PART OF THE SOFTWARE
PRODUCT. If the Software Product delivered by Yokogawa is altered, modied or combined with other software or is otherwise made different from Yokogawa
catalogues, General Specications, basic specications, functional specications or manuals without Yokogawa's prior written consent, Yokogawa shall be exempted
from its obligations and liabilities under this Agreement or law.
6.2 Any claim against Yokogawa based on any cause of action under or in relation to this Agreement must be given in writing to Yokogawa within three (3) months after the
cause of action accrues.
7.Export Control
You agree not to export or provide to any other countries, whether directly or indirectly, the Software Product, in whole or in part, without prior written consent of Yokogawa.
If Yokogawa agrees such exportation or provision, you shall comply with the export control and related laws, regulations and orders of Japan, the United States of America,
and any other applicable countries and obtain export/import permit and take all necessary procedures under your own responsibility and at your own expense.
8. Audit; Withholding
8.1 Yokogawa shall have the right to access and audit your facilities and any of your records, including data stored on computers, in relation to the use of the Software
Product as may be reasonably necessary in Yokogawa's opinion to verify that the requirements of this Agreement are being met.
8.2 Even after license being granted under this Agreement, should there be any change in circumstances or environment of use which was not foreseen at the time of
delivery and, in Yokogawa's reasonable opinion, is not appropriate for using the Software Product, or if Yokogawa otherwise reasonably believes it is too inappropriate
for you to continue using the Software Product, Yokogawa may suspend or withhold the license provided hereunder.
9. Assignment
If you transfer or assign the Software Product to a third party, you shall expressly present this Agreement to the assignee to ensure that the assignee comply with this
Agreement, transfer all copies and whole part of the Software Product to the assignee and shall delete any and all copy of the Software Product in your possession
irretrievably. This Agreement shall inure to the benet of and shall be binding on the assignees and successors of the parties.
10. Termination
Yokogawa shall have the right to terminate this Agreement with immediate effect upon notice to you, if you breach any of the terms and conditions hereof. Upon termination of
this Agreement, you shall promptly cease using the Software Product and, in accordance with sub-clause 2.5, return or irretrievably delete all copies of the Software Product,
certifying the same in writing. In this case the license fee paid by you for the Software Product shall not be refunded. Clauses 2.4 and 2.5, 3, 5, 6 and 11 shall survive any
termination of this Agreement.
11. Governing Law; Disputes
This Agreement shall be governed by and construed in accordance with the laws of Japan.
Any dispute, controversies, or differences which may arise between the parties hereto, out of, in relation to or in connection with this Agreement ("Dispute") shall be resolved
amicably through negotiation between the parties based on mutual trust. Should the parties fail to settle the Dispute within ninety (90) days after the notice is given from either
party to the other, the Dispute shall be addressed in the following manner:
(i) If you are a Japanese individual or entity, the Dispute shall be brought exclusively in the Tokyo District Court (The Main Court) in Japan.
(ii) If you are not a Japanese individual or entity, the Dispute shall be nally settled by arbitration in Tokyo, Japan in accordance with the Commercial Arbitration Rules
of the Japan Commercial Arbitration Association. All proceedings in arbitration shall be conducted in the English language, unless otherwise agreed. The award of
arbitration shall be nal and binding upon both parties, however, each party may make an application to any court having jurisdiction for judgment to be entered on
the award and/or for enforcement of the award.
12. Miscellaneous
12.1 This Agreement supersedes all prior oral and written understandings, representations and discussions between the parties concerning the subject matter hereof to the
extent such understandings, representations and discussions should be discrepant or inconsistent with this Agreement.
12.2 If any part of this Agreement is found void or unenforceable, it shall not affect the validity of the balance of the Agreement, which shall remain valid and enforceable
according to its terms and conditions. The parties hereby agree to attempt to substitute for such invalid or unenforceable provision a valid or enforceable provision that
achieves to the greatest extent possible the economic, legal and commercial objectives of the invalid or unenforceable provision.
12.3 Failure by either party to insist on performance of this Agreement or to exercise a right when entitled does not prevent such party from doing so at a later time, either in
relation to that default or any subsequent one.
End of document
IM WX101-01E
iii
Page 5

How to Use This Manual
Structure of the Manual
This User’s Manual consists of the following nine chapters and an index.
Chapter Title Description
1 Before Operation Gives an overview of the DAQLOGGER and the
2 Configuring the System Describes the system environment that is required to
3 Monitoring the Data Describes how to display the data being scanned and
4 Displaying the Waveform
on the Viewer
5 File Utility Describes how to merge or divide the file containing
6 Event Processor Describes how to transfer the target file to an FTP
7 Configuring the Recorder Describes how to configure the recorder.
8 Using the DAQLOGGER
Client Package
9 Error Messages and
Corrective Actions
Index Gives a list of important terms used in this manual.
DAQLOGGER Client Package. Also describes the
PC requirements needed to run the application, the
installation procedures, and other information.
run DAQLOGGER and how to setup the system such
as tags.
how to change the display settings.
Describes how to display the waveform or numerical
values of the recorded data and how to change the
display settings. Also describes how to display the
statistics that are computed over a specified area and
how to convert the data format.
scanned and recorded data. Also describes how to
convert the scanned and recorded data or report data
to Excel, ASCII, or Lotus format.
server, transmit the file through e-mail messages,
or convert the files when the specified conditions of
alarm, time, and system status are met.
Describes the operating procedure of the
DAQLOGGER Client Package.
Describes the error messages and their corrective
actions.
Scope of the Manual
This manual does not explain the basic operations of your PC's operating system (OS).
For information regarding the basic operations of Windows, see the Windows user’s
manual.
iv
IM WX101-01E
Page 6

Conventions Used in This Manual
Procedure
This subsection contains the operating procedure used to carry out
the function described in the current section. All procedures are
written with inexperienced users in mind; experienced users may
not need to carry out all the steps.
Note
Calls attention to information that is important for proper operation
of the instrument.
Unit
K Denotes 1024. Example: 100 KB
M Denotes 1024K. Example: 10 MB
G Denotes 1024M. Example: 2 GB
Symbols used in operational explanation
In the pages explaining operation (chapter 1 to 8), the following symbols are used to
distinguish the descriptions.
IM WX101-01E
v
Page 7

Contents
Software License Agreement ............................................................................................................ii
How to Use This Manual ..................................................................................................................iv
Conventions Used in This Manual ....................................................................................................v
Chapter 1 Before Operation
1.1 Overview of the DAQLOGGER/DAQLOGGER Client Package .......................................... 1-1
1.2 PC System Requirements and Recorders That Can Be Connected ................................. 1-10
Chapter 2 Configuring the DAQLOGGER
2.1 The Workflow of the Configuration.......................................................................................2-1
2.2 Preparing the Recorder ....................................................................................................... 2-2
2.3 Starting DAQLOGGER ........................................................................................................
2.4 Setting a Project ..................................................................................................................
2.5 Setting the Security ..............................................................................................................
2.6 Setting Communications and the Connected Recorder .....................................................2-13
2.7 Setting
2.8 Setting Groups ...................................................................................................................
2.9 Configuring the Logger ...................................................................................................... 2-38
2.10 Configuring the Report Function ........................................................................................ 2-44
2.11
Setting Up the DDE Server ................................................................................................ 2-52
2.12
Setting Up the Monitor Server ...........................................................................................2-55
2.13 Setting Up the Control Server ............................................................................................ 2-57
....................................................................................................................... 2-26
Tags
2-3
2-5
2-8
2-32
Chapter 3 Using Data Monitor
3.1 Displaying Waveforms on the Monitor Window ................................................................... 3-1
3.2 Setting the Display Conditions ............................................................................................. 3-5
3.3 Changing the Display Settings of Monitor Windows .......................................................... 3-10
3.4 Using the Cursors ......................................................................................................
Saving the Monitor Window ............................................................................................... 3-22
3.5
3.6 Pausing and
Terminating the Monitor ................................................................................
Chapter 4 Using Historical Viewer
4.1 Displaying Waveforms on the Viewer Window .................................................................... 4-1
4.2 Setting the Display Conditions ............................................................................................. 4-7
4.3 Changing the Viewer Window .............................................................................................4-1
4.4 Using the Cursors .............................................................................................................. 4-17
4.5
Using Marks ....................................................................................................................... 4-21
4.6
Searching Measured/Computed Data, Alarms, and Marks ................................................
4.7 Converting Data Formats ...................................................................................................4-27
4.8 Exporting Data ......................................................................................................
Printing Data ...................................................................................................................... 4-35
4.9
4.10
Linking and Displaying Data Files ......................................................................................4-37
4.11
Saving the Display Conditions/Terminating the Historical V
Chapter 5 File Utility
5.1 Starting the File Utility .......................................................................................................... 5-1
5.2 Merging Measurement Data Files ........................................................................................5-2
5.3 Dividing Measurement Data Files ........................................................................................ 5-5
5.4 Converting the Data Format ................................................................................................5-9
........ 3-19
3-23
1
4-23
............. 4-34
iewer ...................................... 4-40
vi
IM WX101-01E
Page 8

1
2
3
4
5
6
7
8
9
Index
Contents
5.5 Restructuring Measurement Data Files ..............................................................................5-11
5.6 Exiting the File Utility ......................................................................................................... 5-13
Chapter 6 Event Processor
6.1 Setting Events ......................................................................................................................6-1
6.2 Saving, Deleting, Redisplaying, or Copying Events ...........................................................6-18
6.3 Starting/Stopping the Event Processor .............................................................................. 6-20
6.4 Displaying Error Information .............................................................................................. 6-21
Chapter 7 Setting the Recorder
7.1 Starting the Hardware Configurator ..................................................................................... 7-1
7.2 Loading the Setting Parameters .......................................................................................... 7-4
7.3 Editing the Setting Parameters ............................................................................................ 7-5
7.4 Setting VR Series ......................................................................................................
Setting µR Series ............................................................................................................... 7-16
7.5
7.6
Setting DX100, DX200, MV100, MV200 ............................................................................ 7-20
7.7 Setting DX1000/DX2000 ....................................................................................................7-44
7.8 Setting MV1000/MV2000 ..................................................................................................7-1
7.9 Setting DARWIN
7.10 Setting CX Series ............................................................................................................7-198
7.1
1 Writing Setting Parameters to the Recorder ....................................................................
7.12 Initializing the Setup Parameters .....................................................................................7-266
7.13 Handling Setting Data Using a Floppy Disk ..................................................................... 7-267
7.14 Saving the Settings .......................................................................................................
7.15
Printing the Settings .........................................................................................................7-272
7.16
Transmitting Control Commands to the Recorder ........................................................... 7-273
7.17
Starting/Stopping the DARWIN Report Function and Executing Balancing ....................
......................................................................................................
.......... 7-9
17
........ 7-165
7-264
... 7-271
7-277
Chapter 8 Using DAQLOGGER Client Package
8.1 Starting the Remote Monitor/Connecting to the Server ....................................................... 8-1
8.2 Monitoring the Data ............................................................................................................. 8-5
Chapter 9 Error Messages and Their Corrective Actions
Index
8.3 Using the Historical Viewer ................................................................................................ 8-15
8.4
Using the File Utility ........................................................................................................... 8-16
8.5
Using the Remote Controller .............................................................................................8-17
9.1 Error Messages and Their Corrective Actions .....................................................................9-1
IM WX101-01E
vii
Page 9

1
Chapter 1 Before Operation
1.1 Overview of the DAQLOGGER/DAQLOGGER Client Package
DAQLOGGER
DAQLOGGER is a software application used to acquire measured or computed data
from a recording device (hereinafter, recorder) connected to a PC that has DAQLOGGER
installed or multiple recorders connected to other PCs. The maximum number of
channels that can be managed is 1600. Also, through Gate software applications, you
can use the DX100P/DX200P, MX100, WT series instruments, µR10000, µR20000,
Controllers, or DAQLOGGER to acquire or monitor data from other devices that are not
directly compatible, including Yokogawa or other manufacturer’s measuring instruments
and OPC servers (DCS and PLC etc.).
Devices That Can Be Accessed
When used in combination with DAQ32Plus, DAQEXPLORER, DAQLOGGER,
MXLOGGER, and Gate software, DAQLOGGER can acquire data from multiple
connected PCs and recorders (uR, VR, DX, CX, MV, DARWIN) via Ethernet. Each
software application can be set up internally with individual systems having their own
logging intervals. The following number of systems are available. Recorders (uR, VR,
DX, CX, MV, DARWIN) allow 1 system per unit.
DAQ32Plus: 1
DAQEXPLORER: up to 16
DAQLOGGER: 1
MXLOGGER: up to 61
GateMODBUS: 1
GateCONTROL: 32
Gate software applications other than GateMODBUS, GateCONTROL or GateEye: up to 16
Up to 32 systems total can be connected using DAQLOGGER. For example, when
acquiring data from 15 DAQEXPLORER systems, 1 DAQ32Plus system, 1 Gate software
system, and 1 DX unit, you can also acquire data from up to 14 of MXLOGGER’s 61
systems. Data acquired from software or from recorders is processed in the same
manner. Communication can be performed with the following versions of the software
programs.
DAQ32Plus R9.01 or later
DAQEXPLORER R1.01 or later
DAQLOGGER R3.01 or later
MXLOGGER R1.01 or later
Gate R1.01 or later
Before Operation
IM WX101-01E
1-1
Page 10

1-2
IM WX101-01E
VIEW RECORDER VR200
DAQLOGGER DAQLOGGER client
RS-232/RS-422A converter
Any combination of 32 of
the µR, VR, DX, CX, MV,
DARWIN, DAQEXPLORER,
DAQ32Plus, DAQLOGGER,
MXLOGGER, and Gate
recorders/PC-based
recording applications.
RS-232
RS-232
RS-422A
Ethernet
Data
transmission
Data acquisition
Data acquisition
Data acquisition
DAQLOGGER
DAQ32Plus
VIEW RECORDER VR200
DAQEXPLORER
1 PC.
VIEW RECORDER VR200
Gate
HUB
MXLOGGER
MX100
1.1 Overview of the DAQLOGGER/DAQLOGGER Client Package
The main functions of DAQLOGGER are as follows:
• Connects up to 32 units of µR recorders (µR1000/µR1800), VR recorders (VR100/
VR200), DAQSTATION (DX100/DX200/DX200C/CX1000/CX2000/DX1000/DX2000),
MobileCorder (MV100/MV200) and DARWIN (DA100/DC100/DR130/DR200) to one
PC (different models can coexist).
•
Scans and records up to the maximum number of channels (1600, 1000, or 400) of
measured/computed data at a minimum interval of 1 second (the interval may be
longer depending on the number of connected units and the number of channels).
• Monitors and displays the measured/computed data being scanned in ve forms:
trend, numerical, meter, alarm, and color graph.
•
Displays the measured/computed data that have been stored, searches for data,
alarms, and marks, computes statistics over an area that is specied by the cursors,
converts the data format to “ASCII,” “Lotus,” and “Excel” formats, extracts a section of
a le to be stored to another le, and prints various data and information.
•
Manages data using tag name (up to 16 characters) that was assigned to each
channel on the PC.
• Manages tags by separating them into a maximum of 50 groups (up to 32 tags/group).
• Saves DAQLOGGER settings (this is called a “project”) accord
ing to the user or the
purpose. Allows switching between projects.
• Protection from erroneous operation provided through operation levels of users and
password protection.
• Generates various reports such as hourly, daily, weekly and monthly reports on a PC.
•
Congures the recorder from the PC.
• Incorporates a DDE server function.
• Transfers the scanned and recorded data to another PC via the network (the PC
receiving the data requires the DAQLOGGER Client Package).
• With the e-mail function, the fact that an alarm occurred can be notied through
e-mail.
• With the FTP function, les can be transferred to an FTP server when data les or
report les are created.
Page 11

1
1.1 Overview of the DAQLOGGER/DAQLOGGER Client Package
Software Construction of DAQLOGGER
DAQLOGGER consists of the following 14 software applications.
• Software Manager
This program is started rst and manages the startup of other DAQLOGGER software
applications.
It also manages multiple projects.
• A
project refers to the set of DAQLOGGER settings that corresponds to each user
or purpose. It contains the settings of all software applications that are described
below. Using Software Manager
By switching projects, you can easily switch between different sets of settings that
have been stored previously.
•
You can limit the range of operation by assigning one of three levels, “Supervisor
“Operator,” or “User,” to a project.
• You can assign a password for each project and limit the operation (password
protection).
•
You can hide the taskbar and icons of Windows so that other programs cannot be
started (desktop protection).
Software Manager is in charge of the user interface provided o
that carries out data scanning and recording and the Report Software that creates
reports. For details, see the description of the respective software application.
For the operation procedure of Software Manager, see sections 2.3, 2.4, and 2.5.
, you can create multiple projects and store them.
,”
n the Logging Software
Before Operation
• Logging Software
The Logging Software collects the measured/computed data from the recorder at
specied intervals. This action is called “scan.” It also stores the scanned data to the
hard disk at specied intervals. This action is called “record.”
The Logging Software never appears on the screen.
carried out through Software Manager:
• Start/Stop scanning.
• Start/Stop recording.
• Set scanning conditions (scan interval, start timing, and opera
computation channels at the start of the scanning operation) and recording
conditions (record interval, data storage directory, le name, and division of stored
les).
•
Set the function that automatically reconnects the recorder.
Display the information (scan interval, record interval, start time of recording,
estimated stop time of recording, le name of recording, and number of recorded data
points) on the data being scanned and recorded.
For the operation procedure of the Logging Software, see sec
The following operations are
tions of the
tion 2.9.
IM WX101-01E
1-3
Page 12

1-4
IM WX101-01E
1.1 Overview of the DAQLOGGER/DAQLOGGER Client Package
• Data Monitor
Data Monitor is started from Software Manager.
This application can display the data that have been scanned by the Logging Software
and the alarm conditions on the following ve types of monitor screens. Each monitor
displays tags that have been assigned to the recorder’s channels using Tag Editor by
groups that have been assigned using Group Editor.
In addition, the display setting dialog box of Data Monitor can
tag assignments, ON/OFF setting for each tag, specify the meters to be used on the
meter monitor, set the tag display color, and set other display conditions.
The display is updated at the scan interval.
Trend monitor
•
Displays the waveform of the scanned data for each group. Y
display conditions such as zooming in or out of the time axis and specifying the
Y-axis zone to be displayed.
• Numeric monitor
Displays the numerical values of the scanned data for each group.
• Meter monitor
Displays the meters of the scanned data for each group.
meter from bar meter, analog meter, and thermometer.
• Alarm monitor
Lists the representative alarm status for each group on a single screen (alarm
overview display). If an alarm is occurring on any one of the tags in a group, the
representative alarm status is shown as “Alarm ON.”
I
t also displays a log of alarm occurrences/releases for each tag including the alarm
type, date and time of occurrence/release, and tag name (alarm log display).
• Color graph monitor
Displays the scanned data on a color graph for each group. The scanned data are
colored in the following order: blue (minimum value), light blue, green, yellow, and
red (maximum value).
For the operation procedure of Data Monitor
be used to change the
ou can change the
You can select the type of
, see chapter 3.
• Historical Viewer
Viewer is started from Software Manager or the Windows Start menu.
Viewer is used to manage the data that have been recorded and stored by the
Logging Software to the hard disk or a storage medium. For data that are currently
being recorded, Viewer can manage the section that have been stored to the hard
disk.
•
Displays the waveforms and numerical values of data of up to 32 tags per group for
up to 50 groups.
• You can change the original data-to-tag assignments, turn ON/OFF the tags,
and change other display conditions.
conditions.
• Calculates the maximum, minimum, P-P, average, and rms values over the area
that is specied by the cursor.
•
You can set conditions and search for the measured/computed data, alarms, and
marks.
You can extract a section of the le to be stored to another le.
•
You can also save the modied display
Page 13

1
1.1 Overview of the DAQLOGGER/DAQLOGGER Client Package
• Reads and displays report les.
• Converts the data format to “ASCII,” “Lotus,” or “Excel” formats.
• Prints the displayed data (a printer is required).
For the operation procedure of Historical Viewer, see chapter 4.
• Software Configurator
Software Congurator is started from Software Manager.
Software Congurator is used to assign recorder numbers of DAQLOGGER to the
recorders that are connected. It is also used to set the congurations of the recorders
and communication parameters. DAQLOGGER scans and records the data based on
the information specied here.
The settings are as follows:
•
Type of communication (RS-232, RS-422, and Ethernet).
• Port, address, baud rate, parity
• Port, baud rate, parity, and stop bit if RS-232 is used.
• Address, login name, user ID, and password if Ethernet is used.
• Type of recorder that is connected, number of measurement channels, and number
of computation channels.
• Standalone model/expandable model, style number, options, and subunit/module
conguration if DARWIN is used.
Software Congurator includes a function that automatically de
registers the model of the recorder that is connected to the specied communication
port (Parameters can be set one by one as some models are not determined
automatically).
For the operation procedure of Software Congurator
, and stop bit if RS-422 is used.
termines and
, see section 2.6.
Before Operation
• Tag Editor
Tag Editor is started from Software Manager.
Tag Editor is used to assign the tags used by DAQLOGGER to the recorder’s
channels. A single channel can have multiple tags.
ddition, you can set names (character string) to the tags. The name is called a “tag
In a
name.” Tag names can be read from the recorder via communications.
Y
ou can search tags by specifying the tag name, tag number, or recorder number.
For the operation procedure of
Tag Editor, see section 2.7.
• Group Editor
Group Editor is started from Software Manager.
The tags that were set by Tag Editor can be assigned to groups, and the groups can
be assigned names. Up to 32 tags can be assigned to a single group.
Up to 50 groups can be assigned.
Data Monitor displays the data by groups that are specied here.
For the operation procedure of Group Editor, see section 2.8.
• Hardware Configurator
Hardware Congurator is started from Software Manager.
Edits the settings in the SET mode (Setting Mode) and SETUP mode (Basic Setting
Mode) of the recorder that is connected to the PC.
When Hardware Congurator is started for the rst time, the initial setup screen
for the SET mode or SETUP mode is displayed based on the model, number of
measurement/computation channels, presence or absence of options (for DAR
and module conguration (for DARWIN) that are specied by Software Congurator.
WIN),
IM WX101-01E
1-5
Page 14

1-6
IM WX101-01E
1.1 Overview of the DAQLOGGER/DAQLOGGER Client Package
• The original SET mode and SETUP mode information can be
• Loaded from the recorder via communications (receive via communications).
• Loaded from a le that is stored on a storage medium such as a oppy disk (this
is called “le importing”).
• Created from scratch.
• The settings after they are edited can be
• Written to the recorder via communications (transmit via communications).
• Stored on a storage medium and written to the recorder from the storage
medium (this is called “le exporting”).
However, the following restrictions exist depending on the recorder:
• Settings for the DX1000 and DX2000 cannot be processed by the setting
software.
• For µR recorders, the SET Mode settings can be transmitted or received via
communications.
Settings in the SETUP
Mode cannot be modied. Set them directly on the µR
recorder. In addition, since no storage media drives are provided, setting using
the storage medium is not possible.
For VR recorders, the SET Mode settings can be transmitted or received
•
via communications or imported or exported through les. The settings
in the SETUP Mode can be modied through le importing and exporting.
Communications cannot be used.
• For DX/CX DAQSTATION and MV MobileCorder
setting mode settings can be transmitted or received via communications or
imported or exported through les. However, network settings (such as the IP
address) cannot be changed via communications. Set them directly on the DX
or use le exporting.
•
For DARWIN, the SET Mode and SETUP
received via communications or imported or exported through les.
• If you are using a DX1000/DX1000N/DX2000 with the /AS1 option on which
users are registered, you cannot use serial communication to transmit settings.
• In addition, Hardware Congurator can be used to create settings by changing the
system conguration such as the presence or absence of options or by changing
the subunit/module conguration (for DAR
such as when preparing the conguration change of the connected recorder
beforehand.
•
The following
control commands can be transmitted to the recorders.
• Set the date and time of the recorder to the date and time of the PC (µR, VR,
DX, MV, CX, DA, DR, and DC).
• Start/Stop the recording (µR, DX, MV, CX, DR, and DC).
• Start/Stop computation (µR, VR, DX, MV
• Initialize the data memory (VR, DX, MV, CX, DC).
• Show the specied display (µR, VR, DX, MV, CX, DR, and DC).
• Execute reconguration (DA, DR200 (Expandable), and DC).
However, if you are using a DX1000/DX1000N/DX2000 with the /AS1 option on
which users are registered, you cannot use serial communication to transmit control
commands.
For the operation procedure of Hardware Congurator
, the setting mode and basic
Mode settings can be transmitted or
WIN). Use this function in situations
, CX, DA, DR, and DC).
, see chapter 7.
• Report Generator
Determines the instantaneous value, maximum, minimum, average, sum, and total
from the data that are scanned or recorded over an hour, a day, a week, or a month
and output them to a le or print them at a specied time. Report Generator never
appears on the screen. The start and stop operation and settings of the report are
done on Software Manager.
Page 15

1
1.1 Overview of the DAQLOGGER/DAQLOGGER Client Package
The following items can be specied.
• Type of report (hourly, daily, weekly, or monthly), the tags to be reported, and the
type of data to be created.
• Data to be used to make the report (scan data or record data).
• Output destination of the report (le or print) and the output le format (binary or
text).
The date or day and time of report generation.
•
In addition, report les (binary) can be displayed on Viewer.
For the operation procedure of Report Generator, see section 2.10.
• DDE* Server
The DDE Server is started from Software Manager.
The server provides DDE services. Data and time that are scanned by the Logger
can be displayed on a Windows application that supports DDE such as EXCEL. Up to
1600 tags can be transmitted via DDE communications.
For the operation procedure of the DDE Server, see section 2.11.
* Dynamic Data Exchange
A technique or procedure used to exchange commands and data between Windows
applications via communications. The database providing the data is called a server. The
application that uses the data is called a client.
Before Operation
• Monitor Server
The Monitor Server is started from Software Manager.
Transfers the scanned data to a PC (Remote Monitor
Ethernet network. Up to 16 remote monitors can be connected.
Remote Monitor can be used to display and monitor the received data.
For the operation procedure of the Monitor Server, see section 2.12.
* Remote monitor
The DAQLOGGER Client Package is required on Remote Monitor side. For an overview
of the functions of the DAQLOGGER Client Package, see the next section, “DAQLOGGER
Client Package.”
*
) that is connected via the
• File Utility
The File Utility performs four functions, Merge, Divide, Convert, and Restructure, on
the data le or report le that the DAQLOGGER creates.
Merge: Merges the les that are continuous in time to a single le.
Divide: Divides or cuts the data les according to various con
ditions.
Convert: Converts data les or report les to Excel, ASCII, or Lotus format and
outputs them.
Restruct.: Performs data le merging and dividing at once.
For the operating procedure of the File Utility, see chapter 5.
• Event Processor
The Event Processor is a software program that can process up to 8 events
simultaneously. The settings of a single event consists of event condition, target
le, and process parameters. In event process, the le specied by target le is
processed using the command specied by process when the conditions specied by
event conditions are met. For the operating procedure of the Event Processor, see
chapter 6.
IM WX101-01E
1-7
Page 16

1-8
IM WX101-01E
1.1 Overview of the DAQLOGGER/DAQLOGGER Client Package
• Control Server
The Control Server is started from the Manager software. Using a PC connected via
Ethernet (remote controller
the event processor. For the operating procedure of the Control Server, see section
2.13.
** Remote Controller
The DAQLOGGER client package is required for the remote controller. For an overview of
the package’s functions, see “DAQLOGGER Client Package” below.
Note the following when performing communications with a PC on which DAQ32Plus,
DAQEXPLORER, DAQLOGGER, or MXLOGGER is installed.
• Only Ethernet may be used for communications.
• When connecting to the DAQ32Plus, DAQEXPLORER, DAQLOGGER, or
MXLOGGER, the hardware congurator cannot be used to enter settings (see chapter
7).
•
The data’s measurement time is determined by the PC controlled by the master
DAQLOGGER.
This time may differ from any slave DAQ32Plus, DAQEXPLORER,
DAQLOGGER, or MXLOGGER that are connected.
• You must use the software congurator to change the port number or enter a system
n
umber (DAQEXPLORER, MXLOGGER) for making a connection to a specic system
(see section 2.6).
**
), you can start a scan, start/stop recording, and start/stop
DAQLOGGER Client Package
The DAQLOGGER Client Package is used to receive data from a PC (Monitor Server)
that is connected via the network and display the measured/computed data on the
monitor screen.
The main functions are as follows:
•
Connects up to 16 Monitor Servers.
• Re
ceives data consisting of up to 1600 tags from a single server at a minimum interval
of 1 s and updates the display (the interval may be longer depending on the number
of connected servers and the number of tags).
•
Displays the data from the server on one of six types of monitors: trend, digital, meter,
alarm, color graph, and circular
• Displays tags by dividing them into groups (up to 50 groups, up to 32 tags per group).
• Loads and displays the le containing data that have been rec
Software of DAQLOGGER and carries out various operations such as computation
over an area specied by the cursors, data conversion, display of le information, and
printing (same as Viewer of DAQLOGGER).
Software Construction of DAQLOGGER Client Package
• Remote Monitor
Remote Monitor is started from Windows Start menu.
Sets the conditions for connecting to the server (host name, port number, frequency
of data retrieval) and connects/disconnects from the server. The conditions for
connection can be stored.
Displays the data from the monitor server on the following six types of monitors. On
each monitor, you can change the display-related settings such as change the tag
assignment or turn ON/OFF the tag display.
stored.
.
orded by the Logging
The display conditions can also be
Page 17

1
1.1 Overview of the DAQLOGGER/DAQLOGGER Client Package
The data display is updated according to the interval (frequency of data retrieval) that
is specied by the conditions for connection.
• Trend monitor
Displays the waveform of the retrieved data for each group. You can change the
display conditions such as zooming in or out of the time axis and specifying the
Y-axis zone to be displayed.
• Numeric monitor
Displays the numerical values of the retrieved data for each group.
• Meter monitor
Displays the meters of the retrieved data for each group. You can select the type
of meter from bar meter, analog meter, and thermometer.
• Alarm monitor
Lists the representative alarm status for each group on a single screen (alarm
overview display). If an alarm is occurring on any one of the tags in a group, the
representative alarm status is shown as “Alarm ON.”
I
lso displays a log of alarm occurrences/releases for each tag including the alarm
t a
type, date and time of occurrence/release, and tag name (alarm log display).
• Color graph monitor
Displays the retrieved data on a color graph for each group. The data are colored
in the following order: blue (minimum value), light blue, green, yellow, and red
(maximum value).
• Circular monitor
Displays the retrieved data on a circular graph for each group.
For the operation procedure of Remote Monitor, see sections 8.1 and 8.2.
Before Operation
• Historical Viewer
Viewer is started from Windows Start menu.
Viewer is used to manage the data that have been recorded and stored by the
Logging Software to the hard disk or a storage medium. The functions are the same
as those for DAQLOGGER Historical Viewer. See the description on DAQLOGGER
Historical Viewer. However, data that DAQLOGGER is recording cannot be accessed.
For the operation procedure of Historical V
iewer, see section 8.3.
• File Utility
The File Utility is started from Windows Start menu.
It performs four functions, Link, Divide, Convert, and Restructure, on the data le or
report le that the DAQLOGGER creates. The functions are the same as those for
DAQLOGGER File Utility.
See the description on DAQLOGGER File Utility.
For details on the File Utility, see chapter 5.
• Remote Controller
The remote controller can be run from the Windows start menu. Enter settings for
connection with the control server (host name, port number used, login/password)
to be used when opening/closing the connection. The following operations can be
performed while connected.
•
Start scan, start/stop recording
• Start/stop the event processor, generate user events
IM WX101-01E
1-9
Page 18

1-10
IM WX101-01E
1.2 PC System Requirements and Recorders That Can Be Connected
PC System (for DAQLOGGER)
OS
Run DAQWORX under any of the following operating systems.
• Windows 2000 Professional SP4
• Windows XP Home Edition SP3
• Windows XP Professional SP3 (excluding Windows XP Professional x64 Editions)
• Windows Vista Home Premium SP2 (excluding the 64-bit editions)
• Windows Vista Business SP2 (excluding the 64-bit editions)
• Windows 7 Home Premium, SP1 (32-bit and 64-bit editions)
• Windows 7 Professional, SP1 (32-bit and 64-bit editions)
The language displayed by the software under different language versions of the OS are
as follows.
OS Language Software Language
Japanese Japanese
Chinese Chinese
Other English
File System
NTFS is recommended. With FAT32, the number of files that can be saved in a single
folder is much smaller. If the limit is reached and additional files cannot be saved, the
software will not function normally. To prevent this, please periodically stop recording by
the software and move the data to a different folder.
PC
A PC that runs one of the OS above, and that meets the following CPU and memory
requirements.
When Using Windows 2000 or Windows XP
Pentium 4, 1.6 GHz or faster Intel x64 or x86 processor; 512 MB or more of memory
When Using Windows Vista
Pentium 4, 3 GHz or faster Intel x64 or x86 processor; 2 GB or more of memory
When Using Windows 7
32-bit edition: Intel Pentium 4, 3 GHz or faster x64 or x86 processor; 2 GB or more of
memory
64-b
it edition: Intel x64 processor that is equivalent to Intel Pentium 4, 3 GHz or faster;
2 GB or more of memory
Hard Disk
Free disk space: 200 MB or more (more may be required depending on the amount of
data to be acquired)
CD-ROM Drive (for Use during Installation)
Mouse and Keyboard
A mouse and keyboard supported by the OS
Monitor
A video card that is recommended for the OS and a display that is supported by the OS,
has a resolution of 1024×768 or higher, and that can show 65,536 colors (16-bit, high
color) or more.
Communication port
• COM port supported by the OS (selected from COM1 to COM9).
• An Ethernet port supported by the OS (when connecting DAQSTATION, MV, or
DARWIN via the Ethernet network or when using the monitor server)
Page 19

1
1.2 PC System Requirements and Recorders That Can Be Connected
Printer (used when printing)
Printer and printer driver supported by the OS
Communication converter (necessary for RS-422 communication)
RS-232/RS-422 converter
Recorder
• µR recorder
µR1000 or µR1800 with communication option (RS-422, /C3).
µR12000 cannot be used (GateµR required to use the µR10000/µR20000).
• VR View Recorder
VR100 (VR104P, VR104D, VR106P, and VR106D) or VR200 (VR202, VR204, VR206,
VR202 S2, VR204 S2, and VR206 S2) with communication option (RS-422, /C3).
• DX DAQSTATION
DX100 (DX102, DX104, DX106, and DX112), DX200 (DX204, DX208, DX210, DX220,
and DX230), DX200C, DX1000 (DX1002, DX1004, DX1006, DX1012, DX1002N,
DX1004N, DX1005N, DX1012N), or DX2000 (DX2004, DX2008, DX2010, DX2020,
DX2030, DX2040, DX2048).
When using serial communications, communication option (RS
RS-485, /C3).
-232, /C2 or RS-422/
Before Operation
• MV MobileCorder
MV100 (MV102, MV104, MV106, MV112), MV200 (MV204, MV208, MV210, MV220,
MV230).
When using serial communications, communication option (RS-232, /C2 or RS-422/
RS-485, /C3).
• MVAdvanced
MV1000 (MV1002, MV1004, MV1006, MV1012) or MV2000 (MV2008, MV2010,
MV2030, MV2040, MV2048).
When using serial communications, communication option (RS-232, /C2 or RS-422/
RS-485, /C3).
• CX DAQSTATION
CX1000 (CX1000, CX1006, CX1200, CX1206), CX2000 (CX2000, CX2010, CX2020,
CX2210, CX2220, CX2410, CX2420, CX2610, CX2620).
When using serial communications, communication option (RS-232, -□-1, RS-422/
RS-485, -□-2).
• DARWIN
DA100, DR130, DR200 (DR231, DR241, DR232, and DR242), or DC100 with a
communication option or communication module (Ethernet, RS-232-C, or RS-422-A/
RS-485)
.
Note
• Data created in 2035 or later cannot be handled.
• DAQLOGGER creates a time stamp based on the clock of the PC in which DAQLOGGER is
installed. Because of this, you should not change the PC’s clock settings or related settings
while DAQLOGGER is running. Also, Windows 2000, and Windows XP operate by default
under the Windows Time service in which the time is automatically set on the PC per a time
server, so you must shut down this service. For details, see the Windows user’s manual.
IM WX101-01E
1-11
Page 20

1-12
IM WX101-01E
1.2 PC System Requirements and Recorders That Can Be Connected
PC System (for DAQLOGGER Client Package)
OS: Same as for DAQLOGGER.
PC: Same as for DAQLOGGER.
Hard disk
Free disk space: 200 MB or more
CD-ROM Drive (for Use during Installation)
Mouse: Same as for DAQLOGGER.
Monitor: Same as for DAQLOGGER.
Communication port: Ethernet port supported by the OS.
Printer (used when printing): Same as for DAQLOGGER.
Note
Data created in 2035 or later cannot be handled.
Page 21
1
2
Section 2.2
Section 2.3
Section 2.4
Section 2.5
Section 2.6
Section 2.7
Section 2.8
Chapter 7
Section 2.9
Section 2.10
Section 2.11
Section 2.12
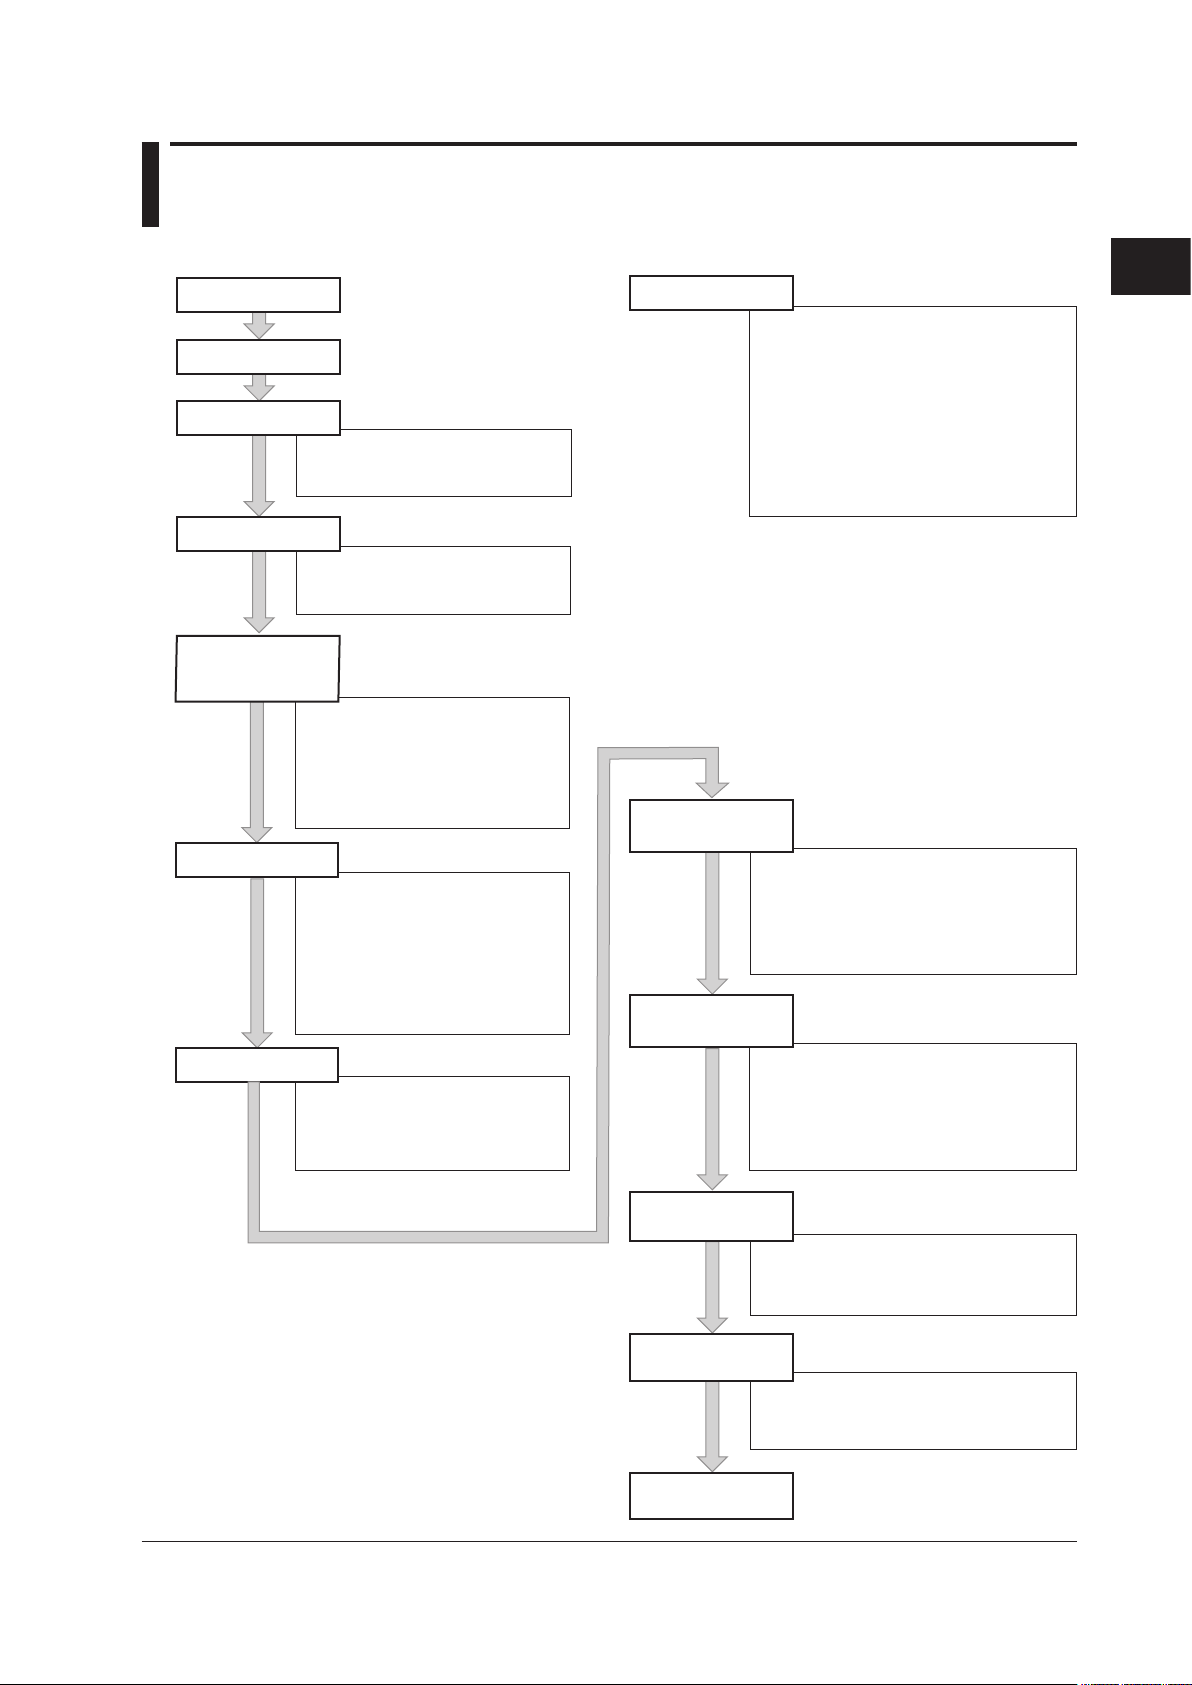
Prepare the recorder
Start DAQLOGGER
Set a project
Set the security
Set communications
and the connected
recorder models
Set tags
Set groups
Set the recorder
Configure the Logger
Configure the report
function
Set up the
DDE Server
Set up the
Monitor Server
Section 2.13
Set up the
Control Server
• Create a new project
• Select an existing project
• Delete an existing project
• Set operation level to a project
• Set password protection
• Set desktop protection
• Set communications
• Set connected recorder models
• Save the settings
• Revert to the last saved settings
• Initialize the serial port
• Print the settings
• Terminate the Software Configurator
• Assign tags to groups
• Show/hide tags
• Change the group name
• Save the group information
• Terminate the Group Editor
• Set tag information
• Reading tag names from the
recorder
• Search tags
• Moving the display by the specified
number of tags
• Print tag information
• Save tag information
• Terminate the tag editor
• Upload setting parameters
• Set VR series
• Set µR series
• Set DX series
• Set CX series
• Set DARWIN
• Set MV series
• Print setting parameters
• Save setting parameters
• Write setting parameters to the recorder
• Send control commands to the recorder
• Handling of setting data using a floppy disk
• Configure the Logger
• Start the scanning
• Start the recording
• Start/stop computation on recorders
• Display the information of the scanned
and recorded data
• Stop scanning/recording operation
• Set the contents of
hourly/daily/weekly/monthly reports
• Set the printer
• Save the report configuration
• Re-display the current settings
• Terminate the report configuration
• Start/stop the report function
• Start the DDE Server
• Set up the DDE Server
• Pause/terminate the DDE server
• Prepare the DDE client
• Start the Monitor Server
• Set up the Monitor Server
• Pause/terminate the Monitor Server
• Prepare the Remote Monitor
Recorders can be set using
the “Hardware Configurator.”
Chapter 2 Configuring the DAQLOGGER
2.1 The Workflow of the Configuration
The workflow of the configuration is shown below.
Configuring the DAQLOGGER
IM WX101-01E
2-1
Page 22

2.2 Preparing the Recorder
Before starting DAQLOGGER, set recorder’s communication parameters then connect
the recorder to the PC.
For µR1000/µR1800/VR100/VR200
Settings for RS-422 communication
Provide the following settings.
• Baud rate: 9600 bps
• Data length: 8 bits
• Parity: None
• Stop bit: 1 bit
• Address: Set a unique address to each recorder.
See the Communication Function Manual of the recorder (IM 4D5B1-10E, IM 4H3B110E, or IM 4N1A1-11E).
For DX100/DX200/DX200C/MV100/MV200/MV1000/MV2000/CX1000/CX2000/
DX1000/DX2000/DARWIN
Settings for Ethernet communication
For a model capable of Ethernet communication, set the following items.
• IP address
• Subnet mask
• Default gateway
Settings for RS-232 communication
For a model capable of RS-232 communication, provide the following settings.
• Baud rate: 38400 bps
• Data length: 8 bits
• Parity: None
• Handshake: CR:RS
• Protocol: Normal (for DX/MV/CX)
• Stop bit: 1 bit (xed to 1 bit on DX/MV/CX)
Settings for RS-422/RS-485 communication
For a model capable of RS-422A/485 communication, provide the following settings.
• Baud rate: 38400 bps
(9600 bps when connecting µR and VR recorders on a single multidrop line.)
• Data length: 8 bits
• Parity: None
• Address: Set a unique address to each recorder.
• Protocol: Normal (for DX/MV/CX)
• Stop bit: 1 bit (xed to 1 bit on DX/MV/CX)
For more details about communication settings, see the Communication Function Manual
for the recorder (IM 04L02A01-17E, IM MV100-17E, IM DA100-11E, IM DR231-11E, IM
DC100-11E, IM 04L31A01-17E, IM 04L41B01-17E, or IM MV1000-17E).
2-2
IM WX101-01E
Page 23

1
2
2.3 Starting DAQLOGGER
Start scanning
Start Viewer
Start Tag Editor
Start Group Editor
Stop scanning/recording
Start the Data Monitor
Start recording
Start the DDE Server
Start Monitor Server
Status indication
Icons that indicate conditions
Menu Bar
Start File Utility
Start Software Configurator
Start Hardware Configurator
Starts the control server
Report function in operation: white, stopped: gray
• Scanning/Alarm occurred: blinking red
If you point to the icon and click the right button, the "Reset Alarm
Status" button appears. Click the button and the indicator changes
to blinking green.
• Scanning/No alarm: blinking green
• Scanning stopped: gray
• Scanning/Normal response from the recorder, scanning stopped: white
• Scanning/Abnormal response from a recorder: displays an "X" mark
If you point to the icon and click the right button, the "Disconnect Recorder"
and "Reconnect Recorder" menu appears. If you select a certain recorder
from the "Disconnect Recorder" menu, the communication with the recorder
is disconnected. To reconnect the communication with the recorder, select
the recorder from the "Reconnect Recorder" menu.
• Scanning/No data dropouts: blinking blue
• Scanning/Data dropouts occurred: blinking yellow
If you point to the icon and click the right button, the "Reset Missing Data
Status" button appears. Click the button and the indicator changes
to blinking blue.
• Recording: Red, a section of the icon blinks
• Recording stopped: gray
• Scanning: A section of the icon blinks
• Scanning stopped: No blinking
Event Processor
Event Processor in operation: blinking light blue,
stopped: gray, waiting: light blue, error: blinking red
If you point to the icon and click the right button,
the "Reset Error Information" menu appears.
Click the menu. The indicator changes to blinking light blue.
Starting DAQLOGGER
Procedure
1. From the Start menu, select “Programs” - “YOKOGAWA DAQWORX” “DAQLOGGER” - ” Manager.” Software Manager starts and the “DAQLOGGER
Manager” window appears. In the window, there are 13 buttons used to start the
individual applications (functions).
Configuring the DAQLOGGER
The meanings of the icons that indicate conditions are as follows:
IM WX101-01E
2. To start a program, click the corresponding button.
2-3
Page 24

2.3 Starting DAQLOGGER
Note
• Use the recorder disconnect function such as when replacing the chart paper of the
• Do not change the input range of channels after disconnecting the recorder. If you change
• The recorders that have been disconnected using the above procedure cannot be
Terminating DAQLOGGER
Procedure
1. From the menu bar of “DAQLOGGER Manager,” select “File” and then “Exit” or click
the “Close” button at the upper right corner of the window.
Note
Exit all DAQLOGGER programs before terminating Software Manager.
recorder.
the input range of a channel, the channel is processed as if it is turned OFF when the
recorder is reconnected.
automatically reconnected. For details on the auto reconnect function, see section 2.9.
2-4
IM WX101-01E
Page 25

1
2
2.4 Setting a Project
DAQLOGGER operates on a project basis.
For each project, you can save the settings for logging and report generating functions
and those for the applications started by Software Manager.
By changing this project, you can easily switch between the sets of different settings that
have previously been saved.
Note
The operations described in the following are possible only when all DAQLOGGER applications
other than Software Manager are terminated and the password protection is not used.
Creating a New Project
To create a new project, the operation level of the current project must be “Supervisor.”
Procedure
1. Before operation, make sure that DAQLOGGER is not communicating, applications
other than Software Manager are not running, and the password protection is not
used.
2.
In the menu bar of the “DAQLOGGER Manager” window, select “File” then “Project
Setting.” The “Project Setting” dialog box appears.
Configuring the DAQLOGGER
In the initial state, the dialog box comes out with “Project1” at the operation level of
“Supervisor.”
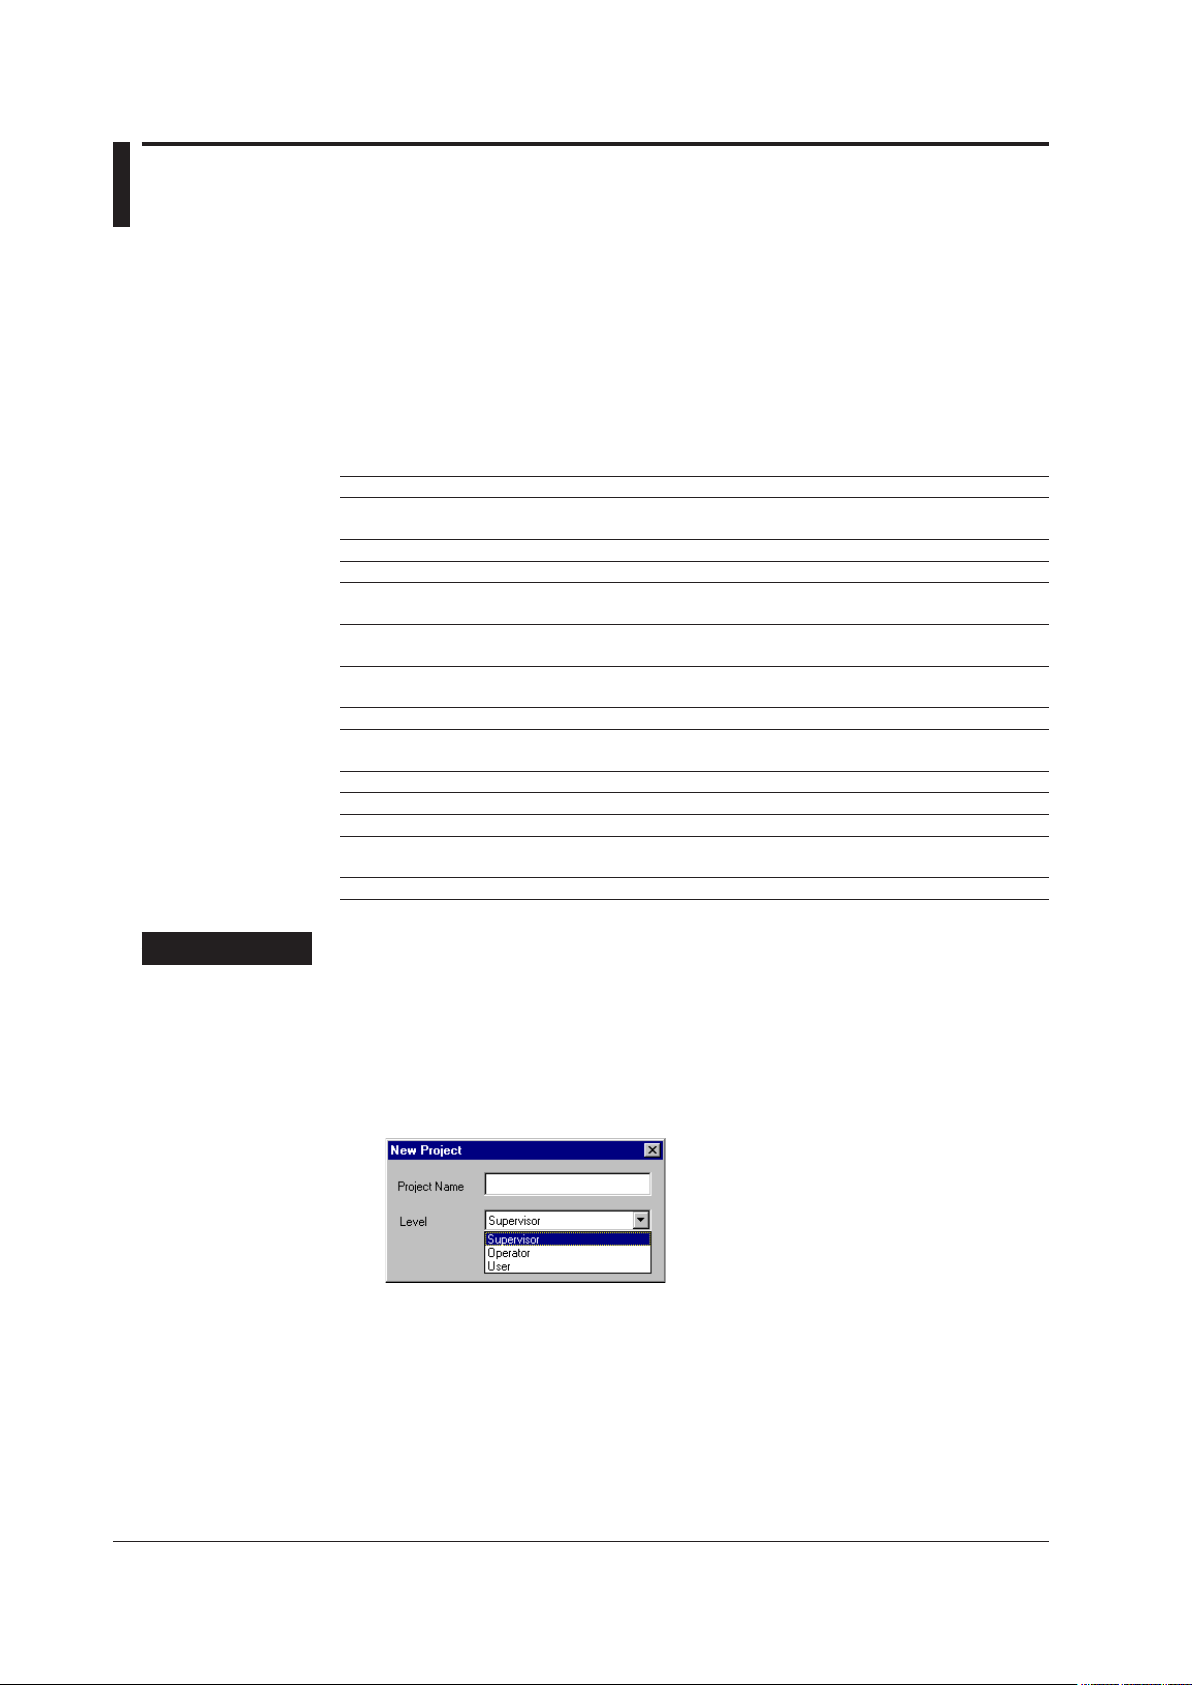
3. Press the “New...” button. The “New Project” dialog box appears.
IM WX101-01E
2-5
Page 26

2.4 Setting a Project
4. Input a project name and select an operation level; then click “OK.”
For more details about the operation level, see “Setting Operation Level to a Project”
in section 2.5.
Note
• You cannot use the following characters in a project name: \ / : , ; * ? ” < > |.
• The following character combinations cannot be used as project names.
con, prn, aux, aux1, aux2, com1, com2, com3, com4, com5, com6, com7, com8, com9, nul,
clock
• You cannot create a new project with the same name and operation level as that of an
existing project. You can create a new project with an existing name if its operation level is
different.
5. If you wish to set password protection, carry out the operation described in “Setting
Password Function” in section 2.5.
6. Sets the logger auto start function. Select “Off,” “Only scan measurement data,” or
“Scan and record measurement data.”
Note
In the logger auto start function, you can select “Only scan measurement data,” “Scan and
record measurement data,” or “Off” when starting the Manager.
Selecting an Existing Project
To select a project when more than one project has already been created, do the
following.
Procedure
1. Same as the operation in “Creating a New Project.”
2. Same as the operation in “Creating a New Project.”
3. In the “Project” list box, select the project.
4. If “Use Password Protection” has been checked for the selected project, the “Input
Password” dialog box appears.
5. Type the password and click “OK.”
You cannot open the project if the password does not match.
2-6
IM WX101-01E
Page 27

1
2
Copying Project
Procedure
2.4 Setting a Project
You can copy project settings from one project to another.
1. Same as the operation in “Creating a New Project.”
2. Same as the operation in “Copying a New Project.”
3. Select the project you want to copy settings to in the Project list. Only select a
project whose operation level is Supervisor.
4. Click Copy. The Copy Project dialog box appears.
Configuring the DAQLOGGER
5. Select the project from which you wish to copy settings, as well as the settings to be
copied. Only the settings appearing in the list may be copied. The items that were
not set for the selected project are dimmed.
Deleting an Existing Project
To delete an unneeded project, do the following.
Procedure
1. Same as the operation in “Creating a New Project.”
2. Same as the operation in “Creating a New Project.”
3. In the “Project” list box, select the project.
4. Click the “Delete” button.
Note
• If there is only one project of “Supervisor” operation level, you cannot delete this project.
• If there is only one project which does not use password protection, you cannot delete this
project.
IM WX101-01E
2-7
Page 28
2.5 Setting the Security
To prevent mis operation, you can set an operation level to each project.
In addition to this operation level, DAQLOGGER’s security function offers password
protection and desktop protection.
Setting Operation Level to a Project
For individual projects, you can set an operation level selecting from “Supervisor,”
“Operator,” and “User.”
Under these operation levels, operation will be limited as follows.
Function Supervisor Operator User
Logging Software No limitation No limitation Setting change disabled
Data Monitor No limitation No limitation No limitation
Historical Viewer No limitation No limitation No limitation
DDE Server No limitation No limitation Setting change disabled
Monitor Server No limitation No limitation Setting change disabled
Report Generator No limitation No limitation Setting change disabled
Group Editor No limitation No limitation Saving disabled
Hardware Configurator No limitation Sending and
Tag Editor No limitation Saving disabled Saving disabled
Software Configurator No limitation Operation disabled Operation disabled
File Utility No limitation No limitation No limitation
Event Processor No limitation No limitation Setting change disabled Start/Stop
Control Server No limitation No limitation Setting change disabled Start/Stop
saving disabled
Start/Stop operation possible
Pause/Resume operation possible
Pause/Resume operation possible
Start/Stop operation possible
Sending and
saving disabled
operation possible
Procedure
The operation level is only set for the process of creating a new project and cannot be
changed once it is set.
Setting the operation level is not an independent operation but is carried out in step 4 of
“Creating a New Project” in section 2.4.
4.
In the “Level” list box, select the operation level you wish to set.
2-8
IM WX101-01E
Page 29
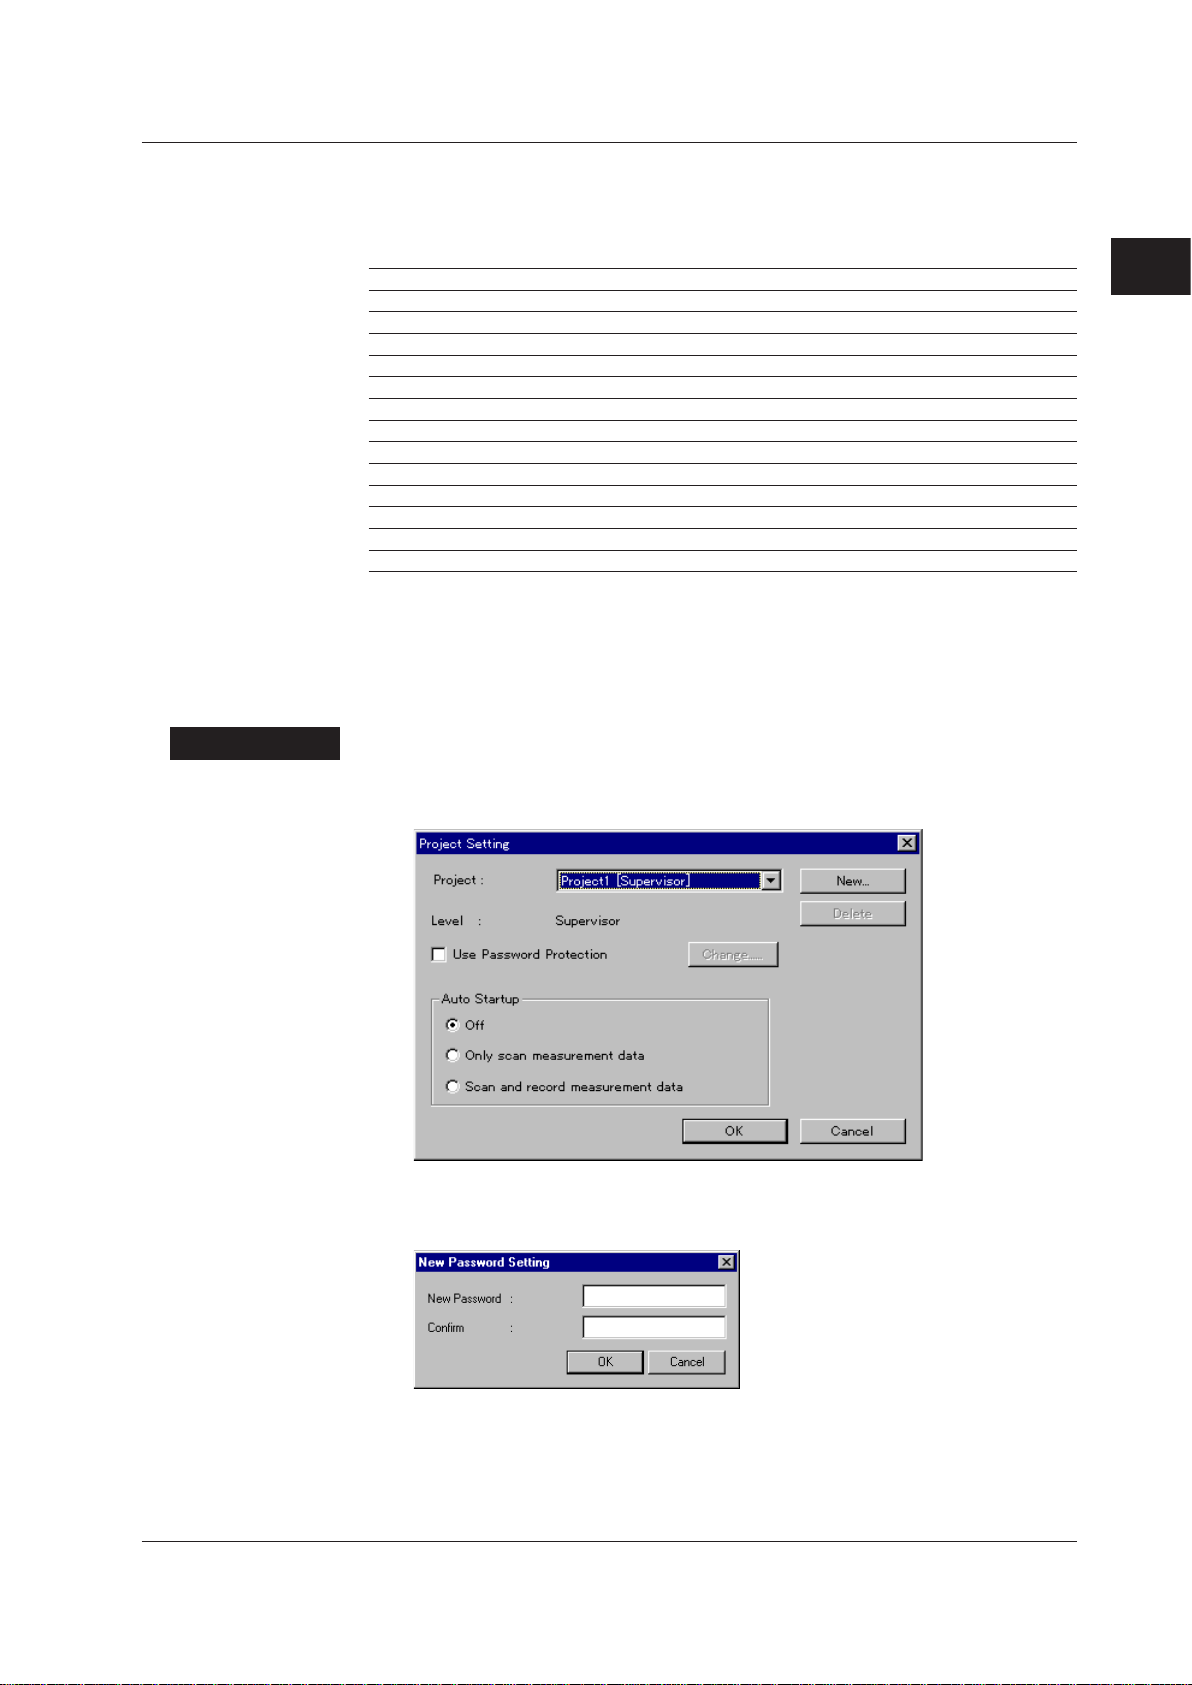
1
2
Setting Password Protection
Password protection is a function to limit operation as shown below, regardless of the
project’s operation level.
Function Protection OFF Protection ON
Logging Software Follows project’s operation level. All operation disabled
Data Monitor Follows project’s operation level. Setting change/save disabled
Historical Viewer Follows project’s operation level. No limitation
DDE Server Follows project’s operation level. All operation disabled
Monitor Server Follows project’s operation level. All operation disabled
Report Generator Follows project’s operation level. All operation disabled
Group Editor Follows project’s operation level. Cannot start
Hardware Configurator Follows project’s operation level. Cannot start
Tag Editor Follows project’s operation level. Cannot start
Software Configurator Follows project’s operation level. Cannot start
File Utility Follows project’s operation level. No limitation
Event Processor Follows project’s operation level. All operation disabled
Control Server Follows project’s operation level. All operation disabled
T
o set up password protection, first specify the use of password function then set the
password protection to ON.
Setting password function
Specifying the use of password function
Procedure
1. In the menu bar of the “DAQLOGGER Manager” window, select “File” then “Project
Setting.” The “Project Setting” dialog box appears.
2.5 Setting the Security
Configuring the DAQLOGGER
2. Click the check box of “Use Password Protection” to select it. The “New Password
Setting” dialog box appears.
IM WX101-01E
2-9
Page 30
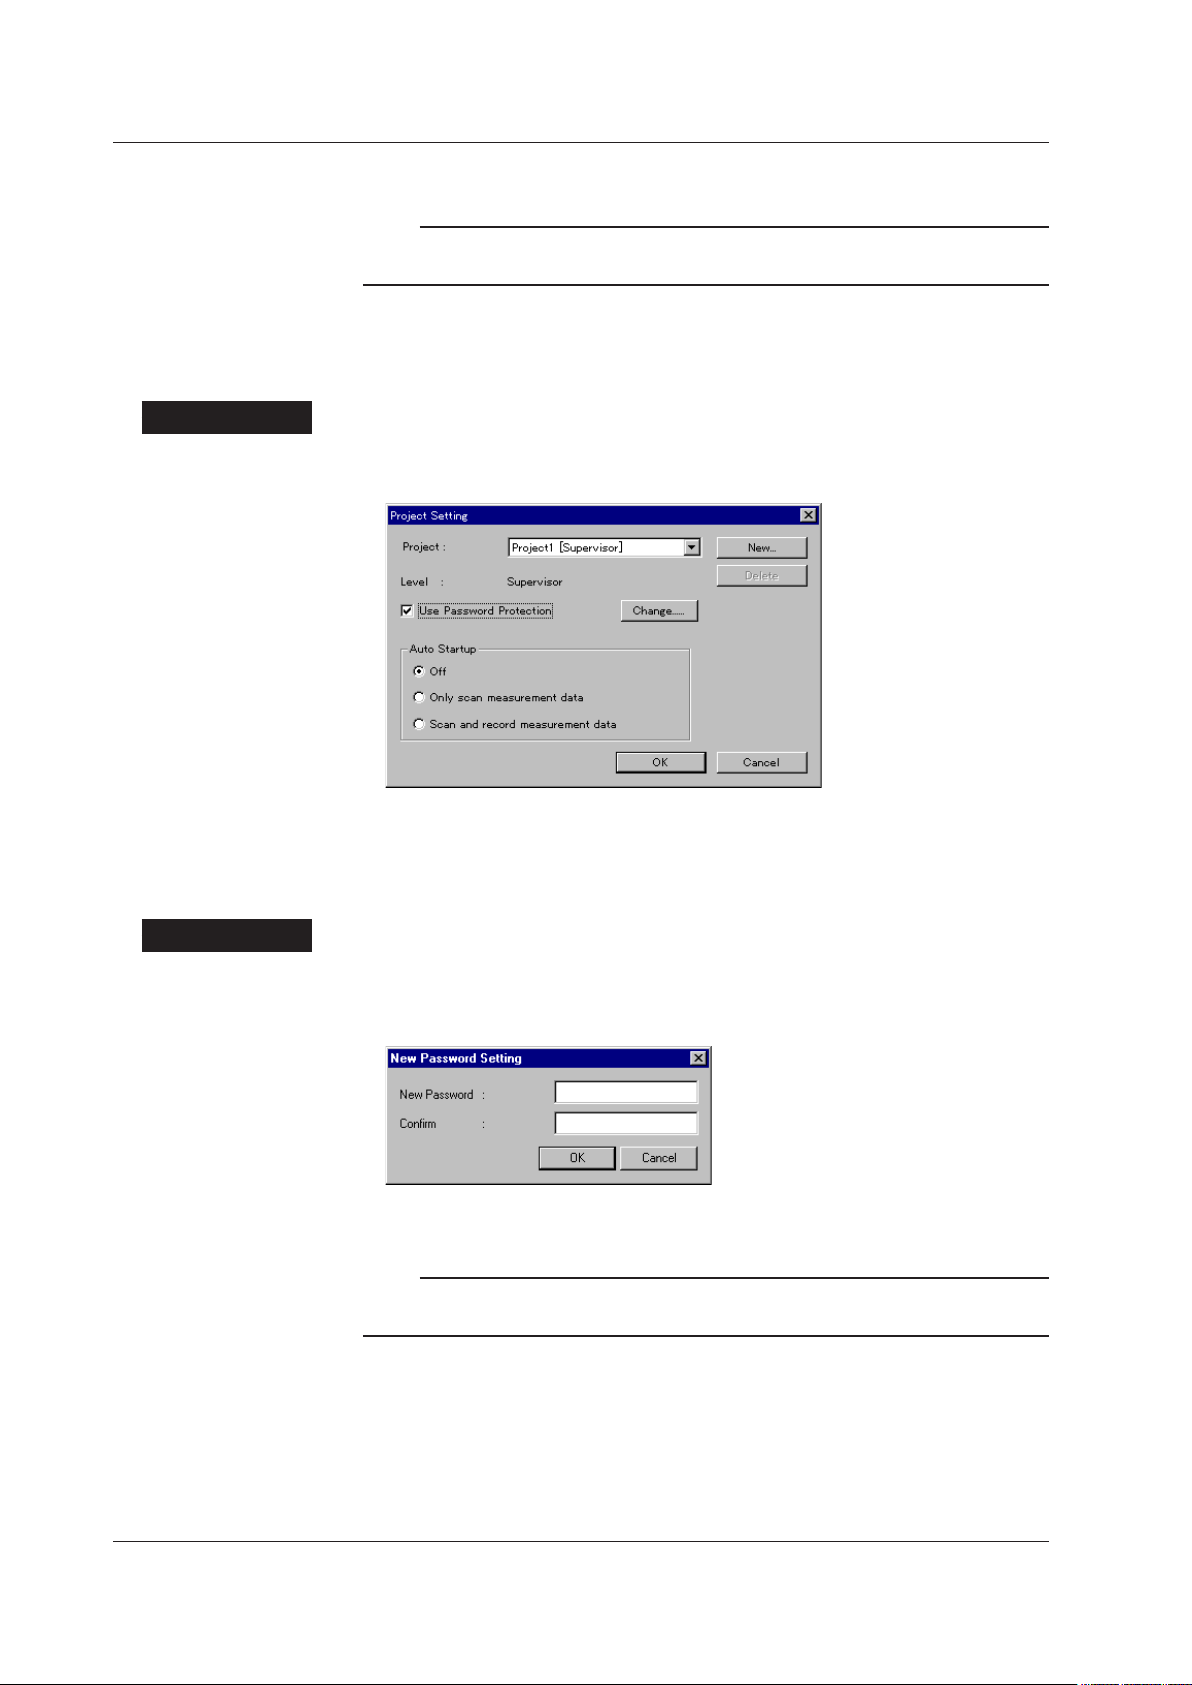
2.5 Setting the Security
Procedure
3. Type the password in the “New Password” and “Conrm” boxes then click “OK.”
Note
• A password must be within 16 characters. Any character is acceptable.
• Do not forget the password you set.
Canceling the use of password function
This operation does not clear the password already set. The password will take effect if
you specify its use again.
1. In the menu bar of the “DAQLOGGER Manager” window, select “File” then “Project
Setting.” The “Project Setting” dialog box appears.
2. Click the check box of “Use Password Protection” to clear it; then click “OK.”
Changing the password
This operation changes the password already set.
Procedure
1. In the menu bar of the “DAQLOGGER Manager” window, select “File” then “Project
2. Press the “Change...” button. The “New Password Setting” dialog box appears.
3. Type the password in the “New Password” and “Conrm” boxes then click “OK.”
Setting.” The “Project Setting” dialog box appears (See the gure above).
Note
• A password must be within 16 characters. Any alphanumeric characters are acceptable.
• Do not forget the password you set.
2-10
IM WX101-01E
Page 31
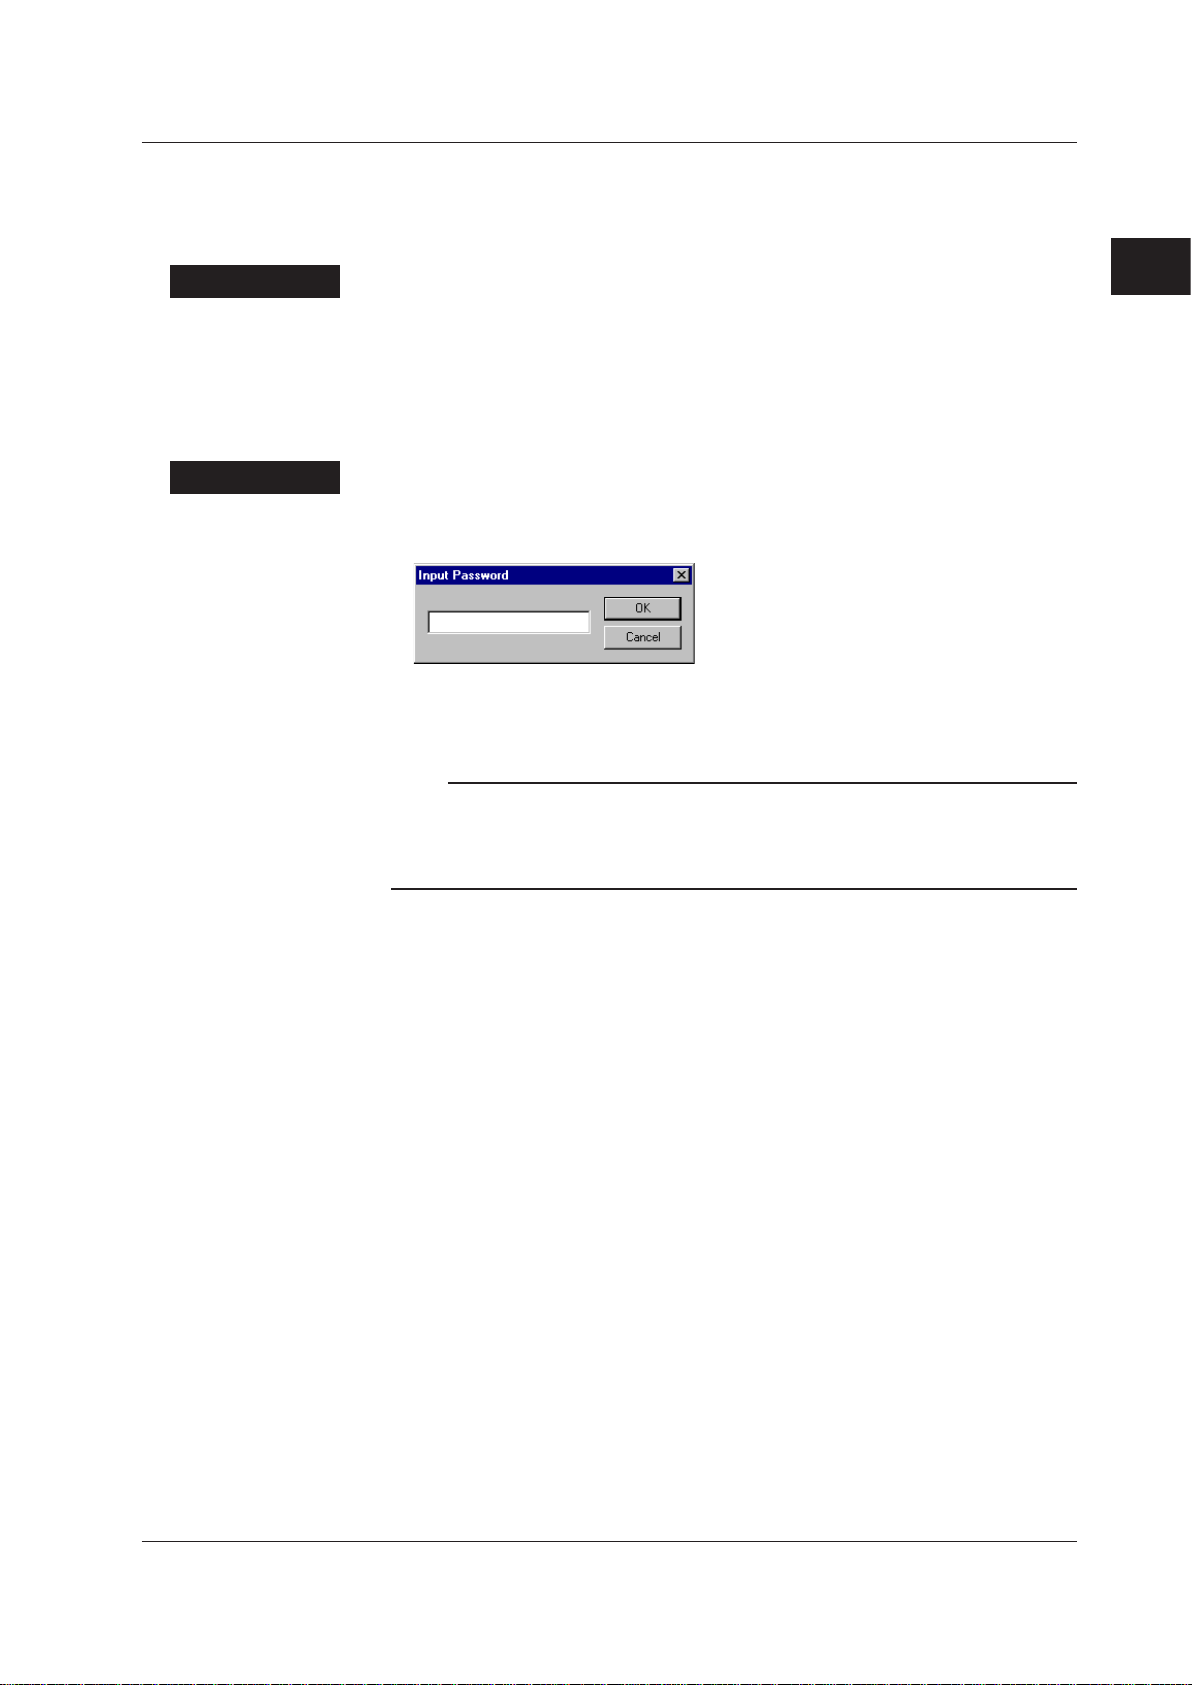
1
2
2.5 Setting the Security
Setting the password protection ON
With a project for which the use of password function is specified, this operation turns the
password protection ON. This operation is disabled while Hardware Configurator, Tag
Editor, or Software Configurator is running.
Procedure
Procedure
1. In the menu bar of the “DAQLOGGER Manager” window, select “File” then “Password
Protection.”
The password protection is turned ON.
Setting the password protection OFF
This operation sets the password protection to OFF.
1. In the menu bar of the “DAQLOGGER Manager” window, select “File” then “Password
Protection.” The “Input Password” dialog box appears.
2. Type the password and click “OK.”
If the password does not match, you cannot turn the protection OFF.
Note
• Protection by a password will not be established by just specifying the use of password
function. You must also set the password protection to ON.
• A password must be within 16 characters. Any character is acceptable.
• Do not forget the password you set.
Configuring the DAQLOGGER
IM WX101-01E
2-11
Page 32

2.5 Setting the Security
Setting Desktop Protection
Desktop protection is a function that temporarily hides the start menu bar and icons
(shortcuts) of Windows normally displayed on the screen.
When desktop protection is ON, other software cannot be started, so the personal
computer is protected from careless operations.
Setting the desktop protection ON
Procedure
1. In the menu bar of the “DAQLOGGER Manager” window, select “File” then “Desktop
Protection.”
The “Hide Desktop” dialog box appears.
Procedure
2. Type the password in the “Password” and “Conrm” boxes then click “OK.”
Note
• A password must be within 16 characters. Any character is acceptable.
• Do not forget the password you set.
Setting the desktop protection OFF
1. In the menu bar of the “DAQLOGGER Manager” window, select “File” then “Desktop
Protection.” The “Password to Display Desktop” dialog box appears.
2. Type the password and click “OK.”
2-12
IM WX101-01E
Page 33

1
2
2.6 Setting Communications and the Connected
The address is reassigned, starting from the smallest
address number available, to the recorders in the
selected range that are connected via RS-422 in the
order of the record numbers.
Switches the “Expandable/Standalone” setting of the
DARWIN recorders in the selected range at once.
Switching the “Expandable/Standalone” setting
initializes the settings (see page 2-20).
Copies the settings of the first recorder
number in the selected range to the
settings of all the recorder numbers in
the selected range.
Initializes the settings of the recorder
numbers in the selected range. Initialization
refers to the act of removing recorder
assignments from recorder numbers and
clearing all other settings as well.
Recorder
To communicate directly with the recorder and acquire the measured/computed data,
you must correctly configure the communication system with the connected recorder
and correctly set the recorder (type, the number of inputs, etc.). In addition, if you
are acquiring the measured/computed data via the Ethernet network with a PC that
has DAQEXPLORER, DAQ32Plus, DAQLOGGER, MXLOGGER, and Gate software
applications installed, you must set parameters such as the IP address of the target PC
and the port number of the monitor server.
Setting the Environment When Communicating Directly with the Recorder
Setting serial communications (only for serial communications)
Set the serial interface port. The data length is fixed to 8 bits.
Procedure
1. In the “DAQLOGGER Manager” window, press the “ENVI” button. Software
Congurator starts and its window opens.
Configuring the DAQLOGGER
IM WX101-01E
2-13
Page 34

Turns ON/OFF the
ports in the selected
range at once.
Copies the settings of the first port number in the
selected range to the settings of all the port numbers
in the selected range.
2.6 Setting Communications and the Connected Recorder
2. Click the “Serial Setting” tab. The Serial Setting panel appears.
3. Click the check box in the “Port No.” cell to set the port to be used.
When more than one port is selected, clicking the tool cell at the bottom allows the
Use/Not Use statuses of the selected ports to be switched collectively.
4. Set
the selected ports. Clicking the individual cells in the “Type,” “Baud Rate,” “Parity
Bit,” or “Stop Bit” column opens a list box containing the choices. Select one from
the list box.
Provide the same settings as those set for the connected recorder.
For information about recorder settings, see section 2.2, “Preparing the Recorder.”
Pressing the tool button at the bottom copies the settings of the rst port number in
the selected range to the settings of all the port numbers in the selected range.
2-14
IM WX101-01E
Page 35

1
2
Procedure
2.6 Setting Communications and the Connected Recorder
Setting the Connected Recorder
Before you start this setting operation, obtain information about the recorders that are
connected: model, channels, options, communication address, etc.
If you are connecting to the recorder using the serial port, serial communication setting
must be completed in advance (see the previous section).
Configuring the DAQLOGGER
From the “Recorder Setting” panel, assign the communication port and address to each
of the connected recorders.
1. To set the communication port, click the cell in the “Port” column and select from the
list box.
For example, when using Ethernet, COM1, and COM2, assign Ethernet, COM1, and
COM2 in the “Port” cells, respectively.
2. Click the cell in the “Address” column and set the recorder address of that port.
However, no address setting is needed for a port to which RS-232 is assigned.
Pressing the tool button at the bottom reassigns the address, starting from the
smallest address number, to the recorders in the selected range that are connected
via RS-422 in the order of the record numbers.
•
For RS-422
The following dialog box appears. Set the items manually.
µR recorders: 1 to 16
VR recorders: 1 to 16
DX/CX DAQSTA
(Excluding the DX1000/DX2000)
DARWIN: 1 to 31
DX1000/DX2000: 1 to 99
MV1000/MV2000: 1 to 99
TION and MV MobileCorders : 1 to 32
IM WX101-01E
2-15
Page 36

2.6 Setting Communications and the Connected Recorder
• For Ethernet
The following dialog box appears. Set the items manually.
IP address or host name
Enter IP address or the host name of the recorder (up to 255 alphanumeric
characters).
Login name
Enter the login name (User name) set on the DX, MV, or CX (up to 20 alphanumeric
characters).
User ID
Enter the User ID set on the DX (up to 20 alphanumeric characters).
Note
The User ID setting is only valid when the DX1000/DX2000 with the /AS1 advanced security
option is configured to use user IDs. Otherwise, any values that you enter for this setting are
ignored.
Password
Enter the password for the “Login Name” set on the DX, MV, or CX (up to 6
alphanumeric characters).
Note
• To send the settings data using Hardware Configurator to the DX, MV, or CX, or to operate
starting/stopping computation on Software Manager (see section 2.9), log onto an account
that has administrative privileges.
• You do not have to specify the port number or system number of the monitor server.
• When the password of a DX1000/DX2000 with the /AS1 advanced security option is set to
the default value, you cannot connect to the DX. Set the password on the DX itself or by
using the DAQSTANDARD software that is included with the DX.
2-16
IM WX101-01E
Page 37

1
2
Recorder Model Determination button
2.6 Setting Communications and the Connected Recorder
3. Select the “No.” cells. Then, press the “Recorder Model Determination” button or
select “Recorder Model Determination” from the “Communication” menu.
The “Recorder
recorders whose “Port” and “Address” has been entered.
If you perform recorder model determination, the models of the recorders connected
to the specied port and with designated address are identied.
If there is any recorder whose model cannot be determined, the following dialog box
appears, asking you to specify the model. Click the appropriate button.
Model Determination” button is enabled when you select “No.” cells of
Configuring the DAQLOGGER
When the recorder model determination ends, the following communication
messages are displayed.
Note
In some cases, model and options cannot be detected correctly using the recorder model
determination. In such case, set the items manually according to the procedure given in
“Entering the settings manually” on the next page.
IM WX101-01E
2-17
Page 38

2.6 Setting Communications and the Connected Recorder
4. After you have read the communication messages, click “OK.”
The Recorder Settings screen shows the model names, measurement channels, and
other information that have been automatically detected.
5. Conrm that the model information that was displayed through automatic detection
matches the model information of the recorder that is actually connected.
If it is not correct, reset the items according to the following procedure.
2-18
IM WX101-01E
Page 39

1
2
2.6 Setting Communications and the Connected Recorder
• Entering the settings manually
A. If necessary, click the “Model” cell and select the model name from the list box.
On the other hand, after selecting an area of the “Model” cells, clicking the tool cell
in the bottom will copy the selected area’s rst cell model to all other cells in the
selected area
B. If necessary, click the “Meas Ch.” cell and select the correct measurement channel
from the list box.
The number of channels displayed in the list box varies depending on the model.
• VR100:
• VR200 and VR200 S2: 1, 2, 3, 4, or 6
• µR1000: 1, 2, 3, 4, or 6
• µR1800:
• DX100, DX1000: 2, 4, 6, or 12
• DX200: 4, 8, 10, 20, or 30
• DX200C: 4 or 8
• DX2000: 4, 8, 10, 20, 30, or 48
• MV100: 2, 4, 6, or 12
• MV200: 4, 8, 10, 20, or 30
• CX1000: NONE, 6
• CX2000: NONE, 10, or 20
• MV1000: NONE, 4, 6, 8, 12, 24
• MV2000: NONE, 8,10, 20, 30, 40, 48
• DARWIN: Not selectable, see “Setting DARWIN options and the
.
1, 2, 3, 4, or 6
1, 2, 3, 4, 6, 12, 18, or 24
subunit/module conguration”
Note
For a description of the settings for DAQEXPLORER, DAQ32Plus, DAQLOGGER,
MXLOGGER, and Gate, see “Setting the Environment When Communicating with a PC with
Software Applications Installed” (page 2-22).
Configuring the DAQLOGGER
C. If necessary, click the “Math Ch.” cell and select the correct computation channel
from the list box.
The number of channels displayed in the list box varies depending on the model.
• VR100:
• VR200 or VR200 S2 : NONE, 1, 2, 3, 4, 6
• µR1000: NONE, 4 (when the num of meas. channels is 1, 2, 3, or 4)
NONE, 6 (when the num of meas. channels is 6)
• µR1800: NONE, 4 (when the num of meas. channels is 1, 2, 3, or 4)
None, 12 (when the num of meas. channels is 6, 12, 18, or 24)
• DX100: NONE, 4, or 8 (when the num of meas. channels is 2 or 4)
None, 12 (when the num of meas. channels is 6 or 12)
• DX200: None, 8 (when the num of meas. channels is 4 or 8)
None, 30 (when the num of meas. channels is 10, 20, or 30)
• DX200C: None, 8
• DX1000: NONE, 12 (when the num of meas. channels is 2 or 4), 24
• DX2000: NONE, 12 (when the num of meas. channels is 4 or 8), 60
• MV100: NONE, 4, or 8 (when the num of meas. channels is 2 or 4)
None, 12 (when the num of meas. channels is 6 or 12)
• MV200: None, 8 (when the num of meas. channels is 4 or 8)
None, 30 (when the num of meas. channels is 10, 20, or 30)
• MV1000: NONE, 12 (when the num of meas. channels is 4 or 8), 24
• MV2000: NONE, 12 (when the num of meas. channels is 8), 60 (when
• CX1000: None, 12
• CX2000:
• DARWIN:
None, 60 (“expandable” models)
• Monitor Server Type: Not available, since there are no computation channels.
Not selectable (no computation option)
(when the num of meas. channels is 6 or 12)
(when the num of meas. channels is 10, 20, 30, 40, or 48)
(when the num of meas. channels is 12 or 24)
the num of meas. channels is 10, 20, 30, 40, or 48)
None, 30
None, 30 (“standalone” models)
IM WX101-01E
2-19
Page 40
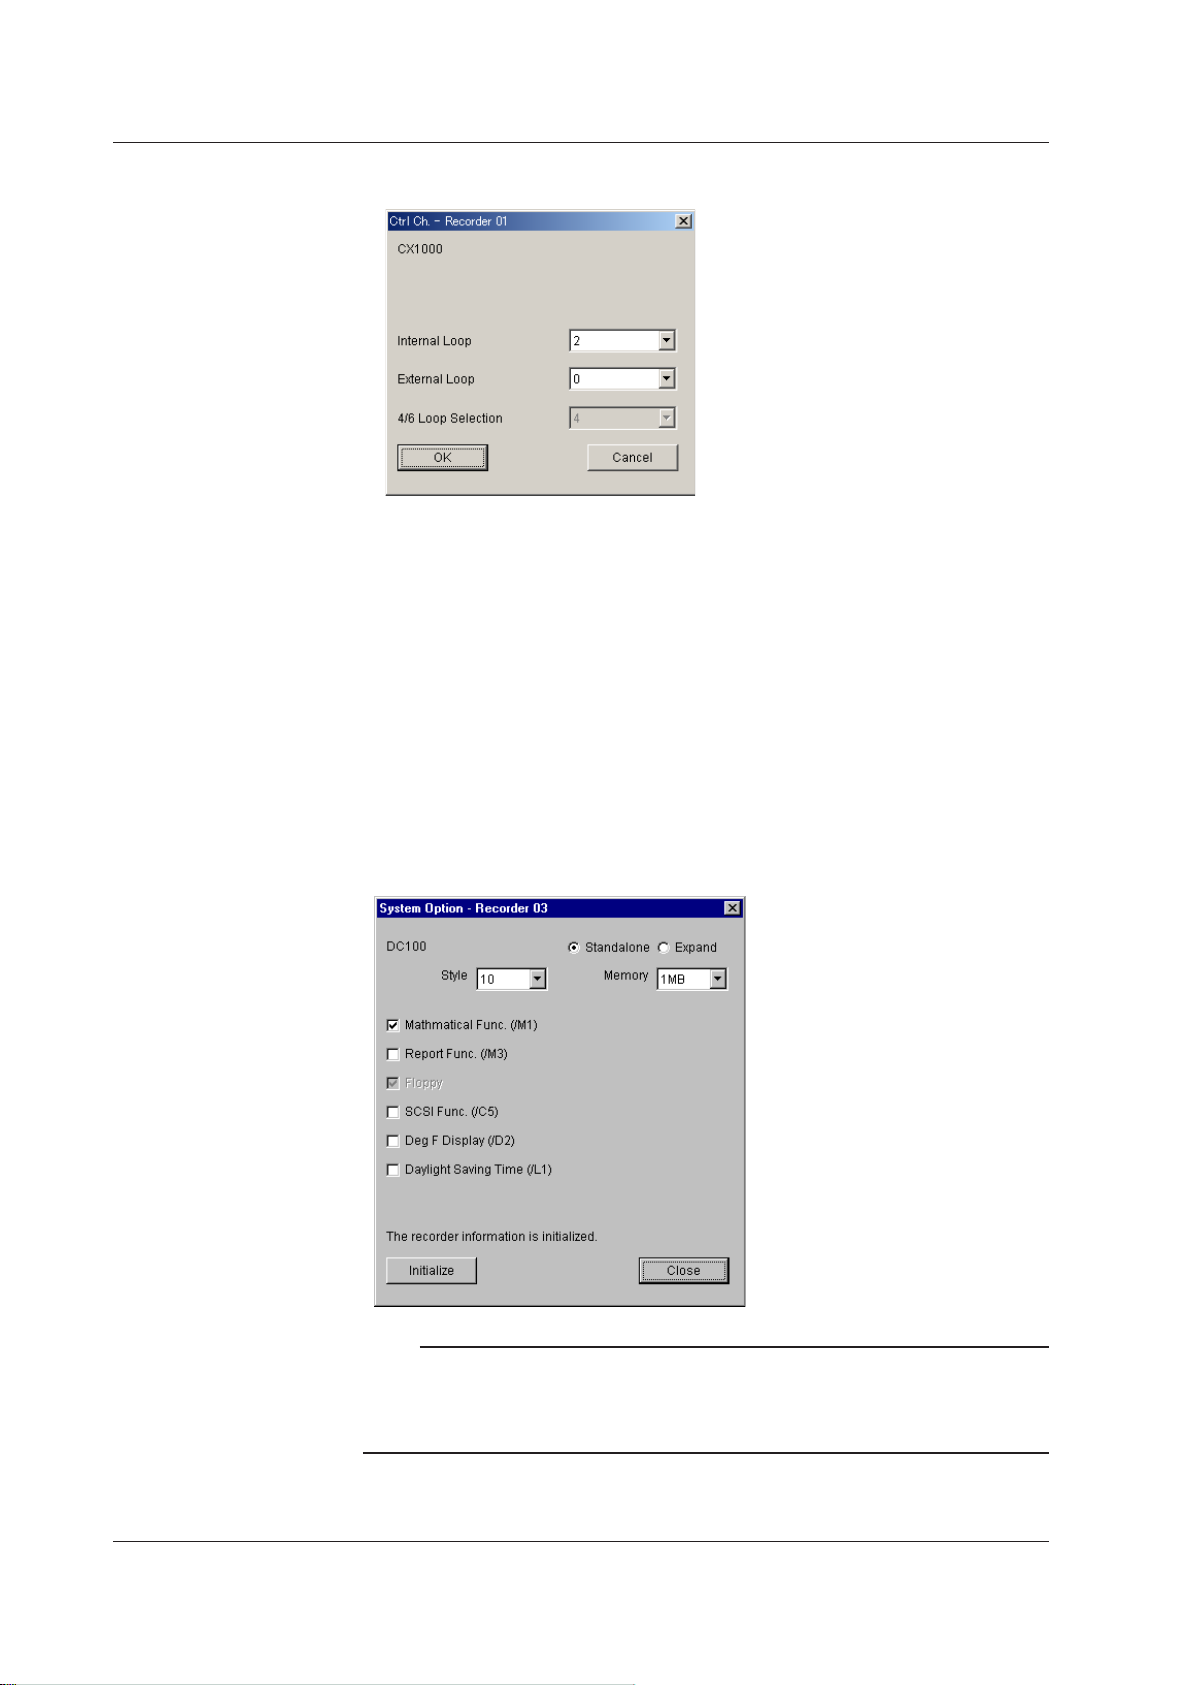
2.6 Setting Communications and the Connected Recorder
D. If necessary, click the “Ctrl. Ch” cell. The dialog box below appears. The “Ctrl. Ch”
cell is only available for CX models.
E. If necessary, set the “Extra. Ch” cell. The “Extra. Ch” cell is only available for DX2000
and MV2000 models with the /MC option.
• Setting DARWIN options and the subunit/module configuration
For DA100, DR130, DR200, and DC100 recorders, select expandable model or
standalone model and set the presence or absence of options and the subunit/module
conguration.
A.
Under the “Recorder Setting” tab, click the “Standalone” or “Expandable” cell in the
“System” column. The “System Options” dialog box opens. Set the displayed items
according to the following procedure:
“Standalone” or “Expandable”: Select using the option (radio) button (“Standalone”
only for the DR130).
Style: Select from the drop-down list box.
Memory (for the DC100 only): Select from the drop-down list box.
Options: Sele
ct the appropriate check box.
2-20
Note
When making changes to the DARWIN series system, if the changes do not effect the system
configuration, do not initialize the system (see the next page). The Initialize button is only
active when initialization is needed. The OK button is displayed when initialization is not
needed.
IM WX101-01E
Page 41

1
2
Unit 0
Unit 3
Unit 5
Unit 1
Unit 2
Unit 4
This figure shows a dialog box when a subunit is assigned.
2.6 Setting Communications and the Connected Recorder
Switching “Standalone” and “Expandable” under the “Recorder
Setting” tab (see page 2-13)
By clicking the tool cell at the bottom of the “Recorder Setting” tab, you can switch
between “Standalone” and “Expandable” for the selected DA100, DR200, and DC100
recorders. If you switch between “Standalone” and “Expandable,” procedure B,
“Initialize” below is executed.
Changing the number of computation channels (Math ch) under the
“Recorder Setting” tab
The number of measurement channels can also be selected by clicking the “Math Ch.”
cell and selecting from the list. If you set the number of computation channels to some
number other than “None,” a check mark appears at “Mathematical Func.(/M1)” in the
“System Options” dialog box.
B.
If you click “Initialize,” the specied items are activated and the recorder settings are
initialized as follows:
Model Standalone
/Expandable
DA100 Standalone 0 30 0 No module
Expandable 0 60 0 No module
DR130 Standalone 10 30 0 DU100-1* 1 unit
DR200 Standalone 10 30 0 DU100-1* 1 unit
Expandable 0 60 0 No module
DC100 Standalone 0 30 0 No module
Expandable 0 60 0 No module
* For models with the optional computation function. If the computation function is not
present, “NONE” is displayed.
Measurement
Channel
Computation
Channel*
Number of
Subunits
Module
Configuration
Configuring the DAQLOGGER
Clicking “Close” cancels the specied items and closes the dialog box.
C. Click the cell on the right side in the “System” column (the cell with the number of
subunits displayed). The “System Module” dialog box opens. Set the displayed
items according to the following procedure:
If you set the following items in the “System Module” dialog box, the number of
measurement channels is displayed in the “Meas Ch.” cell, and the number of
subunits in the cell on the right side in the “System” column.
IM WX101-01E
2-21
Page 42
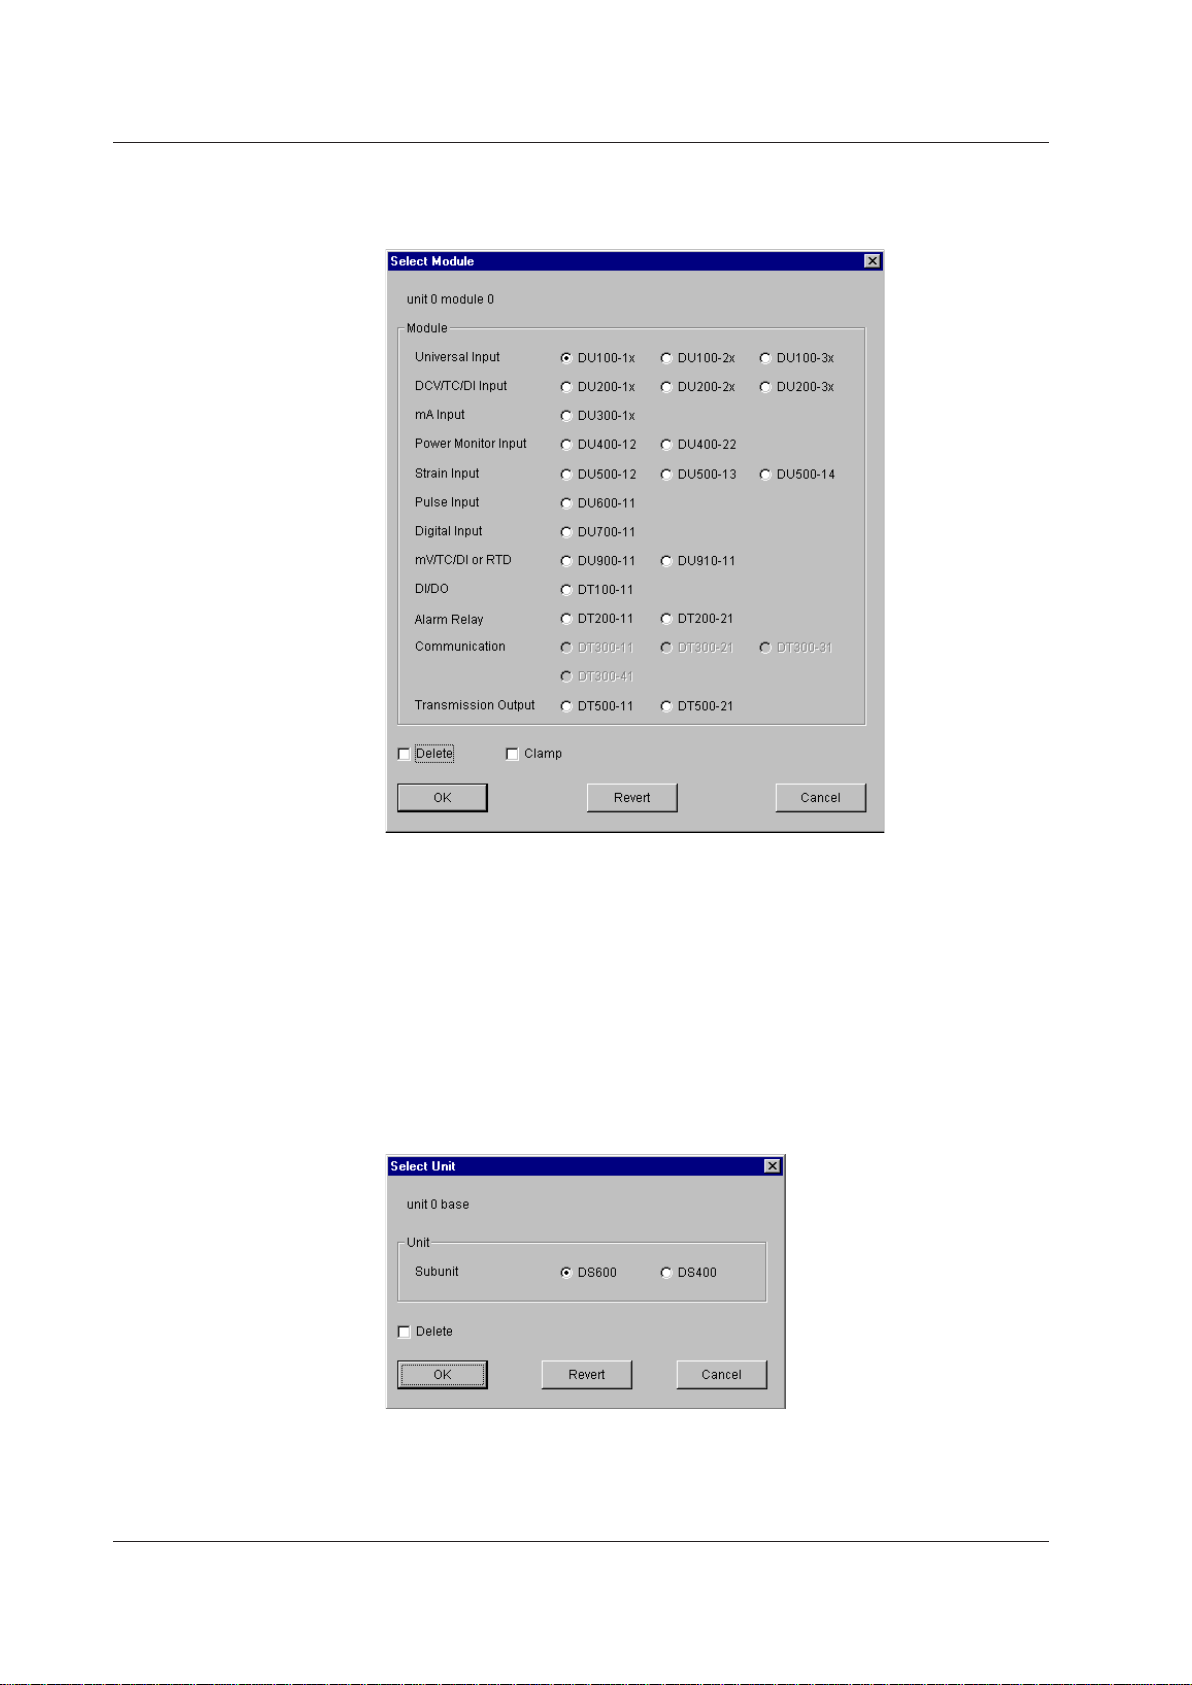
2.6 Setting Communications and the Connected Recorder
Setting the modules
Click the position where the module is to be attached. The module selection dialog
box opens.
If you clear the check mark by clicking “Delete,” the modules that can be attached
For clamp input terminals, select the “Clamp” check box.
To delete a module, clear the check mark by clicking “Delete.”
Click “OK” to activate the new settings and close the module selection dialog box.
Click “Revert” to set the settings back to the settings that existed when the module
Click “Cancel” to discard the settings and close the module selection dialog box.
Setting the subunits
Click the subunit position.
If you clear the check mark by clicking “Delete,” the subunits become selectable.
To delete a subunit, clear the check mark by clicking “Delete.”
become selectable. Select the module with the option button.
selection dialog box was opened.
The subunit selection dialog box opens.
Select the subunit with the option button.
2-22
IM WX101-01E
Page 43

1
2
Select these check boxes when
multiple monitor servers are
running on the connected PC and
the port number or system number
is to be specified.
If you are specifying the system number (specified in the text
box to the right) and acquiring data, select “System No.”
(If you are connecting to Gate, you can acquire data from all
systems by selecting “All System No.”
2.6 Setting Communications and the Connected Recorder
Click “OK” to activate the new settings and close the subunit selection dialog box.
Click “Revert” to set the settings back to the settings that existed when the subunit
selection dialog box was opened.
Click “Cancel” to discard the settings and close the subunit selection dialog box.
The method to set the modules for the subunit is the same as the method described in
the aforementioned section, “Setting the modules.”
By clicking the tool cell at the bottom of the “Recorder Setting” tab, you can copy
the module conguration of the rst subunit in the selected range to all the DA100,
DR200, DC100 expandable models in the selected range.
Setting the Environment When Communicating with a PC with Software
Applications Installed
Before you start this setting operation, obtain information about the target PC: the IP
address, the port number of the monitor server, etc.
Procedure
1. To set the communication port, click the cell in the “Port” column and select “Ethernet.”
2. Click the “Address” cell and set the IP address or host name of the target PC.
Configuring the DAQLOGGER
IM WX101-01E
IP address or host name
Enter the IP address or host name of the target PC (up to 255 alphanumeric characters).
2-23
Page 44
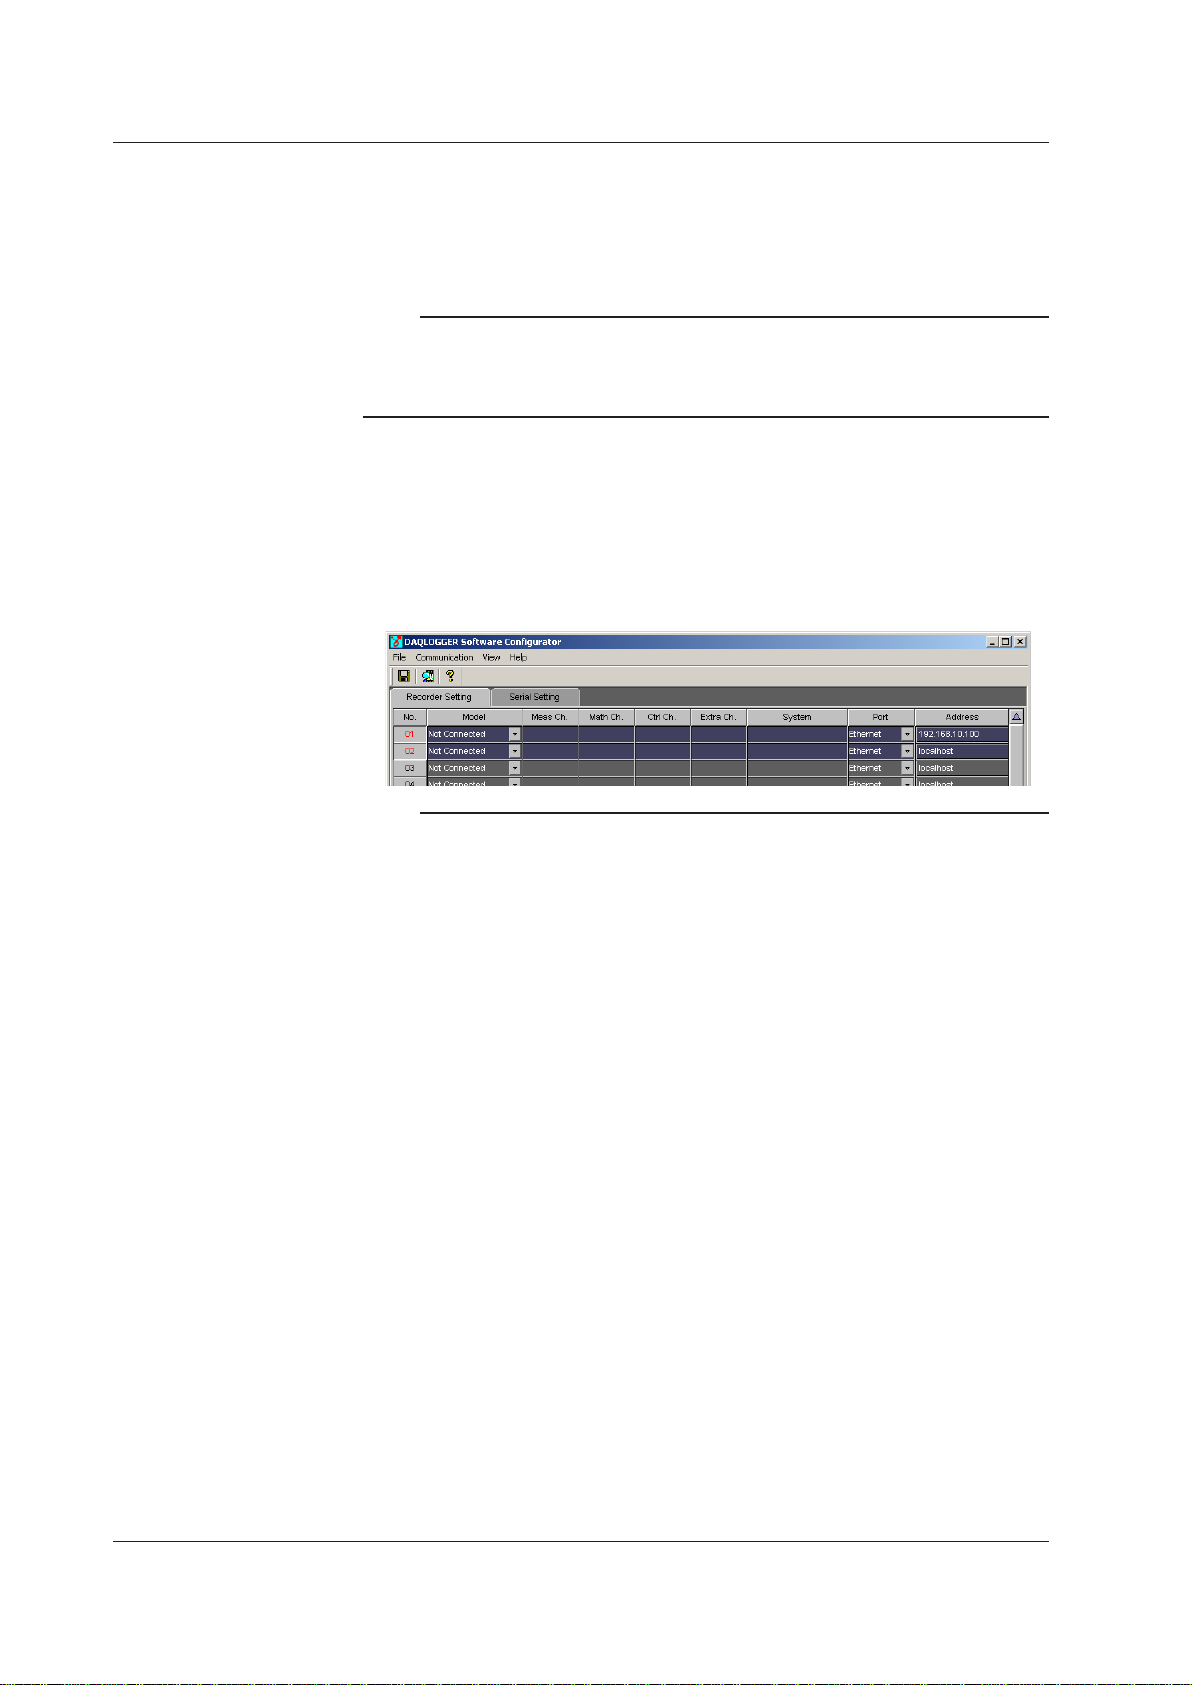
2.6 Setting Communications and the Connected Recorder
Monitor server
Set the port number and system number of the monitor server only when multiple
software applications are installed in the target PC and multiple monitor servers are
running. If you perform recorder model determination without specifying the port number
or the system number, the system with the smallest system number is searched.
Note
• If you are connecting to DAQEXPLORER or Gate, multiple system numbers are available
on a single monitor server.
• If you are connecting to Gate and you wish to acquire data from all systems, you can select “All
System No.” in the system number list box.
3. Select the “No.” column. Then, press the “Recorder Model Determination” button or
select “Recorder Model Determination” from the “Communication” menu.
The “Recorder Model Determination” button is enabled when you select “No” boxes
of recorders whose “Port” and “Address” have been entered.
If you perform recorder model determination, the software applications (displayed in
the “Model” cell) or the number of measurement channels on the target recorders is
identied. The monitor server must be running and scanning (data acquisition) must
be in progress on the software application for this to work.
Note
Note the following points depending on which software application you access.
• For communications with a PC running DAQLOGGER
Before acquiring data, start the DAQLOGGER scan on the PC you will connect to.
On DAQLOGGER R5.01 or later, if you stop the scan during data acquisition, the connection
will be cut. On DAQLOGGER R3.0x or R4.0x, the data after the scan or calculation is
stopped will not be updated, and will remain at the same value. If you restart the scan, the
connection will be cut (however if auto connect is enabled in the logger condition settings,
the connection will be automatically reopened).
• For communications with a PC running DAQ32Plus
Before acquiring data, start the DAQ32Plus monitor on the PC you will connect to. If you
are running DAQ32Plus version R10.03 or later, you can not open a connection unless
the monitor is running. In addition, if you stop the monitor during data acquisition, the
connection will be cut. On DAQ32Plus R9.0x, R10.01, or R10.02, the data after the scan is
stopped will not be updated and will remain at the same value.
• For communications with a PC running DAQEXPLORER
Before acquiring data, turn monitoring ON on the DAQEXPLORER desktop at the PC you
will connect to, and mount the DAQSTATION or MobileCorder.
During data acquisition, if you turn the monitoring setting OFF on the mounted
DAQSTATION or MobileCorder or unmount it, the connection will be cut.
• For communications with a PC running MXLOGGER
Before acquiring data using DAQLOGGER, start the MXLOGGER scan (data acquisition) on
the PC you will connect to.
• For communications with a PC running a Gate application
For applications other than GateMX100 and GateMX/MW, execute the Gate process or
execute the service on the PC you will connect to, before acquiring data. If you stop the
gate process or service during data acquisition, the connection will be cut.
For GateMX100 and GateMX/MW, start data acquisition on the GateMX100 and GateMX/
MW before acquiring data. If you stop data acquisition on the GateMX100 and GateMX/MW
during data acquisition, the connection will be cut.
2-24
IM WX101-01E
Page 45

1
2
2.6 Setting Communications and the Connected Recorder
• When connecting to a Gate series instrument, the recorder model determination function
displays the models whose system numbers are set to 01. To display models with system
number 02 or higher, specify the number in the System field.
When setting the system numbers, start from 0 for the number of the Gate series setting
screen and continue with 1, 2, and so on. For example, for GateWT numbers 1, 2, 3, and so
on, set system numbers on DAQLOGGER of 0, 1, 2, and so on.
• Entering the settings manually
You can enter the “Model,” “Meas Ch.,” “Ctrl Ch.,” and “System” items manually.
However, use recorder model determination in normal cases.
Saving the Settings
Save the current setting.
Procedure
1. Click “Save” on the toolbar or select “Save” from the “File” menu of the “DAQLOGGER
Tag Editor” window.
The environmental settings are saved.
Reverting to the Settings Saved Previously
Load the settings data that was saved last.
Procedure
1. In the “DAQLOGGER Monitor Server” window, select “Revert” from the “File” menu.
The environmental settings saved last are loaded.
Configuring the DAQLOGGER
Initializing the Serial Port
In some cases, unwanted data is present in the serial interface buffer such as
immediately after booting up the PC. This can cause errors when communication is
started. This function initializes the serial interface buffer.
Procedure
1. Click the “Serial Setting” tab. The Serial Setting panel appears.
2. Select the port to be initialized.
3. In the “DAQLOGGER Software Congurator” window, select “Initialize Serial Port”
from the “Communication” menu. The communication buffer is initialized.
Printing the Settings
Operations of “Print,” “Print Preview,” and “Set Printer” under the “File” menu of
“DAQLOGGER Software Configurator” window are the same as those of Windows’ print
commands.
Settings of both “Recorder Setting” and “Serial Setting” are printed.
Procedure
1. In the “DAQLOGGER Monitor Server” window, select “Print” from the “File” menu.
The “Print” dialog box opens.
2. Set the items in the dialog box, and then click “OK.”
Terminating the Software Configurator
If there are environmental settings that have not been saved, a save confirmation
message appears. Save the settings according to the message.
Procedure
1. In the “DAQLOGGER Monitor Server” window, select “Exit” from the “File” menu or
click the “Close” button in the upper right corner of the window.
The Software Congurator closes.
IM WX101-01E
2-25
Page 46

2.7 Setting Tags
Starting with the first “Recorder Number/Channel Number”
in the selected range, recorder numbers and channel
numbers are assigned to the tag in the selected range in
the order of the recorders that are assigned by
the Software Configurator.
Example: Recorder Channel
(in the selected range)
1st tag Rec05 07
2nd tag Rec05 08
3rd tag Rec06 02
Click an item name
to sort the list
using the item in
ascending order.
Search setting button
Select/Deselect
all tags at once.
Switch use/not use of tag in the
selected range at once.
Assign tag names in the selected range by
adding sequential numbers to the tag name of
the first tag name in the selected range.
Example: Before After
(in the selected range)
1st tag name TAG-A TAG-A-0001
2nd tag name - TAG-A-0002
3rd tag name - TAG-A-0003
Name the channels of the recorders which have been set using the Software
Configurator.
The Data Monitor and Historical Viewer use these names (tag names) to handle the
collected data.
Basic Operation
To select tag
• Click the number cell (Tag No.).
• To select a series of numbers from more than one tag, click the rst cell then, pressing
the SHIFT key, click the last cell.
To change the use status of a tag
• Clicking the check box of “Use” cell alternately switches between Use and Not Use.
• If a series of numbers is selected, pressing the tool button in the bottom collectively
switches the status of the selected tags.
To set a cell
• Click the cell to open a list box and select the item you wish to set.
To sort by a header item
• Click the header item (“Tag No.” “Use” “Tag Name,” “Recorder Number,” or “Channel”).
The tag list contents will be sorted by the clicked header item.
Setting Tag Information
To set tag information, first execute the automatic assignment. After that, edit the
information as necessary.
This automatic assignment function assigns a tag number to every channel of the
recorders set using the Software Configurator. A maximum of 1600 tags can be assigned
depending on the software.
Procedure
1. In the “DAQLOGGER Manager” window, press the “TAG” button. Tag Editor starts
and the “DAQLOGGER Tag Editor” window opens.
2-26
IM WX101-01E
Page 47

1
2
Auto Assignment button
2.7 Setting Tags
2. Click the “Auto Assignment” button or, in the menu bar, select “Edit” then “Auto
Assignment.”
The recorder and channel numbers are assigned automatically according to the
instrument settings entered in the Software congurator. Tag numbers are assigned
starting with Tag No. 1 in the following order: measurement channel 1 on recorder
number 1, computation channel 1 on recorder number 1, internal loop channel 1
on recorder number 1 (CX only), external loop channel 1 on recorder number 1,
measurement channel 1 on recorder number 2…and so on.
Configuring the DAQLOGGER
3. Click the check box of “Use” cell to switch the Use/Not Use of the tag.
Clicking the tool cell in the bottom enables the Use/Not Use of the tags in the
selected area to be collectively switched.
To edit each item of the tag information that has been automatically set, perform the
following procedure.
• Manual settings operation
A. If necessary, change the tag name.
A tag name of up to 32 characters long can be entered.
Clicking the tool cell in the bottom renames the tag names of a selected area. Taking
the rst tag name as a base form, the following tag names will be renamed in the
form of “TagName-nnnn” (nnnn: a number which increments by 1, see page 2-21).
B. If necessary, click the “Recorder Number” cell and select the recorder that is to be
assigned to the tag from the list box.
The recorder numbers appear in the list box are as shown below. However, recorder
numbers not connected using the Software Congurator do not appear in the list
box, so you cannot select them.
• NONE
• R01: model name to R32: model name
IM WX101-01E
2-27
Page 48

2.7 Setting Tags
C. If necessary, click the “Channel” cell and select the channel that is to be assigned to
the tag from the list box.
The list box lists the channel numbers of the measurement channels, computation
channels, Int. Loop channels, Ext. Loop channels, and Extra channels which were
set using the Software Congurator.
Clicking the tool cell in the bottom sets the channel numbers for the tags in the
selected area. The channel connected to the rst tag is used as a base and the
channel numbers of the following tags are incremented by 1.
When the channel number reaches the last channel of that recorder
the next recorder number. When the last recorder number is reached, it returns to
the smallest recorder number.
Note
A single channel can be assigned to multiple tags.
Reading Tag Names from the Recorder
The tag string can be read from the recorder and entered in the tag name.
Procedure
1. Select the tag for which to read the tag information.
2. In the “DAQLOGGER Tag Editor” window, select “Receive Tag Setting” from the
“Communication” menu.
A window appears indicating that the tag is being received, and the tag is received.
The tag names in the selected range are replaced with the tag string of the specied
channel of the recorder. After execution, the “Communication Message” dialog box
appears. Read the message and click “OK.”
box closes.
If an error message appears, see Chapter 9, “Messages.”
Note
• The DA does not have tag settings, therefore tags cannot be received.
• If tags have more than 16 characters, only the first 16 characters are read. If this occurs, a
message appears indicating that characters in excess of 16 were deleted.
, it transfers to
The “Communication Message” dialog
Importing Tag Strings from Text Files
You can import text data as tag names. If the text data includes control characters
(other than carriage returns and terminator symbols), those characters are replaced with
spaces.
Control characters:
Carriage returns/line feeds: LF(0x0a), CR(0x0d), CR+LF(0x0d+0x0a)
Terminator symbols: One or more characters used to indicate the beginning or
The file structure of importable text data is as follows.
• Tag information (rst line is the tag number T
character string may not end with a space.
• One line of tag information ends at a carriage return.
• Any more than 15 characters are deleted.
• If a tab is included in a string, the tab and subsequent charact
• If a line that is read contains only a carriage return or only a tab and carriage return,
the tag name of that line is deleted.
2-28
Characters used to affect formatting, control data transfer,
or perform other control functions. (0x00 to 0x1F, and 0x0a)
ending of a character string. Tab (0x09), carriage return.
AG0001), spaces are valid. However, a
ers are ignored.
IM WX101-01E
Page 49

1
2
• A maximum of 1600 lines of data is imported (the 1601st and subsequent lines are
Example: [TAB] = tab, [CR/LF] = carriage return/line feed, [SP] = space.
Procedure
1. Click File > Import. The Import screen is displayed.
2.7 Setting Tags
invalid).
Text Tag Name When Importing
123456789[CR/LF] 123456789
123456789[TAB]ABCDEFG[CR/LF] 123456789
[TAB][CR/LF] Deletes the tab name of the corresponding line.
[CR/LF] Deletes the tab name of the corresponding line.
123456789[SP][SP][SP][CR/LF] 123456789
Spaces at the end of the string are invalid.
Configuring the DAQLOGGER
2. Select a le and click Open. The tag name display changes.
Importing Tag Strings into Text Files
You can save the currently displayed tag names to a text file. With the first line as the tag
number 1(TAG0001), only the tag strings are output (use/do not use, record number, and
channel number data are not output). If tag strings are not set, only the carriage returns
are written. Output to a file continues until the specified line (non-blank line).
Procedure
1. Click File > Export. The Export screen is displayed.
2. Specify the save location for the le, then enter a new le name or select an existing
le name and click Save. The new le is saved, or the existing le is overwritten. If
you attempt to overwrite a le that is write-protected, an error message is displayed.
IM WX101-01E
2-29
Page 50

2.7 Setting Tags
Searching Tags
Procedure
You can search tags by specifying the tag name, tag number, or recorder number. If a
tag is selected, the search begins from the selected tag.
1. Click “Search” on the toolbar or select “Search” from the “Edit” menu of the
“DAQLOGGER Tag Editor” window. The “Move/Find” dialog box opens.
2. Click “Tag Name,” “Tag Number,” or “Recorder No.”
3. Enter the item to be searched in the entry box of the selected item.
The search operation is as follows:
Tag Name: Searches for tags that contains the specied string in the tag name
(case-sensitive).
Tag No.: Searches the tag with the specied tag number.
Recorder No.: Select the recorder number from the list. The tag that is assigned to
the recorder corresponding to the selected recorder number is searched.
Click “Search Next” or “Previous.” The tag that matches the search condition is
4.
selected and displayed. If you click “Search Next” or “Search Previous” again, the
next tag that matches the search condition is selected and displayed.
If the corresponding tag does not exist, nothing happens.
You can change the tag settings while the “Move/Find” dialog box is displayed.
5. Click “Close” to close the “Move/Find” dialog box.
selecting “Search Next” or “Search Previous” from the “Edit” menu or by clicking
“Search Next” or “Search Previous” on the toolbar.
ou can perform the search by
Y
2-30
IM WX101-01E
Page 51

1
2
Moving the Display by the Specified Number of Tags
You can move the display by the specified number of tags.
Procedure
1. Click “Search” on the toolbar or select “Search” from the “Edit” menu of the
“DAQLOGGER Tag Editor” window. The “Move/Find” dialog box opens.
2.7 Setting Tags
Configuring the DAQLOGGER
2. Enter the number of tags to move for each operation in the width box.
3. Click “Up” or “Down” to move by the specied number of tags. Only the display
moves. The selected tags to not change.
4. Click “Close” to close the “Move/Find” dialog box. You can move the display by
selecting “Page Down” or “Page Up” or by clicking “Page Down” or “Page Up” on the
toolbar
Printing Tag Information
Operations of “Print,” “Print Preview,” and “Set Printer” under the “File” menu of the
“DAQLOGGER Tag Editor” window are the same as those of Windows’ print commands.
Tag information for selected tags are printed. When no tag is selected, however, tag
information for all tags are printed.
Procedure
1. In the “DAQLOGGER Tag Editor” window, select “File” then “Print.”
The “Print” dialog box appears.
2. In the dialog box, provide settings for printing then click “OK.”
.
Saving Tag Information
Save the current settings.
Procedure
1. Select “File” then “Save.”
The currently set tag information will be saved.
Terminating the Tag Editor
If the current settings have not been saved yet, a confirmation message appears. Follow
the instructions in the message and save the settings if necessary.
Procedure
1. Select “File” then “Exit.” Or click the close button in the upper right corner of the
window.
The Tag Editor window closes.
IM WX101-01E
2-31
Page 52

2.8 Setting Groups
Assigns the tags set by Tag Editor to groups. Up to 32 tags can be assigned to a single
group, and up to 50 groups can be specified. In addition, names can be placed on the
groups.
Data Monitor and Viewer display the scanned and recorded data by groups that are
specified here.
Basic Operation
To select the waveform number (W**)
• Click the appropriate number cell.
• To select tags consecutively, click the rst cell, and then, pressing the SHIFT key, click
the last cell.
• Click “No.” at the top of the waveform number column to select or deselect all
waveform numbers.
To show/hide tags
• Click the check box of the waveform number cell to switch between show and hide.
• By clicking the tool cell at the bottom when consecutive cells selected, you can switch
between show and hide in the selected range at once.
Setting the cell
• Click the cell to open the tag selection dialog box. Then, select the desired tag.
Assigning Tags to Groups
There are two methods that you can use to assign tags to groups: auto grouping and
manual assignment.
Using auto grouping
You can specify the number of tags to assign per group, and automatically assign tags
to the groups. The tags that have been set by Tag Editor are assigned to the groups
in order from the first tag. However, the tags that are assigned are the ones that have
recorders and channels assigned to them by Tag Editor and set to “Use ON” (indicated
in white). Tags that are set to “Use OFF” or the ones that do not have recorders and
channels assigned to them (indicated in gray) are skipped.
Procedure
1. Click “GROUP” in the “DAQLOGGER Manager” window.
Group Editor starts and the “DAQLOGGER Group Editor” window opens.
2. To select the group, click the cell in the “No.” column in the group list section or click
the group tab in the tag assignment display section.
2-32
IM WX101-01E
Page 53

1
2
Starting with the first tag in the selected
range, tags are assigned to the selected
range in the order that is specified by
the Tag Editor.
Waveform number
Auto Grouping button Group selection tab
Group list
(Group number and group name)
Turn ON/OFF the
selected range at once
Click this button to show or
hide the group list section.
2.8 Setting Groups
Configuring the DAQLOGGER
3. Click “Auto Grouping” on the toolbar or select “Auto Grouping” from the “Edit” menu
of the “DAQLOGGER Group Editor” window. The “Auto Grouping Setting” dialog box
opens.
Enter the number of tags per group and click “OK.” The tags are automatically
assigned to the groups. The number of tags assigned per group is saved even after
the dialog box is closed.
IM WX101-01E
2-33
Page 54

2.8 Setting Groups
To manually assign the tags to groups or to change the assignment, perform the following
procedure.
4. Click the tab to select the group to assign the tags.
5. Click the “Tag No.,” “T
to assign the tag. A dialog box for selecting “Tag No.,” “Tag Name,” or “Model:
Channel” appears.
Sele
Changing any one of “Tag No.,” “Tag Name,” and “Model: Channel” automatically
ct the “Tag No.,” “Tag Name,” or “Model: Channel” to be assigned. Select “None,”
if the tag is not to be assigned.
changes the other two.
ag Name,” or “Model: Channel” cell of the waveform number
If the waveform number are selected in a series, click the tool cell in the bottom
Showing/Hiding Tags
Procedure
1. Click the check box of the “No.” column cell to switch the show and hide condition of
By clicking the tool cell at the bottom when consecutive cells selected, you can
to set tag names in order from the tag name of the rst waveform number in the
selected range.
the tag.
switch between show and hide in the selected range at once.
Changing the Group Name
Procedure
1. Click the “Group Name” cell in the group list section or click the group name display
section in the tag assignment display section. Then, enter the group name using the
keyboard. Changing the name in one changes the other.
2-34
IM WX101-01E
Page 55

1
2
Saving the Group Settings
Selects only valid groups (group in which at least one tag is assigned).
Selects all groups.
Group settings cannot be saved while scanning or recording is in progress.
Procedure
1. In the “DAQLOGGER Group Editor” window, select “Save” from the “File” menu.
The settings are saved.
Note
The group setting items are items that can also be set or changed in the display settings of
Data Monitor. If you change the tag assignments, show/hide condition of tags, or group names
and save the information, the information is also reflected in Data Monitor. However, other
items set in the display settings of Data Monitor (“Scale” and “Meter Type,” for example) are left
unchanged (Even if you change the tag assignments, other tag settings do not change).
Printing the Group Setting Information
Procedure
Setting the printer
1. In the “DAQLOGGER Group Editor” dialog box, choose “Print Setup” from the “File”
menu.
2. The “Print Setup” dialog box appears. Set “Printer,” “Paper,” and “Orientation”
according to the printer that you are using.
2.8 Setting Groups
Configuring the DAQLOGGER
Displaying the print preview of the group setting information
3. In the “DAQLOGGER Group Editor” dialog box, choose “Print Preview” from the “File”
4. A dialog box for selecting the group to be printed appears. Select the group.
menu or click the “Print Preview” icon on the tool bar.
IM WX101-01E
2-35
Page 56

2.8 Setting Groups
5. Click “OK” to display the print preview dialog box. The print image of the selected
group is displayed.
6. Click “Close” in the print preview dialog box to close the print preview display.
Printing the Group Setting Information
7. In the “DAQLOGGER Group Editor” dialog box, choose “Print” from the “File” menu
8. A d
9. Click “OK.” The print process is performed for the selected group and the “Print”
10. Click “OK” to start printing.
or click the “Print” icon on the tool bar.
ialog box for selecting the group to be printed (see the previous section, “Displaying
the print preview of the group setting information”) appears. Select the group.
dialog box appears.
2-36
IM WX101-01E
Page 57

1
2
Terminating the Group Editor
If there are group settings that have not been saved, a save confirmation message
appears. Save the settings according to the message.
Procedure
1. In the “DAQLOGGER Group Editor” window, select “Exit” from the “File” menu. The
“DAQLOGGER Group Editor” window closes and the program terminates.
2.8 Setting Groups
Configuring the DAQLOGGER
IM WX101-01E
2-37
Page 58

2.9 Configuring the Logger
Before collecting measured/computed data by executing SCAN and RECORD, set the
logger configuration.
Configuring the Logger
Procedure
1. In the menu bar of the “DAQLOGGER Manager” window, select “Logger” then
“Conguration.”
The “Logger Conguration” dialog box appears.
2. In the “Scan Interval” box, enter the scan interval in seconds.
Note
Depending on the number of connected recorders, the specified scan interval may be too short
to collect all of the data and may result in data dropouts. In this case, change the scan interval
to a larger value.
3. In the “Recording Rate” box, enter the recording rate in terms of scans.
For example, if the scan interval and recording rate are set to 2 seconds and 5,
respectively, then the measured data are saved to the le at intervals of 10 seconds (2
x 5).
2-38
IM WX101-01E
Page 59

1
2
2.9 Configuring the Logger
4. If necessary, set whether or not to measure in zero start adjustment mode.
In zero start adjustment mode, when the scan interval is less than a minute (1 to 59),
the start time of the scanning operation is adjusted so that the operation takes place
at 00 sec every minute. If the scan interval is greater than or equal to one minute (60
to 3600), the scanning operation is adjusted so that the operation takes place at 00
min 00 sec every hour.
The zero start adjustment mode is valid for scan intervals which are a divisor of 60
when it is less than a minute, and for scan intervals which are a divisor of 3600 when
it is greater than or equal to one minute.
5.
If necessary, set whether or not to record in the zero start adjustment mode.
The zero start adjustment for recording is valid when the zero start adjustment for
scanning is enabled.
When the record interval (scan interval x recording rate) is less than a minute (1 to
59), and is a divisor of 60, the start time of recording is adjusted so that recording
starts at 00 s every minute. If the record interval is greater than or equal to one
minute and less than one hour (60 to 3599), and is a divisor of 3600, the start time
of recording is adjusted so that recording starts at 00 min 00 s every hour. If the
record interval is greater than or equal to one hour and less than or equal to one day
(3600 to 86400), and is a divisor of 86400, the start time of recording is adjusted so
that recording starts at 00 hour 00 min 00 s everyday
6.
In the “Start” box, select the start condition, “On Record” or “Fixed time.”
If you select “On Record,” the recording operation starts when the “RECORD” button
is clicked. If you select “Fixed time,” the recording operation starts automatically at
the specied time.
7.
In the “End” box, select the end condition, None, Fixed time, or Data count.
If you select “None,” the recording operation stops when the “STOP” button is
clicked. If you select “Fixed time,” the recording operation stops automatically at the
specied time. If you select “Data count,” the operation stops when the specied
number of data points have been recorded.
8.
Click the “Select folder” button to specify the folder used to save the recording
results (data le).
The “Browse for Folder” dialog box appears.
.
Configuring the DAQLOGGER
9. Specify the folder to save the data le, then click “OK.”
Note
Report files are also saved to this folder.
IM WX101-01E
2-39
Page 60

2.9 Configuring the Logger
10. If necessary, specify the name of the data le in the “Extra le name” box.
The specied character string will be placed at the beginning of the le name. For
example, if “ABCD” is specied, the le names will be ABCD-0000.mld, ABCD-0001.
mld, etc. If it is not specied, the le names will be 000.mld, 0001.mld, etc. The le
extension “.mld” is xed.
11. If necessary, check the “Add Date” box.
If it is checked, an 8-digit number will be placed at the beginning of the
le name.
For example, if the les are recorded on January 25, 1999, the le names will be
19990125-0000.mld, 19990125-0001.mld, etc.
However
be plac
, if “per Hour” is specied for “File division” in step 11, a 10-digit number will
ed at the beginning of the le name. For example, if the le is recorded at the
15th hour (3 p.m.) on January 25, 1999, the le name will be 1999012515-0000.mld.
If the “Extra le name” is specied, the date will be added after the specied le
name as in ABCD-19990125-0000.mld.
12. In the “File division” list box, select the method of le division which is performed
when data is saved.
The list box shows 4 methods: “Off,” “Data count,” “per Day,” “per Hour,” and “per Month.”
If you select Data count, enter the number of data points to be saved in a le.
If you select per Day or per Hour, the le will be divided at 0 a.m. every day or at 0
minute every hour, respectively.
For “per Month,” select a reference day (1-28). A le from just after 0 hours, 00
minutes, 00 seconds until the last recorded data is created. Data at 0 hours, 00
minutes, 00 seconds is saved in the next le.
13. If necessary, click the Comment button for the Comment setting eld. Enter the Title
and Content of the comment. Up to eight title and content sets can be entered. Up
to sixteen alphanumeric characters can be used for titles, and up to sixty-four can be
used for contents.
Note
You can change the comments during data scanning, or while data scanning is paused.
Comments cannot be changed during data recording. They can only be displayed.
2-40
14. If you want to limit the number of data les that are saved to the folder for a single
measurement, select the “Keep the number of recording les” check box, and enter
the maximum number of les from 1 to 2000. If creating a data le causes this limit
to be exceeded, the oldest data le that was created during the measurement is
deleted.
IM WX101-01E
Page 61

1
2
2.9 Configuring the Logger
15. If necessary, set the “Action on Undesired Disconnection.”
After you select the check box, enter the time interval (in seconds) for checking the
recovery of the disconnected recorder.
This aut
o-reconnecting function checks, at the specied number of seconds, whether
a recorder that experienced a communication error during the initial communication
or a recorder that went out of communication due to some sort of trouble has
recovered or not. If the recorder has recovered, it is rescanned.
Note
• When becoming a communication fault, the data of the recorder is displayed to OFF.
• The following occur in the Monitor and Viewer screens during communication retries.
Monitor screen
If the communication retry is successful, the channel settings of the connected instrument
with which communication was recovered are reloaded, and waveforms are redisplayed. If a
connection with the instrument still cannot be made after a communication retry, the decimal
place, scale, and trip point settings are initialized. If any subsequent communication retry is
successful and the connection is reopened, the correct decimal place is loaded and all monitor
screens are redisplayed. The loading of the channel settings upon a successful retry after the first
communication error is the same as that if no error had occurred during the first communication.
Viewer screen
If the file being logged is to be displayed (if the current data button is pressed) after the
communication retry succeeds, the file is reloaded. If a connection with the instrument cannot
be made during communication, values such as the decimal place and span are initialized.
Therefore if the communication retry is successful, the correct decimal place must be reloaded.
Configuring the DAQLOGGER
16. If necessary, set “Math.” From the “Action” list box, select the recorder computation
None: Does nothing.
Start: Starts the computation.
Stop: Stops the computation.
Clear: Clears the computed data.
Clea
However, the following restrictions exist depending on the recorder.
17. Click the “OK” button.
The n
operation to be executed at the start of the scanning operation. This setting is
common to all recorders that have the computation function.
r&Start: Clears the computation and then starts the computation.
• µR recorders do not accept “Clear” action.
• As for VR, DX, MV, and CX “Clear” action operates when the computation is
stopped.
• When the DX/MV/CX is connected to the Ethernet network, administrator-level
login name must be specied (see section 2.6).
ew logger conguration is saved.
IM WX101-01E
2-41
Page 62

2.9 Configuring the Logger
Starting the Scanning
Procedure
Starting the Recording
Procedure
In the scanning operation, data is being collected from the connected recorders via
communication and the personal computer receives the data, but does not save it.
1. In the “DAQLOGGER Manager” window, click the “SCAN” button.
After obtaining the information of each recorder, the scanning operation starts.
Note
The time it takes to start the scanning operation depends on the number of connected
recorders. For example, if 8 recorders are connected, it takes about 40 seconds.
2. Monitor or Record the data.
See chapter 3 “Data Monitor” or “Recording” in the following.
3. Click the “STOP” button.
The scan
In the recording operation, the data being scanned are saved in a file.
1. In the “DAQLOGGER Manager” window, click the “RECORD” button.
After obtaining the information of each recorder, the recording operation starts. The
measured data is saved according to the conditions set in “Conguring the Logger.”
2. When the end condition is met or when the “Stop” button is clicked, the recording
operation stops and the logger enters the scanning operation.
ning operation stops.
Note
Do not change the date or time of the personal computer while scanning or recording.
Starting/Stopping Computation on Recorders
This operation is effective while scanning or recording is in progress.
Procedure
1. In the “DAQLOGGER Manager” window, select the operation from the “Logger”
menu.
Math Start: Starts the computation
Math Stop: Stops the computation
Math Clear: Clears the computated data
Math Clear&Start: Clears the computation and then starts the computation.
However, the following restrictions exist depending on the recorder.
• µR recorders do not accept “Clear” action.
•
As for VR and DX, “Clear” action operates when the computation is stopped.
• When the DX is connected to the Ethernet network, administrator-level login name
must be specied (see section 2.6).
2-42
IM WX101-01E
Page 63

1
2
2.9 Configuring the Logger
Displaying the Information of the Scanned and Recorded Data
Procedure
1. In the “DAQLOGGER Manager” window, select “Logger Information” from the “Logger”
menu. As shown below, the information about the data being scanned and recorded
is displayed.
Configuring the DAQLOGGER
Stopping the Scanning Operation
Stopping the Recording Operation
If you perform the following procedure when recording operation is in progress, the logger
stops recording data and enters the scanning operation. When scanning operation is in
progress, the logger stops scanning and enters a communication-stopped state.
Procedure
1. In the “DAQLOGGER Manager” window, click the “STOP” button.
The ongoing process (scanning or recording) stops.
IM WX101-01E
2-43
Page 64

2.10 Configuring the Report Function
The Report Function prints (or outputs to a file) at a specified time, the instantaneous
values, the minimum and maximum values from the data that are scanned and recorded
over an hour, a day, or a month and, in addition, the average values, sums, and
accumulating totals that are determined by computation.
The file is output in binary or text format. You can view the binary files using Viewer.
This function generates the following four types of reports:
Types Interval of Report Generation Computed Data Contents
Hourly report Every hour
(The 1st hour, the 2nd hour, ...
the 23rd hour, the 24th hour)
Daily report Every day (at a specified time) Instantaneous value at the time the
Weekly report Every week
(at a specified day and time)
Monthly report Every month
(at a specified date and time)
Instantaneous value at the time the
report is generated.Average/maximum/
minimum values of the hour
Sum of the hour/accumulating total
report is generated.
Average/maximum/minimum values of
the day
Sum of the day/accumulating total
Instantaneous value at the time the
report is generated.
Average/maximum/minimum values of
the week
Sum of the week
Instantaneous value at the time the
report is generated.
Average/maximum/minimum values of
the month
Sum of the month
File names consist of the report type (H: hourly report, D: daily report, W: weekly report, M:
monthly report), a “-” character, and the time that the file was saved (4-digit year, 2-digit
month, 2-digit day, and 2-digit hour). If a file with the same name already exists where
the report file will be saved, “-XXXX” (a 4-digit sequence number starting from 0001) is
appended to the report file name.
Example: A monthly report that is created as a text file at 03:00 on January 2, 2010,
would be saved with the file name M-2010010203.txt. If a file with the same name
already exists, this report is saved as M-2010010203-0001.txt.
Data that are used
You can select scan data or record data.
If you specify scan data, scanning operation must be in progress; if you specify record
data, recording operation must be in progress.
2-44
IM WX101-01E
Page 65

1
2
7:00 8:00 9:00 10:00
Time
Hourly report creation
Specified time for creating the report
Computation result
Accumulating total
Sum
8:00 9:00 10:00 11:00
2.10 Configuring the Report Function
Sum and accumulating total
• Sum
This value is computed by summing the data over an hour for hourly reports, over a
day for daily reports, over a week for weekly reports, and over a month for monthly
reports. It is reset at the time when the corresponding report is generated.
• Accumulating total
Accumulating total can be specied only on hourly and daily reports.
For hourly reports, this value is computed by summing the data until the time the
report is generated (the report creation time set for daily reports). It is reset every day
at the report creation time set for daily reports (the value is the same as the sum of the
daily report).
For daily reports, this value is computed by summing the data
the report is generated (the report creation date and time set for monthly reports). It
is reset every month at the report creation date and time set for monthly reports (the
value is the same as the sum of the monthly report).
until the date and time
Configuring the DAQLOGGER
The following example shows the accumulating total for hourly
reports. The time
when the daily report is generated is 8 O’clock.
About the sum unit
In the sum computation, data are summed over the scan interval. However, for flow
values that have units /s, /min, /h, or /day a simple summation results in the actual value
not matching the computed result, because the scan interval and the unit of the input
values are different. In these cases, the unit of the data measured over the scan interval
is converted to match the unit of the input values and the computation is performed.
For example, if the scan interval is 2 s, and the input value is 100 m
summation would add 100 every 2 s resulting in 3000 after one minute. However, if the
sum unit is set to /min, then 2s/60s is multiplied every scan interval before the value is
added giving a result that is close to the actual input value. The scan interval unit is in
seconds.
Sum Unit Conversion
Off ∑(measured/computed value)
/s ∑(measured/computed value) × data acquiring interval*
/min ∑(measured/computed value) × data acquiring interval*/60
/h ∑(measured/computed value) × data acquiring interval*/3600
/day ∑(measured/computed value) × data acquiring interval*/86400
*
Data acquiring interval refers to scan interval or record interval.
3
/min, a simple
IM WX101-01E
2-45
Page 66

2.10 Configuring the Report Function
Processing for abnormal data
If any abnormality is detected in the data being computed, the following processing will
be performed according to the type of computation and the type of data abnormality.
Type of abnormality Average value Max/min value Instantaneous value Sum value
Overflow (+) Not used for
Overflow (-) Not used for
Source channel
skipped
No source channel Not used for
Error or power failure Not used for
Data dropout Not used for
Cannot output data Not used for
Basic Operation
To switch between “Group Name” and “Tag Number” display
To switch between “Tag Number” and “Tag Name” display
• Click the tool cell in the bottom to switch the display.
To select tag(s)
•
Click the tag number cell or tag name cell.
• To select tags over an area, click the rst cell, then, pressing the SHIFT
last cell.
To specify/cancel report item
•
Click the cell of the item.
• If tags are selected over an area, click the tool cell in the bottom to collectively specify/
cancel the item that corresponds to the tool cell.
To specify/cancel report items collectively for a group
Click the header item (“Inst,” “Min,” “Max,” “Ave,” “Sum,” or “Total”). If any group is
•
already dened in the Data Monitor window
showing a listing of the groups.
• In the “Group Selection” window, click the check box in the “Number” cells to specify/
cancel the settings collectively for the group.
computation
computation
Not used for
computation
computation
computation
computation
computation
Used for
computation
Used for
computation
Not used for
computation
Not used for
computation
Not used for
computation
Not used for
computation
Not used for
computation
, the “Group Selection” window will appear,
Computation result
data is abnormal
Computation result
data is abnormal
Computation result
data is abnormal
Computation result
data is abnormal
Computation result
data is abnormal
Computation result
data is abnormal
Computation result
data is abnormal
Not used for
computation
Not used for
computation
Not used for
computation
Not used for
computation
Not used for
computation
Not used for
computation
Not used for
computation
key, click the
2-46
IM WX101-01E
Page 67

1
2
Click to open the “Group Selection” window.
Set the values in the selected range
to the first value in the selected range.
Specify/Cancel the report item
in the selected range at once.
Switch tag number/tag
name display.
2.10 Configuring the Report Function
Setting the Contents of Hourly/Daily/Weekly/Monthly Reports
The tags initially displayed in the report settings window are those of the current project's
saved data.
Only valid tags that have already been set through the operations in the sections up to
section 2.8 are displayed.
You cannot set the contents of the reports when the report function is in operation.
Procedure
1. In the menu bar of the “DAQLOGGER Manager” window, select “Others,” “Report,”
and then “Conguration.”
The “DAQLOGGER Report” dialog box appears.
Configuring the DAQLOGGER
2. Click the tab of the type of report you wish to specify to show the tab panel.
The tab panel is common to the settings of hourly, daily, weekly, and monthly reports,
and those items that are not applicable are disabled (appears dimmed).
3. Set the report item.
To set a link between a tag and report item(s)
Click the item cell (“Inst,” “Min,” “Max,” “Ave,” “Sum,” or “Total”) of the tag you wish to
report. You can select more than one item for a tag.
To set the items collectively for the selected tags, click the tool cell at the bottom of
each item’s column.
T
o set the items on a group-by-group basis, see the following “To operate the Group
Selection window
.”
To operate the Group Selection window
In this window, you can collectively set or clear report items on a group-by-group
basis.
Click the header item (any one from “Inst,” “Min,” “Max,” “Ave,” “Sum,” and “Total”) you
wish to set for the group(s).
The “Group Selection” window appears.
Note
If no group has been defined in the Group Editor or the Data Monitor, you cannot use the Group
Selection window, because no information is displayed.
IM WX101-01E
2-47
Page 68

Check box
Green: A portion of the tags within the group is selected for the report
Blue: All tags within the group are selected for the report
Gray: None of the tags within the group is selected for the report
(Window when the “Max” box is clicked)
Specify/Cancel the report item for
the groups in the selected range at once.
Switch the group name/group
number display.
When the left column is displaying
tag numbers, drag this knob to
scroll through the tag numbers.
When the left column is displaying
tag numbers, click this button to
scroll the tag numbers one by one.
2.10 Configuring the Report Function
To set the items group-by-group, click the check box in the “Number” cell that
corresponds to the group name and turn it ON (blue).
When you have nished selecting group(s), click “OK.”
A green check box indicates that only a part of the member tags of that group have
been specied to be reported.
To revert the display contents, click “Revert.”
To switch the display between “Group Name” and “T
the bottom.
ag Numbe
r,” click the tool cell at
If you display “Tag Number” and click the “Position” cell, the pointer moves, and you
can scroll the tag numbers. By clicking the tool cell button at the bottom, you can
scroll the tag numbers of the selected group.
2-48
IM WX101-01E
Page 69

1
2
The first line: Type, “REPORT,” date of generation, and start time of data
scanning or
recording
HOURLY REPORT Aug/20/1999 10:00:00 (START=Aug/20/1999 09:58:51)
The second line: Item names
NO TAG UNIT INSTANT MIN MAX AVERAGE SUM TOTAL
The third line and after: Data of individual tags
001 TAG-REC01-01 mV 173.2 -200.0 200.0 1.25667e+001 8.671000e+002 8.671000e+002
2.10 Configuring the Report Function
4. Specify the input source.
Select “Scan” or “Record.”
Scan : Use the data per scan interval.
Record : Use the data per record interval.
5. Specify the output destination.
Binary: Outputs the report to a le in binary format (extension: .rbi). The report can
be viewed using Viewer.
Text: Outputs the report to a text le in a tab-delimited format (extension: .txt). The
format is as follows.
Configuring the DAQLOGGER
Print: Outputs to the printer specied in the printer setting. Output format is the
same as that of the “Text.”
A print example is shown below.
Note
The output destination cannot be set only to “Print.”
IM WX101-01E
2-49
Page 70

2.10 Configuring the Report Function
6. Specify the base time and date.
This is the date and time the reports are created.
Specify the time for hourly reports, date and time for monthly reports, and day and
time for weekly reports. The time is common to all reports (hourly, daily, weekly, and
monthly reports).
Note
If you specify 29th, 30th, or 31st for the “Base Date” for monthly reports, the date of the report
generation on months that do not have these dates are set to the equivalent dates of 29th,
30th, and 31st as shown in the following example.
Example: If the “Base Date” is set to “31st,” the report for June is created on the following day
of June 30th, which is July 1st (at the base time). The report for July is created on the data
between July 2nd and July 31st.
7. Specify the time unit of integration (“Sum Unit”)
Click the sum or accumulating total cell and select the unit of integration from the list
box. The list box shows “None,” “Second,” “Minute,” “Hour,” and “Day.”
If you select the “by calculate” check box in the “Sum Unit” column, the unit of
integration applies to both sum and accumulating total (Changing one unit changes
the other).
If you select the “by Report” check box in the “Sum Unit” column, the selected unit of
integration is set to the unit of integration for the same computation of the same tag
for all types of reports.
Setting the Printer
Set the printer used to print the reports.
Printer setting operation is the same as that of the print command of Windows.
Procedure
1. In the “DAQLOGGER Report” dialog box, click “Print Setup” at the bottom of the
window.
The “Print Setup” dialog box appears.
2. Set the items in the dialog box, and then click “OK.”
Saving the Report Configuration
Save the current settings and terminate configuration.
Procedure
1. In the “DAQLOGGER Report” dialog box, click “OK” at the bottom of the window.
The setting data are saved, and the dialog box closes.
Redisplaying the Current Settings
To cancel the current setting operation and redisplay the setting data before the
operation, do the following.
Procedure
1. In the “DAQLOGGER Report” dialog box, click “Revert” at the bottom of the dialog
box.
The current data settings are discarded and the data before the setting operation are
displayed.
2-50
IM WX101-01E
Page 71

1
2
Report Function
You can print out the report settings.
Procedure
1. In the DAQLOGGER Manager window, choose Other > Report > Print Setting.
2. Enter the settings, then press OK. The report settings are printed out. The report
pages for time, day, month, and week must be printed out separately.
Terminating the Report Configuration
Procedure
1. In the “DAQLOGGER Report” dialog box, click “OK” at the bottom of the window.
The setting are saved, and the dialog box closes.
Click “Cancel” to discard the settings and close the “DAQLOGGER Report” dialog
box.
Starting/Stopping the Report Function
Procedure
Starting the report function
1. In the menu bar of the “DAQLOGGER Manager” window, select “Others,” “Report,”
and then “Start.” The report function is started.
2.10 Configuring the Report Function
Configuring the DAQLOGGER
Stopping the report function
1. In the menu bar of the “DAQLOGGER Manager” window, select “Others,” “Report,”
and then “Stop.” The report function is stopped.
IM WX101-01E
2-51
Page 72

2.11 Setting Up the DDE Server
Using the DDE server permits data and time that are scanned and recorded by the
logging software to be loaded into client applications, such as EXCEL. For detailed
information about DDE, refer to a book that is commercially sold.
Starting the DDE Server
Procedure
1. Click “DDE” in the “DAQLOGGER Manager” window.
The DDE Server starts and the “DAQLOGGER DDE” window appears.
If you start the scanning or recording operation in this condition, the updating of
the topic data that are displayed on the “DAQLOGGER DDE” window starts (If the
scanning or recording operation is already started, the data updating starts when the
“DAQLOGGER DDE” window appears).
The number of data points displayed in topic “data” is the maximum number of
channels (1600, 1000, or 400).
Setting Up the DDE Server
Perform the following procedure when you need to change the configuration.
Procedure
1. In the menu bar of the “DAQLOGGER DDE” window, select “DDE Server” and then
“Set Application Name.”
The “Set Application Name” dialog box opens.
Type the application name and click “OK.”
The default application name is “MLDdeSrvr.”
2. In the menu bar of the “DAQLOGGER DDE” window, select “DDE Server” and then
“Update Mode.”
2-52
IM WX101-01E
Page 73

1
2
The “Update Mode” dialog box opens.
Select either of the following and click “OK.” “Scan Interval” is default.
Scan Interval
Updates data of individual items at the scan interval set in the logging software.
However, the data are updated only during the scanning operation.
Record Interval
Updates data of individual items at the record interval set in the logging software.
The time and data that are displayed are the ones that are actually recorded.
However, the data are updated only during the recording operation.
The intervals mentioned above are set in the “Logger Conguration” dialog box.
For details on how to set these intervals, see section 2.9, “Conguring the Logger.”
Pausing/Terminating the DDE Server
2.11 Setting Up the DDE Server
Configuring the DAQLOGGER
Procedure
1. To pause or resume the DDE Server, perform the following procedure.
In the menu bar of the “DAQLOGGER DDE” window, select “DDE Server” and then
“Pause.” The updating of the topic data that are displayed in the “DAQLOGGER
DDE” window is paused. The data updating on the DDE client side is also paused.
To resume the DDE Server, select “DDE Server” and then “Resume” in the menu bar
of the “DAQLOGGER DDE” window.
2.
To terminate the DDE Server, perform the following procedure.
From the menu bar of the “DAQLOGGER DDE” window
then “Exit” or click the “Close” button at the upper right corner of the window. The
“DAQLOGGER DDE” window closes and the data updating on the DDE client side is
stopped.
, select “DDE Server” and
Note
If the DDE server is terminated directly, the message, “M4132 OK to stop server?” appears. If
you select Yes and a client is connected, communication is disconnected. Note that the DDE
server will not start the next time DAQLOGGER Manager is started.
IM WX101-01E
2-53
Page 74

(Changeable)
Topic name
TAG1600
(Scanned or
recorded data)
(Scanned or
recorded data)
.................
.................
.................
Item name
time
no
(Data No.)
(Time)
(Date)
MLDdeSrvr
sdate date
data
TAG001
Application name
2.11 Setting Up the DDE Server
Preparing the DDE Client
DDE Server uses the following character strings (application name, topic name, and item
name) to provide DDE services so that DDE clients can read the data.
Only the application name is changeable and all others are fixed. The number of data
points is the maximum number of channels (1600).
For details on how to specify data in the DDE client, see the instruction manual for the
software program that you are using.
When using EXCEL, enter “=Application name|Topic name!Item name” in the cell. For
example, to display TAG0001, enter “=MLDdeSrvr|data!TAG0001.”
2-54
IM WX101-01E
Page 75

1
2
2.12 Setting Up the Monitor Server
(Host Name)
(Client Name)
The Monitor Server transfers the scanned or recorded data to the remote monitor* that is
connected via the Ethernet network. Up to 16 remote monitors can be connected.
The remote monitor can be used to display and monitor the received data.
Starting the Monitor Server
Procedure
1. Click “M.SERV” in the “DAQLOGGER Manager” window.
The Monitor Server starts and the “DAQLOGGER Monitor Server” window appears.
The Monitor Server is running when the “DAQLOGGER Monitor Server” window is
displayed. When a remote monitor connects to the Monitor Server, the host name
and the client name appears in the “DAQLOGGER Monitor Server” window.
Configuring the DAQLOGGER
Setting Up the Monitor Server
To change the port number, perform the following procedure. The default port number is
“50280.”
The following procedure can be performed while communicating with a remote monitor.
However, the new port number is activated when the Monitor Server is restarted.
Procedure
1. In the “DAQLOGGER Monitor Server” window, select “Port No.” from the “Monitor
Server” menu.
The “Port No.” dialog box opens.
Enter the port number (0 to 65535) and click “OK.”
IM WX101-01E
2-55
Page 76

2.12 Setting Up the Monitor Server
Pausing/Terminating the Monitor Server
Procedure
1. To pause or resume the Monitor Server, perform the following procedure.
In the “DAQLOGGER Monitor Server” window, select “Pause” from the “Monitor
Server” menu. The data updating on the remote monitor side is paused.
To resume the Monitor Server, select “Monitor Server” and then “Resume” in the
menu bar of the “DAQLOGGER Monitor Server” window.
remote monitor side is resumed.
2.
To terminate the Monitor Server, perform the following procedure.
From the menu bar of the “DAQLOGGER Monitor Server” window
Server” and then “Exit” or click the “Close” button at the upper right corner of the
window. The communication with the remote monitor is disconnected.
Preparing the Remote Monitor
See chapter 8.
The data updating on the
, select “Monitor
2-56
IM WX101-01E
Page 77

1
2
2.13 Setting Up the Control Server
Starts the control server
Entering Control Server Settings
The control server forwards each control request that is sent from the remote control
software (see chapter 8) to the manager software.
Procedure
1. Press the C.SERV button in the DAQLOGGER Manager window.
When using the DAQLOGGER for the rst time after installation, the Login Password
Enter the password to be used for the remote control software. Enter it again in the
Configuring the DAQLOGGER
window is displayed.
Conrm box, then click OK. The DAQLOGGER Control Server window appears.
The host name of the PC that will be sending the remote controls may appear in the
Host Name tab.
The following communications history information may appear in the Log tab. The
newest history and/or selected history are highlighted.
Protect Cancel: Password protection cancelled by the controller.
Protect ERROR:
Connect ERROR: Connection was cut.
Port Open: The port is open.
Port Close: The port is closed.
Open Error: Open port failed.
Login: Password required.
Host:***: Host [***] is connected.
Logout: Remote controller logged out.
LoginERROR: Remote control login failed.
Scan Start: Received scan start command.
Record Start: Received record start command.
Protect Cancel failed.
IM WX101-01E
2-57
Page 78
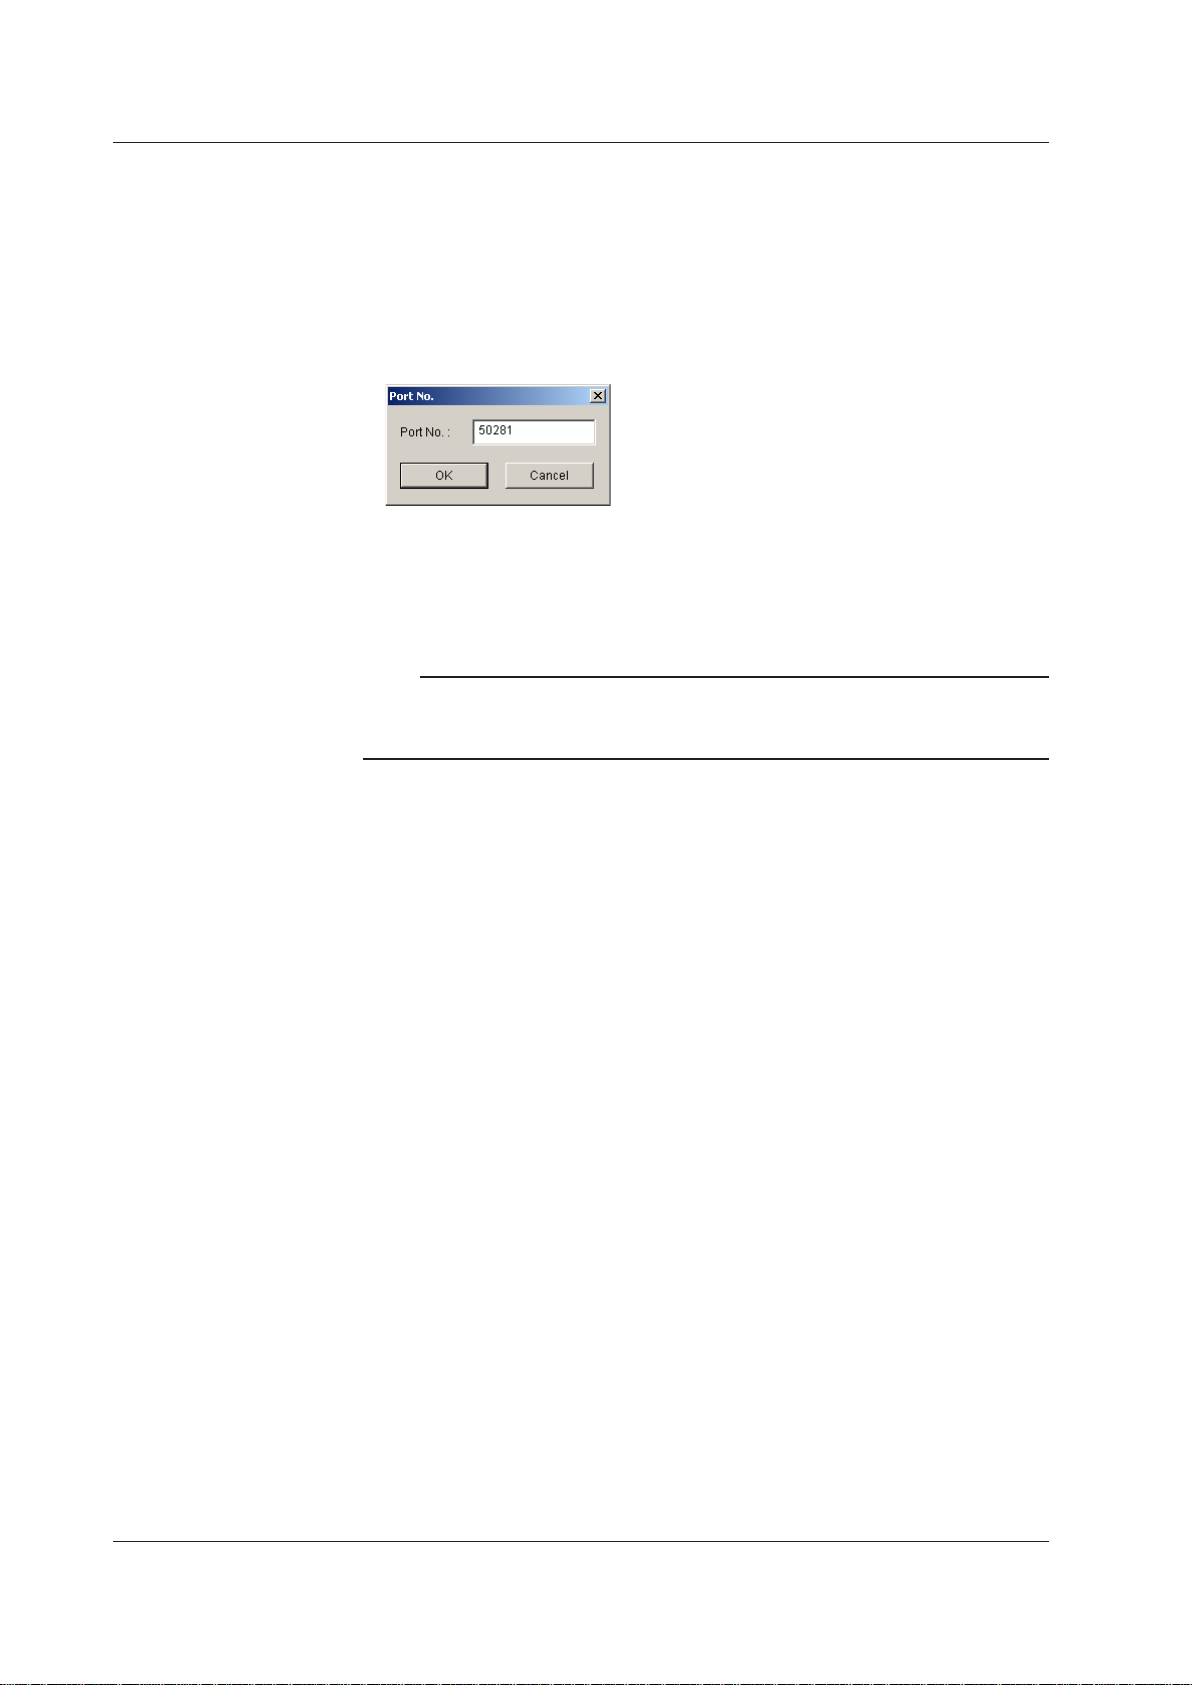
2.13 Setting Up the Control Server
Scan Stop: Received scan stop command.
Record Stop: Received record stop command.
Event Processor Start: Received Event Processor start command.
Event Processor Stop: Received Event Processor stop command.
User Event: User event sent.
2. Choose Control Server > Port No., and enter the port number to which the remote
control software will connect. Be sure not to enter settings that overlap with other
applications.
3. To change the login or password, choose Control Server > Login Password. The
Current Login Password dialog box appears.
4. Enter the current password. A dialog box for entering the new password appears.
5.
Enter the new password.
Note
If the control server is terminated directly, the message, “M4132 OK to stop server?” appears. If
you select Yes and a client is connected, communication is disconnected. Note that the control
server will not start the next time DAQLOGGER Manager is started.
2-58
IM WX101-01E
Page 79

1
2
3
Standard Tool bar
Menu bar
Monitor bar
Status bar
If Internet Explorer Ver. 4.0 or after is
installed, a list box is displayed in the
right of each button.
The list box shows the currently opened
monitor window(s). If clicked, the
selected window will be displayed on
top. If Internet Explorer Ver. 4.0 or later
is not installed, you can also open these
listings by clicking the button with the
right mouse button.
Click to refresh the screen.
Chapter 3 Using Data Monitor
3.1 Displaying Waveforms on the Monitor Window
Data Monitor, the monitor software, displays the measured/computed data that is
currently being collected using the logger software. Data monitor offers 5 display formats
to display measured data: trend, numeric, meter, alarm, and color graph.
Displaying the Monitor
Procedure
Using Data Monitor
1. In the “DAQLOGGER Manager” window, click the “MONITOR” button.
The “DAQLOGGER Data Monitor” window appears.
Measured data is displayed only during the scanning or recording operation. If
no measured data is displayed, click the “SCAN” or “RECORD” button in the
“DAQLOGGER Manager” window.
IM WX101-01E
• Even if the scanning operation is started without opening the monitor window, the
measured data is collected. And when the monitor window is opened, the data
collected up to that point is displayed.
•
The scanning operation can also be started after opening the monitor window. For
the procedures regarding the scanning operation, see section 2.9 “Conguring the
Logger
• The trend monitor can display up to 3600 data points.
2. Click the “TREND,” “METER,” “NUMERIC,” “ALARM,” or “COLOR” button on the
A
.”
monitor bar.
new monitor window of the clicked button opens.
3-1
Page 80

3-2
IM WX101-01E
Link ON/OFF button
Display settings
Pause waveform
display
Save display settings
Alarm display ON/OFF button
Tag number/name display switch button
Zoom in/out of time axis
Waveform display zone buttons
Waveform display limit (clip) button
Cursor value display button
Clicking the
waveform zone
bar changes
the current
waveform.
Zone bar display
area
Tab for adjusting
grid brightness
Tab for adjusting
the brightness of
the waveform
display area
Waveform display
ON/OFF
Display zone
Time (absolute time) or
elapsed time (relative
time)
Alarm indicator
Click this bar to show or
hide the display zone
bars
Drag this bar to adjust the width of
the waveform display area
(possible while the monitor is in
pause mode)
Red bar start blinking
when an alarm occurs
Select monitor
Select display group
Trip point 2
Trip point 1
Waveform display area
Auto Grouping
Link ON/OFF button Display settings
Pause updating data
Save display settings
Alarm display ON/OFF button
Tag number/name display switch button
Select monitor
Red bar start blinking
when an alarm occurs
Select display group
Bar meter
Thermometer
Tag number
/name
Analog Meter
Alarm indicator
(Level1, 2, 3, 4
from the left)
Waveform
display color
Auto Grouping
3.1 Displaying Waveforms on the Monitor Window
Note
• You can open multiple monitor windows at the same time, but doing so may lower the PC’s
performance.
• When multiple monitor windows are displayed, the windows can be aligned. In the menu
bar, select “Window” then “Cascade” or “Tile.”
• Up to two alarm monitor screens can be displayed. Up to twelve screens of other monitors
can be displayed. If the number of displayed monitor screens exceeds the limit, you can
click the Monitor server button to display all screens in order from 1 to 12.
Trend Monitor
Meter Monitor
Page 81

1
2
3
Numeric Monitor
Link ON/OFF button
Display
settings
Pause updating data
Save display settings
Alarm display ON/OFF button
Tag number/name display switch button
Tag number
/name
Current
measured
value with
respect to
the scale
Waveform
display color
Select monitor
Red bar start blinking
when an alarm occurs
Select display group
Alarm indicator
(Level1, 2, 3, 4,
from the left)
Auto
Grouping
Link ON/OFF button
Display settings
Pause updating data
Save display settings
Tag number/name display switch button
Group number
Select monitor
Select display
Alarm indicator
Turns red when an alarm occurs.
A blinking yellow ring is displayed around the lamp when there is an unconfirmed alarm.
The alarms are considered to have been confirmed if you click the lamp. At this point, the
ring disappears.
Auto Grouping
Alarm Monitor
3.1 Displaying Waveforms on the Monitor Window
Using Data Monitor
IM WX101-01E
For the log display, see “Alarm Monitor” (P. 3-16).
3-3
Page 82

3-4
IM WX101-01E
Link ON/OFF button
Display settings
Pause waveform display
Save display settings
Tag number/name display switch button
Zoom in/out of time axis
Waveform display color
Cursor value display button
Tag number/name
The color of the graph changes with data value along the scale.
Blue (minimum value), light blue, green, yellow, and red (maximum
value).
Time (absolute time) or
elapsed time (relative
time)
Select monitor
Red bar start blinking
when an alarm occurs
Select display group
Auto Grouping
3.1 Displaying Waveforms on the Monitor Window
Color Graph Monitor
Arranging the Monitor Window
Showing/Hiding the Standard Bar, Monitor Bar, and Status Bar
Procedure
Procedure
1. Select “Tile” or “Cascade” from the “Window” menu. The multiple monitor windows
that are displayed are arranged accordingly.
1. From the “View” menu, select the bar you wish to hide. The check mark in front
disappears and the bar is hidden. To show the bar, select the command again.
Page 83

1
2
3
3.2 Setting the Display Conditions
In this section, set the display conditions common to all types of monitors, such as scale,
zone, and waveform color. Also set the meter type for the meter monitor.
Note
In the following descriptions, “Tag Name” will be used to identify tags. If you wish to display
and use “Tag Number” instead, click the tag number display button in the tool bar.
Basic Operation
To select waveform number(s)
• Click the waveform number (“No.” cell).
• To select waveform numbers in a series, click the rst cell, then, pressing the SHIFT
key, click the last cell.
To switch the Use/Not Use of the settings
• Click the check box to switch the Use (blue)/Not Use.
• If waveform numbers are selected in a series, click the tool cell in the bottom to switch
the settings in the selected area at the same time.
To copy the display conditions
This operation is to copy the display conditions of a selected waveform number to
another waveform number.
1. In the “Display Settings” dialog box (see next page), click the “Copy Setting...”
button.
The “Copy Setting” dialog box opens.
Using Data Monitor
2. Check the items you wish to copy and click “OK.”
3. Click the “No.” cell of the copy source.
4. Click the “Copy” button.
5. Select the “No.” cell(s) of the copy destination.
To select consecutive numbers, click the rst cell then, pressing the SHIFT key, click
the last cell.
When you have nished selecting numbers, click the “Paste” button.
IM WX101-01E
3-5
Page 84

3-6
IM WX101-01E
3.2 Setting the Display Conditions
Automatically Assigning Tags to Groups
The scanned data are displayed by groups. You can specify the number of tags per
group (up to 32 tags/group), and automatically assign tags up to 50 groups.
Procedure
1. From the “View” menu, select “Auto Grouping.” The “Automatic Group Setting”
dialog box opens.
2. Enter the number of tags to assign per group in the “Amount of tags/group” box.
3. If necessary, select the “Use current display settings” check box.
If the check box is not selected, all information related to the tags in “Display
Settings” will be initialized.
If the check box is selected, only the tag assignment is changed, all other settings
remain the same.
4. Click “OK” to automatically assign the tags to groups.
The tags that have been set by Tag Editor are assigned to the groups in order from
the rst tag. However
(recorder numbers) and channels (channel numbers) assigned to them and set to
“Use ON.” Invalid tags (tags that are set to “Use OFF” or the ones that do not have
recorders assigned to them) are skipped.
When the specied number of tags is assigned to a group, the tags are assigned to
the next group.
, the tags that are assigned are the ones that have recorders
Note
• The information about group names, tag assignments to groups, and show/hide condition of
tags is also managed by Group Editor. If you change these settings in the “Display Settings”
dialog box of Data Monitor, they are also changed in Group Editor.
• “Amount of tags/group” and “Use current display settings” are saved even after the dialog
box is closed.
Page 85

1
2
3
Setting the Display Conditions for Individual Groups
Tag to be registered
Bar graph
Display scale
Turn ON/OFF trip point display
Meter
Y-axis display
Group tab
Thermometer
Meter type
Zone (display position)
Display
color
Turn ON/OFF
trip point
displays in the
selected range
Collectively set
defaults in the
selected range
Collectively set the trip
point in the selected
range as follows:
Trip1: Max.value of the scale
Trip2: Min.value of the scale
Copy the zone settings of
the first waveform number
in the selected range to all
wave waveform number in
the selected range
Copy the Y-axis settings of the first
waveform number in the selected
area to all wave waveform number in
the selected range
Collectively turn ON/OFF the
multiple-Y-axis displays in
the selected range
Set tags in order from the tag
name of the first waveform
number in the selected range
Collectively turn
ON/OFF the waveform
displays in the
selected range.
Turn ON/OFF
the display
Set trip points
Select items
to copy
Collectively set
defaults in the
selected area
Collectively set
meters in the
selected area
Copy
button
Paste button
Waveforms are displayed on a group-by-group basis. A group can contain up to 12 tags,
and the maximum of 32 groups can be registered.
Procedure
1. Click the “Display Settings” button on the tool bar or, in the menu bar, select “View”
then “Display Settings.”
The “Display Settings” dialog box appears.
3.2 Setting the Display Conditions
Using Data Monitor
IM WX101-01E
2. Click the group tab to display the group you wish to set.
This operation switches between the condition setting tab panels for individual groups.
3. In the “
“Group+2-digit number.”
To change this default group name, type the name in the “Group Name” box. Up to
16 characters can be entered for a group name.
4. To r
egister/change/delete a member tag of the group, click the “Tag Number” cell you
wish to operate.
The “Tag Name” dialog box appears.
ck the new tag name you wish to assign. If you wish to assign no tag, click “None”
Cli
in the bottom.
Note
This dialog box shows the tag names that are set using the Tag Editor.
After the “Tag Name” dialog box closes, the new setting is shown in the “Display
Settings” dialog box.
Group Name” box, a group name is initially shown in the default format of
3-7
Page 86

3-8
IM WX101-01E
3.2 Setting the Display Conditions
5. Set the ON/OFF of the waveform display.
To display waveform in the graph, click the check box in the “No.” cell to turn it ON
(blue).
6. Set Y-axis display conditions.
Specify the ON/OFF of the
Also specify the scale of Y-axis (linear or logarithmic).
7. Select the type of meter display in the “Meter Type” cell from bar meter
meter, and thermometer.
Y-axis display when a multiple-axis zone is selected.
, analog
Note
The meter type setting is valid only for the meter monitor.
8. Click the value in the “Scale” cell and type the scale value.
The selectable range is from -1016 to 1016 disregarding the decimal point.
If you set the minimum value to a larger value than the maximum value, the
waveform will be displayed ipped from top to bottom.
Note
The decimal point positions of the entered values are adjusted for each tag according to the
number of significant digits to the right of the decimal point.
9. Click the value in the “Zone” cell and type the value that species the display zone.
The selectable range for minimum and maximum values are from 0 to 99% and from
1 to 100%, respectively.
On the monitor window, waveforms are displayed in zones where the top and bottom
of the waveform display area of the trend monitor correspond to 100% and 0%,
respectively.
10. Click the values in the “Trip 1” and “Trip 2” cells and type the display positions for trip
points 1 and 2.
Click the check box to specify the Use (blue)/ Not Use of the trip point.
Page 87

1
2
3
3.2 Setting the Display Conditions
Note
• The trip points can be set within the range of scale values specified for each tag.
• Trip points 1 and 2 are displayed in red and blue, respectively.
• When the trend monitor is stopped, the trip points can be moved by dragging them on the
trend monitor.
• When the display position of a trip point is entered, the check box in the “Trip 1” and “Trip 2”
cells are automatically turned ON (blue). If you do not wish to display the trip point, click the
check box to turn it OFF.
11. Click the “Color” cell of the tag you wish to change the display color.
The “Color” dialog box opens.
12. Click one of the basic colors you wish to change to.
Using Data Monitor
Note
To create a new color, click the “Define Custom Colors” button. A palette is displayed in the
dialog box. Create a new color with this palette.
13. Click the “OK” button in the “Color” dialog box.
The waveform is displayed in the new color.
Apply the new settings/Terminate the display setting
14. Click “OK” in the “Display Settings” dialog box.
The new settings are made effective and the “Display Settings” dialog box closes.
Clicking “Apply” will make the new conditions effective, but the window will stay
open.
Click [Cancel] to discard the settings and close the dialog box.
Saving the settings
15. In the menu bar of the “DAQLOGGER Data Monitor” window, select “File” and then
“Save Display Settings” or click “Save Display Settings” on the toolbar. The new
settings are saved.
Y
ou can also save the settings when terminating Data Monitor (see section 3.6
“Terminating the Data Monitor”).
Note
IM WX101-01E
The information about group names, tag assignments to groups, and show/hide condition of
tags is also managed by Group Editor. If you change these settings in Data Monitor, they are
also changed in Group Editor.
3-9
Page 88

3-10
IM WX101-01E
3.3 Changing the Display Settings of Monitor
Link button
Tag Number / Tag Name buttons
Windows
The display settings of monitor windows can be changed as desired.
This section describes the display settings of monitor windows: trend monitor, alarm
monitor, and color graph monitor windows.
Changes Common to Monitor Windows
Making changes effective in other monitor windows
Changes made to the display settings in a monitor window-such as a change of display
group, switching between tag number display and tag name display, or a change of the
cursor position on the trend monitor window-can be made to other monitor windows by
simply clicking one button.
Procedure
1. Click the “Link” button on the toolbar or, in the menu bar, select “Monitor” then “Link.”
Switching the display group
The group of measured data that is being displayed can be switched. If a link is set
between monitored windows, the measured data of that group is also displayed in other
monitor windows.
Procedure
Procedure
1. Click the “Group” tab in the monitor window.
The measured data of that group is displayed.
Switching tag number/name display
The tag display can be switched between tag numbers and tag names. If a link is set,
tag number/tag name display is also switched in other monitor windows.
1. Click the “Tag Number” button or “Tag Name” button on the toolbar or, from the menu
bar, select “View” then “Tag Number” or “Tag Name.”
Saving the Settings
The procedure is the same as “Saving the Settings” on the previous page.
Page 89

1
2
3
Trend Monitor
User Zone Full Zone Auto Zone
Slide Zone Multiple-axis ZoneEdit Zone
Procedure
Procedure
3.3 Changing the Display Settings of Monitor Windows
Changing the time axis
The time axis notation can be changed between absolute and relative time. For both
notations, the current zoom factor is shown on the right side of the time axis. With the
absolute time notation, the date is displayed on the left side.
1. From the menu bar, select “TimeAxis” then “Absolute Time” or “Relative Time.”
• Absolute time: Displays the time of the day.
• Relative time: Displays the elapsed time from the start of the scanning operation.
Absolute time
Relative time
Zooming in/out of the time axis
The time span of the waveform display can be adjusted.
1. Click the “Zoom In” or “Zoom Out” button on the toolbar or, from the menu bar, select
“TimeAxis” then “Zoom In” or “Zoom Out.”
The waveform display is expanded or reduced along the time axis (horizontally).
Using Data Monitor
Procedure
Note
• There are 14 zoom factors: 1/1000, 1/500, 1/200, 1/100, 1/50, 1/20, 1/10, 1/5, 1/2, 1, 2, 5,
10, and 20 times.
However, the possible minimum zoom factor depends on the number of pixels in the
waveform display area. Therefore, the minimum zoom factor varies depending on the size
of the monitor window.
• The display of absolute or relative times (example: MM/DD HH or HH: MM: SS) changes
automatically depending on the zoom factor.
Selecting the waveform display zone (Y-axis)
The waveform display can be changed by selecting the zone type.
1. Click one of the “Zone” buttons on the toolbar or select the zone type form the
dropdown list of “Y-Axis” in the menu bar.
IM WX101-01E
3-11
Page 90

3-12
IM WX101-01E
3.3 Changing the Display Settings of Monitor Windows
• User Zone
Waveforms are displayed in the zones set in the “Display Settings” dialog box.
Zones settings cannot be changed in the trend monitor window, but can be
changed in the “Display Settings” dialog box.
For details about settings in the “Display Settings” dialog box, see section 3.2
“Setting the Display Conditions” (P.3-5).
•
Edit Zone
Waveforms are displayed in the zones set in the “Display Settings” dialog box.
Zones can be changed in the zone bar display area of the trend monitor window
In the zone bar display area, change the zone by dragging the control tips in both
ends of the individual zone bars. The zones changed in the zone bar display area
will be reected in the “Display Settings” dialog box. Accordingly, if you switch
to the “User Zone” after changing the zones in the zone bar display area, the
waveforms are displayed using the new zones.
•
Full Zone
All waveforms are displayed in full zones.
.
• Slide Zone
Waveforms are displayed by vertically offsetting the position of each waveform.
• Auto Zone
The waveform display area is equally divided according to the number of displayed
Each waveform is displayed with the same zone width.
waveforms. The waveform is displayed in each divided zone.
Page 91

1
2
3
Drag & drop the Y-axis scale you wish to delete.
Drag & drop the zone bar for which you wish to display a scale.
3.3 Changing the Display Settings of Monitor Windows
• Multiple-axis Zone
Waveforms are displayed in the zones set in the “Display Settings” dialog box
together with multiple Y-axis scales. The operation to display multiple Y-axis scales
described in the following is possible when the trend monitor’s display updating is
paused.
T
o add a Y-axis scale:
In the zone bar display area, select the zone bar that you wish
scale and drag it to the waveform display area.
To delete a Y-axis scale:
In the waveform display area, drag the
in the zone bar display area.
Y-axis scale you wish to delete and drop it
to add to the Y-axis
Using Data Monitor
IM WX101-01E
3-13
Page 92

3-14
IM WX101-01E
Clip button
Current waveform indicator
Adjust the brightness of the grid
Zone bar
Adjust the brightness of the waveform display area
Waveform display ON/OFF button
3.3 Changing the Display Settings of Monitor Windows
Limiting the display
Set the style in which to display the portion of the waveform that extends off the
waveform display area.
Procedure
1. Click the “Clip” button on the toolbar or, from the menu bar, select “Y-Axis” then “Clip.”
The waveform display range along Y-axis is limited to the minimum and maximum
scale values set in the “Display Settings” dialog box. The measured values are
displayed so that the values smaller than the minimum scale value attach themselves
to the minimum scale value and those larger than the maximum scale value attach
themselves to the maximum scale value.
•
Display example in which the display limit is set
Turning ON/OFF the waveform display
To observe a certain waveform more clearly, turn OFF other waveform displays.
Procedure
1. Click the “Waveform display ON/OFF” button of the waveform you wish to turn ON
• Display example in which the display limit is not set
(blue)/OFF (gray).
Page 93

1
2
3
Procedure
Before dragging After dragging
Procedure
Procedure
3.3 Changing the Display Settings of Monitor Windows
Specifying the waveform line width
1. In the menu bar, click “View” then select “Thin Line,” “Medium Line,” or “Thick Line.”
Adjusting the brightness
The brightness of the grid and background can be adjusted.
1. Drag the corresponding brightness control slider located on the right of the zone bar
display area to change the brightness.
Moving the trip points
The trip points can be moved when the monitor is paused.
Turning ON/OFF the trip point display is only possible from the “Display Settings” dialog
box.
1. Click the “Pause” button or in the menu bar, select “Monitor” then “Pause.”
The monitor stops updating the display.
2. Drag the trip point to the desired position.
Using Data Monitor
IM WX101-01E
3-15
Page 94

3-16
IM WX101-01E
No alarm
Alarm occurrence
Alarm 1
Alarm 2
Alarm 3
Alarm 4
Alarm ON/OFF button
3.3 Changing the Display Settings of Monitor Windows
Displaying alarm indication
Alarm conditions are displayed in the bottom of the waveform display area of the trend
monitor window.
If an alarm occurs, a horizontal bar, which increases in size according to the time period
of the alarm duration, is displayed in the color of the waveform that is causing the alarm.
Alarm indicator bars are displayed for level-1, level-2, level-3, and level-4 alarms from
top to bottom.
If more than one alarm occurs at the same time, the indicator bars will be displayed in a
stack with the one for the current waveform (marked with a current waveform indicator)
being displayed on top.
Procedure
1. Click the “Alarm ON/OFF” button on the toolbar or in the menu bar, select “View”
then “Alarm.”
The alarm indication appears or disappears.
Numeric Monitor/Meter Monitor
Displaying alarm indication
Alarm conditions are indicated by the color of the lamp in the numeric monitor and meter
monitor windows. The lamp is shown in green when no alarm occurs, in red when an
alarm occurs, and in black when no alarm is set in the recorder. Each window has 4 lamps
that indicate the conditions of level-1, level-2, level-3, and level-4 alarms from left to right.
Procedure
The operation procedures are the same as procedures on the trend monitor.
Alarm Monitor
Switching between the Overview and Alarm Log
The display of the alarm monitor can be switched between Overview and Alarm Log.
Procedure
1. Click the “Overview” or “Log” tab to switch between the two tab panels.
• Overview display
The alarms within a group are displayed in the following 4 conditions.
Green lamp: No
Red lamp: One of the tags is causing an alarm among the member tags of the
Green lamp with blinking ring:
No alarm is being caused now, and some alarm that occurred in the
past remains unconrmed.
Red lamp with blinking ring:
An alarm is being caused now, and some alarm that occurred in the
tag is causing an alarm among the member tags of the group for
which the waveform display is turned ON or, no alarm is set for the tags.
group for which the waveform display is turned ON.
past remains unconrmed.
Page 95

1
2
3
Occurrence (On) / termination (Off)
Alarm type character
Tag
Alarm level
Time of occurrence/termination
Alarm type icon
Alarm condition icon
Delay upper limit alarm (Red)
PV high-limit (Red)
Deviation high-limit
SP low-limit
Output high-limit
Delay lower limit alarm (Blue)
PV low-limit (Blue)
Deviation low-limit
SP low-limit
Output low-limit
Difference upper limit alarm (Red)
Difference lower limit alarm (Blue)
Rate-of-change alarm (+) (Red)
Rate-of-change alarm (-) (Blue)
Other alarm
Deviation high-limit alarm
Deviation high & low limit alarm
3.3 Changing the Display Settings of Monitor Windows
Note
• The blinking ring displayed around the alarm lamp indicates that there are unconfirmed
alarms (Alarm Hold state).
• To confirm the unconfirmed alarms, click the lamp of the group with a blinking ring. The ring
will disappear.
To cancel the Alarm Hold state of all the tags at a time, select “View” then “Hold Reset” from
the menu bar.
• Displaying the Alarm Log
The alarm types, times of occurrence/termination, and tags are displayed in a list of
alarms that occurred in the past.
The Alarm Log can list for up to 100 alarms when the monitor is paused.
The display format is shown in the following.
Using Data Monitor
The alarm types are indicated using the following symbols.
Alarm abbreviations are given as follows:
H: PV high-limit alarm
PVH: PV high-limit alarm (high-limit alarm for PV values of the CX control channels)
DVH: Deviation high-limit alarm (only CX)
SPH: SP high-limit alarm (only CX)
OTH: Output high-limit alarm (only CX)
IM WX101-01E
3-17
Page 96

3-18
IM WX101-01E
3.3 Changing the Display Settings of Monitor Windows
L: PV low-limit alarm
PVL: PV low-limit alarm (low-limit alarm for PV values of the CX control channels)
DVL: Deviation low-limit alarm (only CX)
SPL: SP low-limit alarm (only CX)
OTL: Output high-limit alarm (only CX)
dH: Difference upper limit alarm
dL: Difference lower limit alarm
RH: Upper limit on rate-of-change alarm
RL: Lower limit on rate-of-change alarm
tH: Delay upper limit alarm
tL: Delay lower limit alarm
DVO: Deviation high & low limit alarm (only CX)
DVI: Deviation within high & low limit alarm (only CX)
ETC: Other alarms (only CX)
Sounding or stopping the alarm warning sound
An alarm warning can be sounded when an alarm occurs. The alarm warning is sounded
only when all the following conditions are met.
• The alarm monitor is displayed.
• The alarm sound function is turned ON.
• Of the tags displayed in the monitor
, at least one alarm is occurring.
Procedure
1. Show “Alarm Sound” from the “Monitor” menu to see whether a check mark is
2.
Color Graph Monitor
The color graph monitor shows the measured data values in color bars.
The display color is determined depending on the data value and the scale. The
maximum value of the scale is red, the minimum value is blue, and the mid-point value is
green.
Changing the time axis
The time axis notation can be changed between absolute and relative time. For both
notations, the current zoom factor is shown on the right side of the time axis. With the
absolute time notation, the current date is displayed on the left side.
displayed. If the check mark is present, the alarm warning sound is ON; otherwise,
it is OFF. You can turn ON or OFF the sound by choosing Alarm Sound from the
Monitor menu.
To stop the alarm sound, click all the groups in the alarm monitor and choose the
menu command. Or, choose V
iew > Hold > Reset.
Note
• Once an alarm starts sounding, the sound continues until it is stopped even if all alarms are
cleared.
• A sound source is required in sounding the alarm.
• Up to two windows of alarm monitors can be displayed. To stop the alarm sound when
two windows of alarm monitors are displayed, the steps taken to stop the alarms must be
performed on both windows.
Procedure
1. From the menu bar, select “TimeAxis” then “Absolute Time” or “Relative Time.”
• Absolute time: Displays the time of the day.
• Relative time: Displays the elapsed time from the start of the scanning operation.
Page 97

1
2
3
3.4 Using the Cursors
Monitor pause button
Cursor BCursor A
Cursor-point value display button
On the trend monitor and color graph monitor, and color graph monitor the measured
data values at the position specified with the cursor can be displayed.
On the alarm monitor, the measured data values at the start and end points of the area
specified in the alarm log display can be displayed.
There are two types of cursors, cursor A and cursor B. In the “Cursor’s Value” dialog box,
the measured values at cursors A and B and the difference between the two cursors are
displayed.
If the link is turned ON, the cursor movements are reflected on all the trend monitor and
color graph monitor windows that are displayed.
Displaying the Cursors and Reading the Values at the Cursors
Cursor operation is possible while the monitor’s display updating is paused.
Displaying values at cursors on the trend monitor
Procedure
1. To pause the monitor’s display updating, click the “Pause” button on the toolbar, or
from the menu bar, select “Monitor” then “Pause.”
Using Data Monitor
2. In the waveform display area, click at a desired position and drag to another position.
3.
Note
The cursors are not displayed while the waveform display is being updated. To display the
cursors, click the “Pause” button to pause the display.
The cursors disappear when the display updating is resumed.
At the rst position, cursor A appears; and at the next position, cursor B appears.
Click the “Cursor’s Value” button on the toolbar or select “View” then “Display Cursor’s
Value” from the menu bar.
IM WX101-01E
3-19
Page 98

3-20
IM WX101-01E
Cursor adjustment button
Alarm indication (Level 1, 2, 3, 4, from the left)
Alarm ON: red
Alarm OFF: green
3.4 Using the Cursors
The “Cursor’s Value” dialog box appears showing the date and time of measurement
and the measured values at the cursor positions.
To precisely adjust the cursor position, click the “cursor adjustment” button on the
right of the data number. The cursor moves by one data point at each click.
If the monitor window is used for operation, the results of the operation are reected
to the “Cursor
’s Value” dialog box; and vice-versa.
Procedure
Displaying cursor’s values with the Alarm Log display
1. To pause the monitor’s display updating, click the “Pause” button on the toolbar, or
from the menu bar, select “Monitor” then “Pause.”
2.
Click the “Cursor’s Value” button on the toolbar or select “View” then “Display Cursor’s
Value” from the menu bar.
The “Cursor’s Value” dialog box appears.
Page 99

1
2
3
3. In the “Log” tab panel (alarm log display) of the alarm monitor, drag the mouse from
Values at the start and end points of the selected area are displayed.
The cursor’s values at the start and end points of the selected area are displayed in
one line to another.
the “Cursor’
s Value” dialog box.
3.4 Using the Cursors
Using Data Monitor
Clearing the Cursors
To clear the cursors, perform the operation shown below.
However, cursors will disappear without doing the following operation when the monitor’s
display updating is resumed.
Procedure
1. From the menu bar, select “View” then “Hide Cursor.”
When the cursors are cleared, no data is displayed in the “Cursor’s Value” dialog
box’s table.
Note
The “Cursor’s Value” dialog box disappears when the monitor’s display updating is resumed.
IM WX101-01E
3-21
Page 100

3-22
IM WX101-01E
3.5 Saving the Monitor Window
Snapshot Function
Saves the active monitor window to an image file (PNG format).
Procedure
1. Choose “Snapshot” from the “File” menu.
2. A dialog box appears for you to specify the output le name. Specify the le name
and click “OK.”
The image file of the active monitor window is saved when the menu command is
selected. The extension is .png.
Note
To view the image saved to PNG format, an application program that supports image files in
PNG format is required.
 Loading...