

Page 1

Model CX1006/CX1206
DAQSTATION CX1000
IM 04L31A01-03E
IM 04L31A01-03E
1st Edition
Page 2

Page 3

Notes
Trademarks
Revisions
Thank you for purchasing the CX1000. This manual describes the functions (excluding
the communications functions), installation and wiring procedures, operating procedures,
and handling precautions of the CX1000. To ensure correct use, please read this
manual thoroughly before beginning operation. The following four manuals are also
provided in addition to this manual. Read them along with this manual.
Electronic Manuals Provided on the Accompanying CD-ROM
Manual Title Manual No. Description
CX1000/CX2000 IM 04L31A01-17E Describes the communications functions of the
Communications Interface CX1000/CX2000 using the Ethernet/serial
interface.
User’s Manual
DAQSTANDARD for CX IM 04L31A01-61E Describes the functions and operating
User’s Manual procedure of the software “DAQSTANDARD
for CX” that comes with the package.
Paper Manuals
Manual Title Manual No. Description
CX1000 Installation and IM 04L31A01-73E Describes concisely the installation
Connection Guide procedures and wiring procedures of the
CX1000.
Precautions on the Use of IM 04L31A01-72E Precautions regarding the use of the CX1000/
the CX1000/CX2000 CX2000. The same information is written on
pages ii and iii of this user’s manual.
• This manual describes the CX1000, style number “S1.”
• The contents of this manual are subject to change without prior notice as a result of
continuing improvements to the instrument’s performance and functions. Note that
the program control operation described in this manual is not supported by this
version of the CX1000. Therefore, the information regarding the program control
operation may not be correct.
• Every effort has been made in the preparation of this manual to ensure the accuracy of
its contents. However, should you have any questions or find any errors, please contact
your nearest YOKOGAWA dealer as listed on the back cover of this manual.
• Copying or reproducing all or any part of the contents of this manual without the
permission of Yokogawa Electric Corporation is strictly prohibited.
• The TCP/IP software of this product and the document concerning the TCP/IP
software have been developed/created by YOKOGAWA based on the BSD
Networking Software, Release 1 that has been licensed from the Regents of the
University of California.
• Microsoft, MS-DOS, Windows, and Windows NT are either registered trademarks
or trademarks of Microsoft Corporation in the United States and/or other countries.
• Zip is either a registered trademark or trademark of Iomega Corporation in the
United States and/or other countries.
• Adobe and Acrobat are trademarks of Adobe Systems incorporated.
• Company and product names that appear in this manual are trademarks or registered
trademarks of their respective holders.
1st Edition March, 2002
Disk No. RE36
1st Edition : March 2002 (YK)
All Rights Reserved, Copyright © 2002 Yokogawa Electric Corporation
IM 04L31A01-01E
i
Page 4

Safety Precautions
About This Manual
• This manual should be read by the end user.
• Read this manual thoroughly and have a clear understanding of the product before operation.
• This manual explains the functions of the product. YOKOGAWA does not guarantee that the product will suit
a particular purpose of the user.
• Under absolutely no circumstances may the contents of this manual be transcribed or copied, in part or in
whole, without permission.
• The contents of this manual are subject to change without prior notice.
• Every effort has been made in the preparation of this manual to ensure the accuracy of its contents.
However, should you have any questions or find any errors or omissions, please contact your nearest
YOKOGAWA dealer.
Precautions Related to the Protection, Safety, and Alteration of the Product
• The following safety symbols are used on the product and in this manual.
“Handle with care.” (To avoid injury, death of personnel or damage to the instrument, the
operator must refer to the explanation in the manual.)
Functional ground terminal. (Do not use this terminal as a protective ground terminal.)
Protective grounding terminal
Alternating current
• For the protection and safe use of the product and the system controlled by it, be sure to follow the
instructions and precautions on safety that are stated in this manual whenever you handle the product.
Take special note that if you handle the product in a manner that violate these instructions, the protection
functionality of the product may be damaged or impaired. In such cases, YOKOGAWA does not
guarantee the quality, performance, function, and safety of the product.
• When installing protection and/or safety circuits such as lightning protection devices and equipment for
the product and control system or designing or installing separate protection and/or safety circuits for
fool-proof design and fail-safe design of the processes and lines that use the product and the control
system, the user should implement these using additional devices and equipment.
• If you are replacing parts or consumable items of the product, make sure to use parts specified by
YOKOGAWA.
• This product is not designed or manufactured to be used in critical applications that directly affect or
threaten human lives. Such applications include nuclear power equipment, devices using radioactivity,
railway facilities, aviation equipment, air navigation facilities, aviation facilities, and medical equipment. If
so used, it is the user’s responsibility to include in the system additional equipment and devices that
ensure personnel safety.
• Do not modify this product.
ii IM 04L31A01-03E
Page 5

Safety Precautions
WARNING
Power Supply
Ensure that the source voltage matches the voltage of the power supply before turning ON the
power.
Protective Grounding
Make sure to connect the protective grounding to prevent electric shock before turning ON the
power.
Necessity of Protective Grounding
Never cut off the internal or external protective earth wire or disconnect the wiring of the protective
earth terminal. Doing so invalidates the protective functions of the instrument and poses a potential
shock hazard.
Defect of Protective Grounding
Do not operate the instrument if the protective earth or fuse might be defective. Make sure to
check them before operation.
Do Not Operate in an Explosive Atmosphere
Do not operate the instrument in the presence of flammable liquids or vapors. Operation in such
environments constitutes a safety hazard.
Do Not Remove Covers
The cover should be removed by YOKOGAWA’s qualified personnel only. Opening the cover is
dangerous, because some areas inside the instrument have high voltages.
External Connection
Connect the protective grounding before connecting to the item under measurement or to an
external control unit.
Damage to the Protective Structure
Operating the CX1000 in a manner not described in this manual may damage its protective structure.
Exemption from Responsibility
• YOKOGAWA makes no warranties regarding the product except those stated in the WARRANTY that is
provided separately.
• YOKOGAWA assumes no liability to any party for any loss or damage, direct or indirect, caused by the
user or any unpredictable defect of the product.
Handling Precautions of the Software
• YOKOGAWA makes no warranties regarding the software accompanying this product except those
stated in the WARRANTY that is provided separately.
• Use the software on a single PC.
• You must purchase another copy of the software, if you are to use the software on another PC.
• Copying the software for any purposes other than backup is strictly prohibited.
• Please store the original media containing the software in a safe place.
• Reverse engineering, such as decompiling of the software, is strictly prohibited.
• No portion of the software supplied by YOKOGAWA may be transferred, exchanged, sublet, or leased for
use by any third party without prior permission by YOKOGAWA.
IM 04L31A01-01E
iii
Page 6
Checking the Contents of the Package
Unpack the box and check the contents before operating the instrument. If some of the
contents are not correct or missing or if there is physical damage, contact the dealer
from which you purchased them.
CX1000
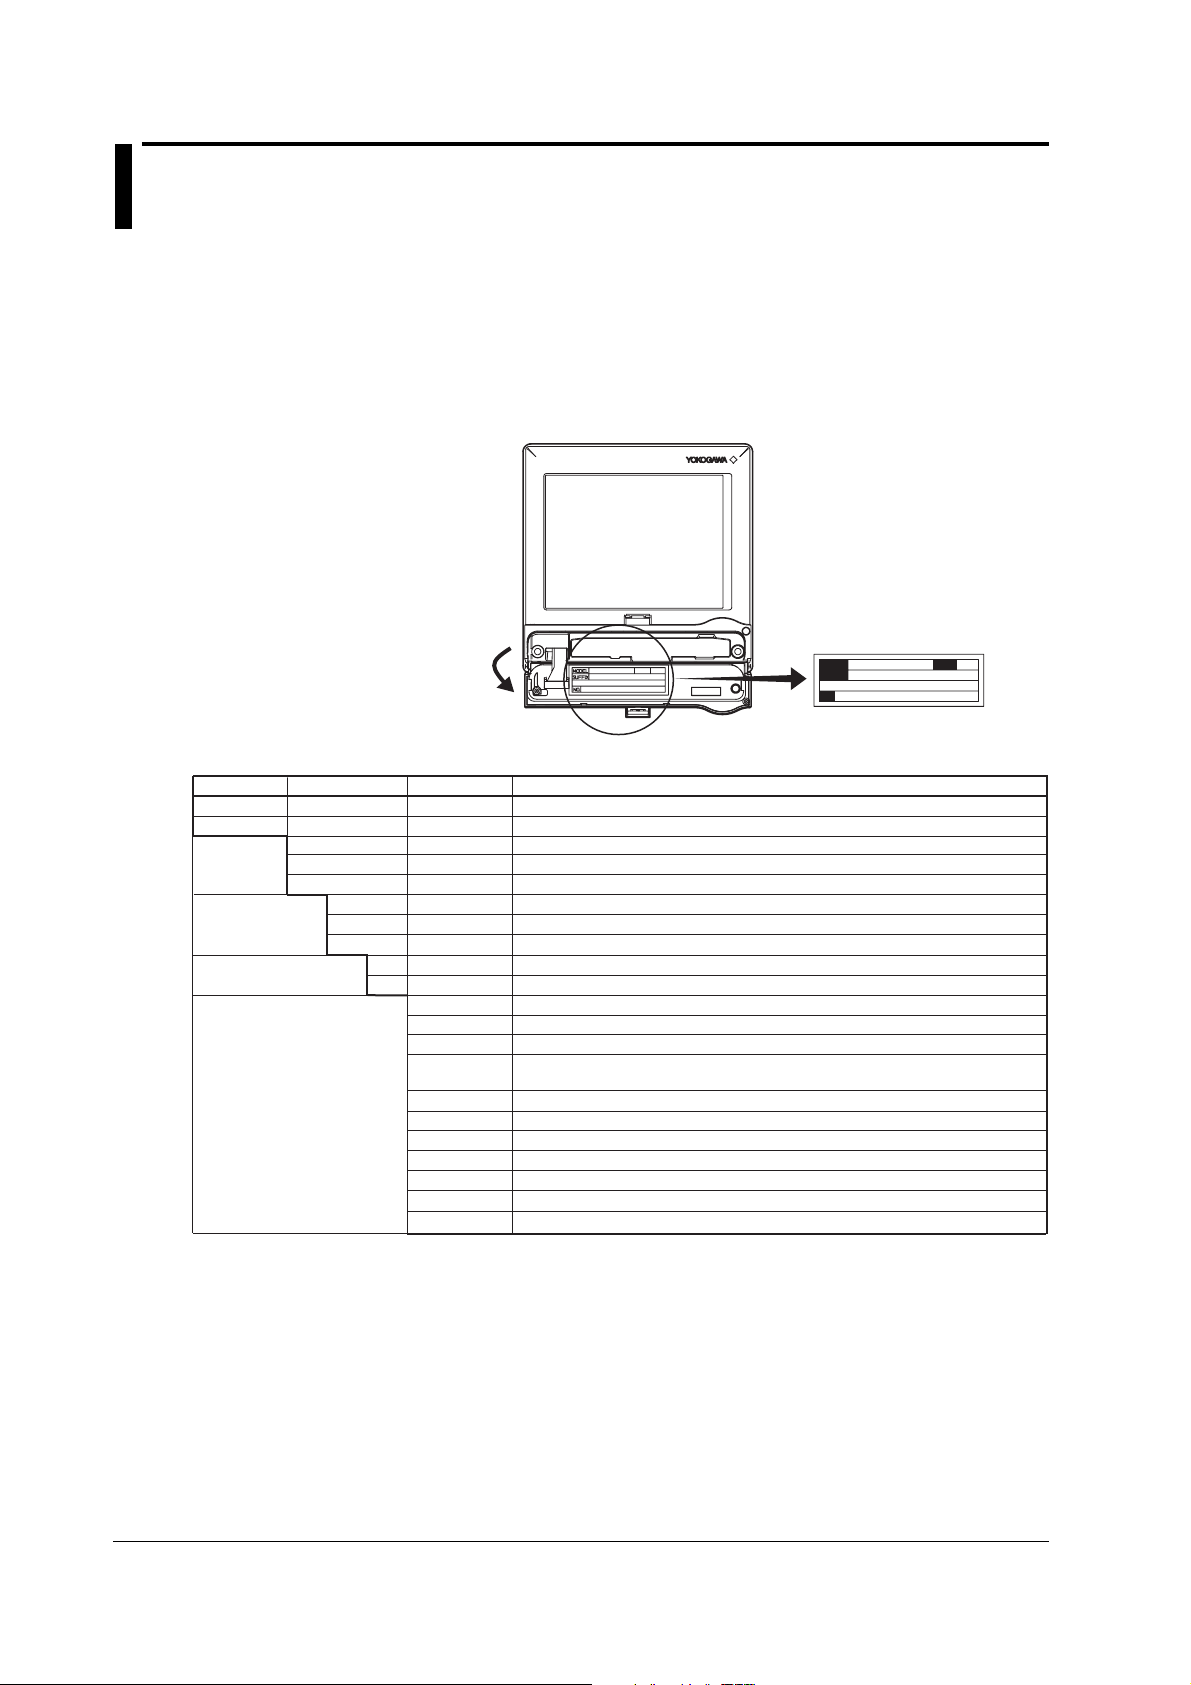
When you open the operation cover on the front panel, a name plate is located on the
back side of the cover. Check that the model name and suffix code given on the name
plate on the rear panel match those on the order.
Open the operation
cover
STYLE
MODEL
SUFFIX
NO
STYLE
MODEL and SUFFIX
Model
CX1006
CX1206
External
storage
medium
Communication
interface
Displayed language
Options
*1
Suffix Code –2 (Ethernet + RS-422A/485 serial interface port) must be selected for the communication interface and
/CM1 (Green series communications) must be selected for the Optional Code.
*2
Includes the Modbus master/slave function. However, to use the Modbus master function, /M1 must be selected for the
Optional Code.
*3
Only one of the options can be specified on the CX1006. Cannot be specified on the CX1206.
*4
Suffix Code –1 (with RS-232 serial interface port) or –2 (with RS422/485 interface port) must be selected for the
communication interface. Either one can be specified on the CX1206. Ladder communication (/CM2) cannot be
specified on the CX1006.
*5
Either one can be specified on the CX1206.
Suffix Code Optional Code Description
*1
Number of internal control loops: 0, number of inputs for measurement: 6 ch
Number of internal control loops: 2, number of inputs for measurement: 6 ch
–1
–2
–3
–0
–1
–2
–1
–2
/A6
/A6R
/A4F
/A4FR
Floppy disk
Zip disk
ATA flash memory card
Only Ethernet
Ethernet + RS-232 serial interface port
Ethernet + RS-422A/485 serial interface port
Japanese
English
6 measurement alarm outputs
6 measurement alarm output, 8 remote inputs
4 measurement alarm outputs, 1 FAIL output, 1 memory end output
4 measurement alarm outputs, 1 FAIL output, 1 memory end output,
8 remote inputs
/M1
/N2
/P1
/CM1
/CM2
/PG1
/PG2
Computation function
Three-wire isolated RTD (input for measurement)
24-VDC/AC power supply driven
Green series communications
Ladder communications
Program control (number of program patterns: 4)
Program control (number of program patterns: 30)
*2
*3
*3
*3
*3
*4
*4
*5
*5
NO. (Instrument Number)
When contacting the dealer from which you purchased the instrument, please give them
the instrument number.
iv IM 04L31A01-03E
Page 7

Standard Accessories
The standard accessories below are supplied with the instrument. Check that all
contents are present and that they are undamaged.
Checking the Contents of the Package
or
1
No. Name Part Number/Model Q’ty Note
1 Terminal screws 5 M4
2 Mounting bracket B9900BX 2 For panel mounting
3 DAQSTANDARD CXA100-01 1 Software for setting the CX and
4 CX1000/CX2000 B8700MA 1 CD-ROM containing the PDF files of this
5 CX1000 Installation and IM 04L31A01-73E 1 Abridged paper manual
6 Precautions on the Use IM 04L31A01-72E 1 Paper stating the precautions.
7 External storage medium A1053MP 1 Zip disk (provided only when the external
2
for CX displaying data CD-ROM used to install
electronic manual manual, the CX1000/CX2000
Connection Guide
of the CX1000/CX2000
3
Optional Accessories (Sold Separately)
The following optional accessories are available for purchase separately. When you
receive the order, check that all contents are present and that they are undamaged.
For information and ordering, contact your nearest YOKOGAWA dealer.
Part Name Part Number/Model Q’ty Note
3.5" floppy disk 7059 00 10 2HD
Zip disk A1053MP 1 100 MB
ATA flash memory card B9968PK 1 24 MB (The size and model may
Shunt resistance 4159 20 1 250 Ω±0.1%
(for the screw terminal) 4159 21 1 100 Ω±0.1%
Mounting bracket B9900BX 2
4
B9968PK 1 ATA flash memory card, provided only
4159 22 1 10 Ω±0.1%
5
6
“DAQSTANDARD for CX”
Communication Interface User’s Manual,
DAQSTANDARD for CX User’s Manual,
and other files.
storage medium suffix code is “-2”)
when the external storage medium suffix
code is “-3” (the size and model may
change in the future)
change in the future. Check with your
YOKOGAWA dealer when ordering.)
7
IM 04L31A01-01E
v
Page 8

How to Use This Manual
Structure of the Manual
This user’s manual consists of the following sections. For details on the communications
functions and the software “DAQSTANDARD for CX” provided with the package, see the
respective manuals (IM 04L31A01-17E and IM 04L31A01-61E).
Chapter Title and Description
1 Explanation of Functions
Describes in detail the functions of the instrument. The chapters that explain the
operation of the CX1000 only describe the operating procedures. For more detailed
information about the functions, see this chapter.
2 Installation and Wiring
3 Names of Parts, Display Modes, and Common Operations
4 Control Function Related Setup Operations
5 Program Control Related Setup Operations (Only on Models with the Program
6 Operations during Control Operation
7 Measurement Function Related Setup Operations
8 Operations for Changing the Displayed Contents
9 Data Save/Load Operations
10 Computation and Report Function Related Operations (Only on Models with the
11 Operations of Other Functions
12 Troubleshooting
13 Maintenance
14 Specifications
Appendix Describes the acquisition function of measured data to the internal memory, additional
Index
Describes the installation and wiring procedures of the CX1000.
Describes the names of the parts of the CX1000, the basic key operations, the basic
operations carried out initially, and how to use the external storage medium drive.
Describes setup operations related to the control function that are carried out before
starting control operations.
Control Option)
Describes the setup operations related to program control that are carried out before
starting control operations on models with the program control option.
Describes how to switch operation mode during control operation, how to change the
setpoints of setting mode, how to tune the control parameters, and the operations on the
program control screen (operations only on models with the option).
Describes how to set the PV input of the measurement function and alarms
(measurement alarms).
Describes how to change the operating display of both the control function and the
measurement function and the display format.
Describes how to write various data to the internal memory, how to save and load from
the external storage medium, and the file operations on the external storage medium.
Computation Function Option)
Describes how to set and execute operations related to the computation function and
report function of the computation function option.
Describes the USER key, key lock, login/logout of key operation, log display, and
remote input setting.
Describes the error messages and the troubleshooting measures of the CX1000.
Describes periodic inspection, calibration, and recommended replacement period for
worn parts.
Describes the specifications of the CX1000.
information on the computation and report functions, the ASCII file format, and initial settings.
Note
• This user’s manual covers information regarding CX1000s that have a suffix code for
language “-2” (English).
• For details on setting the displayed language, see
vi IM 04L31A01-03E
section 3.6
.
Page 9

Conventions Used in This Manual
Unit
K........ Denotes “1024.” Example: 768 KB (file size)
k........ Denotes “1000.”
Safety Markings
The following markings are used in this manual.
How to Use This Manual
Danger. Refer to corresponding location on the instrument.
This symbol appears on dangerous locations on the instrument
which require special instructions for proper handling or use. The
same symbol appears in the corresponding place in the manual to
identify those instructions.
WARNING
CAUTION
Note
Symbols Used on Pages Describing Operating Procedures
On pages that describe the operating procedures in Chapter 3 through 11, the following
symbols are used to distinguish the procedures from their explanations.
[ ] ................ Indicates character strings that appear on the screen.
Procedure
Calls attention to actions or conditions that could cause serious
injury or death to the user, and precautions that can be taken to
prevent such occurences.
Calls attentions to actions or conditions that could cause damage to
the instrument or user’s data, and precautions that can be taken to
prevent such occurrences.
Calls attention to information that is important for proper operation
of th instrument.
Example: [Space] soft key, [Volt]
This subsection contains the operating procedure used to carry out
the function described in the current section. All procedures are
written with inexperienced users in mind; experienced users may
not need to carry out all the steps.
IM 04L31A01-01E
Setup Items
Describes the details of the settings and the restrictions that exist with
the operating procedure. It does not give a detailed explanation of
the function. For details on the function, see chapter 1.
vii
Page 10

Contents
Safety Precautions ..........................................................................................................................ii
Checking the Contents of the Package ..........................................................................................iv
How to Use This Manual ................................................................................................................vi
Chapter 1 Explanation of Functions
1.1 CX1000 Overview ............................................................................................................ 1-1
1.2 Control Function Overview............................................................................................... 1-2
1.3 Basic Settings of Control................................................................................................ 1-13
1.4 PV Input Related Settings .............................................................................................. 1-18
1.5 Contact Input/Output Related Settings .......................................................................... 1-22
1.6 Target Setpoint Related Settings ................................................................................... 1-25
1.7 PID Parameter Settings ................................................................................................. 1-27
1.8 Control Output Suppression Settings............................................................................. 1-31
1.9 Settings for ON/OFF Control.......................................................................................... 1-33
1.10 Control Alarm Related Settings ...................................................................................... 1-34
1.11 Program Control Related Settings ................................................................................. 1-36
1.12 Tuning ............................................................................................................................ 1-50
1.13 Measurement Function Overview .................................................................................. 1-52
1.14 Measurement Function > Measurement Input Related Settings .................................... 1-54
1.15 Measurement Function > Measurement Alarm Related Settings .................................. 1-57
1.16 Display Function............................................................................................................. 1-62
1.17 Data Storage Function ................................................................................................... 1-81
1.18 Computation and Report Functions (Option) ................................................................. 1-86
1.19 Other Functions ............................................................................................................. 1-90
Chapter 2 Installation and Wiring
2.1 Handling Precautions ....................................................................................................... 2-1
2.2 Installation ........................................................................................................................ 2-2
2.3 Wiring ............................................................................................................................... 2-5
2.4 Connecting the Power Supply ........................................................................................ 2-13
Chapter 3 Names of Parts, Display Modes, and Common Operations
3.1 Names and Functions of Sections ................................................................................... 3-1
3.2 Basic Key Operations ....................................................................................................... 3-4
3.3 Setting the Date and Time ............................................................................................. 3-11
3.4 Setting the Brightness of the Display and the Backlight Saver Function........................ 3-13
3.5 Initializing the Setup Data and Clearing the Internal Memory ........................................ 3-14
3.6 Changing the Displayed Language ................................................................................ 3-15
3.7 Changing the Time Zone................................................................................................ 3-16
3.8 Inserting and Ejecting the External Storage Medium ..................................................... 3-17
Chapter 4 Control Function Related Setup Operations
4.1 Control > Control action ................................................................................................... 4-1
4.2 Control > Input setting (Burnout and RJC) ....................................................................... 4-4
4.3 Control > Contact input-registration ................................................................................. 4-6
4.4 Control > AUX (Remote setting, Alarm mode, SP No. selection source) ....................... 4-11
4.5 Control > Output processing .......................................................................................... 4-13
4.6 Control > Relay .............................................................................................................. 4-15
4.7 Control > Tuning setting ................................................................................................. 4-17
viii IM 04L31A01-03E
Page 11

Contents
4.8 Control input range ........................................................................................................ 4-19
4.9 Control alarm ................................................................................................................. 4-23
4.10 Operation-related parameters/Zone PID........................................................................ 4-25
4.11 PID parameters .............................................................................................................. 4-27
4.12 Control group setting ...................................................................................................... 4-29
4.13 Ten-segment linearizer I/O ............................................................................................. 4-31
4.14 Detailed setting (Control function/Hysteresis) ................................................................ 4-33
Chapter 5 Program Control Related Setup Operations
5.1 Program Pattern Setup Procedure................................................................................... 5-1
5.2 Program parameter setting > Pattern initial setting .......................................................... 5-2
5.3 Program parameter setting > Wait action setting ............................................................. 5-4
5.4 Program parameter setting > Program start setting ......................................................... 5-5
5.5 Program parameter setting > Program pattern setting..................................................... 5-6
5.6 Program parameter setting > Event setting...................................................................... 5-8
5.7 Program parameter setting > Repeat action setting ...................................................... 5-10
5.8 Event output setting ....................................................................................................... 5-11
5.9 AUX (Auto message, Display position) .......................................................................... 5-12
Chapter 6 Operations during Control Operation
6.1 Operations on the Control Group Display (Switching Displayed Information and
Control Operation Modes) ................................................................................................ 6-1
6.2 Switching Displays on the Overview Display.................................................................... 6-6
6.3 Tuning Operation .............................................................................................................. 6-7
6.4 Operations on the Program Control Display (Only on Models with the Program
Control Option)............................................................................................................... 6-10
1
2
3
4
5
6
7
8
Chapter 7 Measurement Function Related Setup Operations
7.1 Settings Related to Measurement Inputs ......................................................................... 7-1
7.2 Settings Related to Measurement Alarms ....................................................................... 7-6
7.3 Setting the Temperature Unit ......................................................................................... 7-11
Chapter 8 Operations for Changing the Displayed Contents
8.1 Using the Information Display (Alarm Summary, Message Summary, Memory
Summary, and Control Summary) .................................................................................... 8-1
8.2 Measurement Function > Measurement Group Setup Operation .................................... 8-2
8.3 Measurement Function > Settings Related to Tag Display for Channels ......................... 8-4
8.4 Measurement Function > Operations When Displaying Trend, Digital, and Bar
Graph Displays................................................................................................................. 8-6
8.5 Measurement Function > Operations When Displaying the Overview ............................. 8-8
8.6 Measurement Function > Operations When Displaying the Historical Trend ................... 8-9
8.7 Measurement Function > Changing the Display Update Rate of the Trend Display ...... 8-10
8.8 Measurement Function > Settings Related to Messages Displayed on the
Trend Display and Write Operation ................................................................................ 8-11
8.9 Measurement Function > Changing the Trip Line of the Trend Display .......................... 8-13
8.10 Measurement Function > Changing the Channel Display Color .................................... 8-14
8.11 Measurement Function > Changing the Zone Display of the Trend Display .................. 8-16
8.12 Measurement Function > Setting the Scale Division, Bar Graph Base Position,
Scale Position of Trend Displays .................................................................................... 8-17
8.13 Measurement Function > Setting the Partial Expanded Display on the Trend Display .. 8-21
8.14 Measurement Function > Setting the Display Direction, Background Color,
Waveform Line Width, Trip Line Width, Grid, and Scroll Time ........................................ 8-23
9
10
11
12
13
14
App
IM 04L31A01-01E
Index
ix
Page 12

Contents
Chapter 9 Data Save/Load Operations
9.1 Acquiring Measurement Data to the Internal Memory and Saving Data to
the External Storage Medium .......................................................................................... 9-1
9.2 Saving Measured/Computed Data at Arbitrary Times (Manual Sample) ......................... 9-7
9.3 Saving and Loading Setup Data ...................................................................................... 9-8
9.4 Loading the Stored Display/Event Data (Historical Trend) ............................................. 9-10
9.5 Managing Files and Checking the Free Space on the External Storage Medium.......... 9-11
9.6 Saving the Screen Image Data ...................................................................................... 9-13
9.7 Clearing the Data in the Internal Memory ...................................................................... 9-14
Chapter 10 Computation and Report Function Related Operations
(Only on Models with the Computation Function Option)
10.1 Assigning Computation Channels and Setting Computing Equations,
Constants and Tags ....................................................................................................... 10-1
10.2 Starting, Stopping, and Resetting the Computation ....................................................... 10-4
10.3 Setting Computation Channel Alarms ............................................................................ 10-5
10.4 Setting TLOG Computations .......................................................................................... 10-8
10.5 Setting the Rolling Average .......................................................................................... 10-11
10.6 Creating Reports .......................................................................................................... 10-12
10.7 Starting/Stopping the Report Function......................................................................... 10-14
Chapter 11 Operations of Other Functions
11.1 USER Key Assignment and Operation .......................................................................... 11-1
11.2 Key Lock......................................................................................................................... 11-3
11.3 Key Operation Login/Logout .......................................................................................... 11-5
11.4 Displaying Logs (Checking Operations) and System Information Display
(Checking the System Specifications)............................................................................ 11-8
11.5 Setting the Measurement Remote Input (/A6R option or /A4FR option) ...................... 11-11
Chapter 12 Troubleshooting
12.1 Messages ....................................................................................................................... 12-1
12.2 Troubleshooting Flow Chart ......................................................................................... 12-11
Chapter 13 Maintenance
13.1 Periodic Inspection ......................................................................................................... 13-1
13.2 Calibration ...................................................................................................................... 13-2
13.3 Replacement of Parts .................................................................................................... 13-4
Chapter 14 Specifications
14.1 Input Section Specifications ........................................................................................... 14-1
14.2 Control Function ............................................................................................................. 14-3
14.3 Alarm Function ............................................................................................................... 14-4
14.4 Display Function............................................................................................................. 14-5
14.5 Storage Function............................................................................................................ 14-7
14.6 Communication Functions ........................................................................................... 14-10
14.7 Options ......................................................................................................................... 14-11
14.8 General Specifications ................................................................................................. 14-14
14.9 Dimensional Drawings ................................................................................................. 14-18
x IM 04L31A01-03E
Page 13

Contents
Appendix
Index
Appendix 1 Supplementary Explanation of the Acquisition of Display Data/Event Data
to the Internal Memory .......................................................................................App-1
Appendix 2 Supplementary Explanation of the Computation Function ................................App-6
Appendix 3 Meaning and Syntax of Equations ..................................................................... App-9
Appendix 4 Additional Explanation of the Report Function ................................................App-13
Appendix 5 Data Format of ASCII Files ..............................................................................App-16
Appendix 6 Initial Values ..................................................................................................... App-20
Appendix 7 Control Function Block Diagram ...................................................................... App-33
Appendix 8 Explanation of Engineering Units (EU and EUS)............................................. App-39
1
2
3
4
5
6
7
8
9
10
11
12
13
14
IM 04L31A01-01E
App
Index
xi
Page 14

Page 15
Chapter 1 Explanation of Functions
1.1 CX1000 Overview
The CX1000 consists of a control function and a measurement function. The control
function executes control through PID control and ON/OFF control. The measurement
function displays and acquires measured data and control-output data.
Control Function
The CX1000 supports thee control modes: single-loop control, cascade control, and loop
control with PV switching. It can handle up to two loops of PID control. In addition, the
UT Series controllers made by Yokogawa M&C Corporation can be connected and
controlled simultaneously as external loops (four loops max.). You can check the control
status on the controller style and faceplate style displays and the hybrid style display that
is a mixture of the two styles. Furthermore, the overview display allows monitoring of all
control loops including external loops. In addition, the CX1000 provides auto-tuning of
PID constants as well as manual tuning, which enables you to adjust the control
parameters such as PID constants while checking the control status.
Measurement Function
In addition to the measured data for the control function, the CX1000 can acquire up to
six channels of measured data. The data can be displayed as waveforms, numeric
values, and bar graphs. The measured data along with the control data can be stored to
a floppy disk, Zip disk, or ATA flash memory card using the built-in drive.
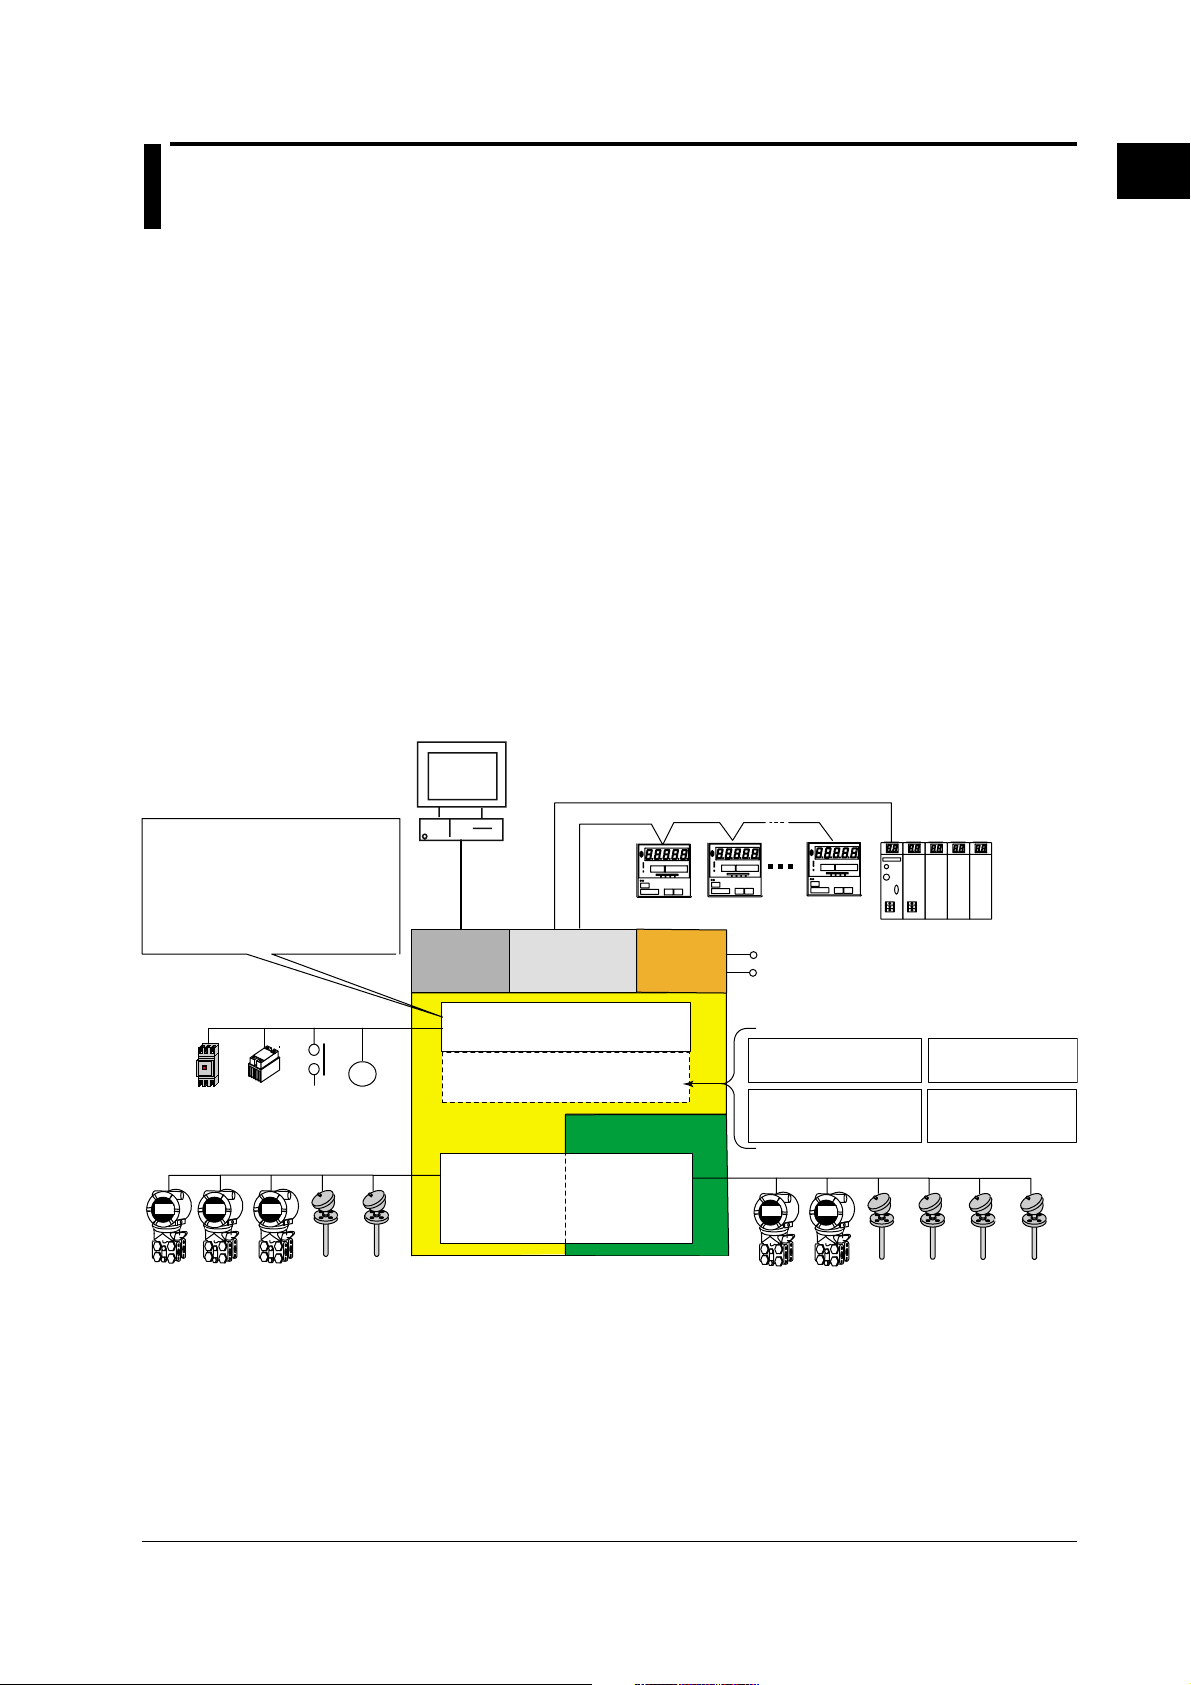
Conceptual Input/Output Diagram
1
Explanation of Functions
PC
• Universal control output: for 2 loops
Select current, voltage pulse, or
relay output.
• Control contact input: 6 inputs
• Control contact input
Relay output: 2 outputs
Transistor output: 4 outputs
R1
Magnet
switch
5 universal measurement inputs 6 universal measurement inputs
SSR
Contact
input
6 inputs
Contact
output
6 outputs
LAN
(Ethernet)
CX1000
Ethernet
the control output terminal block)
Control loop
(select 0 or 2 loops)
Serial interface
port
RS-422/485/232
Control output terminal
block (Loops 1 and 2)
Option terminal block
(Can be installed in place of
section
Control/measurement input
Control input
terminals
Measurement input
terminal block
Measurement input
Supply
section
terminals
CH1 to CH6
Power
Controllers (up to
4 loops)
100 VAC to 240 VAC
24 VDC/AC (/P1 option)
Select one from the following option
terminal blocks.
Measurement alarm output
(/A6 option)
Measurement alarm output +
FAIL/memory end output
(/A4F option)
PLC
(such as the FA-M3
by YOKOGAWA)
Measurement alarm
output + remote input/
output
(/A6R option)
Measurement alarm
output + FAIL/memory
end output + remote
input/output
(/A4FR option)
IM 04L31A01-03E
1-1
Page 16

1.2 Control Function Overview
Control Signal Input/Output
As shown in the following figure, the CX1000 can control up to two loops.
Control PV input
Control output
• Relay
• Voltage pulse
DISP/
ENTER
• Current
CX
The UT Series controllers made by Yokogawa M&C Corporation can be connected via
the serial interface and controlled simultaneously as external loops (four loops max.)
(see the
CX1000/CX2000 Communication Interface User’s Manual
Analog Input for Loop Control
PV input and remote setpoint input (RSP) are available as control signal inputs. You can
select thermocouple, resistance temperature detector, standard signal, or DC voltage for
both PV input and RSP input. The RSP input is used as a terget setpoint (SP). There
are five input terminals on the control/measurement input terminal block. The figure
below shows their assignments according to the number of loops used and the control
mode (see the
[Control mode setting]
During single-loop control
During cascade control
During loop control with
PV switching
You can apply scale conversion, bias, input filter, ten-segment linearizer bias, tensegment linearizer approximation, and square-root computation on the control signal
input. For thermocouple inputs, you can set reference junction compensation. In
addition, ratio setting can be specified against RSP inputs.
(number of analog inputs: 5)
[Up to 2 loops]
Controls
and
switches
··· ···
• SSR
• Magnet switch
etc.
next page
).
LOOP2
21321
PV, PV1, PV2: PV input, (RSP): RSP input
(not used during program control), : unused terminal
Object of
control
(RSP)
LOOP1
(RSP)(RSP)
(RSP)
• TC
• RTD
etc.
).
Measurement input terminals
PVPV
PVPV
PV1PV1 PV2PV2
Control Signal Output
The terminal provides universal output. Two loops can be controlled (except cascade control
which uses two loops for one control). The following types of control output can be selected.
• PID control output
• Time proportional PID Outputs ON/OFF signals with a pulse width that is proportional
relay contact output: to the time as relay contact signals according to the computed
PID value.
• Time proportional PID Outputs ON/OFF signals with a pulse width that is proportional to
voltage pulse output: the time as voltages according to the computed PID value.
• Current output (continuous Continuously outputs a current (analog signal) that is
PID control output): proportional to the computed PID value.
• On/off control relay Outputs on/off control relay contact signals according to the
contact output: polarity (positive/negative) of the deviation between the SP
and the PV.
1-2 IM 04L31A01-03E
Page 17
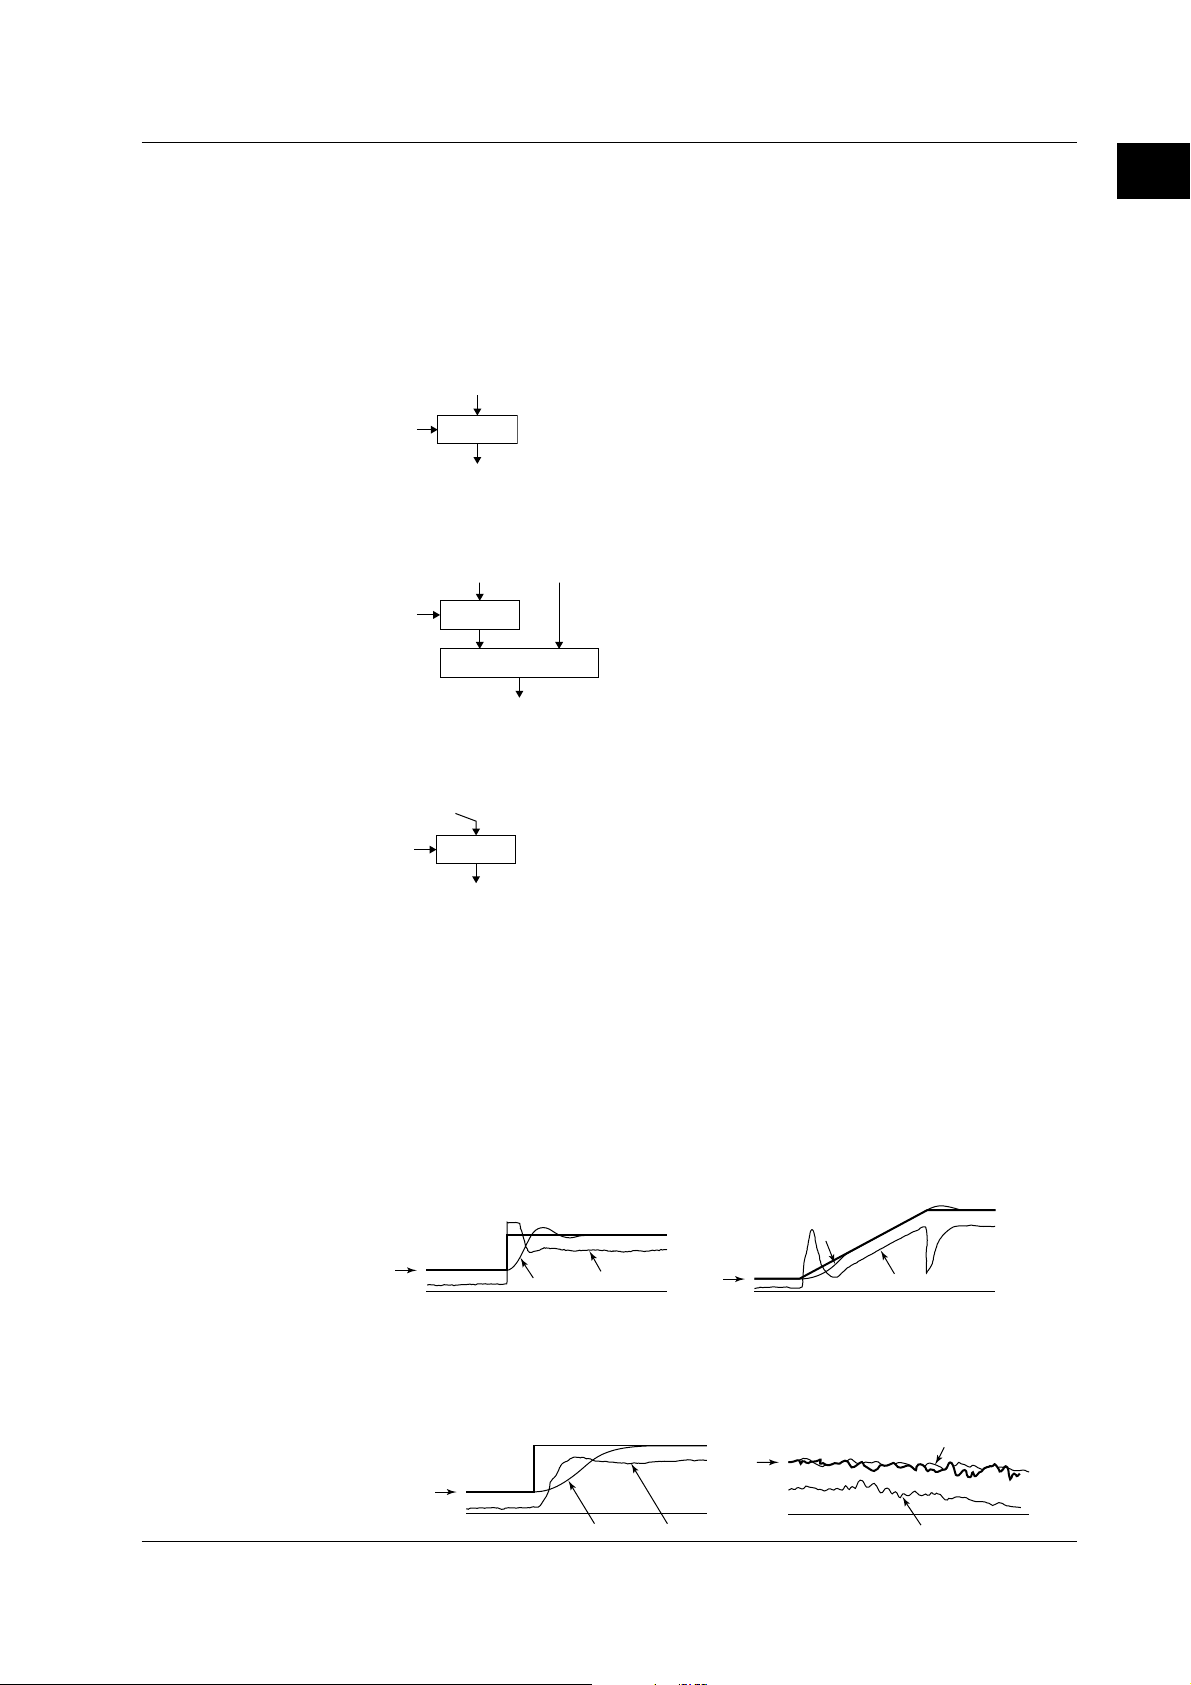
SP
PV
OUT
SP
PV
OUT
PV derivative type PID
(with output bump)
Deviation derivative type PID
(with output bump)
1.2 Control Function Overview
Control Methods
PID control and ON/OFF control are available. The following control modes can be
selected for both PID control and ON/OFF control.
Control Mode
In PID control, the following three control modes are available in relation to the PV input
selection.
• Single-loop control
Basic control consisting of a single system of controller CPU.
PV
PIDSP
OUT
• Cascade control
Control consisting of two systems of controller CPUs that use the primary control
output as the secondary control SP.
PV1
PIDSP
PV2
PID
OUT
• Loop control with PV switching
Single-loop control that is switched between two PV inputs (PV1 and PV2) according
to a specified condition.
PV1
PV2
1
Explanation of Functions
IM 04L31A01-03E
PIDSP
OUT
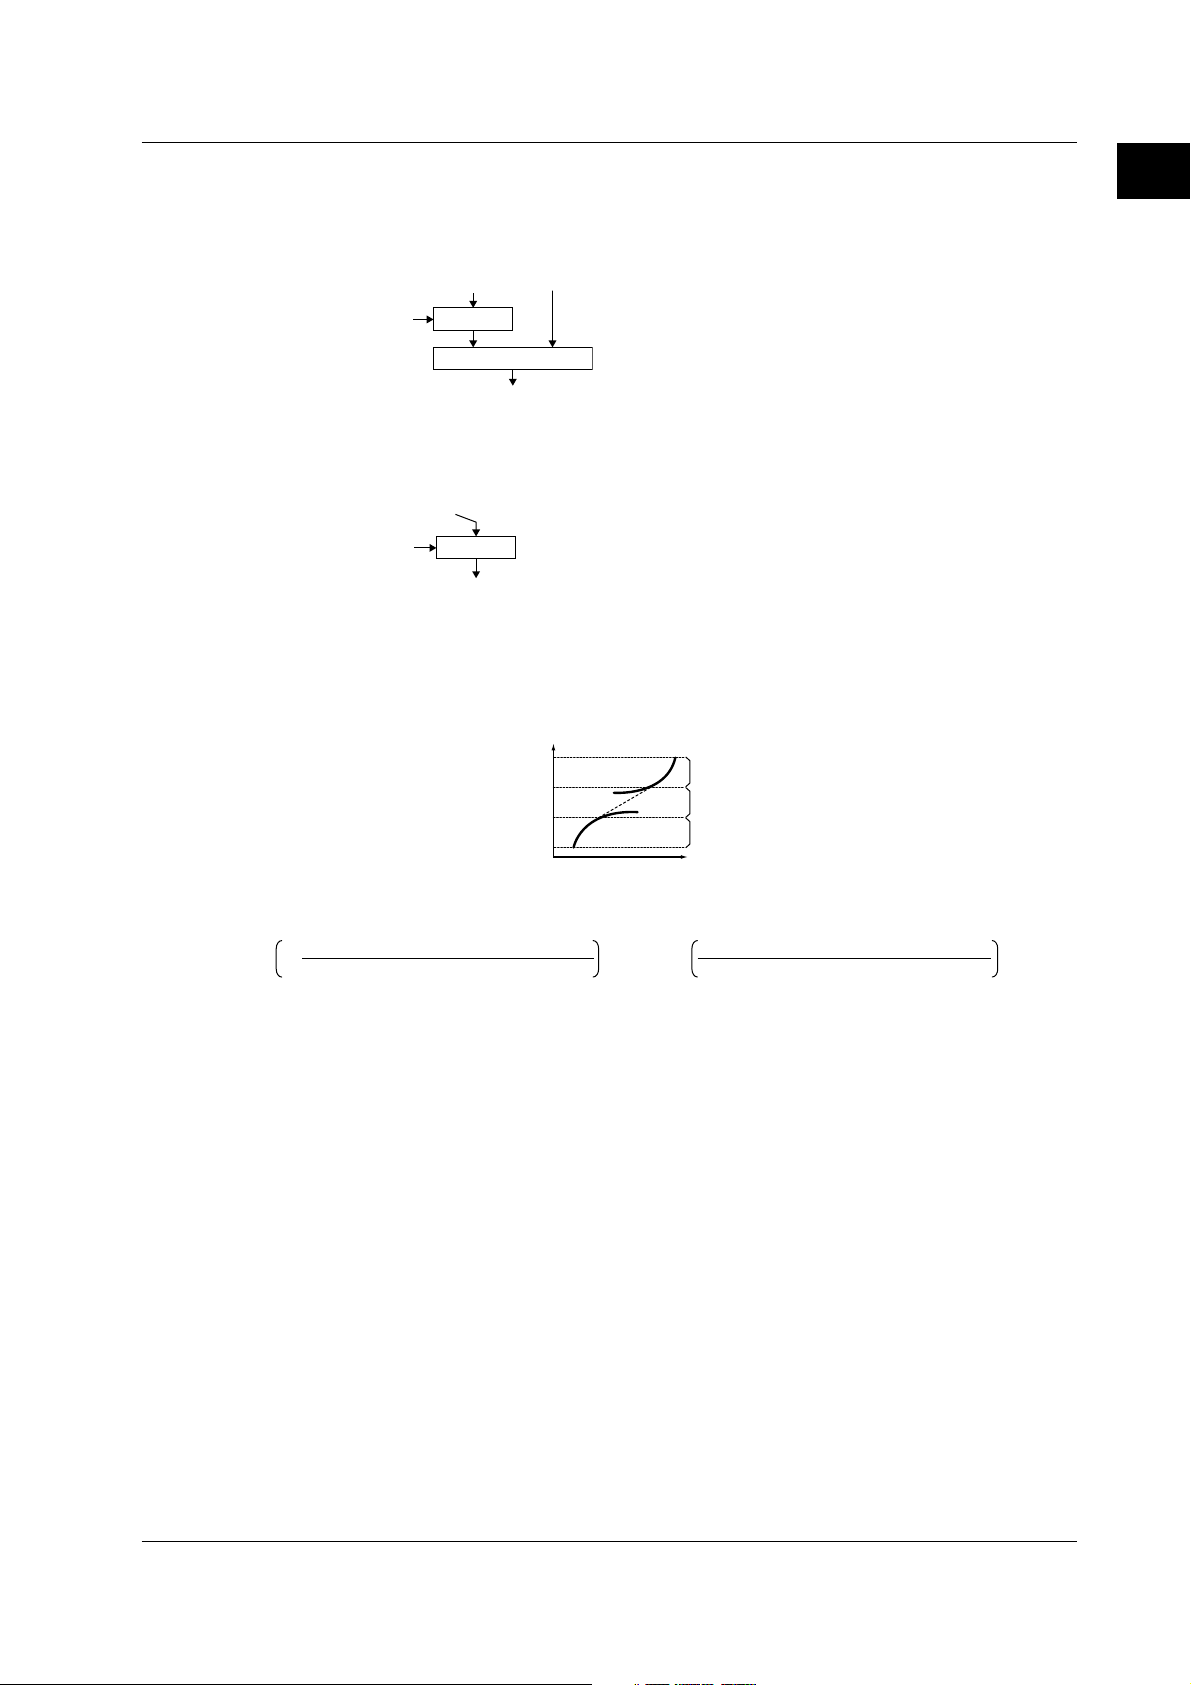
In PID control, you can also select the PID control mode.
PID Control Mode
Depending on the desired operation at the time the SP is changed, you can select the
PID control mode from below. The selections between the PV derivative type and
deviation derivative type as well as the presence or absence of the control output bumps
are automatically made according to the PID control mode and operation mode (fixedpoint control or program control).
• Standard PID control
Controlled so that the control output reaches the new SP quickly after the SP is
changed.
• Fixed-point control
Select this mode if you wish to avoid the control OUT from reacting sensitively to the
SP change causing a disturbance in the control such as in the case with a continuous
fixed-point control.
PV derivative type PID (without output bump) PV derivative type PID (with output bump)
SP
SP
PV OUT
PV
OUT
1-3
Page 18
1.2 Control Function Overview
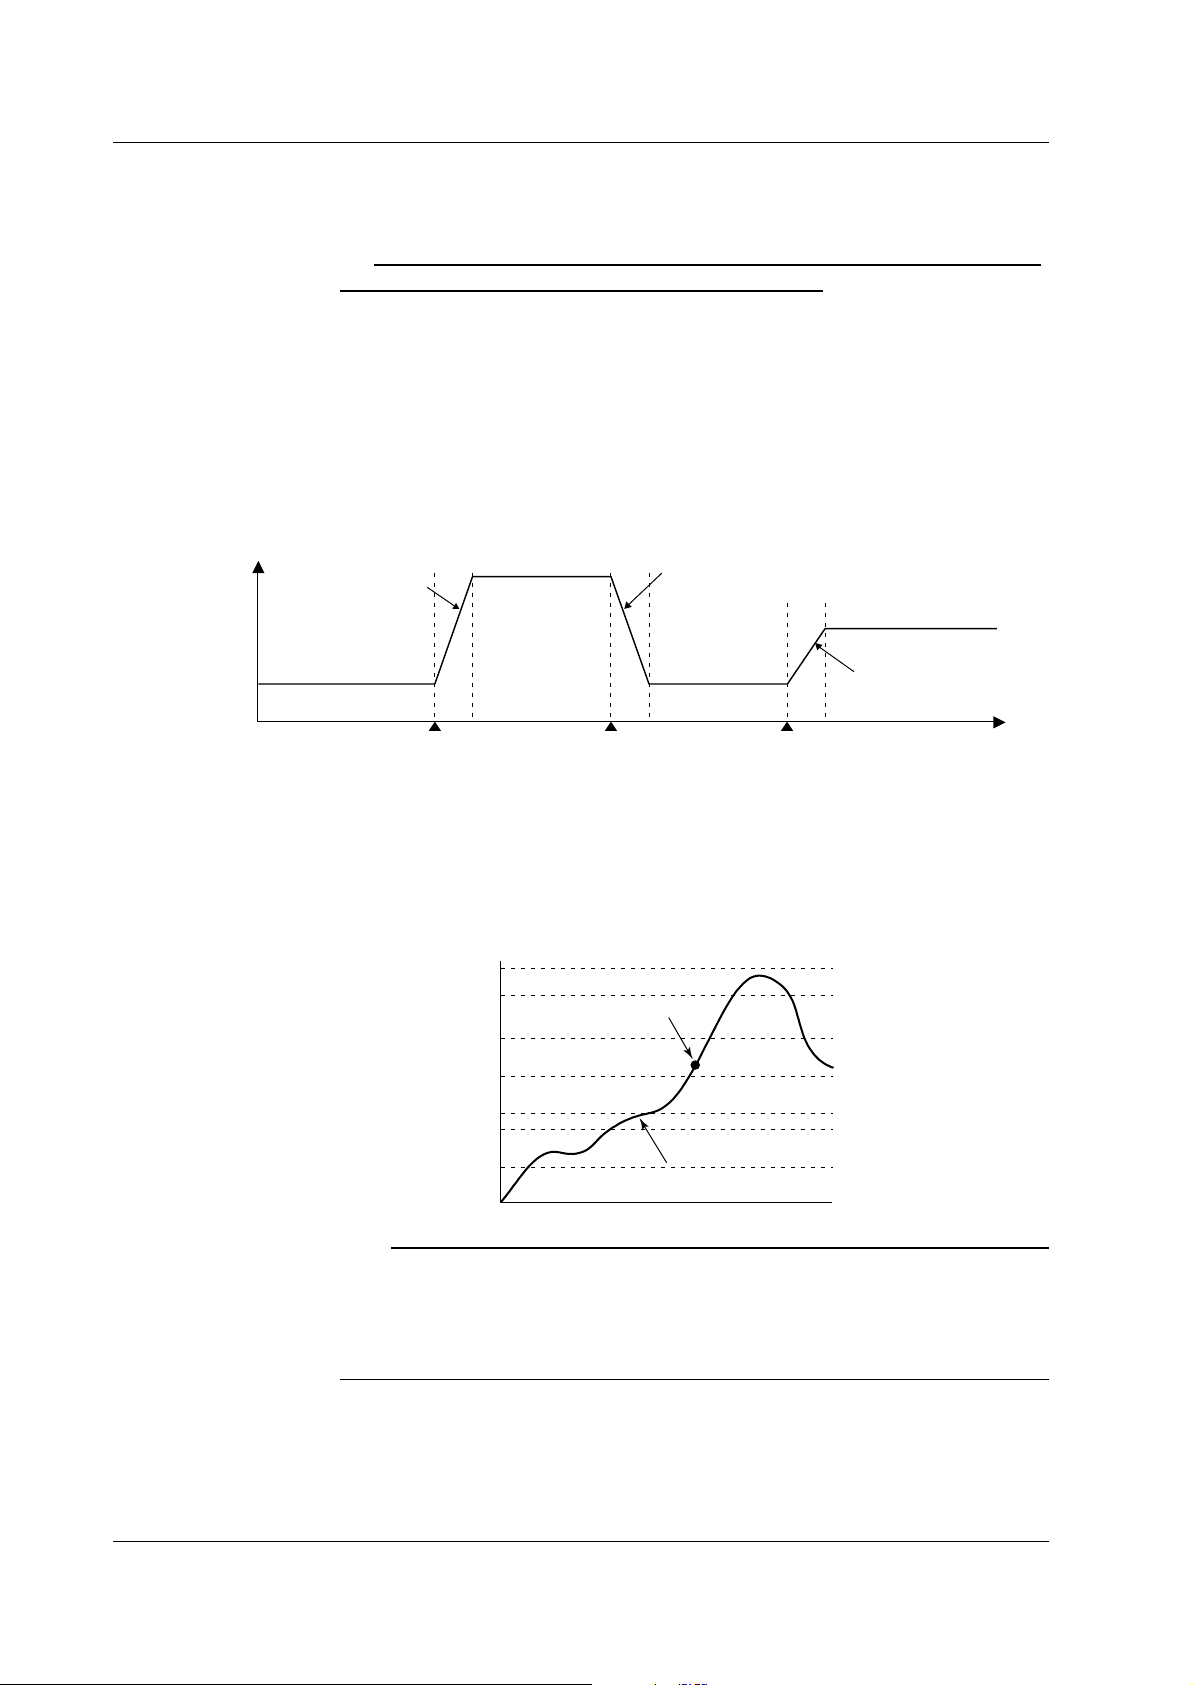
Control Parameters
The following control parameters are available. For each group, you can enter up to
eight sets of SPs and PID parameters as underlined below.
SP,
value, relay hysteresis, control action direction, preset output, SP tracking, PV tracking,
setpoint limiter, output velocity limiter, auto/manual switching of the over-integration
prevention function (anti-reset windup), ON/OFF of the control output suppression
function, and SP ramp-rate.
PID Selection Method
The following two methods are available.
• Target setpoint selection method
PV
Rise according to the
setpoint ramp-up
SP1
(No.1 PID)
Switch from SP1 to SP3 Switch from SP3 to SP1 Switch from SP1 to SP2
• Zone PID method
Maximum value of
measurement span
Reference point 6
Reference point 5
Reference point 4
Reference point 3
Reference point 2
Reference point 1
Minimum value of
measurement span
Note
PID constant, control output limiter, ON/OFF of the shutdown function, manual reset
A group (up to 8 groups) consisting of a SP and PID parameters is registered to a PID
number (SP number). By specifying the SP number using keys on the front panel,
external contact input, or via communications, the SP and PID parameters are
switched.
SP3
(No.3 PID)
setting
Fall according to the
setpoint ramp-down
setting
SP1
(No.1 PID)
SPn: Target setpoint number
SP2
(No.2 PID)
Rise according to the
setpoint ramp-up
setting
Time
The measurement span is divided into a maximum of seven zones using reference
points. The optimum PID constant is preassigned to each zone, and the PID constant
(in actuality, other control parameters that are registered using the PID number are
included) is automatically switched according to the PV. This method is suited for
controlling equipment such as reactors in which the chemical reaction gain varies
depending on the temperature.
If the current PV is here, PID
constant of PID No. 5 is used
for control.
Change in the
PV.
• When performing program control operation on models with the program control option,
you will select between segment PID method (zone PID selection OFF) and zone PID
method.
• For a description on auto tuning, which automatically sets the optimum PID constant, see
section 1.12, “Tuning.”
No.7 PID
No.6 PID
No.5 PID
No.4 PID
No.3 PID
No.2 PID
No.1 PID
1-4 IM 04L31A01-03E
Page 19

1.2 Control Function Overview
Alarm Output
When the control action status matches the preset status (up to 4 points per loop), the
CX1000 can output a relay contact signal from the control output terminal block or the DIO
expansion terminal block or display the alarm occurrence status on the screen. In relay
contact output, you can select and assign the type of alarm you wish to output at each
output terminal of the control output terminal block or the control DIO extension terminal
block.
Alarm Type
You can select the alarm type from below. For a detailed explanation on each alarm
output, see
section 1.10, “Control Alarm Related Settings.”
PV high-limit alarm, PV low-limit alarm, deviation high-limit alarm, deviation low-limit
alarm, deviation high & low limit alarm, deviation within high & low limits alarm, SP highlimit alarm, SP low-limit alarm, output high-limit alarm, and output low-limit alarm.
Alarm Hysteresis
You can set a hysteresis to the setpoints used in the activation and releasing of the alarm.
Example of PV high limit alarm
OFF
PV
Time
ON
Alarm setpoint
Hysteresis
Alarm ON
OFF
ON
OFF
1
Explanation of Functions
Alarm Standby
You can put the alarm output on standby at the initial stage of control operation until the
PV input reaches the SP.
PV
Power up
Normal
handling
Alarm Mode
You can set the condition for disabling the alarm output (such as when the operation is stopped).
FAIL Output/Self Diagnosis Output
In addition to the alarm output described above, the following relay contact signal for
failure detection can be output from the control output terminal block.
• FAIL output
Output when a failure is detected in the CX1000 CPU. When a failure is detected, the
CX1000 is put in the following condition.
Control: Stopped (preset output if in the middle of operation, control output is off or
0% when power is turned ON)
• Self diagnosis output
Output when an input burnout, A/D converter failure, or RJC failure occurs. If an input
burnout or A/D converter failure is detected, the control output is set to the preset
output value. For RJC, PID control continues as though RJC is 0 °C.
Normal
Alarm is not output during this
period even if the PV is below
the alarm low limit.
Failure
Alarm output ON
Hysteresis
Alarm low limit value
Time
IM 04L31A01-03E
1-5
Page 20
1.2 Control Function Overview
Control Operation Mode
The following control operation switching is available. The control operation can be
switched using keys on the CX1000 control group display (see
inputs, or via communications. For a description of the control operation modes on
models with the program control option, see “
control function block diagram in the explanation below is a simplified one. For a
detailed control function block diagram for each control mode, see appendix 7.
Switching between Remote (REM) and Local (LOC)
Select whether control is executed using the SPs set on the CX1000 or using the
external analog signal (RSP) as the SP.
PV input RSP input
PV
SP
Local
(LOC)
Controller CPU
RSP
Remote
(REM)
(Analog signal)
Program Control
page 1-12
), using contact
” in the next section. The
Control output
OUT
Switching between Auto (AUT), Manual (MAN), and Cascade (CAS)
When set to auto, the control output value (OUT) is computed from the deviation between the PV
input and the SP. When set to manual, the control output value (OUT) that is set manually is
used rather than the computed control output value (OUT). Switching to “cascade (CAS)” is
possible only when the control mode is set to “cascade control.” In cascade control, the primary
PID control output is used as the SP of the secondary PID control.
Switching between Run (RUN) and Stop (STP)
When the operation is stopped, the control output value (OUT) is set to the preset value.
Single-loop control
Manual operation
Manual (MAN)
Preset output
Stop (STP)
PV input
PV
Controller CPU
Output limiter
Run (RUN)
Control output
SP
Auto (AUT)
OUT
Cascade control
PV input 1
(Cascade primary)
PV1 PV2
Controller CPU 1
Cascade
Manual (MAN)
SP1
PV input 2
(Cascade secondary)
SP2
Auto/
Manual
Controller CPU 2 Manual operation
Cascade/
Auto
(CAS/AUT)
Output limiter Preset output
Run (RUN)Stop (STP)
Control output
OUT
Enabling/Disabling Auto-Tuning
In PID control, the optimum PID constant is set automatically when auto-tuning (see
page 1-52
) is performed. Auto-tuning is possible only during auto operation.
Contact Input
Contact input can be used to carry out operations such as running/stopping operation,
switching operation modes, changing SPs, switching PV inputs (during loop control with
PV switching). For a description on the possible operations, see “Contact Input
Information Registration” on
1-6 IM 04L31A01-03E
page 1-23
.
Page 21
1.2 Control Function Overview
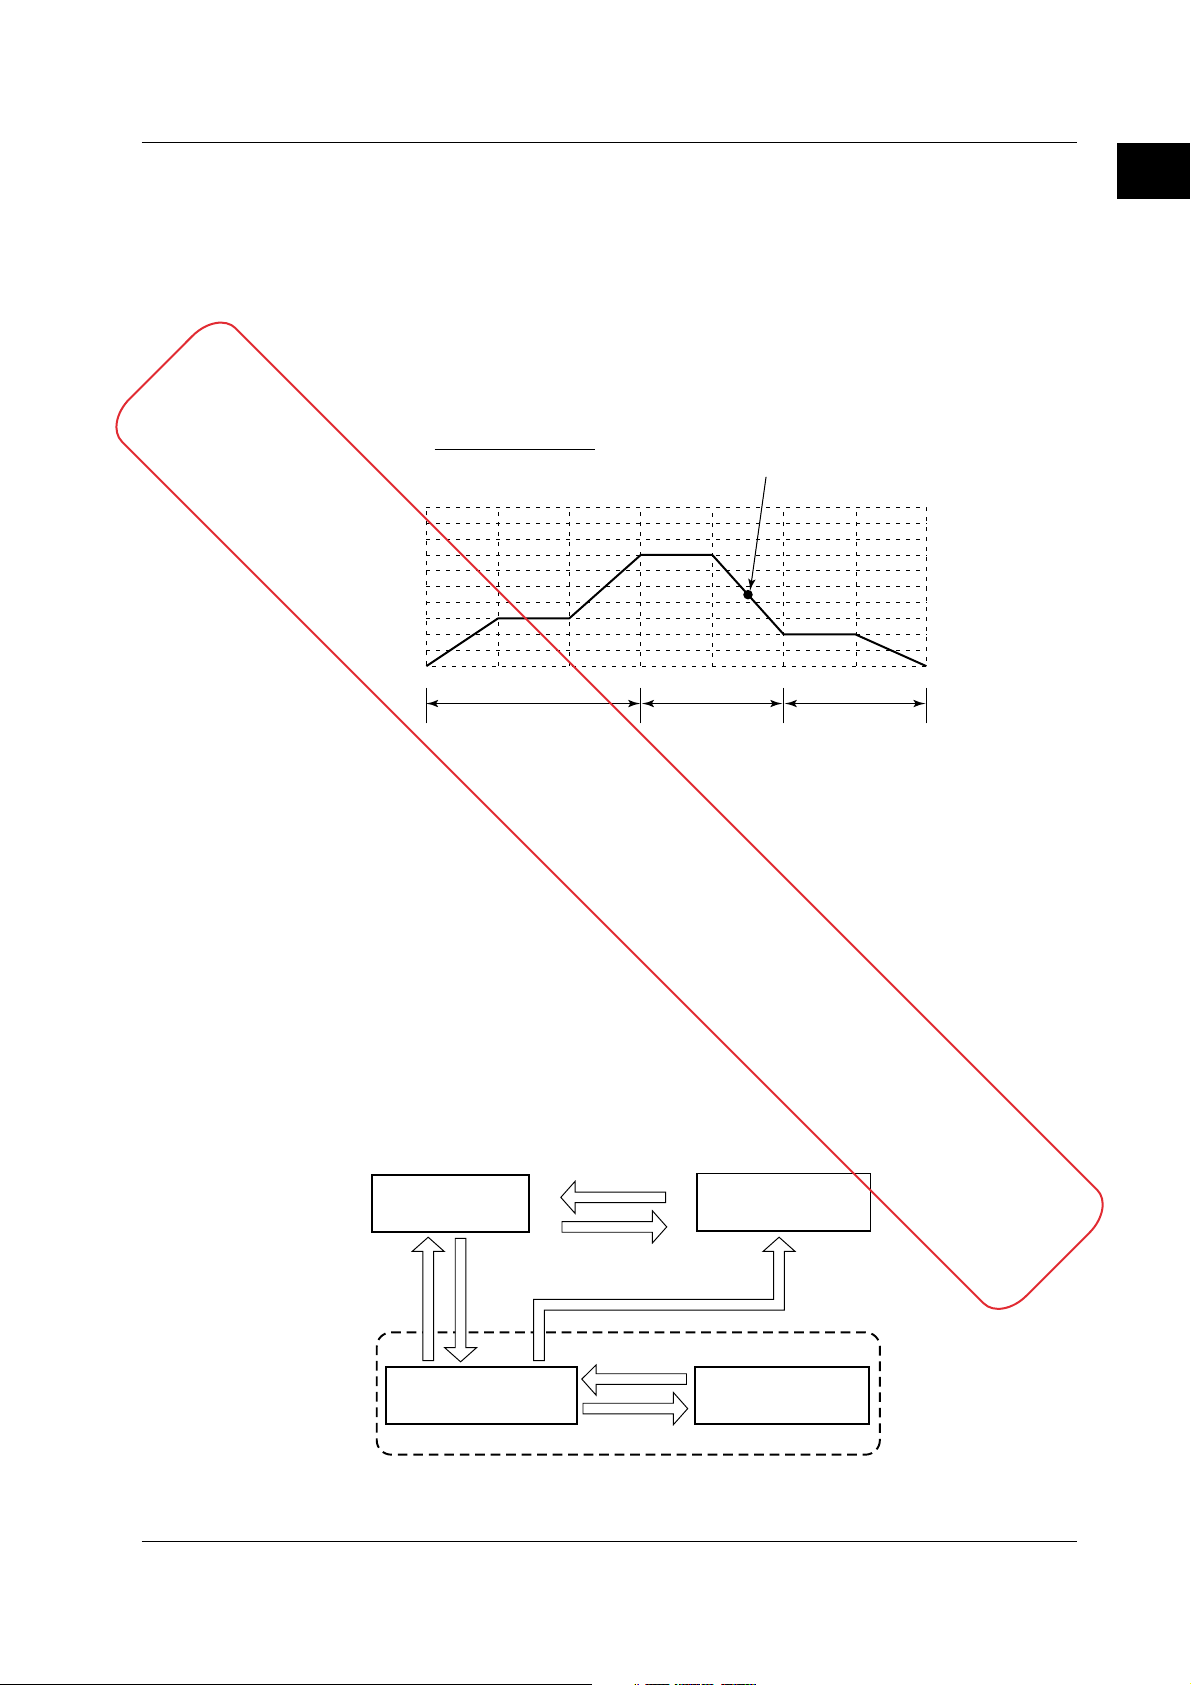
Program Control (Optional Function)
This function is used to ramp-up or ramp-down the SP according to a program pattern. You can
set multiple program patterns (up to 30) and switch among them according to the operating
condition. A program pattern consists of multiple program segments.
There are two methods in selecting the PID constant in program control. One is the
“segment PID method” in which the PID constant is switched every segment according to
the program pattern setting; the other is the “zone PID method” in which the PID
This function cannot be used on the current version of the CX1000.
The infomation given here may change in the future.
constant is automatically switched according to the PV. The “segment PID method” is
used when a different PID constant is required in the same PV region when the
temperature is rising and when the temperature is falling.
Segment PID method
PV
1000.0
500.0
0.0
SEG1 SEG2 SEG3 SEG4 SEG5 SEG6 SEG7
No.2 PID
Setting the Operation for Program Control
Settings include the number of repetitions of the program pattern (repeat function), delay
function (wait function) for the case when the PV cannot follow up the SP, and alarm
output/event output assignments (contact output assignments) according to the program
progression.
Operation Mode during Program Control
The following 4 types of operation modes are available.
• Program operation mode
Condition in which control is carried out according to the program pattern.
• Hold operation mode
Condition in which program operation is paused.
• Reset mode
Condition in which program operation is stopped. All event outputs are cleared (off).
• Local operation mode
Mode in which fixed-point control is performed independently from the program
operation condition.
No.1 PID No.3 PID
The PID constant of PID No. 1
is used in the 5th segment (SEG5).
1
Explanation of Functions
IM 04L31A01-03E
RESET
Reset mode
RESET
Program operation mode Hold operation mode
Since the remote input cannot be used for the SP during program control, there is no
remote/local switching operation.
RUN
RUN per
loop
Release HOLD
HOLD
Program operation
Local operation mode
LOC
1-7
Page 22

/
1.2 Control Function Overview
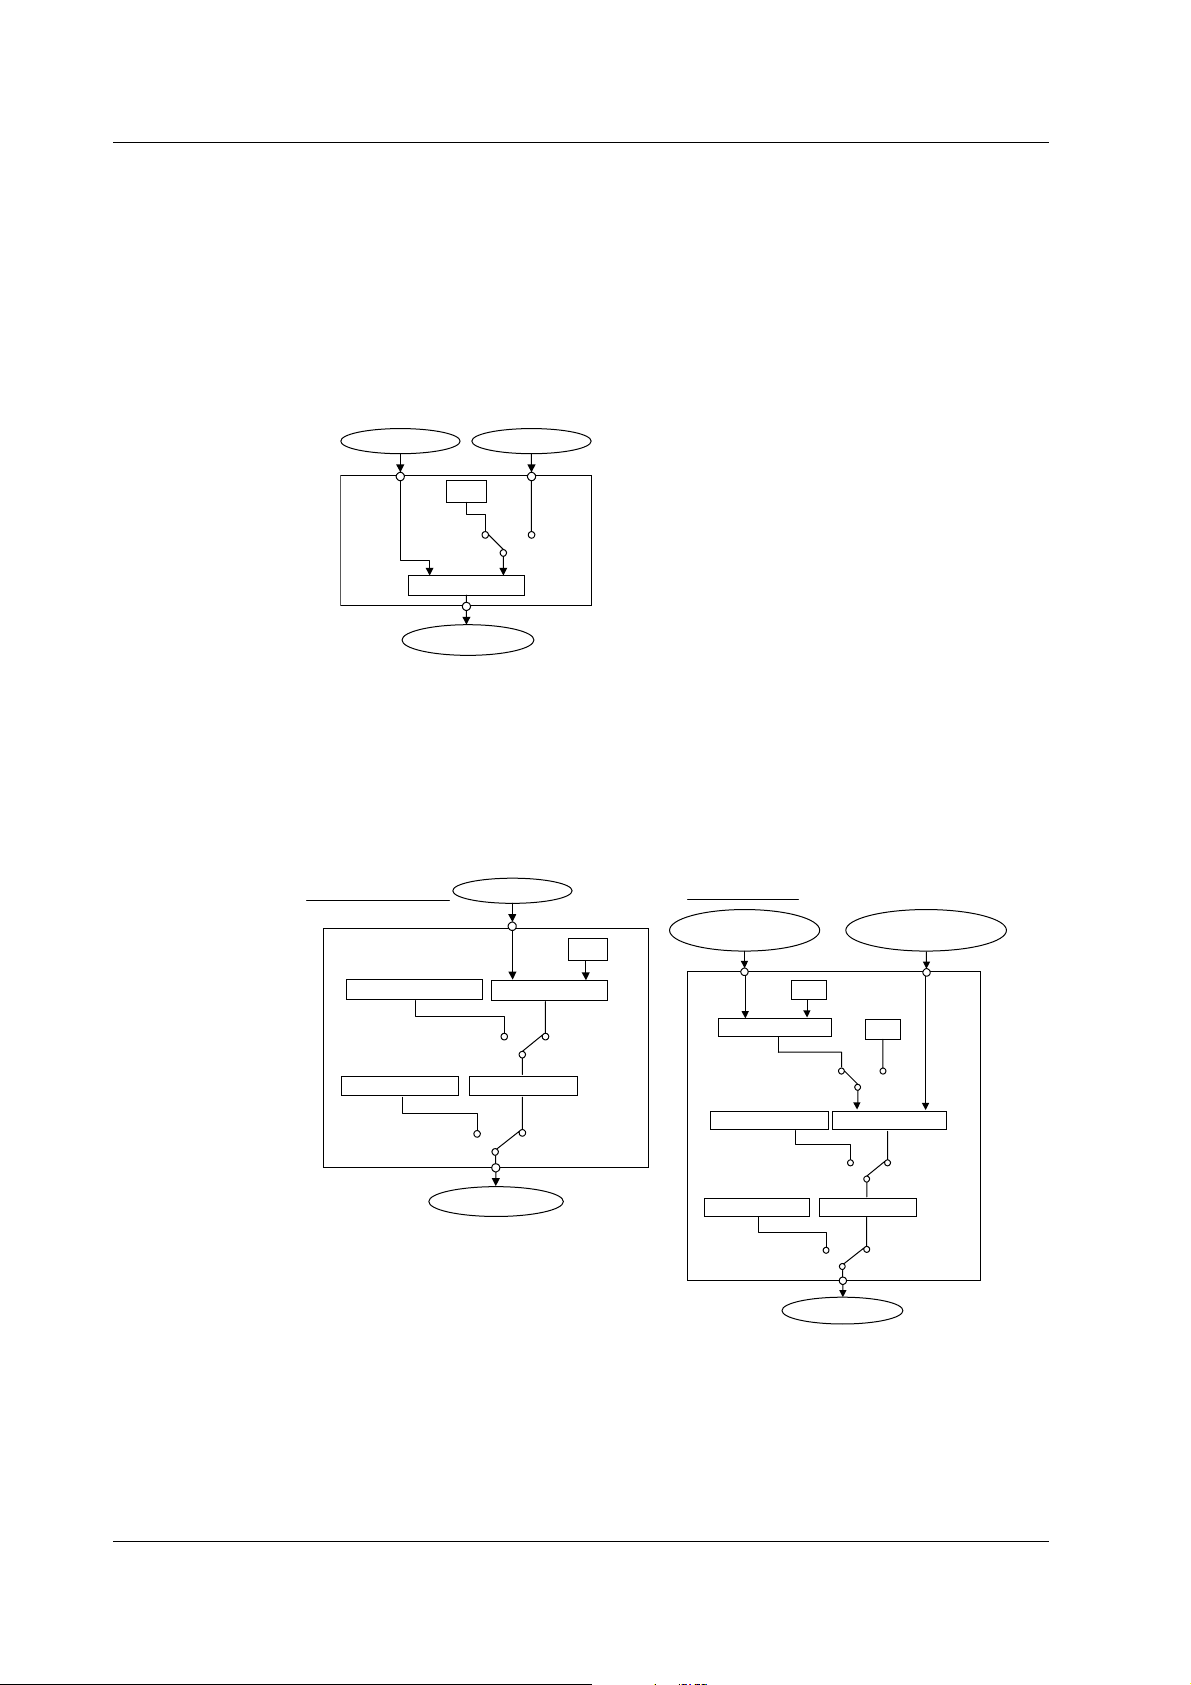
Flow of Setup Procedure
Below is a standard flow of setup procedure in executing control for the first time using
auto operation.
Power ON
Initial settings include the following
parameters.
Set SP
Set relay hysteresis
Set other control
parameters
Set alarm-related
parameters
Operating condition
Stop control
Initial settings
PID control or
ON/OFF control?
Set SP
Section 1.10
Set PID parameters
Set alarm-related
parameters
Start a test run
Operating condition
Adjust control
Start actual operation
Initial settings
Basic control settings
PV input related settings
Contact input/output
*
*
Set in
"Control Output Type"
PID controlON/OFF control
of basic control settings
related settings
Control output
suppression
→ Section 1.3
→ Section 1.4
→ Section 1.5
→ Section 1.6
→ Section 1.7
→ Section 1.10
• Auto tuning
• Manual tuning → Section 1.12
• Other adjustments
(Parameters that cannot be changed
during operation → section 6.1)
When using program control, set the items that include “Program control: On” in “Basic
control settings” indicated above. Then, carry out the following settings in addition to
“Target setpoint/PID parameter settings.”
Settings for program control
This function cannot be used on the current version of the CX1000.
The infomation given here may change in the future.
Pattern initial setting
Wait operation setting
Pattern start setting
Program pattern setting
Event setting
Event output setting
Repeat action setting
Operation start time
Start segment number
*
The operation start time and start segment number is set using key
operations on the operation screen.
→ Section 1.11
Pattern initial setting:
Set the pattern numbers, pattern off/on, number of
segments used, segment assignment method, and
edit segment number.
Wait operation setting:
Set wait zone off/on, wait zone settings, and timer.
Pattern start setting:
Set starting target setpoint and start code (operation
start condition).
Program pattern setting:
Set segment numbers, ramp/soak, final target setpoint,
segment time, ramp-rate-time unit, ramp-rate, segment
PID group numbers, operation at the time of segment
switching, wait operation type, and wait numbers.
Event setting:
Set event types, loop number/type/setpoint (only when
PV event is selected), time event ON/OFF, and ON time
OFF time (only when time event is selected).
Event output setting:
Set the event type, relay output ON/OFF, and relay
output number.
*
Repeat action setting:
Set the repeat function, number of repetitions, start
*
segment number, and end segment number.
1-8 IM 04L31A01-03E
Page 23
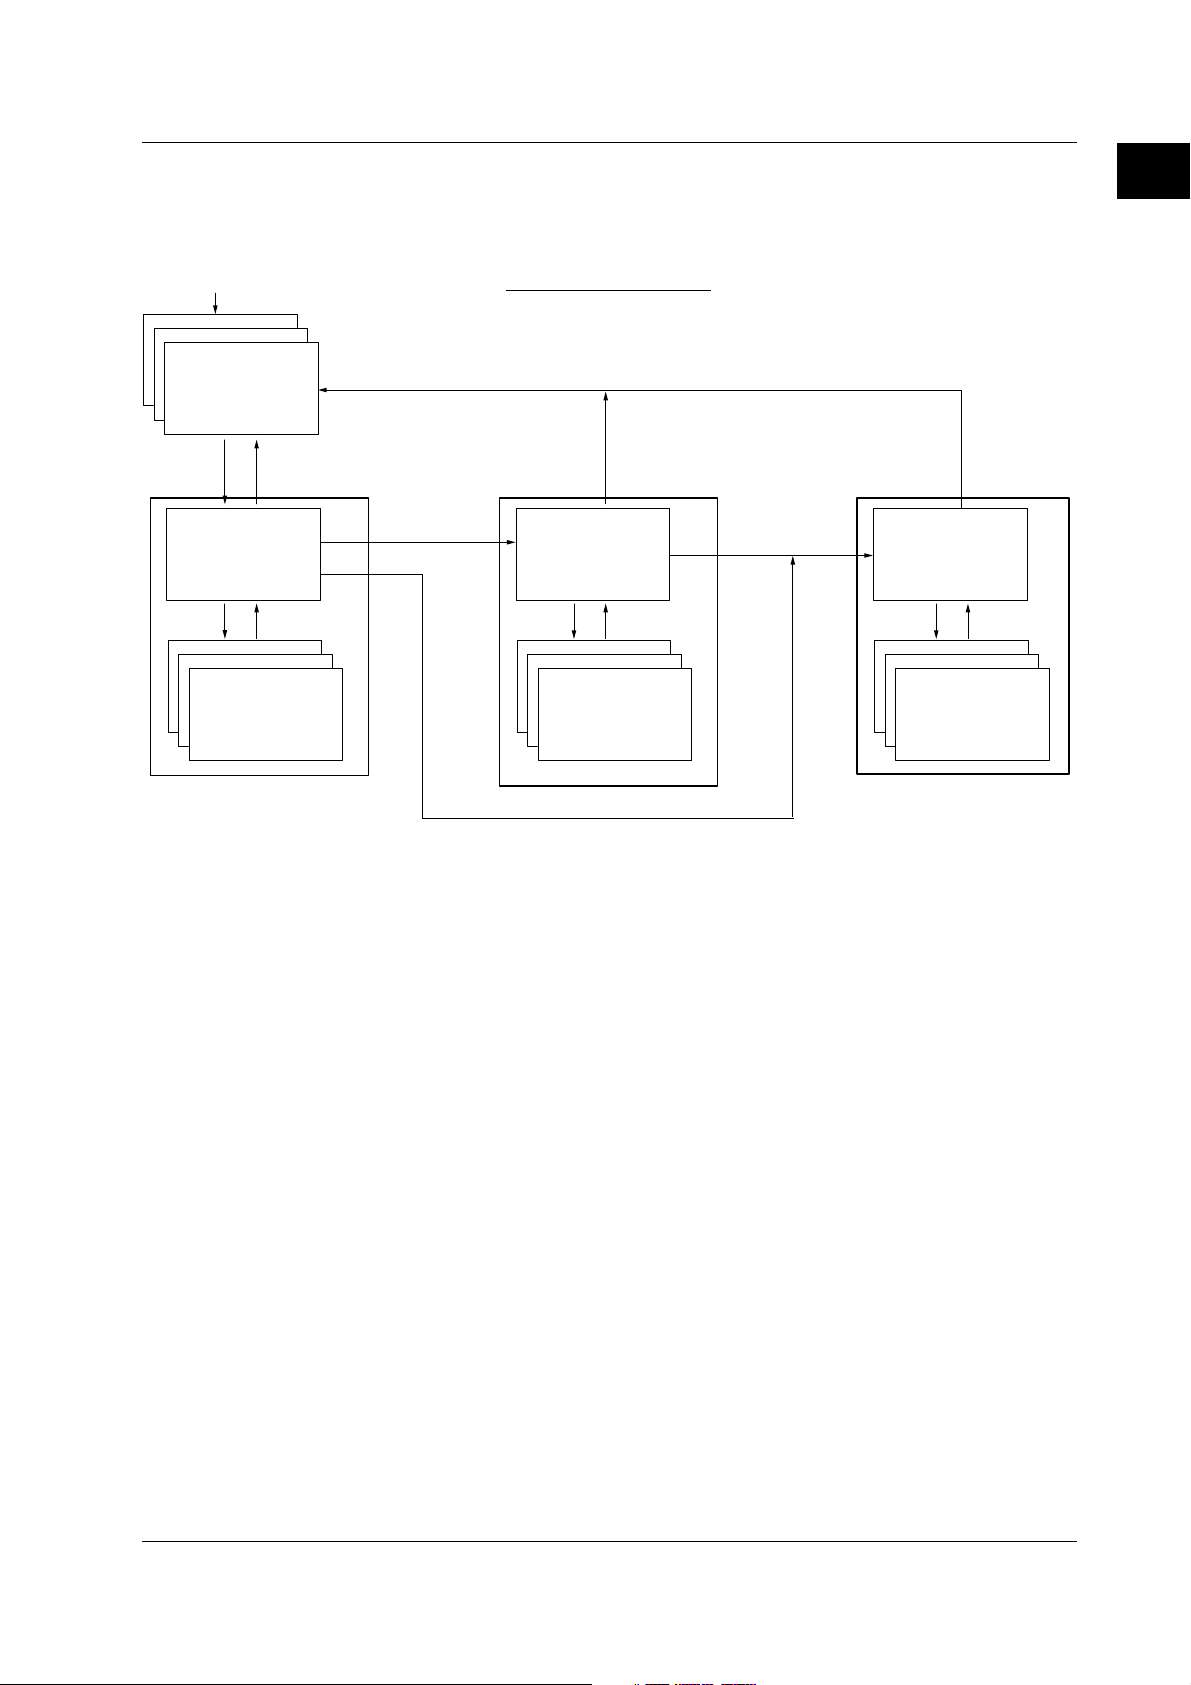
1.2 Control Function Overview
Switching Displays
Power ON
Operation display
MENU key
Soft keys
Operation mode
ESC key
Control setting mode
[Setting mode (Control)]
Menu
MENU key or
ESC key
Setup display
(#1 to #7
*
)
Control-related settings are entered in basic setting mode and control setting mode. In
addition, settings common to control and measurement are entered in the common and
measurement setting mode.
Display Transition Diagram
[End] soft key -> DISP/ENTER key
(This operation saves the settings made
in the basic setting mode.)
MENU key or ESC key
MENU key
Press the FUNC
key for 3 s
Soft keys
Common and measurement setting mode
[Set mode]
Press the FUNC
Menu
MENU key or
ESC key
Setup display
(#1 to #11)
key for 3 s
Soft keys
Basic setting
mode
Menu
ESC key
Setup display
(#1 to #12
**
)
1
Explanation of Functions
*
#1 to #8 when program control
is ON.
**
#1 to #11: Basic common and
measurement settings
#12: Basic control settings
Basic Control Setup Items in Basic Setting Mode
#1 Control action
PID number, control period, zone PID, restart mode, restart mode (program) (only on
models with the control option), initial PID, auto tuning, control mode, method (only
during loop control with PV switching), program control ON/OFF (only on models with
the program control option), and PID control mode.
#2 Input setting
Burnout and RJC.
#3 Contact input-registration
Contact input registration
#4 AUX
Remote setting, alarm mode, and SP number selection source.
#5 Output processing
Control output, cycle time, and analog-output type
#6 Relay
FAIL ON/OFF, self diagnosis ON/OFF, and relay action/behavior (energize/deenergize, hold/nonhold)
#7 Tuning setting
Tuning item selection
#8 External loop setting (For details on the settings, see the
Communication Interface User’s Manual
.)
CX1000/CX2000
Setup Items in the Control Setting Mode
#1 Control input range
Input type, mode, type, range, span, scale, unit, square root, low-cut, bias, filter, and ratio.
#2 Control alarm
Type, standby, relay output ON/OFF, and alarm value
IM 04L31A01-03E
1-9
Page 24

1.2 Control Function Overview
#3 Operation-related parameters/Zone PID
#4 PID parameters
#5 Control group setting
#6 Ten-segment linearizer I/O
#7 Program control (only when program control is ON)
#8 Detailed setting (“#7” when program control is OFF)
Suppressing function, ramp-rate-time unit, SP ramp-down-rate/SP ramp-up-rate, tag,
tag comment, reference point (when zone PID is selected), switching hysteresis
(when zone PID is selected), and reference deviation (when zone PID is selected).
SP, PID constant, output limit, shutdown ON/OFF, manual reset, relay hysteresis
(only during ON/OFF control), reverse/direct, and preset output.
Group name, kind (internal loop/external loop/measurement channel), and number.
Input type, mode, and biasing or approximation input/output values.
#1Program parameter setting
Pattern initial setting, wait action setting, program start setting, program pattern
setting, event setting, and repeat action setting.
#2Event output setting
Event kind, relay output ON/OFF, number, and program pattern end signal relay
output ON/OFF.
#3AUX (Auto message, Display position)
Auto message for program Run/Reset and Program display position.
#1Control function
SP tracking, PV tracking, SP limiter, output velocity limiter, and anti-reset windup
auto/manual.
#2Hysteresis (Alarm and PV event)
Alarm hysteresis and PV event hysteresis
1-10 IM 04L31A01-03E
Page 25
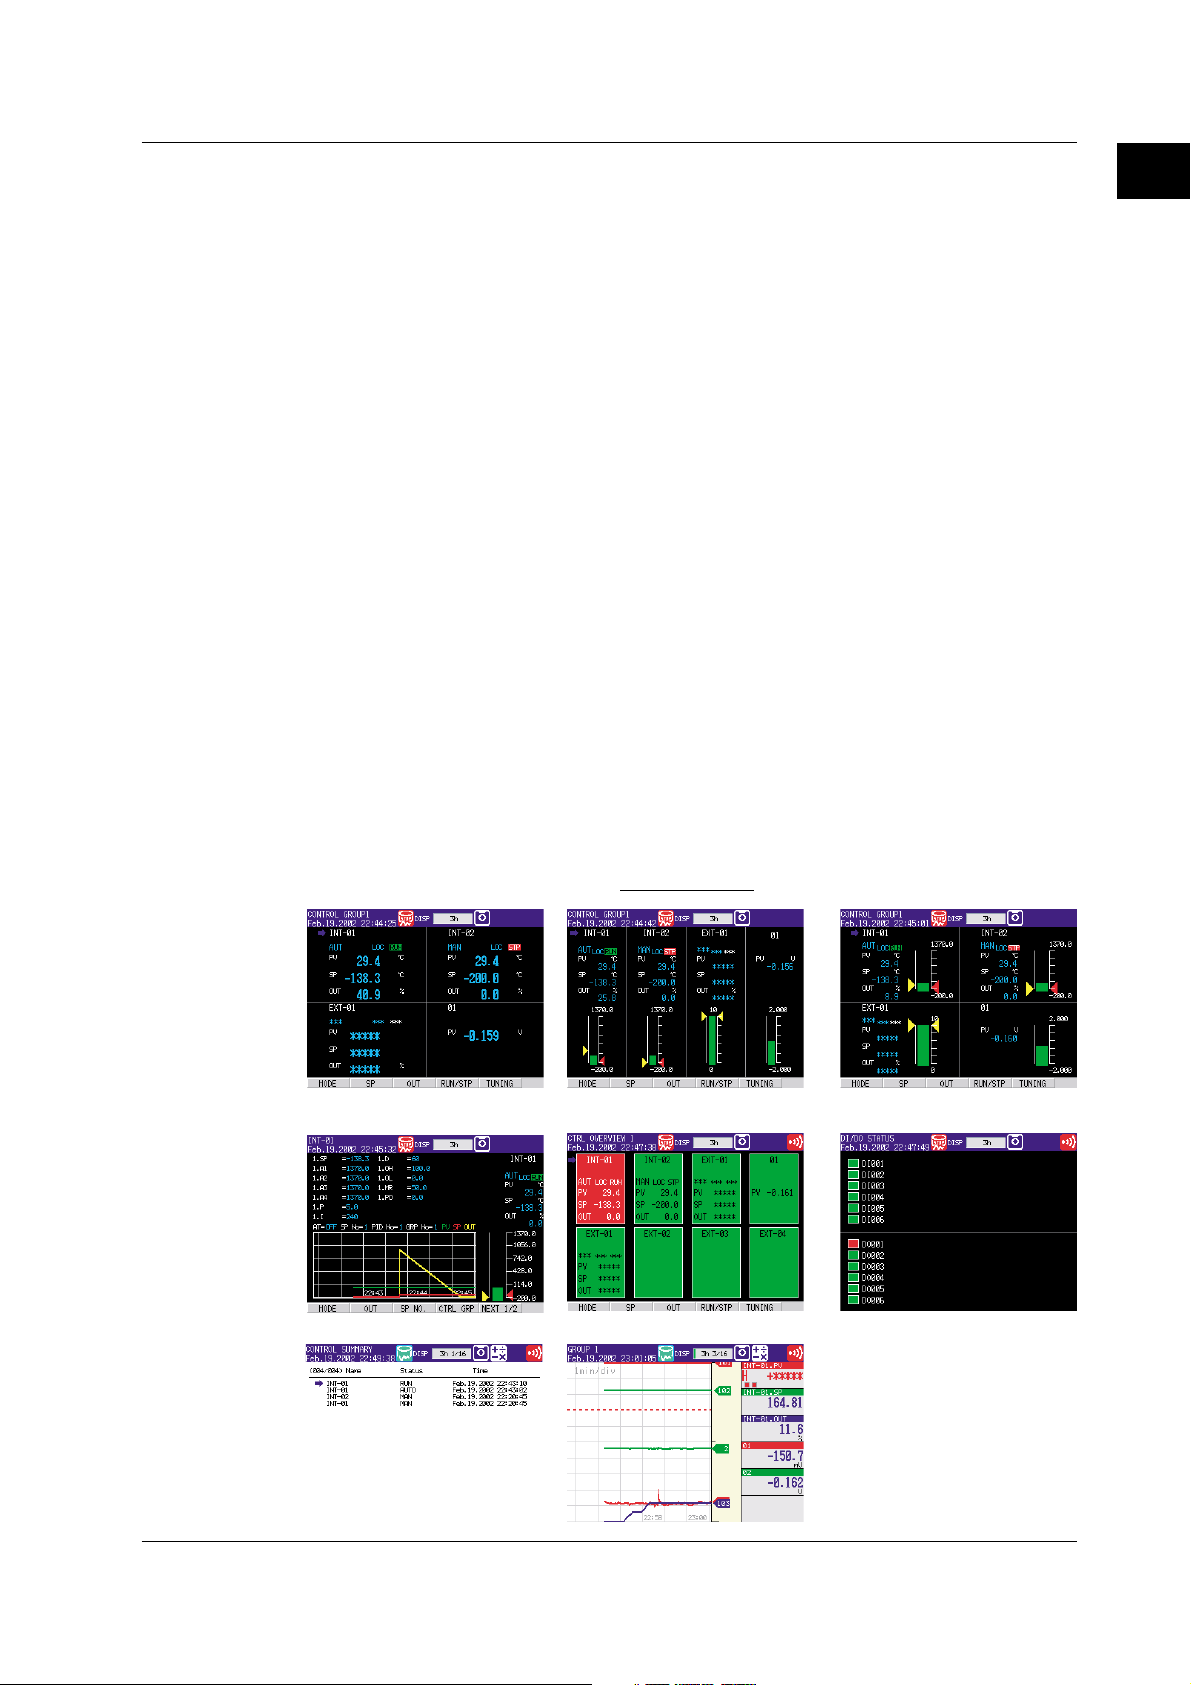
1.2 Control Function Overview
Control Operation Display
In operation mode, the following control operation displays can be shown.
• Control group display
This display is used to monitor the control status of multiple loops simultaneously
including external loops. You can select from three display styles as shown in the
display example in the figure below. If you include the measurement channels for the
measurement function in the group, you can also monitor the measured values on the
measurement channels at the same time on this display.
• Tuning display
This display is used to optimize (tune) the control parameters such as PID constants.
• Overview display
This display is used to monitor the alarm status of all control loops.
• DI/DO status display
Displays the ON/OFF status of the current contact input (DI) and contact output (DO).
• Control action summary display
Displays a log of control actions such as operation run/stop and auto/manual
operation switching.
On models with the program control function option, the following additional displays are
available: 1) the program operation display, which can show the pattern and current PV
accumulated on the screen during program operation and 2) the program event
summary display, which shows a log of time events and PV events that occurred during
program operation. Displays common with the measurement function include: 1) the alarm
summary display, which shows a log of alarm occurrence status and 2) the memory summary
display, which shows the file information of the internal memory. In addition, the values of PV,
SP, and OUT can be assigned to channels, and the trends of these channels can be displayed
along with the trends of measurement channels on the trend display of the measurement
function.
• Control group display
1
Explanation of Functions
Display Examples
IM 04L31A01-03E
• Tuning display
• Control operation summary display
Faceplate style Hybrid styleController style
• Overview display
• Trend display
• DI/DO status display
1-11
Page 26

1.2 Control Function Overview
Saving Data
Acquisition to the Internal Memory
Along with the measurement data, the data of SPs, PVs and OUT, and event information
for control are acquired to the internal memory.
Saving Data to the External Storage Medium
You can save the data acquired in the internal memory to an external storage medium
(floppy disk, Zip disk, or ATA flash memory card).
Floppy disk
Communications
CX
1
6
26
21
16
11
2
7
27
22
17
12
DISP
3
8
4
9
5
10
/ENTER
28
23
18
13
29
24
19
14
30
25
20
15
• Control setup data
• Measurement setup data
Zip disk
ATA flash memory card
• Measured data
The following communications functions are available. For a description on the handling
of the communications function and the software “DAQSTANDARD for CX” that comes
with the package, see the respective manuals.
Communications with Controllers
The CX1000 can communicate with UT Series Controllers made by Yokogawa M&C
Corporation to transmit/receive control parameters and receive PV data. Up to four
external loops can be constructed.
CX
1
6
26
21
16
11
2
7
27
22
17
12
DISP
3
8
4
9
5
10
/ENTER
28
23
18
13
29
24
19
14
30
25
20
15
Controllers
Up to four units (four loops)
Communications with PLCs
The CX1000 can carry out ladder communications between PLCs (sequencers).
PLCs (such as the FA-M3 by YOKOGAWA)
CX
1
6
26
21
16
11
2
7
27
22
17
12
DISP
3
8
4
9
5
10
/ENTER
28
23
18
13
29
24
19
14
30
25
20
15
CX
11
16
21
26
6
1
12
17
22
27
7
2
8
3
9
4
10
5
DISP
/ENTER
13
18
23
28
14
19
24
29
15
20
25
30
Up to 32 units
Communications with PCs
The CX1000 can communicate with PCs.
• Modbus master/slave
CX
1
6
26
21
16
11
2
7
27
22
17
12
DISP
3
8
4
9
5
10
/ENTER
28
23
18
13
29
24
19
14
15
30
25
20
PC
• Dedicated protocol communications
with the PC (Command communications)
• Display settings/data of the CX using
“DAQSTANDARD for CX”
1-12 IM 04L31A01-03E
Page 27

1.2 Control Function Overview
1.3 Basic Settings of Control
PID Group Number
You can set up to eight groups of control parameters (“PID parameters” on the setting
display) that you wish to change collectively through control. You set the number of
groups to be used from 1 to 8. For example, if you set a value of 4, the selectable PID
numbers will be 1 through 4. The parameters that are included in a single control
parameter group vary depending on the control method (“Control output” in the settings).
During PID control: SP, PID constant, output lower/upper limit, shutdown ON/OFF
(only when outputting 4-20 mA of current), manual reset, reverse/
direct, and preset output
During ON/OFF control: SP, relay hysteresis, reverse/direct, and preset output
Control Period
The following control periods can be selected:
250 ms (initial value), 500 ms, and 1 s.
The control period is common to all loops. When the A/D integral time is set to 100 ms,
the control period is fixed to 1 s.
The scan interval of control PV input is the same as the control period.
PID Selection Method (Zone PID ON/OFF)
Select either one from below. When program control is ON on models with the program
control option, the selection is between the segment PID method (zone PID OFF) and
the zone PID method.
• Target setpoint selection method (zone PID: OFF) (initial value)
In the target setpoint selection method, the operator can switch up to 8 SPs as
necessary. There are two methods in switching the SPs. One method is to specify
the SP number (SPs are registered to PID numbers (= SP numbers) along with PID
constants and other parameters) using keys on the front panel. The other is to use
external contact input or communications. The SP can be switched at any time.
During switching, the setpoint ramp-up-rate or setpoint ramp-down-rate setting is
activated. In addition, when a switch is made, control computation is performed using
the PID constant group that corresponds to the SP at that point.
PV
Rise according to
ramp-up setting
(No.1 PID)
the setpoint
SP1
Switch from SP1 to SP3 Switch from SP3 to SP1 Switch from SP1 to SP2
SP3
(No.3PID)
Fall according to
the setpoint
ramp-down setting
SP1
(No.1 PID)
1
Explanation of Functions
SPn: SP number
SP2
(No.2PID)
Rise according to the
setpoint ramp-up setting
Time
IM 04L31A01-03E
1-13
Page 28

1.3 Basic Settings of Control
• Zone PID method
In the zone PID method, the measurement span is divided into a maximum of seven zones
using reference points. The optimum PID constant is preassigned to each zone, and the
PID constant (in actuality, other control parameters that are registered using the PID
number are included) is automatically switched according to the PV.
The number of reference points that can be specified is “PID group number – 2.” As shown in
the figure below, if the PID group number is 7, the number of reference points is 5. If the
number of reference points is 5, there are 6 zones. For example, if zones 1 through 6
correspond to PID numbers 1 through 6 and if the PV is within the zones of reference points 3
and 4, the control parameters of PID number 4 are selected. The control parameters of PID
number 7, which cannot be assigned to a zone, are selected when the deviation between the
SP and PV becomes greater than the preset reference deviation.
Maximum value of
measurement span
Reference point 5
Reference point 4
Reference point 3
Reference point 2
Reference point 1
Minimum value of
measurement span
If the current PV here,
control using thePID
constant of No. 4.
Restart and Restart for Program Control
Select how the CX1000 is to behave when an extended power failure occurs during control
operation (power failure period of 5 s or more) and the power recovers.
• Continue (initial setting):
Continue the operation before the power failure occurred.
• Manual operation:
Start from the manual operation condition.
• Auto operation (only during fixed-point operation):
Auto operation by continuing the operation before the power failure occurred.
• Reset (only during program operation):
Stop the program operation.
Change in the
PV.
No.6 PID
No.5 PID
No.4 PID
No.3 PID
No.2 PID
No.1 PID
Note
If the duration of the power failure is less than or equal to 2 s (a short power disruption), the
operation before the disruption continues. If the duration is between 2 to 5 s, the behavior for a
short power disruption or an extended power failure is carried out depending on the condition.
Initial PID
Select whether the initial PID constant in PID parameter settings (see
optimized to temperature control, pressure control, or flow control. Below are the initial
values of PID constants.
Initial values for temperature: P = 5.0%, I = 240 s, and D = 60 s.
Initial values for pressure/flow: P = 120.0%, I = 20 s, and D = 0 s.
page 1-28
) is
Control Mode
The following three control modes are available. The mode is selected for each control loop.
• Single-loop control
Basic control consisting of a single system of controller CPU.
PV
PIDSP
OUT
1-14 IM 04L31A01-03E
Page 29
1.3 Basic Settings of Control
Process value = 1–
• Cascade control
Control consisting of two systems of controller CPUs that uses the primary control
output as the secondary control SP. Continuous PID control is only possible for
primary control.
PV2
PID
OUT
SP
PV1
PID
• Loop control with PV switching
Single-loop control that switches between two PV inputs (PV1 and PV2) according to
the following conditions.
PV1
PV2
PIDSP
OUT
Input Switching Condition ([Method] on the setting display)
• Auto switching according to the PV range ([Range] on the setting display)
Switches PV inputs (PV1 and PV2) automatically according to the preset “PV
switching low-limit” and “PV switching high-limit” as shown in the following figure.
However, PV1 must be less than PV2.
PV range high limit
PV switching high limit
PV switching low limit
PV range low limit
PV
The PV value is computed using the following equation when “PV switching lower limit
< PV1 ≤ PV switching upper limit” and “PV switching lower limit ≤ PV2 < PV switching
upper limit.”
PV input 1 – PV switching low limit
PV switching high limit – PV switching low limit
• Auto switching according to the PV switching upper limit ([PVHigh] on the setting display)
The preset “PV switching upper limit” and PV1 are compared. Auto switching is
performed according to the following conditions. The switching hysteresis is
approximately 0.5% of the PV range span.
When PV1 ≤ PV switching upper value: Switch to PV1
When PV1 > PV switching upper value: Switch to PV2
• Switching through control input ([Signal] on the setting display)
Input is switched using “PV switching (loops 1 and 2)” (see page 1-23) as follows:
Contact input is OFF: Switch to PV1. Contact input is ON: Switch to PV2.
PV2
Process value according
to the equation
PV1
× PV input 1+ × PV input 2
PV input 1 – PV switching low limit
PV switching high limit – PV switching low limit
1
Explanation of Functions
Program Control ON/OFF (only on models with the program control option)
Select whether to use the program control function. For a description on the settings for
program control, see
IM 04L31A01-03E
section 1.11, “Program Control Related Settings.”
1-15
Page 30
1.3 Basic Settings of Control
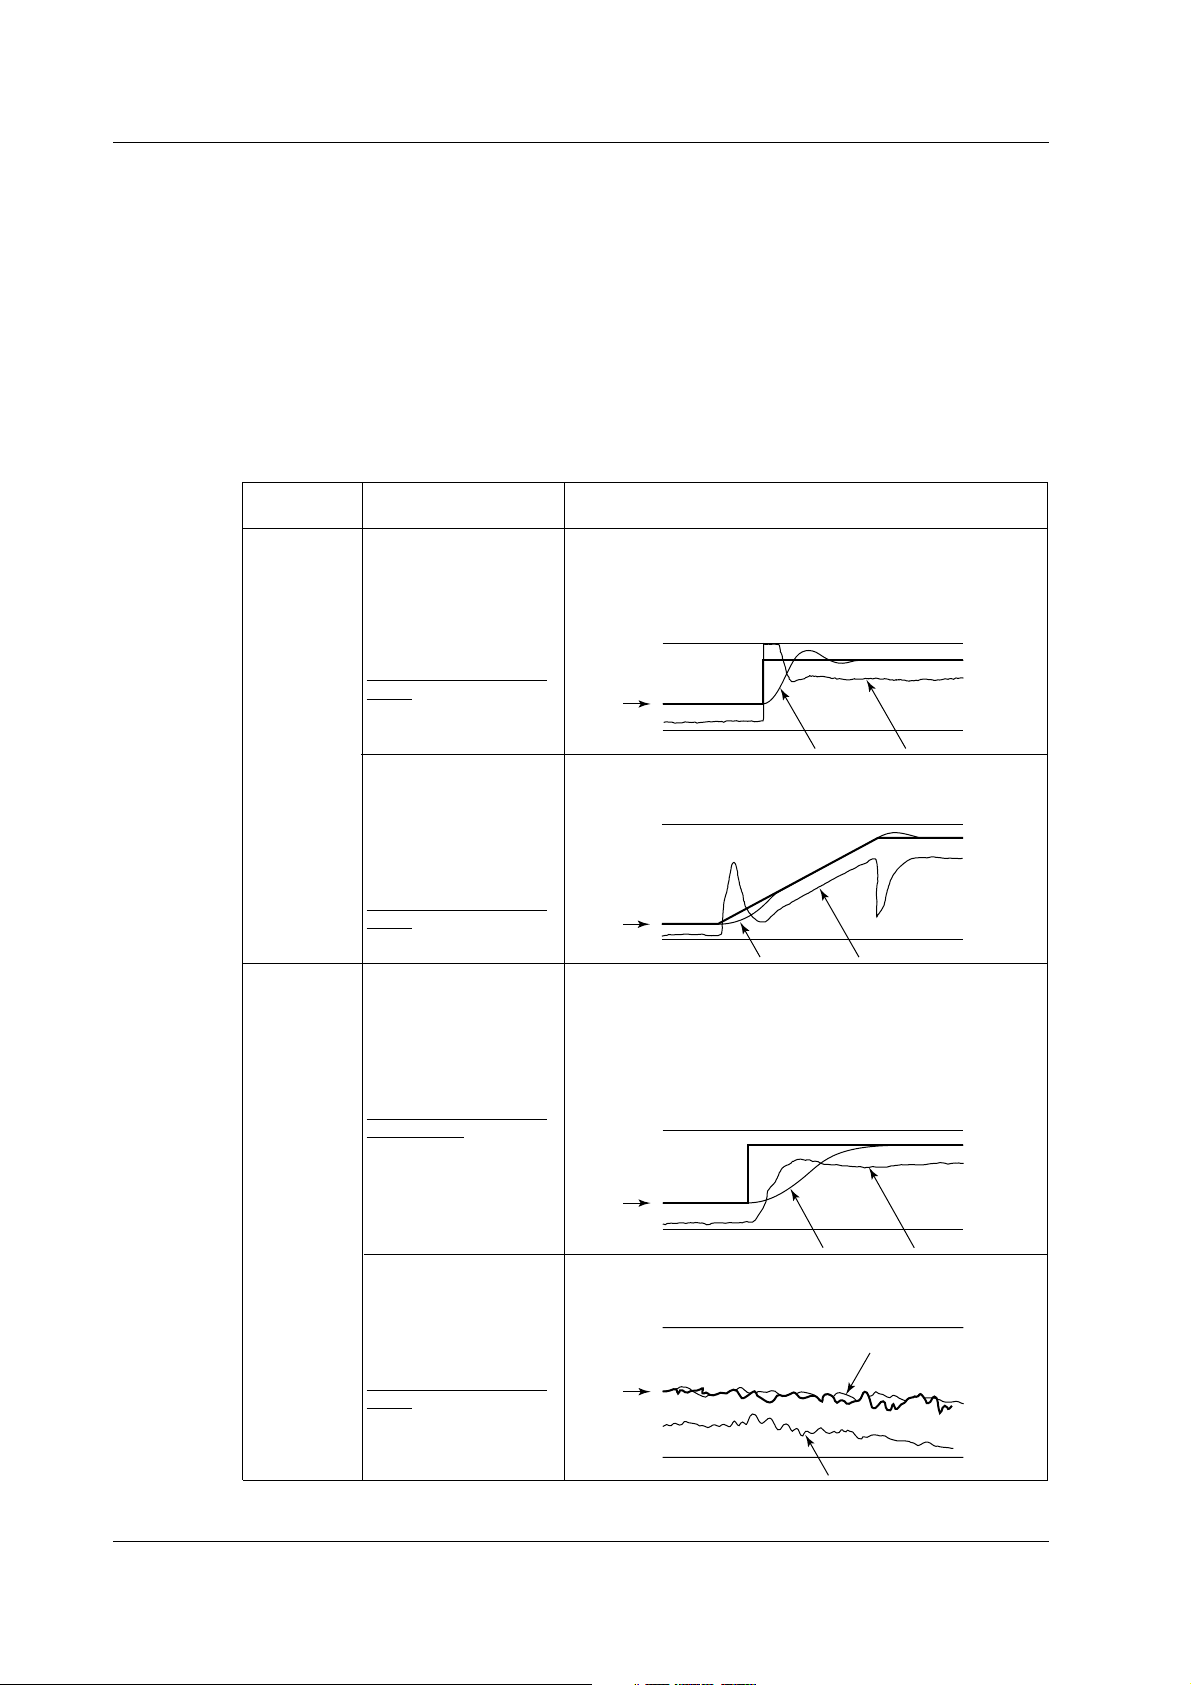
PID Control Mode
There are two PID control modes: standard PID control mode and fixed-point control mode. To
control the output so that the PV reaches the new SP quickly after the SP is changed, select
“standard PID control mode.” To perform a continuous fixed-point control, select “fixed-point
control.” As shown in the figure below, the control behavior varies depending on the selected
PID control mode. There are two control methods: PV derivative type PID control method and
deviation derivative type PID control method. As shown in the figure below, the control method is
automatically selected. In addition, the presence or absence of the control output bump at the
point of change of the SP is automatically selected. When performing program control in
standard PID control mode on models with the program control option, deviation derivative type
PID control is used during operation (except during hold and soak) and on the secondary loop of
cascade control. For all other cases, PV derivative type PID control is used.
Type of PID
Control Mode
Standard PID
control mode
(Initial value)
Control Method Description of the Control Operation
PV derivative type PID
During operation in local
mode or auto mode
(only the primary side
during cascade control)
With bumps in the control
output at the time the SP
is changed
Deviation derivative
type PID
During operation in remote
mode (secondary side
during cascade control)
Employs a PV derivative type PID so that the output reaches
the new SP quickly after the target setpoint is changed. In PV
derivative type PID, the proportional terms (P) that are
proportional to the deviation that occurred due to the SP change
are output immediately, forcing the process value to quickly reach
the new SP.
SP
PV
By applying the derivative term (D) against the deviation that
occurs due to minute changes in the program pattern, the process
value quickly tracks the program pattern.
OUT
Fixed-point
control mode
With bumps in the control
output at the time the SP
is changed
PV derivative type PID
During operation in local
mode or auto mode
(only the primary side
during cascade control)
Without bumps in the
control output at the time
the SP is changed
PV derivative type PID
During operation in remote
mode (secondary side
during cascade control)
With bumps in the control
output at the time the SP
is changed
SP
PV
Use this function on continuous fixed-point control, if you do not
wish to disturb the PV caused by the sensitive reaction of the
control output (OUT) at the time the SP is changed.
In the case of "PV derivative type PID + no control output bumps,
" the output value (OUT) does not drastically change at the time
the SP is changed. The deviation is gradually eliminated using
only the integral term (I) against the deviationthat occurs.
SP
Use this function on the secondary loop of cascade control.
A stable control output is achieved without sensitively reacting to
the output of the primary loop.
SP
PV
OUT
OUT
OUT
PV
1-16 IM 04L31A01-03E
Page 31

1.3 Basic Settings of Control
Control Output
Cycle Time
Select the type of control output from the following. The type can be selected for each loop.
• Time proportional PID relay contact output
• Time proportional PID voltage pulse output
• Current output (continuous PID control output)
• On/off control relay contact output
Time Proportional PID
The result of PID computation is output using a pulse width of an ON/OFF signal that is
proportional to the time. The pulse width is calculated using the following equation with
the cycle time (control output period, see next section) taken to be 100%.
Pulse width = Control output (%) × cycle time
You can select relay output or voltage pulse for the output type.
Current Output (Continuous PID Control Output)
The result of PID computation is output using a current (analog signal) that is
proportional to the computed PID value. There are four types of output current.
On/Off Control Relay Contact Output
The on and off signals are output using a relay according to the polarity of the deviation
between the SP and PV.
Set the cycle time (control output cycle) for the time proportional PID in the range of 1 s
to 1000 s. Setting a short cycle time enables precise control. However, the life of the
output relay and the input contact on the control element may be shortened, because the
number of ON/OFF operations increases. In general, the cycle time is set around 10 s to
30 s for relay output. You can select the cycle time for each loop.
1
Explanation of Functions
Ratio of the
ON time
Selecting the Analog Output
Select the type of output current when current output is used from the following:
4-20 mA, 0-20 mA, 20-4 mA, and 20-0 mA.
When the cycle time is of
medium length
When the cycle time
is short
0.0 50.0
Output display value
ON
OFF
When the cycle time is long
ON
OFF
ON
OFF
100.0
Cycle time
ON
OFF
IM 04L31A01-03E
1-17
Page 32

1.4 PV Input Related Settings
Input Range
Input Type
Select the input source for making input range related settings from the following. Select
“RemoteSP” when setting the remote input when you are performing remote/local
switching of the SP. When using program control, “RemoteSP” cannot be selected
because remote input is not possible.
• During single-loop control or cascade control: PV1/RemoteSP
• During loop control with PV switching: PV1/PV2/RemoteSP/PVrange
Set “process value 1” (PV1) and “process value 2” (PV2). “PVrange” is used for “loop
control with PV switching” when the input range of two PV inputs (PV1 and PV2) is
different and PV range conversion (see
range,” “PV upper-/lower-limits,” “unit,” and “PV switching lower/upper limits” (“PV lower-
limit” if the input switching method is “PV High”) are set in place of the following settings.
Measurement Mode
Select from the following according to the type of input.
TC (thermocouple), RTD (resistance temperature detector), scale (linear scale), and 1-5 V.
Select scale when scaling the input signal to values with an appropriate unit for the
application. If you select scale, set the lower and upper limits.
Type (setting only when measurement mode is set to “scale”)
Select the type of input signal from “Volt,” “TC” (thermocouple), and “RTD” (resistance
temperature detector.”
Range
Set the range (thermocouple or resistance temperature detector type) that matches the
input signal type. This setting determines the measurement range (measurable range).
• Thermocouple
R, S, B, K, E, J, T, N, W, L, U, PLATINEL, PR40-20, and W3Re/W25Re.
• Resistance temperature detector
Jpt100 and Pt100.
• Voltage
Standard signal: 1-5 V (when “measurement mode” is set to “1-5 V”)
Current voltage: 20 mV, 60 mV, 200 mV, 2 V, 6 V, 20 V, and 50 V.
Span
Set the “measurement span,” the actual range of control (upper limit and low limit), within
the minimum and maximum values of the measurement range.
Unit
You can enter the unit using up to 6 alphanumeric characters.
PV Correction
Input Filter
The input filter can be used to eliminate noise when harmonic noise is included in the PV input
such as in current signals and pressure signals. The input filter is first-order-lag computation. The
larger the time constant (parameter setting), the stronger the noise elimination function becomes.
The input filter is also used for the improvement of the controllability and for phase correction.
The time constant of the input filter can be changed during operation as an operation parameter.
Selectable range: OFF (no filter) or 1 to 120 s (initial value is OFF)
Raw input
Filter time constant:
small
Filter time constant:
page 1-21
large
) is to be performed. When set to “PV
1-18 IM 04L31A01-03E
Page 33

1.4 PV Input Related Settings
Bias
This function is used to add a constant value (bias value) to the PV and use the result in
the display of the PV and control.
PV input value
+
Bias value Process value in the instrument
=
This function can be used in a case when the PV is less than the true value by a
constant amount due to the physical circumstances of the detector. For example, the
atmospheric temperature inside a furnace can be measured and substituted for the
material temperature. This function can also be used to make minute adjustments when
the displayed value is within the allowable precision range but small deviation exists
between other instruments and you wish to align it.
Selectable range: –100.0% to 100.0% of the measurement span (the initial value is 0.0%)
Ten-segment Linearizer Biasing Function
This function is used when you wish to correct the input value due to the deterioration of
the sensor. In the ten-segment linearizer biasing function, the output value (b) is the
corrected value obtained by adding the bias at numerous arbitrary points (up to 11 points
can be specified) against the input value (a), as shown in the figure below. For
definitions of the engineering units (EU and EUS), see
appendix 8, “Explanation of
Engineering Units (EU and EUS).”
Selectable range of input values: EU (–5.0% to 105.0%) of the measurement span (the
initial value is 0.0%)
Selectable range of output values: EUS (–100.0% to 100.0%) of the measurement span
(the initial value is 0.0%)
1
Explanation of Functions
Output
(b)
Corrected value
(sum of the actual input
and the ten-segment
linearizer bias)
n.b4
n.a2 n.a4 Input
Actual input
Ten-segment linearizer bias
(a)
Ten-segment Linearizer Approximation
This function is used when the relationship between the input signal value and the value you wish
to measure is not linear such as the level meter and the volume of a spherical tank. In the tensegment linearizer approximation function, you can set the output value (b) to an
arbitrary value with respect to the input value (a) of an arbitrary point (up to 11 points can
be specified), as shown in the figure below. For definitions of the engineering units (EU
and EUS), see
appendix 8, “Explanation of Engineering Units (EU and EUS).”
Selectable range of input value: EU (–5.0% to 105.0%) of the measurement span (the
initial value is 0.0%)
Selectable range of output values: EU (–5.0% to 105.0%) of the measurement span (the
initial value is 0.0%)
IM 04L31A01-03E
1-19
Page 34

1.4 PV Input Related Settings
Output
(b)
Square-root Computation of PVs
The square-root function is used in the case such as when the differential pressure
signal of a restriction flowmeter such as an orifice or a nozzle is converted to a flow
signal. You can also set the low-signal cutoff point for the square-root computation.
Square-root computation ON/OFF setting: ON or OFF (the initial value is 1.0%)
Selectable range of the low-signal cutoff of the analog input: 0.0 to 5.0% (the initial value
is OFF)
100.0%
Ten-segment linearizer
approximation
Input
(a)
Slope: 1
Low-signal
cutoff point
(0.0 to 5.0%)
Input 100.0%0.0%
PV Range Conversion (only during loop control with PV switching)
The PV range conversion is a function used to determine the PV range of the control
function when the measurement range of the two input signal is different for the loop
control with PV switching. For example, if the input range of the first input is 0 °C to 500
°C and the input range of the second input is 300 °C to 1000 °C, the PV range
conversion is used to convert the PV range of the control function to 0 °C to 1000 °C.
PV range
PV range of PV input 2
PV range of
PV input 1
0 300 500 1000 °C
1-20 IM 04L31A01-03E
Page 35

1.4 PV Input Related Settings
PV Tracking ON/OFF
The PV tracking function is used to prevent radical changes in the PV.
When the PV tracking function is enabled (ON), the SP is forced to match the PV once in
the following cases.
• When powering up.
• When switching from manual (MAN) operation mode to auto (AUTO) operation mode.
• When switching from operation stop to operation run.
• When switching the SP number.
The SP is matched against the PV once, and then returns to the original SP according to
the “target setpoint ramp-rate (rate of change)” that is specified separately. When using
the PV tracking function, make sure to set the SP ramp-rate (rate of change). The ramprate is 0 when it is OFF. Consequently, the PV tracking function does not operate in this
case. PV tracking function ON/OFF setting: ON or OFF (the initial value is OFF)
• When PV tracking is OFF
SP
PV
1
Explanation of Functions
MAN AUTO
Mode switching
• When PV tracking is ON
SP
PV
MAN AUTO
Mode switching
Burnout
When the PV input is a thermocouple or standard signal, a burnout action can be
specified. When a burnout is detected, the PV is fixed to positive overrange (when the
burnout detection action is set to “UP”) or negative overrange (when the burnout
detection action is set to “DOWN”), and the control output is set to preset output.
Reference Junction Compensation
You can select whether to use the internal reference junction compensation function of
the CX1000 or an external reference junction compensation function. When using an
external reference junction compensation, set an appropriate reference junction
compensation voltage. For example, if the reference junction temperature of the external
reference compensation is T
thermoelectromotive force of the 0-°C reference of T0 °C.
Time
Follows the target setpoint
ramp-rate
Time
°C, set the reference compensation junction voltage to the
0
IM 04L31A01-03E
1-21
Page 36

1.5 Contact Input/Output Related Settings
Contact Input/Output Terminal
The contact signal is input or output from the control output terminal block indicated in
the following figure.
Control output
terminal block
As shown in the following figure, contact input terminals (DIGITAL IN) and contact output
terminals (DIGITAL OUT) are arranged on the control output terminal block. There are
two types of contact outputs: relay output and transistor output. For the connection
procedure of the signal wires, see
Relay contact output
section 2.3, “Wiring”
Contact inputTransistor output
.
Contact Input
LOOP2
NO
NC
C
CTRL OUT
LOOP1
NO
NC
C
DIGITAL OUT
2
NO
C
1
NO
C
LOOP2
mA
PULS
C
CTRL OUT
LOOP1
mA
PULS
DIGITAL OUT
5
6
CC
DIGITAL IN
3
4
4
C
1
5
2
6
3
Prescribed operation such as stop/run operation can be performed using contact inputs.
There are six contact inputs, and numbers DI001 to DI006 are used to select them.
1-22 IM 04L31A01-03E
Page 37

1.5 Contact Input/Output Related Settings
Contact Input Information Registration
You can select the information that is registered to the contact input from the following.
Name of Action Detection Action
Stop all loop control operation Trigger Stops the operation of all internal loops.
Start all loop control operation Trigger Starts the operation of all internal loops.
Stop/run control (loops 1 and 2) Edge Starts/stops the operation of each internal loop.
Remote/local (loops 1 and 2) Edge Switches the local/remote operation modes of each
internal loop.
Auto/Man operation Edge Switches the auto/manual operation modes of each
(loops 1 and 2) internal loop.
Cascade switching Trigger Switches the internal loops 1-2 to cascade operation.
Auto operation Trigger Switches the internal loops 1-2 to auto operation.
Manual operation Trigger Switches the internal loops 1-2 to manual operation.
Set target setpoint bits 0 to 3 Trigger Switches the SP to the specified binary value.
Start program operation Trigger Starts the program operation (only on models with the
program control option).
Stop program operation Trigger Stops the program operation (only on models with the
program control option).
Hold Trigger Holds the program operation (only on models with the
program control option).
Advance Trigger Advances the program operation (only on models with the
program control option).
Set pattern number 0 to 4 bits Trigger Switches the program pattern number to the specified
binary value (only models with the program control option).
Input switch contact Edge Switches the PV input (PV1, PV2) of each internal
(loops 1 and 2) loop during loop control with PV input switching.
Start/Stop Edge Starts/stops data acquisition to the internal memory.
Trigger Trigger Trigger used to start acquiring event data to the
internal memory (valid only when “event data” is
specified to be acquired to the internal memory and
the trigger used to start the acquisition is set to
“external trigger”).
Alarm ACK Trigger Clears alarm display/relay output (valid only when the
alarm indicator or output relay behavior is set to “hold”).
Time adj Trigger Adjusts the internal clock to the nearest hour.
Math Edge Starts/stops computation (only on models with the
computation function (/M1)).
Math reset Trigger Resets computed data of measurement channels
(Resets the computed value to 0. Only when
computation is stopped on models with the
computation function option).
Manual sample Trigger Acquires instantaneous values of all channels to the
internal memory.
Load setup data 1 to 3 Trigger Loads the setup data file saved to the external storage
medium.
Messages 1 to 8 Trigger Displays message 1 to 8 on the trend display and
stores the message to the internal memory.
Snapshot Trigger Saves the screen image data to the external storage
medium.
1
Explanation of Functions
IM 04L31A01-03E
Method of Detecting Contact Inputs
The above operations are carried out on the rising or falling edge of the contact signal
(edge) or the ON signal lasting at least 250 ms (trigger). The remote signal rises when
the contact switches from “open to closed” and falls when the contact switches from
“closed to open.” For open collector signals, the remote signal rises when the collector
signal (voltage level of the input terminal) goes from “high to low” and falls when the
collector signal goes “low to high.”
Rising and falling edges
Rising
Falling
Trigger
250 ms or more
1-23
Page 38

1.5 Contact Input/Output Related Settings
Note
• For a description on how to register contact inputs, see “Setup Items” of
“Basic Control Settings > Contact Input-Registration.”
• On models with the measurement alarm option terminal block /A6R or /A4FR, the actions from
“Start/stop” to “Snapshot” can also be assigned to the measurement remote input. For a
description on the assignment of actions to the measurement remote input, see “Measurement
Remote Input” on
• If the same action is performed using keys of the CX1000, communications, and contact
input, the newest operation/input is valid regardless of the method. This is also true
between contact inputs and measurement remote inputs.
page 1-94
.
Contact Output (FAIL Output, Self Diagnosis Output, and Event Output)
Output Terminal Selection
There are six contact outputs, and numbers DO001 to DO006 are used to select them.
Setting the Relay Action/Hold
Set whether to energize or de-energize the output relay when outputting failure detection
found by FAIL or self diagnosis and events. In addition, set whether the relay output is
turned OFF when the condition is appropriate for releasing the output, or hold the relay
output until an alarm ACK operation is carried out. In the settings, select the behavior
from “deenergize/hold,” “deenergize/nonhold,” “energize/hold,” and “energize/non-hold.”
In the case of a transistor (open-collector) output, the signal is switched from Off to On
during output for an energize setting and from On to Off during output for a de-energize
setting. These relay actions are the same as the alarm output relay actions of the
measurement function. For details on energize/de-energize and hold/nonhold, see
“Energized/De-energized Operation of Alarm Output Relays” and “Hold/Non-hold
Operation of Alarm Output Relays” on page 1-60.
FAIL Output
This is the setting for the function that outputs a relay contact signal when a failure is
detected in the CX1000 CPU. When FAIL output is turned ON, “DO001” of the control
output terminal block is automatically assigned to “de-energized/hon-hold.”
Fault Diagnosis Output
This is the setting for the function that outputs a relay contact signal when an input
burnout, A/D converter failure, or reference junction compensation failure occurs.
When fault diagnosis output is turned ON, “DO002” of the control output terminal block is
automatically assigned to “de-energized/hon-hold.”
Event Output
On models with the program control option, PV events and time events can be assigned
to contact outputs. You can select the output terminal for PV events and time events
from DO001 to DO006.
section 4.3,
1-24 IM 04L31A01-03E
Page 39
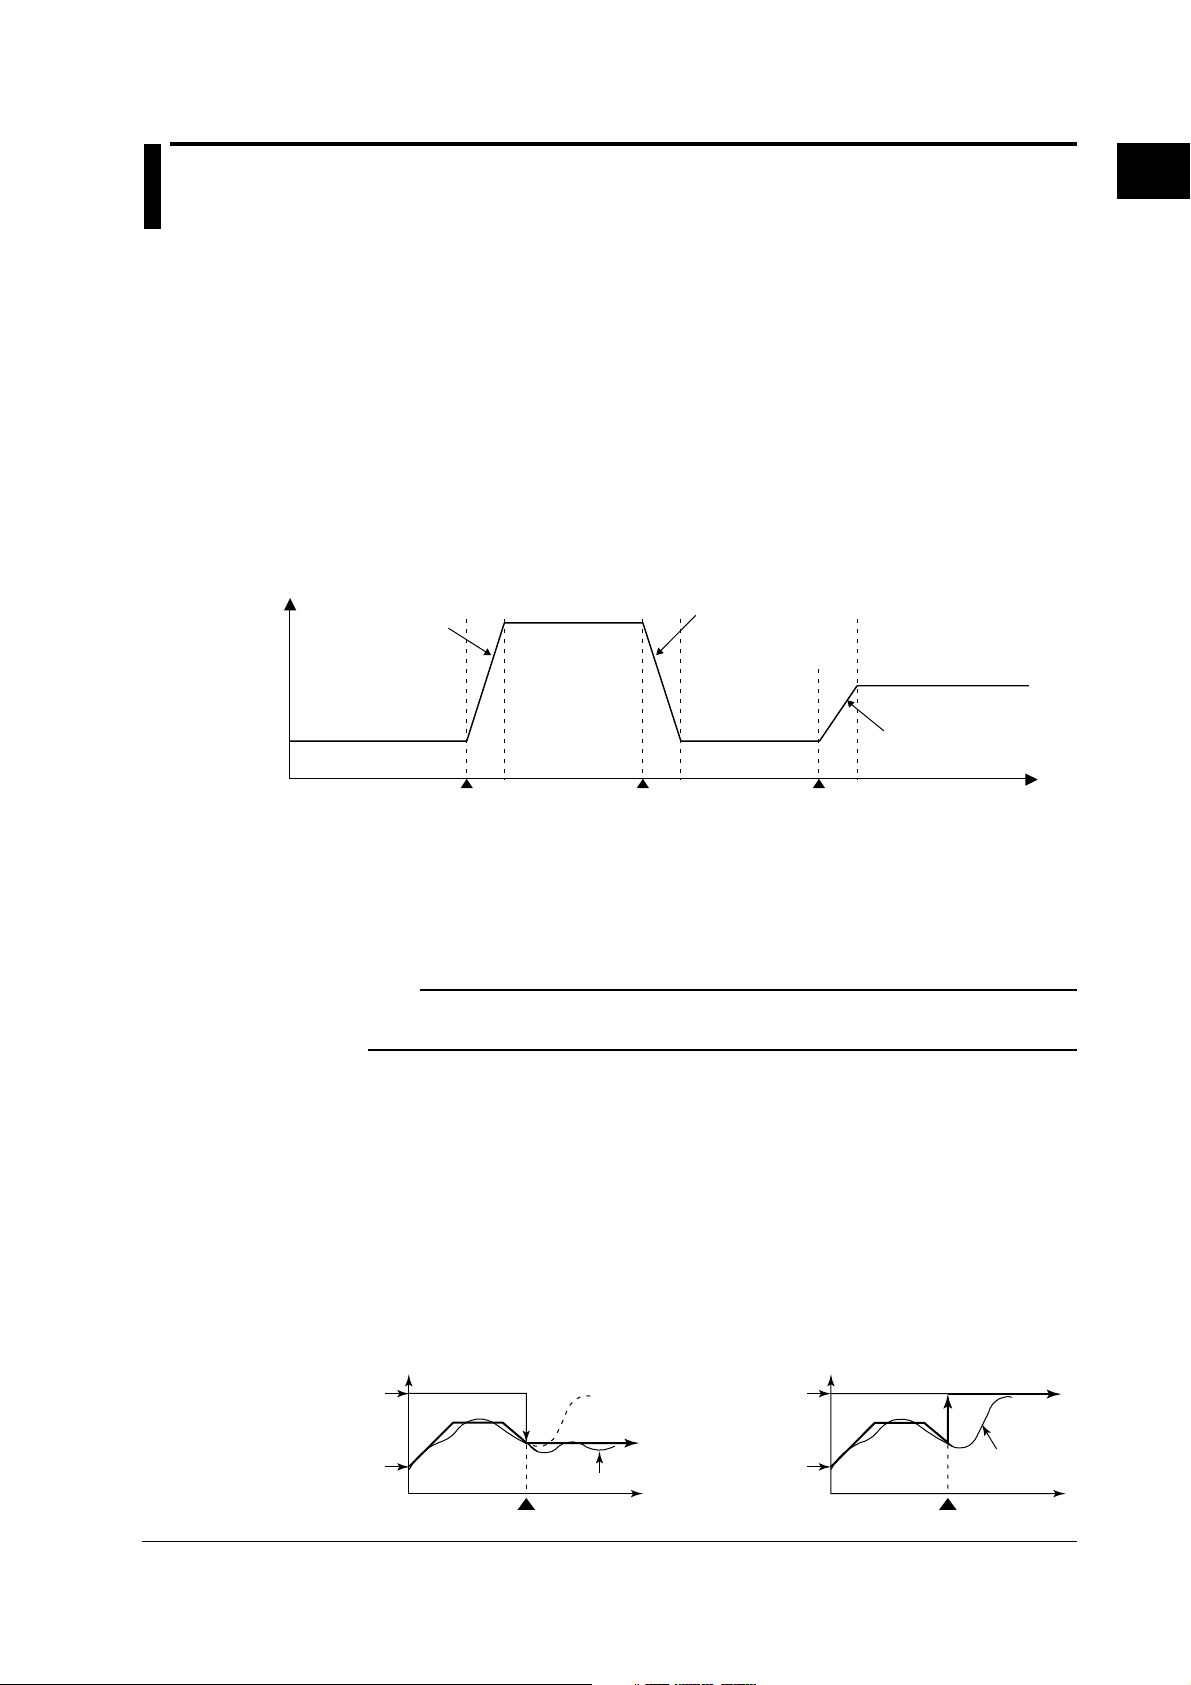
1.6 Target Setpoint Related Settings
Setting the SP
Set the SP, as one of the PID parameters, for each PID number (1 to 8) in the range of
EU (0.0 to 100.0% of the measurement span). The PID number in which the SP has
been registered is handled as “SP number” when specifying the setpoint and for other
purposes.
SP Assignment
The SP is specified using the SP number. The operation at the time of SP number
switching varies depending on the PID selection method.
• When target setpoint selection method is selected
The SP number and PID number are synchronized. By switching the SP number, the
control parameters (“PID parameters” in the settings) such as the SP and the PID
constant are changed to the control parameters registered to the corresponding PID
number.
PV
Rise according to
SP1
(
No.1PID
the setpoint
ramp-up setting
)
Switch from SP1 to SP3 Switch from SP3 to SP1 Switch from SP1 to SP2
SP3
(
No.3PID
Fall according to
)
the setpoint
ramp-down setting
SP1
(
No.1PID
)
SPn: SP number
SP2
(
No.2PID
Rise according to
the setpoint
ramp-up setting
1
Explanation of Functions
)
Time
• When zone PID method is selected
The assignment of the SP number and the assignment of the PID number are not
synchronized.
A PID number (group number of the PID parameter) is registered for each zone
beforehand. When the PV changes and becomes a value of a different zone, the PID
number automatically changes, but the SP number does not switch.
Note
The value of control alarms corresponds to the SP number (see
number is changed, the alarm value also changes accordingly.
Selection of the SP Number to Be Switched Using Contact Input
Set loop 1 and 2 for switching the SP number using the contact input “Set target setpoint
bits 0 to 3” (see
page 1-23
).
Target Setpoint Tracking
The CX1000 can perform operation according to the remote SP (remote input) received from an
external source. In this case, it is foreseeable that the output value will drastically change when
switching from a remote operation condition to a local operation (operation according to the
internal SP of the CX1000) condition or switching from program operation to local operation. To
prevent the output value from drastically changing, the CX1000 has a function used to track the
output from the remote SP to the local SP. The operation image of target setpoint tracking is
shown below.
• When target setpoint tracking is enabled
Local SP
• When target setpoint tracking is disabled
Local SP
section 4.9
). If the SP
IM 04L31A01-03E
Remote SP
PV
Switch from remote to local mode
Remote SP
PV
Switch from remote to local mode
TimeTime
1-25
Page 40

1.6 Target Setpoint Related Settings
Setpoint Limiter
This function is used to limit the range in which the SP is to change. The value is
specified using EU (0.0% to 100.0%). For a definition of the engineering unit (EUS), see
appendix 8, “Explanation of Engineering Units (EU and EUS).”
When not in program operation: Limit the change in the SP.
When in program operation: Limit the program setpoint.
Ramp-rate Setting during Target Setpoint Switching
When you do not want the SP to change rapidly or when you wish to change the SP at a
constant velocity ramp-rate, you can set the velocity ramp-rate (SP ramp-up rate or SP
ramp-down rate) for raising or lowering the SP. The specified velocity ramp-rate
functions in the following cases.
• When the SP is changed.
• When the SP number is changed.
• When the CX1000 is powered up (or recovers after a power failure).
The SP changes according to the specified ramp-rate from the PV to the SP.
• When the CX1000 is switched from manual operation to auto operation.
The SP changes according to the specified ramp-rate from the PV to the SP.
• When the SP is changed
SP (old)
• When the SP number is changed
SP 2
• At the time of power-up (or recovery
after power failure) or when manual/auto
operation is switched
Input range
SP
SP (new)
SP change
RSP Input
Preset ramp-rate
Time
The following figure shows an example in which the ramp-up rate is set to 70 (°C/minute)
and the CX1000 is operating at SP 1 = 500 °C and a switch is made to SP 2 = 640 °C.
SP 2 = 640°C
SP1 = 500°C
In addition to the value specified on the CX1000, the value determined from the analog signal
that is input to the RSP terminal of the control input terminal block can be used as the SP. The
input setting for the remote input analog signal is carried out in the same fashion as the input
setting for the PV input (see
remote input, select [REMOTE] through the local/remote switching operation on the operation
display. The switching operation can also be carried out using the contact input (see
“Contact Input/Output Related Settings”
Note
SP 1
SP switching
SP 1
Temperature difference:
140°C
Preset ramp-rate
PV
Time
SP switching
SP 2
Temperature rise time:
2 minutes
section 1.4, “PV Input Related Settings”
Preset ramp-rate
Time
Power-up or manual/auto switching
70°C/minute
). When using the SP of the
section 1.5,
).
The remote input function can be used only when program control is not used. To use this
function, the program control ON/OFF setting (setting available only on models with the
program control option) must be set to [OFF] and “[Basic Control Settings] > [Contact Input
Registration] > [Remote Input Selection]” must be set to [REMOTE].
1-26 IM 04L31A01-03E
Page 41

1.7 PID Parameter Settings
PID Number
PID parameter group number. The PID number can be set for each loop. When the PID
group number setting is “8”, you can select the PID number from 1 through 8. However,
if the PID group number is set to a smaller number, the maximum selectable PID number
is decreased accordingly.
Note
• The parameters that are registered to a single PID number include the PID constant,
output lower/upper limit, control action method, preset output value, shutdown function
ON/OFF, and manual reset value.
• In the zone PID method, a single PID number is assigned to each zone (zone specified by
reference points 5 and 6 is assigned a PID number of 6, for example). When the zone
changes, the parameter switches to the control parameters assigned to the PID number,
and the output is controlled accordingly.
PID Number Assignment
The PID number assignment operation varies depending on the PID selection method.
• When using the target setpoint selection method
The SP number and PID number are synchronized. By switching the SP number, the control
parameters (“PID parameters” in the settings) such as the SP and the PID constant are
changed to the control parameters registered to the corresponding PID number.
• When using the zone PID method
PID numbers are assigned to each zone beforehand. When the PV changes and
becomes a value of a different zone, the output is controlled automatically using the
PID parameters of the PID number that is assigned to that zone. The following
settings are required when using this method.
Reference Points
As shown in the following figure, reference points 1 to 6 (up to 7 zones) are specified to divide the
measurement span into zones. The number of reference points that can be specified is “PID
group number – 2.” As shown in the following figure, if the PID group number is 7, the number of
reference points is 5. If the number of reference points is 5, there are 6 zones.
Maximum value of
measurement span
Reference point 6
Reference point 5
Reference point 4
Reference point 3
Reference point 2
Reference point 1
Minimum value of
measurement span
If the current PV is here, PID
constant of PID No. 5 is used
for control.
Change in the
PV.
1
Explanation of Functions
No.7 PID
No.6 PID
No.5 PID
No.4 PID
No.3 PID
No.2 PID
No.1 PID
IM 04L31A01-03E
Switching Hysteresis
You can set the hysteresis used in the zone switching in EUS (0.0% to 10.0%) of the
measurement span. The hysteresis is initially set to 0.5% of the measurement span.
PV
Reference
point 1
No.1PID
No.2PID No.1PID
Hysteresis width
No.2PID
1-27
Page 42

1.7 PID Parameter Settings
Maximum value
of measurement span
Reference
point 2
Reference
point 1
Minimum value
of measurement span
PID Constant
Control Output Limiter
Reference Deviation
During control operation, the operation can be switched automatically to a preset PID
constant (PID constant with the largest PID number. For example, if the PID group
number is 8, the PID constant of PID number 8.) when the deviation between the SP and
the PV exceeds the “reference deviation” setting. For example, when the deviation is
large, you can increase the proportional gain (decrease the proportional band) to make
the output reach the SP quickly. The switching of the PID constant by the reference
deviation has precedence over the switching of the PID constant by the zone PID. When
the actual deviation becomes smaller than the “reference deviation” setting, the CX1000
returns to the operation using the PID constant assigned to the zone corresponding to
the PV at that point.
PV
Reference deviation value
Reference deviation value
If the PID group number is 8 and
the PV exceeds the reference
deviation value, the operation
switches to the PID constant of
PID number 8 regardless of the zone.
No.1 PID
SP
No.2 PID No.8 PID
Proportional Band (P)
The proportional band is specified in the range of 0.1 to 999.9% of the measurement span.
Integral Time (I)
The integral time is set in the range of 0 to 6000 s.
Derivative Time (D)
The derivative time is set in the range of 0 to 6000 s.
The control output limiter is a function that allows the upper and lower limits of the
operation range of the control output (output limiter) regardless of operation mode.
Selectable range of upper/lower limits: –5.0% to 105.0% (where upper limit > lower limit)
105.0%
Upper limit of output
Actual output from the terminal
Actual output
Lower limit of output
Variable range
Lower limit of limiter Upper limit of limiter
0%
–5.0% 105.0%
Original variable range
Selectable range: –5.0% ≤ lower limit of limiter < Upper limit of limiter ≤ 105.0%
change range
1-28 IM 04L31A01-03E
Page 43

1.7 PID Parameter Settings
Shutdown Function ON/FF (can be specified only during manual mode using 4- to 20mA current output)
The shutdown function closes the control value fully (set the output to 0) exceeding the
dead band of the control valve positioner. When this function is turned ON, the control
output is set to 0 mA if the manual control output becomes –5.0%.
Manipulated
output
20.0 mA
–5.0%
4.0 mA
3.2 mA
0.0 mA
100.0%
Output
display value
Note
The “output high-limit alarm” is not activated even if the control output becomes 0 mA due to
shutdown.
Manual Reset Value (valid only when the integral action is Off)
The manual reset value is the output value when the PV is equal to the SP. For example, if
the manual reset value is set to 50%, the output value is set to 50% when PV = SP.
Selectable range of manual reset value: –5.0 to 105.0%
1
Explanation of Functions
Control Direction
Condition
ON/OFF output
Current output
PV time-proportional
output
Output change direction
for the 4-20 mA case
The control action direction defines the direction (increase or decrease) in which the
control output value changes according to the polarity of the deviation between the SP
and the PV. In reverse action (factory default setting), the control output value
decreases when the PV is greater than the SP and vice versa. The control output is
varied using direct control or reverse control specified beforehand in sync with the
deviation between the SP and the PV at that point. Direct action and reverse action can
be switched in the middle of operation.
Reverse action Direct action
PV>SP
OFF
Current decrease
ON time decrease
20 mA
(Increase)
↑
Output
value
↓
(Decrease)
4mA
Minimum value
(PV is low)
PV<SP
ON
Current increase
ON time increase
SP
Maximum value
(PV is high)
PV
PV>SP
ON
Current increase
ON time increase
20 mA
(Increase)
↑
Output
value
↓
(Decrease)
4mA
Minimum value
(PV is low)
PV<SP
OFF
Current decrease
ON time decrease
SP
PV
Maximum value
(PV is high)
IM 04L31A01-03E
1-29
Page 44

1.7 PID Parameter Settings
Preset Output
The preset output function outputs a constant value (preset output value) independently
from the control output value present up to that point when the following conditions
occur.
• When an input burnout occurs during operation in auto mode or cascade mode.
• When a failure occurs in the A/D converter during operation in auto mode or cascade
mode.
• When the operation of the CX1000 is switched from run to stop.
The initial preset output value is set to 0.0%. However, the preset output value can be
set to a value in the range of –5.0 to 105.0% regardless of the high and low limits of the
output limiter.
Note
When setting (changing) the preset output value, presume the case when the preset output is
actually used, check the appropriate output value, and set the value. After confirmation,
change the preset output only when it is necessary.
1-30 IM 04L31A01-03E
Page 45
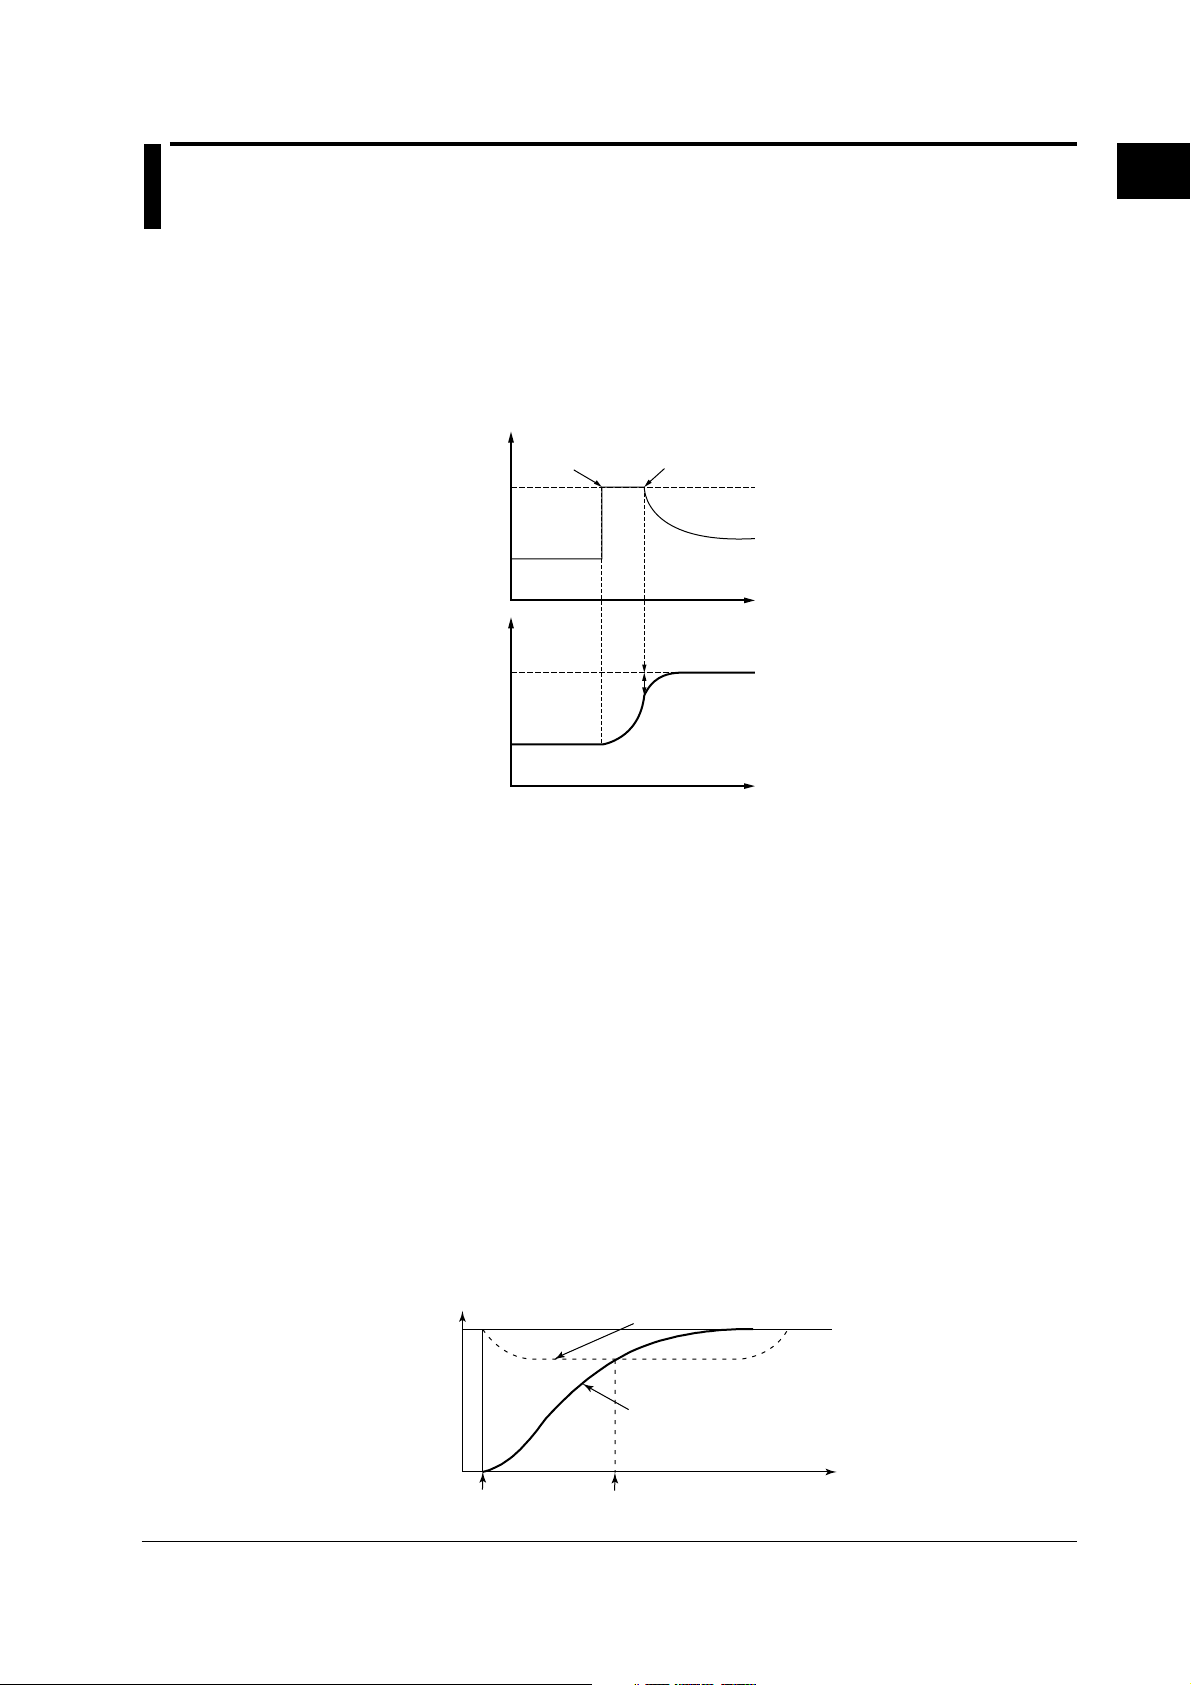
1.8 Control Output Suppression Settings
Anti-Reset Windup (Over-Integration Prevention)
There are certain cases in which a large deviation between the SP and PV is present for
an extended time such as when control operation is started. In such cases, the control
output may reach the high limit of the output limiter and become saturated due to the
integral action. In the end, an overshoot may occur. To prevent this from happening, the
anti-reset windup function is used to pause the integral action when the manipulated
output reaches the high limit of the output limiter.
100%
Upper limit of the
output limiter
Stop PID
computation
Output
value
Start PID
computation
1
Explanation of Functions
The function can be set automatically or manually. When manually setting the function,
the point at which the integral computation is resumed is set in terms of a deviation width
(%). The deviation width is derived using the following equation.
Deviation width (%) = |PV – SP|/proportional band × 100
Selectable range of deviation width: 50.0 to 200.0%
Control Output Suppression
You can use the overshoot suppressing function that uses fuzzy logic. The overshoot
suppression function works only during PID control when all PID constants are specified.
When the overshoot suppression function is used, the deviation is monitored to detect
the danger of overshooting. If danger is detected, the SP is automatically changed to a
slightly lower tentative value referred to as the “auxiliary SP”, and the control continues.
Then, when the PV enters a range in which overshooting is no longer a danger, the auxiliary SP
is gradually returned to the original SP.
The following cases are examples in which this function is effective.
• When you wish to suppress overshooting.
• When you wish to shorten the rise time.
• When load fluctuation is frequent
• When the setpoint is changed frequently.
Original SP
SP
0
PV
Auxiliary SP
→Time
→Time
IM 04L31A01-03E
PV
Control output
suppression function ON
PV
Time
Start fuzzy logic
1-31
Page 46

1.8 Control Output Suppression Settings
Output Velocity Limiter
This function is used to prevent radical changes in the control output to protect the
control element and object of control. Since this function negates the derivative action,
use caution when using this function on derivative type control.
Selectable range of velocity: 0.1 or 100.0%/s
1-32 IM 04L31A01-03E
Page 47
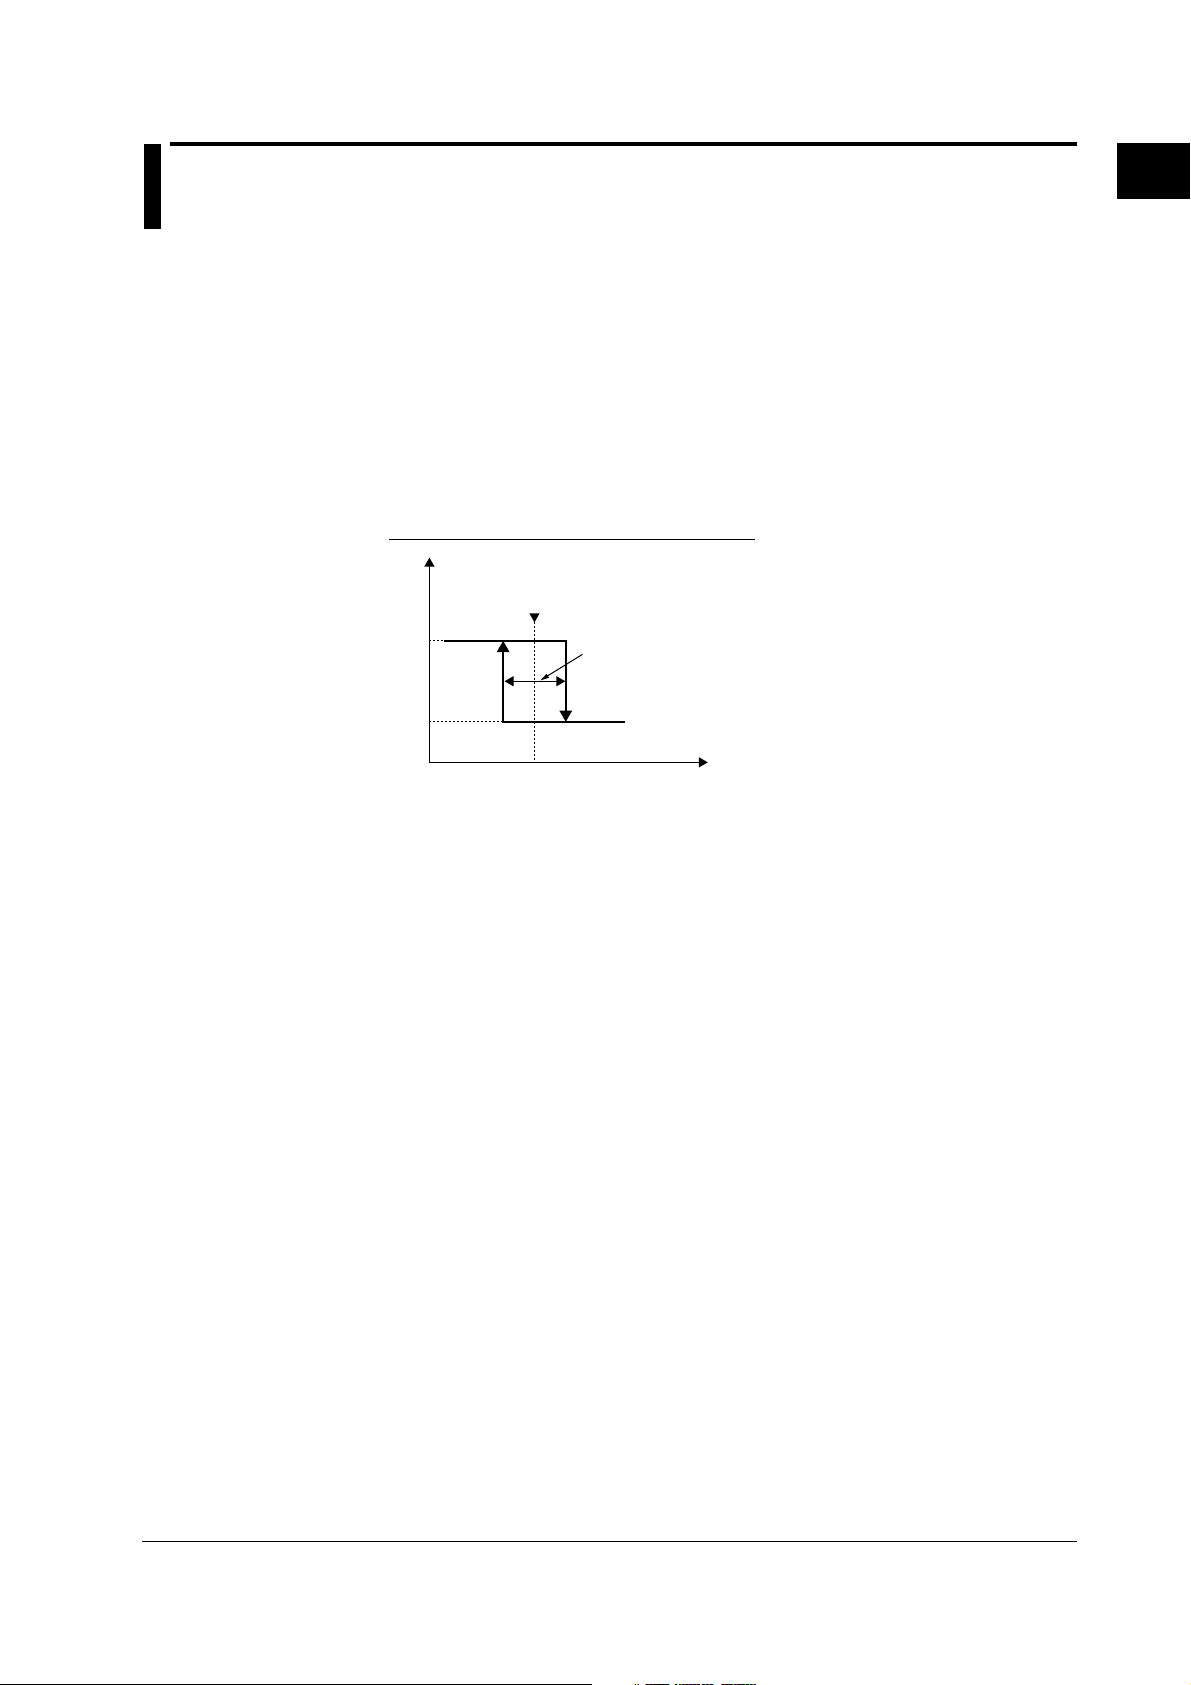
1.9 Settings for ON/OFF Control
Target Setpoint
The target setpoint (SP) is set on the PID Parameter setting display (see
(0.0 to 100.0% of the measurement span) in the same fashion as the PID control. On the
PID parameter setting display, you select a PID number in the range of 1 to 8 and register
one SP for each PID parameter as with other parameters. However, in ON/OFF control,
the PID number functions as a SP number.
Relay Hysteresis
In ON/OFF control output, you can set hysteresis to prevent chattering. The hysteresis
is set using the setpoint (0.0 to 100.0%) and the hysteresis activation position (center,
low limit, and high limit).
When the activation position setting is “Center”
page 4-23
1
Explanation of Functions
) in EU
Output
OFF
ON/OFF action point
(Target setpoint)
ON
Hysteresis
Settings of Other Control Parameters
The following control parameters are common with PID control.
• Control action direction
• Preset output
• Control alarm mode
• SP tracking
• PV tracking
• Setpoint limiter
• Target setpoint ramp-rate setting
Switching Control Parameters by PV Zones
When Zone PID is turned ON, the following control parameters can be switched
according to the specified PV zones. Like in the case with PID control, reference points
1 to 6 (up to 7 zones) for setting the zones correspond to the SP number (1 to 7, PID
number on the setting display).
• Relay hysteresis
• Control action direction
• Preset output
Process value
Control Mode Selection
IM 04L31A01-03E
ON/OFF control output also allows single-loop control, cascade control, and loop control
with PV switching. However, for cascade control, the secondary output is ON/OFF
control output, but the primary output is the computed result obtained by the PID
constant that is assigned to the primary loop. Therefore, a PID constant is assigned to
the parameter of the PID number assigned to the primary loop.
1-33
Page 48

1.10 Control Alarm Related Settings
Alarm Operating Conditions (Alarm Mode)
The following three types of alarm operating conditions are available for selection.
• Alarm is always enabled ← initial value
• Alarm is disabled when operation is stopped.
• Alarm is disabled when operation is stopped or during manual (MAN) operation mode.
Alarm Type
You can select the alarm type from the following.
Alarm type Alarm type
PV high-limit
(Open/close: relay contact status)
Alarm action
Hysteresis
Open
PV
Alarm
setpoint
Close
Deviation within
high & low
limits
(Open/close: relay contact status)
Deviation
setpoint
Alarm action
Hysteresis Hysteresis
Close
OpenOpen
PV
SP
PV low-limit
Deviation
high-limit
Deviation
low-limit
Deviation
high & low
limit
Close
Open
PV
Close
Deviation
setpoint
Hysteresis Hysteresis
Close Open Close
Deviation
setpoint
Action When an Alarm Occurs
Alarms can be generated at the contact output and on the CX1000 display.
The alarm contact output can be assigned to the [DIGITAL OUT] terminal (see
of the control output terminal block.
The alarm display can be confirmed by the mark on the control group displays, alarm
occurrence history on the alarm summary display, and the alarm icon on the operation
status display section.
Hysteresis
Alarm
setpoint
Hysteresis
SP
Hysteresis
SP
Open
PV
Close
Deviation
setpoint
Open
PV
SP
PV
SP high-limit
SP low-limit
Output high-limit
Output low-limit
Hysteresis
Alarm setpointSetpoint
Hysteresis
Alarm setpoint Setpoint
Hysteresis
value
Alarm setpoint
Alarm setpointOutput
Hysteresis
Output
value
page 2-6
)
Note
You cannot assign the control alarm output to the [ALARM] terminal of the measurement
alarm option terminal block.
1-34 IM 04L31A01-03E
Page 49

Control Alarm Related Settings
Setting the Alarm Value
An alarm is registered for each SP of a single control loop. If the SP number (1 to 8) is
switched, the alarm value switches accordingly. Since up to 4 alarm types can be
assigned for each control loop, four alarm values can be assigned per SP number. You
can set the alarm value in the following range.
PV high/low limits, SP high/low limits: EU (0 to 100%) of the measurement span.
Deviation high/low limits: EUS (–100 to 100%) of the measurement span.
Deviation high & low limit, deviation within high & low limits: EUS (0 to 100%) of the
measurement span
Output high/low limit: –5.0 to 105.0%
Note
Alarm Stand-by Action
When the PV input reaches the SP at the initial stages of control operation, you can put
the alarm output on standby.
PV
Power up
The alarm number corresponds to the SP number. If you change the SP number, the alarm
switches to the value of the corresponding alarm number.
Normal
handling
Normal Failure
Alarm output
ON
Alarm is not output during
this period even if thePV is
below the alarm lower limit.
Hysteresis
Alarm lower limit value
Time
1
Explanation of Functions
Alarm Hysteresis
Open Open
PV
The alarm hysteresis can be set in the range of EUS (0.0% to 10.0%) of the measurement span.
Below is an example of setting the hysteresis of alarm 1 when the alarm 1 type is set to
PV high limit. Open and close in the figure indicate the relay contact status. If the alarm
switching (ON/OFF) is excessive, the alarm hysteresis can be widened to lessen the
excessiveness. In the right figure, the switching of the alarm (ON/OFF) is slow because
the hysteresis width has been widened.
HY1: 15.0°C (example)HY1: 5.0°C (example)
Close (ON)Close (ON)
AL 1 setpoint: 100.0°C
(example)
PV
Alarm ON
OFF
ON
OFF
ON
AL 1 setpoint: 100.0°C
(example)
Alarm ON
IM 04L31A01-03E
OFF
OFF
TimeTime
1-35
Page 50
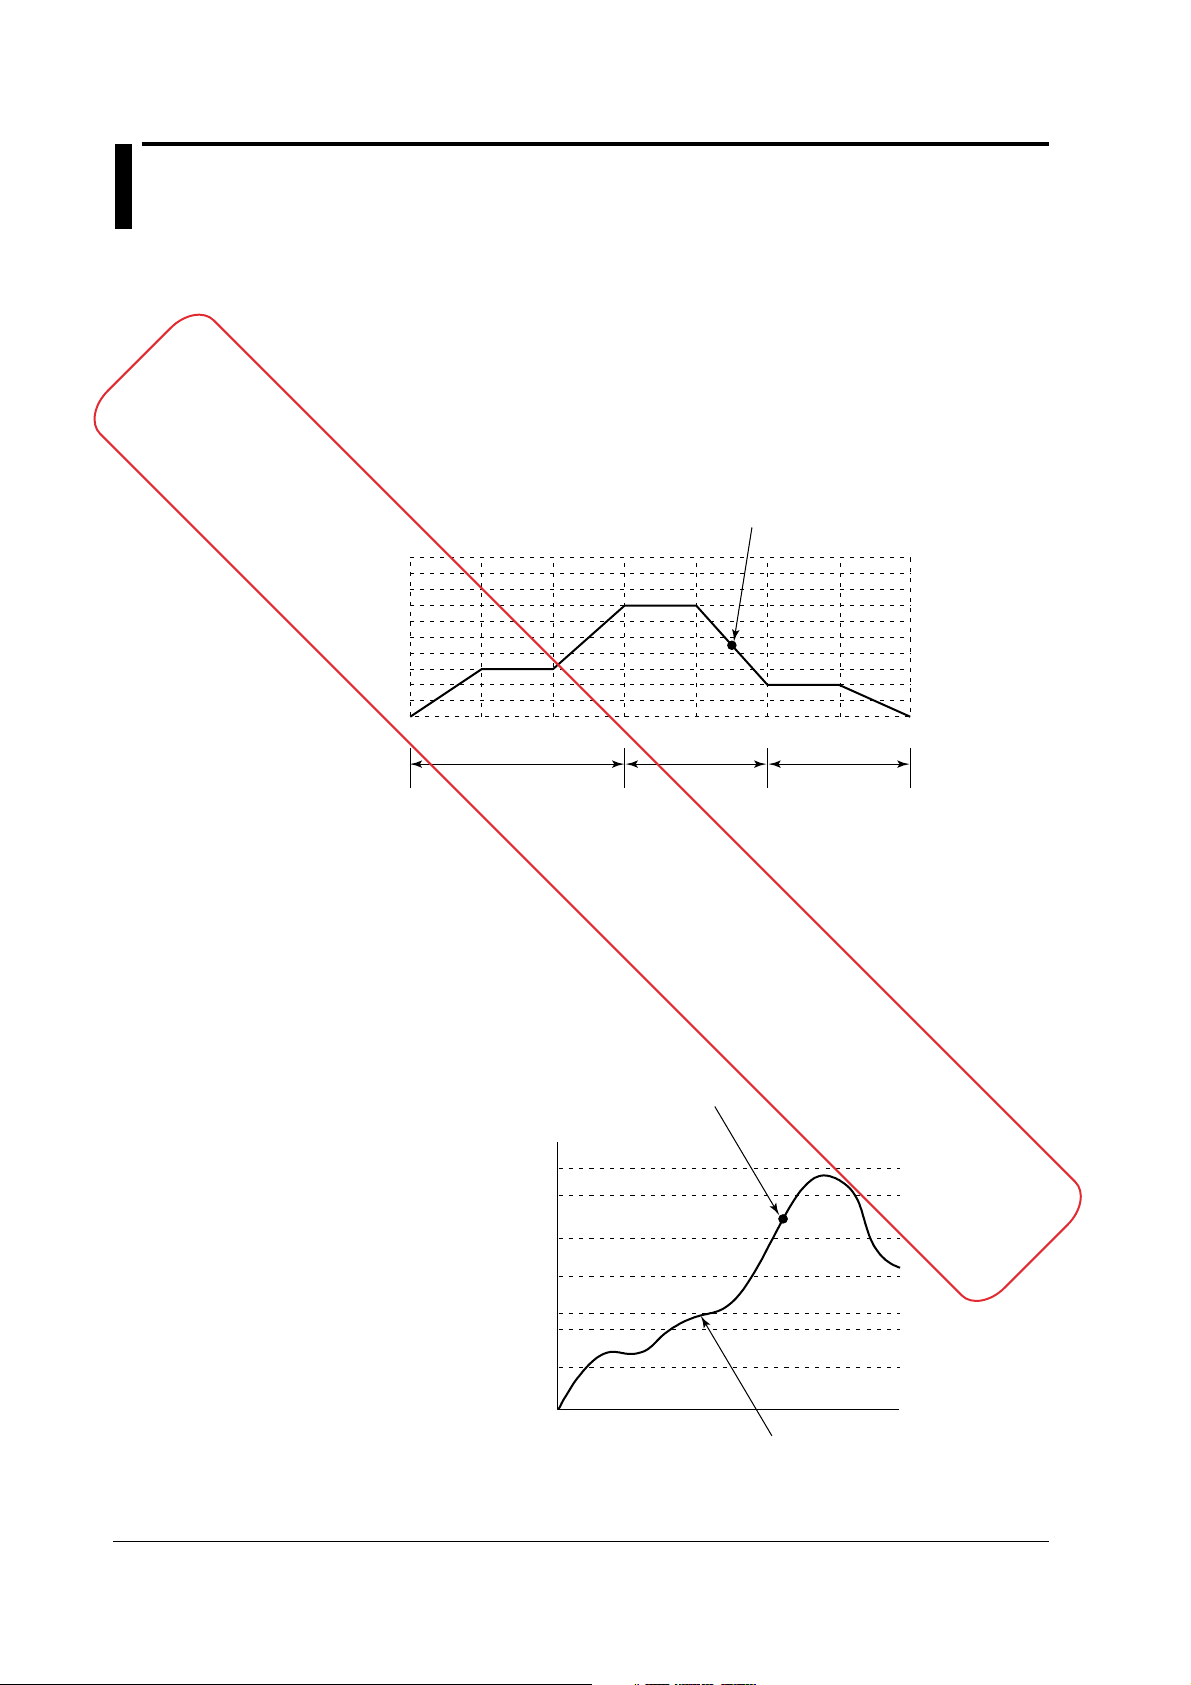
1.11 Program Control Related Settings
Selecting the PID Selection Method (basic setting of control action)
When program control is turned ON, select segment PID method (zone PID selection
OFF) or zone PID method.
• Segment PID method
This function cannot be used on the current version of the CX1000.
The infomation given here may change in the future.
Segment PID method is a function in which the PID setpoint is switched for each
segment according to the program pattern setting during program operation.
Therefore, this method is suitable for control in which the PID constant is changed
during ramp-up and ramp-down in the same PV region.
If the current operation is
at the 5th segment, the
PID constant of No. 1 is
used.
1000.0
Process
value
500.0
0.0
SEG1 SEG2 SEG3 SEG4 SEG5 SEG6 SEG7
No.2PID
• Zone PID method
Zone PID method is a function in which the PID setpoint is automatically switched
according to the PV. Therefore, the same PID constant is used in the same PV
region regardless of the ramp-up and ramp-down program operation. This method is
used on equipment such as reactors in which the chemical reaction gain varies
depending on the temperature.
As shown in the following figure, the measurement span can be divided into up to 7
zones using reference points 1 to 6. An optimum PID constant can be assigned to
each zone. Therefore, even if the PV changes and crosses between the zones, the
output is controlled automatically using the PID constant that is assigned to each zone.
If the current process value (PV) here,
control using the PID constant of No. 6.
Maximum value of PV span
Reference point 6
Reference point 5
Reference point 4
Reference point 3
Reference point 2
Reference point 1
Minimum value of PV span
No.1PID No.3PID
No.7PID
No.6PID
No.5PID
No.4PID
No.3PID
No.2PID
No.1PID
Change in the process value (PV)
1-36 IM 04L31A01-03E
Page 51

1.11 Program Control Related Settings
Program Pattern Number and Pattern Name (Initial Pattern Value)
From the multiple program patterns available, you can switch the program pattern used
in the operation by specifying a number according to the conditions. Each program
pattern can be assigned a pattern name. Program pattern number: 1 to 30 (the
maximum number of program patterns that can be specified is 30).
Pattern name: Up to 16 characters.
Number of Segments Used (Initial Pattern Value)
This function cannot be used on the current version of the CX1000.
The infomation given here may change in the future.
The selectable number of segments is as follows:
• Number of segments that can be assigned to a single program: 1 to 99.
• Total number of segments constructing all program patterns: 300 max.
Segment Assignment Method (Initial Pattern Value)
The following two types of segment assignment methods are available for selection.
• Segment time assignment method (factory default setting)
This method sets the action inside the segment using the final SP (control setpoint at
the end of the segment) and the segment time (time length from the start of the
segment to the end). Selectable range of final SP: Within the control measurement
span (within PV range span during loop control with PV switching).
Selectable range of segment time: 00:00:01 to 99:59:59.
PV
Operation of
segment n
Final SP of the
previous segment
(Starting SP at the time
of program operation start)
Segment time
• Segment time ramp-rate assignment method
This method sets the action within the segment using the final SP and the ramp-rate
value. The ramp-rate value for ramp-up or ramp-down (target setpoint change) is the
ramp-rate per 1 hour or 1 minute. For calculating the ramp-rate, the span of the loop
with the smallest number in the program operation is used. The segment time during
ramping is the maximum time in the specified loops. Selectable range of ramp-rate
during ramping: Within the control measurement span (within PV range span during
loop control with PV switching).
The segment time during soaking (the setpoint is constant) is the time length of the segment.
Selectable range of segment time during soaking: 00:00:01 to 99:59:59.
During ramp-up
PV
Operation of
segment n
n = 1 to 99
Final SP
Time
n = 1 to 99
Final SP
1
Explanation of Functions
IM 04L31A01-03E
Final SP of the
previous segment
(Starting SP at thetime
of program operation start)
The segment assignment method applies to all segments constructing the program
pattern. Note that the contents of all program patterns created before are cleared when
the segment assignment method is changed.
1min or
1h
Ramp-rate setting
Time
1-37
Page 52

1.11 Program Control Related Settings
Selecting the Start Condition for Program Operation (Basic Program Settings)
The following four operation start conditions (start codes) are available for selection.
• Starting SP start (initial value).
• Ramp-prioritized PV1 start
• Time-prioritized PV start
• Ramp-prioritized PV2/3/4/5/6 start
Starting Target Setpoint Start
This function cannot be used on the current version of the CX1000.
The infomation given here may change in the future.
The starting SP is the SP at the start of the program operation.
When set to starting SP start, the SP is changed from the starting SP to the final SP. In
this case, the change follows the ramp-rate defined by “(final SP – starting SP)/segment
time” regardless of the PV. When segment time ramp-rate assignment method is
selected, the change follows the specified ramp-rate.
PV
SEG1
SEG2
TSPn: Final SP
SSPn: Starting SP
Program pattern for
the 2nd loop
Program pattern for
the 1st loop
Time
SSP2
SSP1
TSP2
TSP1
Segment time
Ramp-prioritized PV Start
In ramp-prioritized PV start, the program operation is started by specifying one of the
process values (PV1 to PV6) of loops 1 to 6. The patterns of other unspecified patterns
start according to the PV start pattern of the specified loop. The start point varies
depending on the comparison between the starting PV of the specified loop and the SP
specified by the program pattern. The section of the program pattern that is compared is
from the starting SP to the first soak point or the first ramp-down start point. The start point
is the point at which the starting PV value and the setpoint on the program pattern match. If
this matching point is not found, the start point is the end point of the program pattern being
compared against.
If the segment consists of only an up ramp and the starting PV is greater than the final SP, the
program operation will start. If the start segment is a soak, this function does not operate, and
the start condition is the same as with the starting SP start.
Below are examples of ramp-prioritized PV1 start and ramp-prioritized PV2 start.
• Example in which the 2
When set to ramp-prioritized PV1 start, the ramp-rate of the 1
nd
segment of the 1st loop is a soak segment
st
loop is prioritized. The
program operation start point of the 1st loop will be point C1, D1, or E1 (depends on
the PV position a to e at that point). The program operation start point of the 2nd loop
(one of the other loops) is at the same time as that of the 1
st
loop. For example, if the
program operation start point of the 1st loop is point C1, the program operation start
point of the 2nd loop is point C2.
PV
a
b
A1
B1
c
d
E1
e
E2
D1
SEG1
C1
A2
B2
C2
D2
SEG2 SEG3 SEG4 SEG5
Program pattern for
the 1st loop
Program pattern for
the 2nd loop
Time
1-38 IM 04L31A01-03E
Page 53

1.11 Program Control Related Settings
• Example in which the 3rd segment of the 2nd loop is a soak segment
nd
When set to ramp-prioritized PV2 start, the ramp-rate of the 2
The program operation start point of the 2
nd
loop will be one of the points from A2 to
loop is prioritized.
E2 (depends on the PV position a to e at that point). The program operation start
st
point of the 1
For example, if the program operation start point of the 2
loop (one of the other loops) is at the same time as that of the 2nd loop.
nd
loop is point A2, the
program operation start point of the 1st loop is point A1.
This function cannot be used on the current version of the CX1000.
The infomation given here may change in the future.
PV
a
A2
b
c
d
E2
e
E1
SEG1
C2
D2
C1
D1
B2
A1B1
SEG2 SEG3 SEG4
Program pattern for
the 2nd loop
Program pattern for
the 1st loop
Time
• Example in which the segment consistS of only aN up ramp
When set to ramp-prioritized PV1 start, the ramp-rate of the 1
st
loop is prioritized. The
program operation start point of the 1st loop will be one of the points from B1 to E1
(depends on the PV position a to e at that point. If the PV position is at point a,
program operation will not start). The program operation start point of the 2
(one of the other loops) must be at the same time as that of the 1st loop. For example,
if the program operation start point of the 1st loop is point B1, the program operation
start point of the 2
PV
a
nd
loop is point B2.
A1
nd
1
Explanation of Functions
loop
IM 04L31A01-03E
b
c
d
e
D1
E1
E2
SEG1
C1
C2
D2
SEG2
B2
B1
Program pattern for
the 1st loop
A2
Program pattern for
the 2nd loop
Time
1-39
Page 54

1.11 Program Control Related Settings
Time-prioritized PV Start
Program operation is started by prioritizing the segment time to change the SP from the
PV at the start of program operation to the final SP of the 1
st
segment. The ten-segment
linearizer ramp is defined by “(final SP – PV)/segment time.” When the 1st segment is a
soak segment, the start condition is the same as with the starting target setpoint start.
• Example in which the 2
nd
segment is a soak segment
The program operation start point of the 1st loop is always one of the points from point a
This function cannot be used on the current version of the CX1000.
The infomation given here may change in the future.
to e. Since the program operation start point of the 2nd loop is at the same time as that
st
a2
b2
c2
d2
e2
a
b
c
d
e
of the 1
loop, the program operation start point is one of the points point a2 to e2.
PV
C1
C1
C1
C1
C1
SEG1
TSP1
C2
TSP2
SEG2 SEG3 SEG4 SEG5
TSPn: Final SP
Program pattern for
the 1st loop
Program pattern for
the 2nd loop
Time
Switching Conditions of Program Segments (program operation related setting)
The operating conditions related to the switching of the segments can be specified for
each segment. Such conditions include the condition for switching to the next segment
and the operating conditions within the segment. The following three conditions for
switching the segment are available.
• Switching for continuation (initial value)
• Hold-on switching
• Local-mode end
Switching for Continuation
When the segment set to switching for continuation ends, the next segment is executed.
When switching for continuation is specified on the last segment, the program operation
stops (reset) after executing the program operation. After the last segment ends, the
setpoint is set to the starting SP. Below is an example of segment switching for
continuation.
PV
SEG.n SEG.n + 1
When SEG.n ends, the
operation continues
to the next segment
(SEG.n + 1).
n = 1 to 98
Final SP of segment n
Time
TIMEn
TIMEn + 1
1-40 IM 04L31A01-03E
Page 55

1.11 Program Control Related Settings
Hold-on Switching
When a segment set to hold-on switching ends, the program operation is paused (hold
operation).
The hold condition continues until the hold operation mode is cleared through key
operation or an external contact. If the hold operation mode is cleared at the last
segment, the program operation is stopped (reset). If you execute advance during hold
operation, the hold is cleared. Below is an example of segment hold-on switching.
This function cannot be used on the current version of the CX1000.
The infomation given here may change in the future.
PV
SEG.n
TIMEn
In hold
The hold mode continues
until it is cleared.
SEG.
n + 1
n = 1 to 98
When the segment (SEG.n) to which hold
switching has been assigned ends, the
program operation is paused (hold operation).
Time
TIME
n + 1
Local-Mode End
When local-mode end is selected, the operation is set to local mode (constant SP) after
the last segment of program operation ends. The SP that is used varies depending on
the ON/OFF condition of target setpoint tracking as follows. In addition, when the
operation enters local mode, PV event and time event are turned OFF.
• When the target setpoint tracking is ON
When the program operation of the last segment ends, the operation is set to local
mode (constant SP). At this point, the final SP of the last segment is used
continuously as the SP in local mode. The “local SP” can be specified beforehand.
However, if the target setpoint tracking is ON, the PV tracks to the final SP of the final
segment regardless of the local SP.
PV
Program
operation
Local
operation
1
Explanation of Functions
IM 04L31A01-03E
Last segment
SEG.n
Time event
EVn
n = 1 to 99
Local SP
After the last segment ends, the local
SP is set to the final SP of the last
segment regardless of the "local SP"
specified beforehand, and the operation
continues under fixed-point control.
Time
1-41
Page 56

1.11 Program Control Related Settings
• When the target setpoint tracking is OFF
When the program operation of the last segment ends, the operation is set to local
mode (constant SP). At this point, the output is controlled using the preset “local SP,”
and PV event and time event are turned OFF.
PV
Program
operation
This function cannot be used on the current version of the CX1000.
The infomation given here may change in the future.
Last segment
SEG.n
Time event
EVn
Local
operation
n = 1 to 99
After the last segment ends,
the operation continues under
fixed-point control using the
"local SP" specified beforehand.
Local SP
Time
Wait Operation
This function is used to pause the program operation when the PV cannot track the SP.
The program is paused to stop the change in the SP and waits for the PV to track the
SP. When the PV tracks the SP, the program operation is automatically resumed.
This function has the following two types of operation.
• Wait at the time of segment switching
• Wait within the segment
The operation is set using the wait zone, which is the deviation width used to determine
the tracking level of the PV input, and the wait time, which is the time until the wait zone
is reached. Up to 5 groups of wait zone and wait time combination can be specified.
Wait at the Time of Segment Switching
Wait at the time of segment switching is the wait operation that is performed when the
PV has not reached the final SP before changing to the next segment. If the PV reaches
the wait zone within the wait time, the operation moves to the next segment at that point.
If the PV does not reach the wait zone within the wait time, the operation moves to the
next segment after the wait time elapses.
• Operation when the PV reaches the wait zone within the wait time
If the PV reaches the wait zone of the final SP before the wait time elapses after the wait
operation is started, the operation switches from wait mode to run mode and transits to
the next segment. The timer related to the execution of the program pattern is stopped
during wait operation. Thus, the time event value is retained.
SEG.n + 1 n = 1 to 98
Wait zone
Wait zone
SP
Final SP
SEG.n
PV
Timer
stopped
EVn EVn + 1
Wait time
Transits to the next segment
(SEG.n + 1) when the wait zone
is reached.
1-42 IM 04L31A01-03E
Page 57

1.11 Program Control Related Settings
• Operation when the PV does not reach the wait zone within the wait time
If the wait time elapses before the PV reaches the wait zone, the operation switches
from wait mode to run mode at that point (even if the PV has not reached the final SP)
and transits to the next segment. However, if the wait time is set to “0” (OFF), the wait
operation continues until the PV reaches the wait zone.
SEG.n SEG.n + 1
Final SP
This function cannot be used on the current version of the CX1000.
The infomation given here may change in the future.
SP
Timer
PV
Wait within the Segment
If the PV falls outside the wait zone specified with respect to the current SP when the
program operation is within the segment, the operation enters wait mode and the
program operation is delayed. The function applies to each loop. Therefore, when the
PV of any single loop does not reach the wait zone, the operation enters wait mode.
When the PV returns within the wait zone, the operation switches from wait mode to run
mode and the program operation is resumed.
stopped
EVn EVn + 1
Wait time
Segment n
The PV has not reached
the wait zone, but the
program transits to the
next segment when the
waittime has elapsed.
n = 1 to 98
Wait zone
Wait zone
1
Explanation of Functions
SP
Original SP
Wait period
Wait zone
PV
IM 04L31A01-03E
1-43
Page 58

1.11 Program Control Related Settings
Event Output
This function is used to output an alarm at a preset point in time or turn ON the contact
output after a given time elapses. The function operates in sync with the progression of
the program operation. The event action operates at the start time of the segment to
which the event action is assigned. There are two types of event actions: time event and
PV event.
• Number of time events/PV events that can be assigned to a single segment: 16 each.
This function cannot be used on the current version of the CX1000.
The infomation given here may change in the future.
• Total number of events that can be assigned (total of all patterns): 800
Time Event
Time event is a function used to turn ON the contact output after a specified time elapses
by starting the clock from the time the segment operation is started. The ON time and
OFF time are specified in terms of the time elapsed from the start point of the specified
segment. You can specify the time and activate the event outside the specified
segment.
SEG4SEG3SEG2
Program pattern for
the 1st loop
ON time OFF time
Time event 1
Time event 2
Time event 3
SEG1 SEG5
Program pattern for
the 2nd loop
TSP2
TSP1
TSPn: Final SP
ON time OFF time
ON time OFF time
Note
The event information of the time event is retained even after the segment to which the time
event is assigned.
1-44 IM 04L31A01-03E
Page 59
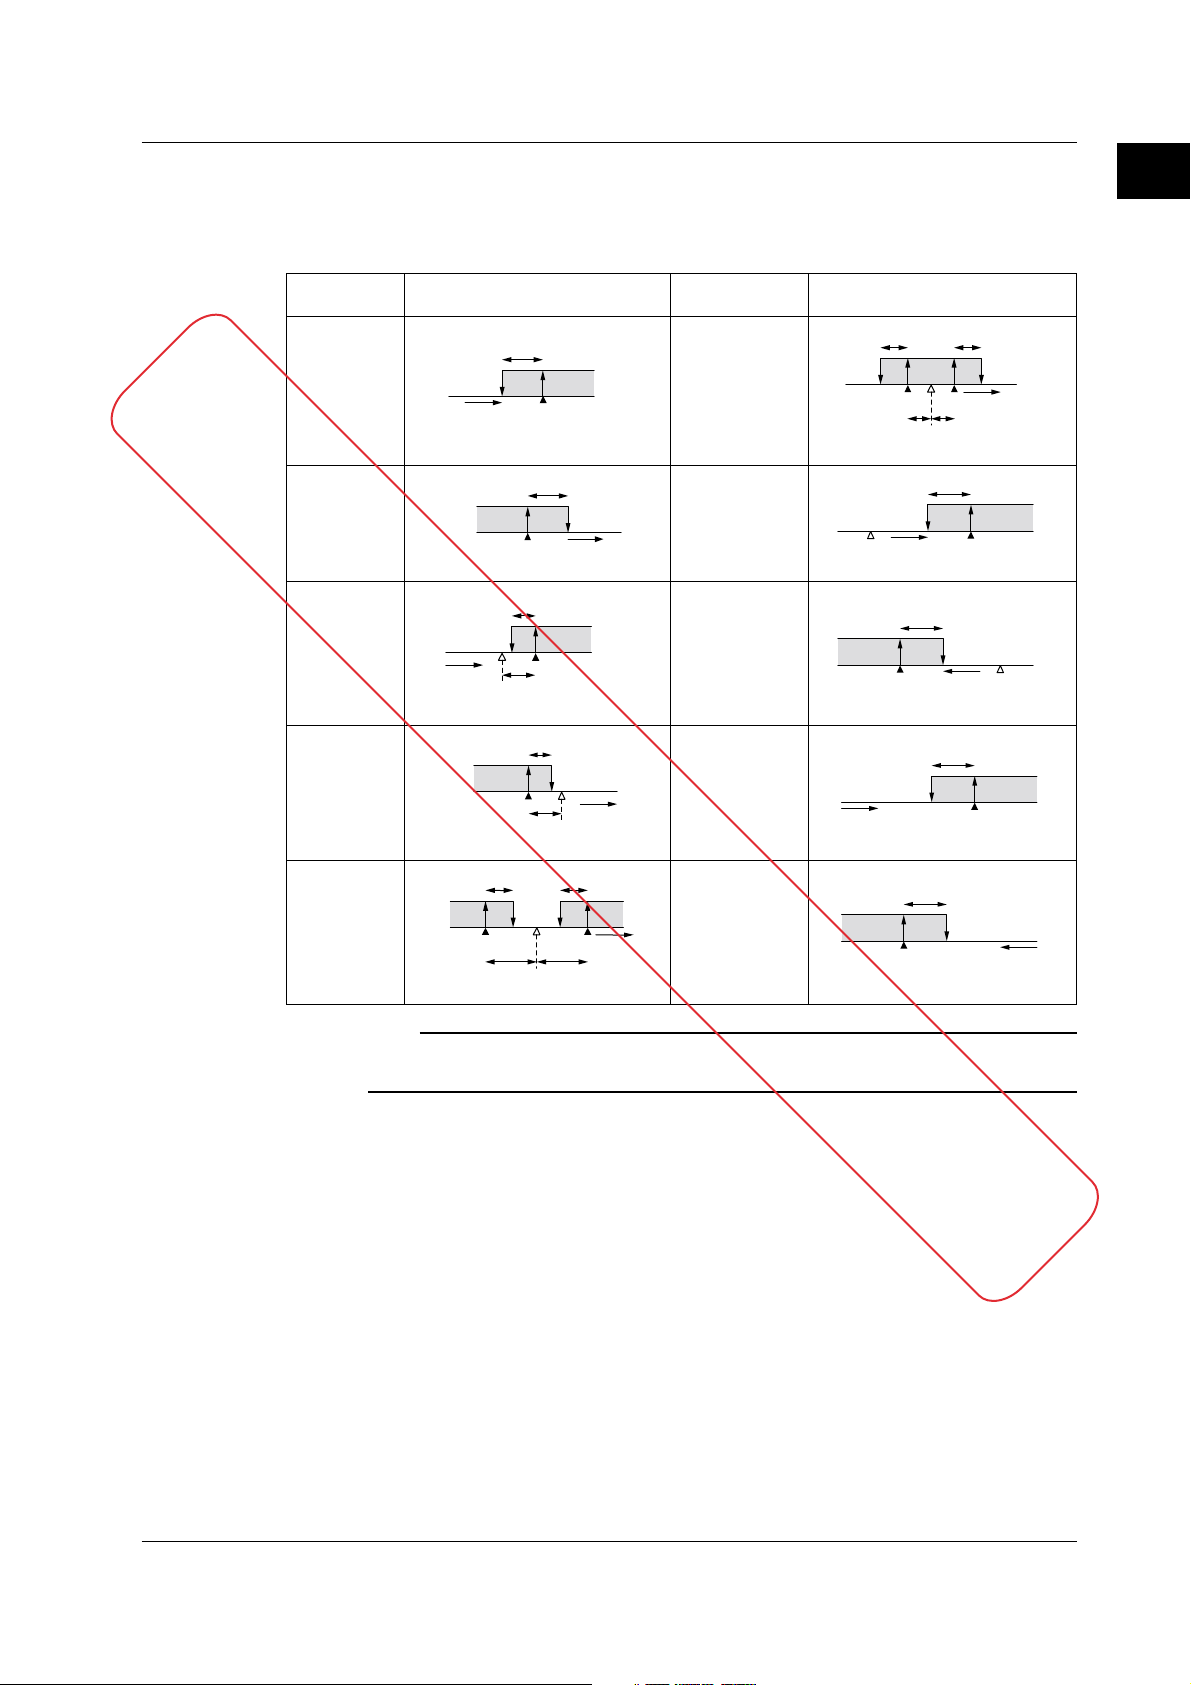
1.11 Program Control Related Settings
PV Event
This function outputs preset alarms such as PV alarms and deviation alarms during
program operation. PV events operate only within the specified segment.
The following table shows the types of PV events. Hysteresis can be specified for each event.
Open
Process
value
Close
Open
PV
Close
Deviation
setpoint
Relay action
Hysteresis
Alarm
setpoint
Hysteresis
setpoint
Hysteresis
Deviation
setpoint
SP
Hysteresis
Open
SP
Open
PVAlarm
PV
Close
Close
Deviation within
high & low limits
SP high-limit
SP low- limit
Output high-limit
(Open/close: relay contact status)
Hysteresis
Deviation
setpoint
Output value
Event type Event type
(Open/close: relay contact status)
This function cannot be used on the current version of the CX1000.
The infomation given here may change in the future.
PV high-limit
PV low-limit
Deviation
high-imit
Deviation
low-limit
Relay action
Hysteresis
Close
PV
SP
Hysteresis
Setpoint
Alarm setpoint Setpoint
Alarm
setpoint
Hysteresis
Hysteresis
Alarm
setpoint
1
Explanation of Functions
OpenOpen
Deviation
high & low
limit
Note
Hysteresis Hysteresis
Close Open Close
Deviation
setpoint
The setup conditions of PV events are reset at the time the operation of the specified program
segment ends.
SP
PV
Output low-limit
Hysteresis
Alarm
setpoint
Output value
IM 04L31A01-03E
1-45
Page 60
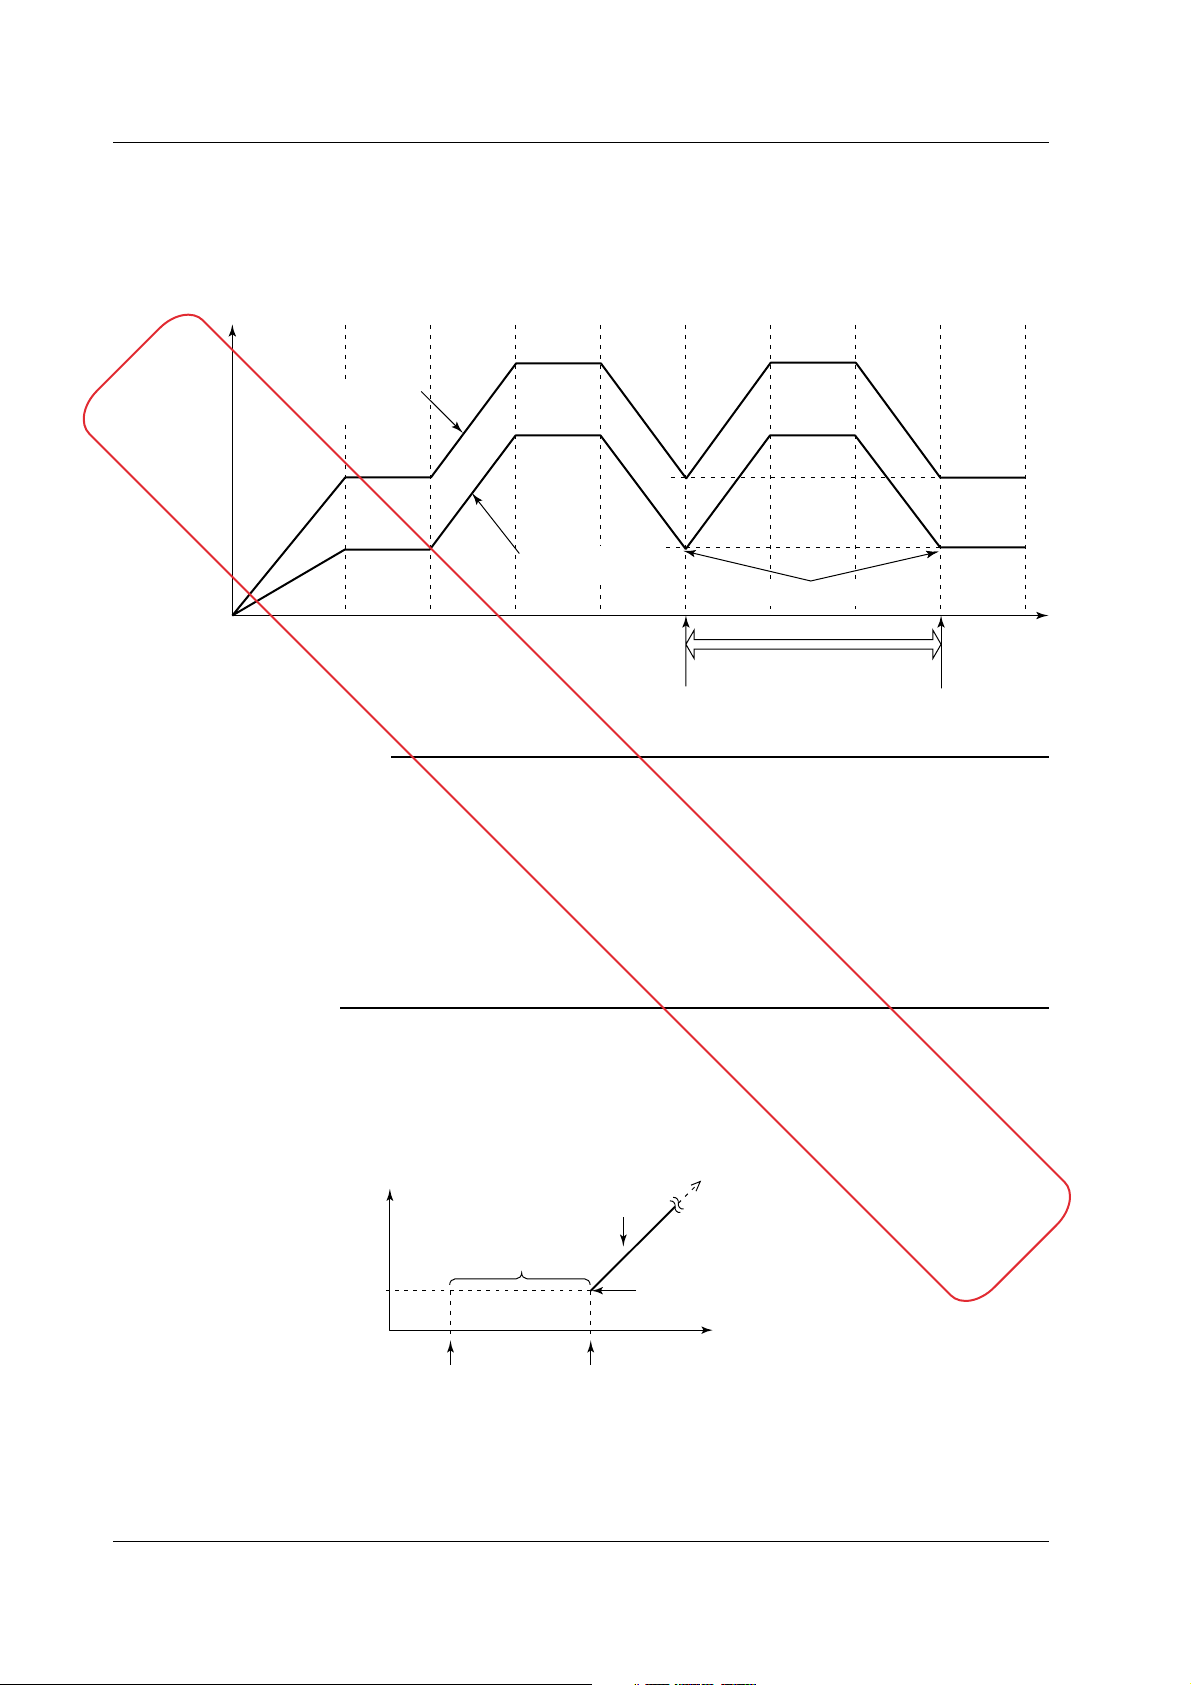
1.11 Program Control Related Settings
Repeat Function
This function repeats the operation over a section of the program pattern consisting of
continuous segments. To perform repeat operation, you specify the repeat start
segment, repeat end segment, and the number of repetitions (repeat count).
Below is a program pattern in which the repeat count = 1, repeat start segment number =
3, and repeat end segment number = 5.
SEG4 SEG6SEG5SEG3SEG5SEG4SEG3SEG2SEG1
This function cannot be used on the current version of the CX1000.
The infomation given here may change in the future.
Program pattern for
the 2nd loop
TSP2
TSP1
TSPn: Final target setpoint
Note
• Only a single repeat function can be specified for each program pattern.
• Set the first SP of the repeat start segment the same as the last SP of the repeat end
segment. If they do not match, the start segment pattern will be affected.
• The settings related to the time event output operation of the repeated segments are
initialized at the start of the repeat function. Therefore, reassign the time event output
operation that is required within the section over which the operation is repeated. The
settings related to PV events are valid within the specified segment. If necessary, assign
the PV events for each segment. If “time-prioritized PV start” or “ramp-prioritized PV start”
is specified as a starting condition of the program operation, PV start is also performed
when repeat operation is started.
Program Operation Start Delay
You can set a delay (program start time) in starting the actual program operation after
carrying out the procedure for starting the program operation. The setting is common to
all loops.
Selectable range of program start time: 00:00:00 to 99:59:59
Process value
Program pattern for
the 1st loop
Repeat start
segment number = 3
Target
setpoint
Same value
Repeat period: repeat count = 1
Repeat end
segment number = 5
Delay
Program operation starts
Time
Program start
operation
Delay elapses
1-46 IM 04L31A01-03E
Page 61
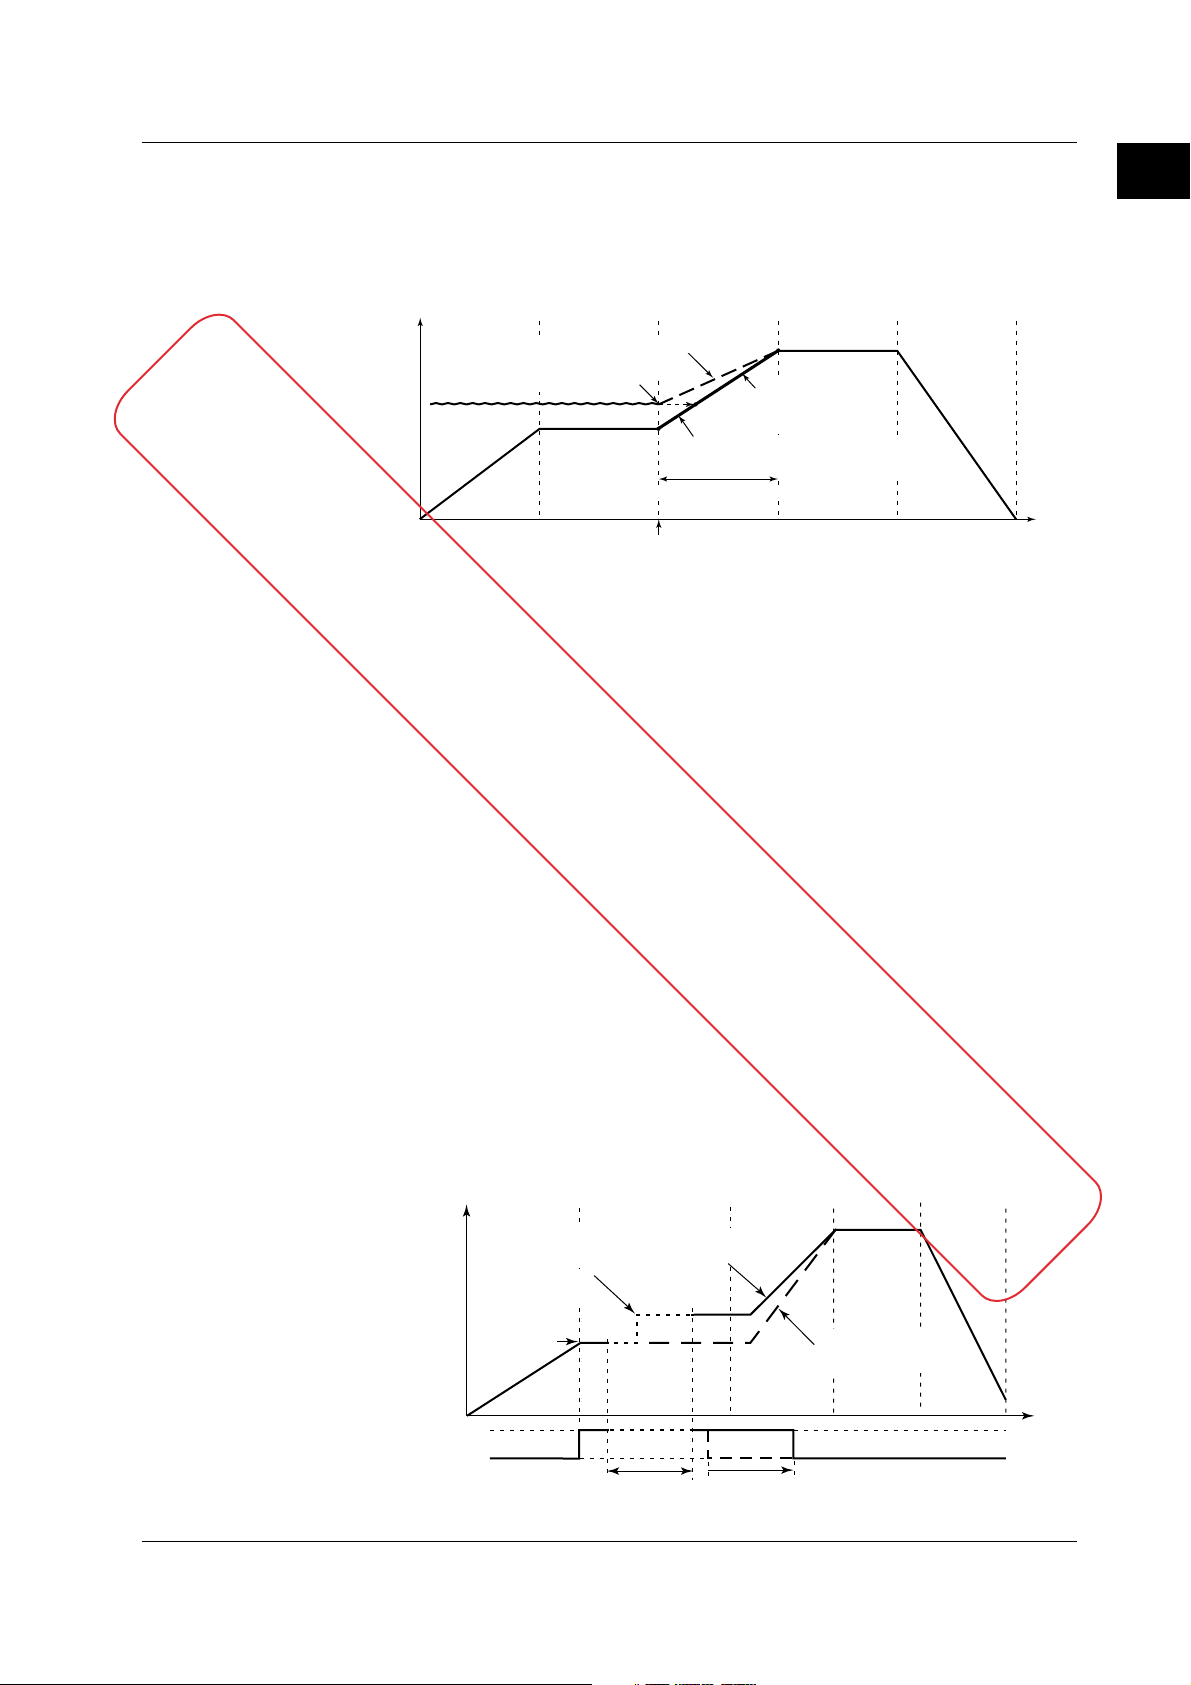
SEG4SEG3
SEG2
SEG1
SEG5
Time
Start program operation from segment 3
B
C
A
Process value
Segment time of segment 3
When set to
ramp-prioritized
PV1 start
When set to time-prioritized
PV start
Current process value
When set to starting target
setpoint start
1.11 Program Control Related Settings
Specifying the Start Segment at the Time Program Operation Is Started
You can specify the start segment number that is used at the time program operation is
started. For example, this function can be used when you wish to set the program
currently in operation back to the previous segment and restart the operation. Below is
an example in which the operation is started from segment 3.
This function cannot be used on the current version of the CX1000.
The infomation given here may change in the future.
If the program operation is started from segment 3, the program operation starts
according to the start conditions as follows.
• When set to starting SP start
The program operates using point A as the starting SP and progresses towards point C.
• When set to ramp-prioritized PV1 start
The program progresses from point B to point C.
• When set to time-prioritized PV start
Program operates from the current PV using the segment time of segment 3 and
progresses toward point C.
Hold Operation
You can hold the program progression (stop the timer) during program operation. You
can hold the program using key operation on the program operation status display, using
the external contact input, or through the communication function. While the program
operation is in hold mode, you can temporarily change the settings for the current segment.
When hold mode is cleared, the operation continues with the new settings. The settings that can
be changed temporarily are indicated below. Temporarily means that the changes take effect in
the operation of the current segment, but the setting itself is not changed. However, if the
segment indicated in bold is a ramp segment and the segment time ramp setting method
is used, you cannot change only the segment time. If you change the final SP, the
segment time changes accordingly.
• Change the final SP of the segment.
• Increase or decrease the segment time.
When changing the SP of the segment
You can change the SP during the hold operation. The ON/OFF time of the time event
and the segment time is adjusted by the amount of time the operation is held.
SEG1 SEG2 SEG3 SEG4
Pattern after the
setpoint is changed
Target SP
changed
SEG5
1
Explanation of Functions
IM 04L31A01-03E
Time event
ON
OFF
Final SP
Hold period
(Timer stopped)
Pattern before the
setpoint is changed
Delay for the amount of time
the timer was stopped
1-47
Page 62

1.11 Program Control Related Settings
When increasing or decreasing the segment time
You can increase or decrease the segment time during the hold operation.
If the segment time is increased or decreased during the hold operation, the ON/OFF
time and segment time is automatically adjusted by the amount of time the operation is
held and the amount of time the segment time is increased or decreased.
• Example in which the segment time is increased
SEG1 SEG2 SEG5SEG4SEG3
This function cannot be used on the current version of the CX1000.
The infomation given here may change in the future.
Pattern before the remaining
segment time is increased
Final SP
Pattern after the
remaining segment
time is increased
Time event
• Example in which the segment time is decreased
ON
OFF
Hold period
(Timer stopped)
SEG1 SEG2 SEG5SEG4SEG3
Pattern when the remaining
segment time is decreased
Delay for the amount of time
the timer was stopped
Increase the
remaining
segment time
Final SP
Pattern before the
remaining segment
time is decreased
The time event also decreases by the amount
the remaining segment time was decreased.
Time event
ON
OFF
Decrease the
remaining
segment time
Delay for the amount of time
the timer was stopped
Hold period
(Timer stopped)
1-48 IM 04L31A01-03E
Page 63

1.11 Program Control Related Settings
Advancing Segments
During program operation, you can force the program to advance to the next segment.
You can advance the program using key operation on the program operation status
display, using the external contact input, or through the communication function.
When you advance the program at the segment currently in operation, the program
advances to the next segment. However, depending on the segment at which this
function is executed, the following operation may take place.
This function cannot be used on the current version of the CX1000.
The infomation given here may change in the future.
• When advance is executed at the last segment
The program operates according to the switching settings of the segment. If localmode end is selected, the operation enters local mode. If switching for continuation or
hold-on switching is selected, the operation enters reset mode (operation stop).
• When advance is executed at the repeat end segment
Repeat operation is started.
• When advance is executed at a segment other than those described above
The program advances to the next segment regardless of the segment switching
settings.
• When advance is executed when the program operation is on hold
The hold mode is cleared, and the program operates according to the segment
conditions described above.
1
Explanation of Functions
IM 04L31A01-03E
1-49
Page 64

1.12 Tuning
Selecting Tuning Parameters
Up to 21 tuning parameters can be shown on the tuning display. The parameters are
initially assigned as shown below. The name of the tuning parameters (such as SP) can
be changed using up to 6 characters. In addition to the tuning parameters below, [DR]
(control direction) and [H] (relay hysteresis) are available.
SP (target setpoint) D (derivative time)
A1 (alarm 1 setpoint) OH (High limit of the output limiter)
A2 (alarm 2 setpoint) OL (Low limit of the output limiter)
A3 (alarm 3 setpoint) MR (manual reset)
A4 (alarm 4 setpoint) PO (preset output)
P (proportional band)
I (integral time)
Manual Tuning Operation
On the tuning display as shown below, you can select the parameter you wish to tune
using the arrow keys and change the value.
Auto Tuning the PID Constant
On the tuning display, select the PID number you wish to auto-tune and execute auto tuning.
1-50 IM 04L31A01-03E
Page 65

Setpoint
Process
value
Control
output
Auto tuning on
PID control according to
the PID control determined
by auto tuning
Auto tuning ends
on the third hump.
Auto tuning in progress
OFF OFF
ON ONON
Time
1.11 Program Control Related Settings
Auto Tuning
Auto tuning is a function that automatically measures the process characteristics and
automatically sets the optimum PID constant. When auto tuning is executed, the control
ouput is temporarily turned ON/OFF step-wise (see the following figure). From the
hunting period and amplitude of the PV that is generated, the optimum PID constant is
calculated and set. This method is called the limit cycle method. Auto-tuning is allowed
only during auto operation under PID control. In addition, for cascade control, auto
tuning on the primary loop is possible only when cascade operation is in progress.
Target Setpoint during Auto Tuning Execution (Auto Tuning Point)
The auto tuning point is limited in the range of 3 to 97% of the measurement span.
• Auto tuning execution during program operation
The optimum PID constant for the SP that the segment in execution is using is
determined. The auto tuning point in this case is the SP that exists at the start of auto
tuning. For the secondary loop of cascade control, the tuning point is the SP of
the SP number corresponding to the specified PID number.
• Auto tuning execution during the zone PID method
When auto tuning is executed for all groups, the midpoint of each reference point
pairs is used as the auto tuning point. For reference deviation, auto tuning is
performed at 50% of the measurement span.
1
Explanation of Functions
IM 04L31A01-03E
1-51
Page 66

1.13 Measurement Function Overview
Measurement Input
DC voltage, thermocouple, resistance temperature detector, or ON/OFF signal (contact
signal or voltage signal) can be measured. The input signal is A/D-converted at a scan
interval of 1 s or 2 s and acquired to the internal memory. In addition, difference
computation, square-root computation, and scaling can be carried out on the measured
data and acquired to the internal memory.
Displaying the Measured Data
The measured data acquired to the internal memory can be displayed on the operation
display using trend waveforms, numeric values (digital values), or bar graphs.
Trend Display Digital Display
Bar Graph Display
Measurement Alarms
Alarms can be generated when the measured/computed data meets a certain condition.
When an alarm occurs, information notifying the alarm occurrence is indicated on the
operation display. In addition, a relay signal can be output from the alarm output
terminal [ALARM] of the measurement alarm option terminal block and the relay contact
output/transistor output terminal [DIGITAL OUT] of the control output terminal block.
On the operation display, the alarm status is displayed as alarm icons in the status
display section and using methods such as the trend, digital, bar graph, overview
displays. The detailed information about the alarms is displayed in the alarm summary.
Alarm Indication Example on the Overview Display
Alarm type
Channel No. or tag name
Cursor
Measured/computed value
Area of channels on which an alarm
is not occurring is indicated in green
Alarm icon
Area of channels on which an
alarm is occurring is indicated
in red
1-52 IM 04L31A01-03E
Page 67

1.13 Measurement Function Overview
Saving Data
Alarm Summary Display Example
Number of the alarm information displayed on the bottom line
Number of the alarm information in the internal memory
Alarm occurrence channel (channel No. or tag)
Alarm No. (1, 2, 3, 4)/type (H, L, h, l, R, r, T, t)
Date and time when the alarm occurred
Mark
Cursor
Date and time when the
alarm was released
The measured data can also be saved to external storage media such as floppy disks
(2HD), Zip disks (100 MB), and ATA flash memory cards (4 to 440 MB).
External storage medium
(One of the following types
CX1000
specified at the time of purchase)
Floppy disk
Zip disk
1
Explanation of Functions
The data that has been saved to an external storage medium can be displayed on a PC
using the DAQSTANDARD for CX software that comes with the package. The data can
also be loaded into the CX1000 to be displayed.
Communication Function
By using the Ethernet interface that comes standard with the CX1000, the data can be
transferred to a server on a network (client function). The data stored on the CX1000’s
external storage medium can also be read from a PC on the network (server function).
CX
The communication functions using the Ethernet or serial interface are not covered in this
manual. See the
17E)
.
1
2
3
4
CX
Measured data
Server
Primary Secondary
CX1000/CX2000 Communication Interface User’s Manual (IM 04L31A01-
PC
DISP/
ENTER
ATA flash
memory card
Data on the external
storage medium
CX
CX
IM 04L31A01-03E
1-53
Page 68

1.14 Measurement Function > Measurement Input Related Settings
Integration Time of the A/D Converter
The CX1000 uses an A/D converter to convert the sampled analog signal to a digital
signal. At this point, the sampled data is integrated for a certain period to eliminate the
noise that is mixed in the input signal. You can select the integral time from [Auto]/
[50Hz(20ms)]/[60Hz(16.7ms)/100ms]. This setting applies not only to the measurement
input of the measurement function but also to the PV input of the control function. By
setting the integration time of the A/D converter to match the time period corresponding
to one cycle of the power supply or an integer multiple of one cycle, the power supply
frequency noise can be effectively eliminated. If [Auto] is selected, the recorder will
automatically detect the power supply frequency and select 16.7 ms or 20 ms. Because 100 ms
is an integer multiple of 16.7 ms and 20 ms, this setting can be used to eliminate the power
frequency noise for either frequency, 50 Hz or 60 Hz.
Scan Interval
The scan interval is the interval used to sample the input signal. You can select [1s] or
[2s]. However, if the integral time is set to [100ms], the scan interval is fixed to 2 s.
Note
When performing four arithmetic operations on models with the computation function (/M1),
this scan interval is used to carry out the computation.
Input Type and Input Computation (Mode)
There are six channels of measurement input channels (measurement channels). You can
select the type of signal input to each measurement channel from DC voltage, thermocouple,
resistance temperature detector, and ON/OFF input (contact signal or voltage signal). In
addition, difference computation, square-root computation, and scaling can be performed on the
measured data and display or save the computed result as measured data.
On the CX1000, the input type and input computation type is set as a [Mode]. In
addition, if [Mode] is set to difference computation, square-root computation, or scaling,
the input type is set as a [Type].
Mode Notation in Setup* Description
DC voltage Voltage Measures a DC voltage in the range of ±20 mV to ±50 V.
Thermocouple TC Measures temperatures corresponding to the temperature range of each
Resistance RTD Measures temperatures corresponding to the
temperature detector appropriate range for Pt100 or JPt100.
Scaling Scale The input signal can be scaled to a value in the appropriate unit and displayed. You
Difference Delta Displays the value obtained by subtracting the measured value of another channel
ON/OFF input DI Displays the contact input or voltage input signals by correlating them to 0% or
Square root Sqrt Calculates the square root of the input signal and
computation displays the result as the measured value of the channel. The computed
Skip Skip Disables the channel.
* Characters displayed as selections in the [Mode] box of the setting display. It is used when setting the measurement channels.
thermocouple type such as R, S, B, K, E, J, T, N, and W.
can select the input type from DC voltage, thermocouple, resistance temperature
detector, and ON/OFF input.
(called the reference channel) from the input signal of the specified channel as the
measured value for the specified channel. You can select the input type from DC
voltage, thermocouple, resistance temperature detector, and ON/OFF input.
100% of the display range.
Contact input: Closed contact is ON (1).
Open contact is OFF (0).
Voltage input: Less than 2.4 V is OFF (0).
Greater than or equal to 2.4 V is ON (1)
result can also be scaled to a value in the appropriate unit and displayed.
The input type is DC voltage only.
1-54 IM 04L31A01-03E
Page 69

1.14 Measurement Function > Measurement Input Related Settings
Note
• For current inputs, a shunt resistor is attached to the input terminal to convert the signal to
voltage input. The following table shows the available shunt resistors. For example, a
250-Ω shunt resistor is used to convert the signal to 1 to 5 V for 4-20 mA input.
Name Model Resistance
Shunt resistor 4159 20 250 Ω ± 0.1%
(for screw terminals) 4159 21 100 Ω ± 0.1%
• The square-root computation method of the CX1000 is indicated below.
max min
F = (F - F )
x
Meanings of the symbols are shown below.
V
min
: span lower limit, V
F
max
: scale upper limit after conversion, Vx: input voltage, Fx: scaling value.
If the value inside the root is negative, the computed result is displayed as follows.
When F
min
< F
When F
min
> F
Input Range and Measurable Range
When the input type is set to DC voltage, thermocouple, resistance temperature detector,
or ON/OFF input, you will select the range to match the input signal. For DC voltage, select
the measurable range (select [20mV] for “–20.00 to 20.00 mV”). For thermocouple or
resistance temperature detector, select the type. For example, the type selections for the
thermocouple are [R], [S], [B], [K], [E], [J], [T], [N], [W], [L], [U], [PLATINEL], [PR40-20], and
[W3Re/W25Re]. If [R] is selected, the measurable range is 0.0 °C to 176.0 °C. In addition,
you will set the measurement span ([Span lower limit] and [Span high limit]) within the
measurable range as the actual range for making measurements.
max
max
4159 22 10 Ω ± 0.1%
V - V
x min
max
V - V
max
min
: span upper limit, F
: “–*****”
: “+*****”
1
Explanation of Functions
=
min
F
min
: scale lower limit after conversion,
Burnout Detection
When measuring the temperature using a thermocouple, you can have the measurement result
set to positive overrange*1 or negative overrange*2 when a burnout occurs. Burnout can be set
on each measurement channel. The initial setting is set so that burnout is not detected.
*1 Positive overrange refers to the condition in which the input signal is exceeding the upper limit of
the measurable range of the input range. The measured value is show as “+*****”.
*2 Negative overrange refers to the condition in which the input signal is less than the lower limit of
the measurable range of the input range. The measured value is show as “–*****”.
Reference Junction Compensation
When measuring the temperature using a thermocouple, the reference junction compensation
can be used. You can select whether to use the reference junction compensation provided by
the CX1000 or an external reference junction compensation. If you are using an external
reference junction compensation, you will also set the reference voltage. The initial setting is set
so that the reference junction compensation provided by the CX1000 is used. When using the
external reference junction compensation, set an appropriate reference junction
compensation voltage. As in the example in the following figure, if the reference junction
temperature for the external reference junction compensation is T
thermoelectromotive force of the 0-°C reference for T
compensation voltage.
CX1000
°C as the reference junction
0
External reference junction compensation
(Hold the contact point of the thermocouple
and copper wire at T0 °C)
Copper wire
Thermocouple
°C, set the
0
IM 04L31A01-03E
1
2
3
4
DISP/
ENTER
1-55
Page 70

1.14 Measurement Function > Measurement Input Related Settings
Moving Average
The moving average is used to suppress the effects of noise that is riding on the signal.
The input signal of the measurement channel is set to the averaged value of the m most
current data points (the number of moving-averaged data points) acquired using the scan
interval. The number of moving-averaged data points (m) can be set in the range 2 to 16.
The figure below shows an example indicating the operation of the buffer for the moving
average computation when the number of moving averaged data points is set to “5.”
The moving average can be set on each channel. The moving average is initially turned
OFF.
Buffer data for the nth
sampling time
Buffer data for the n+1th
sampling time
New data New data
Buffer data for the n+2th
sampling time
Moving
average
1
2
3
4
5
10.0mV
5.0mV
0.0mV
–5.0mV
–10.0mV
0.0mV
Cleared
15.0mV
10.0mV
5.0mV
0.0mV
–5.0mV
5.0mV
10.0mV
15.0mV
10.0mV
5.0mV
0.0mV
Cleared
8.0mV
1-56 IM 04L31A01-03E
Page 71

1.15 Measurement Function > Measurement Alarm Related Settings
Turning ON/OFF the Alarm
You can set up to four alarms for each channel. You can set alarms not only on
measurement channels but also computation channels. For each alarm, you can set
different alarm conditions.
Alarm Conditions
The following eight conditions (shown as [Type] on the setting display) are available.
• Upper limit alarm
An alarm occurs when the measured/computed value exceeds the alarm value.
• Lower limit alarm
An alarm occurs when the measured/computed value falls below the alarm value.
Upper limit alarm
Alarm occurrence
Alarm release
Process value
Alarm
value
• Difference upper limit alarm (can be set on difference computation channels only)
An alarm occurs when the difference in the measured values of two channels exceeds
the difference upper limit alarm value.
• Difference lower limit alarm (can be set on difference computation channels only)
An alarm occurs when the difference in the measured values of two channels falls
below the difference upper limit alarm value.
• Upper limit on rate-of-change alarm (can be set on measurement channels only)
The rate-of-change of the measured values is checked over a certain time (interval).
An alarm occurs if the rate-of-change of the measured value in the rising direction
exceeds the specified value.
• Lower limit on rate-of-change alarm (can be set on measurement channels only)
The rate-of-change of the measured values is checked over a certain time (interval).
An alarm occurs if the rate-of-change of the measured value in the falling direction
exceeds the specified value.
Upper limit on rate-of-change alarm Lower limit on rate-of-change alarm
Change in
the measured
Measured
value
T
2
T
1
t
1
Interval
t
2-t1
value
Amount of change
in the setting
t
2
|T
Time
2
-T1|
Lower limit alarm
Process
value
Alarm occurrence
Measured
value
T
1
T
2
Alarm release
Alarm
value
t
1
Interval
t
2-t1
Amount of change
in the setting
Change in
the measured
value
Time
t
2
|T
2
1
Explanation of Functions
-T1|
IM 04L31A01-03E
The alarm value of the rate-of-change alarm is set using an absolute value. The interval
is derived using the following equation and set using the number of sampled data.
Interval = Scan interval × number of sampled data
• Delay upper limit alarm
An alarm occurs when the measured/computed value remains above the alarm value
for the specified time (delay).
1-57
Page 72

1.15 Measurement Function > Measurement Alarm Related Settings
• Delay lower limit alarm
An alarm occurs when the measured/computed value remains below the alarm value
for the specified time (delay).
Delay upper limit alarm example (T is the specified delay)
Measured value or
computed value
X1 X2 X3 X4
T1
T
• Alarm does not occur at T1, because the time is shorter than the specified delay (T).
• The input exceeds the alarm value at X2, but the alarm occurs at X3 at which the
specified delay period elapses (the time when the alarm occurs is the time at X3).
• The input falls below the alarm value at X4 and the alarm is released.
Note
The following special operations are available for the delay upper/lower limit alarm.
• When a delay alarm is set on a computation channel and the computation is stopped
If the computation is stopped in a condition in which the computed value is exceeding the
alarm setting, the alarm is turned ON after the specified period (delay period) elapses.
Stop computation
Alarm setting
Alarm releaseAlarm occurrence
Alarm setting
Computed
values
T
Alarm occurrence
• Delay alarm when a power failure occurs
Alarm detection is reset upon a power failure. It restarts the operation after the power recovers.
Measured value or
computed value
Alarm setting
Alarm
T
:Off
T T
On Off On Off On Off
Power failure
occurrence/recovery
Power failure
occurrence/recovery
• Operation when the alarm setting is changed
• When a new delay alarm is set
The alarm detection starts at the time the alarm is set. It is unaffected by the conditions
existing before the alarm is set.
• If the alarm setting of a preexisting delay alarm is changed
• If an alarm is not occurring at the time of the change, alarm detection starts at the
new setting.
• If an alarm is occurring at the time of the change and the alarm type is set to delay
upper limit alarm, the alarm continues as long as the input is above or equal to the
new setting. If the input is below the new setting, the alarm turns OFF. If the alarm
type is set to delay lower limit alarm, the alarm continues as long as the input is
below or equal to the new setting. If the input is greater than the new setting, the
alarm turns OFF.
1-58 IM 04L31A01-03E
Page 73

1.15 Measurement Function > Measurement Alarm Related Settings
Alarm Hysteresis
Alarm Relay Output
You can set a width (hysteresis) to the values used to activate and release alarms.
Alarm hysteresis prevents frequent activation and release of alarms when the measured
value is unstable around the alarm value. The hysteresis is fixed to 0.5% of the
measurement span (display scale width if the range is set to scale).
It is applied only on alarms set to upper/lower limit alarm on measurement channels, and
the function can be turned ON/OFF.
Factory default setting: Hysteresis ON
Upper limit alarm
Alarm occurrence
Measured value
Alarm
setting
Alarm release
Lower limit alarm
Measured value
Alarm occurrence
Alarm release
Hysteresis
(Approx. 0.5%)
Alarm
setting
Relay Output ON/OFF
A relay signal can be output from the alarm output terminal [ALARM] of the
measurement alarm option terminal block and the relay contact output/transistor output
terminal [DIGITAL OUT] of the control output terminal block. You can set whether to
output the relay signal for each alarm setting.
Reflash Alarm
This function is used to notify alarms occurring after the relay is activated on the first
alarm when multiple alarms are assigned to a single alarm output relay. When this
function is turned ON, the output relay is temporarily (approx. 500 ms) released when
alarms after the first alarm occur. The initial setting is [Off] (not use reflash alarm).
The reflash alarm function is set only on output relays I01, I02, and I03.
1
Explanation of Functions
Channel 1
Alarm
Alarm output relay
(Reflash alarm ON)
Alarm output relay
(Reflash alarm OFF)
Channel 2
Channel 3
Approx.
500 ms
Approx.
500 ms
Note
If the reflash alarm is set, I01 to I03 become dedicated reflash alarms regardless of the
number of alarm output relays. Therefore, relays I01 to I03 operate as OR logic (see “AND/
OR of Alarm Output Relays”) and non-hold (see
Relays”
) regardless of the settings made in “AND/OR of alarm output relays” and “Hold/Non-
hold operation of the alarm output relay.”
“Hold/Non-hold Operation of Alarm Output
IM 04L31A01-03E
1-59
Page 74

1.15 Measurement Function > Measurement Alarm Related Settings
AND/OR of Alarm Output Relays
When a single alarm relay is shared among multiple alarms, you can select either
condition below to activate the alarm output relay.
• AND: Activated when all assigned alarms are occurring simultaneously.
• OR: Activated when any of the specified alarms is occurring.
Set the alarm output relays for taking the AND logic in the following fashion: “I01 (first relay)
to Ixx (where xx is the relay number).” The value is initially set to [None] (no AND relay).
Channel 1
Alarm
Channel 2
AND
Alarm output relay
OR
Note
When the reflash alarm is turned ON, I01 to I03 operates as reflash alarms. They are fixed to
OR logic operation. Specifying AND produces no effect.
Energized/De-energized Operation of Alarm Output Relays
You can select whether the alarm output relay is energized or de-energized when an
alarm occurs. If de-energized is selected, the alarm output relay behaves in the same
fashion as when an alarm occurs if the power is shut down. The setting applies to all
alarm outputs. The initial setting is [Energized].
De-energized
NOEnergized
C NC NO C NC NO C NC
NO C NC NO C NCNO C NC
When power is
shut down
NO: Normally Opened, C: Common, NC: Normally Closed
When alarm is
not occurring
When alarm is
occurring
1-60 IM 04L31A01-03E
Page 75
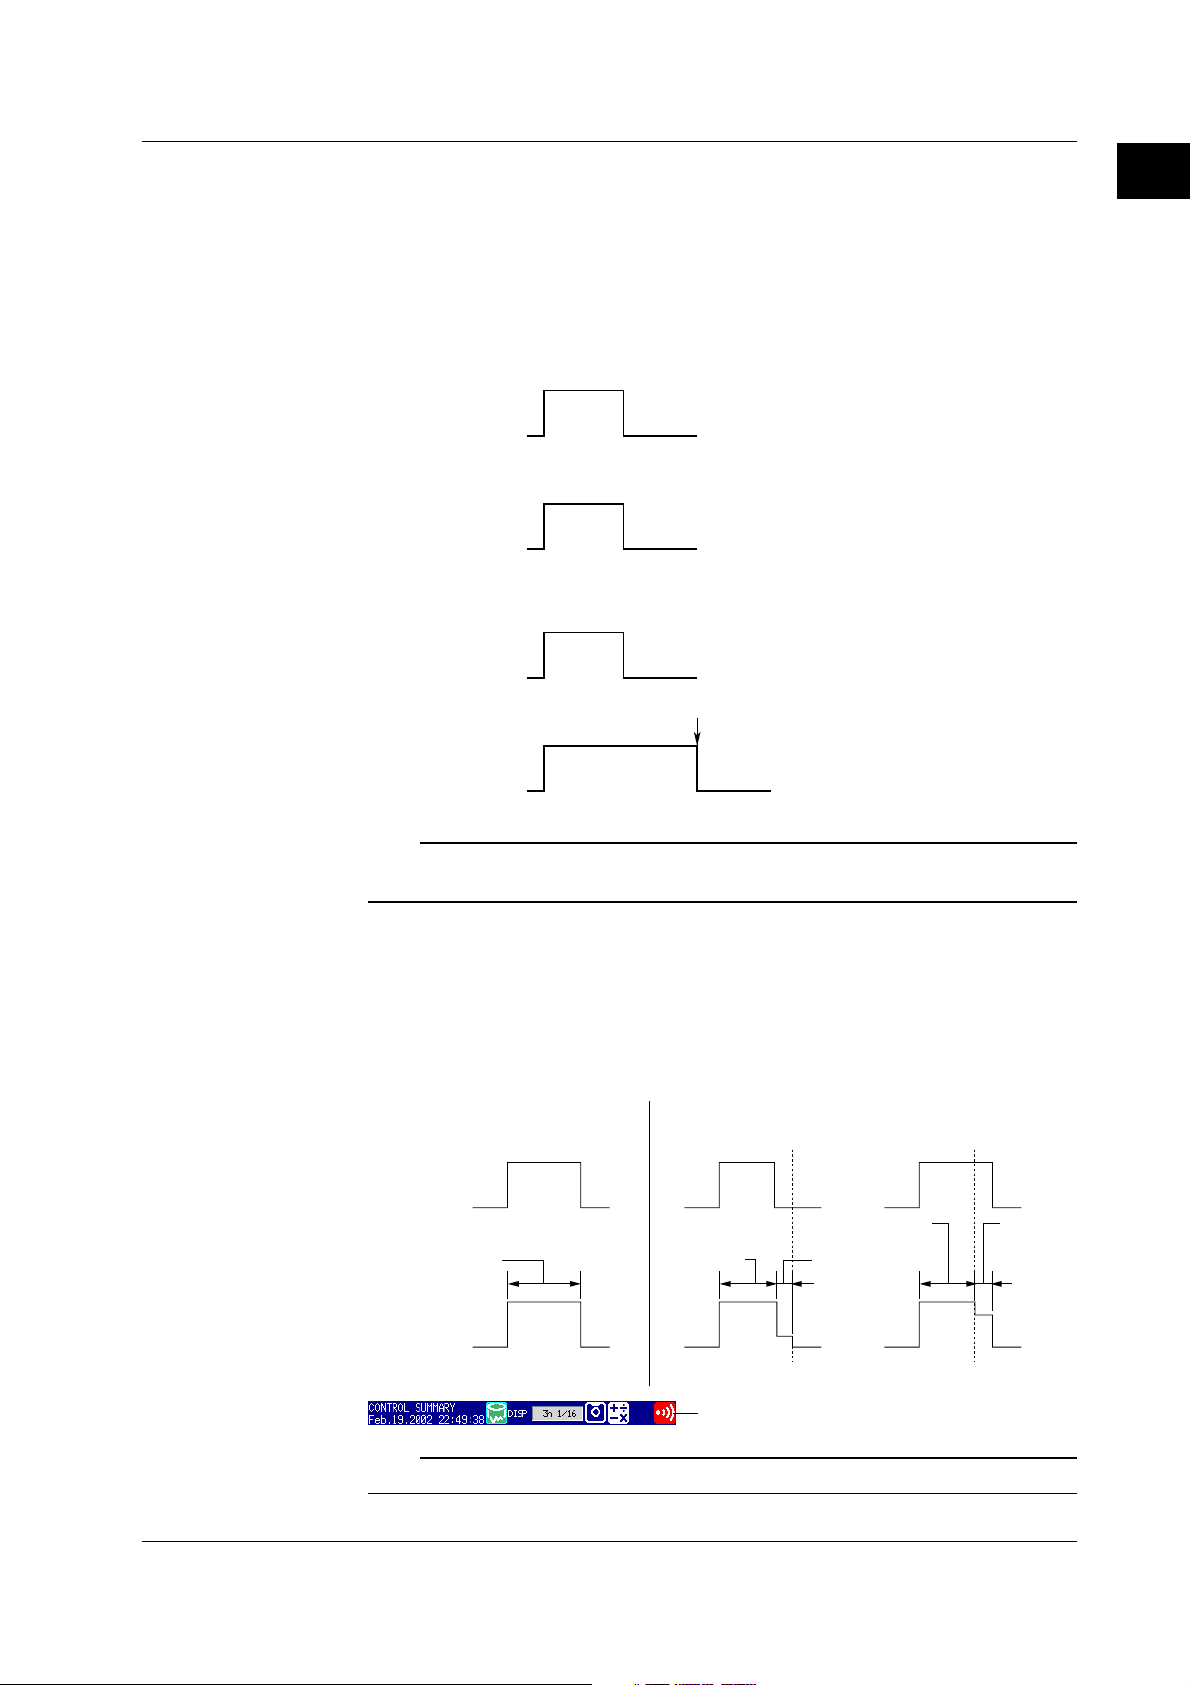
Release
When indication is set to non-hold
Alarm
Occurrence
Red icon
Red icon
Indication
None
When indication is set to hold
Occurrence
Release
None
Blinking
red icon
Blinking
green icon
Alarm ACK
Blinking
red icon
Alarm ACK
1.15 Measurement Function > Measurement Alarm Related Settings
Hold/Non-hold Operation of Alarm Output Relays
You can select the following behavior when the alarm switches from the activated
condition to the released condition (reverts to the normal condition).
• Turn OFF the output relay with the release of the alarm (non-hold).
• Hold the output relay at ON until an alarm ACK operation is performed (hold).
The setting applies to all alarm output relays. The initial setting is [Non-hold].
When set to non-hold
Alarm ON
Alarm OFF
*
Relay output ON/OFF is for the case when
Relay output ON
Relay output OFF
When set to hold
Alarm ON
Alarm OFF
Relay output ON
*
*
Alarm ACK
*
NO (Normally Opened) terminal is used.
If a NC (Normally Closed) terminal is used,
the ON/OFF condition is reversed from the
condition shown in the left figure.
1
Explanation of Functions
Relay output OFF
*
Note
When the reflash alarm is turned ON, I01 to I03 are set to non-hold. Specifying [Hold]
produces no effect.
Hold/Non-hold of Alarm Indications
You can select the following behavior when the alarm switches from the activated
condition to the released condition.
• Clear the alarm indication with the release of the alarm (non-hold).
• Hold the alarm indication until the alarm ACK operation is performed (hold).
The initial setting is [Non-hold].
Alarm Icon Indication Example
IM 04L31A01-03E
Note
The non-hold/hold setting of the alarm indication also applies to control alarms.
Alarm
icon
1-61
Page 76
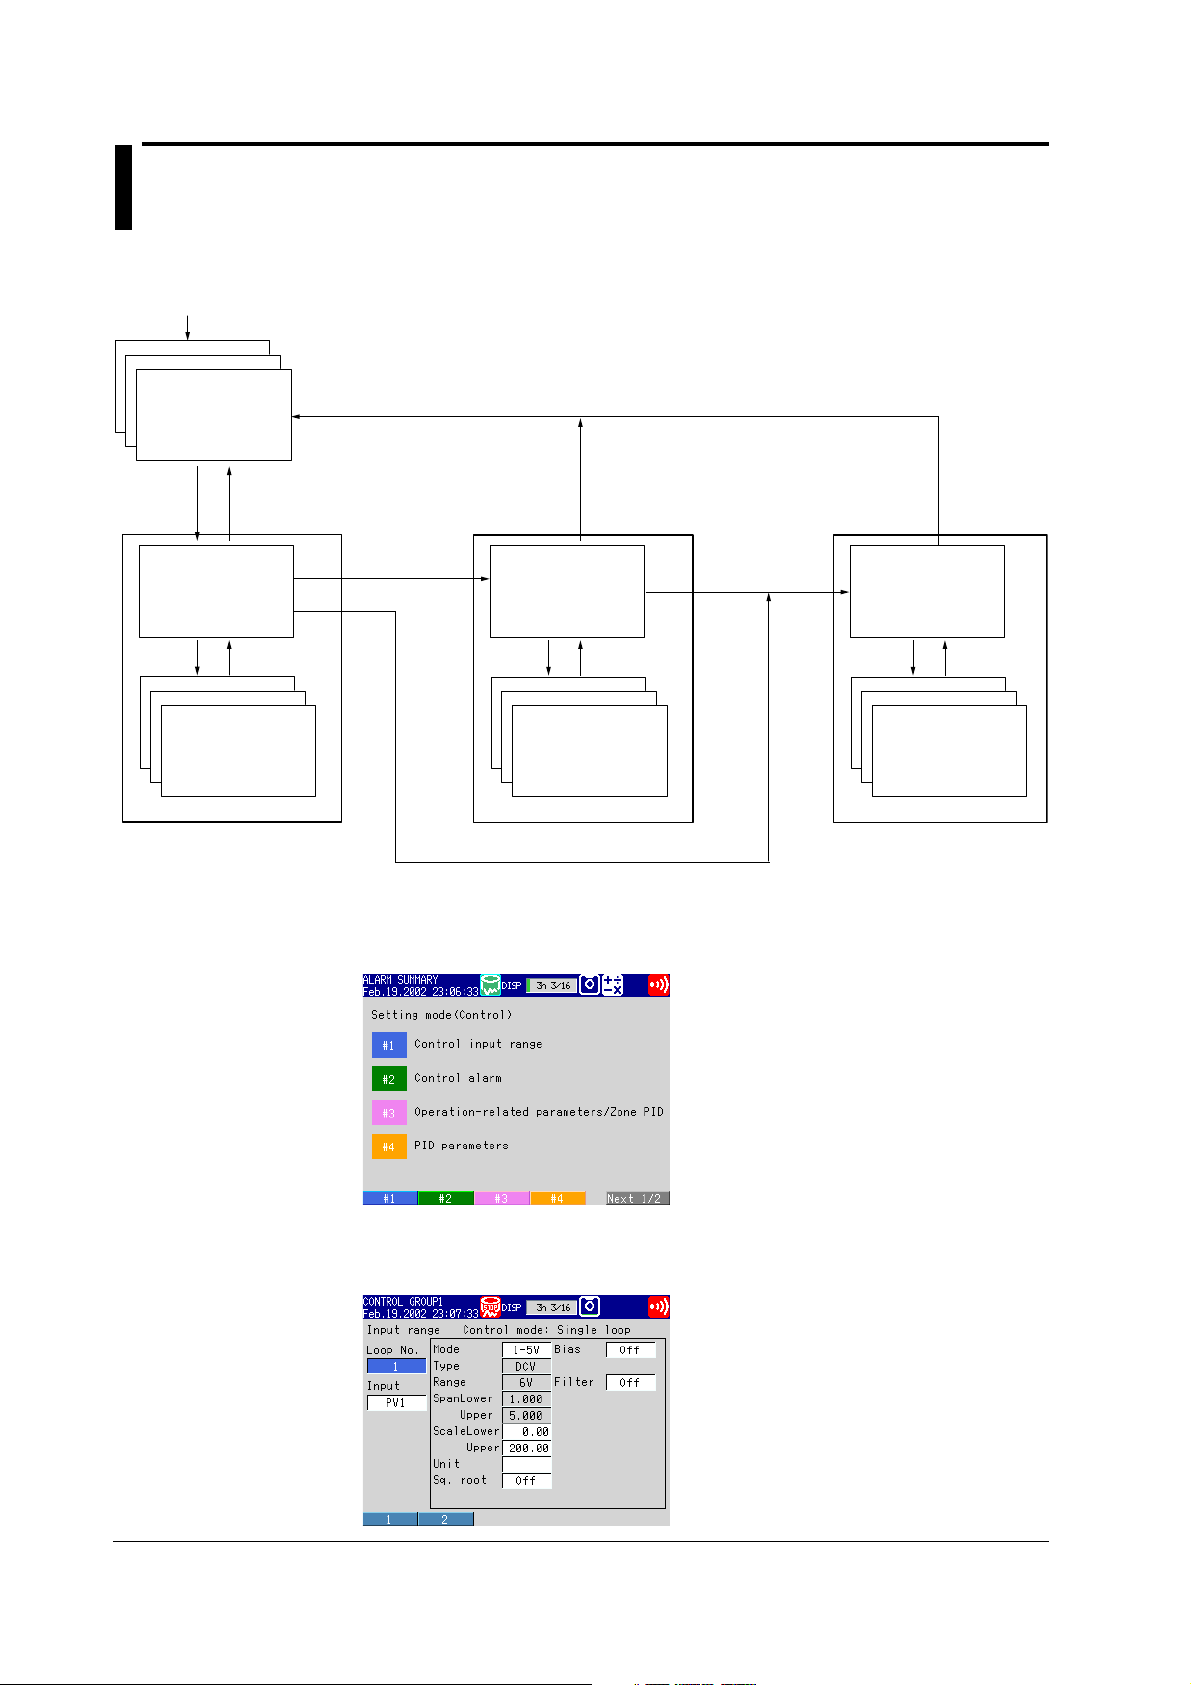
1.16 Display Function
Display Types and Switching Operation
As indicated in the following figure, key operation is used to switch the displays.
Power ON
Operation mode
Operation display
[End] soft key -> DISP/ENTER key
(This operation saves the settings made in the basic setting mode.)
MENU key
ESC key
Control setting mode
[Setting mode (Control)]
Menu
Soft keys
MENU key or
ESC key
Setup display
(#1 to #7)
*
#1 to #8 when program
control is ON.
MENU key or ESC key
Common and measurement setting mode
[Set mode]
MENU key
Press the FUNC
key for 3 s
Soft keys
Menu
MENU key or
ESC key
Press the FUNC
key for 3 s
Setup display
(#1 to #11)
Menu
This display is used to select the necessary setup items.
• Selection Display for Control Related Setup Items
Basic setting
mode
Menu
Soft keys
Setup display
(#1 to #12
**
#1 to #11: Basic common and
measurement
settings
#12: Basic control settings
ESC key
**
)
Setting Display
This display is used to set various parameters for the selected item.
• Control Input Range Setting Display
1-62 IM 04L31A01-03E
Page 77

1.16 Display Function
Operation Display
This display is used to monitor the operation status and carry out control operations such
as running and stopping the operation.
• Control Group Display (Controller Style) for Monitoring the Control Status and
Performing Control Operations
• Trend Display of Measured Data
1
Explanation of Functions
Display Construction
The display consists of the operation status indication section, data display section, and
the soft key menu. However, on the measurement operation display, the [FUNC] key
must be pressed to show the soft key menu.
[Control Group Display (Faceplate Style) Example]
Operation status
display section
Control data
display section
Soft key menu
IM 04L31A01-03E
1-63
Page 78

1.16 Display Function
• Operation Status Indication Section
The following information is displayed in the status display section during operation
mode and setting mode. (The information is not displayed during basic setting mode.
[Setup Mode] is displayed instead.)
(When set to display data only)
2
3
1
(When set to [Free])
(When set to [Trigger] or [Rotate])
4
A
B
C
7
6
When the internal
memory is partitioned
into 16 blocks
859
10
11
D
E
F
G
1. User name
The user name is displayed when the key login function is used and the user is logged in.
2. Group name or display name
The display name or group name corresponding to the display shown on the data display
section. [ALL] is displayed only when all channels are displayed on the trend display.
3. Current date and time
The current date and time are displayed.
4. Data acquisition to the internal memory ON/OFF
A and B is alternately displayed: Data being acquired or waiting for a trigger for event data.
C: Data acquisition stopped
Note
For event data that starts sampling when the trigger condition is met, the display indicates
that sampling is in progress even in the trigger wait state. The trigger wait state can be
determined on the bar graph.
5. Memory usage of the display data acquisition area in the internal memory
Displayed when acquisition of display data is enabled.
• Bar graph
Indicates the amount of display data acquisition area that is being used.
• Time display
Remaining time of the display data acquisition area. When the remaining time
becomes short, the time is displayed in units of minutes.
Remaining time Unit
100 days or more % (Percentage of the remaining area in the display data acquisition area)
100 hours or more to Days (time unit less then one day is truncated)
less than 100 days
60 minutes or more to Hours (time unit less then one hour is truncated)
less than 100 hours
Less than 60 minutes Minutes (time unit less then one minute is truncated)
• n/16
The maximum number of display data files that can be written to the internal
memory is 16. “16” represents this value.
The value n is the number of display data files in the internal memory.
1-64 IM 04L31A01-03E
Page 79

1.16 Display Function
Note
In the following cases, the display data is overwritten from the oldest file. Use caution
because the overwritten data is lost forever.
• When there is no more remaining time of the display data acquisition area in the internal
memory
At this point, the status display section shows [Overwrite].
• When the number of display data files in the internal memory has exceeded 16
6. Memory usage of the event data acquisition area in the internal memory
Displayed when acquisition of event data is enabled.
• When the acquisition mode is [Free]
• Bar graph
Indicates the amount of event data acquisition area that is being used.
• Time display
Remaining time of the event data acquisition area. When the remaining time
becomes short, the time is displayed in units of minutes.
Remaining time Unit
100 days or more % (Percentage of the remaining area in the event data acquisition area)
100 hours or more to Days (time unit less then one day is truncated)
less than 100 days
60 minutes or more to Hours (time unit less then one hour is truncated)
less than 100 hours
Less than 60 minutes Minutes (time unit less then one minute is truncated)
1
Explanation of Functions
• n/16
The maximum number of event data files that can be written to the internal
memory is 16. “16” represents this value.
The value n is the number of event data files in the internal memory.
Note
In the following cases, the event data is overwritten from the oldest file. Use caution because
the overwritten data is lost forever.
• When there is no more remaining time of the event data acquisition area in the internal
memory
The status display section shows [Overwrite].
• When the number of event data files in the internal memory has exceeded 16
• When the mode is [Trigger] or [Rotate]
• Bar graph
Displays the acquisition time (amount of memory used with respect to the
data length) of the specified event data.
When pretrigger is specified and START is pressed causing the CX1000 to
enter the trigger wait state, data of size equal to the pretrigger amount is
acquired to the internal memory. At this point the bar is displayed in orange.
After acquiring the data of size equal to the pretrigger, the length of the bar
stays fixed. However, the relevant data is updated until the trigger condition
is met. When the trigger condition is met, the bar turns green. Data is
acquired to the internal memory after the pretrigger data.
If data acquisition to all blocks is finished in [Trigger] mode, [Full] is displayed
in the bar. When [Full] is displayed, event data is not acquired to the internal
memory even if the trigger condition is met.
IM 04L31A01-03E
1-65
Page 80

1.16 Display Function
• Block display
When the event data acquisition area is divided into multiple blocks, the block
usage is displayed.
White blocks: Blocks with no data.
Green blocks: Block containing data that was acquired to the internal
memory after starting the current acquisition of event data.
Gray blocks: Blocks containing previous data.
7. Icon indicating the external storage medium status
If E and F are displayed alternately, the external storage medium is being
accessed. If the icon is not displayed, this indicates that an external storage
medium is not inserted in the drive. Other indications are as follows.
D: The operation cover on the front panel is open.
F: External storage medium waiting (not being accessed).
G: The green level inside the icon indicates the amount of the external storage medium
used. If the remaining amount falls to 10% or less, the color changes to red.
Note
• The CX1000 detects whether an external storage medium is inserted in the drive when the
operation cover is closed.
• To prevent adverse effects from dust, use the CX1000 with the door closed.
8. Computation icon (only on models with the computation option)
No computation mark is displayed: No computation option or computation is stopped.
White computation icon: Computation in progress.
Yellow computation icon: Computation dropout occurred.
Note
Computation dropout occurs when the computation process cannot be completed within the
scan interval. Press “FUNC > [Math ACK] soft key” to set the icon back to a white
computation icon. If computation dropouts occur, increase the scan interval or reduce the
number of computation channels that are turned on.
9. Key lock icon
Key icon: Key locked
No indication: No key lock
10. E-mail transmission function icon
Displayed when the e-mail transmission function (see the
Communication Interface User’s Manual
) is enabled.
11. Alarm icon
Displayed when any one of the alarms is occurring.
• Data Display Section
The control operation display shows the PV input values, SPs, and OUT for
monitoring the control status, tuning information, and so on. The measurement
operation display shows the trend display, digital display, and bar graph display of the
measured and computed data as well as alarm, message, and file information. For
details on the displayed contents, see the following pages.
CX1000/CX2000
1-66 IM 04L31A01-03E
Page 81

1.16 Display Function
Setting Groups
The control monitoring data and measured/computed data on the operation display are
shown in groups. Therefore, control loops and measurement channels must be
assigned to groups.
Setting Control Groups (for the Control Function)
Up to four loops by combining internal and external loops can be assigned to each
group. In addition to internal and external loops, measurement channels can also be
assigned. You can assign up to four groups and assign a group name to each group for
easy identification.
Setting Measurement Groups (for the Measurement Function)
Measurement channels or computation channels are assigned. Up to six groups can be
registered. The groups are common to the trend, digital, and bar graph displays.
On the trend, digital, and bar graph displays, the displayed groups can be automatically
switched at “5 s,” “10 s,” “20 s,” “30 s,” or “1 min” intervals.
For trend display, the waveform of all applicable channels can be displayed on a single
display rather than in groups.
Displaying Tags
For identifying the control loops and channels, tags (tag comments can also be assigned
to control loops) can be displayed in place of numbers.
Control Operation Display > Control Group Display
Loop selection
cursor
Tag name
Tag comment
display section
Remote (REM) or local (LOC)
1
Explanation of Functions
Operation running (RUN), operation stopped (STP),
or auto tuning (blinking AT)
Auto/manual
PV input value
Target setpoint
Control output value
*
Red when alarm
is occurring
Alarm mark
*
*
*
Scale
(The value indicates span
lower limit or upper limit.)
Process value (PV)
Red: Alarm occurrence
Green: Alarm OFF
Control output value (OUT)
Red: Controllable
Yellow: Not controllable
PV input value
Upper limit alarm
Red: Alarm occurrence
Green: Alarm OFF
Target setpoint (SP)
Red: Can be set
Yellow: Cannot be set
IM 04L31A01-03E
1-67
Page 82

1.16 Display Function
Control Operation Display > Tuning Display
Control parameter setup
display section
PID number
Item name
Control Operation Display > Overview Display
Red indication
when alarm is
occurring
Loop selection cursor
Control status indication section
(similar to the display on the
faceplate control group display)
Setup display
AT: PID number being auto tuned
SP No.: Current target setpoint number
PID No.: Current PID number
Group No.: PID number of the tuning
parameter to be manipulated
Trend waveform display of PV (green),
Time
SP (red), and OUT (yellow)
Tag name and tag comment
Remote (REM) or local (LOC)
Run (RUN)/Stop (STP)/
auto tuning (blinking AT)
Auto/manual
PV input value
Target setpoint
Control output value
1-68 IM 04L31A01-03E
Page 83
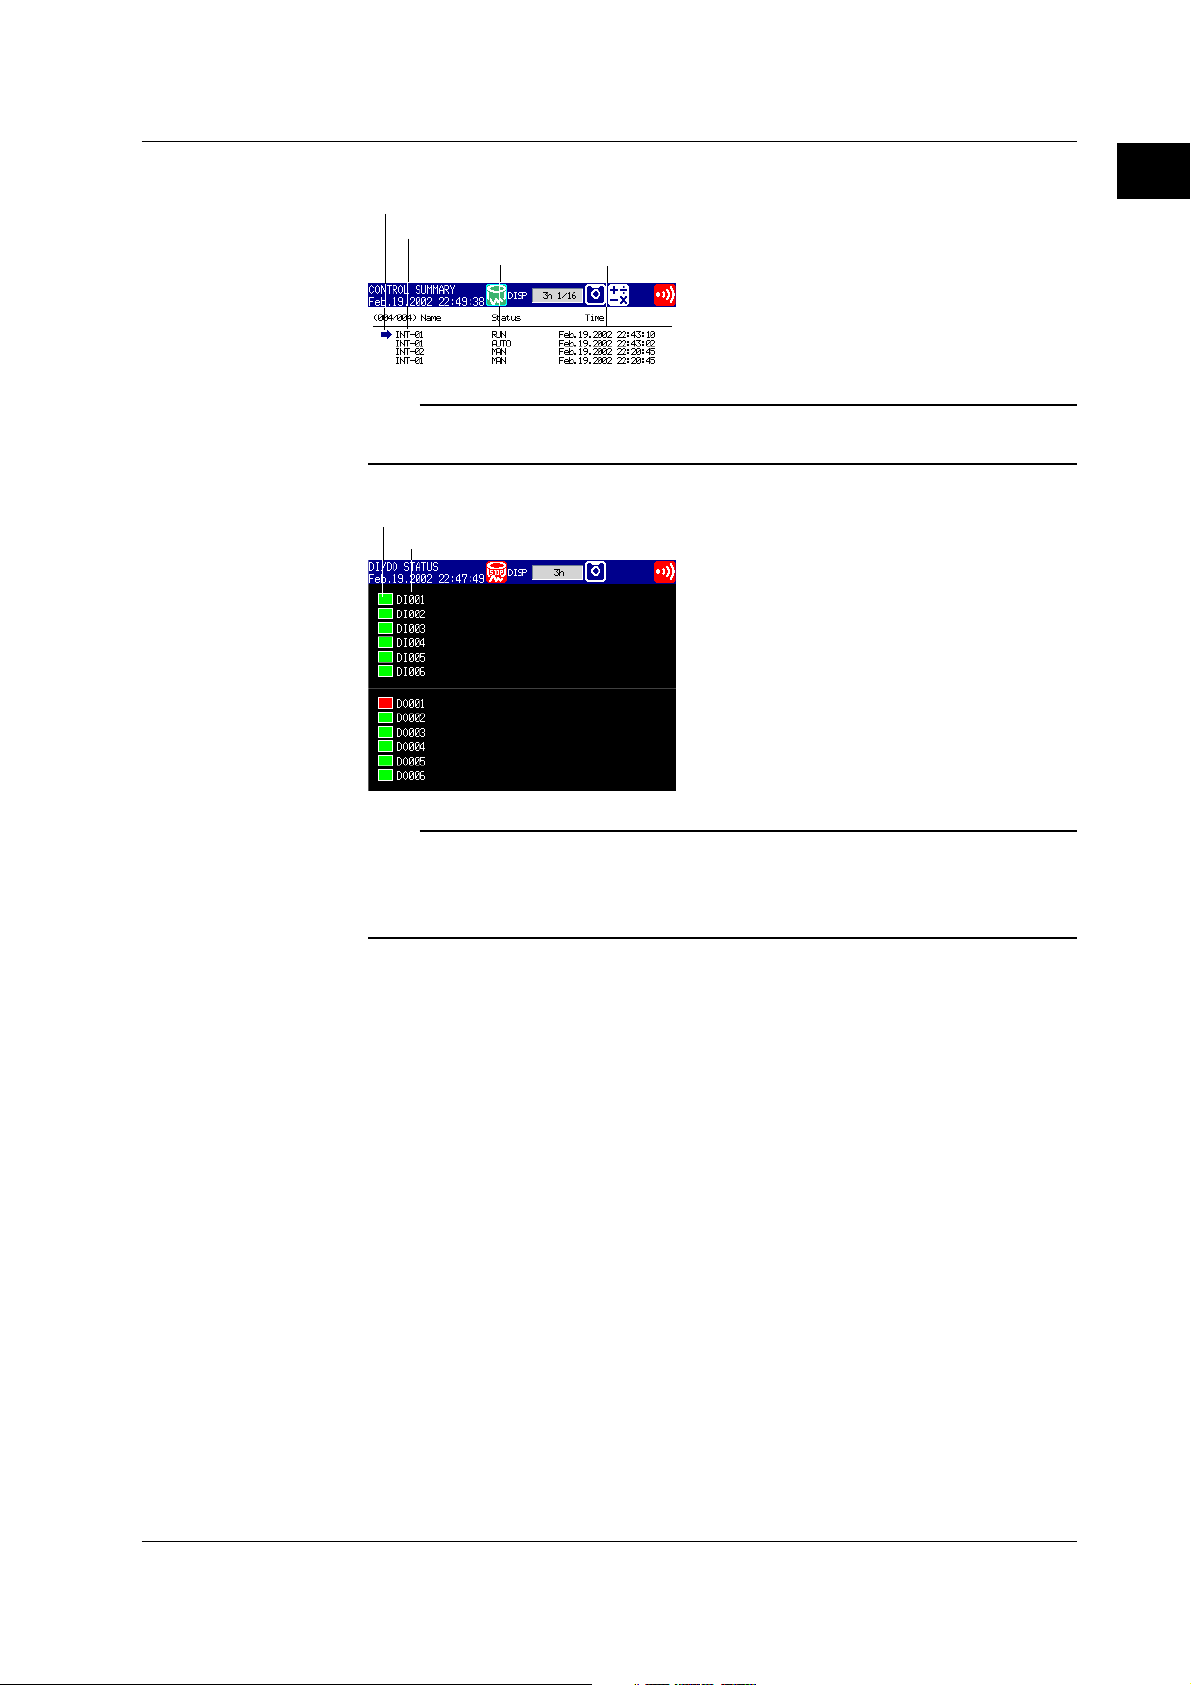
1.16 Display Function
Control Operation Display > Control Action Summary Display
Item selection cursor
Tag name + tag comment or "Program"
Operation status
Date and time of occurrence
Note
The status indicates “****,” if an error is occurring on an external loop using the optional
Green series communication function.
Control Operation Display > DI/DO Status Display
Contact ON/OFF (red: ON, green: OFF)
Contact number (DI: input, DO: output)
1
Explanation of Functions
Note
Contact displays with numbers “DOXXX” indicate the alarm output status, not the ON/OFF
status of the output. For example, if the energize/de-energize setting of an alarm output relay
is set to “de-energize,” the indication turns red when an alarm occurs to indicate that it is deenergized.
IM 04L31A01-03E
1-69
Page 84

1.16 Display Function
Control Operation Display > Trend Display
Displayed Information and Display Direction
In addition to the waveforms of measured/computed data, PVs, SPs, and OUT of
internal/external control loops are also assigned to channels and displayed. The display
direction of the waveform can be set to horizontal or vertical as show in the following
figure. Numeric values can be displayed along with waveforms.
Note
For a description of the assignment of internal control channels (internal loop channels) and external
control channels (external loop channels), see channel assignment explanation on
Trend (Vertical) Display
Trend (Vertical, All Channels) Display
page 1-83
Scale
Display update rate
Message (message mark, time, and message)
Trip line
Channel No. or tag name
Measured or computed value
Unit
Alarm mark
Numerical
display section
(digital display
section)
.
Waveforms of all channels that are
set to display the trend
Data of the selected group
Trend (Horizontal) Display
Type 1 Typ e 2
Displayed Info Description
Message Messages specified by the user can be displayed at arbitrary points in time. For example, by displaying a
message when a certain operation is carried out, the point at which the operation is carried out can be seen
visually. Displayed messages are saved.
Trip line You can display a line to indicate a particular value of interest (trip line) for each group. You can select the thickness
Scale A scale appropriate for the measured item can be displayed for each channel. The number of divisions of the display
of the displayed line from three types: 1, 2, or 3 dots. Up to four trip lines can be displayed on a single group.
scale created by the main scale marks can be set to a value in the range 4 to 12 divisions (also applies to the bar
graph display). Medium and small scale marks are displayed in between the main scale marks. You can select
whether or not to display the scale for each channel and the display position.
1-70 IM 04L31A01-03E
Page 85

1.16 Display Function
Updating the Waveform and Updating the Numerical Display
One division on the CX1000 consists of 30 dots along the time axis on the LCD. The
displayed waveform is updated at an interval corresponding to one dot. This interval is
determined by the time corresponding to one division (referred to as the display update
rate). The relationship between the display update rate and the speed of movement of
waveforms is as follows. Measured/computed values of the numerical display are
updated every second (every 2 s if the scan interval is set to 2 s on the).
Display Update Rate (/div) 1 min 2 min 5 min 10 min 20 min 30 min 1 h 2 h 4 h 10 h
Speed of Movement of 594 297 119 59 30 20 10 5 2.5 1.0
Waveforms (approximate value, mm/h)
Note
The speed of movement of the trend display along the time axis is derived from the following
equation given the dot pitch of the LCD (0.33 mm).
The speed of movement of the trend display along the time axis = 30 (dots) × 0.33 (mm) × 60
(min)/display update rate (min)
Display Format of Waveforms
The data shown on the display consists of maximum and minimum values of the data
that is sampled at the scan interval, within the time period corresponding to one dot.
1
Explanation of Functions
Maximum value
Minimum value
1 division (30 dots)
{
1 minute
{
2 s (1 dot)
If the display update rate is set to 1 minute, the time corresponding
to 1 dot (sampling interval of display data) is 2 s. For example,
if the scan interval is 250 ms, the input signal is sampled 8 times
within a 2-s interval. The maximum and minimum values of the data
sampled eight times are used as display data.
The time period corresponding to one dot is called “the sampling interval of displayed
data.” The sampling interval of displayed data is determined by the display update
interval. The relationship between the display update rate and the sampling interval of
displayed data is as follows:
Display Update Rate (/div) 1 min 2 min 5 min 10 min 20 min 30 min 1 h 2 h 4 h 10 h
Sampling interval of 2 4 10 20 40 60 120 240 480 1200
displayed data (s)
Zone Display
The waveform display range is called a zone. You can display channels by setting a
zone for each channel. Displaying the waveforms in separate zones facilitates reading
of the waveform. In the example in the figure, channel 1 is displayed in the 0 to 30%
zone, channel 1 in the 30 to 60% zone, and channel 3 in the 60 to 100% zone.
When zone display is not used When zone display is used
Time axis
100%
CH3
CH2
CH1
Time axis
100%
Zone 3
60%
Zone 2
30%
Zone 1
0%0%
IM 04L31A01-03E
1-71
Page 86

1.16 Display Function
Partial Expanded Display
This function compresses a section of the waveform display range and expands the rest
of the section. In this function, you specify the destination position (the new boundary
position) where a single value (boundary point) in the display range is moved. In the
example in the figure, 0 V (boundary value) is moved to the 30% position of the display
range (new boundary position). The 30% below the boundary corresponds to “–6 V to 0
V” and 70% above the boundary corresponds to “0 V to 6 V.”
When partial expanded display is usedWhen partial expanded display is not used
Measured
value
6V
Percentage with
respect to the
display span
100
Measured
value
6V
Percentage with
respect to the
display span
100
Boundary
Time axis
Waveform color and line thickness
The waveform color can be set or changed for each channel. The waveform color and
the bar color in the bar graph display are the same.
You can select the thickness of the waveform line from 1 to 3 dots. The thickness of the
line cannot be set separately for each channel.
Control Operation Display > Digital Display
Displays the measured, computed, and control data numerically using large numbers.
New
500
0
Time axis
Channel No. or tag name
Specified alarm
Measured or computed value
Unit
boundary
position
30
0–6V–6V 0
Expanded section
Reduced
section
Updating of the Numerical Display
Measured/computed values are updated every second (every 2 s if the scan interval is
set to 2 s).
1-72 IM 04L31A01-03E
Page 87

1.16 Display Function
Control Operation Display > Bar Graph Display
Displays the measured, computed, and control data using bar graphs.
Bar Graph (Horizontal) Display
Bar graph (displayed using
the channel display color)
Alarm setpoint mark
Left end value of the scale
Bar Graph (Vertical) Display
Alarm setpoint mark
Scale
Right end value of the scale
1
Explanation of Functions
Measured or computed value
Unit
Channel No. or tag name
Alarm that is occurring
Specified alarm
Channel No. or tag name
Specified alarm
Top scale value
Scale
Bottom scale value
and unit
Bar graph (Channel display color)
Measured or computed value
Updating of the Bar Graph and Numerical Displays
Measured/computed values and bar graphs are updated every second (every 2 s if the
scan interval is set to 2 s).
Displayed Information
The following items can be displayed:
Function Description
Display direction The bar graph can be displayed vertically or horizontally.
Reference position When the bar graph is displayed horizontally, the starting point of the bar
Display color The displayed color of bar graphs can be specified for each channel. The
Scale display Main scale marks are displayed for each channel. You can select the number
(reference position) can be set to standard (Left or right end of the scale,
whichever the value is smaller) or the center.
display color is common to the trend display color.
of divisions created by the main scale marks from 4 to 12. This is common
with the number of scale divisions of the trend display.
IM 04L31A01-03E
1-73
Page 88

1.16 Display Function
Control Operation Display > Overview Display
A list of measured/computed values and alarm conditions of all measurement/
computation channels is displayed. You can move the cursor to select a channel and
display the trend or bar graph of the group containing the selected channel. For the
procedure in displaying the overview display, see section 8.5.
The type of alarm that is occurring
Channel selection cursor
Measured or
computed value
Channel No. or tag name
Update Rate of the Numerical Display
Measured/computed values are updated every second (every 2 s if the scan interval is
set to 2 s).
Area of channels on which an alarm
is not occurring is indicated in green
Area of channels on which an alarm
is occurring is indicated in red
Control/Measurement Common Operation Display > Alarm Summary
Lists the newest control alarms and measurement alarms. By scrolling the display using
the arrow keys, up to 120 incidents can be displayed. By selecting an alarm from the list
using up and down arrow keys, the historical trend of the display data or event data
containing the alarm can be recalled. For a description on the historical trend display,
Alarm selection
cursor*
see the section
Number of the alarm information displayed on the bottom line
Alarm status indication mark
Select a alarm using the cursor and select [INFORMATION] > [JUMP TO HISTORY]
*
on the display selection menu to display the data historical trend containing the
selected alarm information.
Note
• You can also display only the control alarms (see
• Alarm type indicates [ETC], if the alarm is an external loop and the alarm is of a type other
“Measurement Operation Display > Historical Trend”
Number of the alarm information in the internal memory (120 max.)
Control loop name (tag name + tag comment)/channel number (or tag name)
Alarm number (1, 2, 3, 4)
Alarm type (See page 4-24 for the meaning of control alarm symbols.
Control alarm: PVH, PVL, SPH, SPL, OTH, OTL, DVH, DVL, DVO, DVI, ETC (see Note below)
Measurement alarm: H, L, h, l, R, r, T, t
Date and time when
the alarm occurred
than the control alarms that you can specify on the CX1000.
See page 7-8 for the meaning of measurement alarm symbols.)
Date and time when
the alarm was released
page 8-1
).
.
1-74 IM 04L31A01-03E
Page 89

1.16 Display Function
Control Operation Display > Message Summary
A list of written messages and the time the messages were written is displayed.
• Up to 120 sets of message information can be stored to the internal memory. When
the number of message information exceeds 120, the information is overwritten from
the oldest information.
• By scrolling the screen using up and down arrow keys, the message information in the
internal memory can be displayed.
• By selecting a message from the list using up and down arrow keys, the historical
trend of the display data or event data containing the message can be recalled. For a
description on the historical trend display, see “
Trend
” in this section.
Number of the message displayed on the bottom line
Number of messages in the internal memory
Date/time when message as written
Name of the user who wrote the message
(only when the key login function is used)
Message string
Cursor
(Select a message using the cursor and select [INFORMATION] > [JUMP TO HISTORY]
on the display selection menu to display the data historical trend containing the
selected message.)
Control Operation Display > Memory Summary
The information pertaining to the display data and event data in the internal memory is
displayed.
• By selecting the display data or event data using the arrow keys, the historical trend
display can be recalled. For a description on the historical trend display, see “
Operation Display > Historical Trend
• The number of manual sampled data, TLOG data (/M1 option), and report data (/M1
option) residing in the internal memory are displayed.
• For models that have the alarm output relays (option), the ON/OFF status of the
relays are also listed.
Number of data points in the internal memory/maximum number
of data points that can be acquired in the internal memory
Date/time when the newest
data was acquired
1
Explanation of Functions
Control Operation Display > Historical
Control
” in this section.
IM 04L31A01-03E
Data type (switch usin
left and right arrow keys)
• Display data
Date/time when
the data
acquisition
ended
Date/time when the data
acquisition started
Cursor
(Select the data using the cursor and select [INFORMATION] > [JUMP TO HISTORY]
on the display selection menu to display the historical trend of the selected data.)
Factor causing the end of data
acquisition
Sampling count
• Event data
1-75
Page 90

1.16 Display Function
Control Operation Display > Report Data (Optional Function)
Report data residing in the internal memory can be displayed.
The report function is used to write the average, minimum, maximum, and sum at
specified intervals for the specified channels. Reports can be made hourly, daily,
weekly, or monthly.
Number of the report data being displayed
Number of report data in the internal memory
Type of report
Start date/time
Report date/time
Unit
Report data status
Channel No. or tag name
Average, maximum, minimum, and sum
Control Operation Display > Historical Trend Display
The waveform of the past display data* and event data* in the internal memory can be
displayed. This function is called “Historical trend.”
Methods of Displaying the Historical Trend
The following four methods are available in displaying the historical trend.
• Display from the alarm summary.
• Display from the message summary.
• Display from the memory summary.
• Display from the control action summary.
• Display from the program event summary (only on models with the program control
option)
• Recall from the screen menu.
Information Displayed on the Historical Trend
Alarm information and scales are not displayed on the historical trend display.
The background color is
the opposite of the trend
display color. (black or white)
Waveform display
(channel display color)
Date and time at the left
end on the time axis
Message
Zoom factor of the time axis
(using the display selection menu)
Time axis
Trip line
Position of the newest
displayed data
Date and time at the right
end on the time axis
Channel No. or tag name
Measured/computed value
(max. or min. value at the cursor position)
Measured/computed value
(max. or min. value over the entire display range)
This area is displayed
using the channel
display color.
Unit
Screen switch display
Up arrow key:
Display the all data display
(see the next page)
Down arrow key:
Half screen display of current
and historical trend (see the next page)
1-76 IM 04L31A01-03E
Page 91

1.16 Display Function
Operations on the Historical Trend Display
• The waveform can be scrolled along the time axis using the left and right arrow keys
(for horizontal display) or up and down arrow keys (for vertical display).
• The time axis can be expanded or reduced using the display selection menu ([TREND
HISTORY] > [ZOOM +] or [ZOOM -]).
• You can display all the data points on the historical trend display in a section of the
screen (all data display). When you move the cursor (yellow line) using the left and
right arrow keys (for horizontal display), the date and time of the acquisition of the
data at the cursor position are displayed. By pressing the down arrow key (for
horizontal display) after moving the cursor to return to the original display, you can
change the display position within the entire data. In the display that appears, the
data at the cursor position is shown at the right end of the display.
Cursor
All data display
Date and time at the cursor position
• You can display the information of the file displayed on the historical trend through the
display selection menu operation ([Historical Trend] > [Memory Information ON]).
File name and data type
Serial No. of the instrument
that sampled the data
Start/end time and user name
(User name is displayed only when
the key login function is used.)
1
Explanation of Functions
Half Screen Display (Only When Displaying the Historical Trend of the Display Data)
Using up and down arrow keys, you can have the left half of the display (lower half if the
trend display is vertical) show the historical data of the display data and the right half
(upper half if the trend display is vertical) show the display data currently being
measured.
Historical trend
(Display data only) Current trend
Current trend
information
IM 04L31A01-03E
1-77
Page 92
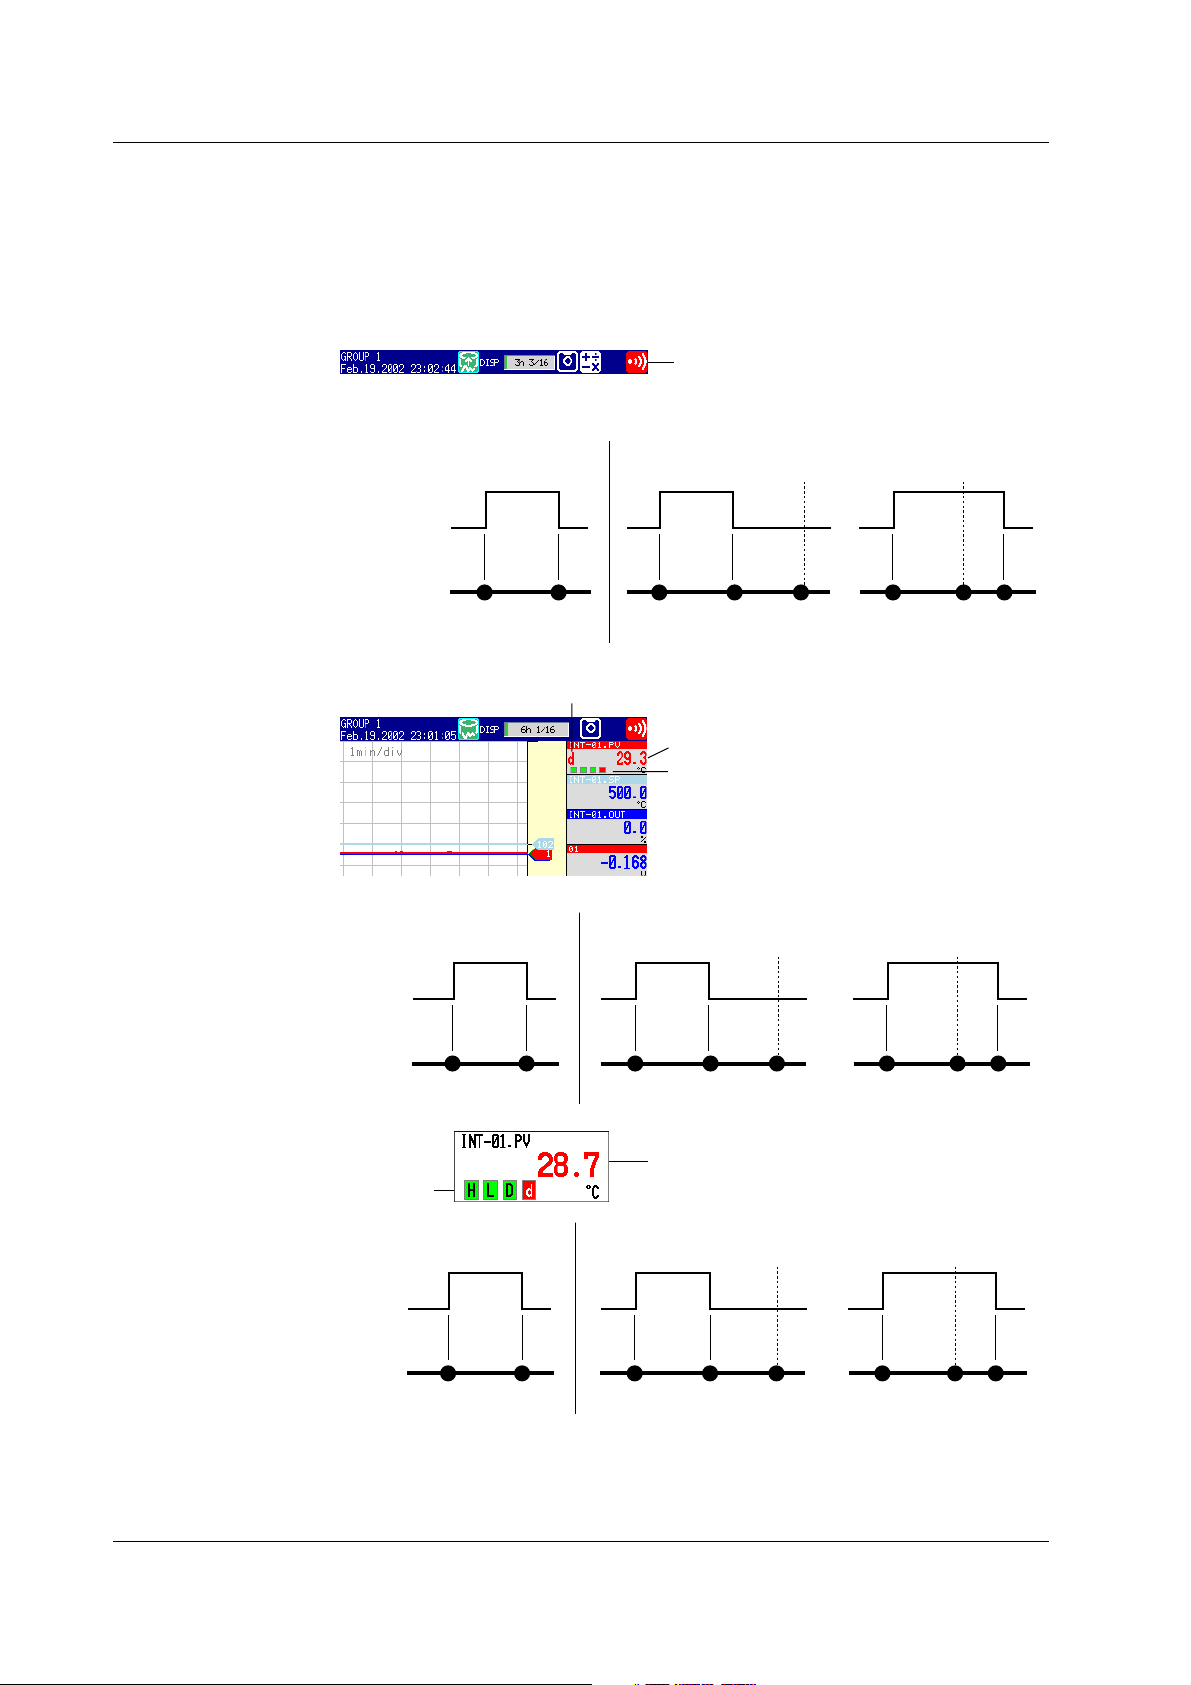
1.16 Display Function
Control Operation Display > Alarm Display
The measurement alarm status is indicated using an alarm icon on the status display
section (common with the control alarm) and the alarm indication on operation displays
such as the trend display. The displayed pattern varies depending on the non-hold/hold
mode of the alarm indication. In the explanation below, “Alarm ACK” refers to the alarm
release operation.
Alarm Icon in the Status Display Section
Alarm icon
Alarm
Alarm Indication on the Trend Display
Occurrence
Alarm
Release
Mark for the
specified alarm
Occurrence
Release
Alarm icon
When indication is
set to non-hold
When indication is
set to non-hold
Blinking
None Red None None None None NoneRed
red
indication
When indication is
set to hold
Alarm ACK
Blinking
green
indication
Alarm ACK
Blinking
red
indication
Alarm type
Measured value
Alarm mark
When indication is
set to hold
Alarm ACK Alarm ACK
red
Blinking
green
indication
Blinking
Green Green Green Green
indication
Blinking
red
indication
RedGreen Red Green
Alarm Indication on the Digital Display
Measured value
Alarm mark
When indication is
set to non-hold
When indication is
set to hold
Alarm ACK Alarm ACK
Occurrence
Alarm
Release
Mark for the
Green Green Green Green Green GreenRedRed
Blinking
red
indication
Blinking
green
indication
Blinking
red
indication
specified alarm
1-78 IM 04L31A01-03E
Page 93

k
.
1.16 Display Function
Alarm Indication on the Bar Graph Display
Occurrence
Alarm
Mark for the
specified alarm
Alarm Indication on the Overview Display
Alarm mark
Alarm setpoint mar
Measured value
When indication is
set to non-hold
When indication is
set to hold
Alarm ACK Alarm ACK
Release
red
Blinking
green
indication
Blinking
Green Green Green Green Green GreenRed Red
indication
Channel No. or tag name
Measured value
Cursor
Area of channels on which an alarm
is occurring is indicated in red
1
Explanation of Functions
Blinking
red
indication
Occurrence
Alarm
Release
Channel/Tag
Channel display
area color
Alarm type
When indication is
set to non-hold
When indication is
set to hold
Alarm ACK
Blinking
indication
*
Green Green Green Green Green GreenRed Red Red
*
When all the alarms occurring on the channel is acknowledged (alarm ACK)
Alarm ACK
Blinking
indication
*
IM 04L31A01-03E
1-79
Page 94

1.16 Display Function
Alarm information
selection cursor*
Alarm Summary Display
A list of the most recent alarms can be displayed.
• Up to 120 sets of alarm information can be stored to the internal memory. When the
number of alarm information exceeds 120, the information is overwritten from the
oldest information.
• By scrolling the screen using arrow keys, the alarm information in the internal memory
can be displayed.
• You can select arbitrary alarm information and show the historical trend of the display
data or event data that contains the alarm information.
For the operating procedure, see
Number of the alarm information displayed on the bottom line
Number of the alarm information in the internal memory (up to 120)
Control loop name (tag + tag comment)/channel number (or tag)
Alarm No. (1, 2, 3, 4)
Alarm type (See page 4-24 for the meaning of the control alarm symbols;
see page 7-8 for the meaning of the measurement alarm symbols.)
Control alarms: PVH, PVL, SPH, SPL, OTH, OTL, DVH, DVL, DVO, DVI, ETC (see Note below)
Measurement alarms: H, L, h, l, R, r, T, t
Date/Time when the
alarm occurred Date/Time when the alarm was released
section 8.1
.
Alarm status mark
* Select the alarm information using the cursor and select [INFORMATION] > [JUMP TO HISTORY]
on the display selection menu to display the historical trend containing the selected alarm
information.)
Note
• You can also display only the control alarms (see page 8-1).
• Alarm type indicates [ETC], if the alarm is an external loop and the alarm is of a type other
than the control alarms that you can specify on the CX1000.
Alarm Mark Indication
The mark indication varies depending on the hold/non-hold setting of alarm indication
(see section 1.6) as follows.
When indication is
set to non-hold
Occurrence
Alarm
Release
Mark
Red RedGreen Green Green
Setting the Display Conditions of the LCD
The following display conditions of the LCD can be configured.
Display Attribute Setting
Background color of The background color of the display can be set to white or black. The initial
the operation display setting of the control operation display is [Black]; the initial setting of the
LCD brightness The brightness of the LCD can be set between eight levels. The initial setting is [4].
Backlight saver The lifetime of the LCD backlight can be extended by automatically dimming
measurement operation display is [White].
the light when there is no key operation for a certain amount of time. The
display returns to the original brightness with a key operation or an alarm
occurrence. The initial setting is set so that the backlight saver is disabled.
Blinking
red
indication
When indication is
set to hold
Alarm ACK Alarm ACK
Blinking
green
indication
Blinking
red
indication
1-80 IM 04L31A01-03E
Page 95

1.17 Data Storage Function
Data Acquisition to the Internal Memory
Control Data
The following control related data can be acquired to the internal memory. Control
related data includes the PV, SP, and OUT of external loops created through Green
series communications (/CM1 optional function) in addition to those of internal loops.
Data Type Data Content
Display data Maximum/minimum values of PVs, SPs, and OUTs for every interval of acquisition to the internal
Event data Instantaneous value of PV, SP, and OUT at every specified sampling interval.
Manual sampled data Data in ASCII format containing the time and PV at the time of key operation or remote input.
Alarm summary data Channel on which alarm is occurred, alarm type, and time of occurrence and release.
Event summary data Loop number at which the time event or PV event occurred and the time of occurrence and release.
Operation mode Information of operation mode switching.
summary data
memory.
Internal control channel (internal loop channel) assignments
The data of two loops is assigned to channel numbers as follows.
Loop 1 PV: 101, Loop 1 SP: 102, Loop 1 OUT: 103
Loop 2 PV: 104, Loop 6 SP: 105, Loop 6 OUT: 106
External control channel (external loop channel) assignments
The data of 4 loops is assigned to channel numbers as follows.
External loop 1 PV: 201, External loop 1 SP: 202, External loop 1 OUT: 203
•••
External loop 4 PV: 210, External loop 4 SP: 211, External loop 4 OUT: 212
Measurement Data
• Display data and event data
The measured/computed/control data can be written to two types of data, display data
and event data, in the internal memory of the CX1000.
Display data
Data used to display waveforms on the CX1000 display. Display data consists of maximum
and minimum values of the measured or computed data sampled at the scan interval within
the time period corresponding to one dot on the time axis on the display. The display data
that is saved can be likened to the conventional recording on the chart sheet and is useful for
observations of long-term changes. The data is saved in binary format.
Event data
Event data consists of instantaneous values of the measured/computed/control data at
specified sampling intervals. This is useful when you wish to observe the measured/
computed/control data more in detail than display data. If the sampling interval is set to
the same value as the scan interval, all the measured or computed data sampled at the
scan interval can be acquired to the internal memory. The data is saved in binary
format.
Max. value per sampling interval
Min. value per sampling interval
Display data
1
Explanation of Functions
IM 04L31A01-03E
Event data
Measured/computed/
control data per scan
interval
Scan interval
Sampling interval of event data
Sampling interval of dislay data (time equivalent to 1 dot on the display)
Time
1-81
Page 96

1.17 Data Storage Function
Internal memory size
The size of the internal memory for acquiring display data and event data is 1.2 MB. When
the measured/computed/control data is saved using both display data and event data, 0.9 MB
and 0.3 MB of memory is used for display data and event data, respectively.
CX1000
internal
memory
1
2
3
4
DISP/
ENTER
When set to display data only When set to event data only When set to display data and event data
1.2 MB
Display data
1.2 MB
Event data
0.9 MB
Display data Event data
0.3 MB
Data to be acquired and selecting the acquisition mode of event data
You can select “display data only,” “display data and event data,” or “even data only”
for the items to be acquired (“Data type” in the settings). If “display data and event
data” or “event data only” is selected, you can select the acquisition mode (“Mode” in
the settings) from “Free,” “Trigger,” or “Rotate.” Refer to the following examples to
make the appropriate selection for your application.
• Acquire only the display data at all times
Data to be acquired: Display data only
• Acquire display data in normal cases and acquire event data around the alarm
occurrence when alarms occur
Data to be acquired: Display data and event data.
Acquisition mode: Trigger or rotate
• Acquire event data at all times
Data to be acquired: Event data only. Acquisition mode: Free
• Acquire event data only when alarms occur
Data to be acquired: Event data only. Acquisition mode: Trigger or rotate
Block segmentation during event data acquisition
In the acquisition of event data, the acquisition area in the internal memory can be
divided into blocks (block segmentation). The acquisition operation varies depending
on whether the acquisition area is divided into blocks for each mode. For detailed
information, see “Acquisition Mode of Event Data” in appendix 1, “Supplementary
Explanation of the Acquisition of Display Data/Event Data to the Internal Memory.”
You can select the number of blocks from 2, 4, 8, and 16.
• Manual sampled data
Every time a given key operation is carried out, all measured/computed/control data
(instantaneous values) at that point is acquired to the internal memory except for
measurement channels that are skipped and computation channels that are turned OFF.
• TLOG data (only on models with the computation function option)
All the measured/computed data (instantaneous data) of all channels can be acquired
to the internal memory at the preset interval. However, this excludes measurement
channels that are skipped and computation channels that are turned OFF.
• Report data (only on models with the computation function option)
The average, maximum, minimum, and sum can be computed for the specified
channels at the preset interval, and the result can be acquired to the internal memory.
You can select one hour (hourly report), one day (daily report), one hour/one day
(hourly and daily), one day/one week (daily and weekly reports), or one day/one
month (daily and monthly reports) for the interval.
1-82 IM 04L31A01-03E
Page 97

1.17 Data Storage Function
Saving Data to the External Storage Medium
The data acquired to the internal memory can be saved to an external storage medium.
The following two methods are available in saving the data.
Manual Save
The data in the internal memory is saved to the external storage medium, only when the external
storage medium is inserted into the drive. You can specify whether to save the entire data in the
memory or only the data that have not been saved to the external storage medium beforehand.
Auto Save
Have the external storage medium inserted in the drive at all times. Data storage to the
external storage medium is done automatically.
Note
• If an external storage medium is not inserted when the data save operation is started
during “auto save” mode, the unsaved data is saved the first time the specified interval
elapses after an external storage medium is inserted.
• If the acquisition of the display data to the internal memory or acquisition of the event data
to the internal memory in free mode is started, you can save the display data or event data
at any time by operating the “[FUNC] key > soft key” even during auto save mode.
• Display data
The display data in the internal memory is closed as a single file at the specified interval or at
the specified date and time and saved to the external storage medium in binary format.
Examples of data save operation to the external storage medium
Example 1
Auto save interval or data length: 1 day
Date and time when data is saved to the external storage medium: Not use
After starting at 13:10, data is saved every day at 13:10 to the external storage medium.
7/19 13:10 7/20 13:10 7/21 13:10 7/22 13:10
1
Explanation of Functions
Memory start
Example 2
Auto save interval or data length: 1 day
Date and time when data is saved to the external storage medium: 0 hour every day.
After starting at 13:10 on July 19th, data is saved at 0 hour on July 20th and then every
day after and at 0 hour every day (the same time for both in this example).
7/19 13:10 7/20 0:00 7/21 0:00 7/22 0:00
Memory start Saved to the external
Example 3
Auto save interval or data length: 12 hours
Date and time when data is saved to the external storage medium: 0 hour every day.
After starting at 13:10 on July 19th, data is saved at 0 hour on July 20th and then every
12 hours after and at 0 hour every day
(0 hour occurs at the same time as the 12 hour timing).
7/19 13:10 7/20 0:00 12:00 12:00 12:007/21 0:00 7/22 0:00
Memory start Saved to the external
Example 4
Auto save interval or data length: 2 days
Date and time when data is saved to the external storage medium: 0 hour every day.
After starting at 13:10 on July 19th, data is saved at 0 hour on July 20th and then every
2 days after and at 0 hour every day (the 2-day timing occurs at the same time as 0 hour).
7/19 13:10 7/20 0:00 7/21 0:00 7/22 0:00
storage medium
storage medium
Saved to the external
storage medium
IM 04L31A01-03E
Memory start Saved to the external
storage medium
1-83
Page 98
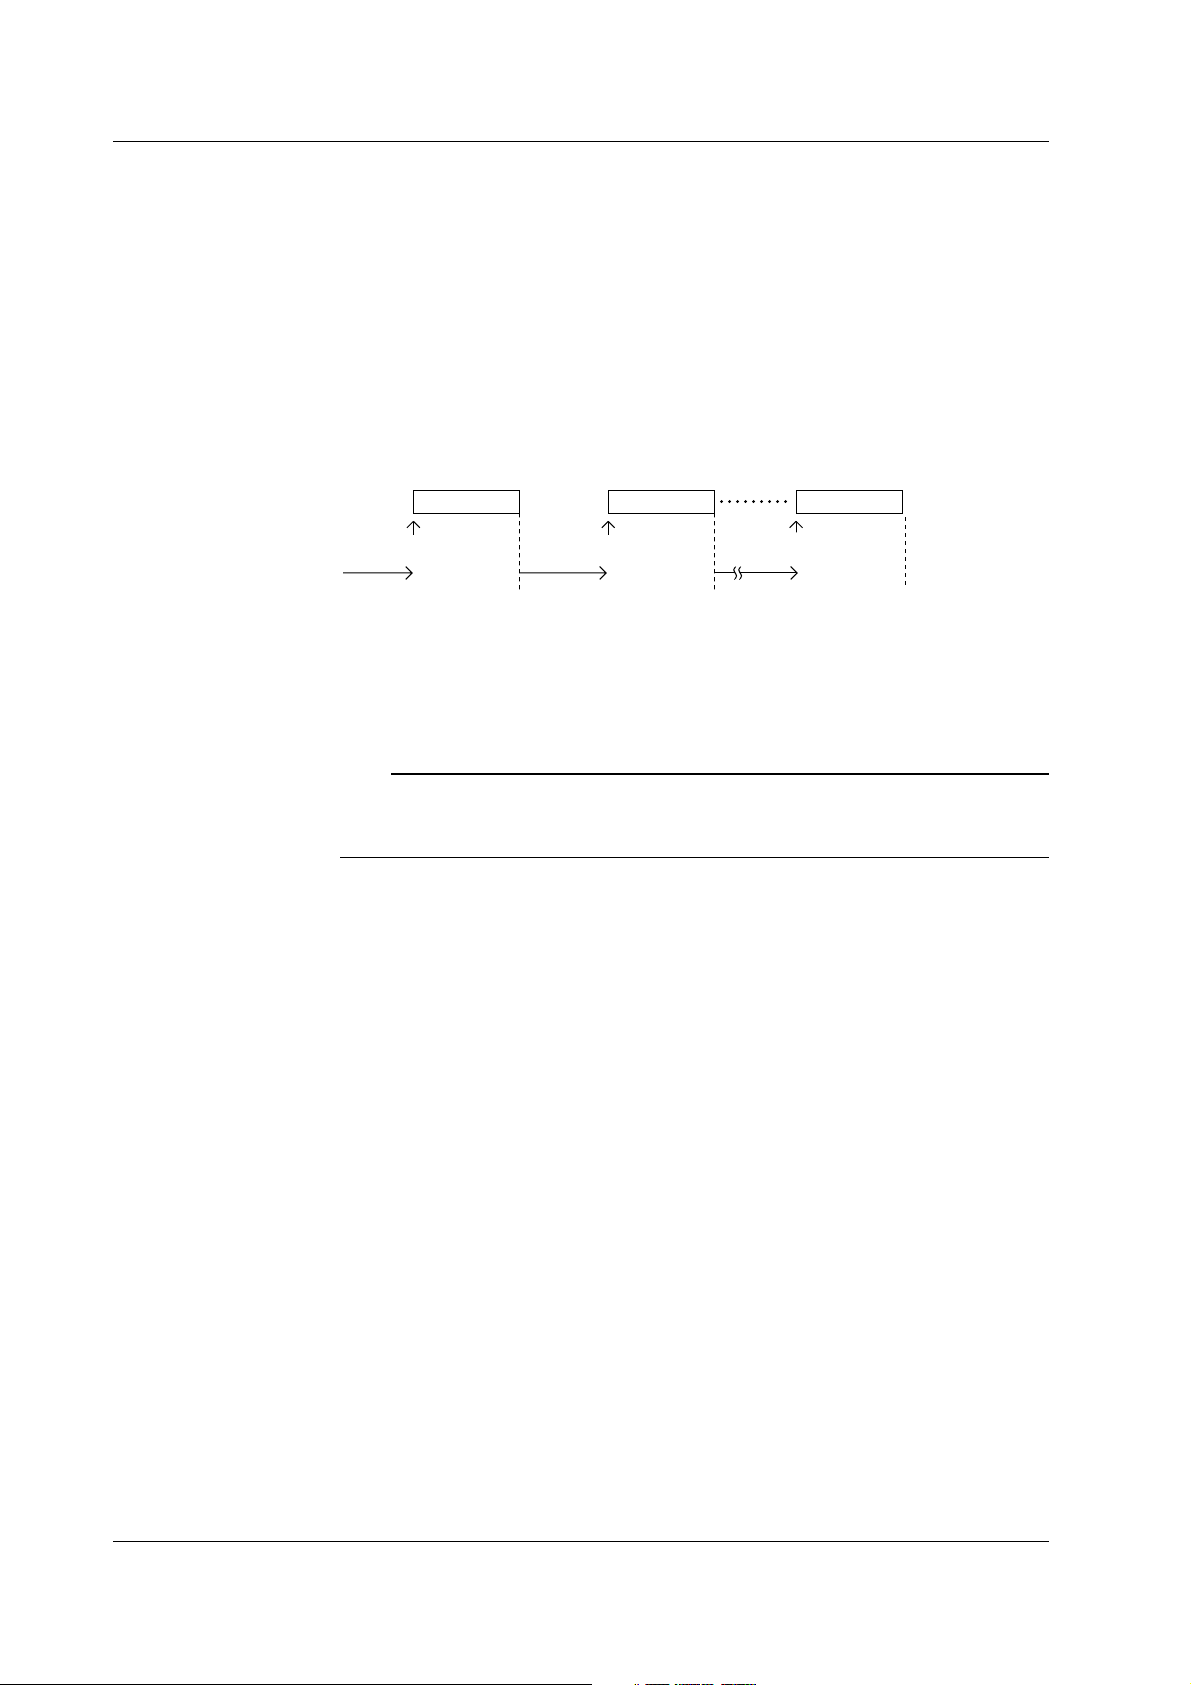
1.17 Data Storage Function
• Event data
• During the free mode
The event data in the internal memory is closed as a single file at the specified
interval (data length) or at the specified date and time and saved to the external
storage medium in binary format.
• During trigger or rotate mode
After acquiring the data to the internal memory over the specified period (data
length), the event data in the internal memory is stored to the external storage
medium in binary format.
The following figure shows the operation when the acquisition area in the internal
memory is divided using the trigger mode.
1st block 2nd block Last block
Data acquisition
Data acquisition Data acquisition
Trigger
condition met
Stop
Saved to the external
storage medium
Trigger wait
Trigger
condition met
Trigger
Trigger wait
Saved to the external
storage medium
condition met
Trigger wait
Saved to the external
storage medium
• Manual sampled data
The first time manual sample is executed, a manual sample data file is created on the
external storage medium. Data is added to this file every time manual sample is
executed. The data is saved in ASCII format.
Note
If an external storage medium is not inserted in the drive during auto save mode, the unsaved
data is saved the first time manual sample is executed after an external storage medium is
inserted.
• TLOG data
The first time TLOG data is created, a TLOG data file is created on the external
storage medium. The data is appended to this file at the specified interval. If the
number of TLOG data points saved exceed 400, a new file is created on the external
storage medium. The data is saved in ASCII format.
• Report data
The first time report data is created, a report data file is created on the external
storage medium. A file is created for each type of report such as daily and monthly.
The data is appended to this file every time of report.
The report file is divided at the following times. The data is saved in ASCII format.
• For hourly reports
• When the report at 0 hour every day is created.
• When the number of data points in a single file reaches 25.
• For daily reports
• When the report on the 1st day of every month is created.
• When the number of data points in a single file reaches 32.
Other Types of Data That Can Be Stored
The following two types of data can be stored on the external storage medium.
• Setup data
The setup data can be saved to the external storage medium. The saved data can be
loaded to change the CX1000 settings.
• Image data of the display screen
The image data of the display screen can be stored to the external storage medium in
PNG format.
1-84 IM 04L31A01-03E
Page 99

1.17 Data Storage Function
File Name
• The file name “(Sampling month, day, hour, minute of the first data).extension” of
display data, event data, manual sample data, TLOG data, and report data is
automatically assigned.
• Display data file: Mddhhmma.CDS
• Event data file: Mddhhmma.CEV
• Manual sample data file: Mddhhmma.DMN
• TLOG data file: Mddhhmma.DTG
• Hourly data file: Mddhhmma.DHR
• Daily data file: Mddhhmma.DDR
• Weekly data file: Mddhhmma.DWR
• Monthly data file: Mddhhmma.DMR
M: Month (1-9, X (October), Y (November), Z (December), dd: day, hh: hour, mm: minute,
a: the lowest digit of the year (0 to 9, except if another file with the same month, day,
hour, and minute exist, in which case “a” to “z” are assigned in order).
• Setup data
Set the name using up to 8 characters through the save operation. A .pcl extension is
automatically added when the data is saved.
• Screen image data
The file name “(month, day, hour, minute when the save operation of the screen
image data was executed+sequence number).png” is automatically assigned.
Mddhhmma.PNG
M: Month (1-9, X (October), Y (November), Z (December), dd: day, hh: hour, mm:
minute, a: the lowest digit of the year (0 to 9, except if the screen image data is saved
multiple times within a minute, in which case “a” to “z” are assigned in order from the
second file)
Save Destination Directory
All the data excluding the setup data (display data, event data, manual sample data, TLOG
data, report data (only on models with the computation function option), and screen image
data) are saved to the specified directory. The setup data is saved to the root directory.
The save destination directory varies depending on how the data is saved.
Auto save: Directory specified here.
Manual save: Directory with a sequence number added to the string
specified here.
Save on the setting display: Directory with “A+sequence number” added to the string
specified here (the sequence number increments every time
the data is saved).
File Header of Display Data and Event Data
You can enter a header comment using up to 32 alphanumeric characters.
1
Explanation of Functions
Saving Data via the Ethernet Network
The display data, event data, and report data, as described in “Data Acquisition to the
Internal Memory,” can be automatically transferred to an FTP server via the Ethernet
network for storage. Conversely, the CX1000 can function as an FTP server. The
CX1000 can be accessed from a PC and the data in the external storage medium can be
retrieved for storage. For a description on these functions, see the
Communication Interface User’s Manual (IM 04L31A01-17E)
IM 04L31A01-03E
CX1000/CX2000
.
1-85
Page 100

1.18 Computation and Report Functions (Option)
Computation Function
You can perform computations by specifying a computing equation and display the results
as computed values of a computation channel, on various displays such as the trend
display, numerical display, and bar graph display. You can use data of measurement
channels, the data of computation channels, the data of control channels, constants, etc. in
the computing equation. Computed data can be saved similar to measured data of
measurement channels. Computation is performed every scan interval.
Explanation of the computation function is also given in appendix 2, “Supplementary
Explanation of the Computation Function” and appendix 3, “Meaning and Syntax of
Computing Equations.” Read them along with this section.
Channel Numbers Dedicated to Computations
The channel numbers dedicated to computations are 31 to 42 (12 channels).
Computation Types and the Order of Precedence of Computations
The following computations can be performed. The order of precedence of computations
in descending order is functions (SQR, ABS, LOG, EXP, relational computation, logical
computation, and statistic computation), exponentiation, logical negation, multiplication/
division, addition/subtraction, greater/less relation, equal/not equal relation, logical
product, logical sum/exclusive logical sum.
Type Description
Four arithmetic operation Addition (+), subtraction, multiplication (×), and division (/)
** Power. y = X
SQR Square root
ABS Absolute value
LOG Common logarithm
EXP Exponent. y = e
Relational computation Determines <, ≤, >, ≥, =, or ≠ of two elements and outputs “0” or “1.”
Logical computation Determines the AND (logical product), OR (logical sum), XOR (exclusive logical
sum) of two elements, NOT (negation) of an element and outputs “0” or “1.”
Statistical computation Determines the average (AVE), maximum (MAX), minimum (MIN), sum
(TLOG) (SUM), and maximum - minimum (P-P) at specified time intervals for the
specified channels.
Rolling average Determines the moving average of the computed results of the channels to
which a computing equation has been assigned. The sampling interval and the
number of samples can be specified for each channel. The maximum sampling
interval is 1 hour; the maximum number of samples is 64.
n
x
Data That Can Be Used in Equations
Data Description
Measured data Measured value of a measurement channel or the control PV input.
Computed data Computed value of a computation channel.
Constants Set as constants K01 to K12 in the computation function.
Communication input data Values set using the communication function and written as C01 to C12
Conditions of the Remote Input signal (0 or 1) of the remote control function, written as D01 to D08.
Control Terminals
(see the
CX1000/CX2000 Communication Interface User’s Manual
).
Handing of the Unit in Computations
The unit corresponding to the measured/computed data in the equation is not
compensated. In computations, measured and computed data are handled as values
without units. For example, if the measured data from channel 01 is 20 mV and the
measured data from channel 02 is 20 V, the computed result of 01 + 02 is 40.
1-86 IM 04L31A01-03E
 Loading...