

Page 1

User's
Manual
CW500
Power Quality Analyzer
User’s Manual
IM CW500-01EN
1st Edition
Page 2

Thank you for purchasing the CW500 Power Quality Analyzer. This user’s
manual explains the features and operating procedures of the CW500.
To ensure correct use, please read this manual thoroughly before
beginning operation. Keep this manual in a safe place for quick reference
in the event that a question arises.
The following five manuals, including this one, are provided as manuals
for the CW500.
Please read all manuals.
Manual Title Manual No. Description
CW500
Power Quality Analyzer
User’s Manual
IM CW50001EN
This guide. This manual
explains the CW500’s standard
features and how to use these
features.
Application Software
User’s Manual
IM CW50061EN
The supplied CD contains the
PDF file of this manual. This
manual explains how to use the
application software.
CW500
Power Quality Analyzer
Getting Started Guide
IM CW50002EN
The guide explains the
handling precautions and basic
operations of the CW500 and
provides a list of specifications.
Application Software
Installation Manual
CW500
IM CW500-62JA This manual describes how to
install the application software.
IM CW500-92Z1 Chinese document
Power Quality Analyzer
User’s Manual
The “-EN” in the manual number is the language code.
Contact information of Yokogawa offices worldwide is provided on the
following sheet.
Manual No. Description
PIM113-01Z2 List of worldwide contacts
1st Edition : September 2015 (YMI)
All Rights Reserved, Copyright © 2015 Yokogawa Meters & Instruments Corporation
IM CW500-01EN
i
Page 3

Notes
• The contents of this manual are subject to change without prior notice
as a result of continuing improvements to the software’s performance
and functionality. The figures given in this manual may differ from those
that actually appear on your screen.
• Every effort has been made in the preparation of this manual to ensure
the accuracy of its contents. However, should you have any questions
or find any errors, please contact your nearest YOKOGAWA dealer.
• Copying or reproducing all or any part of the contents of this manual
without the permission of YOKOGAWA is strictly prohibited.
•
Trademarks
• Microsoft, Windows, Windows 7, and Windows 8 are either registered
trademarks or trademarks of Microsoft Corporation in the United States
and/or other countries.
• Adobe, Acrobat, and PostScript are either registered trademarks or
trademarks of Adobe Systems Incorporated.
• In this manual, the TM and ® symbols do not accompany their
respective registered trademark or trademark names.
• Other company and product names are trademarks or registered
trademarks of their respective companies.
Revisions
September 2015 1st Edition
ii
IM CW500-01EN
Page 4

Contents
Chapter 1 Product Outline
1.1 Feature Outline .....................................................1-1
1.2 Features ................................................................1-3
1.3 System Configuration Diagram .............................1-5
1.4 Measurement Procedure ......................................1-6
Chapter 2 Component Names
2.1 Display (LCD) and Control Keys ...........................2-1
2.2 Connectors ...........................................................2-2
2.3 Side Panel ............................................................2-3
2.4 Voltage Probe and Current Clamp-on Probe ........2-4
Chapter 3 Basic Operation
3.1 Description of Control Keys ..................................3-1
3.2 Marks Displayed in the Top Area of the LCD ........ 3-3
3.3 Display Symbols ...................................................3-4
3.4 Backlight and Contrast Adjustment .......................3-5
3.5 Screens and Screen Configuration .......................3-6
Chapter 4 Recording
4.1 Starting and Stopping Recording ..........................4-1
4.2 Starting to Record with “Quick start guide” ...........4-3
Chapter 5 Setup
5.1 Settings .................................................................5-1
5.2 Basic Setup ...........................................................5-2
5.3 Measurement Setup ...........................................5-12
5.4 Recording Setup .................................................5-25
5.5 Other Settings .....................................................5-31
5.6 Saved Data .........................................................5-36
IM CW500-01EN
iii
Page 5

Contents
Chapter 6 Display Items of Each Screen
6.1 Instantaneous Value (W) ......................................6-1
6.2 Integrated Value (Wh) ........................................... 6-9
6.3 Demand .............................................................. 6-11
6.4 Vector ..................................................................6-14
6.5 Waveform............................................................6-17
6.6 Harmonics ...........................................................6-19
6.7 Power Quality .....................................................6-25
Chapter 7 Other Features
7.1 Other Features ......................................................7-1
Chapter 8 Connecting to Peripheral Devices
8.1 Transferring Data to a PC .....................................8-1
8.2 Signal Control with External Devices ....................8-2
8.3 Supplying Power through Measurement Lines .....8-5
Chapter 9 PC Software for Configuration and Analysis
9.1 PC Software for Configuration and Analysis .........9-1
Chapter 10 Troubleshooting
10.1 Troubleshooting ..................................................10-1
10.2 Error Messages and Corrective Actions .............10-3
iv
Appendix
When Using 96030, 96033, or 96036 ......................... App-1
Index
IM CW500-01EN
Page 6

Chapter 1 Product Outline
1.1 Feature Outline
Displaying Instantaneous,
Integrated, and Demand
Displays instantaneous, average,
maximum and minimum values for
current, voltage, active power,
apparent power, and reactive power.
Switch the screen to display
integrated values. Set a demand
target value and display the demand
values from start to finish.
See “Displaying Instantaneous,
Integrated, and Demand.”
Starting and Ending Recording
Start recording normally or start by
following the Quick Start Navigation, which guides you through the
necessary setup for recording.
See “Starting and Stopping
Recording.”
IM CW500-01EN
Displaying Vectors and
Checking the Wiring
Displays a vector diagram of
voltage and current for the
measurement channel and
checks the wiring.
See “Vector.”
1-1
Page 7

1.1 Feature Outline
Displaying Waveforms
Displays waveforms of voltage
and current for the measurement
channel. See “Waveforms.”
Harmonic Analysis
Displays harmonic components
superimposed on the voltage and
current for the measurement channel.
See “Harmonic Analysis.”
Displaying Power Supply
Quality Events
Displays the swell, dip,
interruption, transient, inrush
current, and flicker of the
measured voltage.
See “Power Supply Quality.”
1-2
Setup (SET UP)
Configures the CW500 and
measurement.
See “Setup.”
IM CW500-01EN
Page 8

1.2 Features
This product is a clamp-type power quality analyzer that supports a
variety of wiring systems. It simultaneously performs simulations of
instantaneous values, integrated values, demand values for power
management, harmonic analysis, power quality events, and phase lead
capacitor values for improving the power factor. Voltage and current can
be displayed as waveforms and vectors.
Measured data can be saved to files in SD memory cards or internal memory,
and the files can be transferred to a PC through USB communication.
Safety Design
This product complies with safety standard IEC 61010-1 CAT. IV 300V/
CAT. III 600V/CAT. II 1000V.
Power Quality Measurement
This product supports international power quality measurement standard
IEC61000-4-30 Class S. It can perform highly accurate frequency
and rms voltage measurements and harmonic analysis as well as
simultaneously measure without gaps swell, dip, interruption, transient,
inrush current, and flicker that are necessary for capturing and monitoring
power abnormalities.
Power Measurement
This product can measure active, reactive, and apparent powers as well
as watt-hour, power factor, rms current, phase angle, and neutral line
current.
Wiring Systems
This product supports single-phase two-wire (four systems), single-phase
three-wire (two systems), three-phase three-wire (two systems), and
three-phase four-wire measurement lines.
Demand Measurement
You can monitor in a simplified form the usage condition so that the
specified target value (contract demand) is not exceeded.
IM CW500-01EN
1-3
Page 9

1.2 Features
Waveform and Vector Displays
Voltage and current can be displayed as waveforms and vectors.
Saving Measured Data
This product is equipped with a logging function whose recording interval
can be specified. Measured data can be saved manually or by specifying
the date and time. Further, the print screen function can be used to save
image data to SD memory cards.
Dual Power System
This product can be driven by AC power or batteries. For batteries, AA
alkaline batteries (LR6) or off-the-shelf rechargeable AA nickel-metal
hydride batteries (Ni-MH) can be used. For rechargeable AA nickel-metal
hydride (Ni-MH) batteries, use the battery manufacturer’s charger to
charge them. You cannot charge them on the CW500. If a power failure
occurs while the CW500 is running off of AC power, the power supply is
automatically switched to battery power.
Display Screen
This product has a color TFT LCD.
Easy Wiring and Compact, Lightweight Design
Wiring is easy as this product is a clamp type. Its compact, lightweight
design makes it convenient to install and carry around.
Application
Files saved in SD memory cards and internal memory can be downloaded
to a PC through USB. Downloaded files can be analyzed easily using the
accompanying PC software. It is also possible to configure the CW500
from a PC.
Auxiliary I/O Function
The 2-channel analog input (DC voltage) can be used to simultaneously
measure analog signals from thermometers, lux meters, and the like.
If a power quality event occurs, a contact signal can be sent to an alarm
through the 1-channel digital output.
1-4
IM CW500-01EN
Page 10

1.3 System Configuration Diagram
電流入力
Current input
AC voltage input
Digital output (1 ch) to
recorder or alarm
Analog input (2 ch) from
AA alkaline
batteries (LR6)
AA Ni-MH batteries
thermometer or illuminometer
USB
Power cord
IM CW500-01EN
SD memory
PC
card
(Option)
1-5
Page 11

1.4 Measurement Procedure
Getting Started Guide, “Making Preparations for Measurements” Page 5
Connecting cords and sensors to the CW500
Getting Started Guide, “Connecting a Voltage Probe and Clamp-on Probe”
Getting Started Guide, “Power Supply” Page 7
Setting common measurement items
5.2, “Basic Settings” Page 5-3
Getting Started Guide, “Safety Precautions” Page vii
Configuring measurement settings and save method
5.3, “Measurement Settings” Page 5-12 and 5.4, “Record Settings” Page
6.1, “Instantaneous Value W” Page 6-1 and 6.4, “Vectors” Page 6-14
Measurement preparation
Page 15
Turning the power on
Loading CW500 settings
5.6, “Save Data” Page 5-36
Wiring measurement lines
Checking the wiring
6.4, “Vectors” Page 6-14
5-25.
Checking measured values
4.6, “Starting and Stopping Recording” Page 4-12
Starting and stopping recording
Checking Measured Data
Chapter 6, “Display Items of Each Screen” Page 6-1
Removing cords and sensors from the measurement line and turning the
power off
Analyzing recorded data on a PC
8.1, “Transferring Data to a PC” Page 8-1
Chapter 9, “PC Software for Configuration and Analysis” Page 9-1
1-6
IM CW500-01EN
Page 12

Display (LCD)
Chapter 2 Component Names
2.1 Display (LCD) and Control Keys
IM CW500-01EN
Control keys
2-1
Page 13

2.2 Connectors
AC voltage input terminals
Power inlet
(VN, V1, V2, V3)
Current input terminals
(A1, A2, A3, A4)
Terminal covers
Wiring System
Single-phase two-wire (1 system)
Single-phase two-wire (2 system)
Single-phase two-wire (3 system)
Single-phase two-wire (4 system)
Single-phase three-wire (1 system)
Single-phase three-wire (2 system)
Three-phase three-wire (1 system)
Three-phase three-wire (2 system)
Three-phase three-wire 3A
Three-phase four-wire
1P2W×1
1P2W×2
1P2W×3
1P2W×4
1P3W×1
1P3W×2
3P3W×1
3P3W×2
3P3W3A
3P4W×1
AC Voltage
Input Terminal
VN, V1 A1
VN, V1 A1, A2
VN, V1 A1, A2, A3
VN, V1 A1, A2, A3, A4
VN, V1, V2 A1, A2
VN, V1, V2 A1, A2, A3, A4
VN, V1, V2 A1, A2
VN, V1, V2 A1, A2, A3, A4
V1, V2, V3 A1, A2, A3
VN, V1, V2, V3 A1, A2, A3
Current Input
Terminal*
* Current terminals that are not used in wiring can measure only rms values
and harmonics.
2-2
IM CW500-01EN
Page 14

2.3 Side Panel
Analog input/digital output area
Analog input/digital output terminals
With the Connector Cover Closed
SD memory card area
With the Connector Cover Open
SD memory card slot USB port
USB area
IM CW500-01EN
2-3
Page 15

2.4 Voltage Probe and Current Clamp-on Probe
Alligator Clip (the end of the voltage probe)
Barrier
Current Clamp-on Probe
Barrier
Barrier: A mark for securing the minimum required creep and spatial
distance to prevent electric shock during operation.
When taking a measurement, be careful that your finger or the like does
not cross over the barrier.
2-4
IM CW500-01EN
Page 16

Chapter 3 Basic Operation
3.1 Description of Control Keys
Display
Function keys
Selects or executes the menu
items at the screen bottom.
PRINT SCREEN key
Saves the LCD screen as a
BMP file.
DATA HOLD/
KEY LOCK key
DATA HOLD
Holds the display.
But, measurement
continues.
KEY LOCK
Hold down for 2 s to lock all
keys. Hold down for 2 s
again to release.
Power key
Turns the power
on and off.
Display switch key
See page 3-2.
SETUP Key
Changes basic, measurement,
recording, saved data, and
other settings.
START/STOP key
Starts or stops recording.
Status LED
Shows the recording status.
Green solid: Recording
Green blinking: Standby
Red blinking: Backlight off
LCD key
Turns on/off backlight, adjust
contrast and brightness.
ENTER key
Confirms the operation or
setting.
Arrow keys
Selects items, changes
displays.
ESC/RESET key
Resets to the original setting.
IM CW500-01EN
3-1
Page 17

Display Switch Key
W/Wh key
Displays instantaneous
values, integrated
values, and “demand”
Vector key
Displays phases
Waveform key
Displays voltage and current
waveforms
Harmonic analysis key
Displays harmonic voltage,
harmonic current, and
harmonic power
QUALITY key
Displays the occurrence of
swell, dip, interruption,
transient, inrush current, and
flicker
3-2
IM CW500-01EN
Page 18

3.2 Marks Displayed in the Top Area of the LCD
Mark Status When Displayed
Running on batteries. Shows the battery level using four
levels.
Running on AC power.
Screen updating is held.
Keys are locked.
The buzzer is turned off.
SD memory card can be used.
Recording to SD memory card.
Not enough space in SD memory card to record.
Unable to access SD memory card.
Possible to record to internal memory. This appears when
recording is started without an SD memory card inserted.
IM CW500-01EN
Recording to internal memory.
Not enough space in internal memory to record.
Waiting to record.
Recording measurement values.
Recording medium is full.
USB can be used.
Bluetooth® can be used.
3-3
Page 19

3.3 Display Symbols
Display Symbol
1
V
P
PF
DC1
2
An
WP+
WP-
THD
Pst
(1min)
Phase voltage
+
Active
power
power
factor
Consumption
Regeneration
–
+ Lag
– Lead
Analog input
channel 1 voltage
Neutral line current
Active energy
(consumption)
Active energy
(regeneration)
Voltage/current distortion
1-minute voltage flicker
1 The V and VL displays can be customized when 3P4W is selected.
2 An appears only when 3P4W is selected.
3 PA and C can be displayed by customization.
VL
Q
f
DC2
PA
WS+
WS-
Pst
1
Line voltage
Reactive
power
+ Lag
– Lead
Frequency
Analog input
channel 2 voltage
3
Phase
angle
+ Lag
– Lead
Volt-ampere hours
(consumption)
Volt-ampere hours
(regeneration)
Short term voltage
flicker
A
S
3
C
WQi+
WQc+
Plt
Apparent power
Phase advance
capacitance
Reactive energy
Reactive energy
Long term voltage
Current
capacitor
(lag)
(lead)
flicker
3-4
IM CW500-01EN
Page 20

3.4 Backlight and Contrast Adjustment
Backlight brightness can be changed
Brightness adjustment
to any of the 11 available levels.
Holding down the LCD key for 2 seconds when the backlight is on
displays slide bars for adjusting the backlight brightness and display
contrast. To adjust the brightness or contrast, use the arrow keys to move
the slide bars. After adjusting, press ENTER to confirm. To cancel the
adjustment, press ESC or LCD again.
to any of the 11 available levels.
Contrast adjustment
Contrast can be changed
IM CW500-01EN
3-5
Page 21

3.5 Screens and Screen Configuration
Demand
Wh (Integrated value)W (instantaneous value)
Instantaneous, Integrated, and Demand
Switching the W/Wh Screen
Each time you press function key F1, the display screen changes.
Select and change the items to be displayed.
Zoom
Zoom in on selected items.
4 windows 8 windows
Customize
Trend
Measurement variation trends
are displayed on a graph.
3-6
IM CW500-01EN
Page 22

Vector
Switching the Vector Screen
Wiring diagram
Displays the diagram of the
selected wiring
3.5 Screens and Screen Configuration
Wiring check
Displays the results of
check items
Waveform
Switching the Waveform Screen
IM CW500-01EN
3-7
Page 23

3.5 Screens and Screen Configuration
Voltage, Linear, Overall display
Harmonics
Switching the Harmonic Analysis Display Items
Current Power
List, percentage content
Logarithm Zoom
Phase angle Rms value
Current Power
3-8
IM CW500-01EN
Page 24

Power Quality
Event Flicker
Use the left and right arrow keys
Switching the Quality Display Items
Setup
Switching the Setup Display Items
3.5 Screens and Screen Configuration
IM CW500-01EN
switch between screens.
3-9
Page 25

Chapter 4 Recording
4.1 Starting and Stopping Recording
Starting Recording
Press START/STOP.
You can select the recording start method from “Quick start guide” and
“Start now.”
Quick start guide
You can easily start recording by setting the items by following the
instructions displayed on the screen. However, the items that you can
set are those related to wiring and recording. If you need to specify other
settings, set them from the SETUP menu.
Start now
Recording starts immediately using the current settings.
<Procedure>
Using the up and down arrow keys, select “Quick start guide” or “Start
now,” and press ENTER.
To cancel, press ESC.
IM CW500-01EN
4-1
Page 26

Recording method
4.1 Starting and Stopping Recording
Stopping Recording
While recording is in progress, press START/STOP.
Data number
Record items
Recording information is displayed, and recording stops.
Display Items
Recorded
data
number
Elapsed time Elapsed time from the start of recording is displayed.
Recording
method
Save to
Record items Measurement items being recorded are displayed.
The ID number of the recorded data is displayed. This is
also used as the name of the folder in which measured
data is saved.
Manual
Constant
rec.
Time period
rec.
The recording start date and time are
displayed.
The recording start/end date and time are
displayed.
The recording start date and time, recording
period, and recording time are displayed.
The location where measured data is being recorded to is
displayed.
<Procedure>
Using the up and down arrow keys, select CANCEL or STOP, and then
press ENTER.
You can also cancel by pressing ESC.
4-2
IM CW500-01EN
Page 27

4.2 Starting to Record with “Quick start guide”
Set the
record items.
Set the
wiring system.
Select the item you want to record.
* Greater the number of items, the greater the file
size, which means shorter recording time.
Connect to the circuit to be
measured.
* Read and follow the safety precautions.
See the Getting Started Guide (IM CW500-02EN).
Check wiring
connection.
Check the test
environment.
Select the wiring system to be measured.
* Select a proper wiring system for accurate
measurements.
See page 4-5.
Check the test environment.
* Performs a CW500 self-diagnosis, wiring status
* We recommend that you execute this check in
IM CW500-01EN
check, and connected sensor identification.
order to record in the correct conditions. The
test takes about 10 seconds.
See page 4-6.
4-3
Page 28

4.2 Starting to Record with “Quick start guide”
Select the
rec interval
Select the
rec method
Select a recording interval.
* Selecting a short interval results in a large
See page 5-29.
Ready. Recording will start.
When recording starts, the screen shows
REC, and the Logging LED turns green.
To stop recording, press START/STOP, and
follow the instructions on the screen.
Confirm to
start recording.
file size preventing long-term recording.
Start
recording
Select the rec. method.
See page 4-9.
4-4
IM CW500-01EN
Page 29

be reversed.
4.2 Starting to Record with “Quick start guide”
Setting the Wiring System
You can select from the following wiring systems.
L
Power
supply
N
A1
VN
V1
A2
V2
VN
V1
L1(R)
Power
supply
L2(S)
L3(T)
L1(R)
Power
supply
L2(S)
L3(T)
N N
A3
A1
A4
A2
L
Load
(1)
N
1P2W
L
Load
(2)
N
1P2W
L
Load
(3)
N
1P2W
L
Load
(4)
N
1P2W
L1(R)
L2(S)
L3(T)
L1(R)
L2(S)
L3(T)
A3
A4
L1(R)
L2(S)
L3(T)
1P2W×2
1P2W×3
1P2W×4
Load
(1)
3P3W
Load
(2)
3P3W
Load
3P4W
1P2W×1
3P3W×1
3P3W×2
3P4W
L1
Power
supply
N
L2
V1
Power
supply
Orientation of the current clamp-on probe
Power
V2
L1(R)
L2(S)
L3(T)
VN
A1
V1
V2
L1
Load
N
1P3W
L2
L1
Load
N
1P3W
L2
A2
A3
A4
L1(R)
L2(S)
L3(T)
A1
A2
A3
V3
Load
(1)
1P3W×2
(2)
Load
3P3W
Arrow: load
1P3W×1
3P3W3A
V1
IM CW500-01EN
A1
A2
V2
V3
VN
A3
* If clamped in the reverse direction, the
polarity of the active power (P) value will
4-5
Page 30

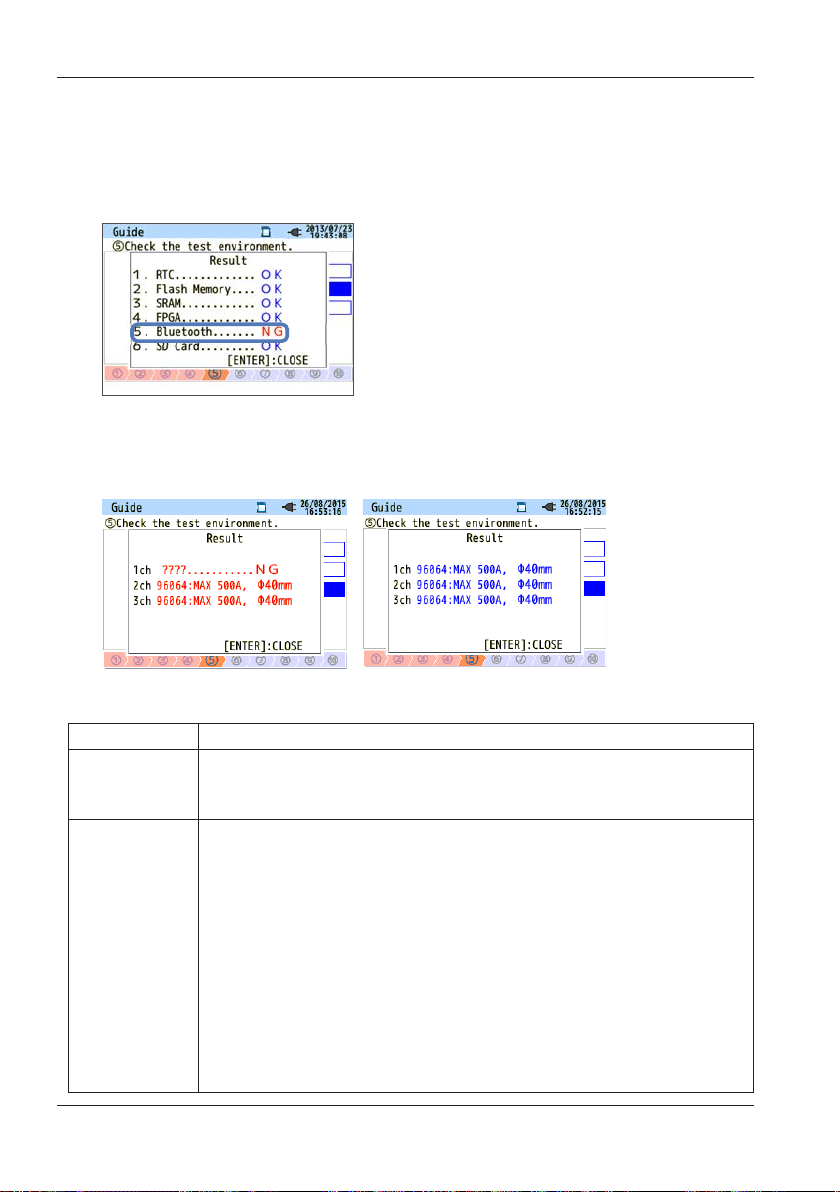
Test environment check
Automatically detects connected current probes
4.2 Starting to Record with “Quick start guide”
Test Environment Check
Select Start test and press ENTER
to check the test environment and
display the results.
Select the OK or NG of a test result
to see the details.
Wiring check
Displays the test results of each item.
* If measuring at site with extremely poor
power factor, this check may fail even
if the wiring is correct.
Self-diagnosis
Displays the results of a system operation
check.
4-6
Sensor detection
and sets the range to their maximums.
IM CW500-01EN
Page 31

Closing the test results causes the NG
values and vectors to blink. If everything
4.2 Starting to Record with “Quick start guide”
NG Judgment
Wiring Check
is OK, the ideal vector diagram will be
displayed in the lower left corner.
Wiring Check Criteria and Failure Cause
Check Judgment Criteria Failure Cause
Frequency
AC
voltage
input
Voltage
balance
Voltage
phase
Current
input
Current
phase
• The V1 frequency is
between 40 to 70 Hz.
• AC voltage input
is 10% of (nominal
voltage × VT) or
higher.
• AC voltage input
is within ±20% of
reference voltage V1.
* Not checked for
single-phase wiring
• AC voltage input
phase is within ±10%
of the reference value
(appropriate vector).
• Current input is 5% or
higher and 110% or
less of (current range
× CT).
• Power factor (PF,
absolute value) of
each channel is 0.5
or higher.
• Active power (P)
of each channel is
positive.
• The voltage clip is not firmly connected
to the DUT.
• Harmonic components are large.
• The voltage clip is not firmly connected
to the DUT.
• Voltage probe is not correctly inserted
into the AC voltage input terminal of
this instrument.
• Settings are not appropriate for the
measurement line wiring system.
• The voltage clip is not firmly connected
to the DUT.
• Voltage probe is not correctly inserted
into the AC voltage input terminal.
• Voltage probe is not connected
correctly.
(The connected channel is incorrect.)
• Current clamp-on probe is not
correctly inserted into the AC power
input terminal of this instrument.
• Current range setting is too high or
too low for the input level.
• Current direction mark of the current
clamp-on probe is not matched with
the current-to-load direction.
• Clamp-on probe is not connected
correctly.
IM CW500-01EN
4-7
Page 32
4.2 Starting to Record with “Quick start guide”
Self-Diagnosis
If NG is displayed frequently, the instrument may be malfunctioning. Stop
using it immediately, and see chapter 10, “Troubleshooting,” on page
10-1.
Sensor Detection
If detection fails, current clamp-on probe types are displayed in red.
Detection Failure Cause
Check Cause
Current
clamp-on
probe type
???
(cause
unknown)
4-8
• Different types of current clamp-on probes are connected
to each channel. Use the same type of current clamp-on
probes for measurement.
• Current clamp-on probe is not firmly connected to the
instrument.
• Troubleshooting
Connect the current clamp-on probe that failed to be
detected to a channel that detection was successful, and
test again. If the same channel fails again, the instrument
may be malfunctioning. If detection fails on the channel
connected to the current clamp-on probe that failed to
be detected the last time, the clamp-on probe may be
malfunctioning. If you suspect a malfunction, stop using
it immediately, and see chapter 10, “Troubleshooting,” on
page 10-1.
IM CW500-01EN
Page 33
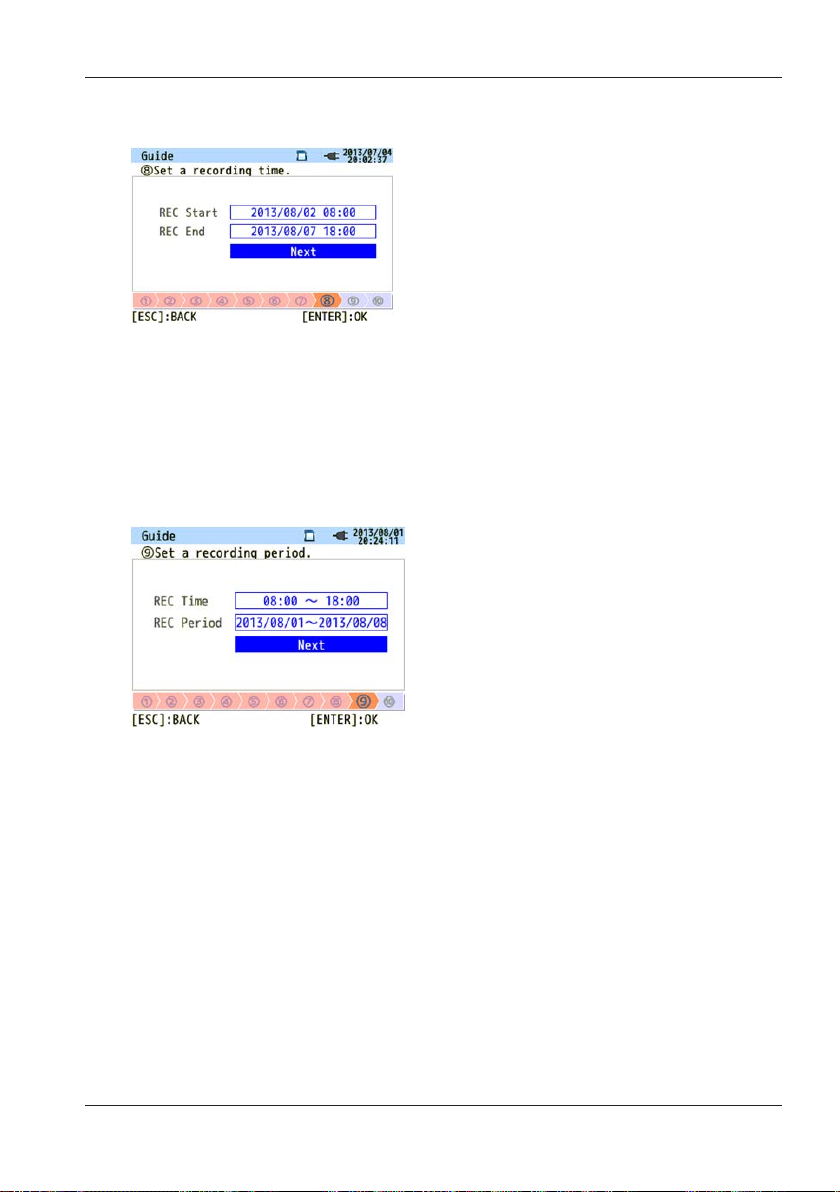
4.2 Starting to Record with “Quick start guide”
Reserving by Specifying the Date and Time
From the specified start date and time to the end date and time, recording
is performed at a given interval.
If the date and time are set as shown above, recording will be performed
during the following period.
8:00 on August 2, 2013 to 18:00 on August 7, 2013
Reserving a Repetitive Recording
Recording is repeated during the specified time slot at a given interval for
the specified period.
If the date and time are set as shown above, recording will be performed
during the time slots (i) to (viii) below. Recording is not performed from
18:00 to 8:00 of the next day.
(i) 8:00 to 18:00 on August 1, 2013
(ii) 8:00 to 18:00 on August 2, 2013
(iii) 8:00 to 18:00 on August 3, 2013
(iv) 8:00 to 18:00 on August 4, 2013
(v) 8:00 to 18:00 on August 5, 2013
(vi) 8:00 to 18:00 on August 6, 2013
(vii) 8:00 to 18:00 on August 7, 2013
(viii) 8:00 to 18:00 on August 8, 2013
IM CW500-01EN
4-9
Page 34
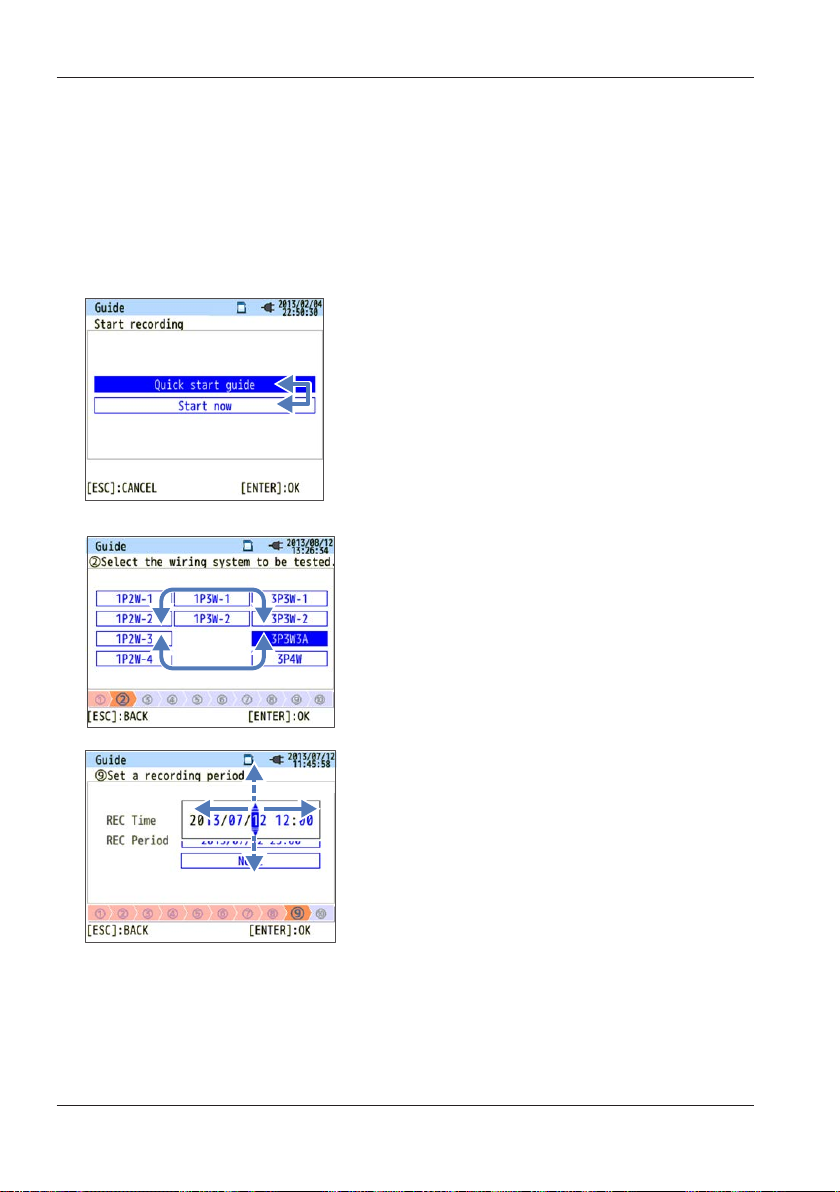
screen shown on the left, you can use the up
the settings and close the Quick start guide,
On a screen that shows selectable items in a
To enter values such time, use the left and
down arrow keys will increment or decrement
the previous screen, press ESC.
4.2 Starting to Record with “Quick start guide”
Operation
The basic procedure to operate this instrument is to use the arrow keys
to select an item or value, the ENTER key to confirm, and the ESC key to
cancel. As an example, the operation is explained for entering settings in
Quick start guide. The operation is similar for entering settings on other
display screens.
Using arrow keys, you can select the items
in blue letters (unselected) and the
highlighted item with blue background and
white letters (selected). On the Record start
and down arrow keys to select the recording
method and ENTER to confirm. To cancel
table form, you can use the up, down, left,
and right arrow keys to select an item. On
the wiring selection screen shown on the
left, you can use the up, down, left, and right
arrow keys to select the wiring system to be
measured and ENTER to confirm. To cancel
4-10
right arrow keys to select the digit and the up
and down arrow keys to change the number.
On the recording time selection screen
shown on the left, left and right arrow keys
were used to select the tenth digit of the
date. In this condition, pressing the up and
the tenth digit. To confirm the change, press
ENTER. To cancel the settings and return to
IM CW500-01EN
Page 35

4.2 Starting to Record with “Quick start guide”
Notes on Settings
If the current range is set to AUTO, only “Power + Harmonics” or “Power
only” can be selected with “1. Select desirable recording item.” If you want
to record power quality, change the current range to a fixed range before
starting to record. Only wiring and recording settings can be specified in
“Quick start guide.” Nominal voltage, nominal frequency, threshold for
power quality events (included in the measurement settings), and filter
coefficient (ramp) for flicker measurement must be set in advance. Set
these items from the SETUP menu. Note that the “+ Clamp” option clampon probe setting is automatically set to OFF.
IM CW500-01EN
4-11
Page 36
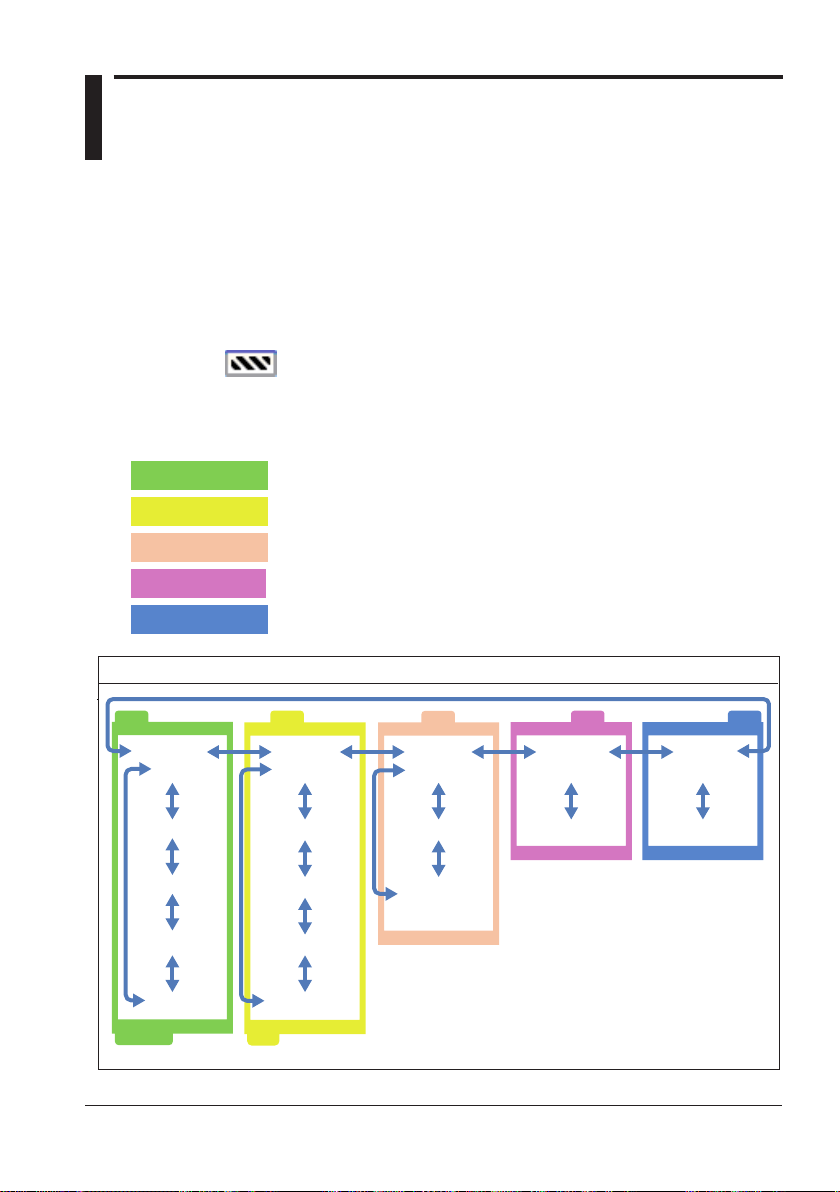
Chapter 5 Setup
5.1 Settings
Before starting measurement, you need to set measurement conditions
and data saving conditions.
To set these conditions, press SET UP to enter the SET UP mode.
The SET UP mode is divided into the following five categories. Use the
arrow keys to move between the categories.
The settings that you change take effect after you exit from the SET UP
mode and appears in the upper left of the screen.
Note that even if you change the settings, if you turn off the power while
in SET UP mode, the settings will not take effect.
Basic
Measurement
Recording
Saved Data
Others
Basic
(Wiring)
(Voltage)
(Current)
(External
input DC)
(Frequency)
Set common measurement items.
Set specific measurement items.
Set the saving method.
Edit recorded data or change the instrument settings.
Configure environmental settings.
Settings
Measurement
(Demand)
(Harmonics)
(Power quality)
(Flicker)
(Phase advance
capacitor)
Recording
(REC item)
(Rec method)
(Manual/
Constant rec.
Time period rec.)
Saved Data
(Rec data)
(System settings)
Others
(Environment)
(System settings)
IM CW500-01EN
5-1
Page 37
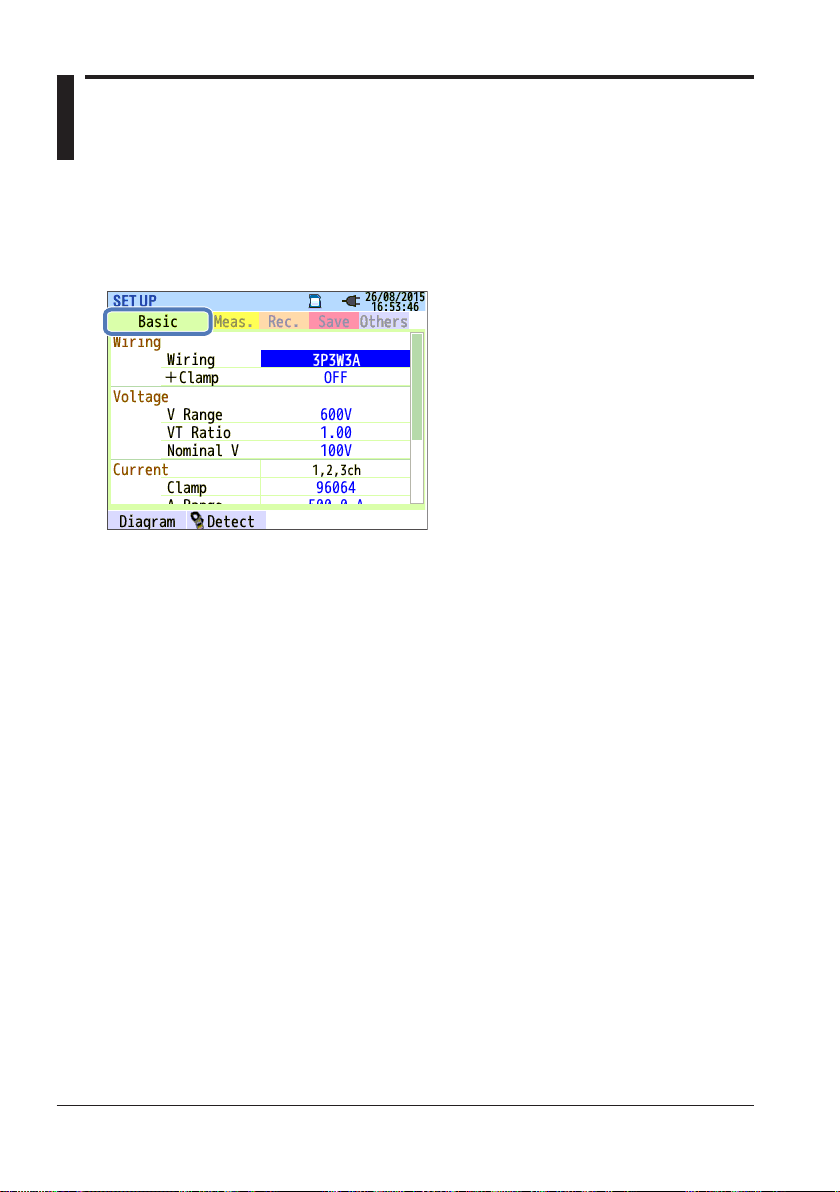
5.2 Basic Setup
<Procedure>
Press SETUP.
tab.
Use the left and right arrow keys to select the Basic
→
5-2
IM CW500-01EN
Page 38
5.2 Basic Setup
Wiring System Settings
Wiring
From the 10 available wiring systems, select the appropriate one for the
wiring system to be measured.
Settings
1P2W×1 1P2W×2 1P2W×3 1P2W×4
1P3W×1 1P3W×2
3P3W×1 3P3W×2 3P3W3A 3P4W (default setting)
*Current terminals that are not used in “+Clamp” wiring can measure only
rms values and harmonics.
<Procedure>
Use the up and down arrow keys to move to Wiring. → Press ENTER to
show a pull-down menu. → Select the wiring system. → Press ENTER
to confirm or ESC to cancel.
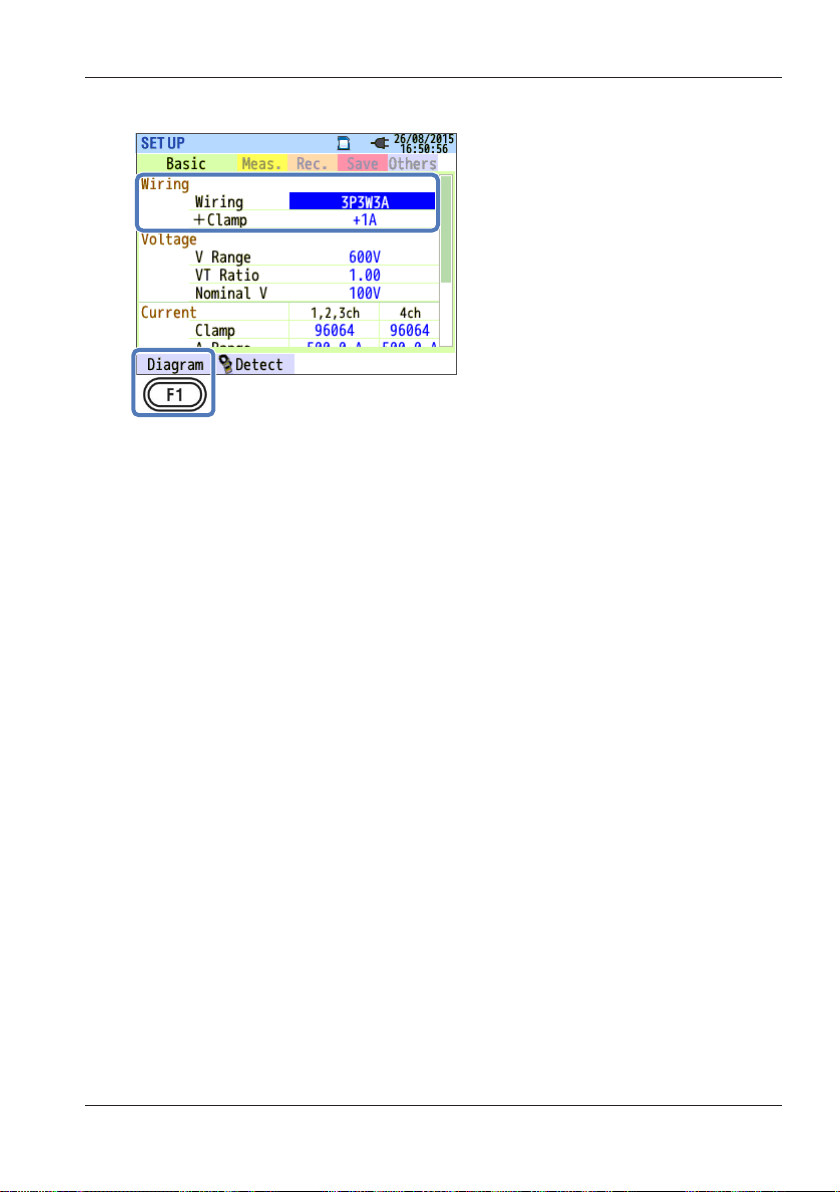
+Clamp (optional clamp-on probe)
<Procedure>
Use the up and down arrow keys to move to +Clamp.
to show a pull-down menu. → Use the up and down arrow keys to select
the optional clamp. → Press ENTER to confirm or ESC to cancel.
IM CW500-01EN
Press ENTER
→
5-3
Page 39
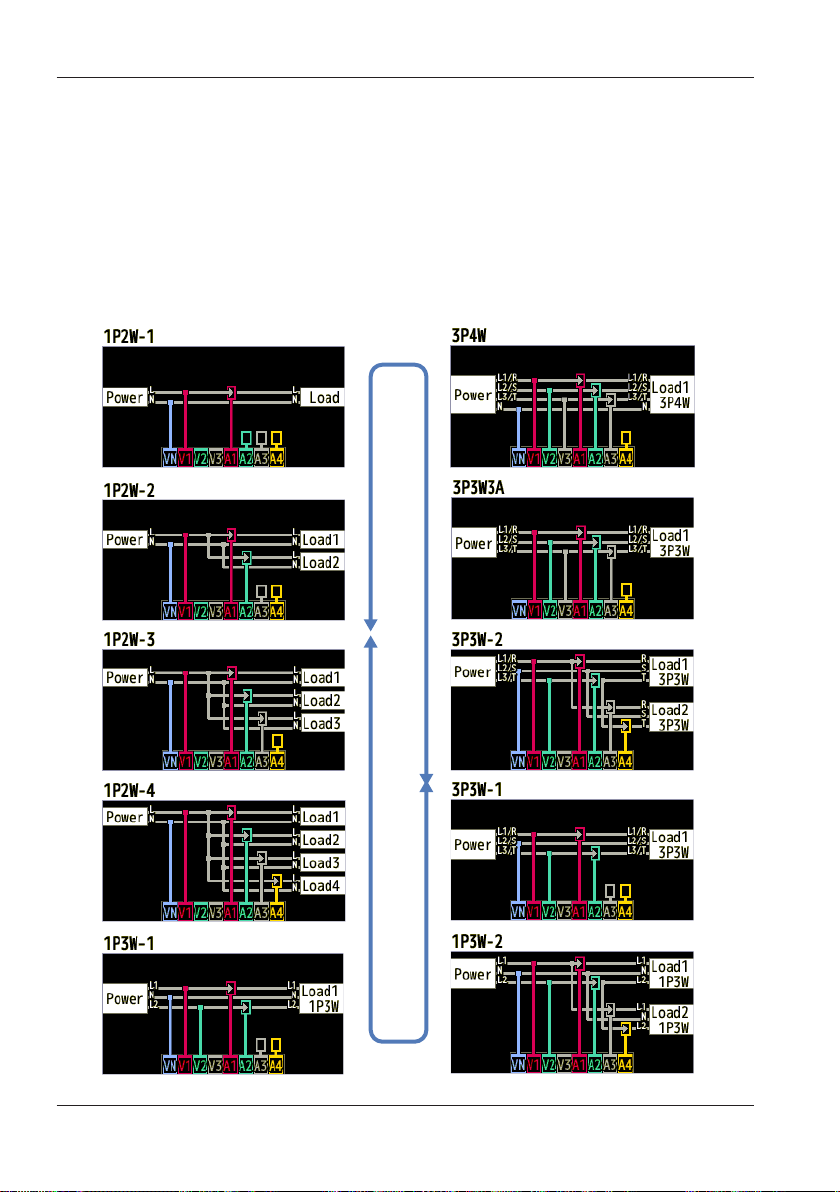
5.2 Basic Setup
Wiring Diagrams
When you move to the Wiring item, you can use the F1 (Diagram) key to
show the wiring diagram of the selected wiring system.
<Procedure>
After showing the wiring diagram, press F1 (previous wiring system) or
F2 (next wiring system) to change the wiring system. → Press ENTER to
confirm or ESC to cancel.
5-4
IM CW500-01EN
Page 40
5.2 Basic Setup
Voltage Measurement Settings
V Range
Select the voltage range to use.
To perform a measurement according to the international power quality
standard IEC61000-4-30 Class S, select 600V.
Settings
*
/1000V
600V
* Default value
<Procedure>
Use the up and down arrow keys to move to V Range.
Press ENTER
→
to show a pull-down menu. → Use the up and down arrow keys to select
the voltage range. → Press ENTER to confirm or ESC to cancel.
VT Ratio
Set this when an external VT (voltage transformer) is installed in the
system. The VT ratio will be applied to all voltage measurements.
*
Default value
IM CW500-01EN
Settings
0.01 to 9999.99 (1.00
*
)
5-5
Page 41
VN V1 A1
L
5.2 Basic Setup
<Procedure>
Use the up and down arrow keys to move to VT Ratio.
Press ENTER
→
to show a value entry window.* → Use the arrow keys to select the VT
ratio. → Press ENTER to confirm or ESC to cancel.
* The input range is shown in a pop-up.
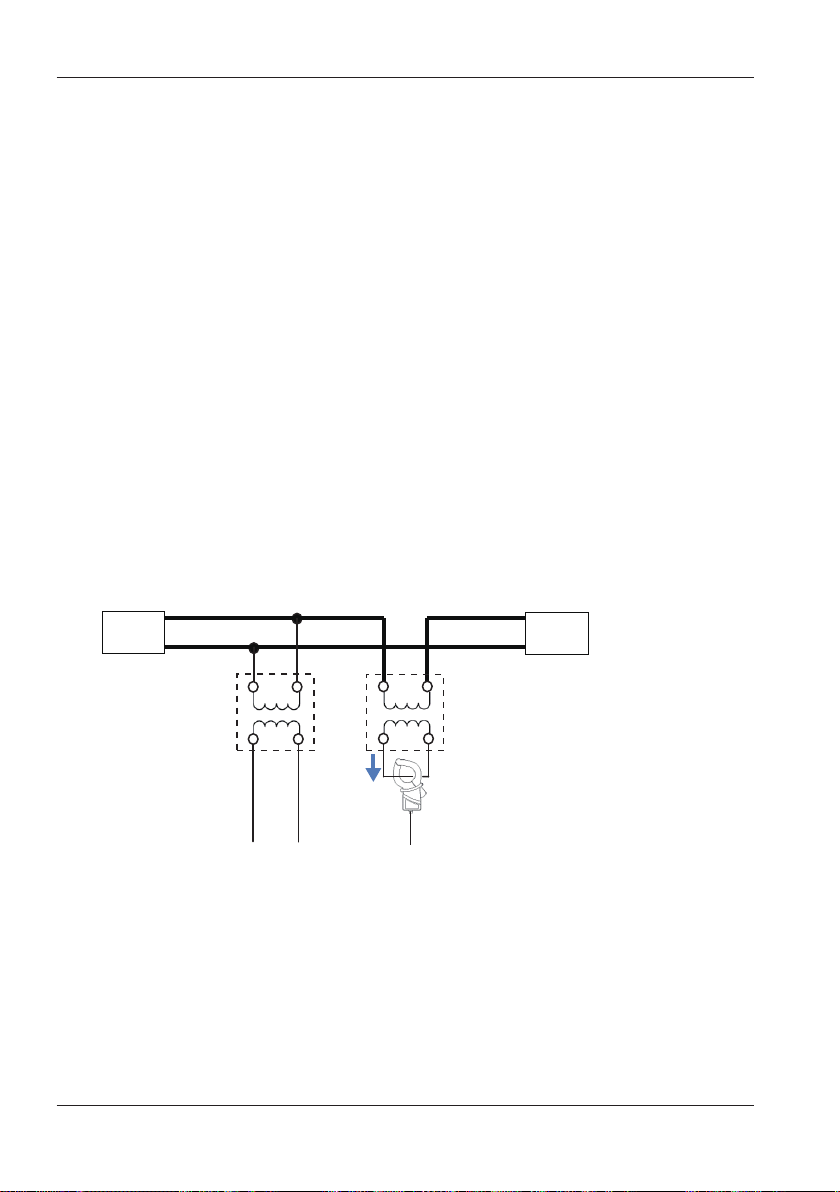
VT/CT
The measurement accuracy of this instrument when VT or CT is used
is not guaranteed. When using a VT or CT, take into consideration the
VT or CT accuracy, phase characteristics, and the like in addition to the
instrument accuracy.
If the voltage or current on the measurement line exceeds the maximum
measurement range of this instrument, you can use a VT or CT with
specifications appropriate for the measurement line voltage and current to
measure the secondary side and display the value on the primary side.
Example of single-phase two-wire (1 system) (1P2W × 1)
5-6
Power
N
VT
CT
i
Load
IM CW500-01EN
Page 42

5.2 Basic Setup
If the rating of the secondary side of the CT is 5 A, We recommend that
you use a 50 A type clamp-on probe and measure at the 5 A range.
Make sure to set the appropriate VT and CT ratios.
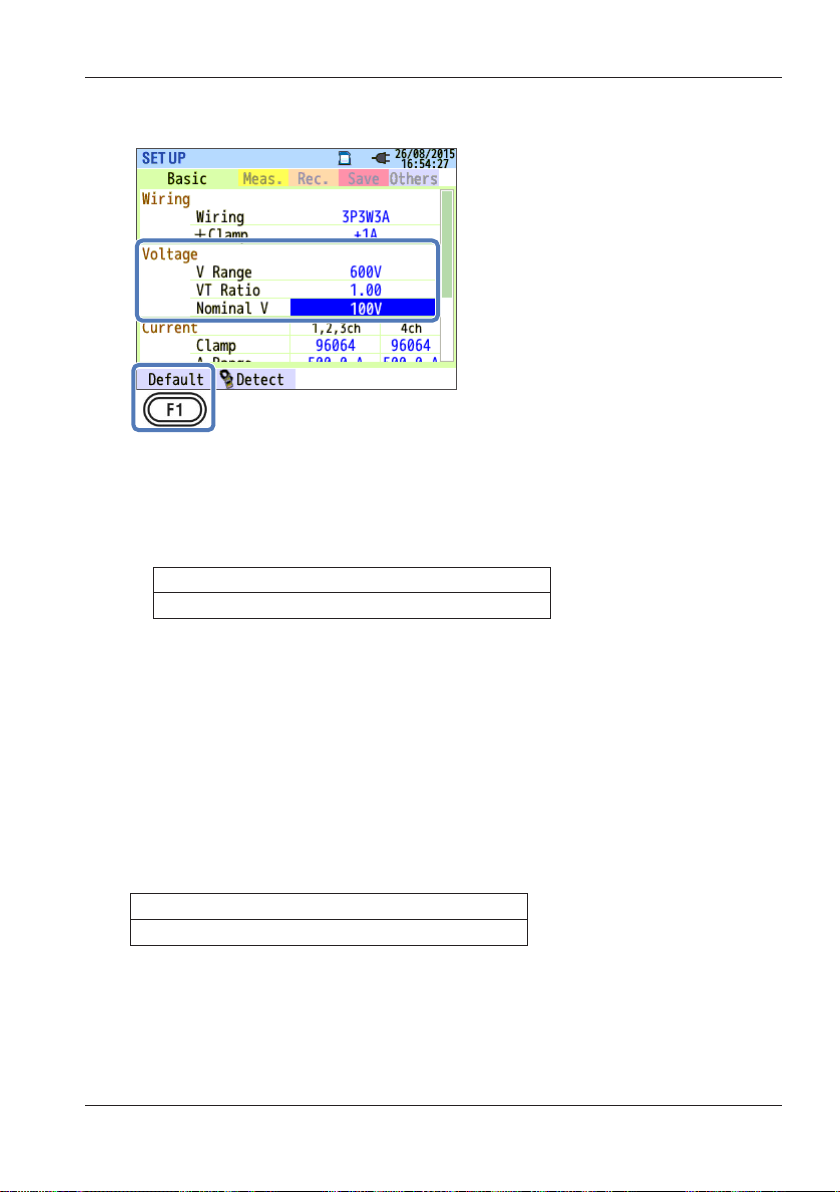
Nominal V
Set the nominal voltage applied from the DUT.
Settings
*
)
*
Default value
50V~600V(100V
<Procedure>
Use the up and down arrow keys to move to Nominal V. → Press ENTER
to show a value entry window.* → Use the arrow keys to enter the
nominal voltage. → Press ENTER to confirm or ESC to cancel.
* The input range is shown in a pop-up.
Default Values
When you move to the Nominal V item, you can press F1 (default values)
to show a list of typical nominal voltages that you can choose from.
Settings
100V/101V/110V/120V/200V/202V/208V/220V/230V/
240V/277V/346V/380V/400V/415V/480V/600V
<Procedure>
Use the arrow keys to select nominal voltage.
confirm or ESC to cancel.
Press ENTER to
→
IM CW500-01EN
5-7
Page 43
5.2 Basic Setup
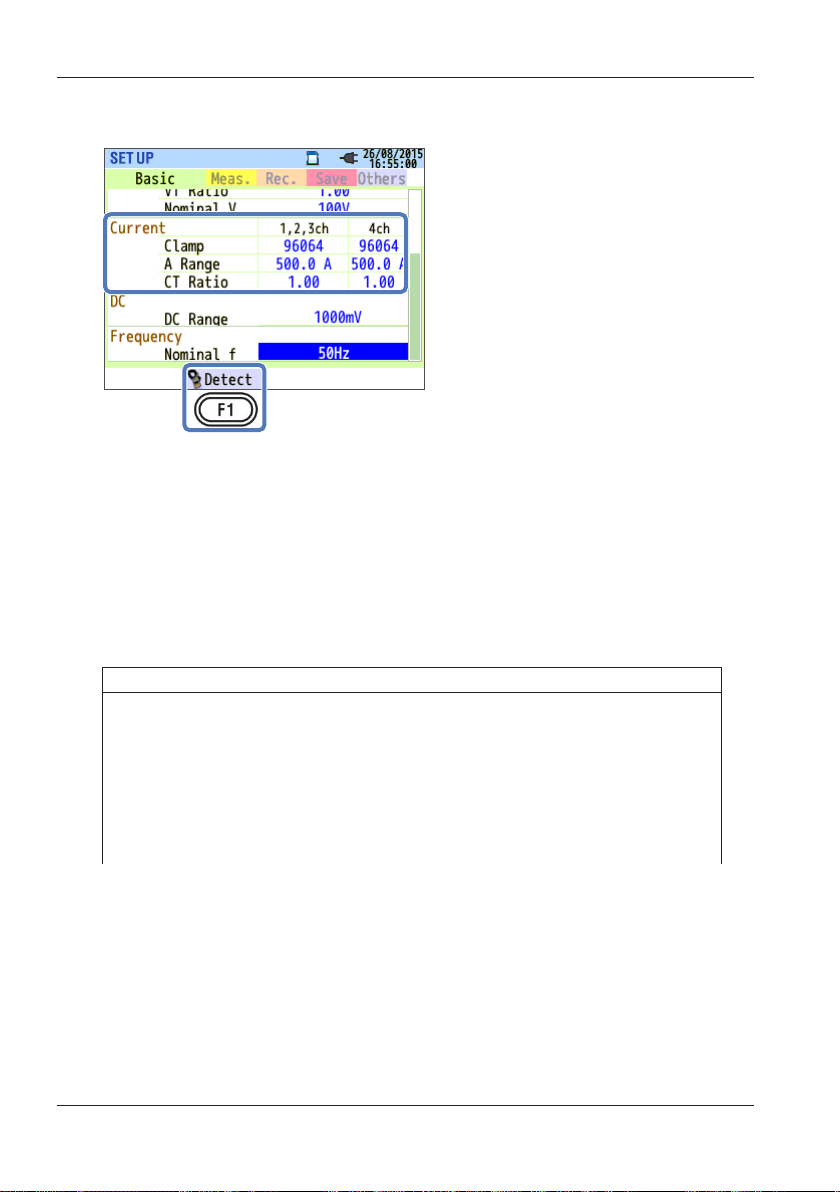
Current Measurement Settings
Clamp (Current clamp-on probe)
Select the current clamp-on probe you want to use. If you selected an
optional clamp-on probe for “+Clamp,” you can select a current clampon probe that is of a different type than the current clamp-on probe
connected to the DUT only for channel 4. If you select a current clamp-on
probe from the pull-down menu, the rated current and the conductor size
are displayed in a pop-up.
Settings
96060: 0.2/2A/AUTO$3 Leak current clamp-on probe
96061:5/50A/AUTO
96062:10/100A/AUTO
96063:20/200A/AUTO
*
96064
:50/500*A/AUTO
96066:100/1000A/AUTO
96065:300/1000/3000
*
Default value
<Procedure>
Use the arrow keys to move to Clamp. → Press ENTER to show a pulldown menu. → Use the arrow keys to select the current clamp-on probe.
Press ENTER to confirm or ESC to cancel.
→
Power measurement clamp-on probe
5-8
IM CW500-01EN
Page 44

5.2 Basic Setup
Current Range
Select the current range to use. If power quality events are set to be
recorded, AUTO is not available.* If you want the current range to switch
automatically, set power quality events to “Do not record.” For details
on power quality event settings, see “Power Quality (Event) Threshold
Settings” on page 5-18.
* If AUTO range is selected, measurements according to international
power quality standard IEC61000-4-30 Class S cannot be performed.
<Procedure>
Use the arrow keys to move to A Range. → Press ENTER to show a pulldown menu. → Use the up and down arrow keys to select the range. →
Press ENTER to confirm or ESC to cancel.
CT Ratio
Set this when an external CT (current transformer) is installed in the
system. The CT ratio will be applied to all current measurements. For
details on CT, see “VT/CT” on page 5-6.
Settings
*
0.01~9999.99(1.00
)
* The default value is 1.00.
<Procedure>
Use the arrow keys to move to CT Ratio.
Press ENTER to show a
→
value entry window.* → Use the arrow keys to select the CT ratio. →
Press ENTER to confirm or ESC to cancel.
* The input range is shown in a pop-up.
IM CW500-01EN
5-9
Page 45

5.2 Basic Setup
Sensor Detection
Press F2 (sensor detection) to automatically set the connected current
clamp probe. However, if a current clamp-on probe whose type is not
appropriate for the DUT is connected or if the type fails to be detected,
this will not work. If this happens, an error message appears in a pop-up,
and Clamp, A Range, and CT ratio settings will be cleared. For details on
sensor detection, see section 4.2, “Sensor Detection.”
5-10
IM CW500-01EN
Page 46

5.2 Basic Setup
External Input Terminal and Reference Frequency
Settings
DC Range
Select the DC range according to the input DC voltage signal.
Settings
100mV/1000mV
* Default value
<Procedure>
Use the up and down arrow keys to move to DC Range.
to show a pull-down menu. → Use the up and down arrow keys to select
the range. → Press ENTER to confirm or ESC to cancel.
*
/10V
Press ENTER
→
Frequency
Set the nominal frequency for the DUT. If the voltage frequency cannot be
determined, such as during a power failure, the CW500 measures based
on the preset nominal frequency.
Settings
*
/60Hz
50Hz
* Default value
<Procedure>
Use the up and down arrow keys to move to Nominal f.
to show a pull-down menu. → Use the up and down arrow keys to select
the frequency. → Press ENTER to confirm or ESC to cancel.
IM CW500-01EN
Press ENTER
→
5-11
Page 47

5.3 Measurement Setup
<Procedure>
Press SETUP.
Measurement tab.
Demand Measurement Settings
Use the left and right arrow keys to select the
→
5-12
IM CW500-01EN
Page 48

5.3 Measurement Setup
Measurement
Disable demand measurement or select the demand measurement cycle.
When demand measurement is started, the demand value is determined
every measurement interval and recorded. In demand measurement,
the recording interval can be set only to the times shown below. If the
interval is set to some other value and the measurement interval is set,
the interval is automatically set to the same value as the measurement
interval.
Selectable intervals: 1 s, 2 s, 5 s, 10 s, 15 s, 20 s, 30 s, 1 min, 2 min, 5
min, 10 min, 15 min,* 30 min
* The interval cannot be set to a value longer than the measurement
interval.
*
Settings
Not be used, 10 min, 15 min, 30 min
*
* Default value
<Procedure>
Use the up and down arrow keys to move to Measurement. → Press
ENTER to show a pull-down menu. → Use the up and down arrow keys
to select the time. → Press ENTER to confirm or ESC to cancel.
Target
Set the demand measurement target value.
Settings
0.001mW~999.9TW(100.0kW
* Default value
<Procedure>
Use the arrow keys to move to Target.
entry window.* → Use the arrow keys to enter the target value. → Press
ENTER to confirm or ESC to cancel.
* The input range is shown in a pop-up.
*
)
Press ENTER to show a value
→
IM CW500-01EN
5-13
Page 49
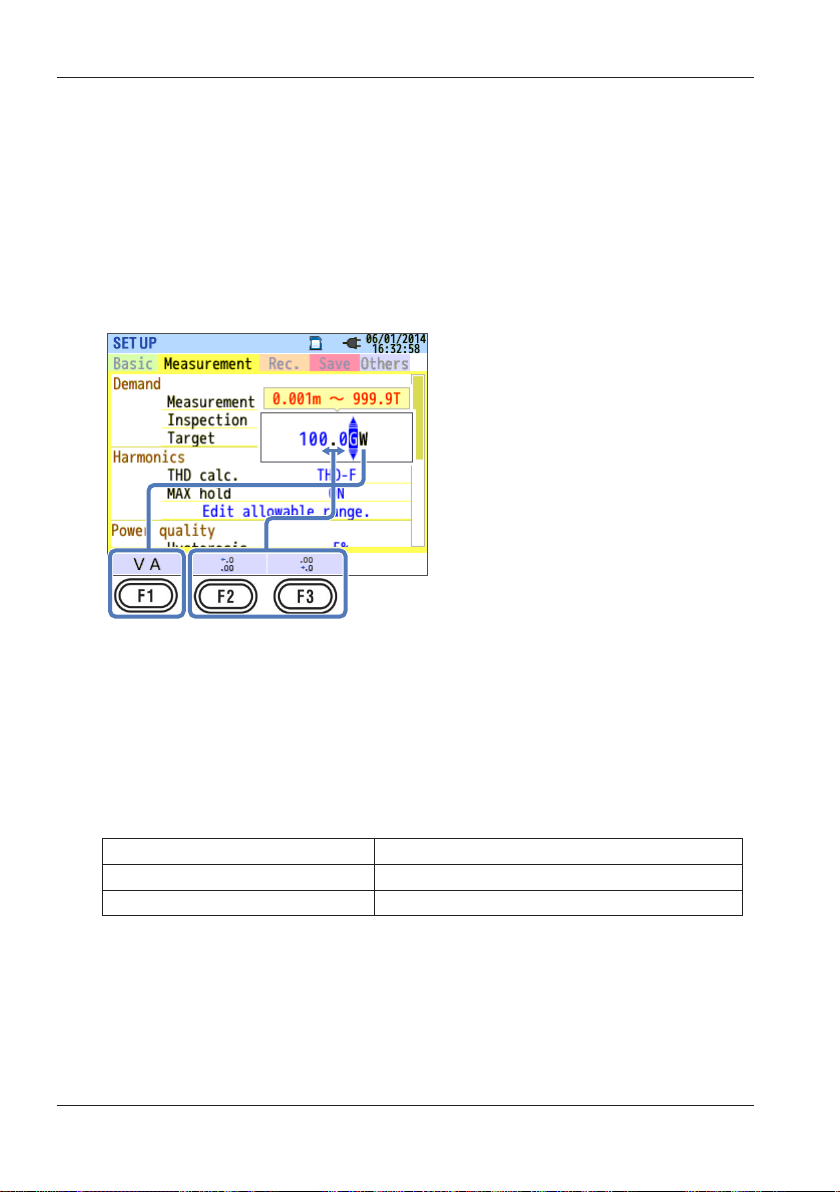
5.3 Measurement Setup
When the target value entry window is displayed, the following operations
become valid. You can specify an active power or apparent power for
the demand target value. To switch between active power and apparent
power, press F1 (VA/W) to change to the appropriate power unit.* To
change the unit,* use the left and right arrow keys to move to the unit, and
use the up and down arrow keys to change it. Press F2 and F3 to move
the decimal point.
*
Apparent power:mVA, _VA, kVA, MVA, GVA, TVA
Active power:mW, _W, kW, MW, GW, TW
Inspection cycle
Select the cycle (time) during which a buzzer is sounded when the
estimated value exceeds the target value during demand measurement.
You cannot set the inspection cycle longer than the measurement
cycle. The inspection cycles that can be selected depending on the
measurement cycle are shown below.
Measurement cycle setting Selectable inspection cycles
10 min or 15 min 1 min, 2 min, 5 min
30 min 1 min, 2 min, 5 min, 10 min,
* Default value
<Procedure>
Use the up and down arrow keys to move to Inspection.
to show a value entry window.* → Use the arrow keys to select the time.
Press ENTER to confirm or ESC to cancel.
→
* The input range is shown in a pop-up.
5-14
Press ENTER
→
*
15 min
IM CW500-01EN
Page 50
(kW)
0
5.3 Measurement Setup
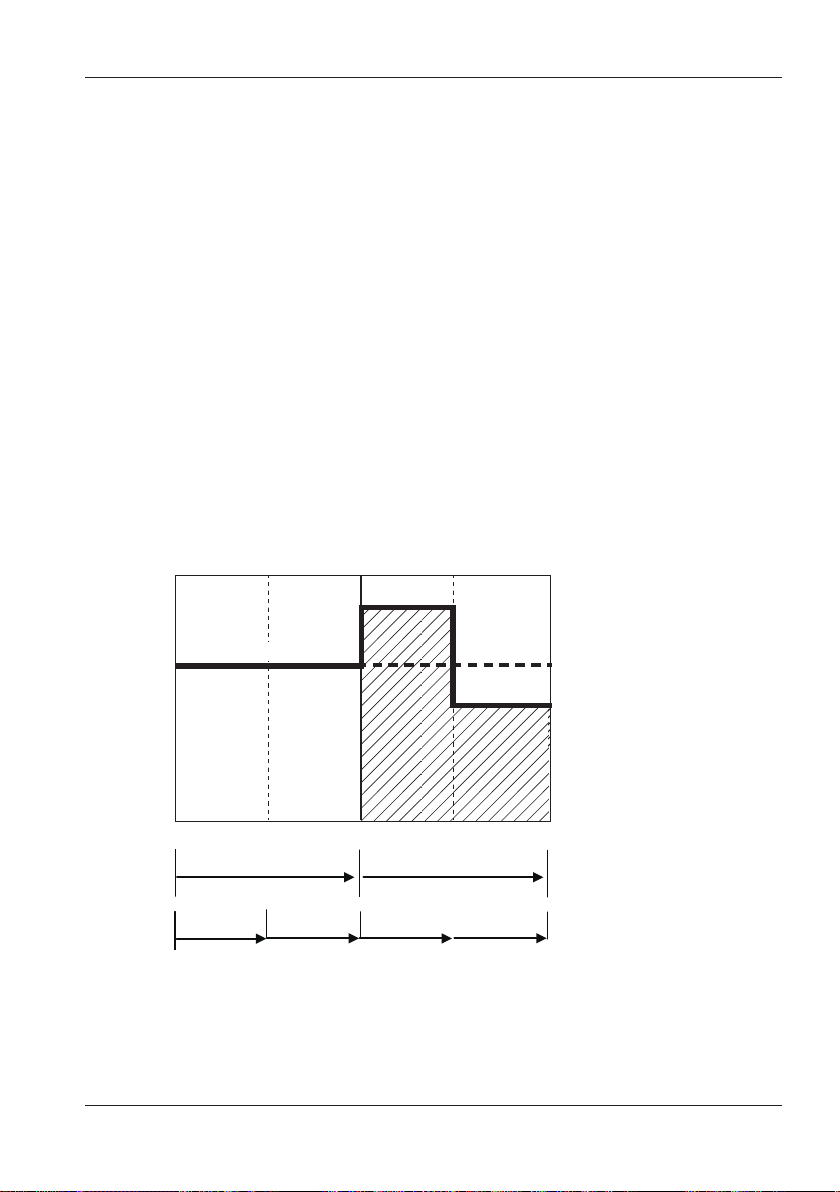
Demand Measurement Overview
The average power over 30 minutes (measurement cycle) is typically
called the demand. Contract demand for factories and the like is
determined by this demand. A method to suppress demand is explained
below using an example. Assuming that the maximum demand needs
to be suppressed to 500 kW (target value), measurement cycle 1 is not
a problem because the demand is 500 kW, but measurement cycle 2 is
because 600 kW of power is consumed in the first 15 minutes. In this
case, the demand for measurement cycle 2 can be suppressed to 500 kW
(the same as measurement cycle 1) by reducing the power of the last 15
min to 400kW. Note that if the power consumption during the first half of
cycle 2 is 1000 kW and the last 15 minutes is 0 kW (no load), the average
power is also 500 kW. If Inspection is set to 15 min, the buzzer will sound
after 15 minutes at measurement cycle 2.
600
500
0 15 30
IM CW500-01EN
500kW
600kW
Interval 2Interval 1
15
500kW
400kW
3
5-15
Page 51
5.3 Measurement Setup
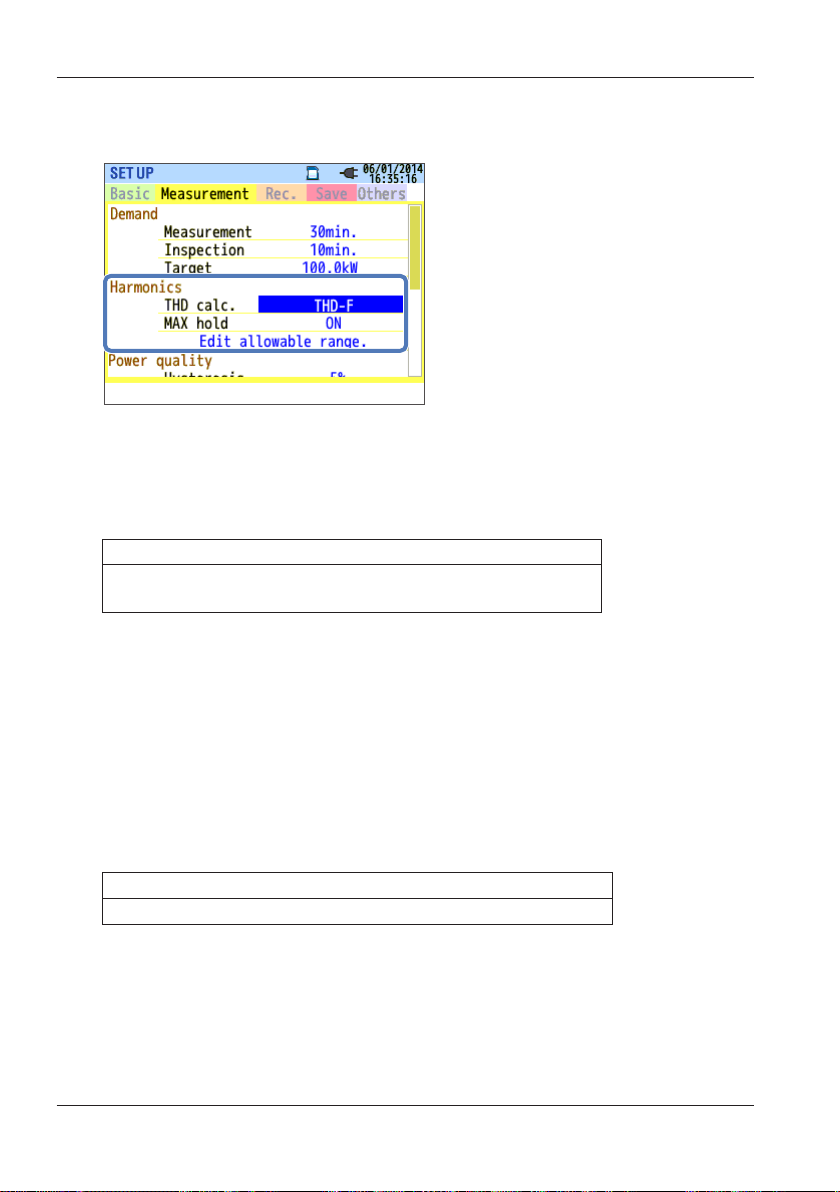
Harmonic Analysis Settings
THD calculation
Select the THD (total harmonic distortion) calculation method. Select
THD-F to calculate the total harmonics distortion based on the
fundamental waveform and “THD-R” to calculate based on all rms values.
Settings
THD-F (fundamental waveform as reference)
(all rms values as reference)
*
Default value
<Procedure>
Use the up and down arrow keys to move to THD calc. → Press ENTER
to show a pull-down menu. → Use the up and down arrow keys to select
the calculation method. → Press ENTER to confirm or ESC to cancel.
*
/THD-R
MAX hold
If MAX hold is set to ON, the maximum percentage content from the start
of measurement is marked on the harmonics graph.
Settings
*
/OFF
ON
*
Default value
<Procedure>
Use the up and down arrow keys to move to MAX hold. → Press ENTER
to show a pull-down menu. → Use the up and down arrow keys to select
ON or OFF. → Press ENTER to confirm or ESC to cancel.
5-16
IM CW500-01EN
Page 52
5.3 Measurement Setup
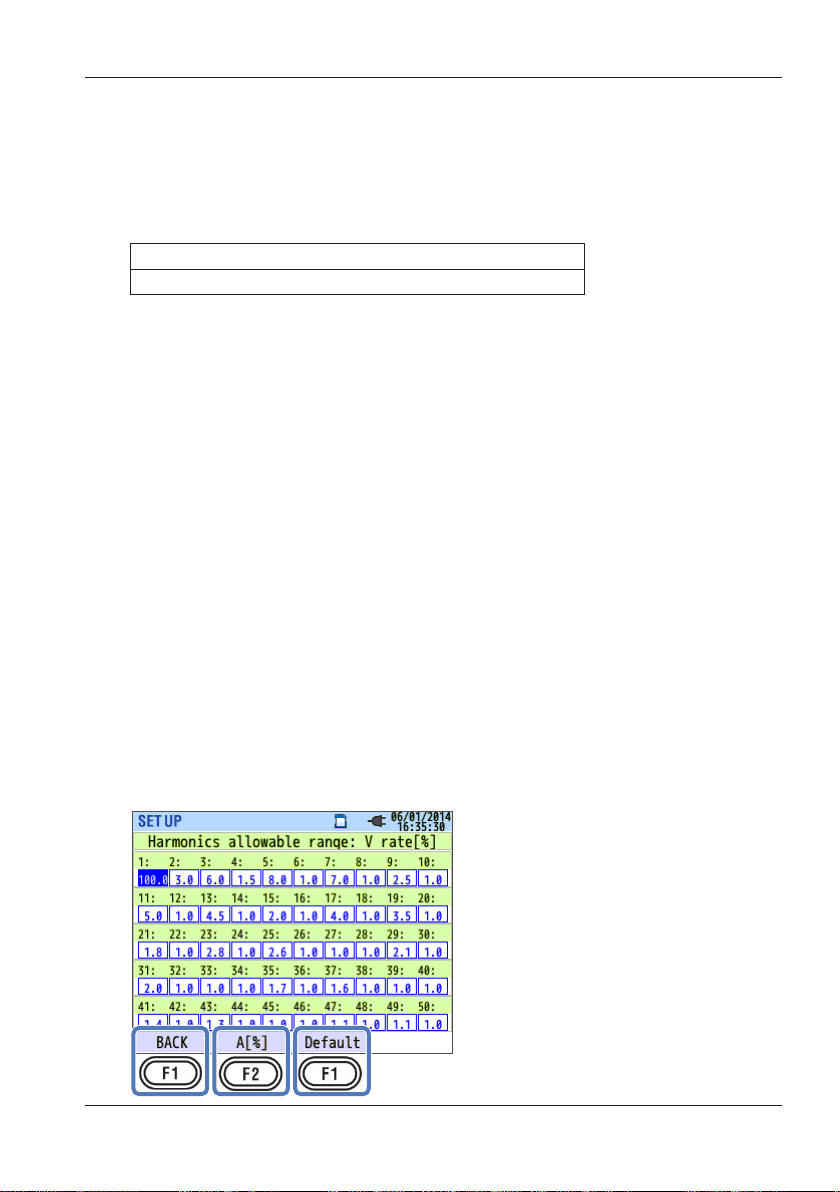
Editing the Allowable Range
Set the EMC allowable range (percentage content) for harmonics for
each order. The specified ranges are displayed as a bar graph on the
harmonics graph.
Settings
*
Specified value
*
Default value
<Procedure>
Use the up and down arrow keys to move to Edit allowable range. →
Press ENTER to display the allowable range entry window. → Use
the arrow keys to select the harmonic order you want to set. → Press
ENTER to open a value entry window.* → Use the arrow keys to enter
the allowable values. → Press ENTER to confirm or ESC to cancel.
* The input range is shown in a pop-up.
When the allowable range entry window is displayed, the following
operations become valid. The default allowable values of each harmonic
order are the values of the international EMC standard IEC61000-47: industrial environment Class 3. If you change the values and want to
reset to their defaults, press F3 (default). Press F2 (A/V [%]) to switch
between the allowable value entry window of harmonic current and that of
harmonic voltage. To return to the measurement setup screen, press F1
(return).
/customize (voltage/current)
IM CW500-01EN
5-17
Page 53

5.3 Measurement Setup
Power Quality (Event) Threshold Settings
Press F1 (OFF/ON) to enable the threshold of each event to be entered.
Even if a threshold is specified, the event will not be detected if it is set
to OFF. When you set an event back to ON, the threshold set previously
appears.
Notes on Setting the Thresholds
Because the SWELL, DIP, and INT thresholds are set as percentages
of the nominal voltage, if the nominal voltage is changed, the threshold
voltages also change. The default value is the peak voltage (300%).
Because the InrushCurrent threshold is set as a percentage of the
current range, if the current range is changed, the threshold current also
changes. Keep these in mind.
5-18
IM CW500-01EN
Page 54
(Voltage)
Voltage waveform
5.3 Measurement Setup
Hysteresis
Set the measurement area where events will not be detected as a
percentage of the threshold. Setting a proper hysteresis will help to
prevent unnecessary detections of events that are caused by voltage or
current fluctuations near the threshold values.
Settings
1 to 10% (5%*) of the threshold
*
Default value
<Procedure>
Use the arrow keys to move to Hysteresis. → Press ENTER to show a
value entry window.* → Use the arrow keys to enter the hysteresis [%].
Press ENTER to confirm or ESC to cancel.
→
* The input range is shown in a pop-up.
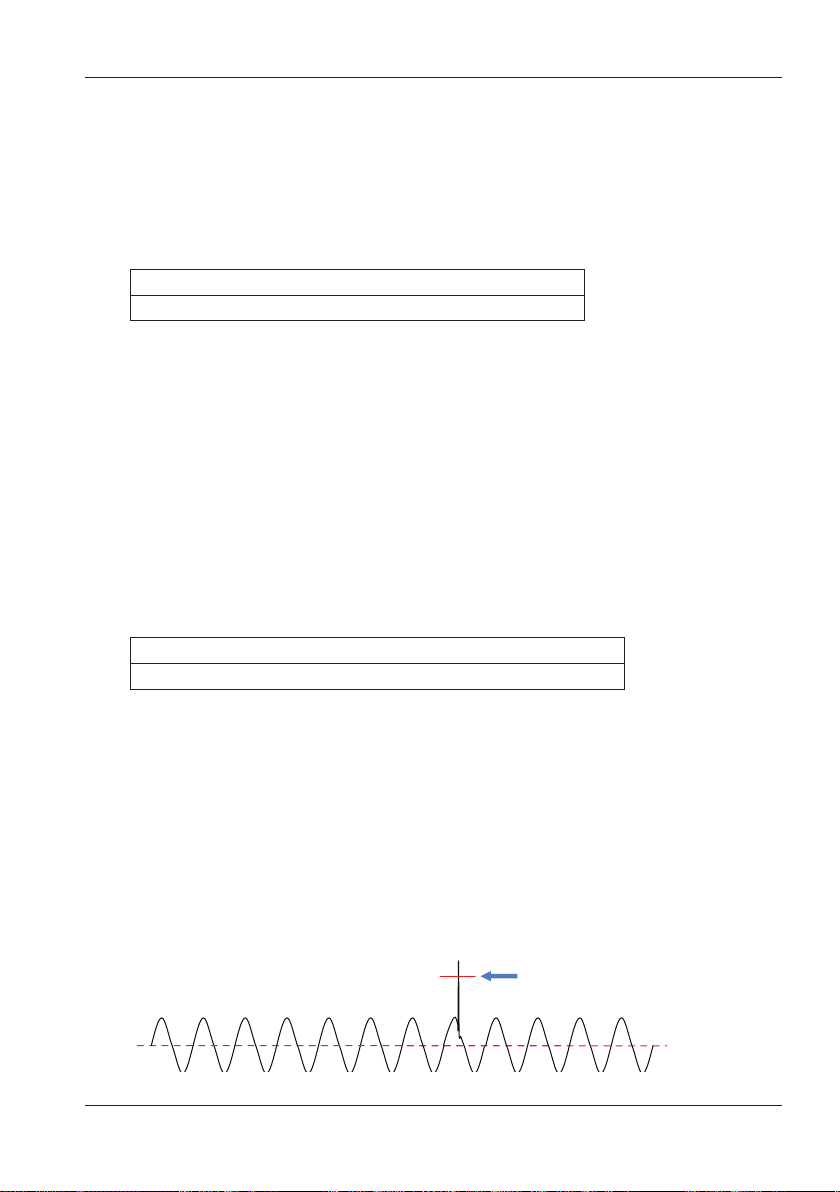
Transient (Over-voltage (Impulse))
Set the transient threshold as an instantaneous voltage. The selectable
range varies depending on the VT ratio.
IM CW500-01EN
Settings
*
±50 to ±2200 Vpeak (300% of the nominal voltage
)
* Default value
<Procedure>
Use the arrow keys to move to Transient.
Press ENTER to show a
→
value entry window.* → Use the arrow keys to enter the voltage. →
Press ENTER to confirm or ESC to cancel.
* The input range is shown in a pop-up.
Example of Transient Detection
For details, see “Displaying Recorded Events” on page 6-27.
Threshold
5-19
Page 55

5.3 Measurement Setup
Swell (Instantaneous voltage rise)
Set the swell threshold (rms voltage in one cycle) as a percentage of the
nominal voltage. The selectable range varies depending on the VT ratio.
Hysteresis is applied to this threshold.
Settings
*
100 to 200% (110%
*
Default value
) of the nominal voltage
<Procedure>
Use the up and down arrow keys to move to SWELL. → Press ENTER to
show a value entry window.* → Use the arrow keys to enter a percentage
of the nominal voltage.
* The input range is shown in a pop-up.
Inrush current (Instantaneous current rise)
Set the inrush current threshold (rms current in one cycle) as a
percentage of the maximum value of the current range. The selectable
range varies depending on the CT ratio. Hysteresis is applied to this
threshold.
Settings
0 to 110% (100%*) of the current range
*
Default value
<Procedure>
Use the up and down arrow keys to move to InrushCurrent. → Press
ENTER to show a value entry window.* → Use the arrow keys to enter a
percentage of the maximum value of the current range.
* The input range is shown in a pop-up.
5-20
IM CW500-01EN
Page 56
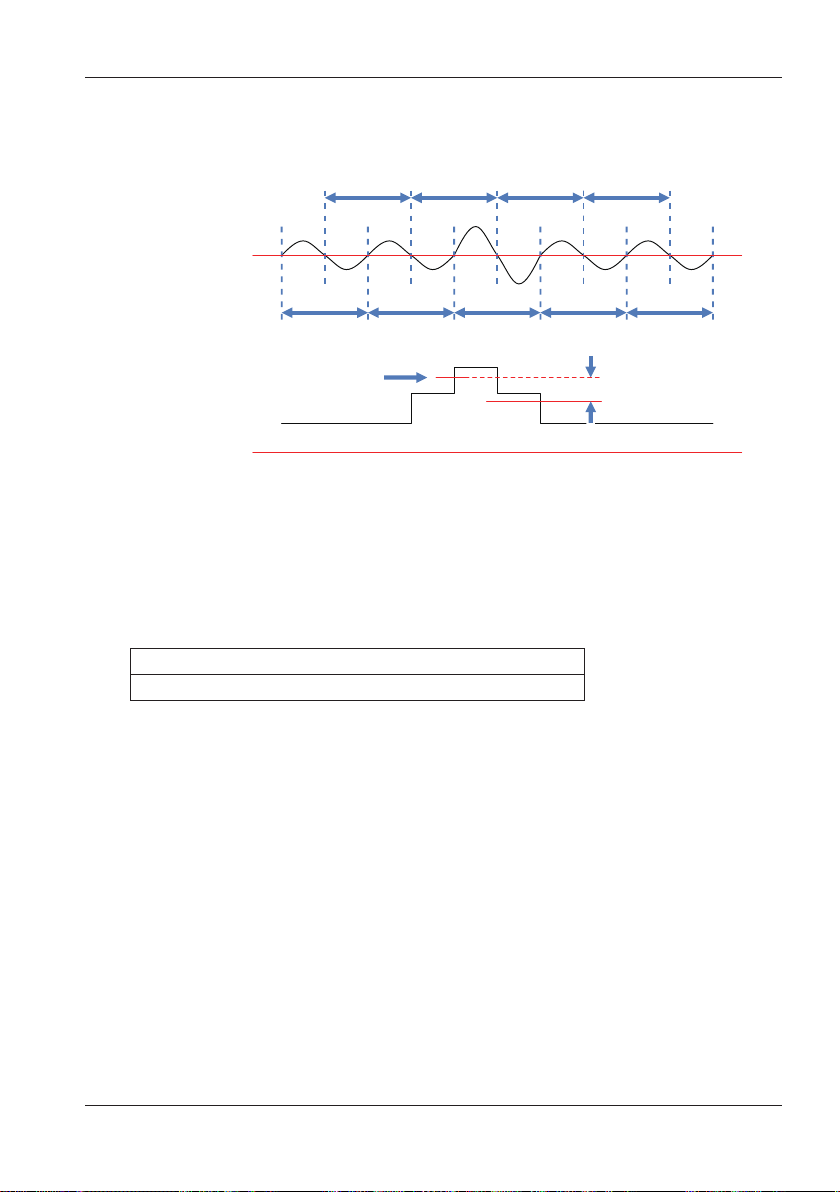
Rms value (2)
Rms value (4) Rms value (6) Rms value (8)
Voltage/current
waveform
5.3 Measurement Setup
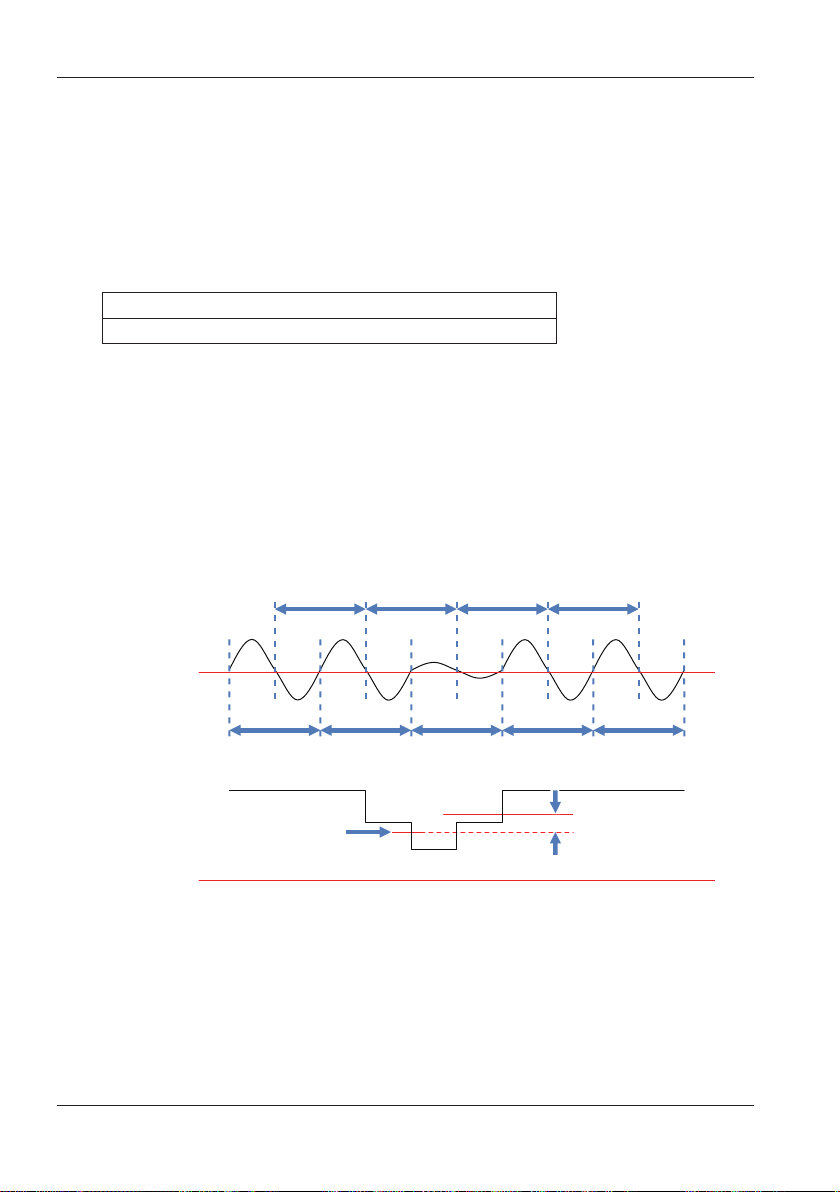
Example of Swell and Inrush Current Detection
For details, see “Displaying Recorded Events” (section 6.7).
Rms value (1)
Threshold
Rms waveform
Rms value (3) Rms value (5) Rms value (7) Rms value (9)
(5)
(4)
(6)
Hysteresis
(7) (8) (9)(1) (2) (3)
Dip (Instantaneous voltage drop)
Set the dip threshold (rms voltage in one cycle) as a percentage of the
nominal voltage. The selectable range varies depending on the VT ratio.
Hysteresis is applied to this threshold.
Settings
*
0 to 100 % (90 %
*
Default value
<Procedure>
Use the up and down arrow keys to move to DIP. → Press ENTER to
show a value entry window.* → Use the arrow keys to enter a percentage
of the nominal voltage.
* The input range is shown in a pop-up.
) of the nominal voltage
IM CW500-01EN
5-21
Page 57
Rms value (2)
Rms value (4) Rms value (6) Rms value (8)
Rms waveform
5.3 Measurement Setup
Interruption (Instantaneous power interruption)
Set the interruption threshold (rms voltage in one cycle) as a percentage
of the nominal voltage. The selectable range varies depending on the
VT ratio. Hysteresis is applied to this threshold. To detect events at rms
voltages of 10 V or less, be sure to enable the interruption event. Proper
detection may not be possible by setting a similar threshold for dip.
Settings
*
0 to 100 % (10 %
* Default value
<Procedure>
Use the up and down arrow keys to move to INT.
show a value entry window.* → Use the arrow keys to enter a percentage
of the nominal voltage.
* The input range is shown in a pop-up.
Example of Dip and Interruption Detection
For details, see “Displaying Recorded Events” on page 6-27.
) of the nominal voltage
Press ENTER to
→
5-22
Voltage
waveform
Rms value (1)
Threshold
Rms value (3) Rms value (5) Rms value (7) Rms value (9)
(4)
(5)
(6)
(7) (8) (9) (1) (2) (3)
Hysteresis
IM CW500-01EN
Page 58

5.3 Measurement Setup
Flicker Filter Coefficient Settings
Filter Coefficient
Select an appropriate filter coefficient according to the nominal voltage.
To accurately measure flicker, the nominal voltage, nominal frequency,
and filter coefficient must be set properly for the actual DUT. If possible,
use the same voltage for the nominal voltage and filter coefficient.
Settings
*
/220V/120V/100V
230V
*
Default value
<Procedure>
Use the up and down arrow keys to move to Filter. → Press ENTER to
show a pull-down menu. → Select the appropriate filter coefficient. →
Press ENTER to confirm or ESC to cancel.
IM CW500-01EN
5-23
Page 59
5.3 Measurement Setup
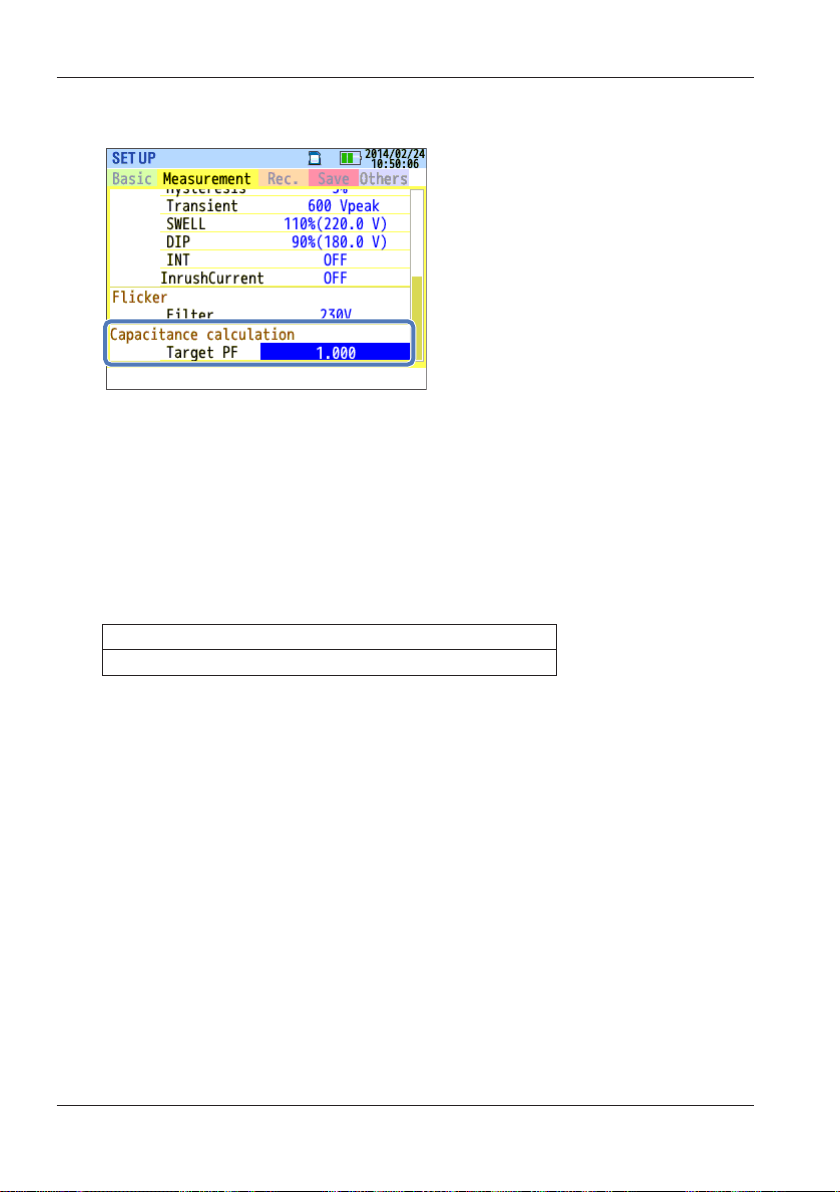
Target Power Factor for Phase Advance Capacitor
Target Power Factor
Set the power factor for when phase advance capacitors are installed.
The power factor degrades if inductive loads, such as motors, are
connected to the power supply because current phases lag behind the
voltage phases. Usually, phase advance capacitors are installed in highvoltage-receiving installations, to improve this situation.
Settings
*
)
*
Default value
0.5 to 1 (1.000
<Procedure>
Use the up and down arrow keys to move to Target PF. → Press ENTER
to show a value entry window.* → Use the arrow keys to enter the target
power factor.
* The input range is shown in a pop-up.
5-24
IM CW500-01EN
Page 60

5.4 Recording Setup
<Procedure>
Press SETUP.
Recording tab.
Recording Item Settings
Use the left and right arrow keys to select the
→
The length of time that measured data can be recorded to an SD
memory card or internal memory varies depending on the number of
recorded items and interval. Recording time can be extended by setting
unnecessary record items to “Do not record.” For details, “Possible
Recording Time” on page 5-30.
Power
This is fixed to “Record.” Power measurement items are always recorded.
IM CW500-01EN
5-25
Page 61

5.4 Recording Setup
Harmonics
Select whether to record the harmonic data of voltage, current, and
power.
Settings
*
/Not record
*
Default value
Record
Event
Select whether to record detailed data when a power quality event
occurs. If the current range is set to AUTO, “Record” cannot be selected.
To select “Record,” change the current range to a fixed range first.
* If AUTO range is selected, measurements according to international
power quality standard IEC61000-4-30 Class S cannot be performed.
Settings
Record*/Not record
*
Default value
<Procedure>
Use the up and down arrow keys to move to Harmonics or Event. →
Press ENTER to show a pull-down menu. → Use the up and down arrow
keys to select Record or Do not record. → Press ENTER to confirm or
ESC to cancel.
5-26
IM CW500-01EN
Page 62

5.4 Recording Setup
Record Items
The following data measured on each channel is recorded according to
the selected record method.
Record items vary depending on the record method and wiring system.
Record file Record items
RMS voltage (line/ phase)
Rms current
Active power
Reactive Power
Apparent power
Power factor
Frequency
Neutral line current (3P4W)
Voltage/current phase angle (1st order)
Analog input voltage, 1CH, 2CH
Power
measurement
data
Harmonic
measurement
data
Voltage/current
fluctuation
data
Event type
data
Waveform data Voltage/current waveforms
Voltage/current unbalance ratio
1-minute voltage flicker
Short term voltage flicker (Pst)
Long term voltage flicker (Plt)
Phase advance capacitor capacitance
Active energy (consumption/regeneration)
Reactive power (consumption) lag/lead
Volt-ampere hours (consumption/regeneration)
Reactive power (regeneration) lag/lead
Demand (W/VA)
Target demand (W/VA)
Total harmonic voltage distortion (F/R)
Total harmonic current distortion (F/R)
Harmonic voltage/current (1 to 50th order)
Voltage/current phase angle (1 to 50th order)
V/A phase difference (1 to 50th order)
Harmonic power (1 to 50th order)
Rms voltage per half-cycle
Rms current per half-cycle
Event detection date and time
Event type
Measured values at event detection
Recording setup
Power +Harmonics +Event
● ● ●
●
●
●
●
IM CW500-01EN
5-27
Page 63

5.4 Recording Setup
Record Method Settings
Interval
Set the interval to record the measured data to the SD memory card
or internal memory. Seventeen different intervals are available, but if
the measurement interval of demand measurement is already set, the
record interval cannot be set longer than the measurement interval.
To set a longer interval, change the measurement interval of demand
measurement to “Not be used” first. If you set the measurement interval of
demand measurement after you set the record interval, the record interval
is automatically set to the same setting as the measurement interval. For
details, see “Demand Measurement Settings” (page 5-12).
Settings
1s/2s/5s/10s/15s/20s/30s/
1min/2min/5min/10min/15min/20min/30min
*
/
1h/2h/150, 180 cycle (approx. 3 s)
*
Default value
The intervals 150, 180 cycles (approx. 3 sec) are defined in the
international power quality standard IEC61000-4-30. Data will be
collected for 150 cycles for 50 Hz nominal frequency and 180 cycles for
60 Hz nominal frequency.
<Procedure>
Use the arrow keys to move to Interval. → Press ENTER to show a
selection window.* → Use the arrow keys to enter the recording interval.
Press ENTER to confirm or ESC to cancel.
→
5-28
IM CW500-01EN
Page 64

5.4 Recording Setup
Start
Select the method to start recording.
Settings
Manual*/Constant rec./Time period rec.
* Default value
<Procedure>
Use the up and down arrow keys to move to Start.
show a pull-down menu.
the recording start method. → Press ENTER to confirm or ESC to cancel.
Use the up and down arrow keys to select
→
Manual
The CW500 records during the period from when you start recording to
when you stop recording using the START/STOP key.
Constant rec.
Set the time to start and stop recording. The CW500 records repeatedly
during the period between the start and stop times at the specified
interval. For details see “Reserving by Specifying the Date and Time” or
“Reserving a Repetitive Recording” (page 4-9).
Press ENTER to
→
Settings Settings
Start date/time Day/Month/Year Hour:Minute (00/00/0000 00:00)
Stop date/time Day/Month/Year Hour:Minute (00/00/0000 00:00)
<Procedure>
Use the arrow keys to move to REC Start/REC End.
show a time entry window. → Use the arrow keys to select the date and
time. → Press ENTER to confirm or ESC to cancel.
IM CW500-01EN
Press ENTER to
→
5-29
Page 65

5.4 Recording Setup
Time Period Recording
Set the recording period by specifying the start date and stop date, and
the common time slot during which recording will take place on each day
of the recording period. During each time slot, recording is performed at
the specified interval. For details see “Reserving by Specifying the Date
and Time” or “Reserving a Repetitive Recording” (page 4-9).
Settings Settings
REC Period Start—Stop
REC Time Start—Stop Hour:Minute (hh:mm) - Hour:Minute(hh:mm)
<Procedure>
Use the arrow keys to move to REC Period.
a time entry window. → Use the arrow keys to enter the date and time.
Press ENTER to confirm or ESC to cancel. → Use the arrow keys to
→
move to Time period rec. → Press ENTER to show a time entry window.
Use the arrow keys to enter the time. → Press ENTER to confirm or
→
ESC to cancel.
Day/Month/Year (DD/ MM/ YYYY) -
Day/Month/Year (DD/ MM/ YYYY)
Press ENTER to show
→
Possible Recording Time
Estimated recording time for a 2GB SD memory card
Interval
1 s 13 days 3 days 1 min 1 year or more 3 months
2 s 15 days 3 days 2 min 2 year or more 6 months
5 s 38 days 7 days 5 min 6 year or more 1 year or more
10 s 2.5 months 15 days 10 min
15 s 3.5 months 23 days 15 min 3 year or more
20 s 5 months 1 months 20 min 5 year or more
30 s 7.5 months 1.5 months 30 min 7 year or more
* The above figures do not include power quality event data. If events
are recorded, the possible recording time will decrease by the amount
of such events. The maximum event data size that can be saved per
recording is 1 GB.
* The SD memory cards that can be used with this instrument are those
provided by YOKOGAWA.
5-30
REC item
Power
+Harmonics
Interval
10 year or more
1 hour
2 hours
150/180 cycle 23 days 4 days
Power
REC item
+Harmonics
2 year or more
10 year or more
IM CW500-01EN
Page 66
5.5 Other Settings
<Procedure>
Press SETUP.
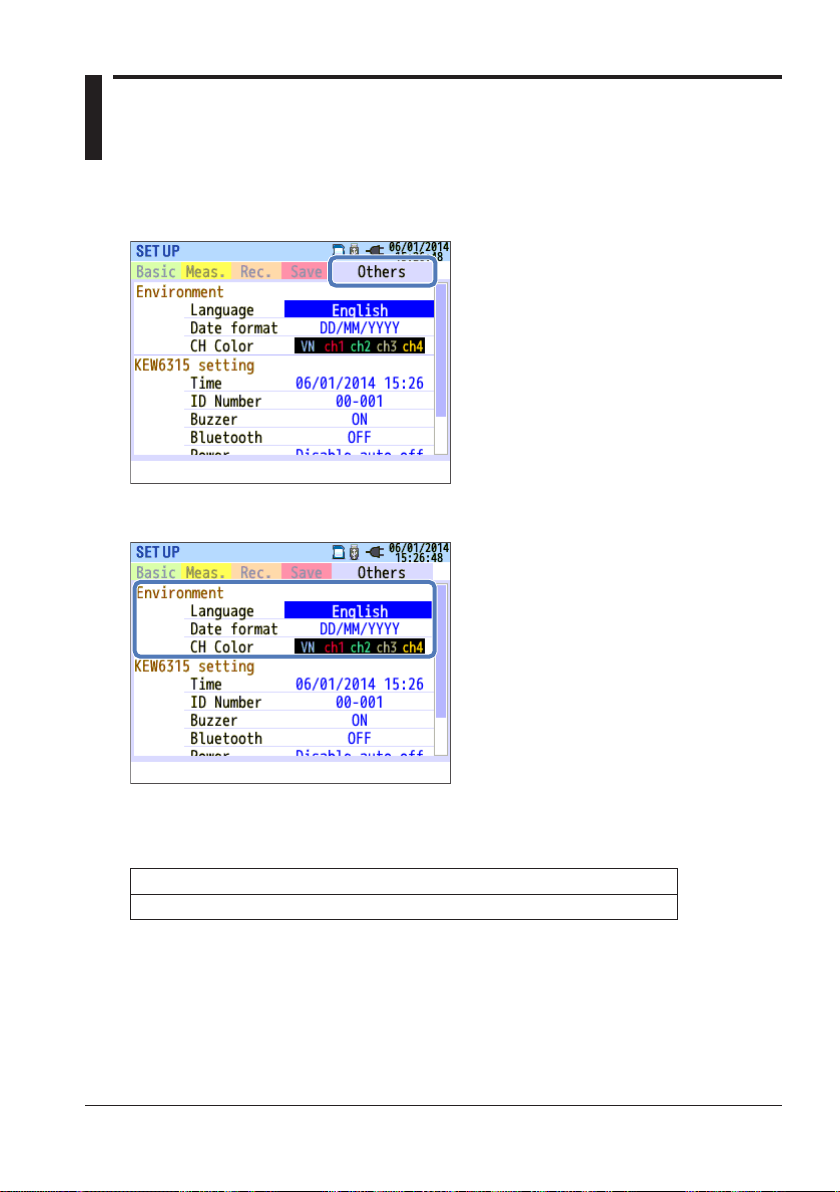
System Environment Settings
Use the left and right arrow keys to select the Others tab.
→
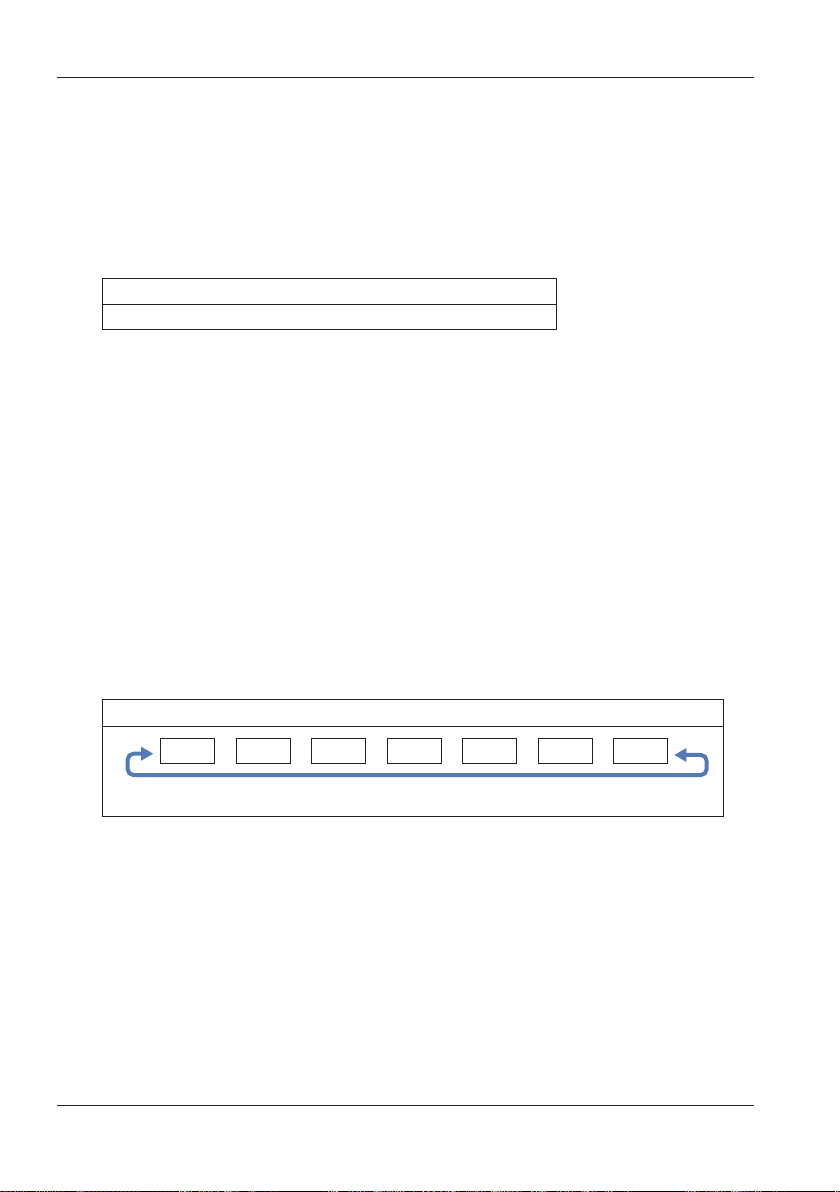
Language
Select the language to be displayed.
*
English
*
Default value. However, this setting will not be initialized even when the
system is reset.
<Procedure>
Use the up and down arrow keys to move to Language. → Press ENTER
to show a pull-down menu. → Use the up and down arrow keys to select
the language. → Press ENTER to confirm or ESC to cancel.
IM CW500-01EN
/Japanese/French/Spanish/Polish/Korean/Chinese
Settings
5-31
Page 67
5.5 Other Settings
Date format
Select the date display format. You can change the display format of all
displayed dates, such as the current date shown in the upper right of the
screen and the recording start and stop dates that are shown and that
you edit.
Settings
*
YYYY/MM/DD / MM/DD/YYYY
*
Default value. However, this setting will not be initialized even when the
/ DD/MM/YYYY
system is reset.
<Procedure>
Use the up and down arrow keys to move to Date format. → Press
ENTER to show a pull-down menu. → Use the up and down arrow keys
to select the format. → Press ENTER to confirm or ESC to cancel.
CH color
Specify the colors for voltage and current of each channel. You can
change the item label text colors, graph colors, wiring diagram’s channel
colors, and so on.
Settings
White*
VN is only supported in wiring diagrams.
* The default color settings are VN: Yellow, 1CH: Red, 2CH: White, 3CH:
Blue, 4CH: Green. However, these setting will not be initialized even
when the system is reset.
<Procedure>
Use the arrow keys to move to CH color. → Press ENTER to show a
selection window.* → Use the arrow keys to select the color. → Press
ENTER to confirm or ESC to cancel.
Yellow*
Orange
Red* Gray Blue*
Green*
// / / / /
5-32
IM CW500-01EN
Page 68
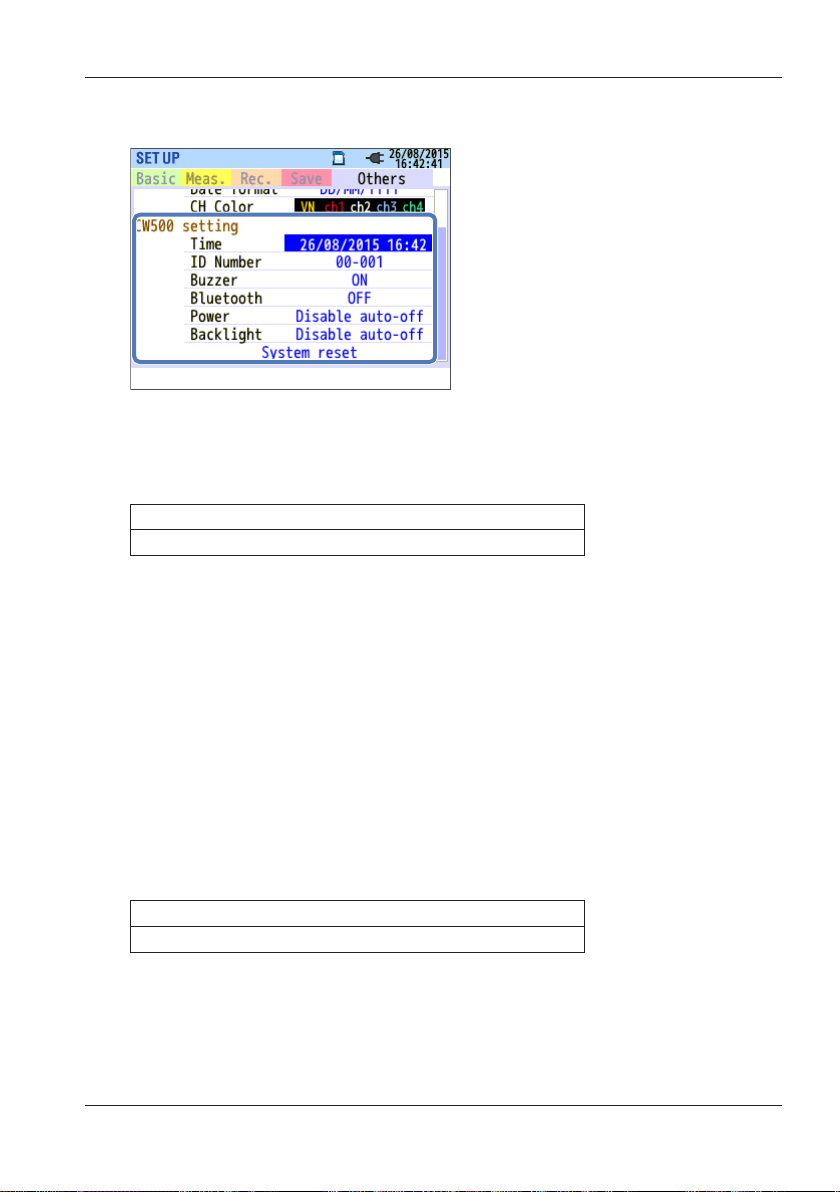
5.5 Other Settings
CW500 System Settings
Time
Set the system clock to the current time.
Settings
yyyy/mm/dd hh:mm
* The input format is synchronized with the Date format setting.
<Procedure>
Use the arrow keys to move to Time.
entry window. → Use the arrow keys to select the date and time. →
Press ENTER to confirm or ESC to cancel.
Press ENTER to show a time
→
ID Number
Set the CW500 ID number. Assigning numbers in an organized manner
will make it convenient to analyze recorded data when several CW500s
are used or when several locations are measured periodically using a
single CW500.
Settings
00-001~99-999(00-001
* Default value
<Procedure>
Use the arrow keys to move to ID Number.
value entry window. → Use the arrow keys to enter the ID number. →
Press ENTER to confirm or ESC to cancel.
IM CW500-01EN
*
)
Press ENTER to show a
→
5-33
Page 69

5.5 Other Settings
Buzzer
Turn on or off the keypad sound. Warning buzzers for demand judgment
and low battery are not affected by this setting.
Settings
*
On
/Off
* Default value
<Procedure>
Use the up and down arrow keys to move to Buzzer.
Press ENTER to
→
show a pull-down menu. → Use the up and down arrow keys to select on
or off. → Press ENTER to confirm or ESC to cancel.
Bluetooth® (option)
Enable or disable the built-in Bluetooth® function. Disable it when you are
not using Bluetooth® communication.
Settings
*
On/Off
* Default value
<Procedure>
Use the up and down arrow keys to move to Bluetooth®. → Press
ENTER to show a pull-down menu. → Use the up and down arrow keys
to select on or off. → Press ENTER to confirm or ESC to cancel.
5-34
IM CW500-01EN
Page 70

5.5 Other Settings
Power
Enable or disable the auto-power-off function. If the CW500 is running off
of batteries, “Disable auto-off” cannot be selected in order to save battery
power.
Mode Settings
AC power Power off in 5 min./Disable auto-off*
Battery Power off in 5 min.
* Default value
<Procedure>
Use the up and down arrow keys to move to Power.
show a pull-down menu. → Use the up and down arrow keys to enable
auto-power-off. → Press ENTER to confirm or ESC to cancel.
Press ENTER to
→
Backlight
Select whether to turn off the backlight automatically when there is no
user interaction for a given period. If the CW500 is running off of batteries,
“Disable auto-off” cannot be selected in order to save battery power.
Mode Settings
AC power Power off in 5 min./Disable auto-off*
Battery Power off after 2 min.
* Default value
<Procedure>
Use the up and down arrow keys to move to Backlight.
to show a pull-down menu. → Use the up and down arrow keys to enable
or disable the backlight auto-off function. → Press ENTER to confirm or
ESC to cancel.
Press ENTER
→
System reset
This restores all the settings to their defaults except for Language, Date
format, CH Color, and Time.
<Procedure>
Use the up and down arrow keys to move to System reset. → Press
ENTER to show a confirmation message. → Use the left and right arrow
keys to select Yes or NO. → Press ENTER to confirm.
IM CW500-01EN
5-35
Page 71
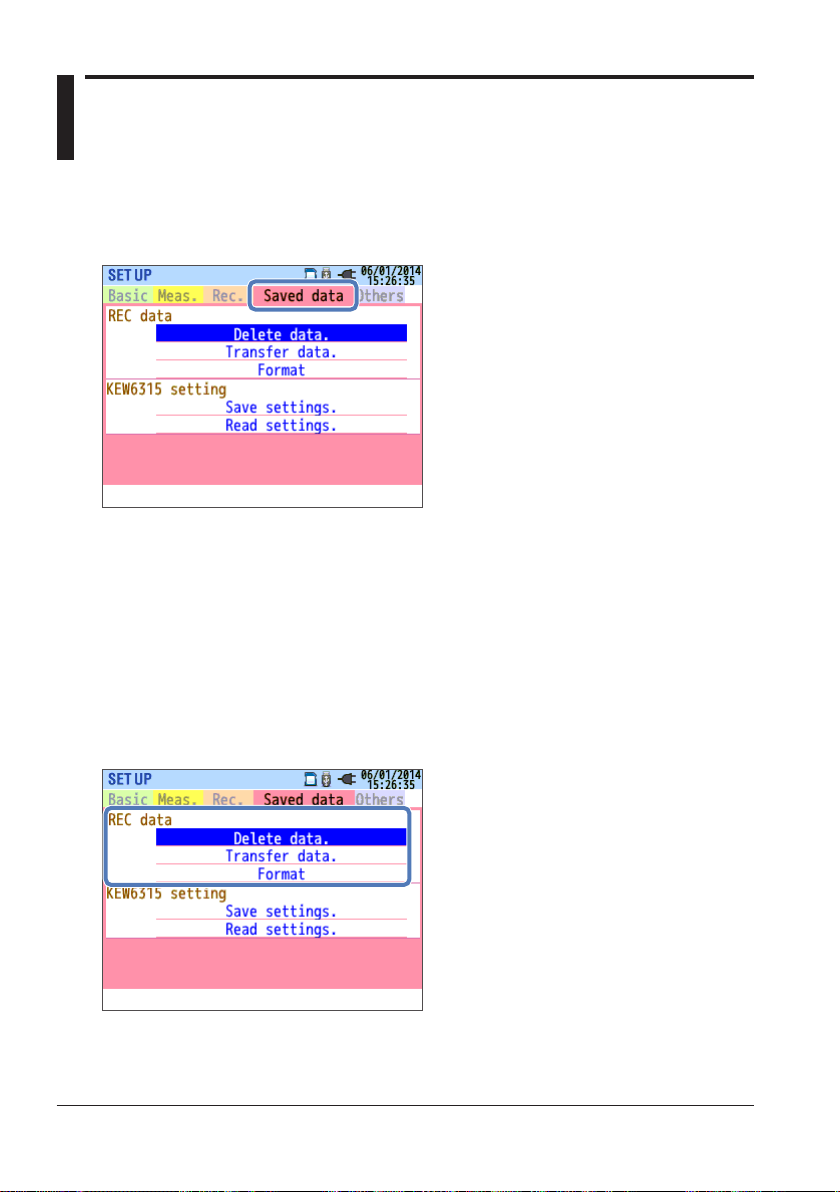
5.6 Saved Data
<Procedure>
Press SETUP.
data tab.
You can save measured data, screenshots, and setup data to the SD
memory card or internal memory. If an SD memory card is inserted in the
instrument, data will be automatically saved to the card. Do not insert an
SD memory card if you want to save to the internal memory. You cannot
set the save destination.
We recommend that you save data to an SD memory card. Up to three
measured data files and eight other files can be saved to the internal
memory.
Use the left and right arrow keys to select the Saved
→
Recorded Data Operation
<Procedure>
Use the up and down arrow keys to move to the desired operation. →
Press ENTER to confirm.
5-36
IM CW500-01EN
Page 72
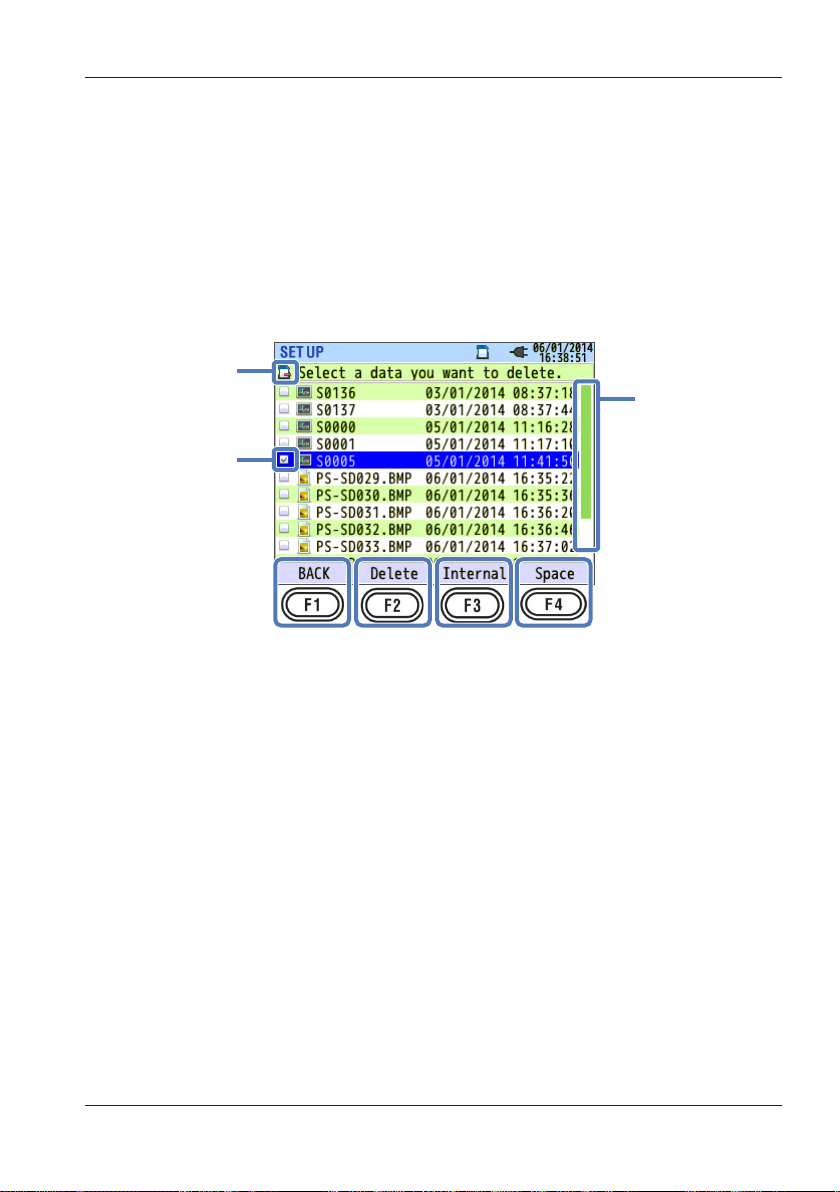
Data location
Scroll bar
5.6 Saved Data
Delete data
This is used to delete measured data, screenshots, and setup data from
the SD memory card or internal memory. Be careful when deleting data
files because they are not sorted by recording date. The data recording
dates are listed to the right of file names. Note that dates of data files
transferred from the internal memory to an SD memory card are the dates
when they were transferred. A scroll bar appears when not all the data
can be displayed on the screen.
Check box
<Procedure>
Use the up and down arrow keys to move to the data you want to delete.
Press ENTER to select it. → Press F2 to show a delete confirmation
→
message. → Use the left and right arrow keys to select Yes or NO. →
Press ENTER to confirm.
When you select a data file, the corresponding check box is selected. You
can delete several data files at once.
Delete
Press F2 (delete) to show a confirmation message. Select “Yes” to delete
the data.
Internal/SD card
Press F3 to switch between the SD memory card and internal memory.
The selected medium is displayed in the upper left of the screen.
Switching the screen clears all the selected check boxes.
IM CW500-01EN
5-37
Page 73
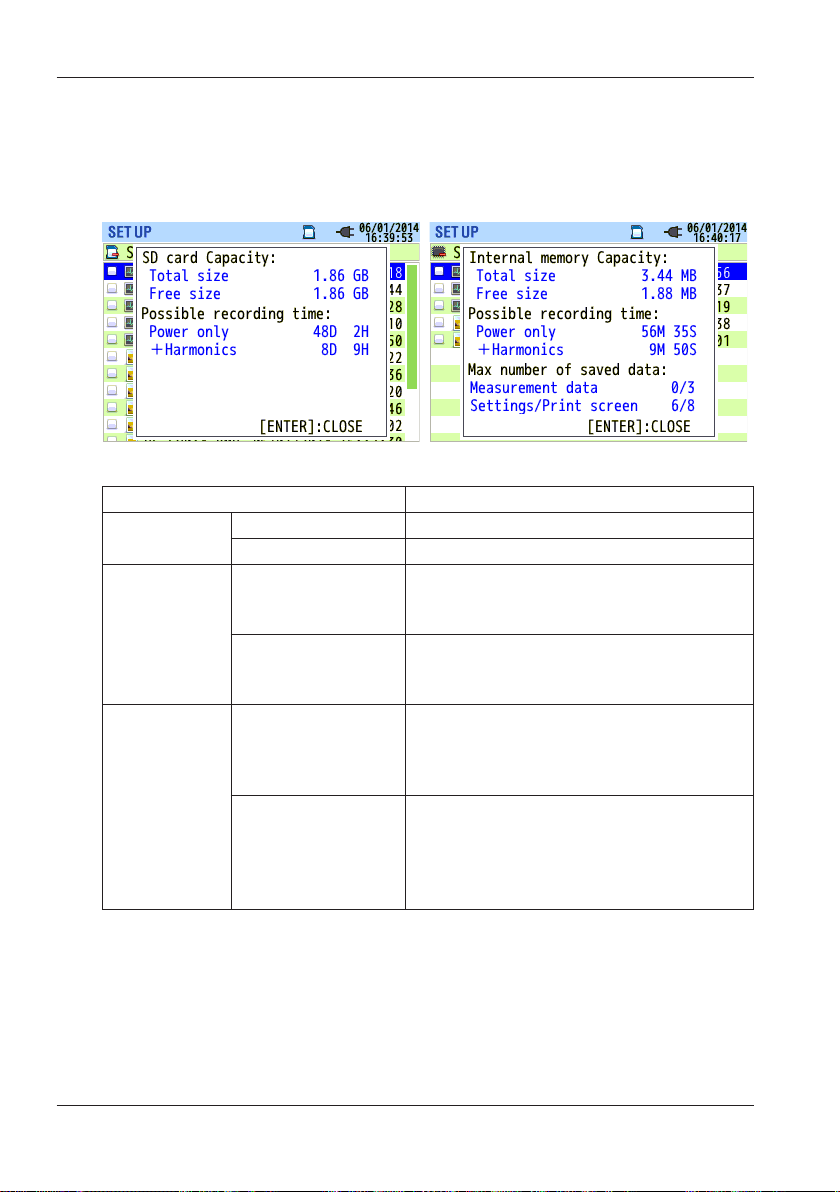
5.6 Saved Data
Space
Press F4 (free space) to display a pop-up screen showing the selected
medium information. Press ENTER to return to the data deletion screen.
Item Displayed Information
Capacity
Possible
recording
time
Max number
of saved data
* Internal
memory only
Total size
Free size
Power only
Power+Harmonics
Measured data
Settings/
Print
screen
Size of used space + free space
Size of free space only
Estimated possible recording time
when only power parameters are
recorded
Estimated possible recording time
when power and harmonic parameters
are recorded
Number of completed measurements
* The maximum number of files that
can be saved in the internal memory is
three.
Number of recorded settings and
screenshots
* The maximum number of files that
can be saved in the internal memory is
eight.
Back
Press F1 (back) to return to the Saved data screen.
5-38
IM CW500-01EN
Page 74
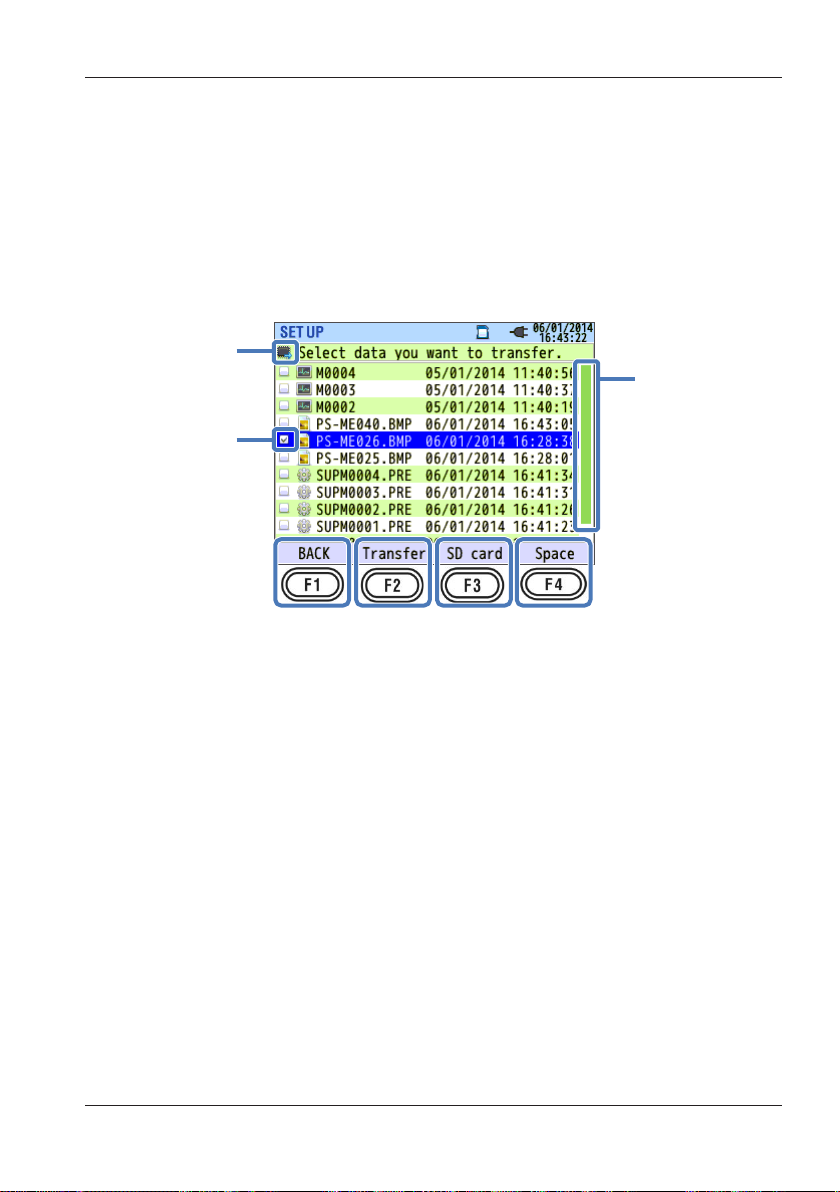
Data location
Scroll bar
5.6 Saved Data
Transfer data
This is used to transfer measured data, screenshots, and setup data from
the internal memory to an SD memory card. Be careful when transferring
data files because they are not sorted by recording date. The data
recording dates are listed to the right of file names. Note that dates of
data files transferred from the internal memory to an SD memory card are
the dates when they were transferred. A scroll bar appears when not all
the data can be displayed on the screen.
Check box
<Procedure>
Use the up and down arrow keys to move to the data you want to transfer.
Press ENTER to select it. → Press F2 to show a delete confirmation
→
message.
→ Use the left and right arrow keys to select Yes or NO. → Press
ENTER to confirm.
When you select a data file to be transferred, the corresponding check
box is selected. You can transfer several data files at once.
Transfer
Press F2 (transfer) to show a confirmation message. Select “Yes” to
transfer the data.
SD card
Press F3 (SD memory card) to view the data stored in the transfer
destination SD memory card. To return to the transfer data selection
screen, press F3 (internal memory) again. Switching the screen clears all
the selected check boxes.
IM CW500-01EN
5-39
Page 75
Data location
Scroll bar
5.6 Saved Data
Free size
Press F4 (free space) to display a pop-up screen showing the selected
medium information. Press ENTER (close) to return to the data transfer
screen.
For details, see “Space” on page 5-38.
Back
Press F1 (back) to return to the Saved data screen.
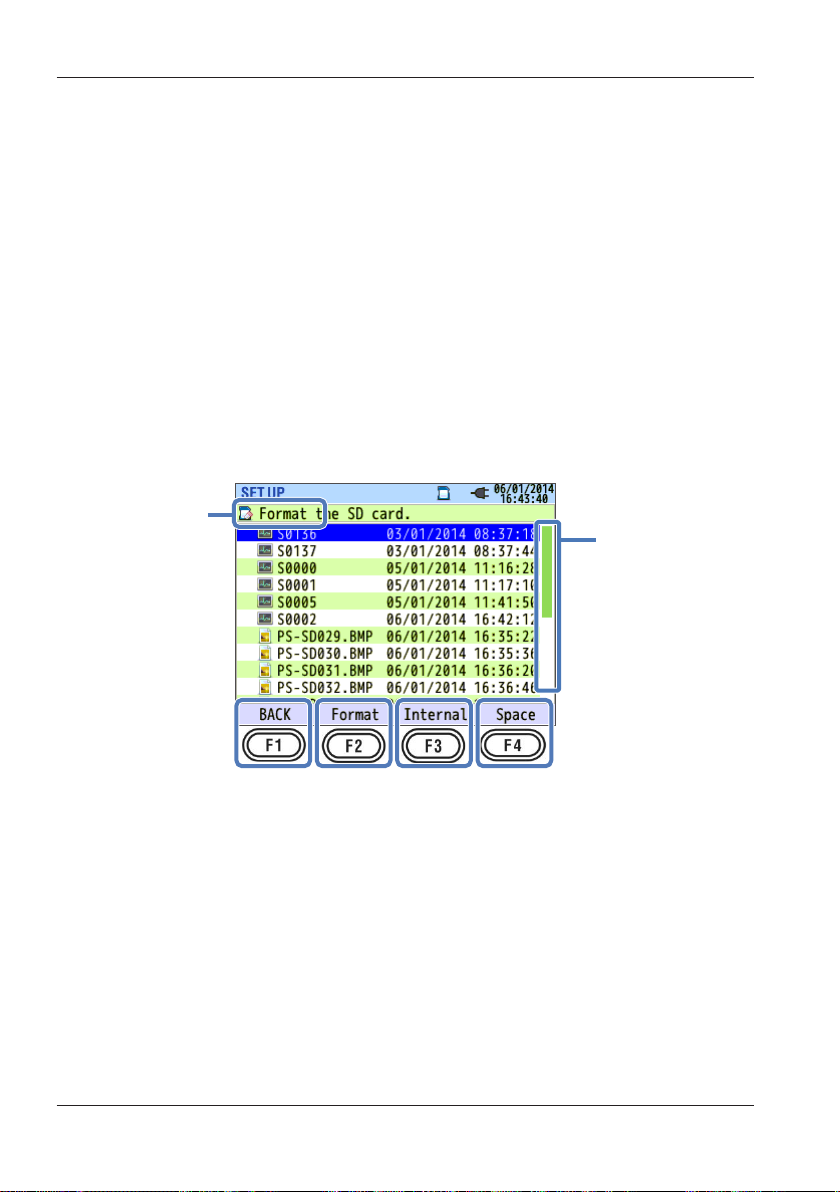
Format
This is used to format an SD memory card or internal memory.
When you format, all the saved data will be deleted. Save necessary data
to a different storage medium before formatting.
5-40
<Procedure>
Press F2 to show a format confirmation message. → Use the left and
right arrow keys to select Yes or NO. → Press ENTER to confirm.
Format
Press F2 (format) to show a confirmation message. Press ENTER (yes)
to start formatting.
IM CW500-01EN
Page 76

5.6 Saved Data
Internal/SD card
Press F3 (internal memory/SD memory card) to switch the target medium.
The selected medium is displayed in the upper left of the screen.
Free size
Press F4 (free space) to display a pop-up screen showing the selected
medium information. Press ENTER (close) to return to the format screen.
For details, see “Space” on page 5-38.
Back
Press F1 (back) to return to the Saved data screen.
IM CW500-01EN
5-41
Page 77

File name: SUP S 0000 .PRE
5.6 Saved Data
Types of Saved Data
File Name
File names are automatically assigned with incrementing file numbers.
As the current file number is retained even when the power is turned off,
it will keep incrementing until the system is reset or until the maximum
count is reached. Even if you change the save destination, files are saved
with serial numbers.
If a file with the same file number already exists at the save destination,
the measured data file name is automatically incremented to the next
number. Screenshot data and setup data are overwritten with the same
file names. Be careful when you reset the system and start saving the
files from number zero and when sharing a single SD memory card
between several CW500s. Note that if all the file numbers from 0 to 9999
are used up, measured data files are also overwritten.
If files are deleted or the folder or files are renamed from a PC or the like,
data operations on the CW500 and analysis using CW500 Viewer will no
longer be possible. Do not change folder names or file names from a PC.
Print screen
Press PRINT SCREEN to save a screen image as BMP data.
| | |
Dest. code
SD: SD memory card
ME: Internal memory
File No. Extension
(000 to 999)
System settings
Press SETUP, and select Saved data and then Save Settings to save the
CW500 setup data.
| |
Dest. code
S: SD memory card
M: Internal memory
5-42
File No.
(0000 to 9999)
(BMP file)
IM CW500-01EN
Page 78

File name: SUP S 0000
.CW5
Harmonic measurement
System setup data
File name EVT S 0000
.
CW5
V/A change
Event type
5.6 Saved Data
Data folder
A new folder is created for every measurement to save interval and power
quality data.
Folder name: / CW5_DATA/ S 0000
| |
Dest. code
S: SD memory card
M: Internal memory
File No.
(0000 to 9999)
Interval data
Measurement setup INI S 0000 .CW5
Power measurement INP S 0000 .CW5
INH S 0000 .CW5
| |
Dest. code
S: SD memory card
M: Internal memory
File No.
(0000 to 9999)
Power quality data
Waveform WAV S 0000 .
IM CW500-01EN
VAL S 0000 .
| |
Dest. code
S: SD memory card
M: Internal memory
(0000 to 9999)
File No.
CW5
CW5
5-43
Page 79

Data location
Scroll bar
5.6 Saved Data
Saving and Loading System Settings
<Procedure>
Use the up and down arrow keys to move to the desired operation. →
Press ENTER to confirm.
Save settings
This is used to save the setup data to an SD memory card or internal
memory. Note that data files are not sorted by recording date. The data
recording dates are listed to the right of file names. Note that dates of
data files transferred from the internal memory to an SD memory card are
the dates when they were transferred. A scroll bar appears when not all
the data can be displayed on the screen.
5-44
<Procedure>
Press F2 to show a save confirmation message. → Use the left and right
arrow keys to select Yes or NO. → Press ENTER to confirm.
IM CW500-01EN
Page 80

5.6 Saved Data
Save
Press F2 (save) to show a confirmation message. Select Yes to save the
system settings to the SD memory card or internal memory.
Internal/SD card
Press F3 (internal memory/SD memory card) to change the save
destination. The current save destination is displayed with a mark in the
upper left of the screen.
Free size
Press F4 (free space) to display a pop-up screen showing the selected
medium information. Press ENTER (close) to return to the data transfer
screen.
For details, see “Space” on page 5-38.
Back
Press F1 (back) to return to the Saved data screen.
Settings That Are Saved
Basic Setup Measurement Setup
Settings Settings
Wiring
Voltage range Inspection cycle
VT ratio Target value
Nominal voltage
Clamp/Current range
CT ratio MAX hold
DC range
Frequency Transient threshold
Other Setup Dip threshold
Settings Interruption threshold
Environment Date format Inrush current threshold
System
settings
ID number Flicker Filter coefficient (ramp)
Buzzer
Demand
Harmonics
Power quality
Phase advance
capacitor
Measurement interval
THD (total harmonic distortion)
calculation method
Allowable range
Hysteresis threshold
Swell threshold
Target power factor
IM CW500-01EN
5-45
Page 81
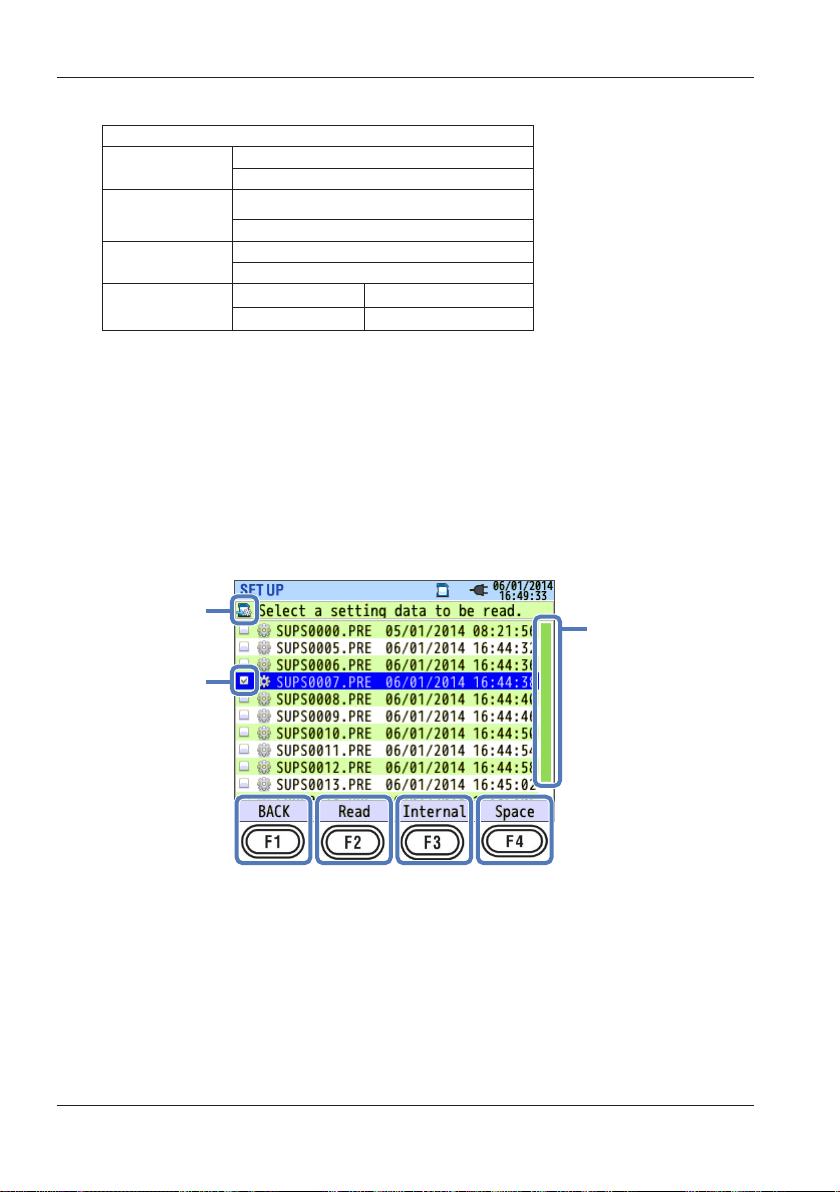
Data location
Scroll bar
5.6 Saved Data
Recording setup
Settings
REC item
Record method
Constant rec.
Time period
rec.
REC period
REC time slot
Harmonics
Power quality (event)
Interval
Start
Start date/time
Stop date/time
Start—Stop
Start—Stop
Read settings
This is used to read setup data from an SD memory card or internal
memory to change the system settings. Note that data files are not sorted
by recording date. The data recording dates are listed to the right of file
names. Note that dates of data files transferred from the internal memory
to an SD memory card are the dates when they were transferred. A scroll
bar appears when not all the data can be displayed on the screen.
5-46
Check box
<Procedure>
Use the up and down arrow keys to move to the data you want to transfer.
Press ENTER to select it. → Press F2 to show a read confirmation
→
message. → Use the left and right arrow keys to select Yes or NO. →
Press ENTER to confirm.
When you select a data file you want to read, the corresponding check
box is selected.
IM CW500-01EN
Page 82

5.6 Saved Data
Read
Press F2 (read) to show a confirmation message. Select Yes to transfer
the data.
Internal/SD card
Press F3 (internal memory/SD memory card) to change the save
destination. The current save destination is displayed with a mark in the
upper left of the screen.
Free size
Press F4 (free space) to display a pop-up screen showing the selected
medium information. Press ENTER (close) to return to the data transfer
screen.
For details, see “Space” on page 5-38.
Back
Press F1 (back) to return to the Saved data screen.
IM CW500-01EN
5-47
Page 83
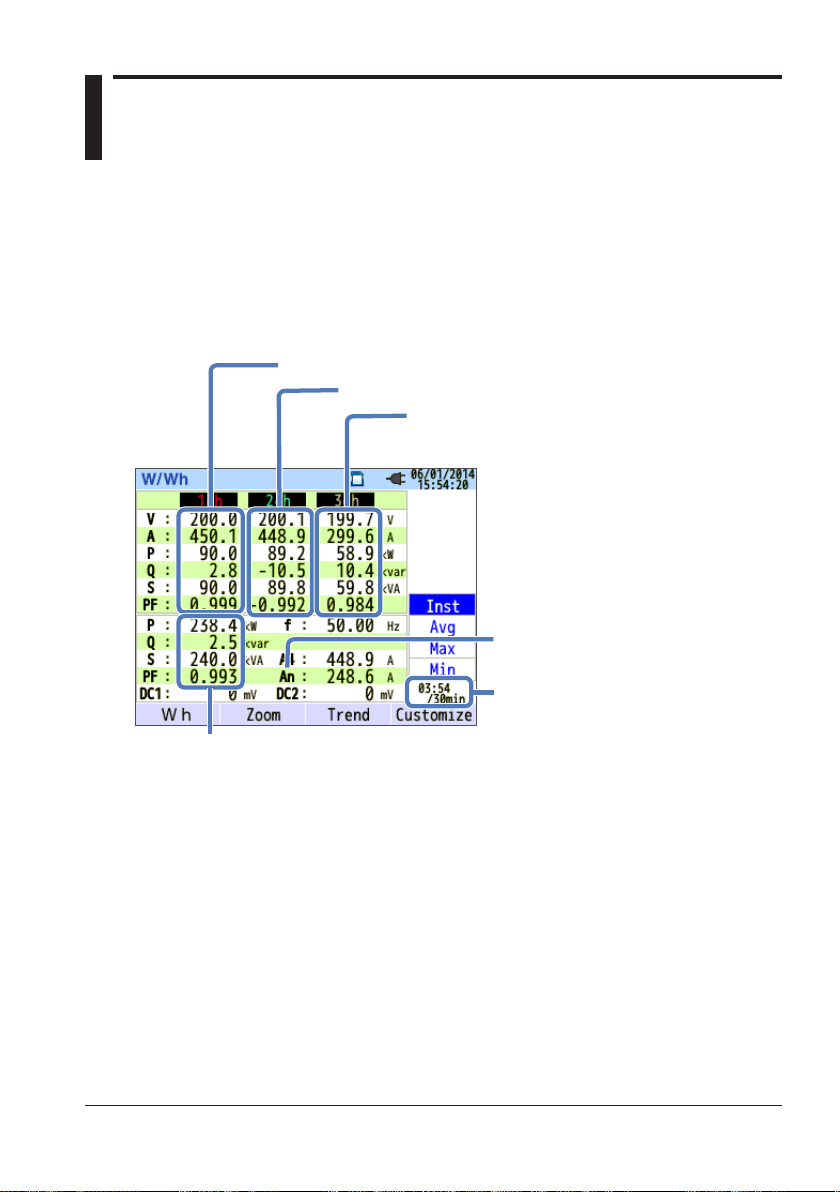
Total
Optional clamp-on probe
Channel 1 measurement
Chapter 6 Display Items of Each Screen
6.1 Instantaneous Value (W)
<Procedure>
Press W/Wh.
Displaying a List of Measurements
Press F2 to display a list.
Press F1 to display the instantaneous value (W) screen.
→
Channel 2 measurement
Channel 3 measurement
IM CW500-01EN
measurement
Elapsed time/
selected interval
Multiple measurement values are displayed on a single screen. The
displayed items and their display positions can be changed using keys.
6-1
Page 84
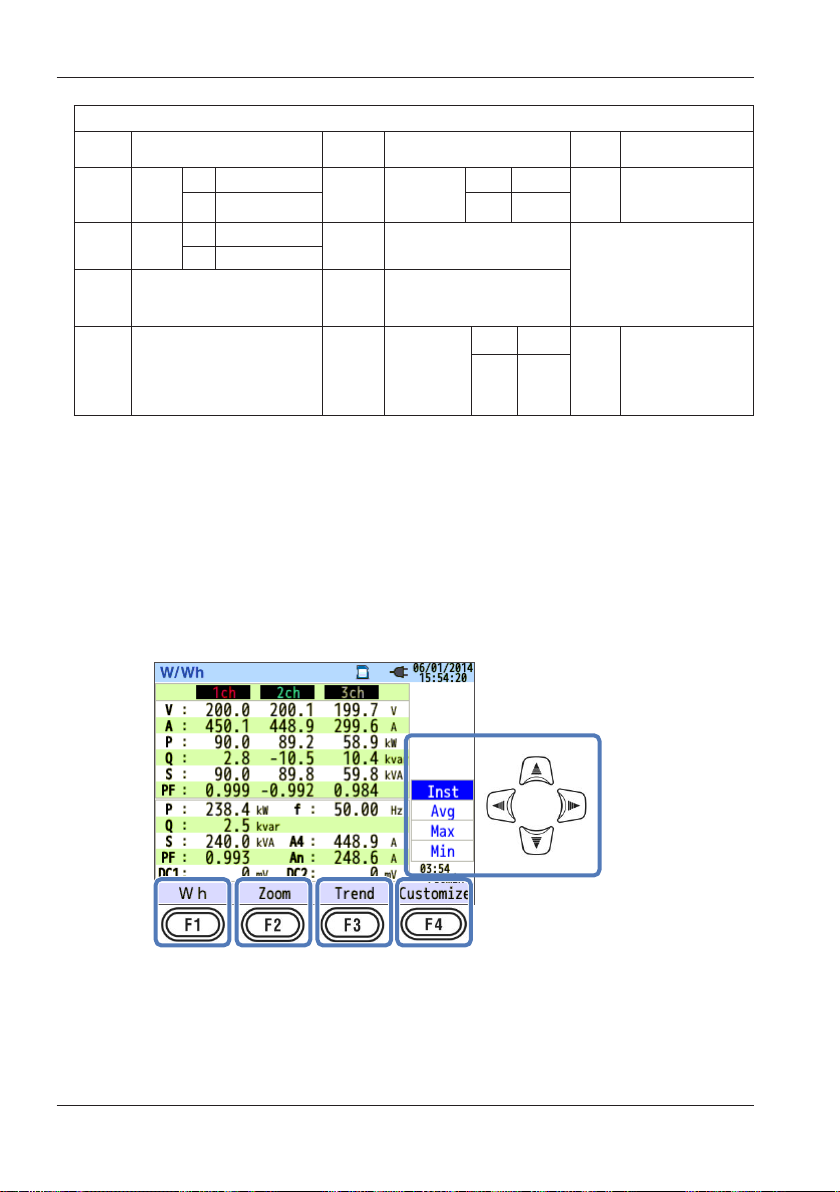
6.1 Instantaneous Value (W)
Display Symbol
V
P
PF
DC1
An
1
Phase voltage VL
+
Active
power
Power
factor
Consumption
-
Regeneration
+
-
Lead
Analog input
channel 1 voltage
2
Neutral line current PA
Lag
1
Q
Line voltage A Current
Reactive
Power
f Frequency
DC2
Analog input
channel 2 voltage
Voltage-
current
3
phase
difference
+ Lag
- Lead
+ Lag
- Lead
S Apparent power
Phase advance
3
C
capacitance
1 The V and VL displays can be customized when 3P4W is selected.
2 “An” appears only when 3P4W is selected.
3 PA and C can be displayed pressing F4 (customization). Line voltages
are converted into phase voltages to determine currents and phase
angles for “PA” of 3P3W3A.
Example: Instantaneous values measured under
1P3W-2 (2 systems)
capacitor
6-2
IM CW500-01EN
Page 85
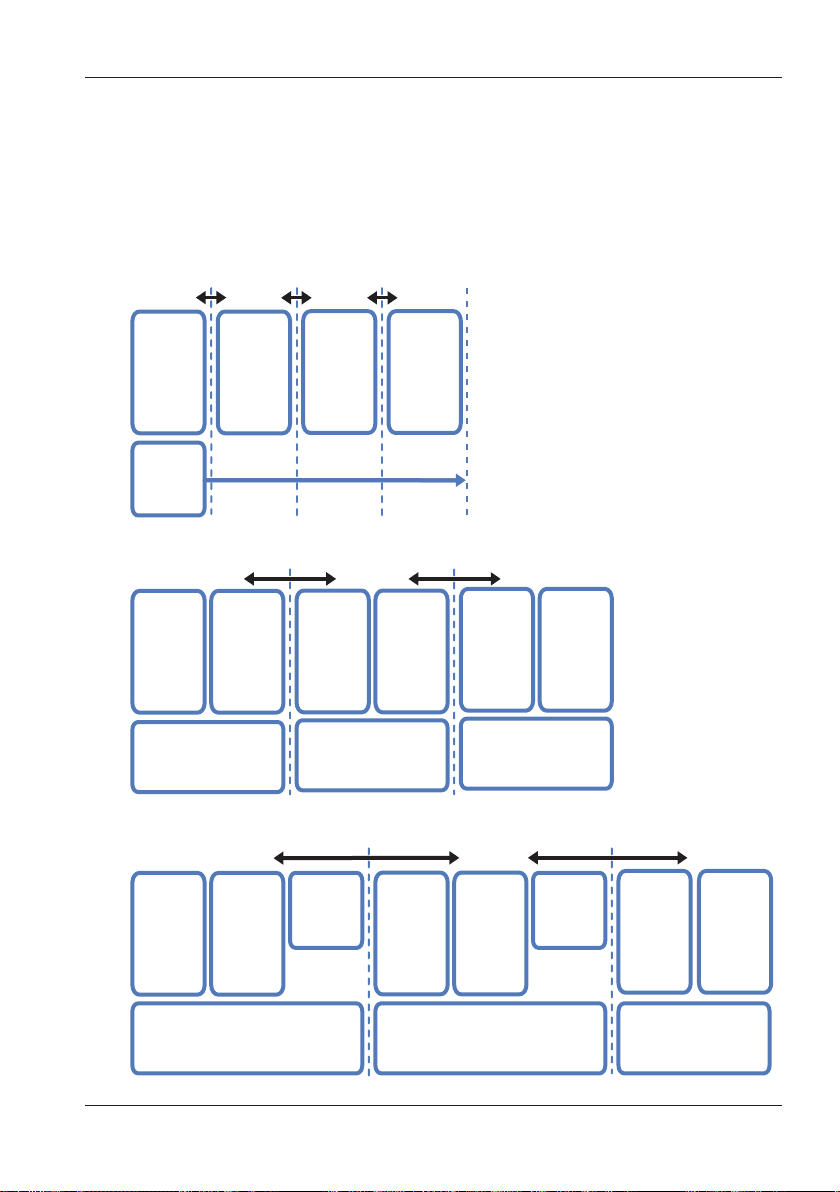
1-system
2-system
3-system
4-system
2-system1-system
1-system 2-system Σ
6.1 Instantaneous Value (W)
Changing the Displayed Systems
Use the left and right arrow keys to change the displayed systems. Items
displayed on the screen depend on the selected wiring system and the
number of systems. The dotted lines represents the range that can be
displayed on a single screen.
1P2W-1 to -4 (single-phase two-wire, system 1, 2, 3, or 4)
Measured
values on
1ch
(V1/A1)
Total
values
Measured
values on
1ch
(V1/A2)
Measured
values on
1ch
(V1/A3)
Measured
values on
1ch
(V1/A4)
1P3W-1 to -2 (single-phase three-wire, system 1 or 2)
Σ
Measured
values on
(V1/A1)
Measured
values on
1ch
1ch and 2ch of
2ch
(V2/A2)
Sum of
1 system
Measured
values on
1ch
(V1/A3)
Sum of
1ch and 2ch of
2 systems
Measured
values on
2ch
(V2/A4)
Sum of
1ch and
2ch of
1 system
Total values
Sum of
1ch and
2ch of
2 systems
1P3W-1 to -2 (three-phase three-wire two-wattmeter, system 1 or 2)
2ch
Computed
values on
3ch
Measured
values on
1ch
(V12/A3)
Measured
values on
(V23/A4)
Measured
values on
(V12/A1)
1ch
Measured
values on
(V23/A2)
2ch
Computed
values on
3ch
1, 2 and
1 system
Sum of
3ch of
Sum of
1, 2 and
3ch of
2 systems
IM CW500-01EN
Sum of
1, 2 and 3ch of
1 system
Sum of
1, 2 and 3ch of
2 systems
Total values
6-3
Page 86

6.1 Instantaneous Value (W)
3P3W3A (three-phase three-wire) 3P4W (three-phase four-wire)
Measured
values on
1ch
(V12/A1)
Measured
values on
2ch
(V23/A2)
Sum of 1, 2 and 3ch Sum of 1, 2 and 3ch
Measured
values on
3ch
(V31/A3)
Measured
values on
1ch
(V1/A1)
Measured
values on
2ch
(V2/A2)
Measured
values on
3ch
(V3/A3)
Changing the Type of Displayed Values
Use the up and down arrow keys to change the display type between
instantaneous values or average, maximum, or minimum within the
interval.
If the interval is set to 1 second, the instantaneous, average, maximum,
and minimum values will all be the same because the display update rate
is also 1 second.
Wh (Integrated value)
Press F1 (Wh) to switch to a screen that shows integrated values. For
details, see section 6.2, “Integrated Value (Wh)” on page 6-9.
Zoom
Press F2 (zoom) to switch between zooming in on four selected
measurement values or eight selected measurement values. For details,
see “Zoom Display” on page 6-5.
Trend graph
Press F3 (trend) to switch to a screen that shows the trends of display
items in a graph. The display range is from the present to the past 60
minutes. For details, see “Displaying a Trend Graph” on page 6-7.
Customize
Press F4 (customize) to change the displayed items and their display
positions. For details, see “Changing Displayed Items and Display
Positions” on page 6-8.
6-4
IM CW500-01EN
Page 87
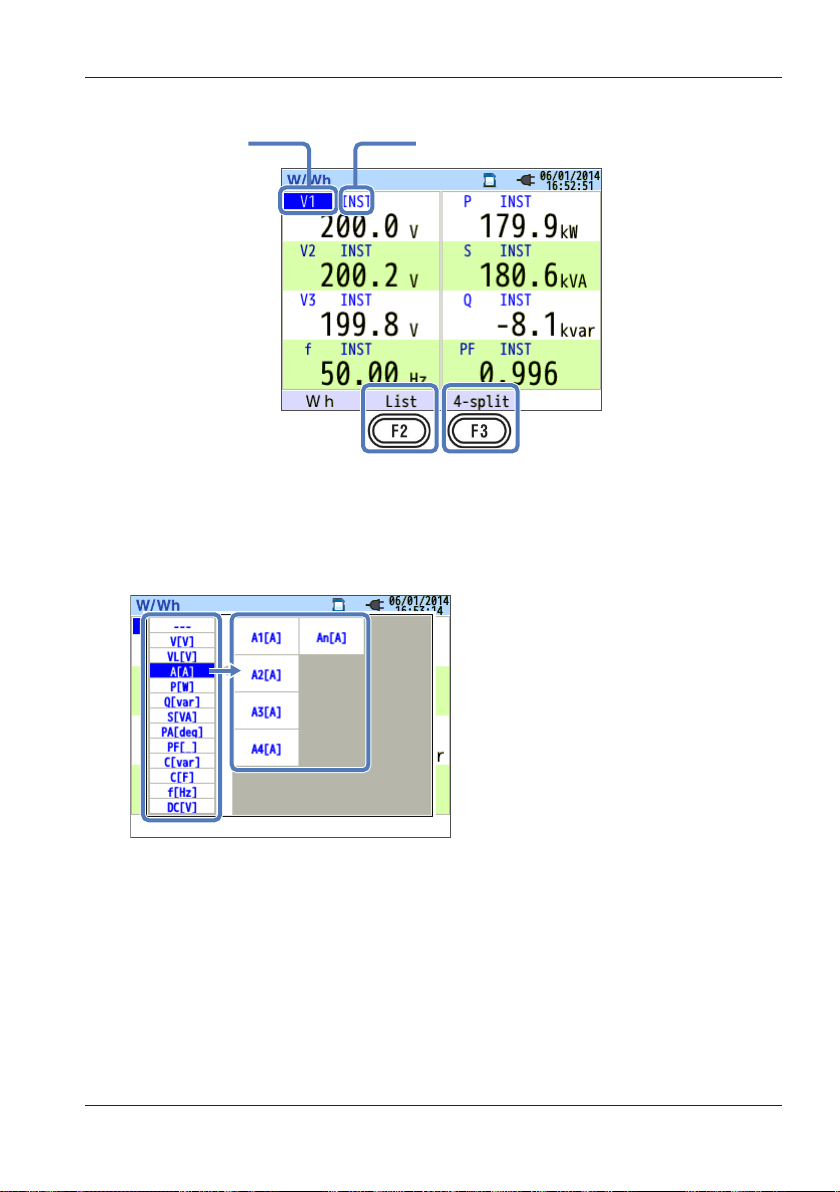
Displayed item Type of value: Inst/AVG
6.1 Instantaneous Value (W)
Zoom Display
The selected four or eight measured values are displayed on one screen.
Measured values are easier to read because the text is larger than that
on the list screen.
Displayed Items
Select the measurement items you want to display. From the list of
measurement items in the left menu, select the items you want to display.
The right menu will display the measurement item with channels that you
can choose from. From the right menu, select the measurement items
you want to display.
<Procedure>
Use the arrow keys to move to the item you want to display. → Press
ENTER to show a selection menu. → Use the arrow keys to select an
item. → Press ENTER to confirm or ESC to cancel.
IM CW500-01EN
6-5
Page 88
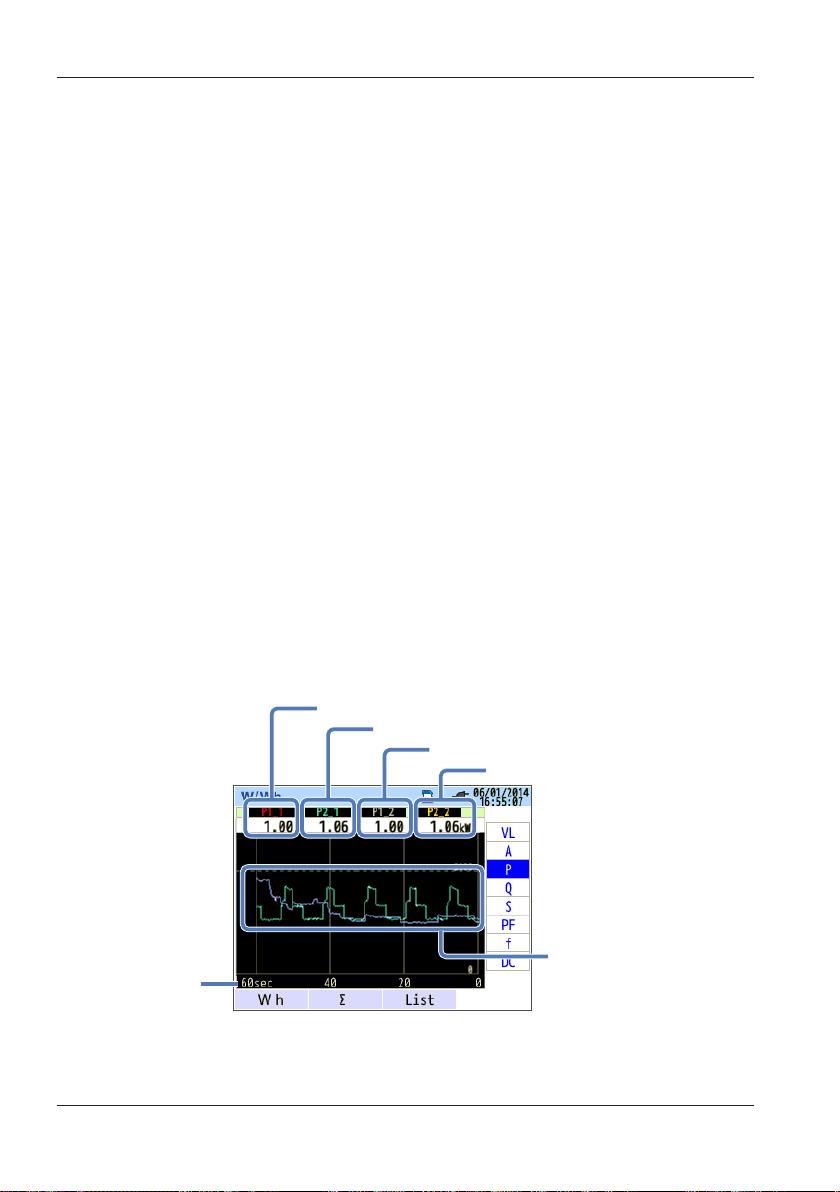
Elapsed time
Inst value on ch2 of system 2
Inst value on ch1 of system 1
6.1 Instantaneous Value (W)
Type of Value
For the selected measurement item, select whether to display the
instantaneous value (INST) or the average (AVG), maximum (MAX), or
minimum (MIN) value among the data values that were measured in the
interval. If the interval is set to 1 second, the instantaneous, average,
maximum, and minimum values will all be the same because the display
update rate is also 1 second.
<Procedure>
Use the arrow keys to move to the type of value you want to display. →
Press ENTER to show a pull-down menu. → Use the arrow keys to select
a type. → Press ENTER to confirm or ESC to cancel.
List Display
Press F2 (list) to display all the values in a list.
4-split/8-split
Press F3 (4-split/8-split) to set the number of items to display on one
screen to four or eight.
Displaying a Trend Graph
6-6
Inst value on ch2 of system 1
Inst value on ch1 of system 2
Different colors for
each channel
You can select measured values and graph their variation with time.
IM CW500-01EN
Page 89
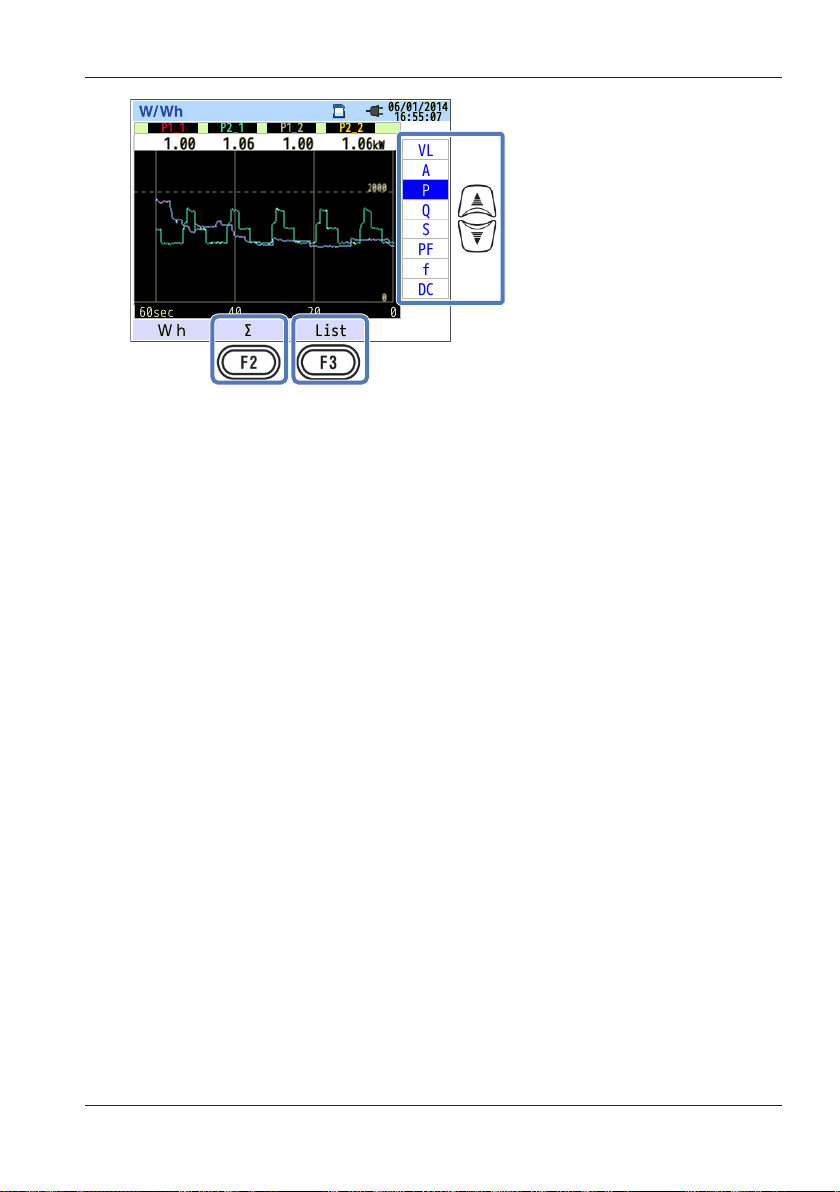
6.1 Instantaneous Value (W)
Changing the Items Displayed on the Trend Graph
Use the up and down arrow keys to change the items to display on the
trend graph.
Σ/CH
Press F2 (Σ/CH) to switch between trend graphs of the sum for each
system and the total sum and trend graphs of each channel. The selection
of “Σ” or “CH” will apply to all trend graphs. Selecting Σ will display the
trend graph of the sum of each system and the total sum. Selecting CH
will display the trend graph of each channel. If you select “Σ” when rms
current value (A) is selected for 3P4W, neutral line currents (An) will be
displayed on the trend graph.
List Display
Press F3 (list) to display all the values in a list.
IM CW500-01EN
6-7
Page 90

Currently displayed items After change
6.1 Instantaneous Value (W)
Changing Displayed Items and Display Positions
You can change the displayed items.
<Procedure>
Use the up and down arrow keys to move to the item you want to change.
Press ENTER to show a pull-down menu. → Use the up and down
→
arrow keys to select a measurement item you want to display. → Press
ENTER to confirm or ESC to cancel. → Use the left and right arrow keys
to select OK or Cancel. → Press ENTER to confirm or ESC to cancel.
Voltage and current measurement items can only be changed other
voltage and current measurement items. Likewise, power and phase
advance capacitor measurement items can only be changed to other
power and phase advance capacitor measurement items.
For details on the symbols displayed on the screen, see “Displaying a List
of Measurements” on page 6-2.
6-8
IM CW500-01EN
Page 91
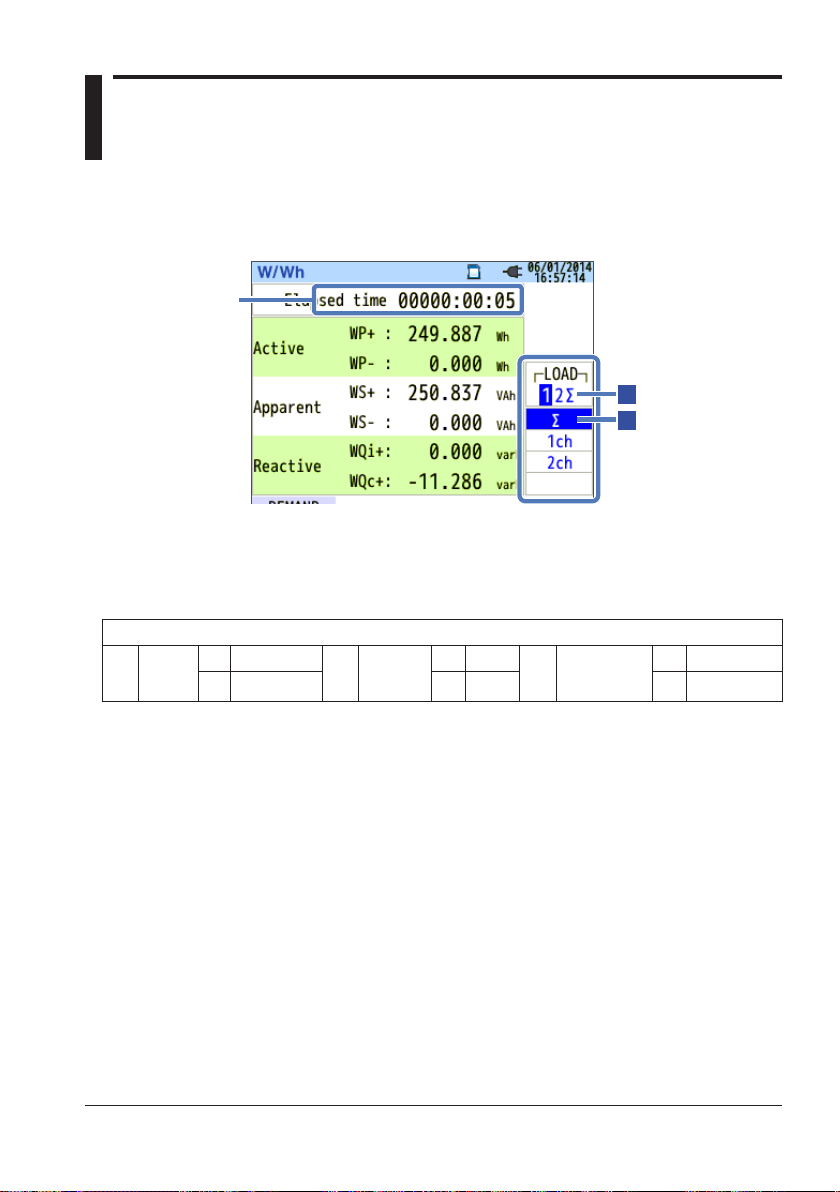
6.2 Integrated Value (Wh)
Elapsed time
: sum per system
<Procedure>
Press W/Wh.
The power that flows during a given period is displayed as integrated
power.
WP
Active
energy
+
–
Press F1 to display the integrated value (Wh) screen.
→
: total amount
Σ
Σ
Display Symbol
Consumption
Regeneration
WQ
Var hours
+
Lag
–
Lead
Volt-ampere
WS
hours
+
–
Consumption
Regeneration
IM CW500-01EN
6-9
Page 92

6.2 Integrated Value (Wh)
Changing the Displayed Systems
Use the left and right arrow keys to change the displayed systems. For
the relationship between wiring and the number of systems, see “Wiring
System Settings” in section 5.2.
Changing the Displayed Channels
Use the up and down arrow keys to change the displayed channels.
For the relationship between wiring and channels, see “Wiring System
Settings” in section 5.2.
Demand
Press F1 (demand) to switch to a screen that shows demand values. For
details, section 6.3, “Demand,” on the next page.
6-10
IM CW500-01EN
Page 93

6.3 Demand
<Procedure>
Press W/Wh.
up and down arrow keys to display the measured value, shift in specific
period, or demand change screen
Displaying Measured Values
Use the up and down arrow keys to display the measured value screen.
The demand is an average power over a given period. When the
estimated value exceeds the target value during demand measurement, a
warning buzzer sounds at each inspection cycle.
Remaining time
(time left)
DEM Target
DEM Guess
DEM Present
DEM Max
Recorded date
Press F1 to display the demand screen. → Use the
→
Display Items
Demand interval is counted down.
Demand target value.
Estimated demand value after the measurement
interval of the current load.
Present value×Measurement interval
(
is calculated as time elapses.
Demand value (average power) within a demand
interval.
(WP+ x 1 hour)
The maximum demand recorded during a measuring
period is displayed. The display is updated each
time the measured value exceeds the maximum
demand.
Interval
/
is calculated as time elapses.
Elapsed time
)/
IM CW500-01EN
6-11
Page 94
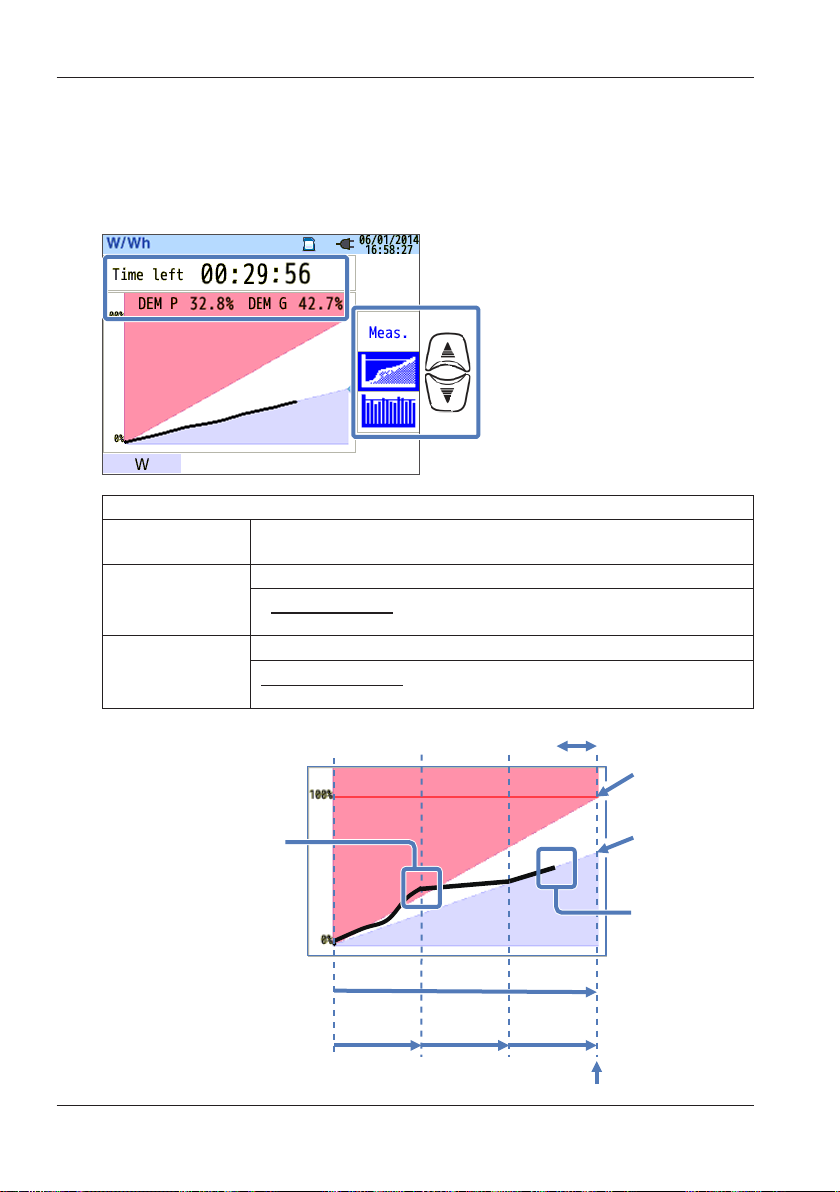
Saved point
Estimated value
Time left
A warning buzzer sounds
when the estimated value
exceeds the target value
after the inspection cycles
have been completed.
6.3 Demand
Instantaneous Value (W)
Press F1 (W) to show instantaneous values on the screen. For details,
see section 6.1, “Instantaneous Value (W).”
Shifts in Specific Period
Display Items
Remaining time
(time left)
DEM P
DEM G
Demand interval is counted down.
The present value as a percentage of the target value.
Present value
Target value
is displayed.
The estimated value as a percentage of the target value.
Estimated value
Target value
is displayed.
6-12
Inspection
cycle
Interval
Inspection
cycle
Inspection
cycle
Target value
Demand value
(Present)
IM CW500-01EN
Page 95

Demand change
Scroll bar
Most recent recording time
Demand value
Max. measured demand
(displayed on the measure-
Cursor
Use the left and right arrow keys to move the cursor and scroll the
graph horizontally. The white area of the scroll bar shows the entire
measurement period while the dark orange area shows the present
display range.
Display Items
Demand
measurement/
Recorded date
Demand value at the cursor is displayed with the
recorded date and time.
6.3 Demand
Target value
Start of demand
Rec start time
End of demand/
ment screen)
Most recent
Demand value
Start of demand and recording start date and time are displayed when the
graph does not fit on one screen.
IM CW500-01EN
6-13
Page 96
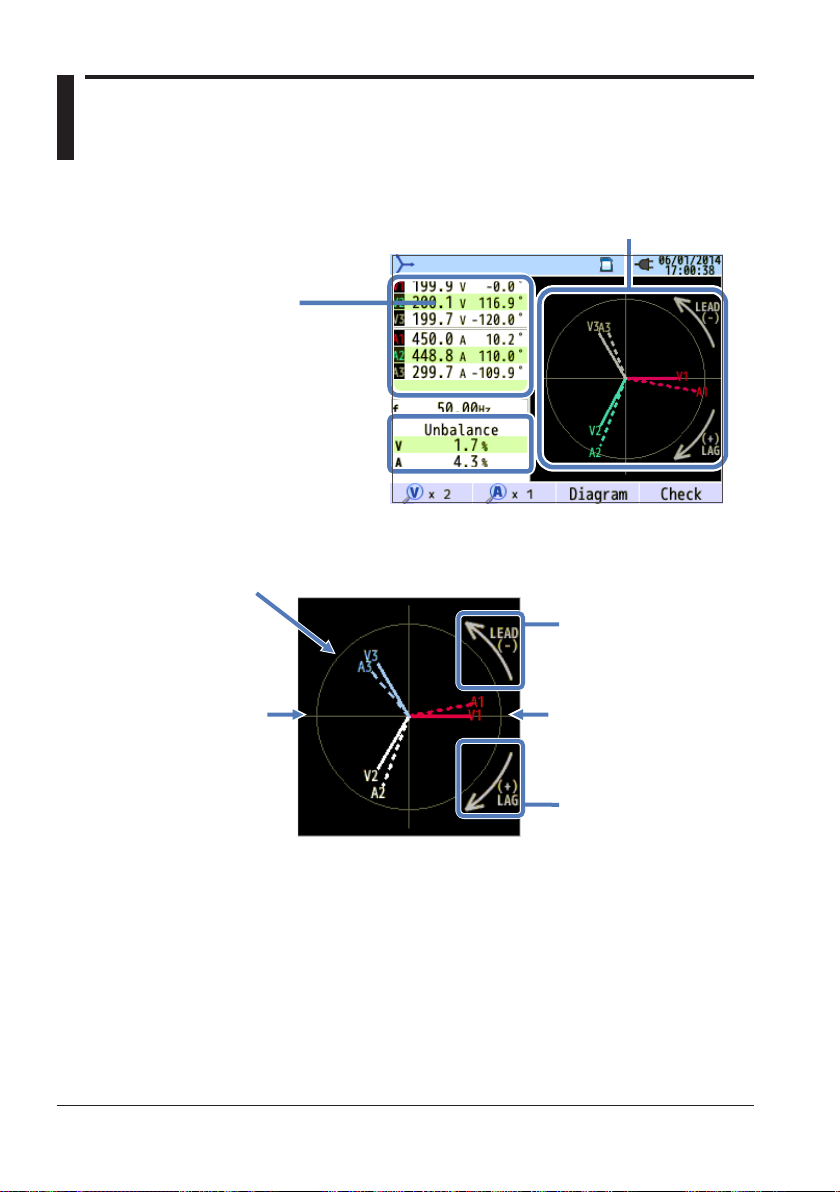
6.4 Vector
1 For 3P3W3A, rms line voltages
are displayed.
2 Phase angle is displayed using
the V1 phase as the reference (0°).
Vector display
Solid circle line: Maximum voltage/current range
Vector display
rms voltage (solid line)
rms current (dotted line)
Phase angle (leading)
Press the vector key.
Measured values
V: rms voltage
A: rms current /Phase angle
1
/Phase angle
2
2
-0° to –180°
±0°±180°
Phase angle (lagging)
+0° to +180°
6-14
IM CW500-01EN
Page 97
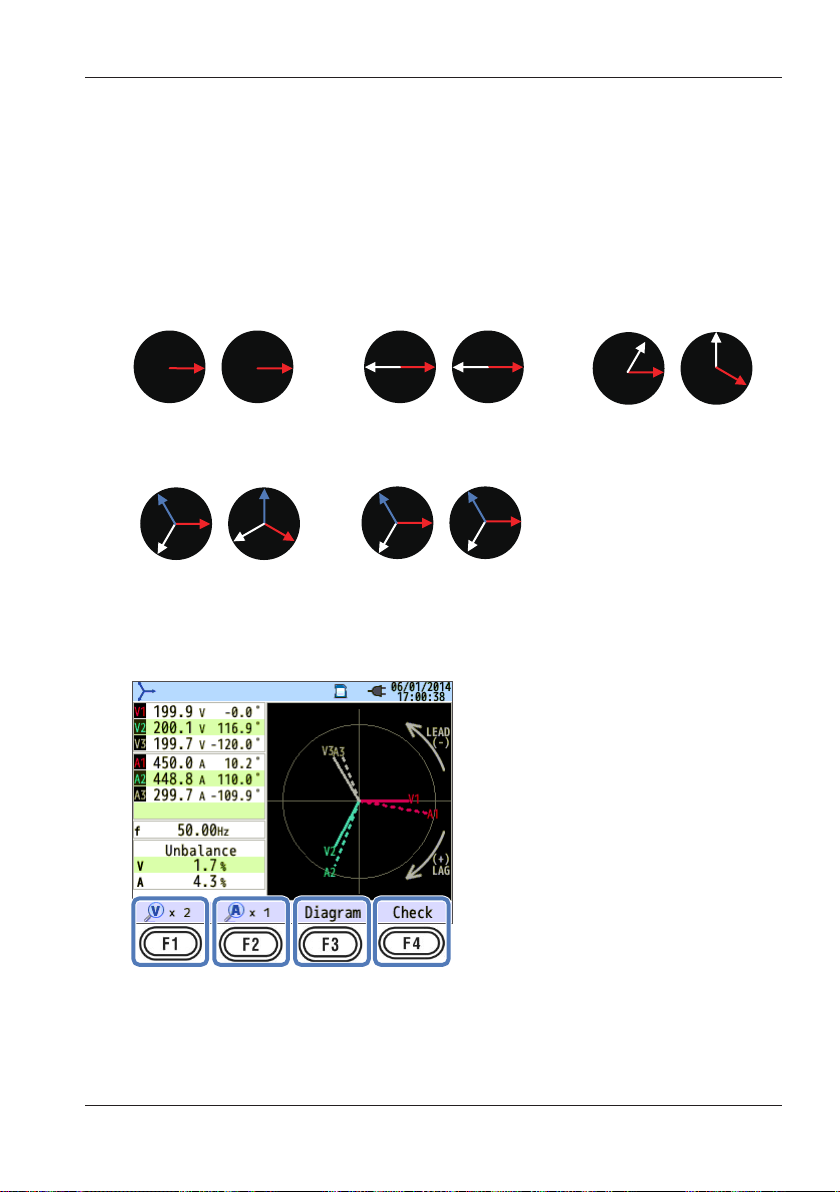
Ch2: -90 °
3P3W
1P3W
1P2W
Ch3: -120 °
Ch3: -120 °
Ch3: –90°
Ch3: -120 °
Ch2: +120 °
Ch1: ±0°
6.4 Vector
The circle (solid line) represents the maximum values of the voltage
and current ranges. The line length represents rms voltage and current
values. The angle between the lines represents the phase relation with
reference to V1. For 3P3W3A/3P4W, unbalance ratio is also displayed.
While the measured voltages and currents are balanced, the following
vectors will be displayed.
Ch1: ±0°
Ch2:±180°
3P4W
Ch1: ±0°
Ch2: +120 °
AV
AV
3P3W3A
Ch1: +30°
Ch2: +150°
AV
Ch1: ±0°±0°±0°
Ch2:±180°
AV
Ch1: ±0°
Ch2: +120 °
The following figure is an example of 3P4W.
Ch1: ±0°
Ch2: -60 °
AV
Ch1: +30°
IM CW500-01EN
6-15
Page 98

1x 2x 5x 10x
1x 2x 5x 10x
6.4 Vector
V × Magnification
Press F1 (V×magnification) to set the magnification of the length of
voltage vector lines.
A × Magnification
Press F2 (A×magnification) to set the magnification of the length of
current vector lines.
Wiring Diagrams
Press F3 (diagram) to show the wiring diagram of the selected wiring
system. For details, see “Wiring Diagram” in section 5.2.
Wiring Check
Press F4 (wiring check) to display the results of the wiring check.
If measuring at site with extremely poor power factor, this check may fail
even if the wiring is correct. For details, see “Wiring Check” in section 4.2.
6-16
IM CW500-01EN
Page 99
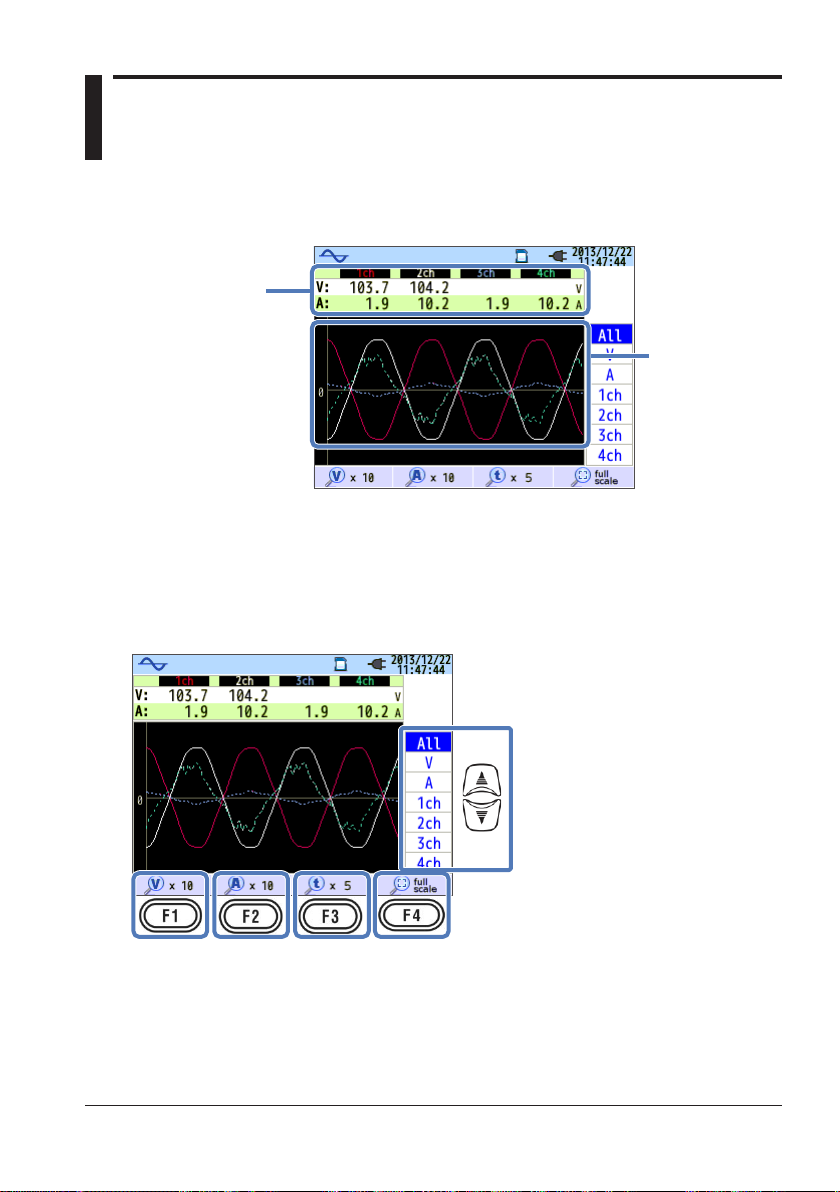
6.5 Waveform
Measured values
V: rms voltage*
A: rms current
*
voltages are displayed.
Waveforms with
for each channel
Press the waveform key.
For 3P3W3A, rms line
different colors
Voltage and current waveforms are displayed for up to 10 cycles at 50
Hz and up to 12 cycles at 60 Hz. If switched to the waveform screen, the
scale is automatically set so that the waveform amplitude and period are
displayed at their maximum size.
Changing the Displayed Waveforms
Use the up and down arrow keys to change the displayed waveforms.
IM CW500-01EN
6-17
Page 100
0.1x 0.5x 1x 2x 5x 10x
0.1x 0.5x 1x 2x 5x 10x
1x 2x 5x
10x
6.5 Waveform
V × Magnification
Press F1 (V×magnification) to set the vertical magnification of the voltage
waveform.
0.1x, 0.5x, 1x, 2x, 5x, 10x
A × Magnification
Press F2 (A×magnification) to set the vertical magnification of the current
waveform.
0.1x, 0.5x, 1x, 2x, 5x, 10x
t × Magnification
Press F3 (t×magnification) to set the time-axis (horizontal) magnification.
1x, 2x, 5x, 10x
full scale
Press F4 (full scale) to set a magnification that displays the voltage and
current waveforms at their maximum size.
6-18
IM CW500-01EN
 Loading...