

Page 1
Models CW120,CW121 Model CW240 AP240E Data Analysis Program
AP240E Data Analysis Program
1
Bulletin CW-E
Page 2

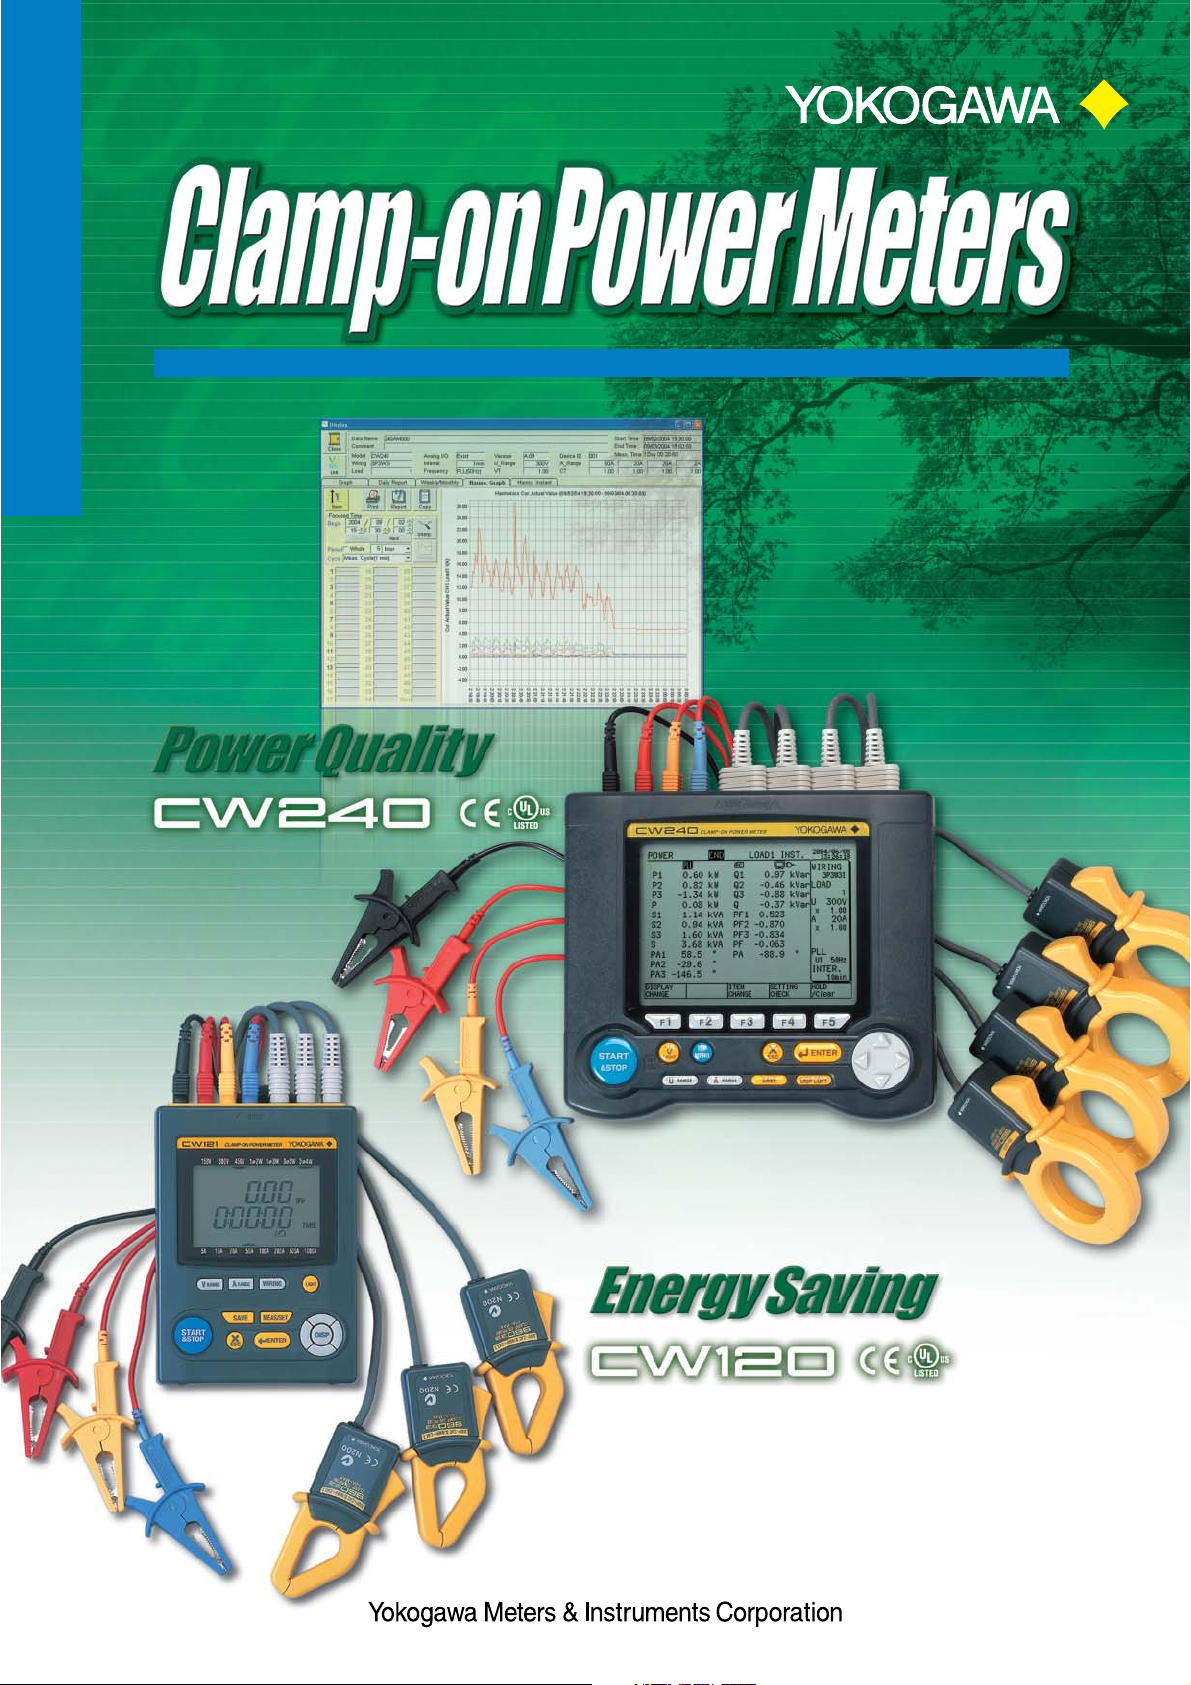
Realization of Power & Power Quality
Realization of Power & Power Quality
Management using a CW240
Management using a CW240
CASE 1
CASE 2
CASE 3
2
2
Get a view of energy consumption!
It is essential to measure energy and manage consumption of each sector such as
facility and production line for your energy saving activities and to minimize loss.
Contribute for improving productivity!
Constantly analyze productivity by managing unit consumption. Managing
voltage, current, electric power and power factor makes for good maintenance of
production facility.
Moreover, you can check operation management loss and enhance productivity.
Discover of electric power waste!
Measure and collect data of electric power consumption by short period.
The CW240 can figure out load of production process, and has the ability to check
wasteful time and current flow of standby load current.
CASE 4
Detect voltage fluctuation!
When trouble occurs on supply side of electric power, instantaneous voltage drop
can affect quality of produced goods at the factory. The CW240 is useful for
collecting data such as voltage fluctuation to prevent such problems.
Characteristics of CW240
Simultaneous measurement of instantaneous value, electric energy, demand, harmonics
and voltage fluctuation.
Simultaneous measurement of loads in 4 systems of up to 1P2W
Simultaneous measurement of loads in 2 systems of up to 1P/3P3W
Data saving interval can be set from 1 waveform (for instantaneous measurement) to 1
hour.
Measure up to 50th order harmonics
4ch leakage current measurement using newly released clamp probe 96036
Long time data logging by using compact flash memory.
Multi language for the display (English, German, French, Italian, Spanish, Korean and
Chinese)
2ch analog input (Optional)
Equipped with 4ch analog output (recorder output)
AC adaptor for power supply. NiMH rechargeable battery and alkaline battery for
backup
Page 3
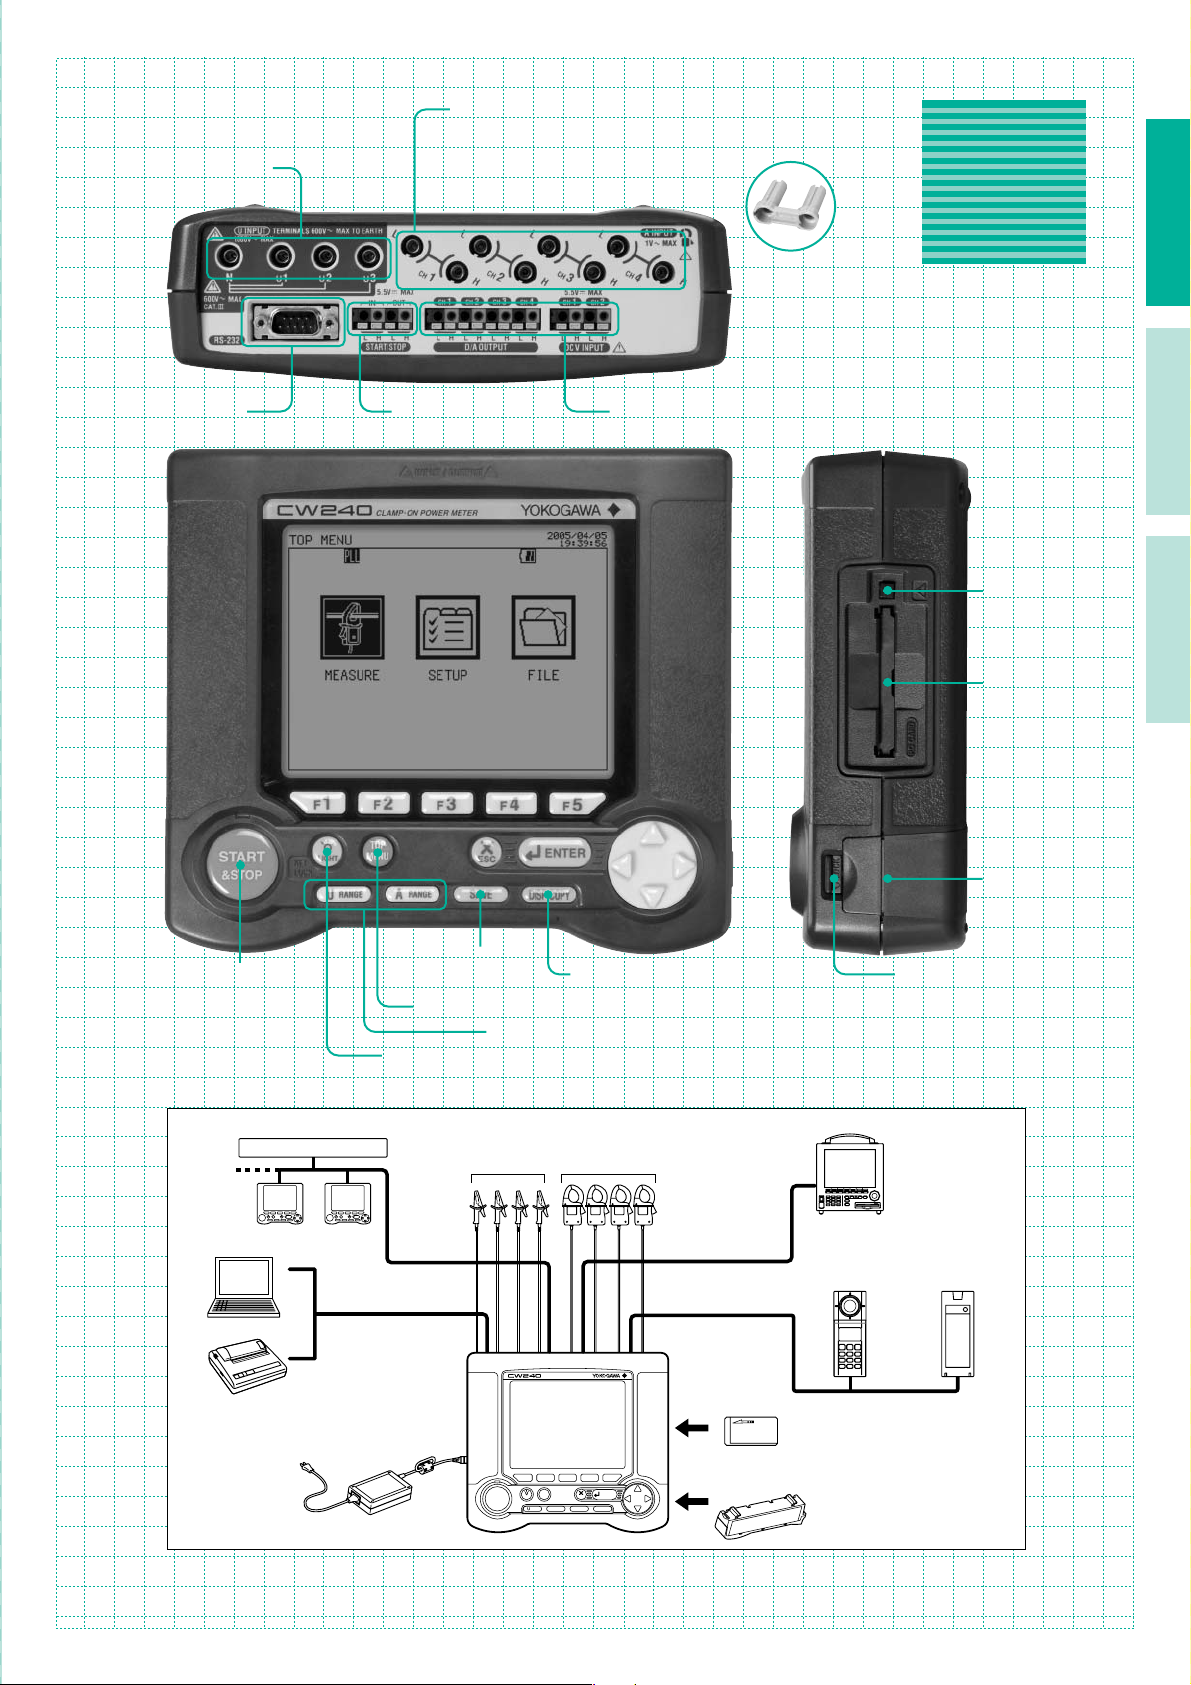
Voltage input terminals
RS-232C connector
Current input terminals
●With protection against H/L reverse connection of current clamp-on probes
●With protection against connection of voltage cables
External control I/O
terminals
Analog I/O terminals
(Optional)
CW240
CW240
Protective cover
CW120 AP240E
Card ejection button
PC card slot
Starts/stops integration measurement.
System Configuration Block Diagram
CW240: Simultaneous measurement using two or more CW240 units
External contact signal
ENTER
START
&STOP
PC
Printer
START
&STOP
RS-232
Saves or prints the
measured data.
Makes a screen hard copy.
Returns to the TOP MENU.
Switches the voltage/current range to another.
Turns ON/OFF the backlight (locked when held down for a while).
Current input
(clamp)
CLAMP-ON POWER METER
DA output
(4 channels)
Analog input
(2 channels)
PC card
ENTER
External
control I/O
terminals
Voltage input
Battery holder lock switch
MV series: Recorder
510 series
Illuminance
meter
Battery holder
JUXTA
Temperature
converter
3
AC adaptor
LIGHT
START
&STOP
510 series Illuminance meter
Product of Yokogawa Meters & Instruments Corporation
MV series: Recorder and JUXTA
Product of Yokogawa Electric Corporation
Alkaline battery
TOP
ENTER
MENU
ESC
RANGE
RANGE
A
SAVE
DISP COPY
NiMH battery pack
Page 4
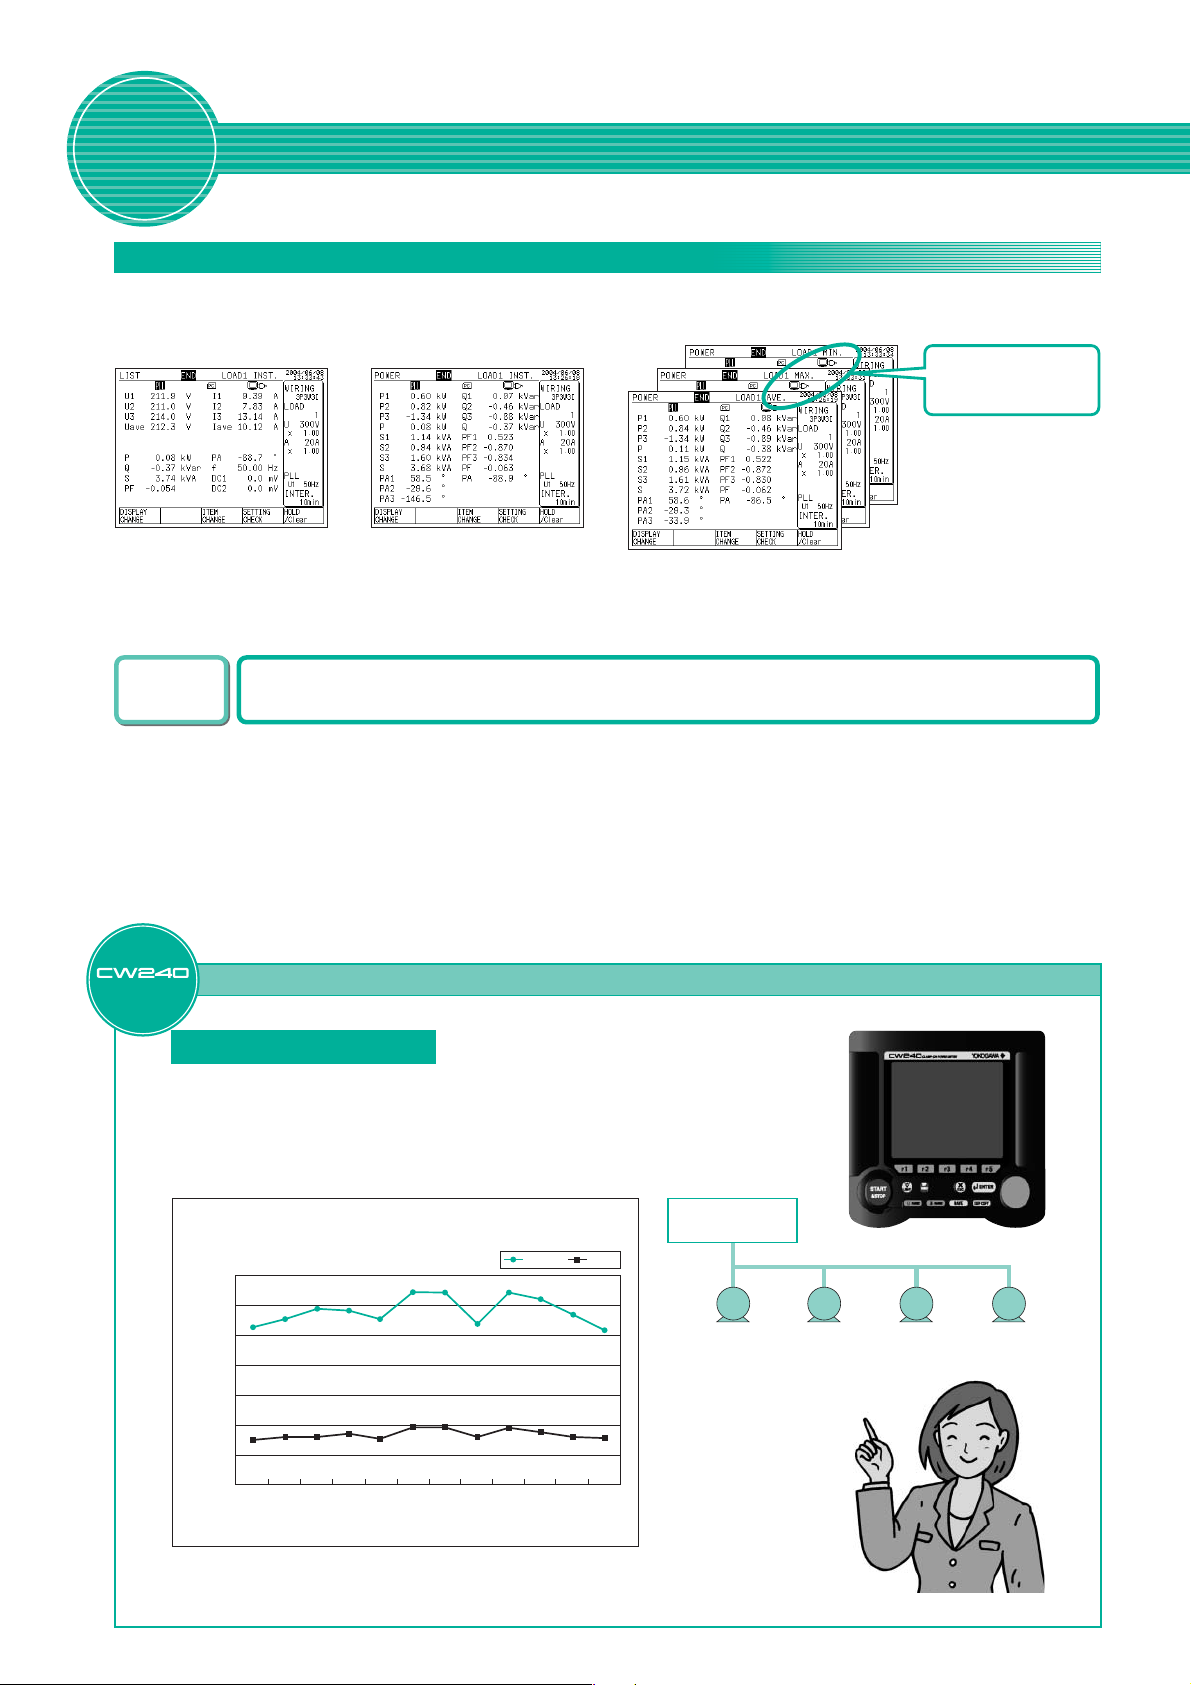
Measurement of Instantaneous
Power
Investigation
Power Investigation Improves power Efficiency Through Detailed Data Coll
Measurement of Instantaneous
Value: For investigation of power consumption, maximum load factor and peak currentMeasurement of Instantaneous Value: For investigation of power consumption, maximum load factor and peak current
The CW240 can be used to carry out investigation regarding renewal of electric equipment such as transformers in
building, check load factors and demand factors, and to check current/voltage fluctuation at motor start-up.
(Example of screen display)
● Measurement elements : Voltage/current/electric power (active, reactive, apparent)/power factor/phase angle of each phase,
● Data collection time : 1/2/5/10/15/30 seconds, 1/2/5/10/15/30/60 minutes
Convenient
functions
average/minimum/maximum values of each measurement element.
One cycle (waveform), 100/200/500 ms (short time interval)
Use of the 3-wattmeter method enables display of instantaneous value of each
measurement element.
Allows switching data
from one to another
and saving data.
4
Solution
Food processing plant
Purpose : To review the current power equipment, and replace it
if necessary but with low investment cost
Solution 1 : Calculation of the amount of used water based on power
Solution 2 : Introduction of invert pump control
Power comparison before and after
implementation of the solution
14
12
10
8
6
Powe r (kw)
4
2
0
0:00
2:00
Investigation into Energy Saving at Factories and Buildings
Facility investigated: Pumps
consumption since flow meters are expensive
Power
measurement
before after
Water supply
pump
Water supply
pump
AP240 Suitable for
Data Analysis!
4:00
6:00
8:00
10:00
12:00
Time
14:00
16:00
18:00
20:00
22:00
CW240
Clamp-on power meter
Water supply
pump
Water supply
pump
Energy saving & Reduce electricity bill
Page 5
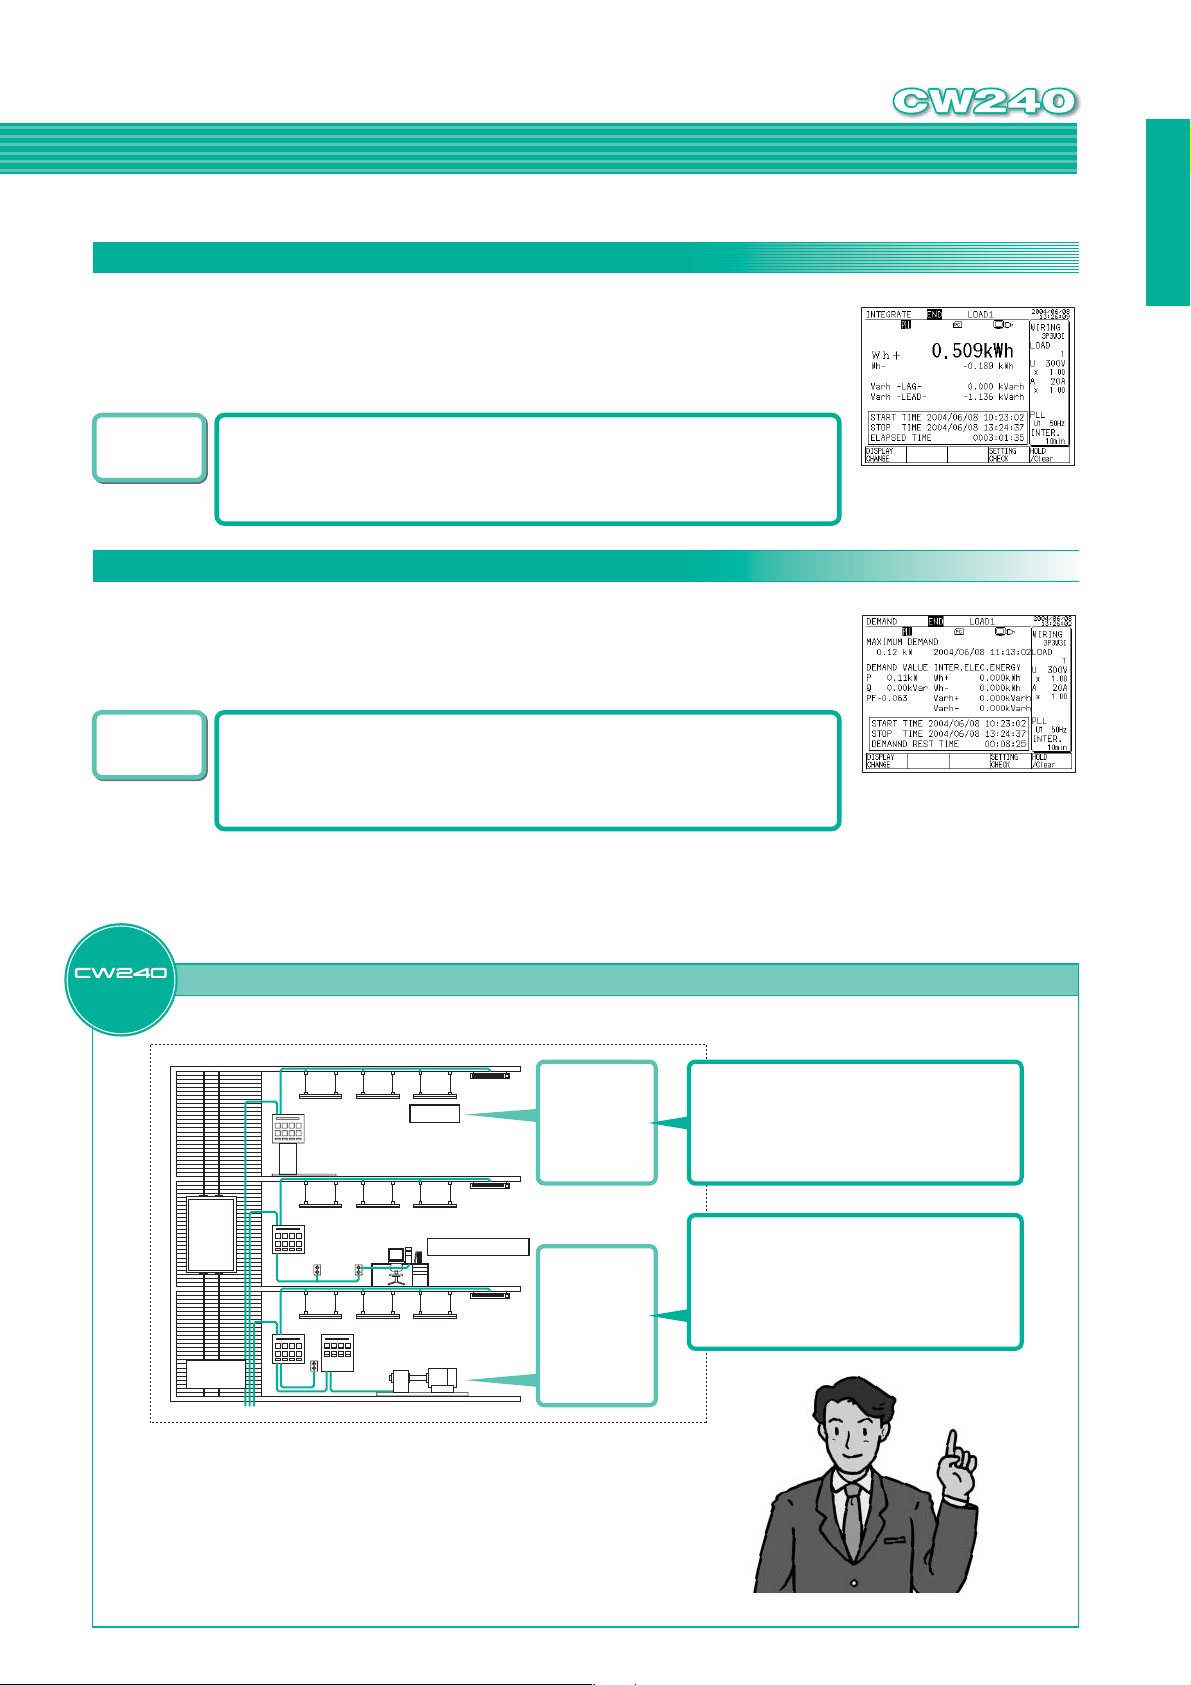
Demand Measurement:
wer Quantity Measurement:
ection.
CW240
Power Quantity Measurement:
For Power-Saving Diagnosis and Data Collection for ISO14001Power Quantity Measurement: For Power-Saving Diagnosis and Data Collection for ISO14001
The CW240 can measure and display the power quantity consumed up to the specified
time (from the start of integration until the end).
● Measurement elements : Active power quantity, regenerative power quantity, reactive power
quantity (leading/lagging)
● Data collection time : 1/2/5/10/15/30 seconds, 1/2/5/10/15/30/60 minutes
Convenient
functions
The number of display digits and display units can be selected.
●Standard (Voltage/current range is selected according to the phase)
●Arbitrary (Decimal point position and display unit can be specified)
●Auto (Decimal point position and display unit are selected automatically according to
the integration result)
Demand Measurement:
For Review and Investigation on Contract DemandDemand Measurement: For Review and Investigation on Contract Demand
● Measurement elements : Maximum power demand required since the start of logging measurement
and the time it occurs
Active power, reactive power (lag), power factor
Active power quantity (consumption, regeneration), reactive power
quantity (lagging/leading)
Convenient
functions
Normally, the demand time limit is set to 30 minutes in the
contract with a power company.
However, the CW240 allows you to set the desired demand
time limit in units of seconds/minutes.
Demand time limit setting : 1/2/5/10/15/30 seconds, 1/2/5/10/15/30/60 minutes
(Example of screen display)
CW120 AP240E
(Example of screen display)
● Demand
Demand time limit : Length of time set to obtain the average power (normally 30 minutes)
Demand power : Average power during the demand time limit
Solution
Energy Saving and Maintenance for Electric Equipment at Factories and Buildings
Investigation at
offices
●Air conditioning
●Lighting
●Office automation
equipment
●Elevator
Investigation at
production
departments
●Power quantity
●Investigation of
electric power
consumption rate
●Production
quantity
●Power factor
Elevator
Distribution
board
Cellulametal floor duct
Distribution board
Distribution
board
Personal computer
Control
panel
Lighting
Personal computer
CW240 solution (building)
1. For energy investigation/control for each application
and floor
2. For simple investigation for each shop and tenant
3. Diagnosis of operational status of equipment such as
elevator and air conditioner
4. Diagnosis regarding renewal of electric equipment
CW240 solution (factory)
1. Diagnosis of operational status of equipment such as
production equipment and air conditioner
2. For investigation of electric power consumption rate for
each production line
3. For energy investigation/control for privately-owned
electrical power facilities
4. For control of monthly target energy consumption
5
Page 6
Power Supply
● Harmonics for analysis : 1st to 50th
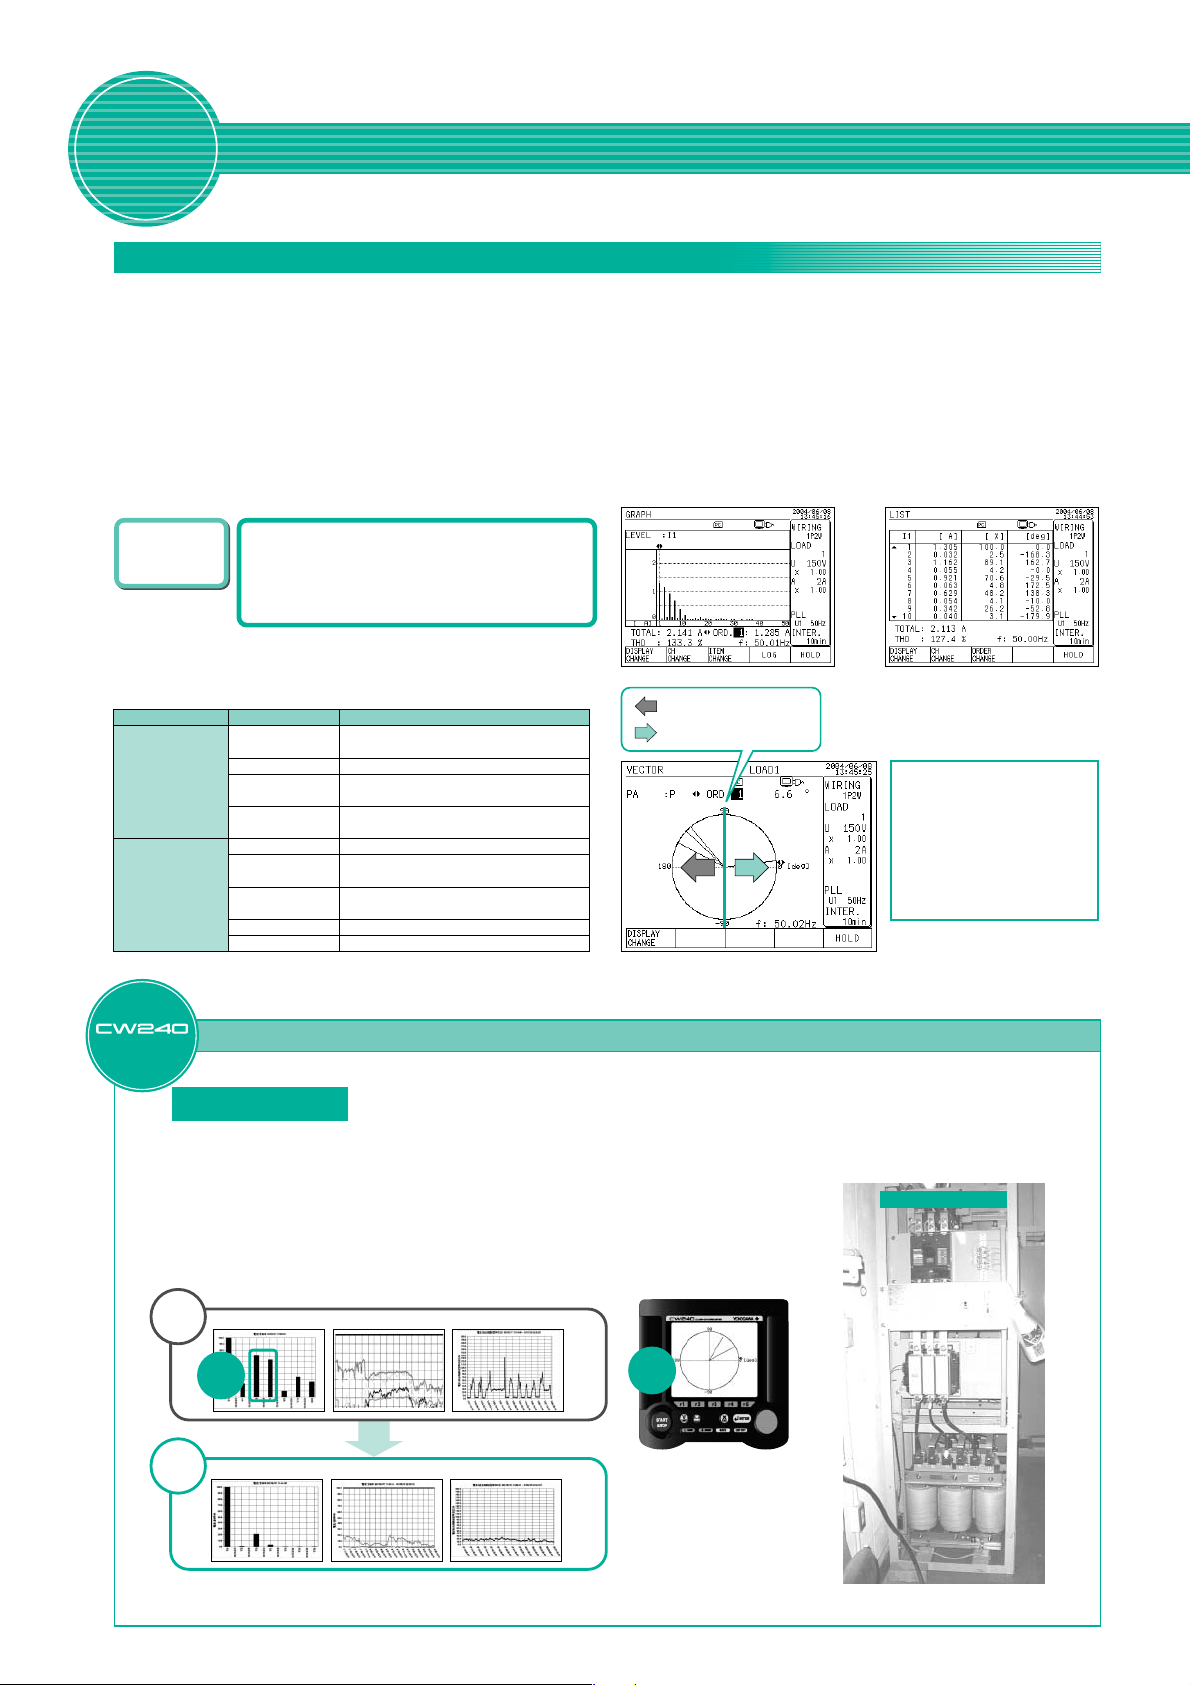
● Display data : List, bar graph (linear/log), vector (inflow/outflow judgment)
● Measurement elements : Level, content, phase angle (voltage/current/electric power of each harmonic), aggregate value (voltage,
current, electric power, power factor), aggregate harmonic distortion factors (THD-F or THD-R) of
voltage/current
● THD-F : Distortion factor for the fundamental wave, THD-R: Distortion factor for all rms values voltage/current
● Data collection time : 1/2/5/10/15/30/60 minutes
Quality Control
Harmonic Measurement
In many cases, inverter power supplies are used to drive air-conditioners and compressors. These power supplies
cause distortions in voltages and currents, leading to malfunctions and power loss. Therefore, investigation and
control of influences on the main power supplies by harmonics is necessary.
Discovers Failures in Power Supply Lines.
(Example of graph display) (Example of list display)
Convenient
functions
The harmonic whose data is
required to be saved can be selected.
Inflow/outflow of harmonics can be
checked.
●THD-F
Distortion factor for the fundamental wave, THD-R: Distortion
factor for all rms values
(Influences by harmonics)
Category Device Influence type
Power devices
6
Electronic/electrical
household
appliances
Solution
Capacitor, reactor
Transformer
Fuse, breaker
Induction motor
Protective relay
Electrical household
appliances
Fluorescent lamp,
mercury-arc lamp
Computer
Electronics device
Overheat, burn, vibration, noise due to
excessive current
Overheat, noise, increase in core/copper loss
Blow-out, malfunction due to excessive
current
Periodic fluctuation of revolution speed,
overheat, increase in loss
Malfunction
Flickering, noise, malfunction, breakdown
Burn of stabilizer/capacitor, flickering
Malfunction, out of control, breakdown
Malfunction of automatic control part
Improvement of Harmonic Measurement and Diagnosis
: Inflow of harmonic
: Outflow of harmonic
Explanation of vector diagram
● Vector length indicates the apparent
power of each harmonic in
proportion to that of the fundamental
harmonic.
● The horizontal axis shows active
power and the vertical axis indicates
reactive power. They are shown in a
logarithm.
● Frequencies shown are those of the
measurement element actually
measured.
Printing plant
Purpose: To investigate the cause for periodic breakdown of printing machine
Measurement: Advantages obtained by using the CW240
Result: Occurrence of harmonics in 5th and 7th was discovered!
Before
solution
Countermeasure: Installation of transformer filter for 5th and 7th harmonics
After
solution
It may be caused by harmonics generated in the power lines.
●
Compact and easy to carry ● Measurement of up to the 50th harmonic
●
Long-term data collection ● Vector diagram display
In addition, it became clear that harmonics are generated due to loads inside the factory.
In perticular, the 5th harmonic causes adverse effects such as burn-out of the serial reactor in the
capacitor used to improve the power factor.
Time series for
each harmonic for current 1
Discovery
of
the cause
Time series for
each harmonic for current 1
Content for
each harmonic for current 1
Content for
each harmonic for current 1
Total harmonics distortion for
current 1
Total harmonics distortion for
current 1
Confirmation
of
inflow
500kV transformer
Effects of countermeasures: The contents of 5th and subsequent harmonics decreased drastically
and the distortion ratio also dropped below 30%, resulting in elimination of breakdowns.
Page 7
Waveform Measurement
Measurement results
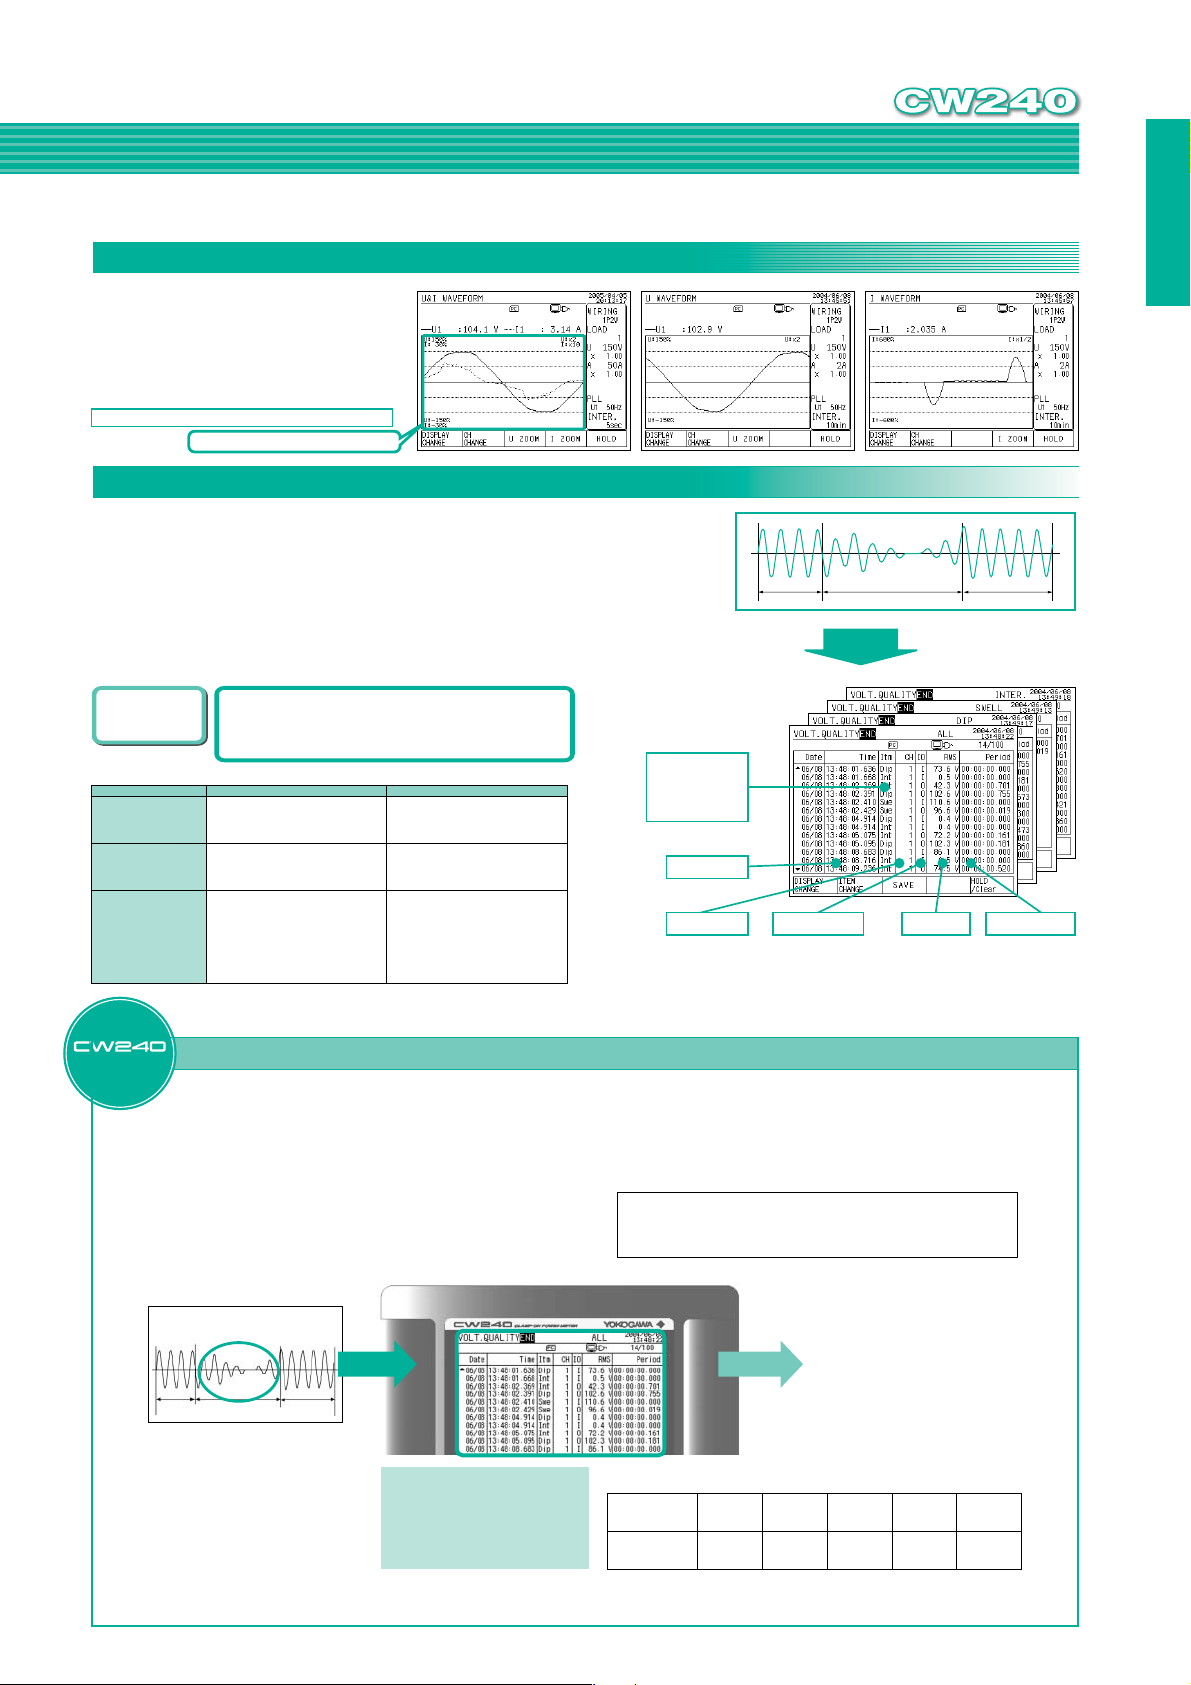
● Measurement elements :
Voltage of each phase, current of each phase
Voltage and current of each phase
● Data saving format :
Binary (can be converted to CSV format
using a standard application program)
The scale of the vertical axis can be changed from x1/3 to x20.
Easy to understand waveform distortion.
Voltage Fluctuation Measurement
The CW240 detects dates/times of when fluctuations occur, fluctuation type,
channels where they occur, rms values, and periods between start and end. The
voltage threshold is set, and fluctuations exceeding the threshold are detected.
● Measurement element : Voltage dip (voltage drop), voltage swell (voltage rise),
instantaneous power failure
lData saving : Detected based on the voltage rms value of one waveform.
Up to 100 data sets can be saved.
CW240
CW120 AP240E
Normal period Fluctuation period Normal period
Measurement results
Convenient
functions
It is possible to provide a voltage
difference between start and end
by setting a hysteresis.
Failures in power supply lines
Item Phenomenon Problem
Voltage dip
(Sag, voltage drop)
Voltage swell
(Voltage rise)
Instantaneous
power failure
(Instantaneous stop
of power supply)
A voltage drop occurs for a short
time due to the occurrence of a large
inrush current, for example, when a
motor is started.
Voltage increases instantaneously,
for example, when lightning occurs
or when a power line with a heavy
load is turned ON/OFF.
Power supply is stopped
instantaneously or for a short/long
time, for example, when a problem
occurs in the power supply
(suspension of power supply due to
lightning, etc.) or due to the trip of a
breaker caused by short circuits in
the power supply, etc.
Solution
Quality check for power supplies used in
semiconductor manufacturing equipment in
accordance with the SEMI guidelines
Measure stability of the voltage of supplied power according to
SEMI S2-0302 (Environmental, Health, and Safety Guideline for
Semiconductor Manufacturing Equipment). If a sag (default:
within 2%) occurs, the wafer is removed from the line for
inspection so daily quality check for power supplies is necessary.
Item
Swe: Swell
Dip: Dip
Decrease of power supply voltage
may cause devices to stop or reset
operations.
Increase of power supply voltage
may cause devices to stop or reset
operations.
Instantaneous power failure may
cause devices to stop or reset
operations. Recently, various
preventive measures have been
taken for computers, thanks to
widespread use of UPS
(uninterruptible power source).
Int: Instantaneous
power failure
Occurrence date
Channel
I: Start 0: End
Power Supply Quality Check at Various Places
SEMI: Semiconductor Equipment and Materials International
SEMI guidelines are used at the time the contract is made, to
evaluate the safety of semiconductor manufacturing equipment
when exporting it from Japan to the USA.
rms value
7
Detection period
Voltage fluctuation image
Normal period Fluctuation period Normal period
Measurement
results
Advantages obtained by using the CW240
●Compact and easy to carry
●Detects voltage fluctuations in each cycle.
Instantaneous power failures and voltage
fluctuations are monitored continuously, and
the occurrence and recovery times are
reported.
Voltage level
(100% as reference)
Fall (rise) time
50% ~
Within 0.2 sec.
Result:
Occurrence date/time of the sag can
be reported so that semiconductor
quality can be improved.
Other:
Verification of instantaneous power failure
preventive measures implemented in
semiconductor manufacturing equipment
70% ~
Within 0.5 sec.
80% ~
Within 10 sec.
90% ~
110%
No limit
~ 120%
Within 0.5 sec.
Page 8
Convenient
functions
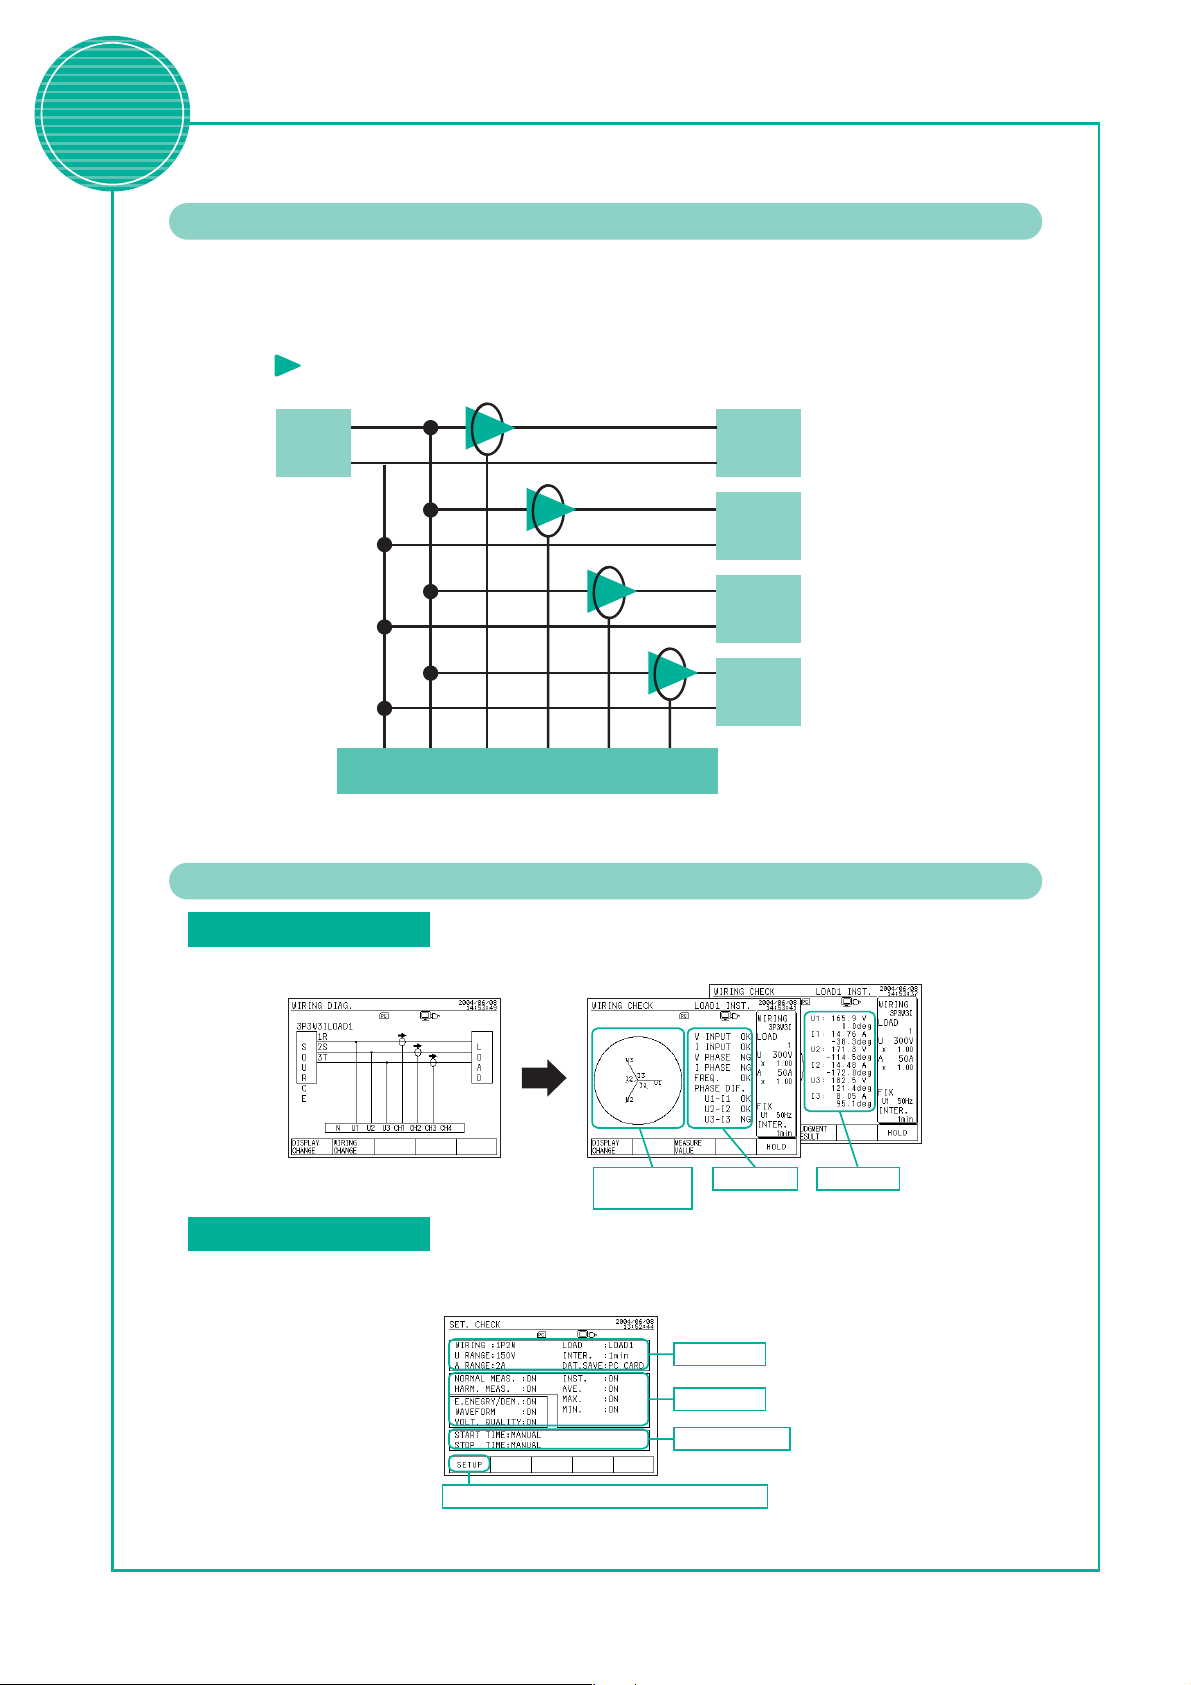
Measures Loads in Four Systems Simultaneously.
The CW240 enables simultaneous measurement of loads in four systems in the case of the
single-phase 2-wire system, and in two systems in the case of the single/three-phase 3-wire
system (common to voltage).
Current clamp probe/range can be set for each system.
This allows measurement according to the current flowing in each load.
(example)
200A
100A
10A
2A
Power
supply
1
N
Load 1
Load 2
Load 3
Load 4
NU1CH1 CH2 CH3 CH4
8
CW240 side Example of single-phase 2-wire system
Reduces Operation Errors at Work Site.
Wiring check function
Prior to start of measurement, the CW240 checks whether wiring is correct. Wiring errors, reverse connection of
current clamps, and phases to be checked can be displayed in a vector diagram.
Checking the
phases displayed in
a vector diagram
OK/NG judgment Measured values
Setting check function
Settings made for data saving can be checked in the screen. This prevents data acquisition errors that may occur due
to mistakes in voltage range setting, current clamp selection or data save item selection.
Phase/range etc.
Data save item
Measurement start/end
To change the settings, press this button to display the setting screen.
Page 9

Saving a Large Amount of Data
Use of an external memory card (compact flash)
makes it possible to save a large amount of data.
A memory card
the data is saved in CSV format.
In addition, the CW240 has a 1MB internal
memory.
*1: Memory cards purchased from Yokogawa should be
used.
*2: Data shorter than one second is saved in binary
format.
Screen copies can be made in bitmap format.
Voltage fluctuation data is saved in text format.
(*1)
of up to 2GB can be used, and
(*2)
Leakage Current Measurement
●Storage period when PC card (512MB) and internal memory (1MB) are used
When storing all items of measured data, measured power quantity/demand data, and measured
voltage fluctuation data
Wiring
Number of storable data items
Recording medium
PC card
(512MB)
Internal memory
(1MB)
When storing all items of measured data, measured power quantity/demand data, all items of
measured harmonics data, waveform data and measured voltage fluctuation data
Wiring
Number of storable data items
Recording medium
PC card
(512MB)
Internal memory
(1MB)
Interval time
1s
1min
60min
1s
1min
60min
Interval time
1min
60min
1min
60min
1P2W
4 systems
168
9 hrs
24 days
1471 days
8 min
8 hrs
21 days
1P2W
4 systems
5642
17 hrs
44 days
12 min
12 min
1P3W
2 systems
196
8 hrs
21 days
1304 days
7 min
7 hrs
18 days
1P3W
2 systems
5052
19 hrs
49 days
13 min
13 hrs
1P3W31
114
14 hrs
37 days
2223 days
12 min
12 hrs
32 days
1P3W31
3758
26 hrs
65 days
19 min
19 hrs
3P3W21
2 systems
208
8 hrs
20 days
1232 days
7 min
7 hrs
17 days
3P3W21
2 systems
6888
14 hrs
35 days
8 min
8 hrs
3P3W31,
3P4W
138
12 hrs
30 days
1852 days
10 min
10 hrs
26 days
3P3W31,
3P4W
4390
22 hrs
56 days
16 min
16 hrs
3P4W41
142
12 hrs
30 days
1802 days
10 min
10 hrs
26 days
3P4W41
5002
19 hrs
49 days
13 min
13 hrs
3P3W
+1P3W
216
7 hrs
19 days
1188 days
6 min
6 hrs
17 days
3P3W
+1P3W
7504
13 hrs
32 days
7 min
7 hrs
CW240
CW120 AP240E
- External magnetic field effect is 0.002A or less, at 400A/m -
Yokogawa's proprietary technology has achieved a magnetic field
impact amount of 30 ppm even in adjacent power lines. (At 100A)
Use of the 2A current clamp probe (96036) enables measurements
with 200.0 mA range.
Current clamp probe 96036
Analog Input/Output
- Besides power data -
Analog data such as temperature and illuminance data can be
saved simultaneously with power data by using the analog input
function (2 channels).
The available input ranges are 100 mV/1 V/5 V. In addition, the
analog output function (4 channels) acquires data to an external
recorder, allowing data duplexing. Output is ±1 VDC.
(The analog input/output function is optional.)
Digital illuminance meter 51001
Other Convenient Functions
Besides the AC adapter, it is possible to use a NiMH battery pack (94004) or alkaline
Power supply backup
Multi-lingual support
batteries (six AA batteries).
The CW240 will continue to operate even if supply of power is interrupted.
The CW240 supports Japanese, English, German, French, Spanish and Italian (available
in the near future).
1R
2S
Power
3T
supply
N
NU1U2U3CH1 CH2 CH3 CH4
CW240 side Three-phase 4-wire 4-current
Voltage,
current,
power etc.
Load
Temperature,
illuminance etc.
Analog output
2 channels
9
Manual data saving
Screen hard copy
Zoom function
The data for the selected items can be saved or printed using the SAVE key.
However, it cannot be saved during integrating measurement (and during standby).
The currently displayed screen can be saved or printed using the DISP COPY key.
Files are saved in bitmap format.
The measured data for the selected five items can be zoomed in.
The items to be displayed can be selected from instantaneous value and measured power
quantity data.
Page 10

Specifications
10
Inputs
Item Voltage Current
Input type Resistive potential division
Rated value
(range)
Phase to be
measured
Number of systems
to be measured
Input resistance
Maximum allowed
input (continuous)
A/D converter
150.0 V
300.0 V
600.0 V
1000 V
Single-phase 2-wire, single-phase 3-wire, single-phase 3-wire 3-current (current in neutral
line), three-phase 3-wire 2-current (2-power meter method), Three-phase 3-wire 3current (3-power meter method), three-phase 4-wire, three-phase 4-wire 4-current
(current in neutral line), Scott connection (three-phase 3-wire + single-phase 3-wire)
With the same voltage
Single-phase 2-wire: 4 systems, single-phase 3-wire: 2 systems, three-phase 3-wire 2current: 2 systems
Approx. 1.3MΩ Approx. 100KΩ (CW240 main unit)
1000 Vrms
Voltage/current input simultaneous conversion, PLL synchronized 128 samples/period,
16-bit resolution
Clamp detection
Varies with the clamp and range used.
96036 (2A) 200.0/ 500.0mA/1.000/ 2.000A
96033 (50A) 5.000/10.00/ 20.00/50.00 A
96030 (200A) 20.00/50.00 /100.0/200.0 A
96031 (500A) 50.00/100.0/ 200.0/500.0 A
96032 (1000A) 200.0/500.0 A /1.000 kA
96034 (3000A range) 300.0/750.0 A /1.500/3.000 kA
(2000A range) 200.0/ 500.0 A/1.000/2.000 kA
(1000A range) 100.0/ 200.0/500.0 A/1.000 kA
96035 (3000A range) 300.0/750.0 A /1.500/3.000 kA
(300A range) 30.00/75.00 /150.0/300.0 A
96036 (2A) 20Arms
96033 (50A) 130Arms
96030 (200A) 250Arms
96031 (500A) 625Arms
96032 (1000A) 700Arms
96034 (3000A range) 2400 Arms (
(2,000A range) 2400Arms
(1000A range) 1200 Arms
96035 (3000A range) 3600 Arms
(300A range) 360 Arms
Measurement Functions
Item Voltage
Method Digital sampling
Frequency range 45 to 65Hz (Measurement element is selected from U1, U2 and U3)
Crest factor Rated input: 3 (however, 1.8 when 1000V range is used)
±
Accuracy
Power factor
influence
Reactive factor
influence
Active input range 5 to 110% of each range (Max. 100% in the case of 1000V range)
0.2%rdg.
±
0.1%rng.
—
—
Voltage / current: 0.4 to 130% of each range
Display range
Temperature
coefficient
Display updating
interval
Power (active, reactive, apparent): 0 to 130% of each range
Harmonic level: 0 to 130% of each range
Frequency: 40 to 70Hz
±0.03%rng/°C ±0.05%rng/°C
Approx. 0.5 seconds
Current / Active power / Reactive power (reactive power meter method is used)
96030, 96031, 96033, 96036 ±0.6%rdg.±0.4%rng.
96032, 96034, 96035 ±1.0%rdg.±0.8%rng.
96030 ±1.0%rng (45 to 65Hz, power factor =±0.5)
Other than 96030 ±2.0%rng (45 to 65Hz, power factor =±0.5)
96030 ±1.0%rng. (
Other than 96030 ±2.0%rng (
45 to 65Hz, reactive factor =±0.5
45 to 65Hz, reactive factor =±0.5
(Zero suppression when below 0.4% of the range)
(Zero suppression when below 0.17% of the range
rating).
3600 Arms for 10 minutes
Equations
Active power, reactive power, apparent power, power factor and phase angle are
measured for each phase.
The average, maximum and minimum values of those obtained during
integrating measurement are calculated.
T
T
1
1
Voltage rms
Current rms
Active power
Reactive power 1 When the reactive power meter method is used
Equations for Each Phase
Measurement
Items
Average voltage
Umrms = um(t)2dt =
Imrms = im(t)2dt =
Pm = {um(t) ҂im(t)}dt =
Qm = {um(t)҂im(t + )}dt =
Wiring
∫
T
0
T
1
∫
T
0
T
1
∫
T
0
T
1
∫
T
0
Equation
Average current
Active power
Reactive power 2
)
Apparent power
Power factor
Phase angle
*1: Line voltage is measured in the case of 3-phase 3-wire system, and phase voltage in the case of 3-phase 4-wire
*2: I2 for three-phase 3-wire system (2-power meter method) is calculated by vector operation.
*3: This equation is applicable when the reactive power meter method is not used. Even in this case, the value is
*4: In the case of three-phase 3-wire system, the phase voltage from the virtual neutral point is used to calculate
*5: Multiplied by the polarity of Q for each phase calculated by the reactive power meter method.
*6: In the case of distorted waves and unbalanced inputs, there may be differences from other instruments that
)
)
(*3)
Q = S
S = U҂I
When the reactive
power meter method
is not used
When the reactive
power meter method
is used
(*5)
In the case of distorted waves, there may be differences from other instruments that
employ different measurement principles.
system.
multiplied by the polarity of Q for each phase calculated by the reactive power meter method.
each phase power.
employ different measurement principles.
P1, P3, Q1, Q3, S1, S3, PF1 and PF3 are obtained during calculations carried out by the 2-power meter
method, and do not exist as physical values.
2
(t)
u
∑
m
T
t=0
T
1
2
i
(t)
∑
m
T
t=0
T
1
{um(t)҂im(t)}
∑
T
t=0
T
T
1
∑
T
4
t=0
—
—
—
2
2
P
—
(*5)
—
{
um(t)҂im(t + )
Symbol
Uave
Iave
∑
P
∑
Q
∑
S
∑
PF
∑
PF
∑
PA
T
}
4
Single-phase
3-wire
(U1 + U2)/2
(1 + I2)/ 2
P1 + P2
Q1 + Q2
S1 + S2
Three-phase
2-current
∑S2 –∑P
∑
∑
∑
3-wire
P1 + P3
3
(S1 + S3)
2
PF =
PF =
PA = cos
*6
∑
P
∑
S
∑
P
–1
∑
u(t): Voltage input signal
i(t) : Current input signal
T:One cycle of input signal
m:Each phase
Three-phase
3-wire
3-current
(U1 + U2 + U3)/3
(I1 + I 2 + I3)/ 3
P1 + P2 + P3
2
Q1 + Q2 + Q3
S1 + S2 + S3
∑
P
2
2
+
∑
Q
PF
rdg: Reading rng: Range
Range Configuration for Active Power
For single-phase 2-wire system (X2 for single/three-phase 3-wire system, X3 for three-phase 4-wire system)
When 96030 / 96031/ 96032 / 96033/ 96036 is used
Voltage range
96036(2A) 96033(50A)
200.0 mA 500.0 mA 1.000 A 2.000 A 5.000 A 10.00 A 20.00 A 50.00 A 100.0 A 200.0 A 500.0 A 1.000 kA
150.0 V 30.00 W 75.00 W 150.0 W 300.0 W 750.0 W 1.500 kW 3.000 kW 7.500 kW 15.00 kW 30.00 kW 75.00 kW 150.0 kW
300.0 V 60.00 W 150.0 W 300.0 W 600.0 W 1.500 kW 3.000 kW 6.000 kW 15.00 kW 30.00 kW 60.00 kW 150.0 kW 300.0 kW
600.0 V 120.0 W 300.0 W 600.0 W 1.200 kW 3.000 kW 6.000 kW 12.00 kW 30.00 kW 60.00 kW 120.0 kW 300.0 kW 600.0 kW
1.000 kV 200.0 W 500.0 W 1.000 kW 2.000 kW 5.000 kW 10.00 kW 20.00 kW 50.00 kW 100.0 kW 200.0 kW 500.0 kW 1.000 MW
When 96034 / 96035 is used
Voltage range
96035_2(300A)
30.00 A 75.00 A 150.0 A 300.0 A 100.0 A 200.0 A 500.0 A 1.000 kA 2.000 kA 300.0 A 750.0 A 1.500 kA 3.000 kA
150.0 V 4.500 kW 11.25 kW 22.50 kW 45.00 kW 15.00 kW 30.00 kW 75.00 kW 150.0 kW 300.0 kW 45.00 kW 112.5 kW 225.0 kW 450.0 kW
300.0 V 9.000 kW 22.50 kW 45.0 kW 90.00 kW 30.00 kW 60.00 kW 150.0 kW 300.0 kW 600.0 kW 90.00 kW 225.0 kW 450.0 kW 900.0 kW
600.0 V 18.00 kW 45.00 kW 90.00 kW 180.0 kW 60.00 kW 120.0 kW 300.0 kW 600.0 kW 1.200 MW 180.0 kW 450.0 kW 900.0 kW 1.800 MW
1.000kV 30.00 kW 75.00 kW 150.0 kW 300.0 kW 100.0 kW 200.0 kW 500.0 kW 1.000 MW 2.000 MW 300.0 kW 750.0 kW 1.500 MW 3.000 MW
Current range
96032(1000A)
96031(500A)
96030(200A)
Current range
96034_3(3000A)
96034_2(2000A)
96034_1(1000A)
96035_1(3000A)
Three-phase
4-wire
*1
*2
*4
*4
*4
Page 11

Specifications of Each Function
Frequency Measurement Function
Measurement input Voltage input Selectable from U1, U2 and U3
Measurement frequency range 45 to 65 Hz
Display range 40.00 to 70.00 Hz
Accuracy ±0.1%rdg. ±1dgt
Low-pass filter function Cutoff frequency: Approx. 300 Hz OFF/ON selectable
Power Quantity Measurement Function
Measurement elements Active power quantity, regenerative power quantity, reactive
Measurement accuracy Measurement accuracy of active power and reactive power
Measurement range Active power quantity
Display digits setting function Selectable from automatic setting by rated power, minimum
Integration time accuracy ±20 ppm (Typ., 23°C)
Demand Measurement Function
Measurement elements Active power (consumption), reactive power (lagging), power
Measurement accuracy Measurement accuracy of active power and reactive power
Harmonic Measurement Function
Method PLL synchronization
Measurement frequency range Fundamental wave frequency 45 to 65 Hz
Harmonics for analysis 1st to 50th
Window width 1 cycle
Window type Rectangular
Analysis data quantity 128 points
Analysis rate 1 sample/16 cycles
Analysis items Harmonic level: Level of each harmonic of voltage, current and
Accuracy Harmonic level
Display data List, bar graph (linear/log), vector
Waveform Measurement Function
Measurement elements Selectable from voltage/current waveform of same phase, all
Magnification change x1/3 to x 20 in relation to the rating
Display data 1 waveform
Voltage Fluctuation Measurement Function
Measurement elements Voltage dip, voltage swell, instantaneous power failure
Measurement method Detected based on voltage rms of one waveform.
Threshold/hysteresis Can be set in percentage in relation to the reference voltage.
Accuracy Same as voltage rms accuracy
Detection period Time length during which the threshold is exceeded
Display data Occurrence date (year, month, day), voltage rms, detection
Number of events 100
Display Function
Display 5.7-inch STN monochrome LCD display (320 dots x 240 dots)
Backlight OFF/ON and auto OFF selectable
Contrast Automatically adjusted according to the ambient temperature /
Display digits Items other than power quantity: 4 digits
Language English, Japanese, German, French, Spanish, Italian, Korean and
Display average function Moving average
Display hold Hold / cancel
Save/Print Function
Data can be saved/printed manually or automatically.
Storage media Internal memory: 1MB or PC card
Printing Dedicated printer (via RS-232)
Save/print data Measured data, voltage variation data, waveform data, screen
Saving format Measured data: CSV format
Save/print interval
Standard interval: 1/2/5/10/15/30 seconds, 1/2/5/10/15/30/60 minutes
For 10% to 130% sine wave input of voltage range
power quantity (lead/lag)
±1dgt (When STANDARD is selected for display digits)
Consumption 0.00000 mWh to 999999 GWh
Regeneration -0.00000 mWh to -999999 GWh
Reactive power quantity
Lagging 0.00000 mvarh to 999999 GVarh
Leading -0.00000 mvarh to -999999 GVarh
resolution setting, and minimum resolution shift by integrated
value.
factor: Demand value within the interval time
Active power quantity (consumption, regeneration), reactive
power quantity (lagging), leading: Power quantity within the
interval time
Maximum demand (consumption power demand) required since
the start of integrating measurement and the time it occurs
±1dgt
(When STANDARD is selected as the standard number of
display digits)
Relative harmonic content: Content of each harmonic of
Harmonic phase angle: Phase angle of each harmonic of voltage,
Total value: Total value of all the harmonics up to the 50th
Total harmonic distortion rate:
1st to 20th: ±1.5%rdg. ±1.5%rng
21st to 30th: ±2.0%rdg. ±1.5%rng
31st to 50th: ±3.0%rdg. ±1.5%rng
Relative harmonic content:
Value calculated from harmonic level ±2dgt
Harmonic phase angle
The accuracy is guaranteed if both voltage and current levels
for each harmonic are 5% of the range or higher.
1st to 20th: ±5°
20th to 50th: ±(0.3° X k+1°) k: Order
The accuracy for current in relation to the fundamental wave
is not specified.
voltage waveforms, and all current waveforms.
period
with backlight
Settable in 8 steps.
Power quantity: 6 digits
Chinese
(Averaging count: selectable from 2, 5, 10 and 20)
data, setting data
(Binary format if short-time interval is set)
Voltage variation data: Text format
Waveform data: Binary format
Screen data: BMP format (bitmap)
Setting data: Text format
It is not possible to output/print measured harmonic and
waveform data if the interval is shorter than 30 seconds.
power
voltage, current and power
current and power
For voltage and current, the phase angle
of the fundamental wave or that of U1
can be selected as the reference.
harmonic of voltage, current, power and power factor
Voltage / current (THD-F or THD-R)
Short-time interval: 0.1/0.2/0.5 seconds for each waveform
Data storage time display
Unoccupied capacity in the storage destination
Data save items, calculated based on the interval time.
File operation
Rename File names in the internal memory and PC card can be changed.
Deletion File names in the internal memory and PC card can be deleted.
Format PC card and internal memory and can be initialized
Data copy Files in the internal memory can be copied to the PC card.
Setting file Setting file can be read, written, deleted and renamed.
Communication Function
Electrical specifications EIA RS-232
Synchronization system Asynchronous communication
Baud rates 1200/2400/9600/19200/38400 bps
Connector D-sub 9-pin
PC card interface
Slot PC card slot TYPE II (x1)
Compatible card ATA flash memory card
Data format MS-DOS format
Recording contents Measured data, voltage fluctuation data, waveform data, screen
External control I/O terminals
Used to control start/end of integrating measurement.
Control input TTL level or contact
Control output TTL level
Analog Input and DA Output Functions (Optional)
DA output
Output voltage ±1VDC of the rated value for each range
Number of output channels 4 channels
Output data
(Four items can be selected) Instantaneous value
Power quantity Active power quantity (consumption, regeneration), reactive
Harmonic Level, content, phase angle, total value, THD (THD-F or THD-R)
Accuracy ±(Measurement accuracy + 0.2%f.s.)
Resolution Polarity + 11 bits
Updating interval Other than harmonic measurement: 1 cycle of input signal
Temperature coefficient ±0.02%f.s./°C or less
Output resistance 22Ω±5%
Power quantity output route Selectable from 1V/1kWh, 1V/5kWh, 1V/10kWh, 1V/50kWh, 1V/
Analog input
Input ranges 100mV/1V/5VDC
Number of inputs 2 channels
Accuracy ±0.5% f.s
Resolution Polarity + 11 bits
Sampling rate Approx. 20ms
Input resistance Approx. 100kΩ
Clock Function
Automatic calendar, automatic leap-year setting, 24-hour system
Real-time accuracy ± 20 ppm (Typ., 23°C)
Wiring Check Function
Verification of validity of measurement of voltage/current input value, voltage/current phase
difference, voltage-to-voltage phase difference, current-to-current phase difference and frequency
Verification of single-phase load (in the case of Scott connection)
Wiring diagram, vector diagram display
Setting Check Window
Used to check data save items and start/end for integrating measurement.
Other functions
VT ratio/CT ratio setting, ID number setting, NiMH (nickel hydride battery) charge, remaining
battery voltage display, beep sound (key operation), key lock, system reset
General specifications
Location for use: Indoor, at an altitude of 2000 meters or less
Storage temperature and humidity ranges
Operating temperature and humidity ranges
Insulating resistance 500 VDC, 50MΩ or greater
Insulating withstand voltage
(50/60Hz, for one minute) 5.55 kVAC rms for one minute (Sensed current: 1mA)
Power supply AC adapter (standard accessory), 100 to 240 VAC, 50/60Hz
Backup battery (for power failure) Six AA size alkaline batteries (standard accessory)
Maximum rated power consumption
External dimensions Approx. 206 (W) ҂ 184 (H) ҂ 65 (D) mm
Weight Approx. 1.2 kg (without batteries)
Accuracy guarantee conditions
Warm-up time 30 minutes or more (within active input range, sine wave input,
Accuracy guarantee temperature and humidity ranges
Accuracy guarantee frequency range
Accuracy warranty period 1 year
Only instantaneous values can be input.
data, setting data
Power quantity depends on the output rate.
X1, X10 and X100 can be set for harmonics.
Frequency: 0.4 to 0.7V / 40 to 70 Hz
Voltage, current, average voltage, average current, active power,
reactive power, apparent power, power factor, phase angle,
frequency
power quantity (lagging/leading)
Harmonic measurement: 16 cycles of input signal
100kWh, 1V/500kWh and 1V/1000kWh.
-20 to 60°C, 90%RH (no condensation)
5 to 40°C, 5 to 80%RH (no condensation)
Between voltage input terminals and case
Between voltage input terminals and current input terminals /
DC power terminals / external interface terminals
Between voltage input terminals and case
3.32 kVAC rms for one minute (Sensed current: 1mA)
Between voltage input terminals and current input terminals /
DC power terminals / external interface terminals
One NiMH battery pack (optional)
Main unit: Approx. 10W (normal operation), approx. 20W
(during charging of NiMH battery pack)
AC adaptor: Approx. 30VA (normal operation), approx. 60VA
(during charging of NiMH battery pack)
(excluding projecting parts)
power factor=1, PLL synchronization)
23±5°C, 30 to 75%RH
45 to 65Hz
CW240
CW120 AP240E
11
Page 12

Model CW120 Clamp-on Power Meter
(integration start/stop signal: function to
start/stop multiple units simultaneously)
Model CW121- -1
CW120
Maintenance and long term monitoring
of electrical equipment and electrical
system.
Current input
Voltage input
(clamp)
12
Model CW121- -1
External I/O controller port
(integration start/stop signal: function to
(integration start/stop signal: function to
start/stop multiple units simultaneously)
start/stop multiple units simultaneously)
RS-232 connector
100-240VAC Power connection
PC card slot
Power switch
(8-pin)
(flash ATA memory)
Easy-to-recognize function icons
Page 13

wer measurement
Low-cost tools to support your energy conservation efforts
As energy conservation becomes increasingly important, we are pleased to present low-cost clamp-on power meters designed to meet user
needs for simple tools capable of measuring power values and instantaneous values.
Useful features for energy conservation and power measurement
Useful features for energy conservation and power measurement
CW240
●Periodically save data as often as once a
second
Data can be saved as low as 1-second interval.
This capability allows the CW120 Series to respond
quickly to load fluctuations and measure transient
responses in equipment.
●Check equipment operating conditions
The CW120 Series has an instantaneous value filing
function (enabling multiple data records to be saved in
a single file when multiple measurements are taken)
which is useful for determining equipment operating
conditions.
Details for Models CW120/CW121
Items
Measurement Mode
Display
Communication
Power supply
Size (W⫻H⫻D)
Weight
Input system
Instant mode
Electric Energy mode
Screen
Interface
Protocol
Monitoring by AP240E
CW120/CW121
Single-phase 2-wire to 3-phase 4-wire
(Up to 3 phase 3 wire for CW120)
Available
Segmented LCD with backlight
RS232 or RS485
MODBUS, PC-link, Power-Monitor, Proprietary
Available
100 to 240V AC, Supply the power from input.
117⫻161⫻51mm
600g
●Wiring error check function
This function helps ensure that measurement
operations are correct.
●Simultaneous measurement of multiple
facilities
Multiple CW120 Series units can start and stop
integration simultaneously through externally
controlled I/O.
●Works even with small electric energy
values
Easily change the decimal position (the number of
digits following the decimal point) and display unit (Wh,
kWh, MWh, GWh) on the electric energy display.
CW120 AP240E
13
Load measurements on multiple systems
● In addition to support for a variety of connection types,
The CW120 Series can simultaneously measure the
loads* (facilities, equipment) on multiple systems
sharing a common power supply.
CW120 (three-phase 3-wire model): 1ø2W⫻2
CW121 (three-phase 4-wire model): 1ø2W⫻2, ⫻3
1ø2W Three current systems (example)
Power supply side
1
2
(Facility 3)
Load 3 side
Load 2 side
(Facility 2)
Load 1 side
(Facility 1)
Page 14

Low-cost tools to support your energy conservation efforts
Compact design
14
● The CW120 Series is compact in size (117҂161҂51mm
(W҂H҂D)), making it ideal for installation in cubicles
and inside distribution panels. Installation is even easier
Approximately
70 mm
Current clamp (96033)
with the magnetic case (93023).
● Although the CW120 Series is small, it has a large
ø18 mm
backlit LCD.
● A new addition to the clamp lineup is a small-diameter
current clamp (model 96033, capable of measurements
in the range of 5–50 A) for measurements in tight spots
and locations where many wires are jumbled together.
Magnetic case (93023)
Measurements
● The CW120 Series can be used for voltage measurements up to 495 V.
● A variety of connection types are supported, from single-phase 2-wire to three-phase 4-wire
(CW120: three-phase 3-wire model; CW121: three-phase 4-wire model).
● Continuous measurement integration (accurate measurements can be obtained even if there are large load
fluctuations)
● Plus/minus signs are shown for reactive power and power factor.
● The data saving interval can be set in the range of one second to one hour.
Parameters setting tool (name: Toolbox)
The setting software allows you to set CW120 Series
measurement conditions through a PC and save
measurement data on a PC when the unit is connected to
the PC through RS-232 or RS-485 port.
●Measurement conditions setting function
This function makes it easy to set basic functions needed
for measurement, such as start/stop time and date, wiring
method, clamp type, voltage, and current range etc.
●File transfer function
The data file stored in CF pack can be transfered to PC.
Microsoft Excel can read transferred data file.
* Toolbox is included as a standard feature (on two floppy disks).
RS-232 comm. cable
Microsoft, Windows, and Excel are trademarks or registered
trademarks of Microsoft Corporation, the United States.
Setting screen
File transfer screen
Page 15
Advanced data management and communication
Data management and communication
CW240
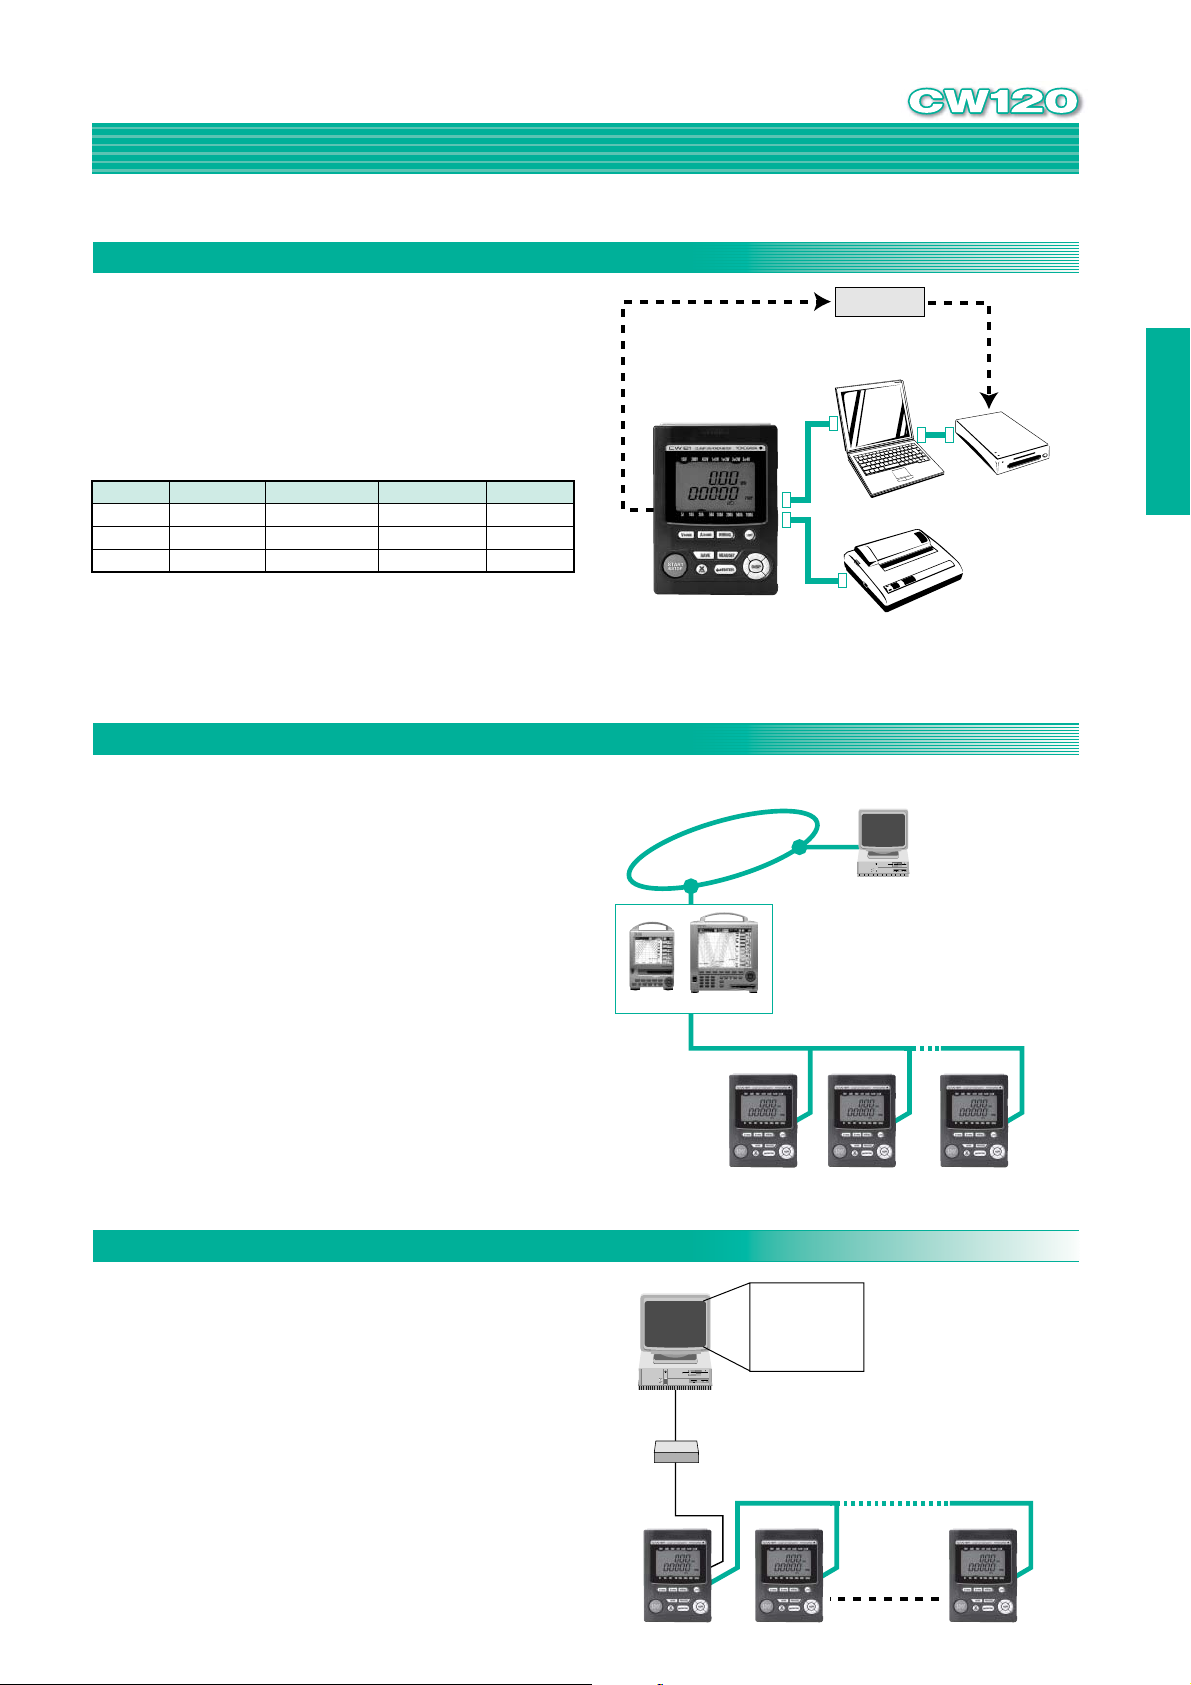
1 You can connect CW120 to a PC through dedicated
RS-232 cable.
2 A printer (sold separately) can be connected through
RS-232 cable to print measurement data.
3 If you have a media reader connected to your PC or card
slot in notebook PC, measurement data and settings can
be uploaded directly to a PC from CF* pack.
Memory Card
97034
97035
97037
* Compact Flash cards with memory capacity up to 2 GB may be used.
Memory capacity
256MB
512MB
2GB
Interval Time 10sec
Approx. 103days
Approx. 206days
Approx. 2years
Interval Time 1sec
Approx. 70hours
Approx. 140hours
Approx. 560hours
Wiring Method
3system 1ø2W
3system 1ø2W
3system 1ø2W
Network Communication
CW120 In addition to proprietary communication also
supports, MODBUS, PC-link and Power Monitor protocols.
PC-link is a protocol for Yokogawa's Temperature
controllers and PLCs.
Power Monitor protocol is a protocol for Yokogawa's
Power Monitors. (PR201)
Model MV Model MV
Yokogawa's
Recorder
CF pack
3
Comm.
Cable
Model 91011
1
PC
2
Printer
Cable
Model 91010
Data Management by DAQLOGGER*
Internet
WEB function: Model MV100/200 can be
monitored by Internet Browser on PC.
E-mail Alarm function: The alarms from
Model MV100/200 can be sent to PC as an Email.
FTP function: Model MV100/200 can send
gathering data as a file to PC by using FTP
function.
Printer Model 97010
PC
RS485-MODBUS protocol
CW120 AP240E
Media reader
15
* DAQLOGGER is Yokogawa’s communication software for Windows
Remote monitoring
The RS-485 allows multiple use to be connected for
remote monitoring.
* RS-485/RS-232 converter is required to connect the CW120/CW121-m-2 (RS-
485 communication spec) to the RS-232 port on your PC.
Recommended brand and model: Yokogawa’s RS-232/RS-485 Converter
Model ML2.
PC
RS-232
RS-485
Monitoring
Software
Converter
Max 31 units, 1.2km
Page 16

Vrms=
T
1
T
0
=
T
1
T
t=0
Arms=
T
1
T
0
=
T
1
T
t=0
T
1
T
0
=
T
1
T
t=0
•Voltage rms
•Current rms
•Active power
•Reactive power and power factor
Single-phase
2-wire
Single-phase
3-wire
Three-phase
3-wire
(Note 3)
Three-phase
4-wire
Reactive power
(Note 2) Apparent power Power factor (Note 2)
Computation
range
Display
resolution
Rated value depends on V
and A ranges.
Rated value depends on V
and A ranges.
Internal computation only;
data not displayed or saved.
Same as for active power.
dt
dt
dt
Single-phase 3-wire, three-phase 3-wire
Three-phase 4-wire
(t), i(t): Input signals
T: One period for input signal
P= i
P = P1 + P2
P = P1 + P2 + P3
Note 1: In the case of distorted waves, there may be differences from other measuring instruments that are based
on different measurement principles.
Note 2: The polarity of each phase determined by the reactive power meter method is multiplied and the polarity
is displayed.
Note 3: In the case of three-phase 3-wire and unbalanced inputs, there may be differences from other measuring
instruments that are based on different measurement principles, or wiring.
Equations
Specifications
16
Inputs
Input type
Rated value
(range)
Wiring
Input
resistance
Maximum allowed
input
A/D converter
CW120
CW121
CW120
CW121
Resistive potential division
150/300/450 V
Single-phase 2-wire, single-phase 3-wire, three-phase 3-wire
Single-phase 2-wire, single-phase 3-wire, three-phase 3-wire, three-phase 4-wire
Approximately 1.5 MΩ
Approximately 1.3 MΩ
495 Vrms
Voltage/current input simultaneous conversion, 12-bit resolution
Voltage (V)Parameter
Current (A)
Clamp detection
Clamp 96033: 5/10/20/50 A
Clamp 96030: 20/50/100/200 A
Clamp 96031: 50/100/200/500 A
Clamp 96032: 200/500/1000 A
Approximately 100 kΩ
Clamp 96033: 130 Arms
Clamp 96030: 250 Arms
Clamp 96031: 625 Arms
Clamp 96032: 1000 Arms
Measurement Input functions
Parameter
Method
Frequency range
Crest factor
Active input range
Display
range
Temperature coefficient
Display updating interval
Instantaneous Value Measurement
•Measurement parameters: Voltage rms (V), current rms (A), active power (W), frequency
•Measurement accuracy (at power factor 1, including clamp)
Voltage: ±(0.3% rdg + 0.2% rng)
Current/active power: ±(0.8% rdg + 0.4% rng) when using clamps 96030, 96031, and
Frequency: ±(0.1% rdg + 1% dgt)
•Computation parameters: Reactive power (Var), power factor
•Computation accuracy: (value calculated from measurement) ±1 dgt
•Power factor influence: ±1.0% rng cosø = ±0.5 (relative to power factor 1) when using
Digital sampling
45–65 Hz (reciprocal system), detected from V1
150/300 V range
450 V range
10–110% of each range
All ranges 1.5 V
Lower limit
130% of each range, except 110% for 450 V range
Upper limit
±0.05% rng/˚C
Approximately one second
•Reactive factor influence: ±1.0% rng sinø = ±0.5 (relative to reactive factor 1) when using
Voltage Current/active power
Rated input: 2
Rated input: 1.56
Rated input: 3
0.4% of each range
130% of each range
±0.07% rng/˚C (including clamp)
(Hz)
96033
±(1.2% rdg + 0.8% rng) when using clamp 96032
clamp 96030
±2.0% rng cosø = ±0.5 (relative to power factor 1) when using
clamps 96031, 96032, and 96033
clamp 96030
±2.0% rng sinø = ±0.5 (relative to reactive factor 1) when using
clamps 96031, 96032, and 9603
Electric Energy Measurement
•Measured parameters:
Active electric energy, regenerative electric energy (regenerative electric energy is not displayed
on the screen; it is merely saved)
•Measurement accuracy: Active power measurement accuracy ±1 dgt (with standard settings)
•Integration function settings
Start/stop settings: Manual, timer, external trigger (control)
Output intervals: 1/2/5/10/15/30 seconds; 1/2/5/10/15/30 minutes; 1 hour
•Displayed digits:
This is set automatically based on the rated power, and the minimum resolution can be set
Saving items
•Saving items:
Voltage, current, active power, reactive power, power factor, frequency, active electric energy,
regenerative electric energy
Display Functions
•Display screen: Backlit segmented LCD
•Maximum number of displayed digits
Electric energy: 6 digits
Other parameters: 4 digits
•Range makeup: (rated values)
Voltage
150.0V
300.0V
450.0V
Wiring
1ø2W
1ø3W
3ø3W
3ø4W
1ø2W
1ø3W
3ø3W
3ø4W
1ø2W
1ø3W
3ø3W
3ø4W
5.000 A
750.0 W
1.500 kW
1.500 kW
2.250 kW
1.500 kW
3.000 kW
3.000 kW
4.500 kW
2.250 kW
4.500 kW
4.500 kW
6.750 kW
10.00 A
1.500 kW
3.000 kW
3.000 kW
4.500 kW
3.000 kW
6.000 kW
6.000 kW
9.000 kW
4.500 kW
9.000 kW
9.000 kW
13.50 kW
Clamp 96033
20.00 A
3.000 kW
6.000 kW
6.000 kW
9.000 kW
6.000 kW
12.00 kW
12.00 kW
18.00 kW
9.000 kW
18.00 kW
18.00 kW
27.00 kW
50.00 A
7.500 kW
15.00 kW
15.00 kW
22.50 kW
15.00 kW
30.00 kW
30.00 kW
45.00 kW
22.50 kW
45.00 kW
45.00 kW
67.50 kW
Clamp 96030
100.0 A
15.00 kW
30.00 kW
30.00 kW
45.00 kW
30.00 kW
60.00 kW
60.00 kW
90.00 kW
45.00 kW
90.00 kW
90.00 kW
135.0 kW
Clamp 96031
200.0 A
30.00 kW
60.00 kW
60.00 kW
90.00 kW
60.00 kW
120.0 kW
120.0 kW
180.0 kW
90.00 kW
180.0 kW
180.0 kW
270.0 kW
Clamp 96032
500.0 A
75.00 kW
150.0 kW
150.0 kW
225.0 kW
150.0 kW
300.0 kW
300.0 kW
450.0 kW
225.0 kW
450.0 kW
450.0 kW
675.0 kW
1.000 kA
150.0 kW
300.0 kW
300.0 kW
450.0 kW
300.0 kW
600.0 kW
600.0 kW
900.0 kW
450.0 kW
900.0 kW
900.0 kW
1.350 MW
Page 17

Communication Functions
•Electrical specifications: Conforms to EIA RS-232 or EIA RS-485.
•Protocols: CW120/121 proprietary protocol, Power Monitor protocol
•Synchronization system: Start stop synchronization
•Baud rates: 1200, 2400, 4800, 9600, 19200, 38400 bps
PC card interface
•Slot: PC card slot TYPE II
•Compatible card: ATA flash memory card
•Function specifications: Saving measurement data, saving and reading settings data
Faulty Wiring Checking Functions
•Check details:
Presence/absence of power input; check for frequency measurement range; voltage phase
sequence;
presence/absence of power input; whether current clamp is reverse-connected
Scaling Function
The VT ratio and CT ratio can be set.
•Settings ranges VT ratio: 1–10,000
External Control I/O (for RS-232 only; not provided for RS-485)
These input and output can be used as signals for starting and stopping integrating measurement.
•Control input: TTL level or contact
•Control output: TTL level
Other Functions
Clock (typical precision: ±100 ppm), key lock, system reset
General Specifications
•Environmental requirements: Indoor usage at an altitude of 2000 meters or less.
•Usage temperature and humidity ranges:
•Storage temperature and humidity ranges:
•Insulating resistance:
500 V DC, 50 MW or greater
Between voltage input terminals and case
Between voltage input terminals and current input terminals, communication terminals, and control
I/O terminals
Between power line and case
Between power line and current input terminals, communication terminals, and control I/O
terminals
•Insulating withstand voltage:
5550 V AC for one minute
Between voltage input terminals and case
3320 V AC for one minute
Between voltage input terminals and current input terminals, communication terminals, and
control I/O terminals
2300 V AC for one minute
Between power line and case
Between power line and current input terminals, communication terminals, and control I/O
terminals
•Power supply: 100–240 V AC ±10%, 50/60 Hz
•Consumed power: 8 VA maximum
•External magnetic field effects: Within accuracy levels at 400 A/m
•External dimensions: Approximately 117 ҂ 161 ҂ 51 mm (W ҂ H ҂ D)
•Weight: Approximately 0.6 kg
•Terminals:
Voltage input CW120: 3 terminals Banana terminals (safety terminals)
Current terminals CW120: 2 pairs Banana terminals (safety terminals)
(H/L) CW121: 3 pairs Banana terminals (safety terminals)
External control I/O 3 terminals (H/L/H) Screwless terminals
terminals RS-485 4 terminals (+/-/SG/TM) M3 screw terminals
•Connectors:
RS-232: Mini DIN 8-pin
AC power supply: 2-pin
•Accessories:
Voltage input probes: 3 for CW120, 4 for CW121
Power cord, user's manual, operation guide, Toolbox (setting software)
•Safety standards:
Compliant with EN61010-1, EN61010-2-031, UL3111-1 First Edition, CAN C22.2 No. 1010.1-92
–Voltage input line
Measurement (Overvoltage) category III (Max. input voltage : 600 Vrms)
– Power line
Installation category II (Max. input voltage : 264 Vrms)
Pollution degree 2
•EMC (emission):
Compliant with EN55011, Group1, ClassA; EN61326; EN61000-3-2; EN61000-3-3
•EMC (immunity):
Compliant with EN61326
(Standard protocol used for YOKOGAWA M&C's Power
Monitor)
PC link communication (Standard protocol used for
YOKOGAWA M&C’s Temperature Controllers)
MODBUS communication (ASCII or RTU)
CT ratio: 1–10,000 (in increments of 0.01)
0–50°C, 5–85% RH (no condensation)
0–40°C, 5–85% RH (no condensation) for UL, C-UL
-20–60°C, 90% RH (no condensation)
CW121: 4 terminals Banana terminals (safety terminals)
CW240
CW120 AP240E
17
Page 18

CW240 Model and Suffix Code
93020
CW240 main unit can be packed in the
carrying case with accessories like
current clamps and voltage probes,
without disconnecting them from the
main unit. It also holds the other
accessories.
To prevent error connection of clamp
probes.
Carrying case Protective Cover
91022
●Model name and suffix code
Model (Part No.)
CW240
Suffix code Option code
-D
-F
-H
-R
-S
Power Cord (UL/CSA Standard)
Power Cord (VDE Standard)
Power Cord (GB Standard)
Power Cord (SAA Standard)
Power Cord (BS Standard)
Description
●CW240 selection list for clamps
Notes for selecting type of clamp probesNumber of clampsAim wiring to measure
1phase2wire1load
1phase2wire2load
1phase2wire3load
1phase2wire4load
1phase3wire1load
1phase3wire2load
3phase3wire1load
3phase3wire2load
3phase3wire1load3currents
3phase4wire
Scott wiring
Standard accessories comes with main unit
91007 Voltage probes, AC adapter x1, AA size alkaline battery x6, ToolBox240(CD-ROM) x1,
User's Manual x1/CD-ROM version x1, Quick Manual x 1/CD-ROM version x1,
Communication function manual(CD-ROM) x1
1
2
3
4
2
4
2
4
3
3
4
Different clamps are selectable.
Same clamps must be selected.
Same clamps must be selected for each load.
Same clamps must be selected.
Same clamps must be selected for each load.
Same clamps must be selected.
Same clamps must be selected.
Same clamps must be selected.
●Accessories
Voltage probes (4 pcs/set)
NiMH battery pack
Memory Card (256MB)
Memory Card (512MB)
Memory Card (2GB)
Printer
AC adapter (for printer, Europe)
AC adapter (for printer, USA)
Thermal paper for printer (10 rolls)
AC adapter for 96035
CW viewer
91007
94004
97034
97035
97037
97010
94006
94007
97080
94013
B9108WB
AP240E
DescriptionModel No.Name
256MB CF with PC Card Adapter
512MB CF with PC Card Adapter
2GB CF with PC Card Adapter
Power Supply 200-240 VAC
Power Supply 100-120 VAC
For AC 120V
For AC 220-240V
18
CW120 Models and Suffix code
●Model name and suffix code
Model (Part No.)
CW120
CW121
Power cord
Communication
Suffix code Option code
-D
-F
-H
-R
-S
-1
-2
Three-phase 3-wire
Three-phase 4-wire
AC power cord (UL/CSA Standard)
AC power cord (VDE Standard)
AC power cord (GB Standard)
AC power cord (SAA Standard)
AC power cord (BS Standard)
RS-232 communication interface
RS-485 communication interface
●CW120/CW121 selection list for clamps
1phase2wire1load
1phase2wire2load
1phase2wire3load
1phase3wire1load
3phase3wire1load
3phase4wire
1
2
3
2
2
3
●Accessories supplied at no extra cost
Product Name Part No.
1. Power cord
2. Voltage probes (for CW 120)
Voltage probes (for CW 121)
3. User's Manual
4. Operation Guide
91018
91007
IM CW120-E
IM CW-120P-E
Description
Notes for selecting type of clamp probesNumber of clampsAim wiring to measure
Same clamps must be selected.
Same clamps must be selected.
Same clamps must be selected for CW121.
Same clamps must be selected.
Same clamps must be selected.
Same clamps must be selected for CW121.
Qty
1
3
4
1
1
●Accessories
Carrying case
CW120 main unit can be
packed in the carrying
case with accessories
like the current clamps
and voltage probes.
It also holds the other
accessories.
Power cable Printer
This cable supplies power from a
measurement circuit. length 1.5m
*Not applied to CE and UL.
Voltage probe
Voltage probe
Communication cable
Printer cable
Memory Card (256MB)
Memory Card (512MB)
Memory Card (2GB)
Printer
AC adapter (for printer, Europe)
AC adapter (for printer, USA)
Printer thermal paper
AC adapter for 96035
CW viewer
Includes magnet
and stand
91007
91018
91011
91010
97034
97035
97037
97010
94006
94007
97080
94013
B9108WB
AP240E
Main unit case
Portable case
9302393022 93024
98030 97010
DescriptionModel No.Name
Four per set
Three per set
RS232 communication cable for PC (9-pin)
RS232 printer cable, length 1.5 m
256MB CF with PC Card Adapter
512MB CF with PC Card Adapter
2GB CF with PC Card Adapter
Includes one roll of thermal paper and one battery pack
Power Supply 200-240 VAC
Power Supply 100-120 VAC
10 rolls
For AC 120V
For AC 220-240V
Page 19

Effective power supply quality and power saving management for PCs
CWViewer
Data Analysis Program for CW240/CW12x
AP240E report creation in line with your objectives.
Powerful & Accurate measurement
with the CW240
AP240E
CW240
CW120 AP240E
Increased quality and effectiveness of report creation
CW Viewer AP240E is data analyzing software for the CW240 Clampon Power Meter. Making full use of the rich measuring functions of the
CW240, this efficiently manages the large amounts of measurement
data that are required in order to implement power quality
management, energy management, and power saving measures.
Furthermore, the quality and efficiency of report creation has been
improved in order that reports to meet certain purposes can be easily
created.
Report creation in line with objectives
●Graph Display
●Daily Report Display, Weekly /
Monthly Report Display
●Harmonic Graph Display
Graph
●Harmonics Instant Value Display
●Waveform Data Display
●Voltage Change Display
19
Daily Report
Page 20

20
Report
Creation
Power quality and power saving management data measured with the CW240
AP240E report creation in line with your objectives
Increased quality and effectiveness of report creation
Bulk Data Management
In order to edit measurement data to create reports that meet objectives, it is necessary to sort the required elements
from a broad range of measurement data, and to set both the parameters for display, and items to display. CW Viewer
AP240E carries out bulk management of data by registering measurement data and display parameters. Easy data
registration, deletion, reference, and analysis means that the program is easy to use immediately, even for beginners.
●Bulk Management of Large Quantities of
Measurement Data
Using the AP240E, it is easy to register a large amount of data
measured with CW240 in the database, for integrated handling.
1 At the time of data registration, only the target files are displayed,
and detailed information can be confirmed by selecting these files.
2 Measurement data can be searched by measurement date or
group name.
3 Automatically links to measurement data such as that for
waveforms and voltage changes.
4 Group names and comments can be added and registered.
●Fast Reproduction of Past Reports
CW Viewer AP240E links display parameters for graphs and records with measurement data, and saves this in the
database, which means that reports that have been created in the past can be swiftly recreated in the same format.
Effective power supply quality and power saving management for PCs.
Registered
Data Details
1
2
3
dialog
4
Main screen
Simple Report Creation
Select measurement data, and click the Data Display button to edit reports. Settings of display items is easy, and items
such as graphs and daily reports are easy to create.
Simple Operation Clear Display
●Pick out target elements from large amounts of
data.
Items that can be selected when setting display items are displayed
in a list, which means that measurement data items that are required
for carrying out power management and power quality management
1
2
3
can be efficiently selected to meet objectives.
1Up to a maximum of 8 items can be set for both the left and right
axes.
4
Item Selection dialog
2 Display items, units, and scale, etc. can be selected from the list.
3 Desired maximum and minimum values for the graph scale can be set. Additionally, the Automatic Settings button
can be used to set optimal values.
4 This is also convenient for comparisons with power reduction targets, by setting standard values.
●Easy Setting of Focus Times
Setting the start and period of the focus times enables setting of a range of part (or all) of the measurement data.
1The display start time can be specified from the range of existing measurement data.
2 The specified display range can be moved easily using these
buttons.
3 The graph display period (the whole period or a desired period)
can be specified.
4 A desired range (more than the measurement cycle) can be
specified.
1
2
3
4
Focus Period settings
Page 21

Data Analysis Program
CWViewer
A
P
240EA
P
240E
Variety of Presentations in Line with Objectives
Report formats that can be selected as a result of the types of measurement data are displayed on tabs. Report formats
in line with objectives can be easily selected with tabs from a variety of report presentations.
●Selection of Report Formats with Tabs
Report formats such as graph display, daily report display,
harmonics graph and voltage change can be easily switched by
selection with tabs.
Superimposed Display of Multiple Waveforms
A channel, system, and type can be selected for each
measurement item such as power, voltage, and current, and up to
8 items can be simultaneously displayed on the graph for each of
the left and right vertical axes (a total of 16 items). This enables
the comparative display per channel and system of multiple data
items.
●Easy-to-see Graph Display
Graph display can be changed (line type, line thickness, and line
color, markers, etc.) in line with objectives, and multiple
measurement data can be displayed on the report in an easy to see
manner.
●Harmonics Data Analysis
Harmonics graphs are displayed by selecting the desired degree
from amongst 50. Harmonics trend graphs and harmonics instant
value graphs can be selected with tabs, and in the harmonics
instant value tab, all harmonics levels, harmonics content ratios,
and phase differences can be displayed. Vector display of power
phase differences is also possible.
●Waveform Data Display
Displays as a graph waveform data (maximum of 7 for each of
four systems) measured with the CW240. Irregularities in voltage
and current waveforms for each phase can be viewed at a glance,
making for effective management of electrical power quality
(current situation and confirmation of measures taken).
Graph Display
Harmonics Trend Display Harmonics Instant
Power Phase Difference
Vector Diagram Display
Val ue Display
Waveform Display
Tab Selection
CW240
CW120 AP240E
21
One-Touch Selection of Daily and Weekly Reports
●Daily Report Display
Demand measurement values for power consumption are
displayed in time units (30 minutes or 1 hour) as daily reports,
simply by selecting the desired demand measurement items.
Furthermore, load and demand ratio calculations are carried out
automatically by setting capacitance values for facilities.
●Weekly and Monthly Report Display
Demand measurement values for power consumption in 1 day
units are displayed as weekly and monthly reports. Load and
demand ratio calculations are carried out automatically in the
same way as with daily reports.
●Voltage Change Display
Displays in a list voltage drops, rises, and momentary power
interruption detection data and detection time. This enables
confirmation of the start, end, and period of voltage changes.
●Record Display
When the graph display, harmonics trend display, and harmonics
instant value display tabs have been selected, numerical data for
the displayed graph range can be displayed as a record.
Daily Report Display
Voltage Change Display
Records Display
Page 22

Report
AP240E Analysis Data can be Further Edited in MS Excel and Word
Creation
Report Creation Customization Functions
●Graph and Record Printing
Print graphs and records by using the Print buttons on the graph
display screen and records screen. Additionally, when printing, the
preview screen will allow confirmation of output.
●Selectable Printer Type
Printer configuration is possible in order that either color or
monochrome are printed correctly.
Effective power supply quality and power saving management for PCs.
Print Preview
22
●Graph Copy
The portion of the graph on the displayed screen can be copied to the
clipboard by using the Graph Copy button on the graph screen. This
enables graph images that are created in CW Viewer AP240E to be
pasted into Excel or Word documents. Power phase difference vector
diagrams and waveform data are also handled in the same way.
●Record Copy
By using the Record Copy button in the same way as with graphs,
record data can be copied to the clipboard. Record data is copied as
text data.
●Saving Record Data as CSV Format Files
The range of data displayed on the daily report, monthly report, and
record screens can be saved as CSV format files. CSV files can be used
in spreadsheet software; this is convenient for secondary analysis of
measurement data, and creation of original reports.
Useful Functions
●Analog Input Data
Scaling for analog input data settings, and unit settings can be carried
out. This enables comparison of measurement data such as
temperature and lighting density with data such as used energy.
●Voltage Unbalance Ratio Display
Automatically measures voltage unbalance ratios when CH1 ~ CH3
voltage is measured, and can display as a graph in the same way as
with other measurement data items.
●Default Settings
Frequently used unit settings, graph display parameter settings, and
group name settings, etc. can be registered as defaults in advance.
●Display Settings / Measurement Parameter Display
Settings parameters and measurement intervals, etc. at the time of
measurement are displayed on the top of the tabs on the data display
screen, enabling constant confirmation by selecting tabs even if the
report format is changed.
Pasting Records
Example of Copying Graphs and Records
Scaling Settings
Default Settings
Measurement Parameter Display
Pasting Graphs
Page 23

AP240E Specifications
Data Analysis Program
CWViewer
A
P
240EA
P
240E
CW240
Data Management
•Display of measurement parameters when
measurement data is registered.
•Registration in the database of measurement date,
measurement parameters, group names, and
comments added to measurement data possible.
•Bulk management of data such as harmonics data,
waveform data, and voltage change data.
•Editing of data names, comments, and group names
possible.
•Searching by measurement dates / periods, and group
names possible.
•Saving of settings information at the time the report
was displayed, and that corresponds to data.
•Setting of defaults for a range of settings data
possible.
Data Display Selection
•Always display measurement parameters on the data
display screen.
•Selection by the use of tabs to select report displays
(graph display, daily report display, weekly / monthly
report display, harmonic graph display, harmonics
instant value display, waveform data display, voltage
change display) possible.
Graph Display
•Graph display of up to 8 items on each of the left and
right axes possible.
•Selection of display items an ordered list possible.
•Settings of units, decimal points, minimum values, and
maximum values, as well as automatic adjustment for
each of the left and right axes possible.
•Graph customization (line type, line thickness marker,
color) possible.
•Setting of the graph display period (focused time,
period, measurement cycle) possible.
•Movement of the graph display period possible.
•Graph interpolation of non-measured segments
possible.
Daily Report Display, Weekly / Monthly Report Display
•Displays the daily report, and weekly / monthly report
tabs where there is demand measurement data.
•Displays selected demand measurement values per
time (or date).
•Selection of display intervals for daily report display
(1 hour / 30 minutes) possible.
•Can set the equipment capacity, and automatically
calculate load ratios and demand ratios.
Harmonic Graph Display
•Displays the harmonics graph tab where there is
harmonics measurement data.
•Selection of degree data up to a maximum of 50
degrees possible.
Harmonics Instant Value Display
•Displays the harmonics graph tab when there is
harmonics measurement data.
•Selection of degrees of up to 50 possible.
•Display of power phase difference vector diagrams
possible.
Waveform Data Display
•Displays the waveform data tab when there is
waveform data.
•Display of selected waveform data.
Voltage Change Display
•Displays the voltage change data tab when there is
voltage change detection data.
•Displays voltage change data per detection time.
•Selection of display items (voltage dip, voltage swell,
detected momentary power interruptions) possible.
Package contents
Contents
AP240E installation CD
User registration card
1
1
CW120 AP240E
23
Page 24

Common Accessories for CW120/121 and CW240
Item
Measuring range
Output voltage
Accuracy
Output impedance
External magnetic
field effects
Conductor position
effects
Operating circuit voltage
External dimensions
Weight
Output cable length
Amplitude
Phase
96031 Clamp-on Current Probe
0–500 Arms AC (750 Apk)
0–0.5 Vrms AC (1 mV/A)
±1.5% rdg ±0.4 mV (20 Hz to 45 Hz)
±0.5% rdg ±0.1 mV (45 Hz to 66 Hz)
±0.8% rdg ±0.2 mV (66 Hz to 1 kHz)
±1.0˚ (45 Hz to 1 kHz)
Approx. 2.4 Ω
0.2 A equivalent or less (at 400 A/m, 50/60 Hz)
±0.5% (at 50–500 A, 45 Hz to 1 kHz)
96032 Clamp-on Current Probe
0–700 Arms AC (990 Apk)
1000 Arms (1414 Apk) for 5 minutes
0–0.25 Vrms AC (0.25 mV/A)
±1.0% rdg ±0.2 mV (45 Hz to 66 Hz)
±1.0˚ (50 A or more, 45 Hz to 66 Hz)
Approx. 100 Ω (max.)
0.5 A equivalent or less (at 400 A/m, 50/60 Hz)
±0.5% (at 200–1000 A, 45 Hz to 66 Hz)
Approx. 100 (W) × 172.5 (H) × 32 (D) mm
Approx. 500 g
96033 Clamp-on Current Probe
0–50 Arms AC
0–0.5 Vrms AC (10 mV/A)
±1.0% rdg ±0.3 mV (20 Hz to 45 Hz)
±0.5% rdg ±0.1 mV (45 Hz to 66 Hz)
±0.8% rdg ±0.2 mV (66 Hz to 1 kHz)
±1.0% rdg ±0.3 mV (1 kHz to 5 kHz)
±3% rdg ±0.4 mV (5 kHz to 20 kHz)
±1.0˚ (45 Hz to 1 kHz)
Approx. 18 Ω
0.1 A equivalent or less (at 400 A/m, 50/60 Hz)
±0.5% (at 1–50 A, 45 Hz to 1 kHz)
300 Vrms AC max.
Approx. 52 (W) × 106 (H) × 25 (D) mm (excluding protrusions)
Approx. 220 g
96036Clamp-on Current Probe
0–2Arms AC (20Apk)
0–0mVrms AC (25mV/A)
±1.5%rdg±0.04mV (20Hz–45Hz)
±0.5%rdg±0.01mV (45Hz–66Hz)
±0.8%rdg±0.02mV (66Hz–1kHz)
±2%rdg±0.04mV (1kHz–5kHz)
±2° (45Hz–3.5kHz)
Approx.70Ω
2mA equivalent or less
(at 400A/m, 50/60Hz)
±0.5% (at 0.2–2A, 45Hz–1kHz)
50Vrms AC max.
Approx.70(W)⫻120(H)⫻25(D)mm
Approx.300g
96030 Clamp-on Current Probe
0–200 Arms AC (300 Apk)
0–0.5 Vrms AC (2.5 mV/A)
±1.5% rdg ±0.4 mV (20 Hz to 45 Hz)
±0.5% rdg ±0.1 mV (45 Hz to 66 Hz)
±0.8% rdg ±0.2 mV (66 Hz to 1 kHz)
±2.0% rdg ±0.4 mV (1 kHz to 20 kHz)
±0.5˚ (45 Hz to 1 kHz)
(for temperature of 23˚C ±5˚C, relative humidity of 35–75%, and sine wave input)
Approx. 6 Ω
0.1 A equivalent or less (at 400 A/m, 50/60 Hz)
±0.5% (at 20–200 A, 45 Hz to 1 kHz)
600 Vrms AC max.
Approx. 73 (W) × 130 (H) × 30 (D) mm
Approx. 300 g
Approx. 3 meters
External Dimensions
Item
Range type
Measuring range
Output voltage
Accuracy
(for temperature
of 23˚C ±5˚C,
relative humidity
of 20–70%, and
sine wave input)
Maximum
allowable current
(600 Hz or less)
Output impedance
External magnetic
field effects
Conductor position
effects
Operating circuit
voltage
Measurable
conductor diameter
External dimensions
Weight
Output cable length
Output terminal
Power supply
Amplitude
Phase
±1% rdg +0.045 mV (1–20 A)
1200 Arms AC (continuous)
1000 A
0–1000 Arms AC
0–0.5 Vrms AC (0.5 mV/A)
±1% rdg (20–1200 A)
Not specified (1–20 A)
±1.0˚ (20–200 A)
±0.5˚ (200–1200 A)
ø64 × 100 mm, five 125 × 5 mm bus bars, or three 100 × 10 mm bus bars
96034 Clamp-on Current Probe
2000 A
0–2000 Arms AC
0–0.5 Vrms AC (0.25 mV/A)
±1% rdg +0.0225 mV (1–20 A)
±1% rdg (20–2400 A)
Not specified (1–20 A)
±1.0˚ (20–200 A)
±0.5˚ (200–2400 A)
2400 Arms AC (continuous)
2 Ω or less
1% +0.2 A or less
600 Vrms AC max.
Approx. 310 (W) × 120 (H) × 48 (D) mm
Approx. 1400 g
3000 A
0–3000 Arms AC
0–0.5 Vrms AC (0.1667 mV/A)
±1% rdg +0.015 mV (1–20 A)
±1% rdg (20–3600 A)
Not specified (1–20 A)
±1.0˚ (20–200 A)
±0.5˚ (200–3600 A)
2400–2800 Arms AC (for 15 minutes)
2800–3600 Arms AC (for 10 minutes)
±0.1% of full scale (at 400 A/m, 50/60 Hz)
Approx. 3 meters
Banana plug (safety terminal)
96035 Clamp-on Current Probe
3000 A
0–3000 Arms AC
0–0.5 Vrms AC (0.1667 mV/A)
±1% rdg (5–3000 A, 45 Hz to 66 Hz)
±3% rdg (100 A, 10 Hz to 10 kHz)
±1˚ (5–3000 A, 45 Hz to 66 Hz)
±4˚ (200 A, 40 Hz to 1 kHz)
3600 Arms AC (10 Hz to 1 kHz)
±2% of full scale
Main unit: 600 Vrms AC max.
Measuring unit: 1000 Vrms AC max.
ø170 mm max.
Main unit: Approx. 140 (W) × 64 (H) × 28 (D) mm
Measuring unit: Approx. 610 mm
Main unit: Approx. 300 g (including battery and output cable)
Measuring unit: Approx. 180 g
9 V alkaline battery (6LF22) AC Adapter
Continuous measurement: 150 hours
Intermittent measurement: 10,000 times
0–0.5 Vrms AC (1.667 mV/A)
±1% rdg (5–300 A, 45 Hz to 66 Hz)
±5% rdg (100 A, 10 Hz to 10 kHz)
±1˚ (5–300 A, 45 Hz to 66 Hz)
±7˚ (200 A, 40 Hz to 1 kHz)
Approx. 47 Ω
300 A
0–300 Arms AC
360 Arms AC
96030,31
96034
unit: mm unit: mm unit: mm
100
24.7
73
30
130
86
57
60
unit: mm unit: mm unit: mm
12048
310
66
71
30
Air-core
Length: approx. 610mm
Weight: approx. 180g
140
Box Weight: approx. 300g
(including a battery and output cable)
172.5
3000
64
28
9603396032
9603696035
World Wide Web site at
http://www.yokogawa.com/ymi
YOKOGAWA METERS & INSTRUMENTS CORPORATION
International Sales Dept.
YOKOGAWA CORPORATION OF AMERICA (U.S.A.) Phone: +1-770-253-7000 Facsimile: +1-770-254-0928
YOKOGAWA EUROPE B. V. (THE NETHERLANDS) Phone: +31-88-4641000 Facsimile: +31-88-4641111
YOKOGAWA ENGINEERING ASIA PTE. LTD. (SINGAPORE)
YOKOGAWA AMERICA DO SUL LTDA (BRAZIL) Phone: +55-11-5681-2400 Facsimile: +55-11-5681-4434
YOKOGAWA MEASURING INSTRUMENTS KOREA CORPORATION (KOREA)
YOKOGAWA AUSTRALIA PTY. LTD. (AUSTRALIA) Phone: +61-2-8870-1100 Facsimile: +61-2-8870-1111
YOKOGAWA INDIA LTD. (INDIA) Phone: +91-80-4158-6000 Facsimile: +91-80-2852-1441
YOKOGAWA SHANGHAI TRADING CO., LTD. (CHINA) Phone: +86-21-6239-6363 Facsimile: +86-21-6880-4987
YOKOGAWA MIDDLE EAST B. S. C.(C) (BAHRAIN) Phone: +973-17-358100 Facsimile: +973-17-336100
YOKOGAWA ELECTRIC CIS LTD. (RUSSIAN FEDERATION)
Subject to change without notice.
All Rights Reserved. Copyright © 2002, Yokogawa Meters & Instruments Corporation.
Tachihi Bld. No.2, 6-1-3 Sakaecho, Tachikawa-shi, Tokyo, 190-8586 Japan
Phone: +81-42-534-1413 Facsimile: +81-42-534-1426
Phone: +65-6241-9933 Facsimile: +65-6241-2606
Phone: +82-2-551-0660 Facsimile: +82-2-551-0665
Phone: +7-495-737-7868 Facsimile: +7-495-737-7869
[Ed: 11/b] Printed in Japan: Mar. 2011(C)/5,000(KP)
106
69
255240
ø40
120
40
25
55.6
NOTICE
● Before using the product, read the instruction manual
carefully to ensure proper and safe operation.
Represented by:
MIK-ES17
 Loading...