

Page 1

User ’s
Manual
AQ1210A, AQ1215A, AQ1210E,
AQ1215E, AQ1215F, AQ1216F
OTDR Multi Field Tester
IM AQ1210-01EN
2nd Edition
Page 2

Thank you for purchasing the AQ1210A, AQ1215A, AQ1210E, AQ1215E, AQ1215F, AQ1216F OTDR
(Optical Time Domain Reflectometer).
This user’s manual explains the features, operating procedures, and handling precautions of the
instrument. To ensure correct use, please read this manual thoroughly before operation. Keep this
manual in a safe place for quick reference.
The instrument comes with the following manuals. Please read all manuals.
Manual Title Manual No. Description
AQ1210A, AQ1215A, AQ1210E, AQ1215E,
AQ1215F, AQ1216F
OTDR Multi Field Tester
User’s Manual
AQ1210A, AQ1215A, AQ1210E, AQ1215E,
AQ1215F, AQ1216F
OTDR Multi Field Tester
Getting Started Guide
AQ1210A, AQ1215A, AQ1210E, AQ1215E,
AQ1215F, AQ1216F
OTDR Multi Field Tester
Communication Interface User’s Manual
Model 739884 Battery Pack Handling
Precautions
AQ1210A, AQ1215A, AQ1210E, AQ1215E,
AQ1215F, AQ1216F
OTDR Multi Field Tester User’s Manual
IM AQ1210-01EN This document. A PDF file of the manual is
contained in the internal memory of the instrument.
The manual explains all the features and how to
use them. For viewing instructions, see page 15 in
the Getting Started Guide, IM AQ1210-02EN.
IM AQ1210-02EN This guide explains the handling precautions, basic
operations, and specifications of this instrument.
IM AQ1210-17EN A PDF file of the manual is contained in the internal
memory of the instrument. The manual explains the
communication interface features and instructions
on how to use them. For viewing instructions, see
page 15 in the Getting Started Guide, IM AQ121002EN.
IM 739884-01EN This document explains the handling precautions of
the battery pack.
IM AQ1210-92EN Document for China.
The “-EN” in the manual number is the language code.
Contact information of Yokogawa offices worldwide is provided on the following sheet.
Document No. Description
PIM 113-01Z2 List of worldwide contacts
Notes
• The contents of this manual are subject to change without prior notice as a result of continuing
improvements to the instrument’s performance and functions. The figures given in this manual may
differ from those that actually appear on your screen.
• Every effort has been made in the preparation of this manual to ensure the accuracy of its
contents. However, should you have any questions or find any errors, please contact your nearest
YOKOGAWA dealer.
• Copying or reproducing all or any part of the contents of this manual without the permission of
YOKOGAWA is strictly prohibited.
Trademarks
• Microsoft, Windows, and MS-DOS 10 are registered trademarks or trademarks of Microsoft
Corporation in the United States and/or other countries.
• Adobe, Acrobat, and PostScript are either registered trademarks or trademarks of Adobe Systems
Incorporated.
• Bluetooth is a registered trademark or trademark of Bluetooth SIG inc.
• In this manual, the ® and TM symbols do not accompany their respective registered trademark or
trademark names.
• Other company and product names are trademarks or registered trademarks of their respective
holders.
2nd Edition: April 2019 (YMI)
All Rights Reserved, Copyright © 2019, Yokogawa Test & Measurement Corporation
IM AQ1210-01EN
i
Page 3

Revisions
1st Edition: April 2019
2nd Edition: April 2019
ii
IM AQ1210-01EN
Page 4

Conventions Used in This Manual
Notes
The notes and cautions in this manual are categorized using the following symbols.
Improper handling or use can lead to injury to the user or damage to the
instrument. This symbol appears on the instrument to indicate that the user must
refer to the user's manual for special instructions. The same symbol appears
in the corresponding place in the user’s manual to identify those instructions.
In the manual, the symbol is used in conjunction with the word “WARNING” or
“CAUTION.”
WARNING
CAUTION
Calls attention to actions or conditions that could cause serious or fatal injury to
the user, and precautions that can be taken to prevent such occurrences.
Calls attention to actions or conditions that could cause light injury to the user or
damage to the instrument or user’s data, and precautions that can be taken to
prevent such occurrences.
French
AVERTISSEMENT
ATTENTION
Calls attention to information that is important for the proper operation of the
Note
Attire l’attention sur des gestes ou des conditions susceptibles de
Attire l’attention sur des gestes ou des conditions susceptibles
de provoquer des blessures graves (voire mortelles), et sur les
précautions de sécurité pouvant prévenir de tels accidents.
provoquer des blessures légères ou d’endommager l’instrument ou les
données de l’utilisateur, et sur les précautions de sécurité susceptibles
de prévenir de tels accidents.
instrument.
Symbols and Conventions Used in Procedural Explanations
The contents of the procedural explanations are indicated using the following symbols.
IM AQ1210-01EN
Procedure
Explanation
Carry out the procedure according to the step numbers. All procedures are
written under the assumption that you are starting operation at the beginning
of the procedure, so you may not need to carry out all the steps in a procedure
when you are changing the settings.
This section describes the setup items and the limitations regarding the
procedures. It may not give a detailed explanation of the feature. For a detailed
explanation of the feature, see chapter 1.
Character Notations
Panel Key Names and Button Names in Bold Characters
Indicate panel keys that are used in the procedure and buttons that appear on the screen.
Unit
k Denotes 1000. Example: 400 km
K Denotes 1024. Example: 400 KB (file size)
iii
Page 5

Contents
Conventions Used in This Manual ................................................................................................... iii
Chapter 1 Features
1.1 Overview .......................................................................................................................... 1-1
1.2 Optical Pulse Measurement (OTDR) ................................................................................ 1-6
1.3 Displaying Measured Data (OTDR) .................................................................................. 1-7
1.4 Analyzing Measured Data (OTDR) ................................................................................. 1-10
1.5 Pass/Fail Judgment (OTDR) .......................................................................................... 1-16
1.6 Utilities ............................................................................................................................ 1-17
1.7 Application ...................................................................................................................... 1-19
1.8 File Features .................................................................................................................. 1-28
1.9 System Features ............................................................................................................ 1-30
Chapter 2 Setting Up the OTDR Feature
2.1 Measurement (Measure) Conditions ................................................................................ 2-1
2.2 Analysis (ANALYSIS) Conditions ..................................................................................... 2-7
2.3 Display (OTDR) Conditions ............................................................................................ 2-13
2.4 File Conditions ................................................................................................................ 2-23
Chapter 3 Performing Real-time Measurement
3.1 Performing Real-time Measurement ................................................................................ 3-1
3.2 Measuring with Cursors .................................................................................................... 3-6
3.3 Cable Installation Completion Notification ........................................................................ 3-7
3.4 Rerouting Work............................................................................................................... 3-10
Chapter 4 Performing Averaged Measurements
4.1 Measuring in TRACE Mode .............................................................................................. 4-1
4.2 Measuring in MAP Mode .................................................................................................. 4-5
4.3 Performing Pass/Fail Judgments on Measured Results .................................................. 4-8
4.4 Saving Measured Data ................................................................................................... 4-10
Chapter 5 Analyzing Events
5.1 Analyzing in TRACE Mode ............................................................................................... 5-1
5.2 Analyzing in MAP Mode ................................................................................................. 5-13
Chapter 6 Analyzing Waveforms
6.1 Operating Cursors and Markers ....................................................................................... 6-1
6.2 Zooming In on or Out of Waveforms .............................................................................. 6-14
6.3 Displaying a Reference Trace ........................................................................................ 6-17
6.4 Analyzing Sections ......................................................................................................... 6-20
Chapter 7 Using the Utility Feature
7.1 Using the Light Source ..................................................................................................... 7-1
7.2 Using the Visible Light Source (/VLS option).................................................................... 7-6
7.3 Using the Optical Power Meter ....................................................................................... 7-10
7.4 Using the PON Power Meter (/PPM option) ................................................................... 7-23
7.5 Using the Power Checker (/PC option) .......................................................................... 7-29
7.6 Using the Fiber Inspection Probe (/FST option) ............................................................. 7-34
iv
IM AQ1210-01EN
Page 6
Contents
Chapter 8 Using the Application Feature
8.1 Displaying a Map of the Line Configuration and Events (OTDR Smart Mapper) ............. 8-1
8.2 Measuring a Multi-Core Optical Fiber Cable (Multi-Fiber Project) .................................... 8-8
8.3 Performing an Auto Loss Test (Auto Loss Test) .............................................................. 8-28
8.4 Performing a Multicore Loss Test (Multicore Loss Test) ................................................. 8-38
8.5 Performing Advanced Analysis (Advanced Analysis) ..................................................... 8-46
Chapter 9 Managing Data
9.1
9.2 Using the Instrument as a Mass Storage Device ............................................................. 9-2
9.3 Displaying the Data Management Buttons ....................................................................... 9-3
9.4 Saving and Loading Data ................................................................................................. 9-5
9.5 Creating Report Files ..................................................................................................... 9-10
9.6 Performing File Operations ............................................................................................ 9-14
Connecting USB Storage Device to the USB Ports ........................................................... 9-1
Chapter 10 System Setup
10.1 Displaying the System Setup Screen ............................................................................. 10-1
10.2 Using the Power Save Mode .......................................................................................... 10-3
10.3 Using the Network (LAN) ................................................................................................ 10-4
10.4 Using the WLAN Application .......................................................................................... 10-7
10.5 Specifying the Expiration Date ..................................................................................... 10-16
1
2
3
4
5
6
Chapter 11 Troubleshooting, Updating, and Storage
11.1
11.2 Error Message Display ....................................................................................................11-2
11.3 Viewing the Product Information......................................................................................11-5
11.4 Updating the Firmware ....................................................................................................11-7
11.5 Factory Default Settings ..................................................................................................11-9
11.6 Adding Options ..............................................................................................................11 -11
11.7 Mechanical Inspection and Operation Check ................................................................11-12
11.8 Routine Maintenance ....................................................................................................11-13
11.9 Storage Precautions ......................................................................................................11-15
Troubleshooting ................................................................................................................11-1
Appendix
Appendix 1 Using Open Source Software ............................................................................. App-1
Index
7
8
9
10
11
App
IM AQ1210-01EN
Index
v
Page 7
Chapter 1 Features
1.1 Overview
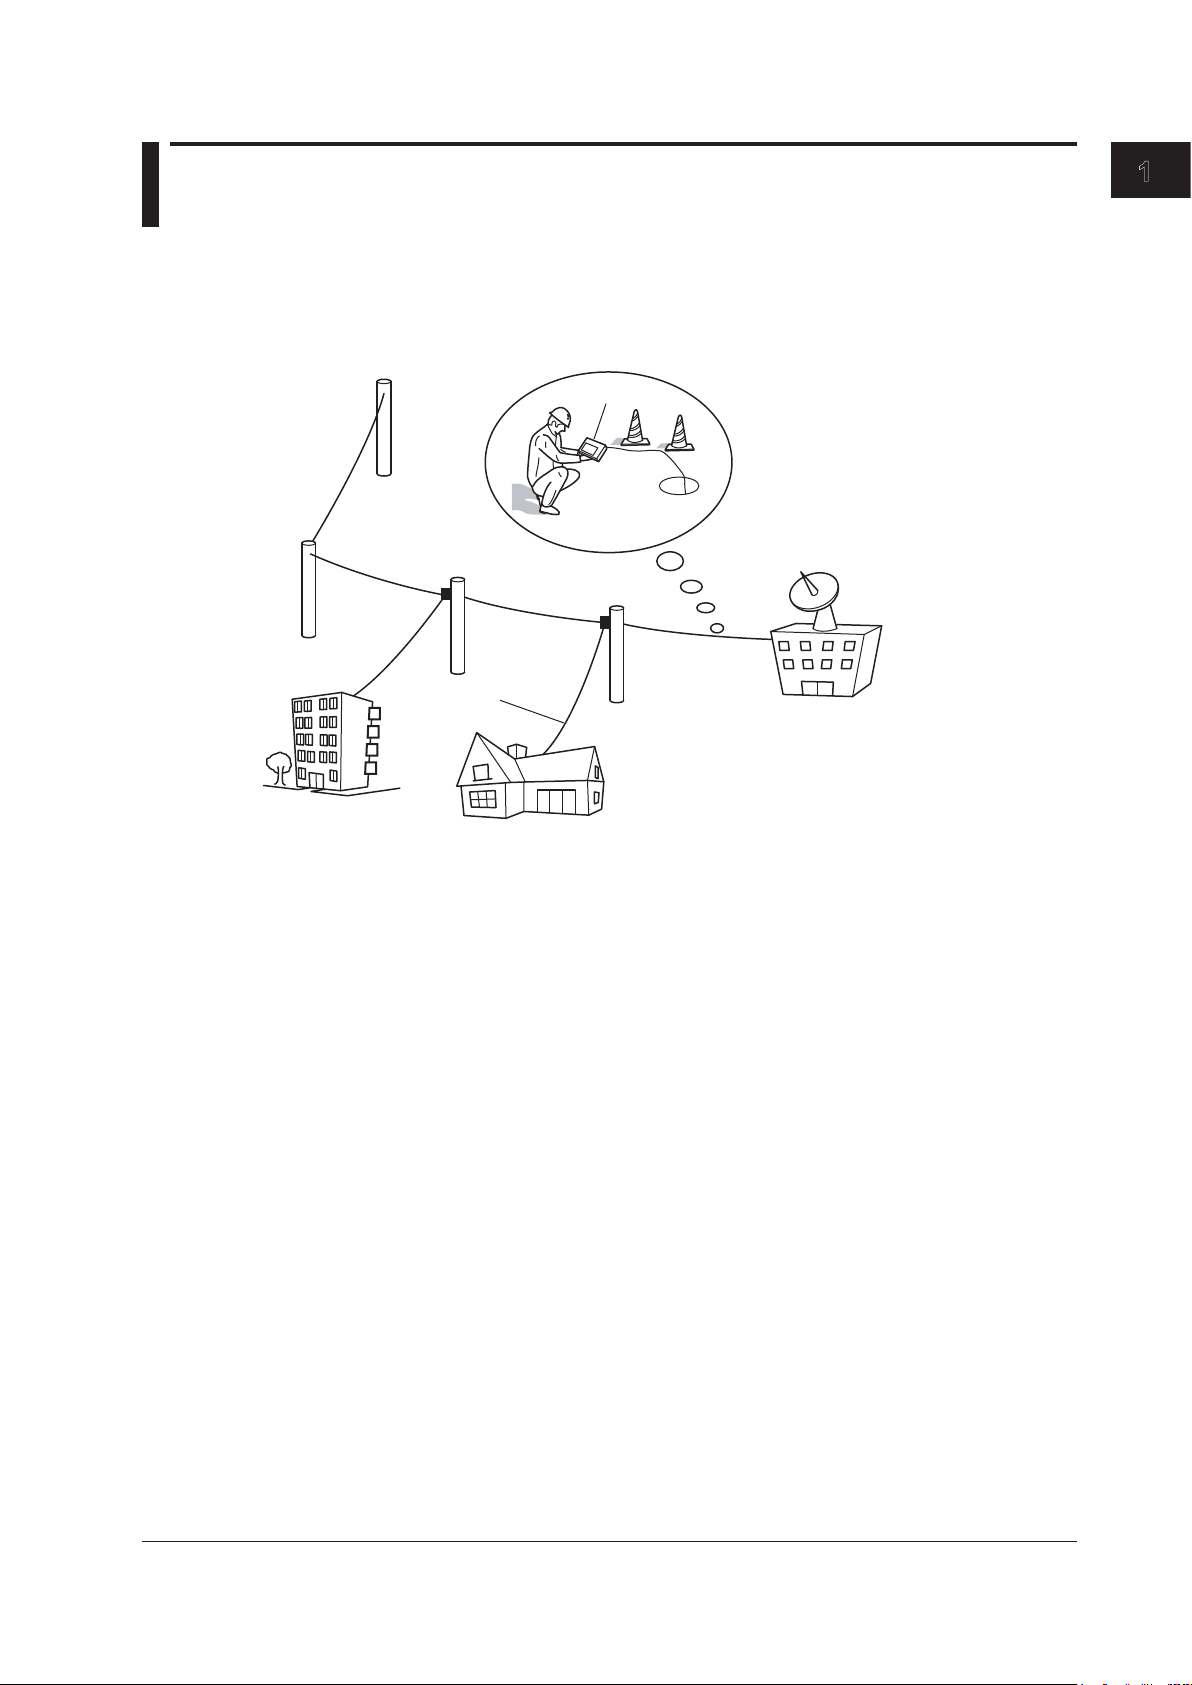
This instrument is an OTDR (Optical Time Domain Reflectometer) with the features listed below. It
is used in the optical fiber and line installation and maintenance servicing of access networks, which
link telephone exchanges and service providers with subscribers, and user networks, which enable
communication within a corporation or building.
Optical fiber cable
1
Features
AQ1210
Measurement
in cable
installations
Telephone
exchanges
Corporate user
Consumer
OTDR Features
OTDR stands for optical time domain reflectometer. The instrument displays waveforms (TRACE
mode) or icons (MAP mode) that you can use to detect fault locations in optical fiber cables and
monitor fault conditions (transmission loss, splice loss, etc.). It is mainly used in the following optical
fiber cable installation and maintenance situations.
• Access network connecting telecom carriers and subscribers, including service providers (SM
optical fiber cable)
• Network between telecom carriers
1 SM: Single mode
Optical Pulse Measurement
• Averaged Measurement (TRACE mode)
A measurement in which measurements are taken several times and the measured values are
averaged to display the waveform.
• Averaged Measurement (MAP mode)
After averaged measurement is performed, the OTDR waveform is automatically analyzed, and
the results are displayed using icons for each event type.
• Real-Time Measurement (TRACE mode)
While optical pulse measurement is in progress, measured values are updated and displayed as
a waveform in real time.
1
IM AQ1210-01EN
1-1
Page 8
Analysis results are displayed on
Analysis results are displayed as icons.
1.1 Overview
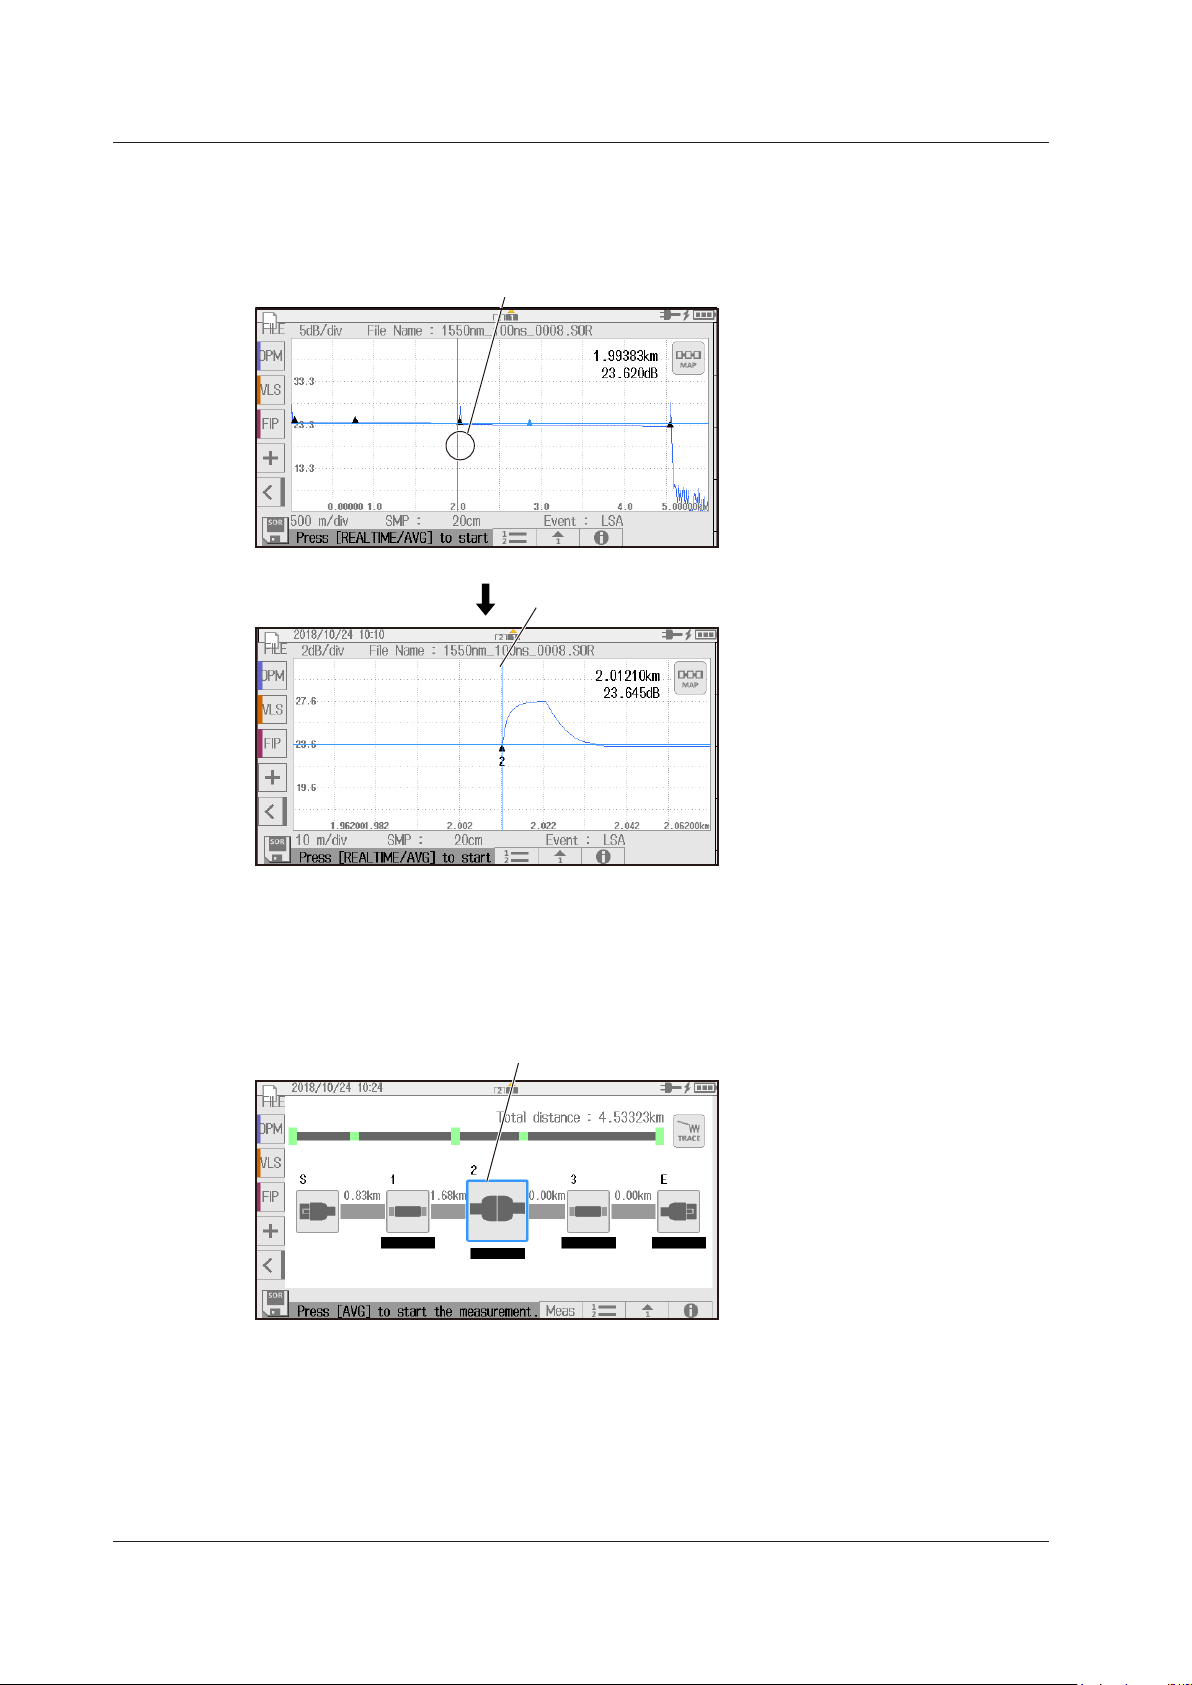
Optical Pulse Waveform Display (TRACE mode)
The results of optical pulse measurement is displayed as a waveform. The displayed waveform can
be zoomed and moved.
the waveform as events.
Zoom the waveform at the cursor position
Event Icon Display (MAP mode)
The instrument can perform an averaged measurement and then automatically display the
measured result events as icons on the screen. In addition, if pass/fail judgment conditions are
specified, judgment results are displayed with icon colors. For details on the pass/fail judgment
function, see section 1.5.
Optical Pulse Analysis
• Waveform Analysis
The following events can be analyzed using cursors and markers.
• Distance
• Splice loss
• Return loss
Return loss between markers can be analyzed.
1-2
IM AQ1210-01EN
Page 9

1.1 Overview
• Event Analysis
Events are automatically detected. In addition, you can edit events. Adjustments can be made
when certain events cannot be detected or when noise is detected as events.
USB Feature
Connecting USB Storage Devices, Communication Dongles, and Fiber Inspection
Probes (Type A)
USB storage devices complying with USB1.0/1.1/2.0 can be used. Up to two devices can be
connected. You can save waveform data and measurement conditions to USB memory devices.
By using a communication dongle (LAN, WLAN), you can remotely control the instrument over a
network and transfer measured waveform data to an external server. You can connect a probe that
is used in Fiber Inspec Probe, which is an application of this instrument. For the recommended
communication dongles that can be used with this instrument, contact your nearest YOKOGAWA
dealer.
Connecting to a PC (Type C)
The instrument can be accessed as a mass storage device from a PC, and the files and folders
in the internal memory can be displayed and manipulated. You can also connect a PC to the
instrument and control it using communication commands. For details, see the communication
interface user’s manual, IM AQ1210-17EN.
Utility Features (simultaneous use of multiple functions)
On the OTDR screen, you can call up optical power meter, visible light source, and other features and
measure optical power and the like simultaneously with the OTDR measurement. In a measurement
that takes a certain time to complete such as in an OTDR averaged measurement, measurement of
other fibers can be executed simultaneously to effectively use the measurement wait time and improve
work efficiency.
1
Features
Light Source Feature (utility)
Stabilized Light Source
This is used as a light source for measuring optical loss or as a light source for optical fiber
identification. The measurement light (CW, CHOP) is emitted from the OTDR port. The wavelength
of the measurement light is the same as that of the optical pulse of the OTDR.
Visible Light Source (/VLS option)
This is used to view the fault locations or check the cores of multi-core optical fiber cables. The VLS
port transmits a visible light (CW, CHOP (2Hz)) with an emission wavelength of 650 nm.
Fiber in Use Alarm (utility)
Power Checker (/PC option)
The OTDR port enables you to check the presence of communication light (fiber in use) within the
optical fiber cable under measurement and view its power value.
Optical Power Meter Feature (utility)
Standard Optical Power Meter (/SPM option)
This feature is used to measure through the OPM port the optical power for loss measurement or
the optical power of a communication device. This is also used as an optical power meter for the
Auto Loss Test, which is an application of this instrument.
High Power Optical Power Meter (/HPM option)
This feature measures through the OPM port the high power (+27 dBm max.) optical power for
loss measurement. This is also used as an optical power meter for the Auto Loss Test, which is an
application of this instrument.
IM AQ1210-01EN
1-3
Page 10

1.1 Overview
PON Optical Power Meter (/PPM option)
This feature measures through the OPM port the optical power of a passive optical network (PON)
for three wavelengths (1310 nm/1490 nm/1550 nm) simultaneously.
Smart Mapper Feature (application)
This feature performs multiple measurements automatically with a single operation, combines the
measured results, and maps the events that occurred on the optical fiber cable as icons. Because
a map display is used in place of a waveform display, complex line configurations can be easily
understood even by inexperienced workers. You can also automatically judge measured results by
setting thresholds. Furthermore, you can view the multiple measured waveforms which are the bases
of the map display.
Events can also be displayed as icons on the map display of the OTDR feature, but the map display
of the OTDR feature converts the analysis results of averaged measurements. If multiple measured
waveforms, which form the bases, are required, the smart mapper feature is convenient.
Multi-Fiber Measurement Feature (application)
Multi-core fiber measurement takes time and effort. This feature makes it possible to efficiently
measure multi-core optical fiber cables through a dedicated menu.
Projects
Items required to make multi-fiber measurements such as measurement conditions, analysis
conditions, and core information are managed as projects. By creating a project before a
measurement, you can measure cores under the same conditions. You can save projects to files.
You can load a previously saved project and make measurements under the same conditions. In
addition, the AQ7933 Emulation Software can be used to create projects, and the project files can
be loaded into this instrument.
List
Cores are listed on the screen. You can identify cores that have been measured, cores that have
not been measured, and cores that are not to be measured. For each core in the list, you can
perform average measurement, real-time measurement, optical power management, and fiber
inspection probe operations. This prevents unintended omission in core measurements and allows
measurements to be performed efficiently.
Saving Measured Results
Measurement results of each core are automatically saved to a folder that is automatically created
in the folder that the project file is saved in. The folder will have the same name as the project file.
Fiber Inspec Probe (application)
A YOKOGAWA-specified fiber inspection probe can be used to view stains on the optical fiber cable
end face on the instrument screen. The fiber inspection probe is not included with the instrument.
Please purchase your own fiber inspection probe. For information about compatible fiber inspection
probes, contact your nearest YOKOGAWA dealer.
Loss Test/Multi-Core Loss Test (Application)
By using two instruments, one as a light source and another as an optical power meter, the optical fiber
loss can be measured. In a multi-core loss test, the loss of a multi-core optical fiber can be measured.
As a light source, the instrument automatically switches between two wavelengths (1310 nm and 1550
nm) and outputs them.
As an optical power meter, the instrument automatically detects the wavelength of the input light,
switches its wavelength setting, and measures the optical power.
1-4
IM AQ1210-01EN
Page 11
AQ1215F, AQ1216F
1.1 Overview
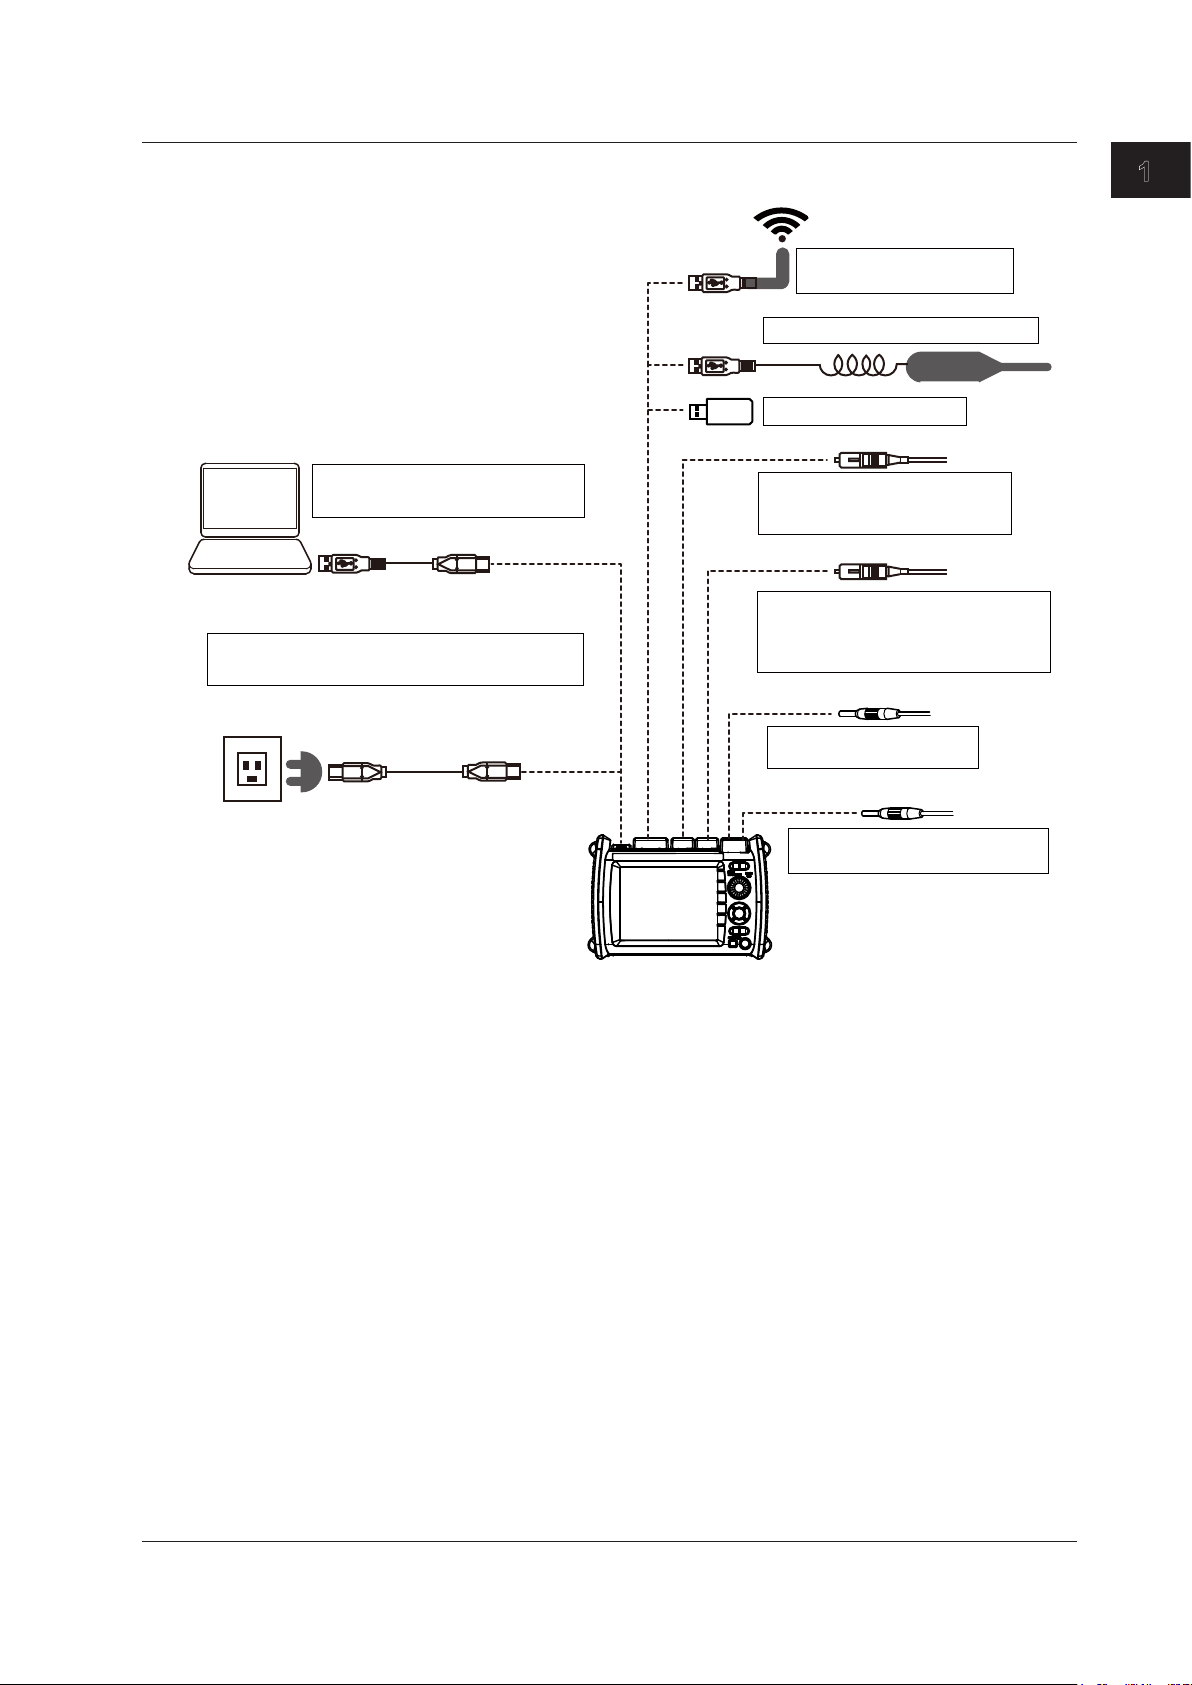
System Configuration
• Mass storage device (section 9.2)
PC
• Charging the instrument
See the Getting Started Guide, IM AQ1210-02EN.
Three-prong
outlet
• Remote control (section 10.4)
USB cable
USB cable (standard
accessory)
USB TypeC
USB TypeC
USB Type A
(2 ports)
Fiber inspection probe (section 7.6)
USB memory (section 9.1)
OTDR port 2
• OTDR measurement
• Light source output
OTDR port 1
• OTDR measurement
• Light source output, power checker
OPM port
Communication dongle
(section 10.3) (WLAN, LAN)
(wavelength 1625 nm, 1650 nm)
(wavelength 1310 nm, 1550 nm)
measurement
Optical power meter input
(/SPM, /HPM, /PPM option)
1
1
Features
1
1
USB-AC
adapter
VLS Port
AQ1210A, AQ1215A,
AQ1210E, AQ1215E,
VLS output (wavelength 650 nm)
(/VLS option)
See the top panel in “Component
1
Names and Functions” in the
Getting Started Guide, IM
AQ1210-02EN.
1
IM AQ1210-01EN
1-5
Page 12
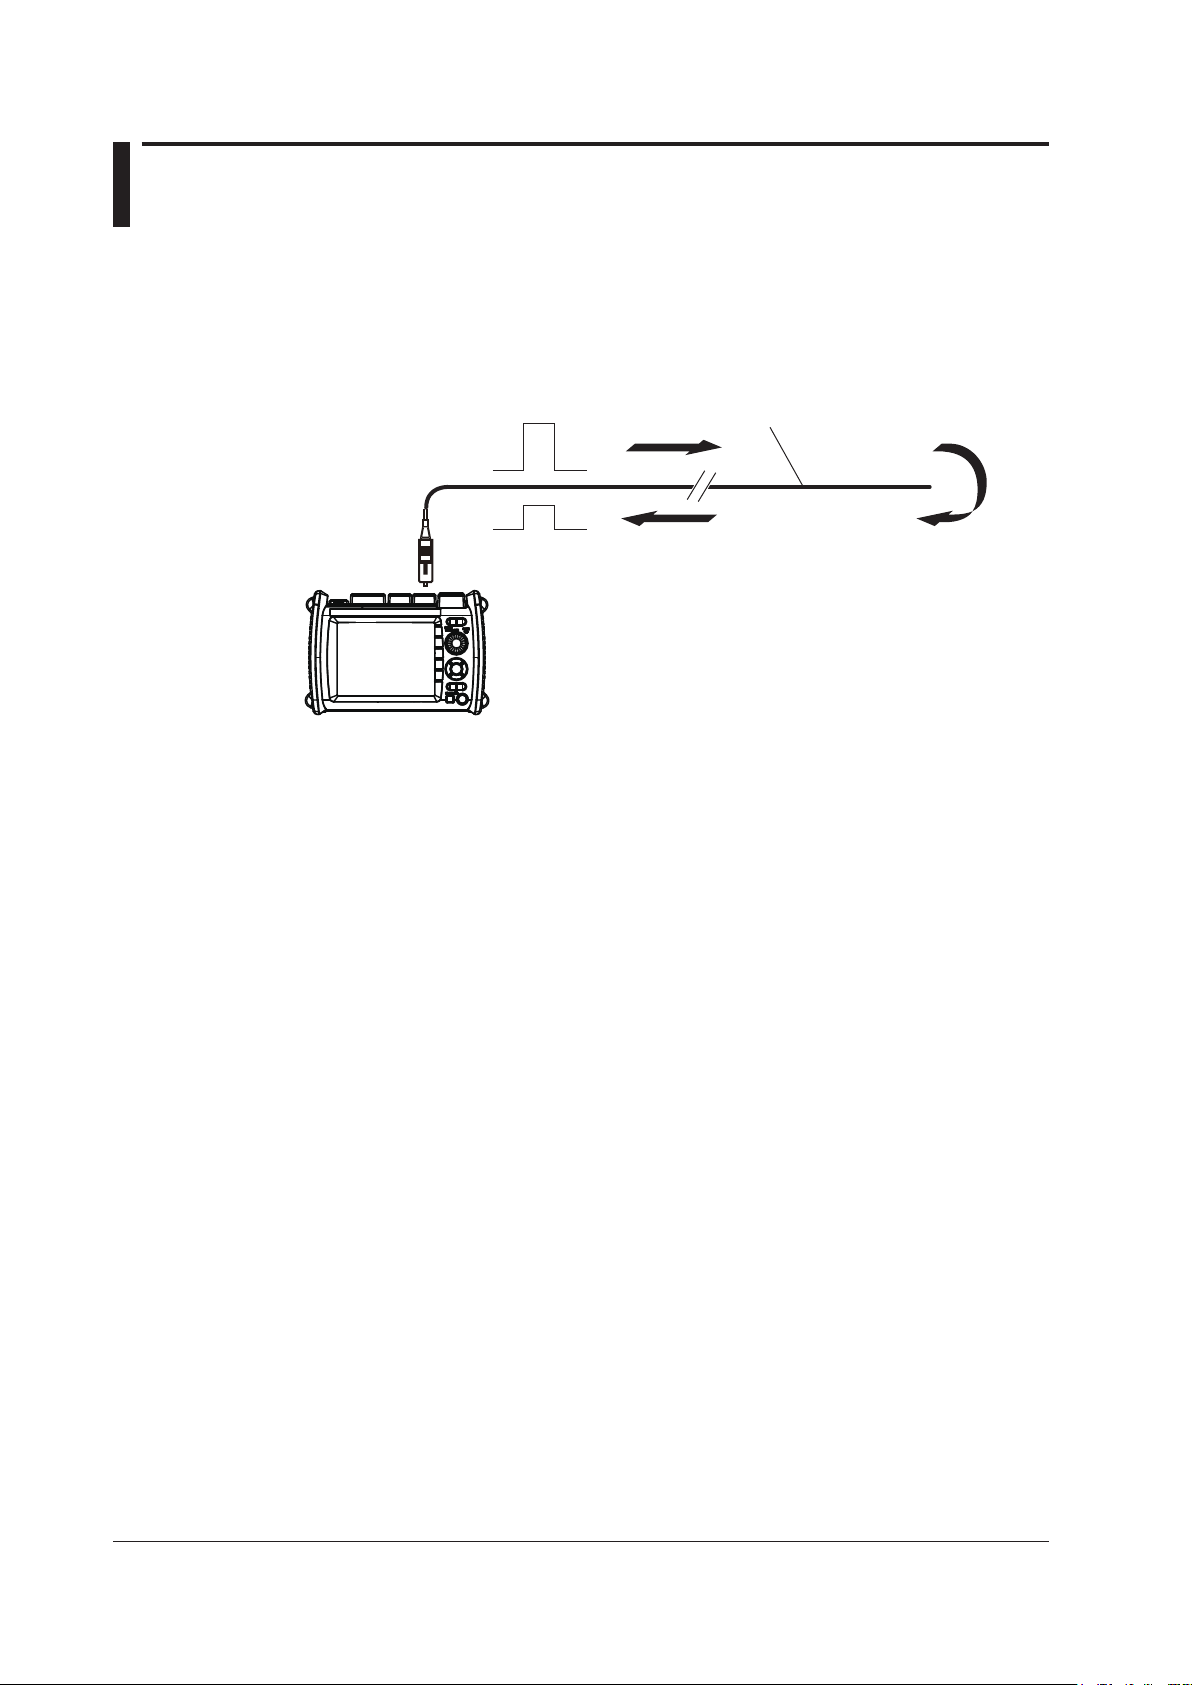
1.2 Optical Pulse Measurement (OTDR)
Optical fiber cable being measured
Optical pulse output
The instrument applies an incident optical pulse to the connected optical fiber cable and measures
the power level of the reflected light from the different sections of the optical fiber cable such as its
connections, bent sections, and the open end of the fiber. The instrument uses the measured power
level to determine the distance to the different points (splices, breaks, etc.) of the optical fiber cable
and the loss and other phenomena that occur at those points. For details on how to view optical pulse
waveforms, see section 1.3.
Reflection point
OTDR/light source port
Reflected light
Do not bend the optical fiber cable.
AQ1210A, AQ1215A,
AQ1210E, AQ1215E,
AQ1215F, AQ1216F
Real-time Measurement
Real-time measurement is a feature that measures optical pulses while updating and displaying
the measured values. You can monitor in real time events, such as splice loss and return loss,
while installing optical fiber cables. You can also view the changes in the waveform as you change
the measurement conditions, such as the wavelength, distance range, and pulse width. Real-time
measurement is not possible in MAP mode (the mode is automatically switched to TRACE mode
before making a measurement).
Averaged Measurement
Averaged measurement is effective when you want to detect reflections, splice loss, and other faint
events that are generated from connections or splice points but are buried in noise. The instrument
derives the measured data by averaging the specified number of optical pulse measurements or by
averaging optical pulse measurements over the specified duration. During averaged measurement,
you cannot change the measurement conditions. You can stop an averaged measurement before it
completes.
• Multi Wavelength Measurement
Two wavelengths, 1310 nm and 1550 nm, can be measured with one measurement operation.
When a measurement is started, an averaged measurement is performed at 1310 nm. Then, the
wavelength is automatically switched to 1550 nm, and another measurement is made.
1-6
Auto Check before Measurement
• Fiber-In-Use Alarm
The instrument uses the same wavelength that is used in real communication to measure optical
pulses. If communication light is present in the optical fiber cable that you want to measure, the
communication will be affected. When this communication light is present, we say that the fiber is
in use. The fiber-in-use alarm is a feature that checks if communication light is being transmitted
along the optical fiber cable that you are trying to measure. If the fiber is in use, a warning
message is displayed asking whether you want to continue the measurement.
• Connection Check
The connection check is a feature that checks the state of the connection between the
instrument and an optical fiber cable. When this feature is set to on, you can prevent light from
being transmitted from the instrument OTDR port if an optical fiber cable is not connected to the
instrument or if the cable is not connected correctly.
IM AQ1210-01EN
Page 13

1.3 Displaying Measured Data (OTDR)
Incident ray Backscatter Splice
Connector Bend
Icons of
each event
Incident ray Backscatter Splice
Connector Bend
Open end
How to View Optical Pulse Waveforms (TRACE mode)
The optical pulse applied to the optical fiber cable is reflected at different points of the optical fiber such
as its connections, bent sections, and the open end of the fiber. These sections generate loss. The
measured result is displayed as a waveform that has distance represented in the horizontal direction
and loss level represented in the vertical direction. On the waveform, detected losses or reflections are
known as events.
1
Features
Optical fiber cable
Near-end reflection
Splice loss
Approximation line
Reflection caused by a connector
Loss caused by bending
Reflection at the open end (Fresnel reflection)
Dynamic range (SNR = 1)
Open end
How to View the Icon Display (MAP mode)
Losses and reflections that occur at connections, bent sections, and open ends are displayed using
icons. Events in the section from the measurement start point to the open end are displayed in order
from the start point.
IM AQ1210-01EN
Optical fiber cable
Start point
(Near-end
reflection)
Splice loss Return loss Bending loss Splitter End point
Splitter
(Fresnel
reflection)
1-7
Page 14
Incident ray
Optical fiber cable
Connector
1.3 Displaying Measured Data (OTDR)
Near-end Reflection
This is the reflection that occurs at the point where the instrument and the optical fiber cable are
connected. This also includes the instrument’s internal reflection. In the section where this near-end
reflection is detected, even if there are other connections, the loss and reflections that occur at these
points cannot be detected. This section is the near-end dead zone.
When you are measuring a short distance, connect a launch fiber cable to reduce the effect of the
near-end reflection.
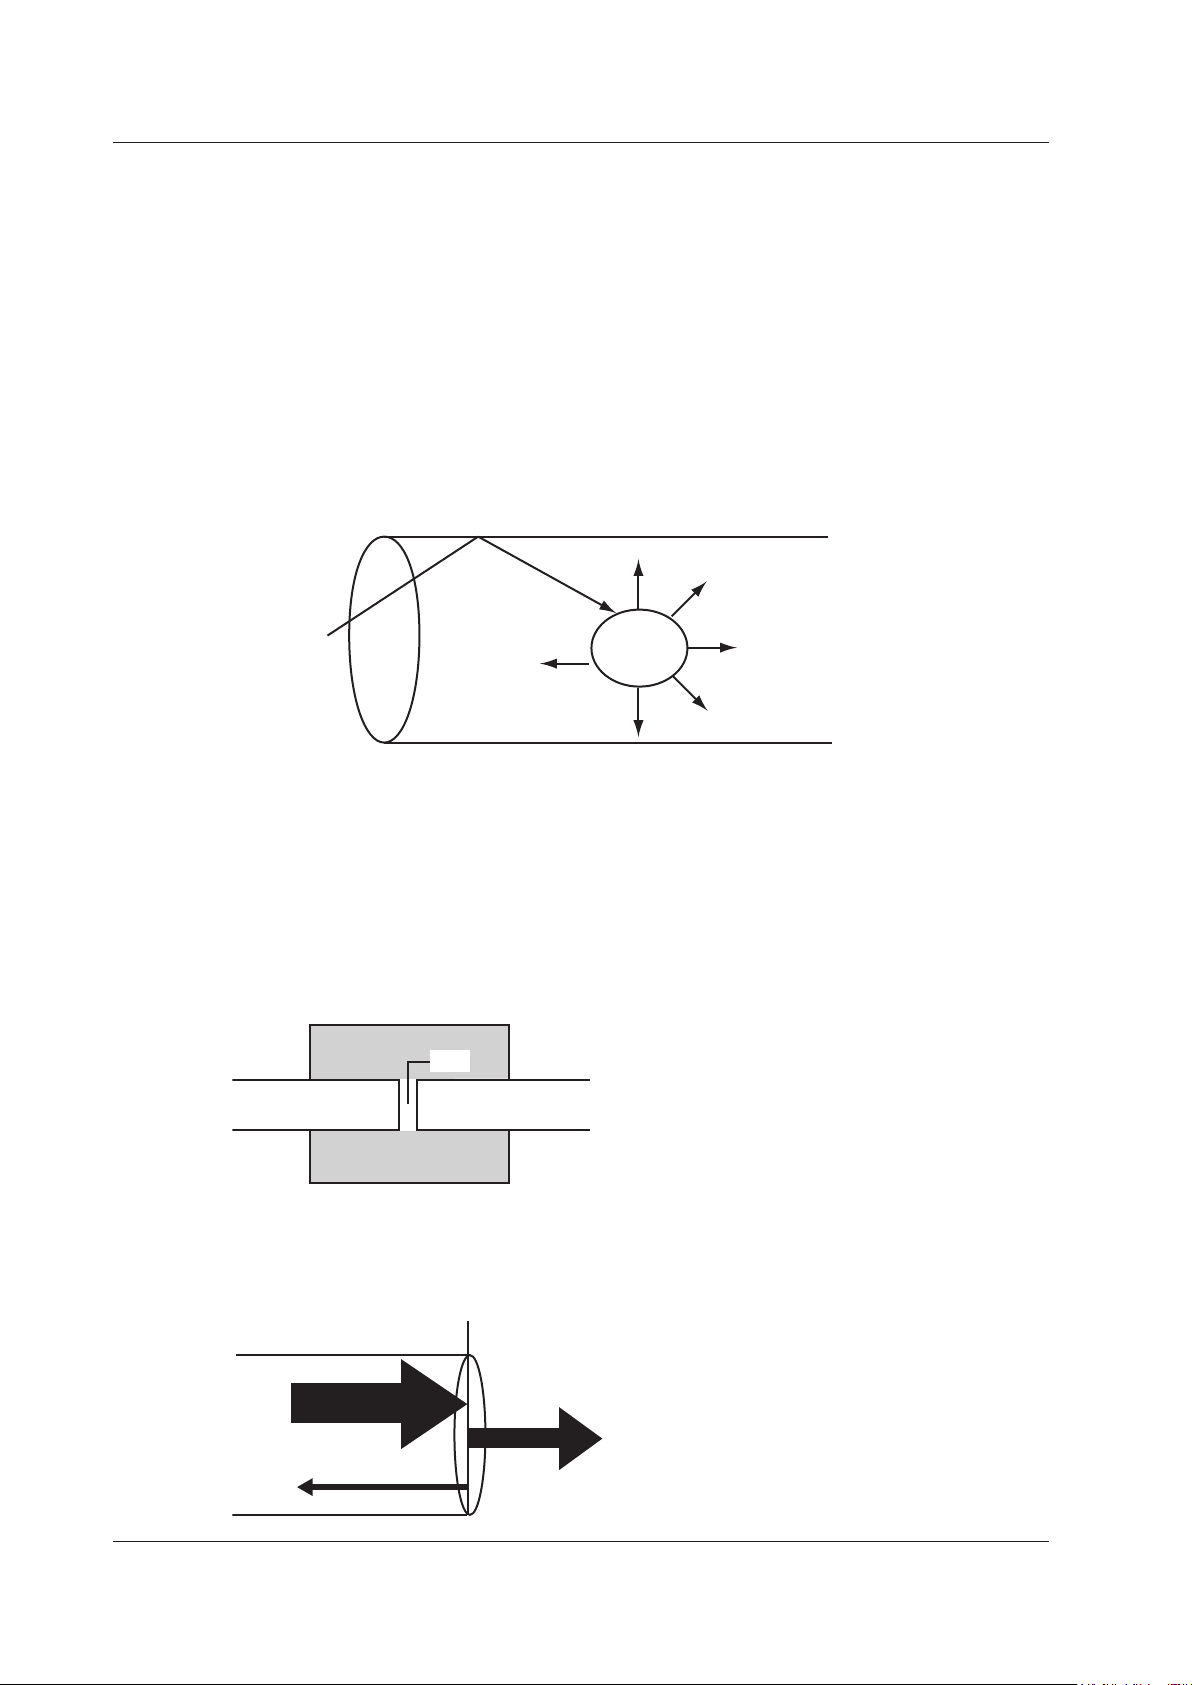
Backscatter
When light travels through an optical fiber cable, Rayleigh scattering caused by changes in the density
of materials that are smaller than the light’s wavelength and inconsistencies in the fiber's composition
generates loss in the optical fiber itself. The portion of the scattered light that travels in the direction
opposite to the direction of propagation is known as backscatter.
Backscatter
Small
material
Splice Loss
Because spliced sections of optical fiber cables have a great number of changes in the material’s
density and inconsistencies in the cable’s composition, loss due to Rayleigh scattering becomes large,
and splice loss occurs in these sections.
Reflection at the Connection Point of Connectors
Using a connector to connect two optical fibers is different from splicing them together in that a small
gap remains between the two fibers. Because this gap has a different index of refraction, reflection
occurs.
Gap
Optical fiber cable Optical fiber cable
1-8
Fresnel Reflection at the Open End of the Fiber
This is the reflection that occurs at locations where the index of refraction changes (glass to air) such
as where there are tears in the optical fiber cable or at the end of it. When the optical fiber cable end
face is vertical, approximately 3% of the incident optical power (14.7 dB) is reflected.
Glass Air
Incident ray (100%)
Light (97%)
Reflected light (3%)
IM AQ1210-01EN
Page 15
RMS level of noise
Optical fiber cable
Small reflection that was hidden
AQ1215F, AQ1216F
1.3 Displaying Measured Data (OTDR)
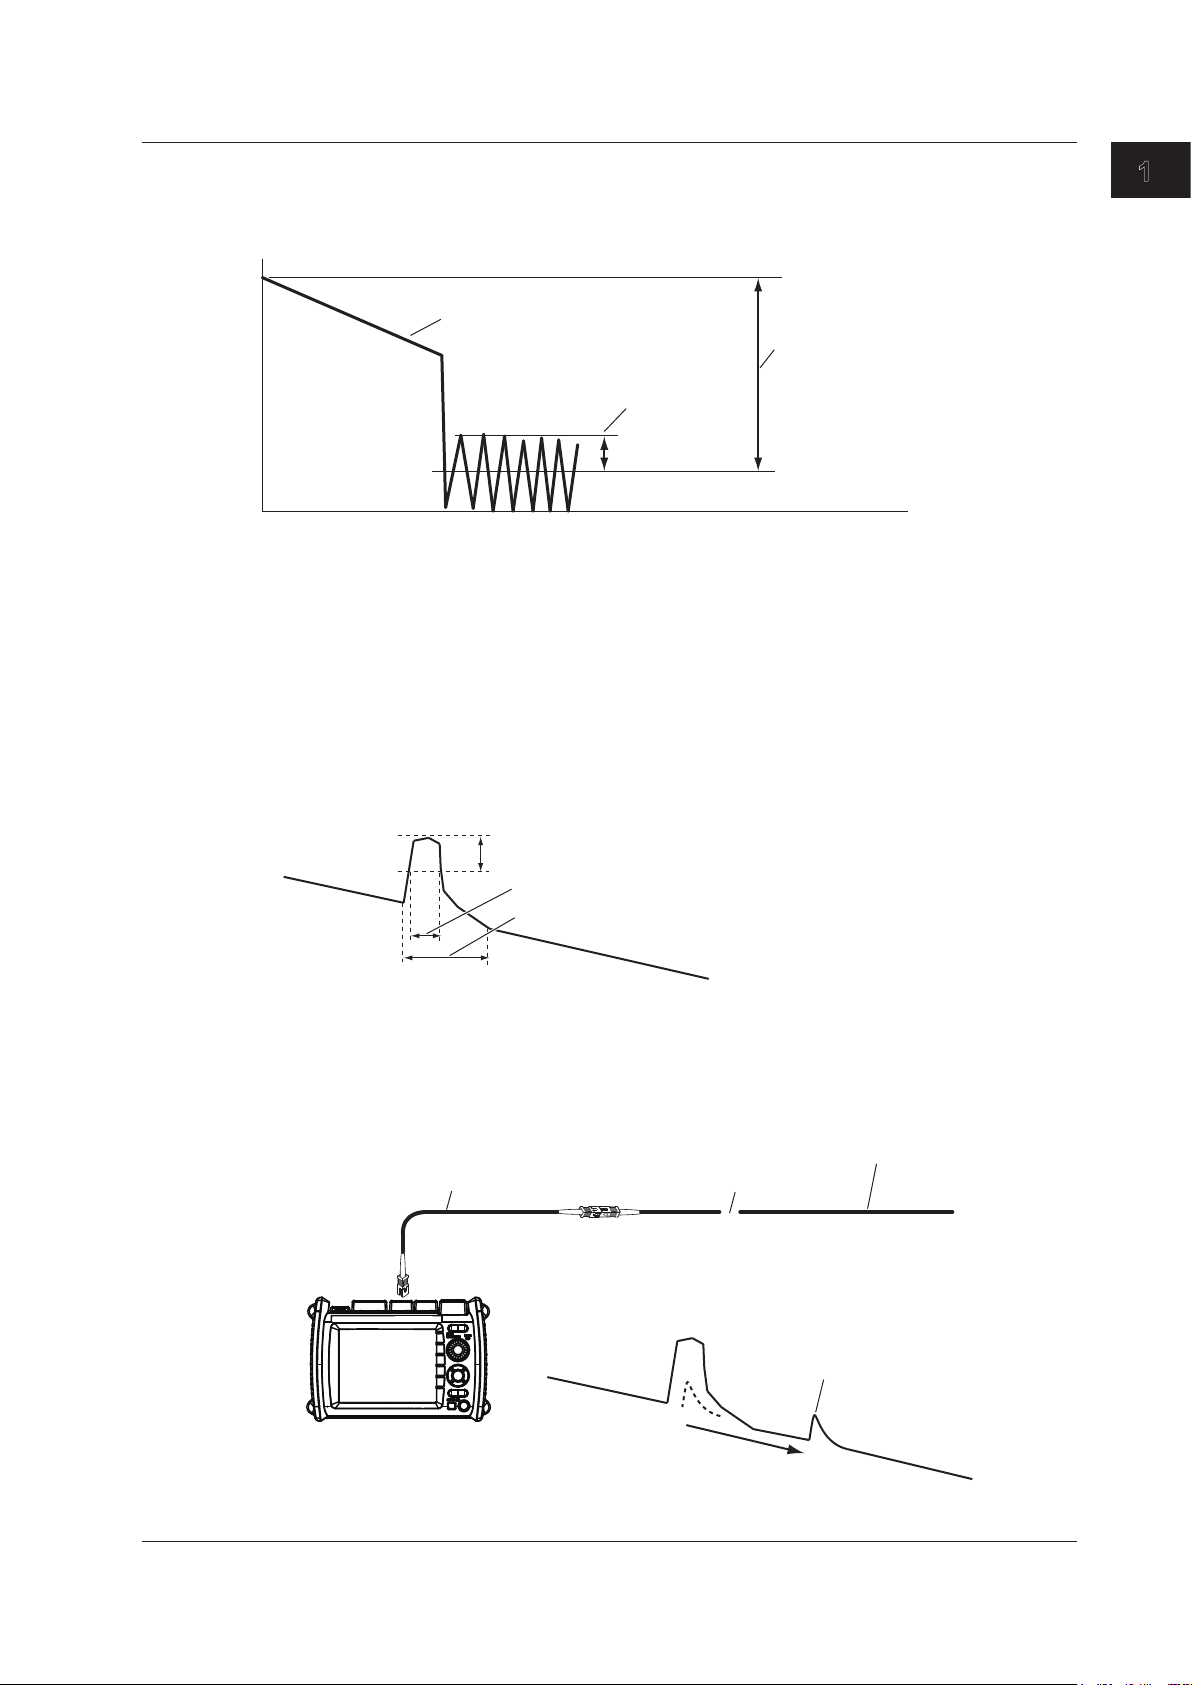
Dynamic Range
Dynamic range refers to the range of optical power levels that can be measured. The larger the
1
Features
dynamic range, the greater the distance that optical pulses can be measured over.
Measured waveform
Dynamic range
(SNR=1)
Noise peak
2.6 dB
Dead Zone
An area where the influence of a large event such as a connector’s connection point makes it
impossible to recognize other events that exist in that area is a dead zone. There are the following
types of dead zones.
Event Dead Zone
An area where adjacent reflections cannot be separated. This is the area represented by the pulse
width between the two points on the waveform at the level that is 1.5 dB below the peak value.
Attenuation Dead Zone
An area where, because there is a large reflection, the surrounding splice losses cannot be
measured.
• Near-end Dead Zone Prevention
In sections where near-end reflection is detected, loss and reflections that occur at connections
cannot be detected. If you are measuring a short distance, connect a launch fiber cable to move
events that are hidden in the near-end reflection the distance of the launch fiber cable.
1.5 dB
Event dead zone
Attenuation dead zone
Launch fiber
Event generation
point
Do not bend the optical fiber cable.
being measured
within a large reflection
IM AQ1210-01EN
AQ1210A, AQ1215A,
AQ1210E, AQ1215E,
1-9
Page 16
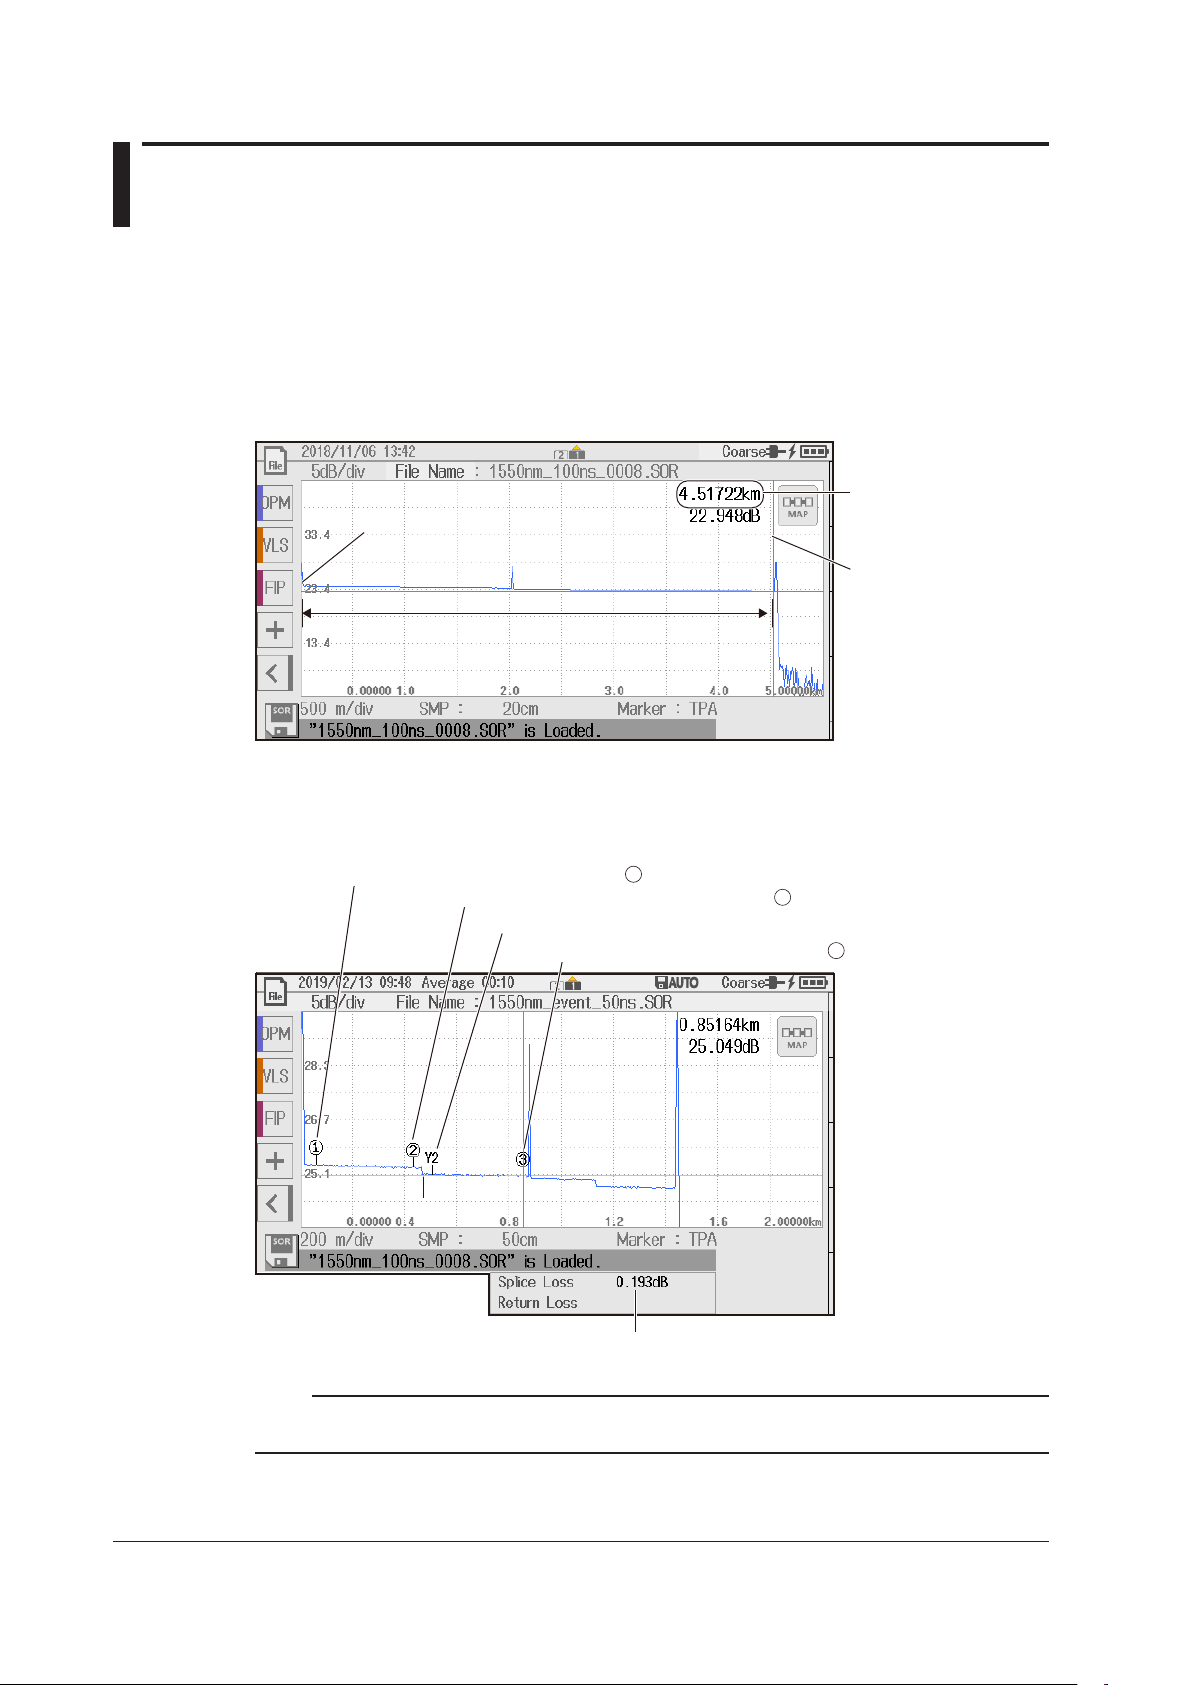
1.4 Analyzing Measured Data (OTDR)
Measurement start position (marker )
Splice loss
1
Marker Analysis (TRACE mode)
You can manually use cursors and markers to measure values such as the distance, splice loss, and
return loss between two points.
Distance between Two Points
The distance from the start point to the cursor position is displayed.
Start point
Distance from the start point to the cursor
Distance
Cursor
Splice Loss
When you place four markers as shown in the following figure, the splice loss from the measurement
start position to the measurement end position is calculated, and the value is displayed.
Position where splice loss starts (marker )
Position where splice loss ends (Y2 marker)
Measurement end position (marker )
Splice loss measurement point
2
3
1-10
Note
In addition to the above method, the splice loss can be measured by using six markers or by using line
markers. For details, see section 6.1.
IM AQ1210-01EN
Page 17
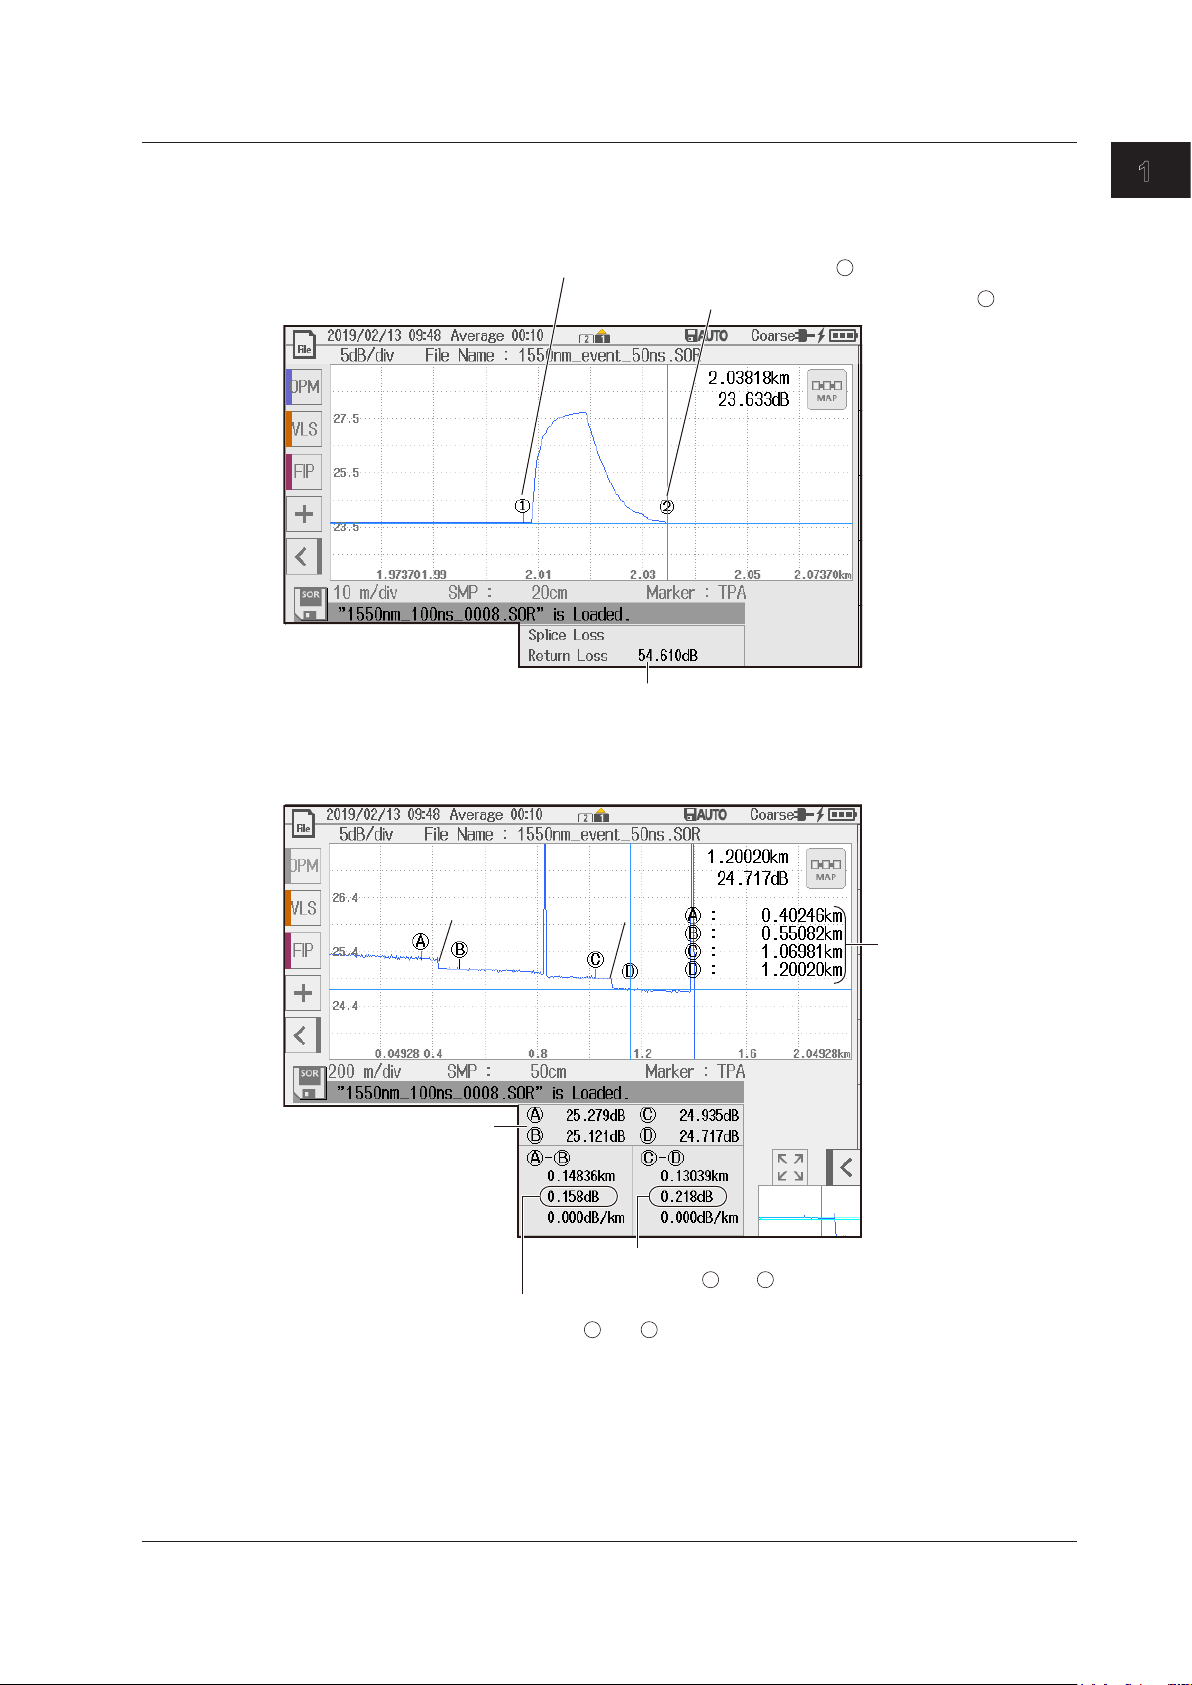
Return loss
Event’s rising start position (marker )
A B
start point to each
(between and )
1.4 Analyzing Measured Data
Return Loss
When you place two markers as shown in the following figure, the return loss is calculated, and the
value is displayed.
Splice Loss at Two Locations (4 Point Monitor)
Splice losses at two locations can be measured simultaneously using four markers.
1
Event’s falling end position (marker )
2
1
Features
Loss from the start
point to each marker
Loss
measurement at
splice point 1
Loss at splice point 1
Loss
measurement at
splice point 2
Loss at splice point 2
(between and )
Distance from the
marker
C D
IM AQ1210-01EN
1-11
Page 18

TRACE mode
1.4 Analyzing Measured Data
Event Analysis
All events are automatically detected from the waveform of optical pulse measurement, and the types
of each event and analysis results (splice loss, return loss, etc.) are displayed on the screen.
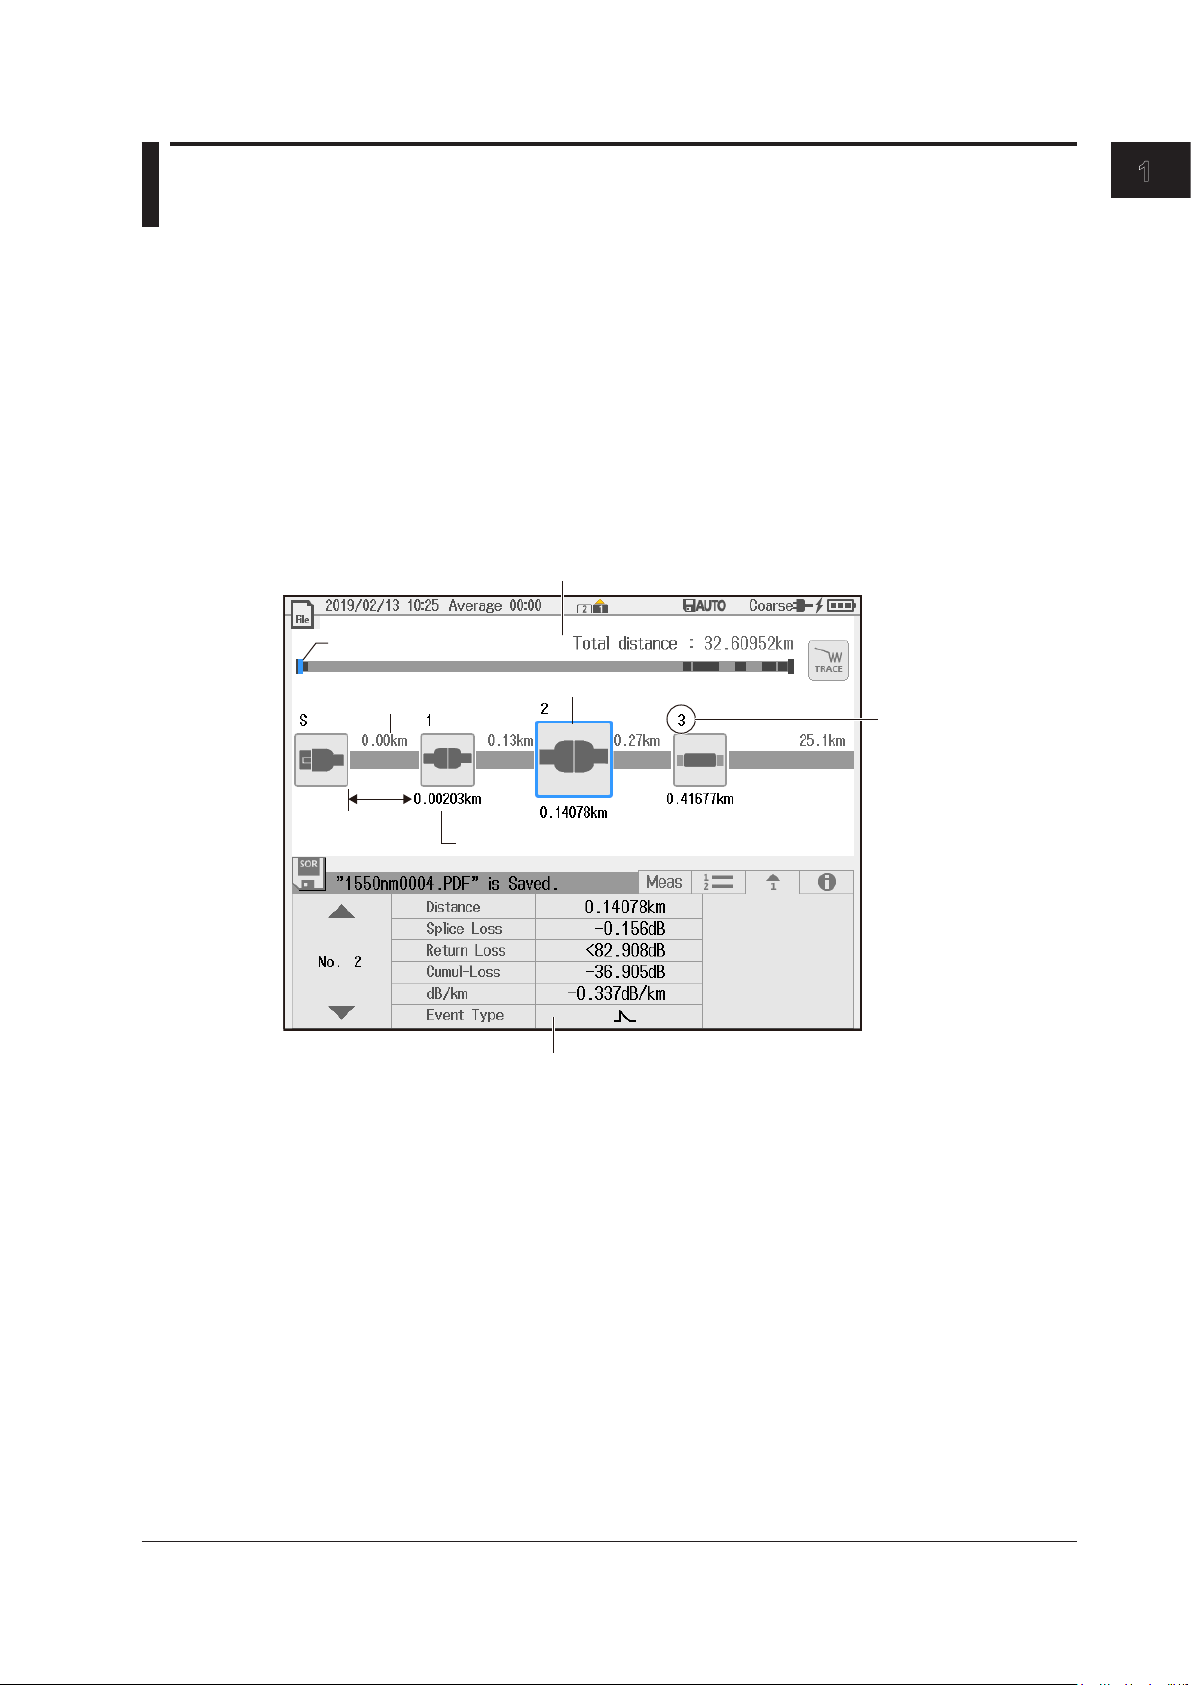
Event Display
In TRACE mode, detected events are displayed on the measured waveform. In MAP mode, the
types of events are displayed using icons along with the distances of each from the measurement
start position.
Event number
MAP mode
Relative position of the event
Distance between
events
Displays the event
type with an icon
Distance from start point S
Event number
1-12
IM AQ1210-01EN
Page 19
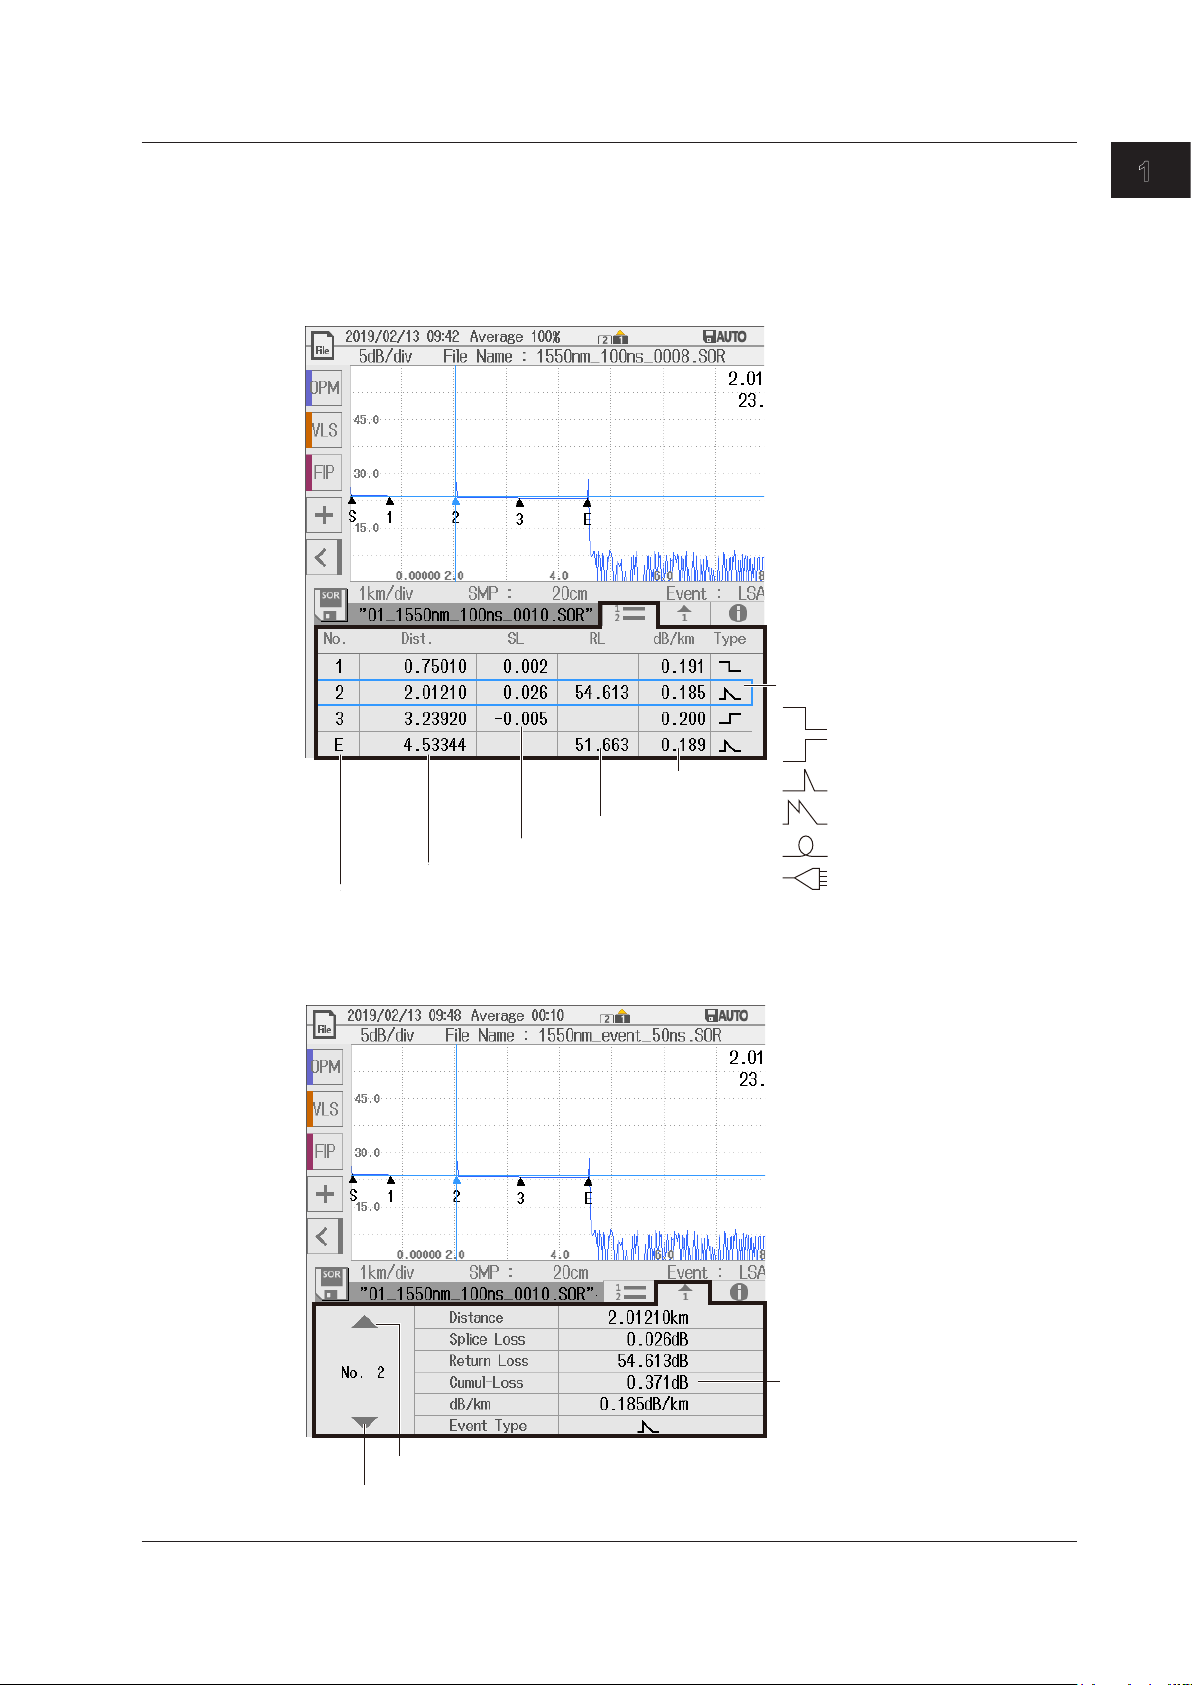
Cumulate loss from the measurement
Displays the previous event number
1.4 Analyzing Measured Data
Event Information Display
The distance, splice loss, return loss, and the like of each event are displayed. This is a feature
common to TRACE mode and MAP mode.
• List Display
All detected events are listed.
Event type
: Positive splice loss
: Negative splice loss
Loss per kilometer
between events
Return loss
Splice loss
Distance from the measurement start point (S)
Event number
: Reflection
: Superimposed reflections
: Bending loss (macro bending)
: Splitter insertion loss
1
Features
• Individual Event Information
The measured data of the selected event number is displayed.
start point (S)
Displays the next event number
IM AQ1210-01EN
1-13
Page 20
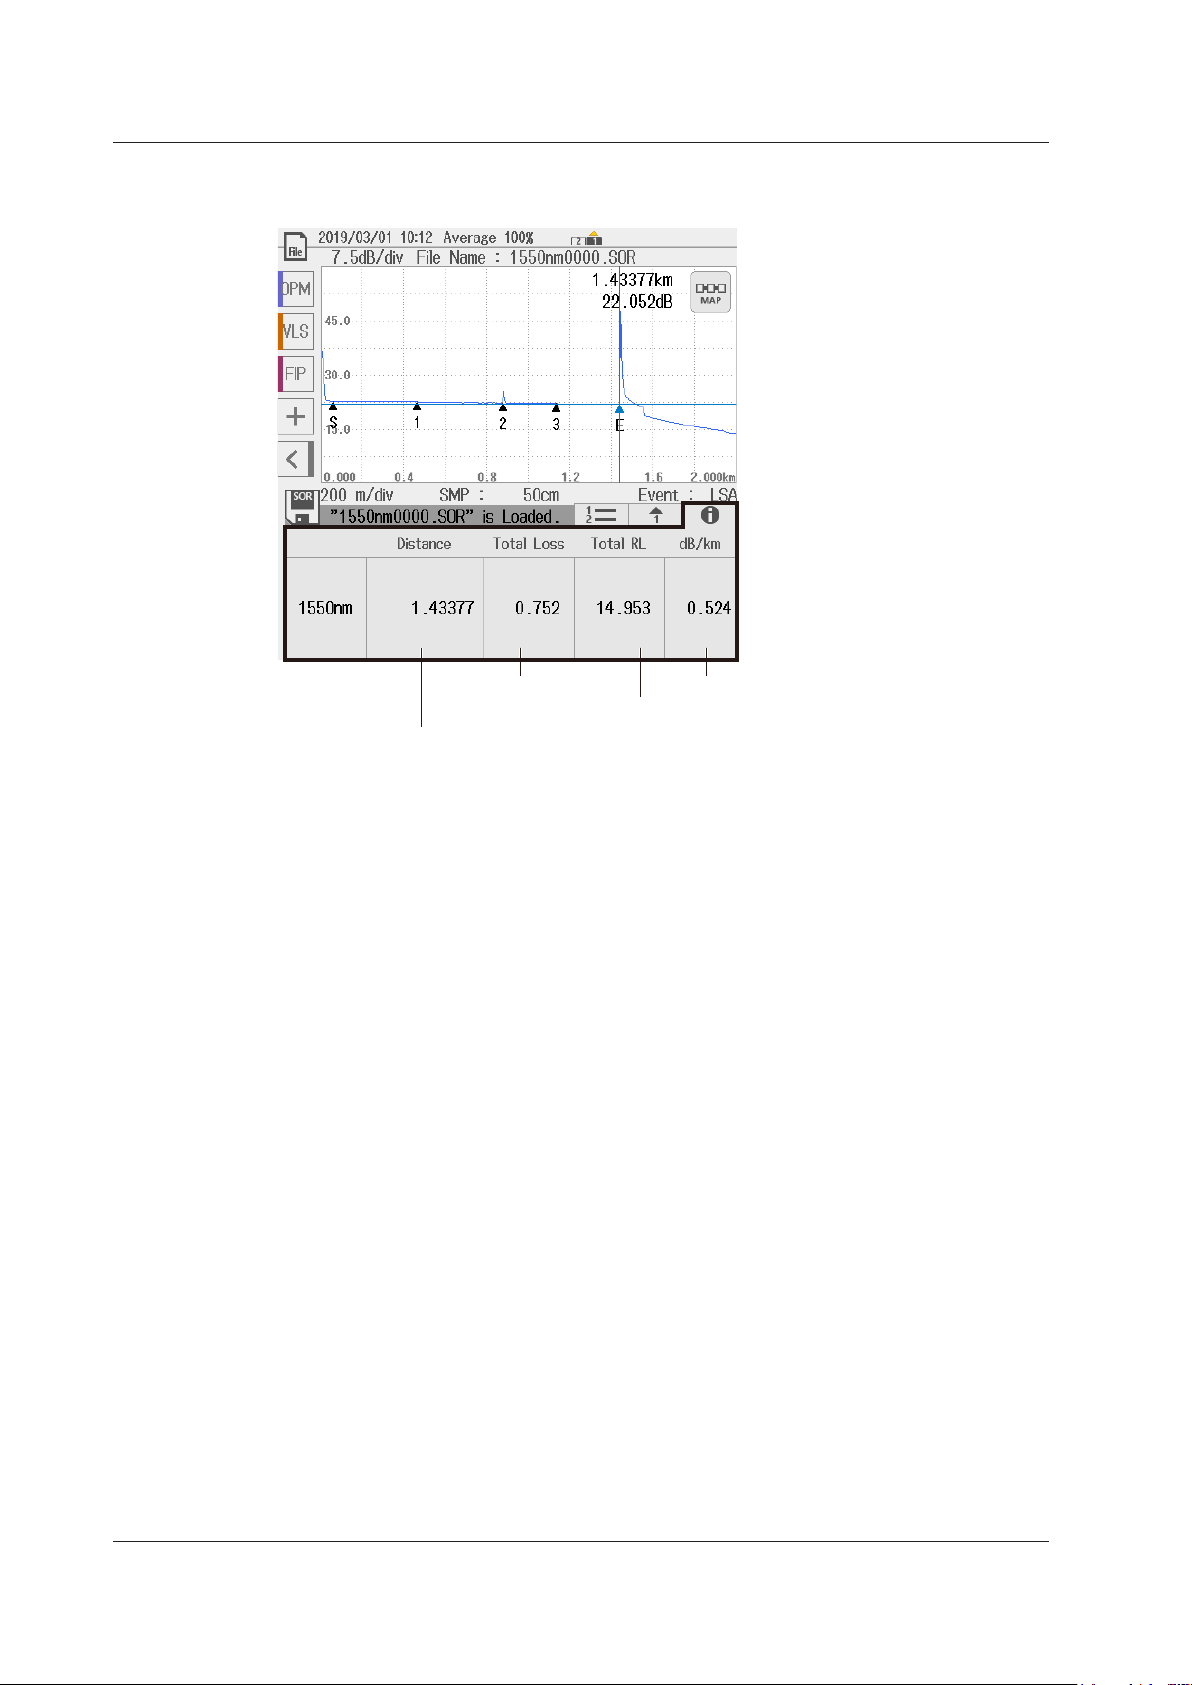
point (S) to the measurement end point (E)
Loss per kilometer between events
1.4 Analyzing Measured Data
• Measurement Total of Events
The total values of detected events are displayed.
Total loss
(cumulate loss)
Distance from the measurement start
Total return loss
Event Analysis Conditions
You can set event search conditions.
• Splice Loss (Splice/Connection)
The instrument recognizes that an event has occurred when it detects a measured result that is
greater than the specified value.
• Return Loss
The instrument recognizes that an event has occurred when it detects a measured result that is
less than the specified value.
• End of Optical Fiber
The instrument recognizes that an end-of-fiber (E) event has occurred when it detects a
measured result that is greater than the specified value.
• Bending Loss
You can select whether to detect bending losses. If you select to detect bending loss, the
instrument recognizes that an event has occurred when it detects a measured result that is
greater than the specified threshold.
• Near-end Dead Zone Prevention (Launch Fiber Setting)
To prevent near-end reflections, if a launch fiber is connected to the measurement start point, the
length of the launch fiber is automatically corrected in the calculations.
For details on near-end dead zone prevention, see “Dead Zone” in section 1.3.
• Splitter Loss
If splitters are inserted, you can select whether to detect the losses caused by them. If you select
to detect splitter loss, the instrument recognizes that an event has occurred when it detects a
measured result that is greater than the specified threshold.
1-14
IM AQ1210-01EN
Page 21

Reference trace (white: when Screen Color is set to Color1)
1.4 Analyzing Measured Data
Setting a Reference Trace
You can perform averaged measurements or real-time measurements while retaining the previous
waveform on the screen (reference trace). You can display the waveform being measured and the
reference waveform at the same time to compare them. Waveform data loaded from a file can also be
used as a reference trace.
Superimposed on the waveform currently being measured
1
Features
IM AQ1210-01EN
1-15
Page 22
TRACE mode
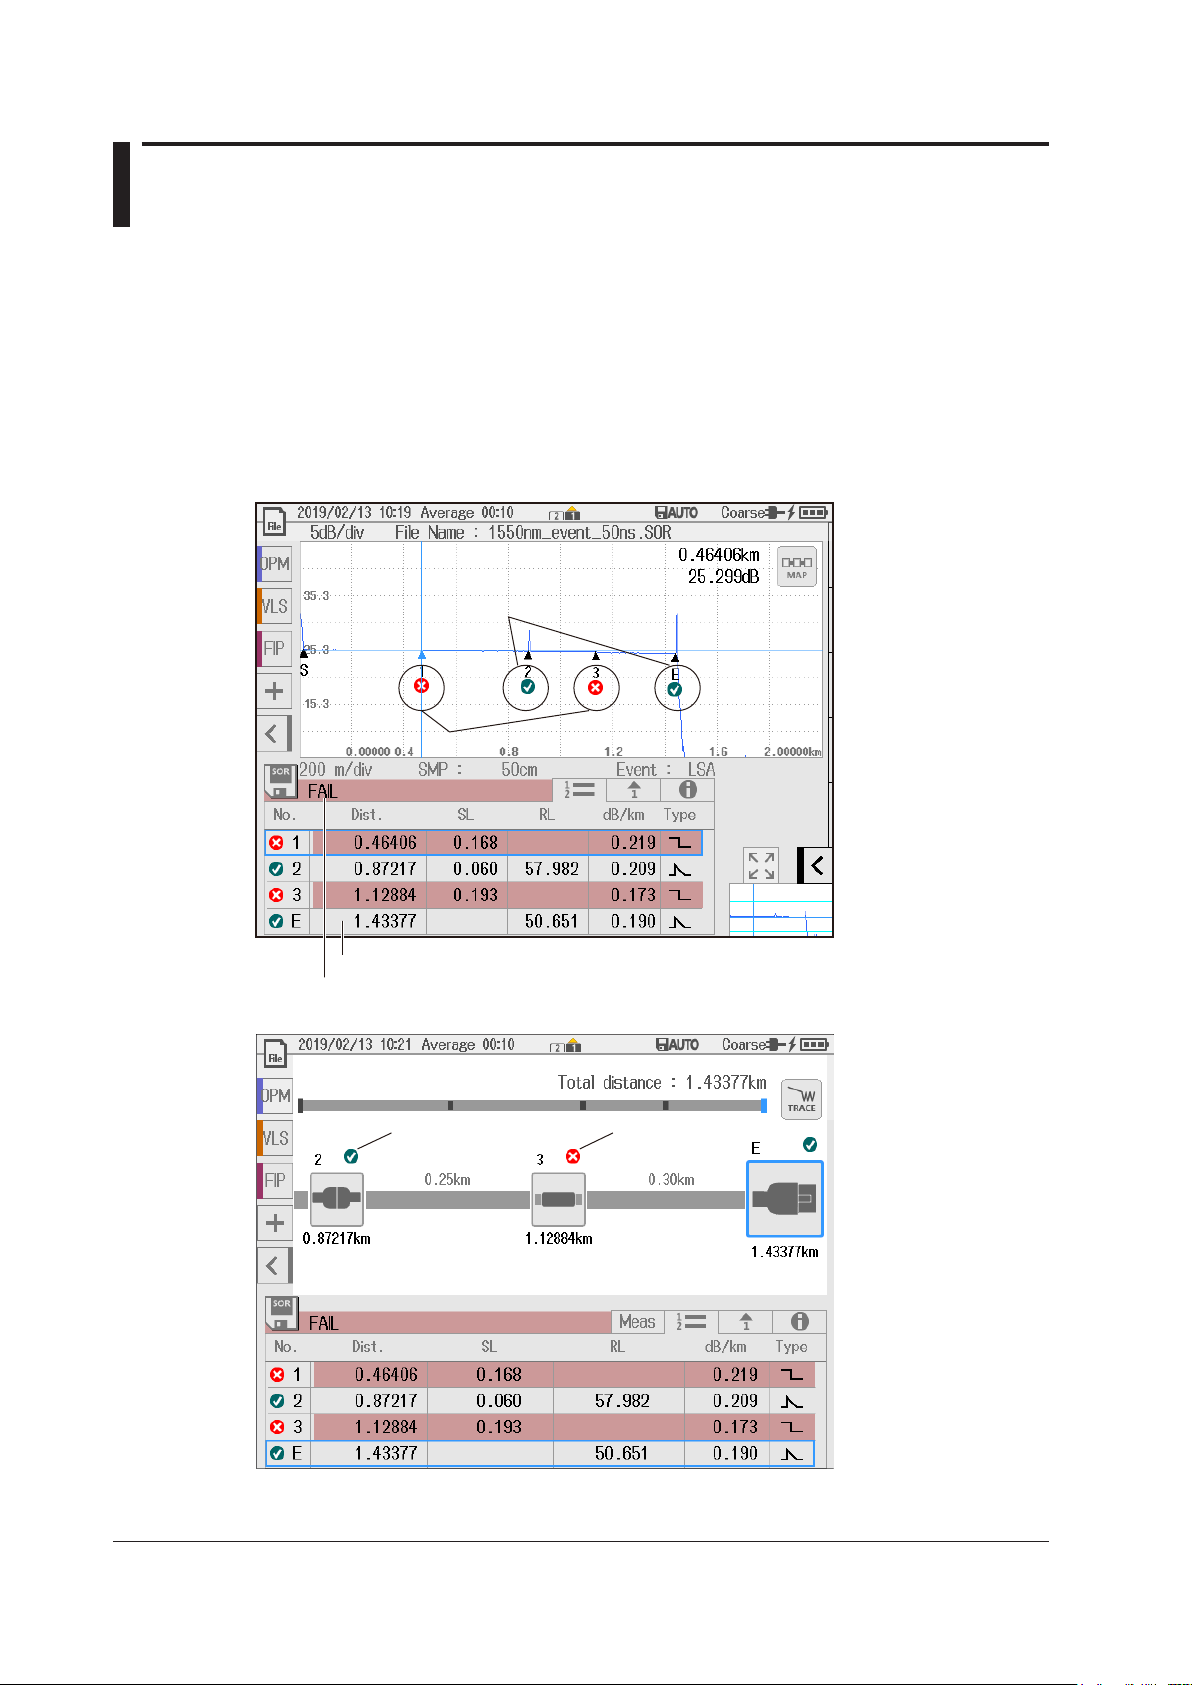
1.5 Pass/Fail Judgment (OTDR)
In pass/fail judgment, the instrument automatically determines whether preset conditions are met
based on the event analysis data and displays the results on the screen.
Judgment Conditions
Set a pass/fail judgment threshold on each measurement item (splice loss, return loss, dB/km, total
loss). When the measurement value does not exceed the threshold, the corresponding event is
indicated as pass. When the measurement value is greater than the threshold, the corresponding
event is indicated as fail.
Pass judgment
Fail
MAP mode
When all events are judged as Pass, the bar turns green.
The pass judgment result and value of each event are displayed.
Pass
Fail
1-16
IM AQ1210-01EN
Page 23

1.6 Utilities
Light Source
The light source is used to make loss measurements. The following measurement light wavelengths
can be generated.
Model Measurement Light Wavelength
AQ1210A 1310 nm, 1550 nm
AQ1215A 1310 nm, 1550 nm
AQ1210E 1310 nm, 1550 nm, 1625 nm
AQ1215E 1310 nm, 1550 nm, 1625 nm
AQ1215F 1310 nm, 1550 nm, 1650 nm
AQ1216F 1310 nm, 1550 nm, 1650 nm
You can produce continuous light or light that has been modulated at the selected frequency (modulation
mode).
Visible Light Source
The features listed for the visible light source are available on models with the /VLS option.
A visible light source can be used for the following purposes.
• Determine visually breaks in the optical fiber cable under test
• Check the cores of multi-core optical fiber cables
Model Measurement Light Wavelength
AQ1210A
AQ1215A
AQ1210E
AQ1215E
AQ1215F
AQ1216F
650 nm
1
Features
Optical Power Meter
The optical power meter feature can be applied to models with the /SPM (standard), /HPM (high
power), or /PPM (PON) option. An optical power meter can be used for the following purposes.
• Measure the loss in an optical line that uses optical fibers
• Measure the optical signal power of an optical communication device
The following measurement lights can be measured.
Model Measurement Wavelength
/SPM option /HPM option /PPM option
AQ1210A
AQ1215A
AQ1210E
AQ1215E
AQ1215F
AQ1216F
Logging
You can measure short-term optical power stability. The optical power value during logging can be
displayed on a graph, and you can calculate the maximum, minimum, and average. In addition,
you can use cursors to calculate the optical signal power at a specified location or the maximum,
minimum, and average within a specified area. The logging results can be saved to a file in CSV
format.
800 nm to 1700 nm 800 nm to 1700 nm 1310 nm, 1490 nm, 1550
nm
IM AQ1210-01EN
1-17
Page 24
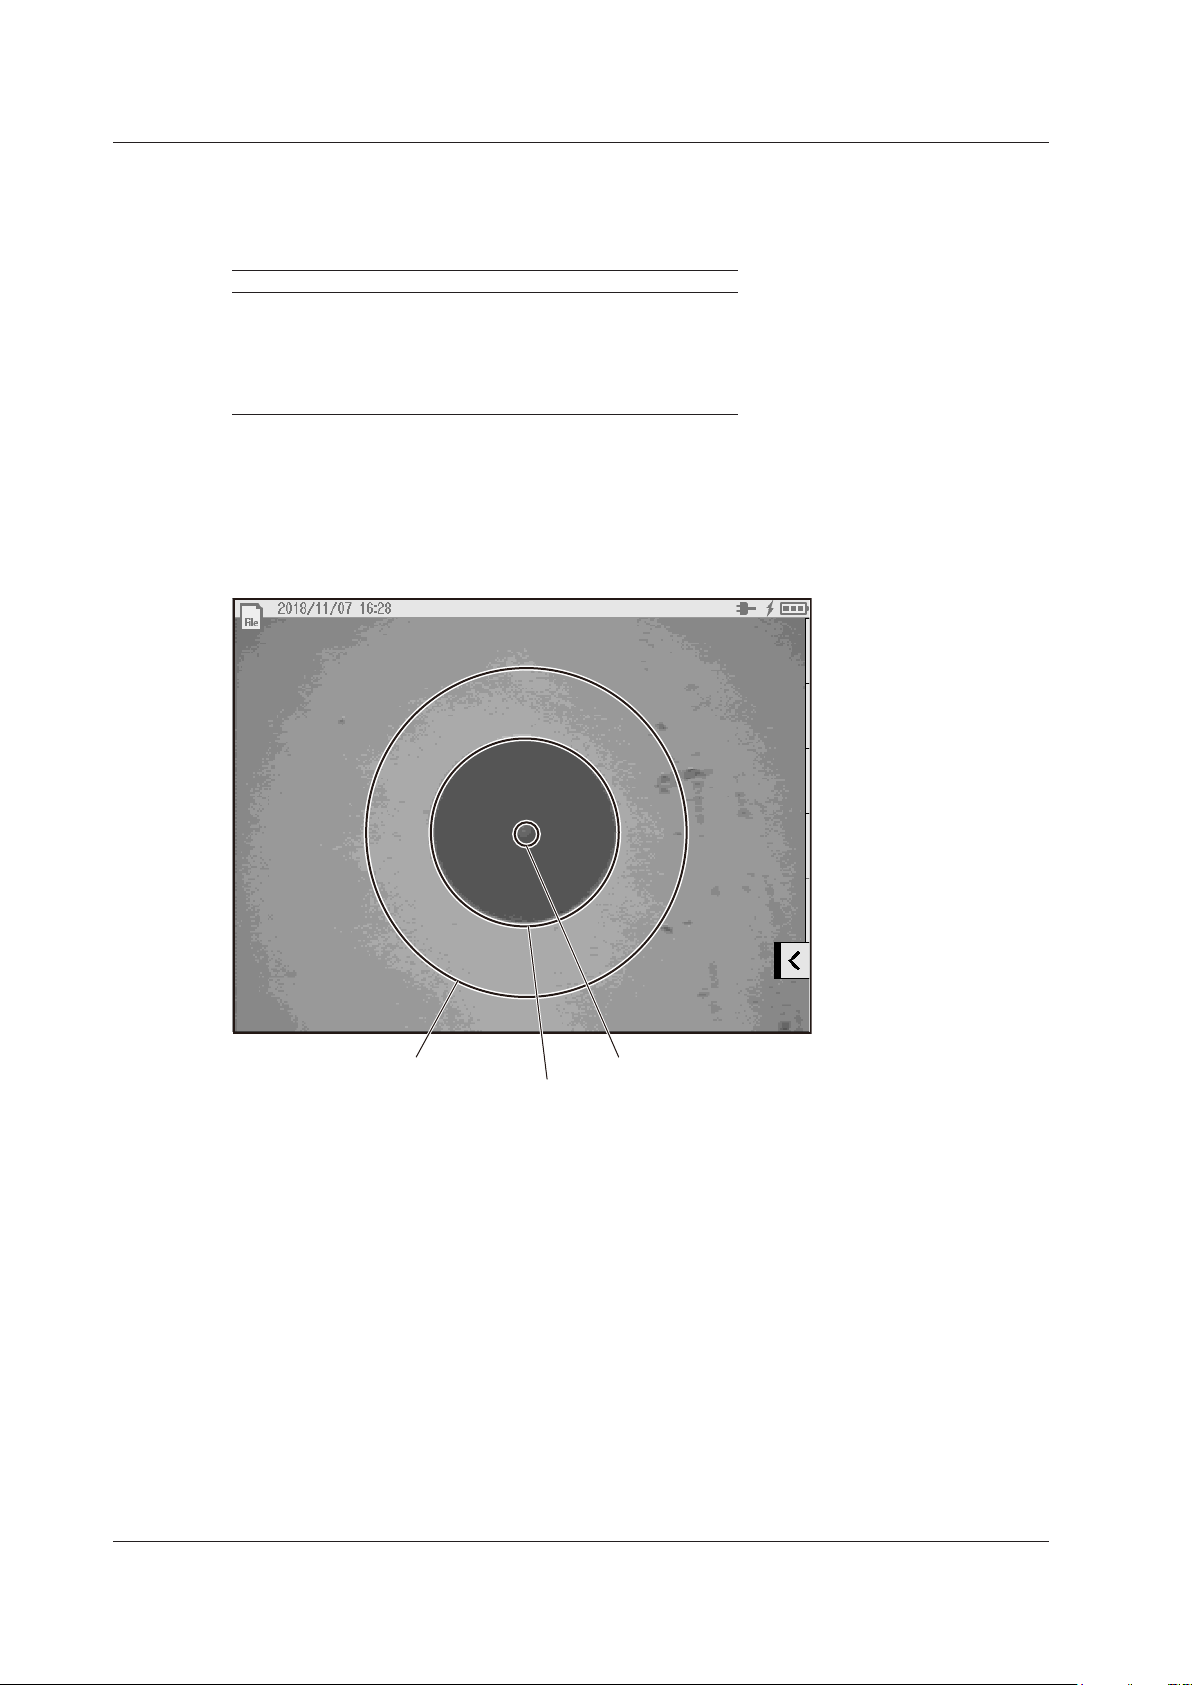
Example of an end face image of an optical fiber cable
Cladding area
1.6 Utilities
Power Checker (/PC option)
The power checker feature is used to check the power of the loss-measurement light source in a
simplified manner.
The following measurement lights can be measured.
Model Measurement Wavelength
AQ1210A
AQ1215A
AQ1210E
AQ1215E
AQ1215F
AQ1216F
1310nm, 1490nm, 1550nm, 1625nm, 1650nm
Fiber End Face Inspection (/FST option)
You can use a fiber inspection probe recommended by YOKOGAWA to take a photograph that shows
the state of a fiber end face. You can display this photograph on the instrument screen and save it. You
can also perform a pass/fail judgment on the state of the cable end face shown on the photograph.
Contact section
Pass/fail judgments can be performed separately on each of the contact areas, cladding areas, and
core areas.
Core area
1-18
IM AQ1210-01EN
Page 25
1.7 Application
The icon display method is the same as the display
See “Event Analysis” in section 1.4.
Smart Mapper
The Smart Mapper feature repeats the averaged measurements of the OTDR feature on the same
wavelength using different pulse widths, and then when measurements are completed, automatically
executes the event analysis of the OTDR feature.
Like the OTDR feature, when measurements are completed, you can select between MAP mode and
TRACE mode.
Event Analysis Using MAP Mode
When you select MAP mode, various events on the optical fiber cable path can be detected and
displayed as icons on the screen.
Relative position of the event
1
Features
in MAP mode of event analysis in section 1.4.
Distance between
events
Distance from start point S
Displays the event type with an icon
Event number
Event information display
IM AQ1210-01EN
1-19
Page 26
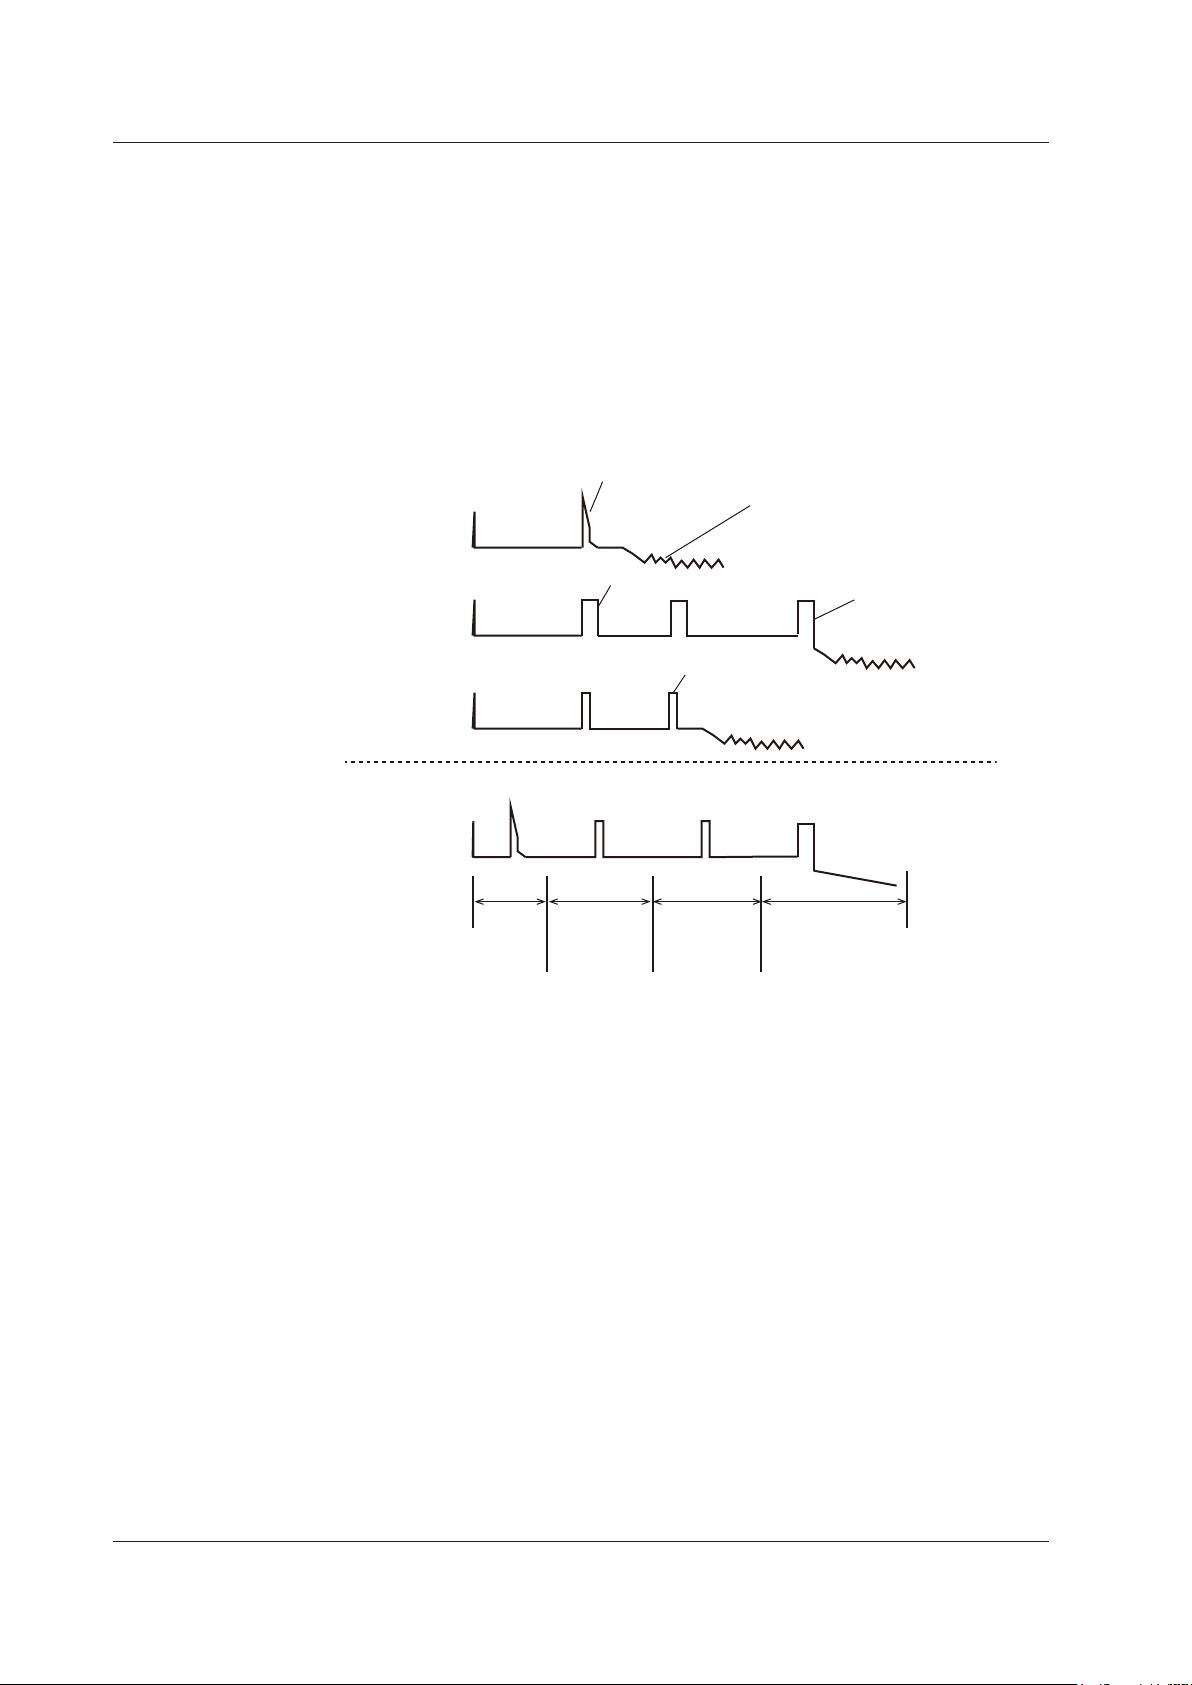
Increased waveform resolution
Measurement waveform using
an intermediate pulse width
(Trace2, Trace3)
1.7 Application
Adapt Trace Using TRACE Mode (waveform editing)
When you select TRACE mode, waveforms measured at different pulse widths can be displayed.
In an optical fiber cable measurement, reducing the pulse width of optical pulse measurement
increases the measurement resolution of the waveform in the near-end section but causes the
optical pulse to attenuate in the far-end section, preventing correct measurement. Conversely,
increasing the pulse width of optical pulse measurement allows correct measurement in the far-end
section but decreases the measurement resolution of the waveform in the near-end section.
The Adapt Trace feature compensates for these measurement accuracy degradations by performing
optical pulse measurement using multiple different pulse widths for the same wavelength and
combining the multiple waveforms on the screen. The instrument automatically determines the
pulse widths depending on the specified distance range and wavelength.
Measurement waveform
using a narrow pulse width
(Trace1)
Measurement waveform
using a wide pulse width
(Trace4)
Adapt Trace
When the distance is long,
measurement is not possible.
Decreased waveform resolution
Events in mid-range
can be measured.
Trace1
Trace2 Trace3 Trace4
Pulse
width
(narrow)
Pulse width
(intermediate)
Line 1 Line 2 Line 3
You can change the effective range of Trace1 to
Trace4 by moving the lines marking the sections.
Pulse width
(intermediate)
Events far away
can be measured.
Pulse width
(wide)
1-20
IM AQ1210-01EN
Page 27
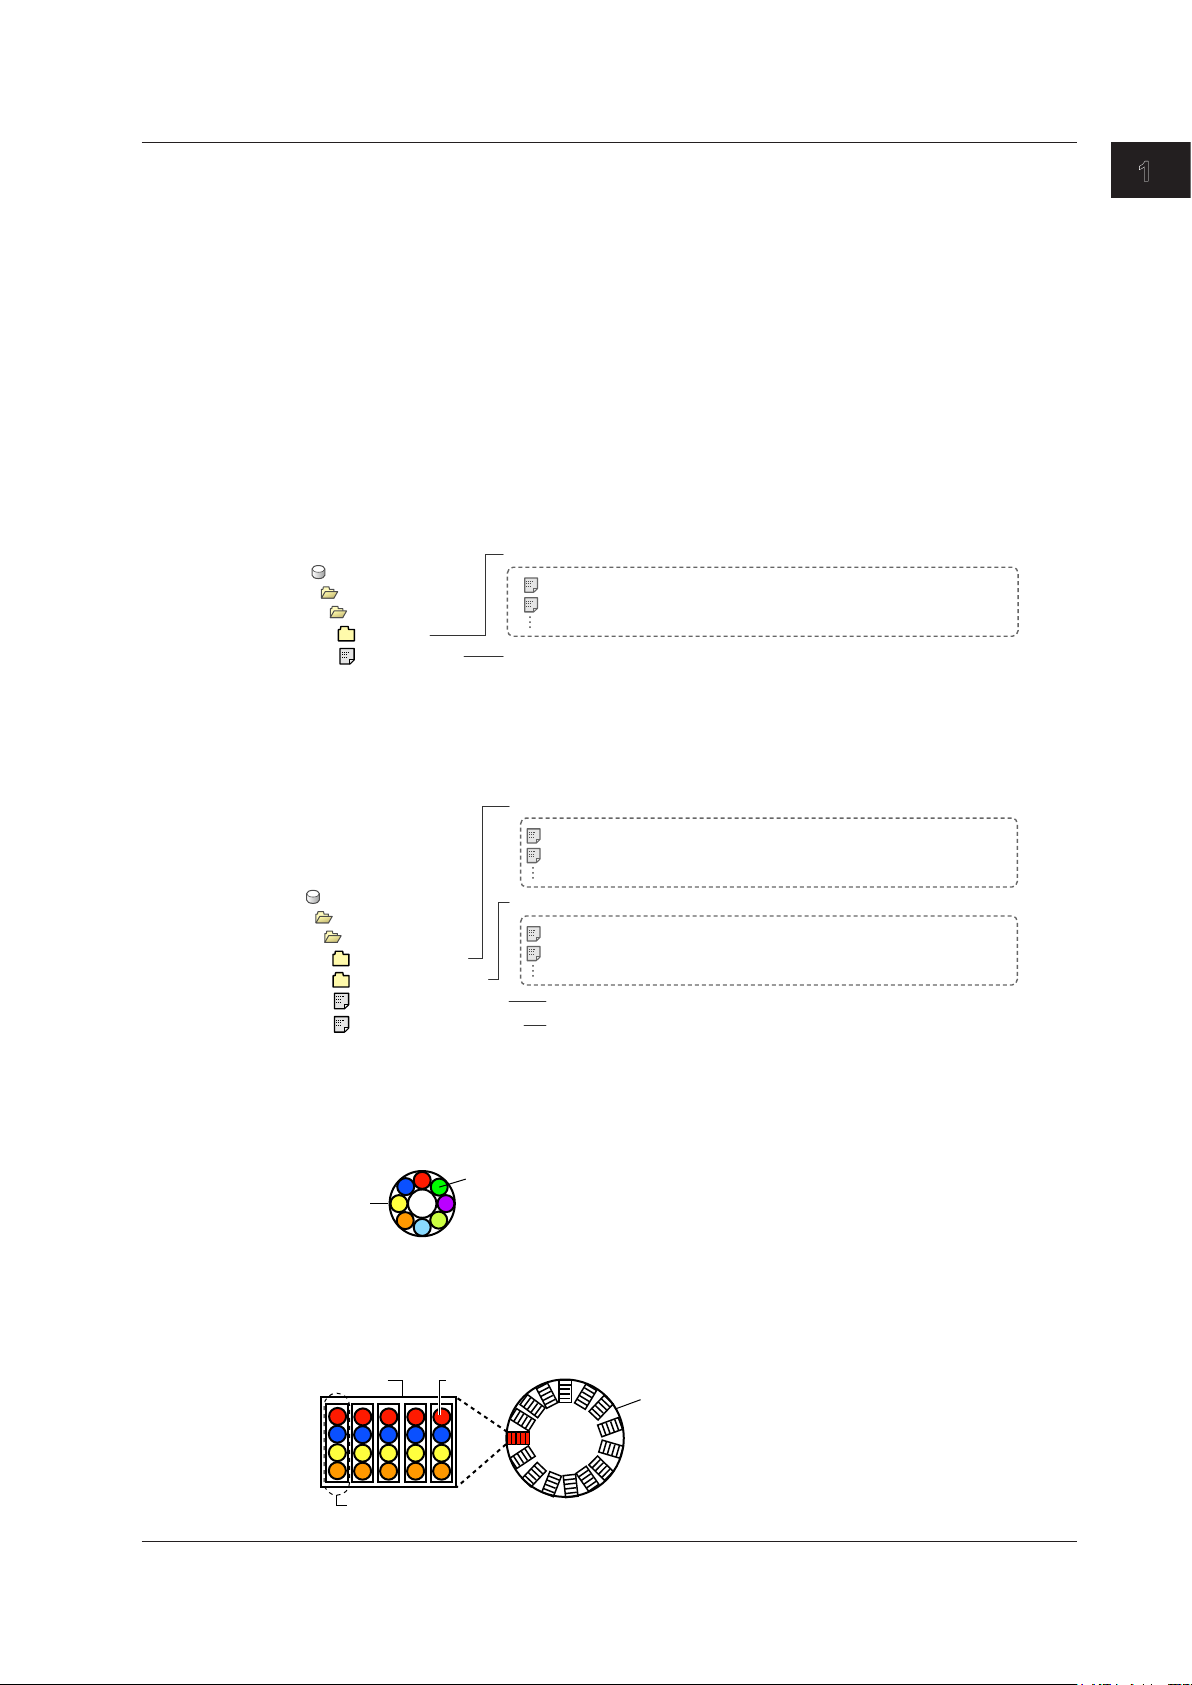
ABCDE.MPJ
The newly created project file
Measurement result files (.SOR extension)
Example of when the project file name is “ABCDE”
Folder for saving measurement result files (core numbers 1 to 10)
Folder for saving measurement result files (core numbers 101 to 200)
ABCDE_101_200.MPJ
The newly created project file (core numbers 101 to 200)
Normal core cable (example with eight cores)
Tape (example: 1a to 1d)
Ribbon slotted core cable (example of 300 fiber type 4-fiber ribbon)
This is an example of a 300 fiber type with 15 slots (20 fibers) containing five 4-fiber tapes.
The following settings need to be entered to set the information of this core cable in a project of this instrument.
• Num of Fibers (per slot): 20
• Tape No.: a-d(4)
1.7 Application
Optical Pulse Measurement of Multi-core Optical Fiber Cables
Projects
Projects are group of items for measuring multi-core fibers. The default project name is “NewProject.”
In the instrument internal memory, core information, measurement conditions, analysis conditions,
measured results, and the like are linked with the project name and saved. You can set up to 15
characters for the project name. For the types of strings and characters that you can use, see the
explanation in section 2.4.
• Project File Structure
When you create a new project name, a new project file (.MPJ extension) and a new folder
If the number of fibers exceeds 100, the folder for saving the project file and that for saving
for saving measurement result files (.SOR extension) are created. At this point, you can select
whether to inherit the fiber information, measurement conditions, and analysis conditions from an
existing project file or reset them to default values.
Internal Memory
DATA
MPJ
ABCDE
Folder for saving measurement result files
1310nm_0001.SOR
1310nm_0002.SOR
are automatically named and saved.
measurement result files will be divided. The folder is automatically divided every 100 fibers. The
divided folder names will be the project name followed by the start core number and end number
set in the project.
1
Features
Internal Memory
Number of Fibers, Number of Fibers in Each Division, Tape Number
The core number indications and settings vary depending on the type of multi-core fiber cable.
Eight cores are bundled into one.
Cable
DATA
MPJ
ABCDE_1_100
ABCDE_101_200
ABCDE_1_100.MPJ
Slot
Core
Core
1310nm_0001.SOR
1310nm_0002.SOR
1310nm_0101.SOR
1310nm_0102.SOR
The newly created project file (core numbers 1 to 100)
Cable
Measurement result files (.SOR extension)
are automatically named and saved.
Measurement result files (.SOR extension)
are automatically named and saved.
IM AQ1210-01EN
1-21
Page 28
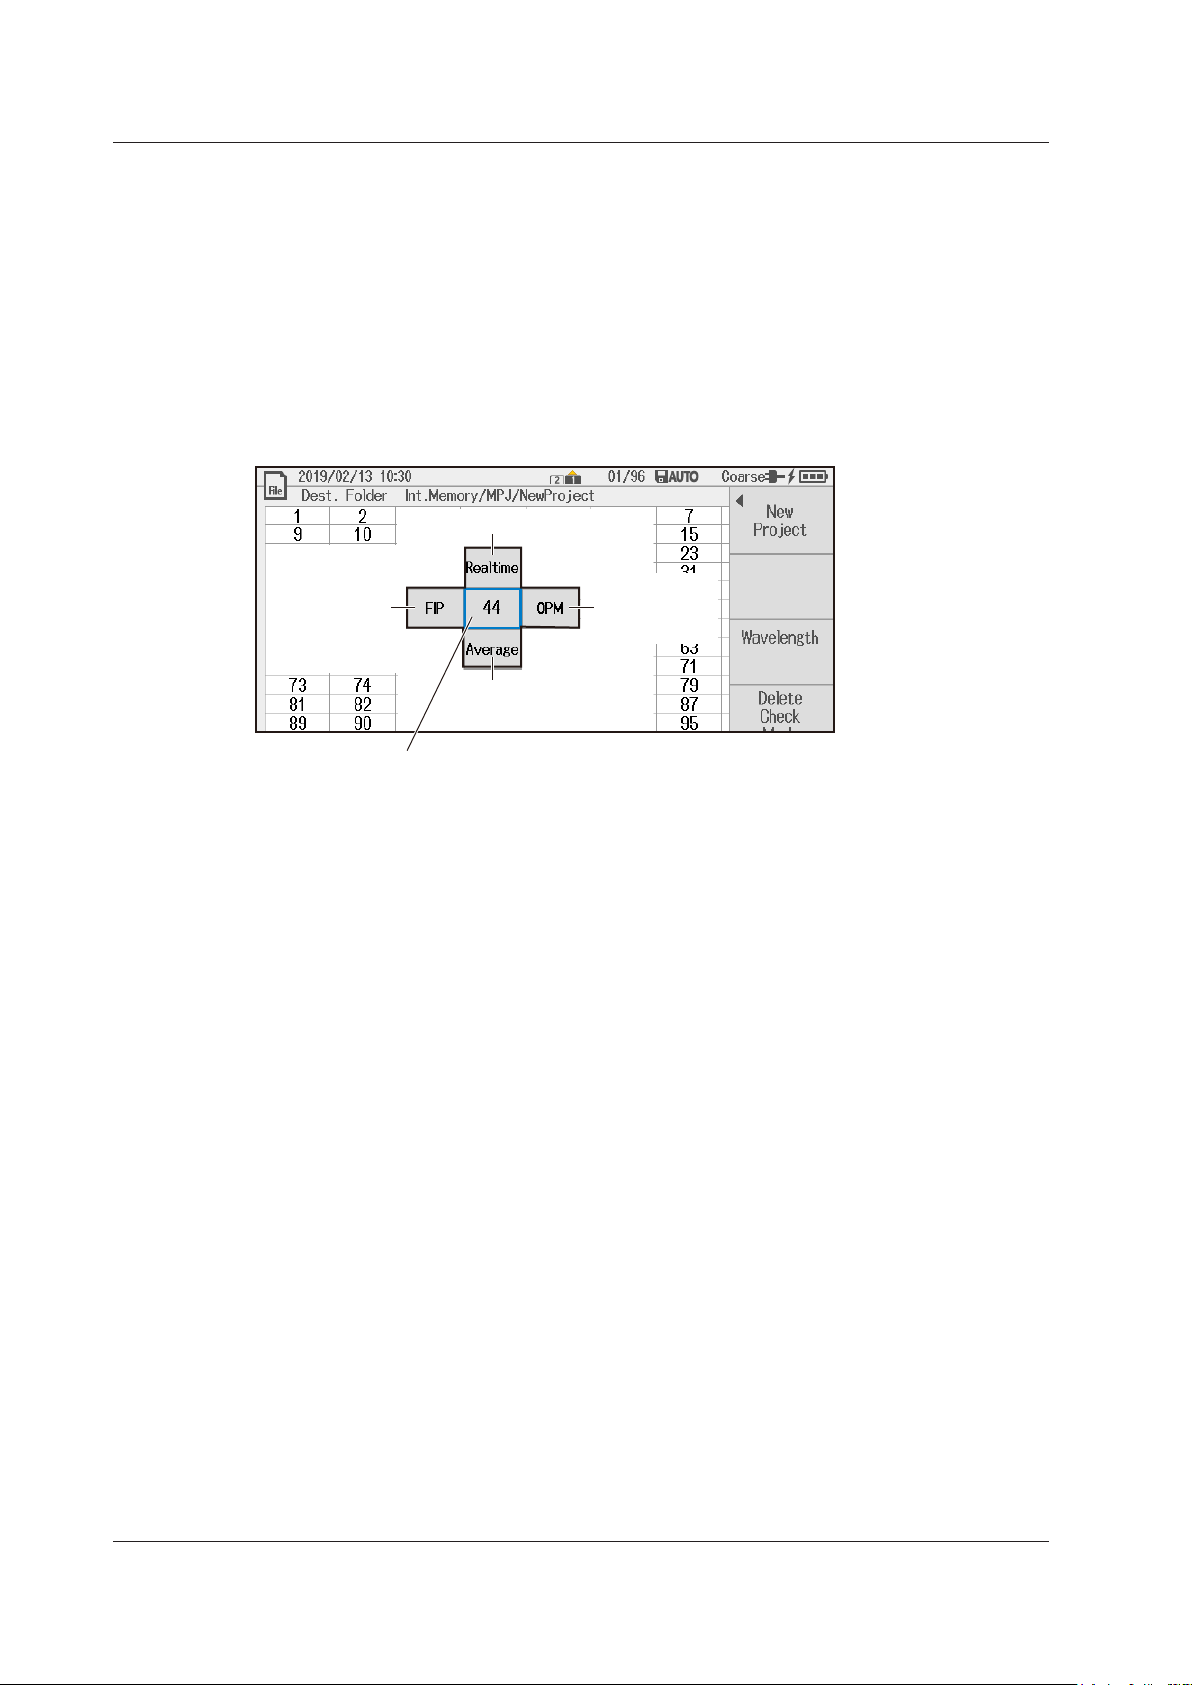
Example of measuring core number 44
1.7 Application
Multi-Fiber Measurement
The following four measurements can be performed in multi-fiber measurement.
• OTDR measurement (Realtime)
• OTDR measurement (Average)
• Optical power measurement
• Fiber Inspec Probe
The four measurement features use the same features as the OTDR feature for measuring a single
fiber explained in section 1.1, the optical power meter (excluding the logging feature) explained in
section 1.6, and the fiber end face inspection explained in section 1.6. You can run and use these
four measuring features from the main view screen of multi-fiber measurement.
OTDR feature (realtime)
Fiber inspection
probe
Saving Measurement Result Data
You can save the results of multi-fiber measurement for each fiber. The data is saved in the folder
explained in “Project File Structure” on the previous page. For details on the data format, see
section 9.4.
• OTDR Feature (Realtime, Average)
For each fiber, waveform data is saved in SOR format in a single file.
• Fiber Inspec Probe
For each fiber, screen capture data is saved in BMP format in a single file.
• Optical Power Meter
For each project, data is saved in tab-separated CSV format in a single file.
Optical power
meter
OTDR feature (average)
1-22
IM AQ1210-01EN
Page 29
AQ1210A, AQ1215A,
(this instrument)
(this instrument)
Optical fiber cable under loss test
OTDR port (PORT1)
Light source
Optical fiber cable under loss test
OTDR port (PORT1)
1.7 Application
Auto Loss Test (combination of light source and optical power
meter)
Using the instrument as a light source and optical power meter, you can easily measure optical fiber
cable and line degradation. You can also use the AQ1100/AQ1200A/AQ1200B/AQ1200C/AQ1200E/
AQ1205A/AQ1205E/AQ1205F in the multi-field tester series instead of this instrument as the light
source or optical power meter.
Light Source Feature
You can set up to two measurement light wavelengths and produce them in order. You can produce
a constant level of light if you use the optical power adjustment feature.
Optical Power Meter Feature
The instrument automatically identifies the measurement light from the opposing instrument
or AQ1100/AQ1200A/AQ1200B/AQ1200C/AQ1200E/AQ1205A/AQ1205E/AQ1205F that it is
connected to and measures the optical power.
AQ1210A, AQ1215A,
AQ1210E, AQ1215E,
AQ1215F, AQ1216F
1
Features
OPM port
AQ1210E, AQ1215E,
AQ1215F, AQ1216F
Loopback Feature
You can use the light source and optical power meter features on a single instrument to perform a
loop-back loss test on an optical fiber cable or line. To perform loss testing, connect one end of the
optical fiber cable that you want to perform loss testing on to the the instrument’s OTDR port (PORT1)
and the other end to the OPM port on the same instrument.
Light source
Optical power meter
OPM port
Optical power meter
AQ1210A, AQ1215A,
AQ1210E, AQ1215E,
AQ1215F, AQ1216F
IM AQ1210-01EN
1-23
Page 30
AQ1210A, AQ1215A,
Create a project
OTDR port (PORT1)
Transfer the project data
1.7 Application
Multicore Loss Test
You can efficiently measure multicore optical fiber cable and optical line degradation.
Projects
Projects are group of items for measuring multi-core fibers.
This feature is the same as that explained in “Optical Pulse Measurement of Multi-core Optical Fiber
Cables” on page 1-21.
• Number of Fibers, Number of Fibers in Each Division, Tape Number
The core number indications and settings vary depending on the type of multi-core fiber cable.
These features are the same as those explained in “Optical Pulse Measurement of Multi-core
Optical Fiber Cables” on page 1-21.
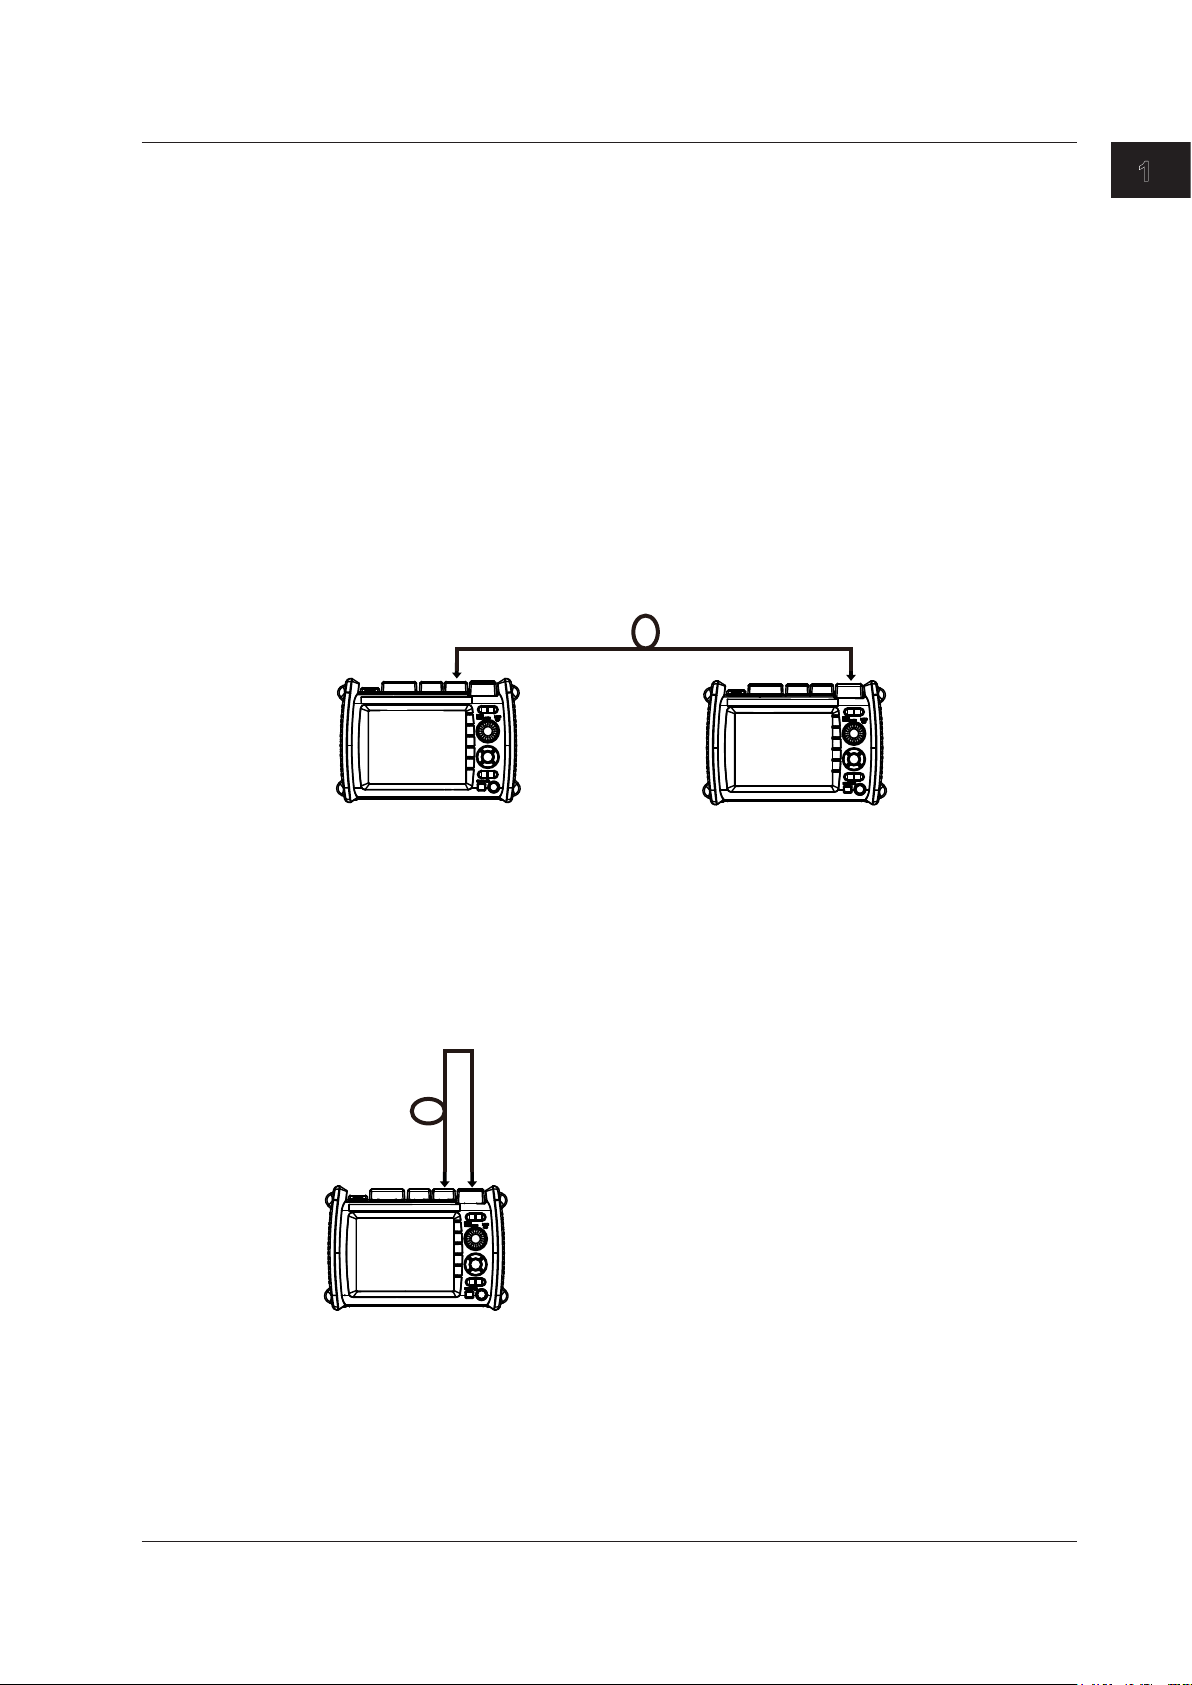
Master and Slave
Connect two instruments and specify the optical power meter as the master and the light source
as the slave. You can also use the AQ1100/AQ1200A/AQ1200B/AQ1200C/AQ1200E/AQ1205A/
AQ1205E/AQ1205F in the multi-field tester series instead of this instrument as the master or slave.
The preparation involves the following steps.
• Connecting an Optical Fiber Cable for Signal Transmission (step 1)
To transmit, between the master and slave, project setup information and information about the
fiber under loss test, you must specify a fiber cable from the multi-core optical fiber cable to use
for the signal transmission. Connect one end of the optical fiber cable for signal transmission to
the OTDR port (PORT1) of the instrument specified as the master (optical power meter side) and
the other end to the OPM port of the instrument specified as the slave (light source side).
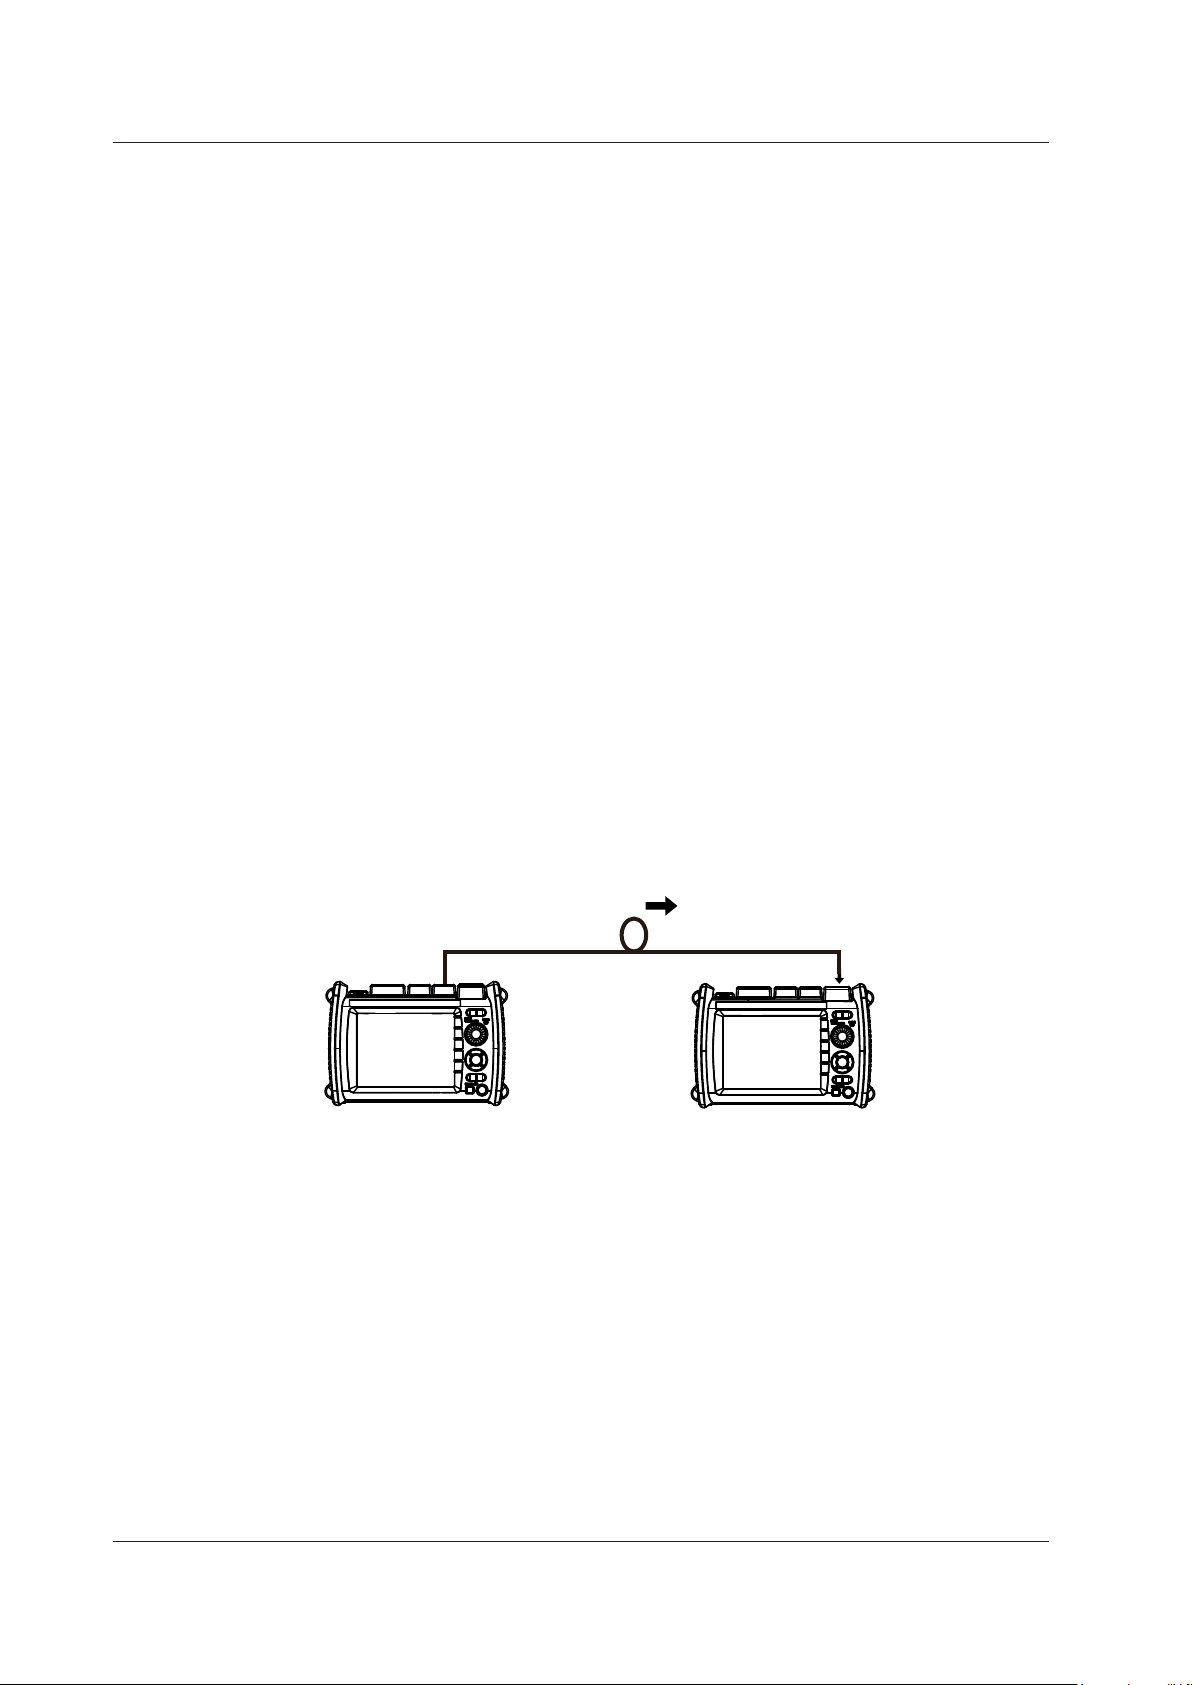
• Transferring Object Information from the Master to the Slave (step 2)
On the master instrument, create a project. Transfer the project information to the slave
• Connecting the Optical Fiber Cable to Perform Multi-Core Loss Test On (step 3)
Multi-core loss test is performed on all optical fiber cables other than the optical fiber cable for
instrument through the optical fiber cable for signal transmission.
Optical fiber cable for signal transmission
AQ1210A, AQ1215A,
AQ1210E, AQ1215E,
AQ1215F, AQ1216F
Master (this instrument)
Slave (this instrument)
OPM port
AQ1210E, AQ1215E,
AQ1215F, AQ1216F
signal transmission. Connect one end of the optical fiber cable to be tested to the OPM port of
the master instrument and the other end to the OTDR port (PORT1) of the slave instrument.
1-24
IM AQ1210-01EN
Page 31

AQ1210A, AQ1215A,
Execute a multicore loss test
Transfer the results of the multicore loss test
Trace 1
Trace 2
Trace 3
Trace 4
Displays up to four waveforms simultaneously
You can move a waveform over another waveform to compare the two.
1.7 Application
Executing the Multi-Core Loss Test
First, start the multi-core loss test on the master instrument. The core number information of the
1
Features
cores to be tested is transmitted from the master side through the optical fiber cable for signal
transmission. When the core numbers to be measured are received through the OPM port, the
slave instrument will be ready to execute a multi-core loss test.
Execute the multi-core loss test on the slave side. The light to be measured is output from the
OTDR port (PORT1) on the slave side. This light enters the OPM port on the master side, and
the loss in the optical fiber cable with the target core number is measured.
The measurement results are sent from the master to the slave instrument through the optical
fiber cable for signal transmission.
OTDR port (PORT1)
OPM port
AQ1210A, AQ1215A,
AQ1210E, AQ1215E,
AQ1215F, AQ1216F
Master (this instrument)
Optical fiber cable for signal transmission
Light being measured
Optical fiber cable under
multicore loss test
OPM port
OTDR port
(PORT1)
AQ1210E, AQ1215E,
AQ1215F, AQ1216F
Slave (this instrument)
If you cancel an ongoing multi-core loss test, the completed portion of the measurement results
are held, so you can resume the test from the optical fiber cable with the next target core
number.
Advanced Analysis
Multi Trace Analysis
You can load up to four waveforms that have been measured on the instrument and display
them simultaneously for comparison. You can adjust the vertical display position of each loaded
waveform.
IM AQ1210-01EN
1-25
Page 32

End A
End B
A
D
A
D
Trace 1
(Current trace)
Trace 2
(Differential trace)
(Trace 2) – (Trace 1)
The differential trace is the result of subtracting the values
You can perform marker analysis on the differential trace.
1.7 Application
2 way trace analysis
Waveform events that have been measured from optical fiber cable end A to end B and those
measured from end B to end A can be combined. This combination enables displaying of events
that could not otherwise be measured because of dead zones.
In the figure below, the event that is in the near-end dead zone (point S) when measured from end
A is detected as event number 5 when measured from end B. In the 2 way trace analysis display, it
is displayed as event number 1.
End A → End B
End A ← End B
2 way trace analysis
An event of the other waveform that exists within 6% of the position of an event of the current trace
will be considered part of the current trace event.
If multiple events of the other waveform that exists within 6% of the position of an event of the
current trace, the closest event will be considered part of the current trace event.
Waveforms that meet the following conditions can be combined.
• Both have the same wavelength.
• Both have the same pulse width.
• Their end position offset is within 6%.
• Both have event lists.
Differential Trace
You can load two waveforms that have been measured on the instrument and display their
difference as a waveform.
The screen can display the loaded waveforms and the differential trace simultaneously.
The differential trace is the result of subtracting the values of the current trace from those of the
other trace.
You can use markers to read the following values of the differential trace.
• Loss between markers (dB)
Loss between
• Distance to each marker
Distance between
This
instrument
▲ ▲ ▲ ▲ ▲ ▲
S 1 2 3 4 E
▲ ▲ ▲ ▲ ▲ ▲
5
▲ ▲ ▲ ▲ ▲ ▲
S
2 3 4 E5
1
and B and between C and
and B and between C and
This
instrument
S1234E
1-26
of the current trace from the target trace.
A
C
B
D
IM AQ1210-01EN
Page 33

S E
1.7 Application
Section Analysis
You can set two markers, start point S and end point E, to measure the return loss and total loss in
the section that you have specified. By setting reference point B, you can calculate the return loss
using the backscatter level you specify.
1
Features
B
IM AQ1210-01EN
1-27
Page 34

1.8 File Features
Measured results (waveform data), measurement and analysis conditions, system settings, and the
like can be saved as files to internal memory or external memory (USB memory). You can efficiently
configure multiple instruments to the same conditions by loading a file containing measurement and
analysis conditions, system settings, and the like. In addition, the instrument can save measured
waveform data as PDF data in report format.
Saving and Loading Files
Saving and Loading Files
The following types of files can be saved.
• .SOR
A file for saving optical pulse measurement results. Measurement and analysis conditions,
waveform data, event list data (when event analysis is executed) are stored in this file. When
an SOR file is loaded, the measurement and analysis data is loaded into the instrument, the
waveform data is displayed on the instrument screen. If event list data is stored, event analysis
results are also displayed. This file is useful when you want to save an SOR file at a site where
optical fiber cables are being installed and load the file into another instrument at a different site.
Only SOR files (waveform data) measured with conditions that are valid for the instrument can
be loaded.
• .PDF
A file for saving the current waveform displayed on the instrument screen or waveform data of an
already saved file in a PDF report format.
• .CFG
A file for saving the instrument system settings (device, connection, etc.). This file is useful when
you want to apply the same system settings to several instruments.
• .BMP, JPG
A file for saving a screen image of the instrument. This file is useful when you want to view the
screen content on the PC screen. BMP and JPG files cannot be loaded into the instrument.
• .SOZ
A file for saving multiple waveforms measured simultaneously.
• .SMP
A file for saving waveforms measured with a feature equivalent to Smart Mapper.
Selecting Drives
You can set the save destination to the following internal and external memories.
• Internal Memory
The memory inside the instrument. The size is about 256 MB. It cannot be removed.
• USB Memory
USB storage device.
1-28
IM AQ1210-01EN
Page 35

Event search conditions
Measurement
1.8 File Features
Creating Reports
Creating Reports
You can save the current optical pulse measurement and analysis conditions, waveforms, and
events as a report on a single sheet in a PDF file. You can choose which items to include in the
report.
Event icon display
Waveform display
Label information
1
Features
conditions
Event analysis results
File Reporting
You can specify several saved SOR files and save the content of the files one at a time as a report
on a single sheet in a PDF file. You can choose which items to include in the report.
File Operations
Copying and Deleting Files
You can copy or delete all the files and folders in the internal memory or external memory. You can
also copy or delete selected files or folders.
Renaming Files
You can rename existing files and folders.
Creating Folders
You can create a folder with a name of your choice in which optical pulse measurement results
are saved automatically. In the settings for automatically saving measure data explained in section
4.4, you can set the name of the folder in which to save the results automatically. When you
select a folder that you created with a name of your choice, measurement results can be saved
automatically to this folder.
IM AQ1210-01EN
1-29
Page 36

1.9 System Features
Power-Save Mode
To suppress battery consumption, you can set the screen brightness and a screen saver. You can set
different screen brightness levels for battery operation and USB-AC adapter operation.
LCD Brightness
You can select from four brightness levels (including OFF). You can choose the appropriate level
depending on the ambient light during outdoor use. You can turn off the display except when
viewing the measured data to suppress battery consumption.
Auto Sleep
If the instrument is turned on and is not accessed for a certain time, the instrument automatically
switches to sleep mode to suppress battery consumption.
Factory Default Settings
Setup
The following setup conditions are reset to their factory defaults. Note that files in the internal
memory are not deleted.
• OTDR feature setup (chapter 2)
• Utility feature (chapter 7)
• Application feature (chapter 8)
• System settings (chapter 10, except the date and time)
All
All the above setup conditions are reset to their factory defaults. All the files in the USER folder of
the internal memory are also deleted. The files in the following folders are not deleted.
• BACKUP (contains system files)
The files in this folder are deleted once, and factory default files are created again.
• USERS_MANUAL (contains the user’s manuals)
These files are not delete.
Configuring Network Settings
You can use a communication dongle (wired LAN adapter or wireless LAN adapter) to remotely control
the instrument from a PC (OTDR Remote Controller) and transfer measured results in the instrument’s
internal memory to a network server (File Transfer@OTDR Data Transporter).
• User Name and Password
Set user names and passwords for authenticating connections from PCs to the instrument.
• Timeout Period
If a communication command is not sent from a PC or measured results are not downloaded
within the timeout period, the instrument releases the network connection.
• TCP/IP
Set network address information.
• Enabling and Disabling Network Connection
Remote control can be disabled. When disabled, a PC cannot connect to the instrument.
1-30
IM AQ1210-01EN
Page 37

1.9 System Features
WLAN Application (wireless LAN)
You can use a communication dongle (wireless LAN adapter) to remotely control the instrument
from a PC (OTDR Remote Controller) and transfer measured results in the instrument’s internal
memory to a network server (OTDR Data Transporter).
• Application Setup
You can set user names and passwords for authenticating connections from PCs to the
instrument.
• Access Point Mode Setup
You can set network information for running the instrument as an access point. This is used
to connect the instrument and terminals directly without connecting a wireless router or other
network device.
Other Features
Language Selection
You can change the language used on the instrument screen.
Start Menu
You can select the screen that is displayed when the instrument starts.
• Trace
When the instrument starts, a screen with the data display area set to waveform display appears.
• Map
When the instrument starts, a screen with the data display area set to icon display appears.
• Setup Info.
When the instrument starts, the OTDR setup menu appears.
1
Features
Screen Color
You can set the screen color (color 1, color 2, or black and white).
Alarm
The instrument can generate sound when an operation error message is displayed.
USB (TypeC)
You can use USB port type C to send communication commands from a PC to the instrument or
download measured results from the instrument internal memory or SD card to a PC.
Operation Restrictions
You can set a PIN to restrict the following operations. This feature prevents settings from being
changed or laser light to be emitted by mistake.
• Mode
Changing from Simple Mode to another mode
• Laser light output
When an operation to emit the following laser light is performed
Optical pulse (OTDR), light source (measurement light), VLS
Expiration Date
This feature displays a message at startup or locks the instrument when the specified expiration
date arrives. You can display a message that urges you to calibrate the instrument or the like when
the recommended calibration period elapses.
IM AQ1210-01EN
1-31
Page 38

1.9 System Features
Version Update
You can update the firmware by storing a new firmware in a USB memory device and connecting it
to USB port type A.
Installing Options
You can install additional option licenses (sold separately) for the AQ1210.
For details on the available option licenses, see Getting Started Guide, IM AQ1210-02EN.
1-32
IM AQ1210-01EN
Page 39

1
Set wavelength 1 (1310nm,
1550nm, 1625nm/1650nm).
Set the distance range.
Set the attenuation
2^16, 2^17, 2^18, 2^19, 2^20)
Chapter 2 Setting Up the OTDR Feature
2.1 Measurement (Measure) Conditions
Procedure
Press MENU to display the MENU screen.
1.
For details on the MENU screen, see the Getting Started Guide, IM AQ1210-02EN.
Tap OTDR to display the OTDR screen.
2.
Press SETUP to display the setup screen.
3.
Tap the MEASURE tab to display the following screen.
4.
● AQ1210A, AQ1210E
(AUTO, 200m, 500m, 1km, 2km, 5km, 10km,
20km, 30km, 40km, 50km, 100km, 200km,
256km)
● AQ1215A, AQ1215E, AQ1215F, AQ1216F
(AUTO, 200m, 500m, 1km, 2km, 5km, 10km,
20km, 30km, 40km, 50km, 100km, 200km,
300km, 400km, 512km)
MEASURE tab
Set the sample interval
(Normal, Hi-Resolution).
( AUTO, 0.00dB, 2.50dB, 5.00dB,
7.50dB, 10.00dB, 12.50dB, 15.00dB,
17.50dB, 20.00dB, 22.50dB, 25.00dB,
27.50dB, 30.00dB).
Set the pulse width.
● AQ1210A, AQ1210E
(AUTO, 5ns, 10ns, 20ns, 30ns,
50ns, 100ns, 200ns, 300ns, 500ns,
1μs, 2μs, 5μs, 10μs, 20μs)
● AQ1215A, AQ1215E, AQ1215F,
AQ1216F
(AUTO, 3ns, 10ns, 20ns, 30ns,
50ns, 100ns, 200ns, 300ns, 500ns,
1μs, 2μs, 5μs, 10μs, 20μs)
2
Setting Up the OTDR Feature
Set wavelength 2
(OFF,
1310nm/1550nm).
Set the connection
check (OFF, ON).
Set the fiber-in-use alarm
(OFF, ON).
Set the event search (OFF, ON).
Set the average
method
(Hi-Speed,
Hi-Reflection).
Set the average duration
(when the average unit is set to Duration).
(AUTO, 5sec, 10sec, 20sec, 30sec, 1min,
3min, 5min, 10min, 20min, 30min)
Set the average times
(when the average unit is set to Times).
(AUTO, 2^10, 2^11, 2^12, 2^13, 2^14, 2^15,
Set the
average unit
(Duration,
Times).
Set auto save.
See the next
page.
Initializes the
measurement
settings
IM AQ1210-01EN
2-1
Page 40

Set auto save (OFF, ON).
Set the file name.
Set the file type (*.SOR).
The data save format is fixed to waveform data (SOR extension).
2.1 Measurement (Measure) Conditions
Configuring Auto Save (when averaged measurement is complete)
Tap Auto Save to display the Auto Save screen.
When the mode is set to Date
Select the destination drive (internal memory, USB memory).
This is displayed when the mode is set to Date, in which case you can set it.
Set the mode (Date, UserDefine).
Select how to specify the save destination
folder. You can set this when auto save is ON.
See section 2.4.
When the mode is set to UserDefine
Save destination folder
The current file path is displayed.
This is displayed when the mode is set to User Define.
Displays the file list of the folder displayed in the current file path.
For details on file operations, see section 9.6.
2-2
IM AQ1210-01EN
Page 41

1
Explanation
Wavelength
You can enter the following wavelengths.
Model Optical Pulse Wavelength
AQ1210A 1310 nm, 1550 nm, 1310 nm/1550 nm (multi wavelength measurement)
AQ1215A 1310 nm, 1550 nm, 1310 nm/1550 nm (multi wavelength measurement)
AQ1210E 1310 nm, 1550 nm, 1625 nm, 1310 nm/1550 nm (multi wavelength measurement)
AQ1215E 1310 nm, 1550 nm, 1625 nm, 1310 nm/1550 nm (multi wavelength measurement)
AQ1215F 1310 nm, 1550 nm, 1650 nm, 1310 nm/1550 nm (multi wavelength measurement)
AQ1216F 1310 nm, 1550 nm, 1650 nm, 1310 nm/1550 nm (multi wavelength measurement)
In a single measurement, 1310 nm and 1550 nm are measured one at a time.
If 1310 nm/1550 nm is selected, the wavelength of optical pulse being measured is displayed on the
Distance Range
Set the distance range according to the length of the optical fiber cable. The distance range that you
can select varies depending on the wavelength. Specify a distance range value that is greater than
the length of the optical fiber cable that you will measure. If you specify a shorter value, the instrument
will not be able to perform measurements properly. The longer the distance that you specify, the more
time measurements will take. When you specify the distance range, the optimum pulse width and
attenuation values are set automatically.
Cable Length Distance Range Cable Length Distance Range
Unknown Auto 16 km to 24 km 30 km
0 m to 160 m 200 m 24 km to 40 km 50 km
160 m to 400 m 500 m 40 km to 80 km 100 km
400 m to 800 m 1 km 80 km to 160 km 200 km
800 m to 1.6 km 2 km 160 km to 240 km 256 km, 300 km
1.6 km to 4 km 5 km 240 km to 320 km 400 km
4 km to 8 km 10 km 320 km to 400 km 512 km
8 km to 16 km 20 km
2.1 Measurement (Measure) Conditions
2
Setting Up the OTDR Feature
1310 nm/1550 nm (multi wavelength measurement)
screen.
Pulse Width
The pulse width has the following characteristics.
• A short pulse width enables you to measure with a high resolution, but you cannot measure long
distances.
• A long pulse width enables you to measure long distances, but you cannot measure with a high
resolution. Also, dead zones are larger with long pulse widths.
The pulse widths that you can select vary depending on the distance range, as shown in the
following table.
Distance Range Selectable Pulse Widths
200 m 3 ns/5 ns
500 m 3 ns/5 ns
1 km 3 ns/5 ns
2 km 3 ns/5 ns
5 km 3 ns/5 ns
10 km 3 ns/5 ns
20 km 3 ns/5 ns
30 km 10 ns 20 ns 30 ns 50 ns 100 ns 200 ns 300 ns 500 ns 1 µs 2 µs
50 km, 100 km 20 ns 30 ns 50 ns 100 ns 200 ns 300 ns 500 ns 1 µs 2 µs 5 µs 10 µs 20 µs
200 km 30 ns 50 ns 100 ns 200 ns 300 ns 500 ns 1 µs 2 µs 5 µs 10 µs 20 µs
300 km 50 ns 100 ns 200 ns 300 ns 500 ns 1 µs 2 µs 5 µs 10 µs 20 µs
1 The pulse width is 5 ns on the AQ1210A/AQ1210E and 3 ns on the AQ1215A/AQ1215E/AQ1215F/AQ1216F.
IM AQ1210-01EN
1
10 ns 20 ns 30 ns 50 ns 100 ns 200 ns 300 ns 500 ns
1
10 ns 20 ns 30 ns 50 ns 100 ns 200 ns 300 ns 500 ns
1
10 ns 20 ns 30 ns 50 ns 100 ns 200 ns 300 ns 500 ns 1 µs
1
10 ns 20 ns 30 ns 50 ns 100 ns 200 ns 300 ns 500 ns 1 µs
1
10 ns 20 ns 30 ns 50 ns 100 ns 200 ns 300 ns 500 ns 1 µs
1
10 ns 20 ns 30 ns 50 ns 100 ns 200 ns 300 ns 500 ns 1 µs
1
10 ns 20 ns 30 ns 50 ns 100 ns 200 ns 300 ns 500 ns 1 µs 2 µs
2-3
Page 42

If reflections are large, the waveform may saturate.
2.1 Measurement (Measure) Conditions
Sample Interval
The maximum number of sample data points is 256000. The shortest sample interval is determined by
the distance range.
Normal: The instrument uses the optimum sample interval for the measurement method to
perform measurements.
Hi-Resolution: The instrument uses a sample interval that would result in the greatest number of
data points.
If you use a short sample interval, you can measure for finer changes. However, the data size of the
measured result becomes large.
Attenuation
If large reflections are caused by connectors or by breaks in the optical fiber cable, the waveform may
be saturated. Specify attenuation to prevent the waveform from being saturated. The attenuations that
you can select vary depending on the pulse width, as shown in the following table.
Pulse Width (Example) Selectable Attenuations
3 ns/5 ns
30 ns, 50 ns
100 ns, 200 ns, 300 ns,
500 ns, 1 µs
2 µs, 5 µs 0dB, 2.50dB, 5.00dB, 7.50dB, 10.00dB, 12.50dB, 15.00dB, 17.50dB, 20.00dB,
10 µs, 20 µs 0dB, 2.50dB, 5.00dB, 7.50dB, 10.00dB, 12.50dB, 15.00dB, 17.50dB, 20.00dB,
1 The pulse width is 5 ns on the AQ1210A/AQ1210E and 3 ns on the AQ1215A/AQ1215E/AQ1215F/
1
, 10 ns, 20 ns,
AQ1216F.
0dB, 2.50dB, 5.00dB, 7.50dB, 10.00dB, 12.50dB, 15.00dB
0dB, 2.50dB, 5.00dB, 7.50dB, 10.00dB, 12.50dB, 15.00dB, 17.50dB, 20.00dB
22.25dB, 25.00dB
22.25dB, 25.00dB, 27.50dB, 30.00dB
Average Method
Hi-Speed
In Hi-Speed mode, all sections are measured according to the specified attenuation. If the specified
attenuation value is not appropriate and a large reflection occurs, the waveform for that section may
be saturated.
Hi-Reflection
In Hi-Reflection mode, the instrument can perform measurements correctly even if large reflections
(excluding extremely large reflections caused by sections of the fiber such as the open end of the
fiber) occur. In Hi-Reflection mode, the instrument sets the optimum attenuation according to the
backscatter level for each section, and performs the measurement. Therefore, the measurement
time is longer than in Hi-Speed mode.
The partitioning of the optical fiber into sections and the specifying of the optimum attenuation are
done automatically.
2-4
Note
Except when the optical fiber cable is short and there are no reflections, we recommend that you measure
with the average method be set to Hi-Reflection.
IM AQ1210-01EN
Page 43

1
2.1 Measurement (Measure) Conditions
Average Unit
Time: Measurements are performed only over the specified duration. If you specify a short duration,
depending on the measurement conditions, measurements may not have finished when the
specified time elapses.
Count: Measurements are performed only the specified number of times.
Average Count and Average Duration
You can select the following values.
Duration: 5sec, 10sec, 20sec, 30sec, 1min, 3min, 5min, 10min, 20min, 30min
Sec is seconds, and min is minutes.
Times: 2^10 (1024 times), 2^11 (2048 times), 2^12 (4096 times), 2^13 (8192 times), 2^14 (16384
times),
2^15 (32768 times), 2^16 (65536 times), 2^17 (131072 times), 2^18 (262144 times),
2^19 (524288 times),
2^20 (1048576 times)
2^10 is 2 to the power of 10 (1024 times).
• The maximum average count is 2^20. If you specify a duration to average over that causes this
number of times to be exceeded, the measurement will finish before the duration to average over
elapses.
• Due to the influence of other measurement conditions, a measurement may take less time than the
duration you have specified or it may not complete when the specified duration elapses.
• If you specify a large value for the number of times or the duration, you can perform highly precise
measurements, but the measurement time becomes longer. Keep the instrument’s dynamic range
and the loss of the optical fiber cable under measurement in mind when you specify these values.
• The display of the duration or the number of times is determined by the specified average unit.
• If Auto is selected, one of the options above is used.
2
Setting Up the OTDR Feature
Event Search
Event search is a feature that automatically searches for losses and reflections in the data that is
acquired during averaged measurements. Losses and reflections detected in waveform data are
known as events. For details on analyzing detected events, see chapter 5.
Auto: After averaged measurements complete, events are automatically searched for and listed,
and the event screen and event analysis menu are displayed.
Manual: After averaged measurements complete, the waveform is displayed, but events are not
searched for.
Fiber-in-Use Alarm
The instrument uses the same wavelength that is used in real communication to measure optical
pulses. If communication light is present in the optical fiber cable that you want to measure, the
communication will be affected. When this communication light is present, we say that the fiber is in
use. The fiber-in-use alarm is a feature that checks if communication light is being transmitted along
the optical fiber cable that you are trying to measure. If the fiber is in use, a warning message is
displayed asking whether you want to continue the measurement.
Connection Check
The connection check is a feature that checks the state of the connection between the instrument
and an optical fiber cable. When this feature is set to on, you can prevent light from being transmitted
from the instrument OTDR port or light source port if an optical fiber cable is not connected to the
instrument or if the cable is not connected correctly.
OFF: Connections are not checked.
ON: Connections are checked.
IM AQ1210-01EN
2-5
Page 44

2.1 Measurement (Measure) Conditions
Auto Save
After an averaged measurement of the optical pulse is complete, the measurement waveform is
automatically saved.
• Set the mode.
Select how to specify the save destination folder.
Date: Folders that are named with dates are automatically created in the selected
drive.
UserDefine: Specify the save destination folder.
• Destination Folder
Create a folder of your choice in advance in the selected drive, and select this folder as the save
destination folder.
2-6
IM AQ1210-01EN
Page 45

1
2.2 Analysis (ANALYSIS) Conditions
See the next page.
Set the end of fiber
Set the splice loss
(0.01dB to 9.99dB).
Set the approximation
Set the threshold (0.001dB to 99.999dB).
Show the bending loss in the analysis results (OFF, ON).
Procedure
1.
2.
3.
4.
Press MENU to display the MENU screen.
For details on the MENU screen, see the Getting Started Guide, IM AQ1210-02EN.
Tap OTDR to display the OTDR screen.
Press SETUP to display the setup screen.
Tap the ANALYSIS tab to display the following screen.
(3dB to 70dB).
ANALYSIS tab
Set macro bending (OFF, ON).
See “Setting Macro Bending (detecting bending loss),”
explained later.
2
Setting Up the OTDR Feature
Set the return loss
(20dB to 70dB).
Set the splitter loss
(1dB to 20dB).
Set the pass/fail
judgment (OFF, ON).
See the next page.
Setting Macro Bending (detecting bending loss)
5.
Set the approximation
method (marker; TPA, LSA).
Set the launch fiber (OFF, ON).
Set the IOR/backscatter level.
See page 2-9.
Tap Macro Bending to display the Macro Bending screen.
method (event; TPA,
LSA).
Executes initialization
Press to reset the analysis settings
to their factory defaults.
IM AQ1210-01EN
2-7
Page 46

Specify the launch fiber section using the distance from the end point (E).
Set the connector loss threshold (0.01dB to 9.99dB).
Set the splitter loss (1dB to 20dB).
2.2 Analysis (Analysis) Conditions
Setting a Launch Fiber
Tap Launch Fiber Setting to display the Launch Fiber Setting screen.
5.
Specify the launch fiber section using an event number.
Set the distance from the end point
(E)(0.00m to 9999.99m).
Configuring Pass/Fail Judgments
Tap Pass Fail Judgment to display the Pass Fail Judgment screen.
5.
Set the splice loss threshold (0.01dB to 9.99dB).
Turns the pass/fail judgment on or off
You can select items when Pass Fail Judgment is set to ON.
Set the end event (None, 1, 2).
Set the start event (None, 1, 2).
Set the return loss threshold
(20dB to 70dB).
Set the total loss threshold for each wavelength (0.01dB to 9.99dB).
Set the loss threshold per kilometer for each wavelength (0.01dB to 9.99dB).
2-8
IM AQ1210-01EN
Page 47

1
Setting the IOR/Backscatter Level
Set the IOR each wavelength (1.3000 to 1.7999).
* Pulse width used as a base for the backscatter level
5.
2.2 Analysis (Analysis) Conditions
Tap IOR/Backscatter Level to display the IOR/Backscatter Level screen.
2
Setting Up the OTDR Feature
Set the backscatter level base
(1μs, 1ns).
Set the backscatter level for each wavelength.
1 µs pulse width*: –10.00dB to –64.99dB
1 ns pulse width*: –40.00dB to –94.99dB
IM AQ1210-01EN
2-9
Page 48

2.2 Analysis (Analysis) Conditions
Explanation
Splice Loss
If a splice loss that exceeds the specified threshold occurs, it is detected as an event.
The range is 0.01 dB to 9.99 dB.
Return Loss
If a return loss that is less than or equal to the specified threshold occurs, it is detected as an event.
The larger the reflection, the smaller the return loss, so events (reflections) are detected when the
return loss is less than or equal to the threshold.
The range is 20 dB to 70 dB.
End of Fiber
If a reflection that exceeds the specified threshold occurs, it is detected as the end of the optical fiber
cable (Fresnel reflection).
The range is 3 dB to 65 dB.
Splitter Loss
Events whose loss exceeds this value are assumed to be optical splitters according to the number
splits.
The range is 1 dB to 20 dB.
Macro Bending (Bending Loss)
When an optical pulse measurement is performed in multi wavelength measurement (when wavelength
setting is 1310 nm/1550 nm), you can compare the splice losses at each wavelength and display on
the screen bending loss events that are caused by bends in the optical fiber cable.
Display
This function displays the detected bending losses in the event list on the event screen when optical
pulses are measured.
OFF: The bending losses are not displayed in the event list.
ON: The bending losses are displayed in the event list.
Threshold
This is the threshold of the difference between the splice losses of each wavelength when optical
pulses are measured.
When the difference between the splice losses of each wavelength for the same event is larger than
this value, the event is detected as a bending loss.
The range is 0.001 dB to 99.999 dB.
Launch Fiber Setting
When you connect a launch fiber cable to avoid near-end dead zones, you can set the launch fiber
cable events (start point and end point) or start position so that the event information in the launch
fiber section is excluded from the analysis conditions.
2-10
Pass Fail Judgment
A judgment is performed on the events detected in the target waveform, and those that exceed the
specified threshold are displayed as fault events on the event screen.
ON: Pass/fail judgment is set to ON, and events that have exceeded their thresholds are displayed
with an asterisk attached to them (see section 1.5).
OFF: Pass/fail judgment is set to OFF, and events that have exceeded their thresholds are not
displayed with an asterisk attached to them.
IM AQ1210-01EN
Page 49

1
Approximation line
1 2
2.2 Analysis (Analysis) Conditions
Approximation Method
When the instrument calculates splice loss, it extrapolates straight lines. These straight lines are
known as approximation lines.
There are the following two kinds of approximation lines.
• Least squares approximation (LSA)
• Two point approximation (TPA)
LSA
The instrument calculates the loss between two points by using the least squares method on all the
data between the two points (between 1 and 2).
This method has the following characteristics.
Advantage: Because all the data between the two points is used, errors in the calculated value
are small. Fluctuations in the calculated values are reduced, and highly reproducible
values can be obtained.
Disadvantage: If a large reflection or splice loss is present in the section whose loss is being
calculated, those values are also included in the calculation, so large errors result.
If no events such as reflections and splice losses are present in the section being calculated, the
LSA provides a value that has a smaller degree of error than the TPA.
1 2
2
Setting Up the OTDR Feature
TPA
The instrument uses the difference between the levels of the two specified points to calculate the
loss. The level of fluctuation and reproducibility in the calculated value may vary greatly. If events
such as reflections and splice losses are present in the section being calculated, the TPA provides a
value that has a smaller degree of error than the LSA.
Approximation line
calculation range
calculation points
IM AQ1210-01EN
2-11
Page 50

2.2 Analysis (Analysis) Conditions
Backscatter Level
Light that travels through an optical fiber cable displays a phenomenon known as Rayleigh scattering.
Due to this phenomenon, light is sent backwards, in the direction opposite to the direction of
propagation. This phenomenon is known as backscattering. The backscatter level setting is used when
the instrument calculates the return loss and total return loss.
If you do not set the correct backscatter level, the return loss and total return loss measurements will
be incorrect.
On the instrument, you can select the reference pulse width for the backscatter level (see section 3.2).
The selectable range of backscatter levels vary depending on the reference pulse width.
1µs:Therangeis–10.00to‒64.99.
1ns:Therangeis–40.00to‒94.99.
The instrument has the following preset backscatter levels that correspond to each wavelength.
Wavelength 1 µs pulse width 1 ns pulse width
1310 nm –50dB –80dB
1550 nm –52dB –82dB
1625 nm –53dB –83dB
1650 nm –53dB –83dB
Index of Refraction (IOR)
The instrument uses the index of refraction to calculate the distance. If you do not set the index
of refraction correctly, the distance measurement will be incorrect. The index of refraction varies
depending on the connected optical fiber cable. Enter the value recommended by the manufacture of
the cable.
The instrument has the following preset indices of refraction that correspond to each wavelength.
Wavelength Index of Refraction (IOR)
1310 nm 1.46000
1550 nm 1.46000
1625 nm 1.46000
1650 nm 1.46000
You can specify a value from 1.30000 to 1.79999.
2-12
IM AQ1210-01EN
Page 51

1
2.3 Display (OTDR) Conditions
Set the ghost cursor
Set the cumulative loss type.
See page 2-14.
Procedure
Press MENU to display the MENU screen.
1.
For details on the MENU screen, see the Getting Started Guide, IM AQ1210-02EN.
Tap OTDR to display the OTDR screen.
2.
Press SETUP to display the setup screen.
3.
Tap the OTDR tab to display the following screen.
4.
(OFF, ON).
Set the marker mode
(Marker, Line).
Marker information display
(OFF, ON)
OTDR tab
Approximation line display
(OFF, ON)
2
Setting Up the OTDR Feature
Set the distance
unit.
Not displayed when
the suffix code is -HJ.
Select the Cursor
display format
(CROSS(+), LINE(¦ ))
Set the total
return loss
(Include END,
Exclude END).
Set the work completion notice.
See page 2-15.
Set the screen zoom direction
(Natural, Legacy).
Set the end point
loss display (OFF,
ON).
Set operation restrictions.
See page 2-14.
Set the total loss calculation method
(Cumul-Loss, Loss between S and E).
IM AQ1210-01EN
2-13
Page 52

Select the restriction mode.
(the default value is
Enter the new PIN again for confirmation.
2.3 Display (OTDR) Conditions
Setting the Cumulative Loss Type
Tap Cumul-Loss Type to display the Cumul-Loss Type screen.
5.
Note
With Type1, loss is measured from the measurement start point to the measurement point.
With Type2, loss is measured from the event marker (Y2) to the measurement point.
With Type3, loss is measured from the approximation line of the event marker (Y2) to the measurement
point.
For each type, the loss measurement range varies depending on whether the distance reference is set (top
illustration in the screen) or not set (bottom illustration in the screen). For details, see "Explanation" in this
section.
Select type
1, 2, or 3.
Setting Operation Restrictions
Tap Operation Lock Setup to display the Operation Lock Setup screen.
5.
• No Check: Operation possible without entering the PIN.
• Check only once: Enter the PIN only for the first operation.
• Check everytime: Enter the PIN for every operation.
Enter the old PIN
0000).
Enter the new
PIN.
Confirms the input
2-14
IM AQ1210-01EN
Page 53

1
Configure the work completion notification.
Set the notification (OFF, ON).
Set the message display at work completion
(OFF, ON).
Example of 4 Point Markers: Marker
1 2 3
5.
2.3 Display (OTDR) Conditions
Tap Work Completion Notice Setup to display the Work Completion Notice Setup screen.
2
Setting Up the OTDR Feature
Set the confirmation message (OFF, ON).
Set how to display the message confirming
whether you have moved the cursor to the
work completion point.
Explanation
Marker Mode
Markers
Move the cursor to the location that you want to measure, and set a marker. When you are
measuring return loss and splice loss, they are calculated automatically when you set all the
markers that are necessary for the measurement method that you are using. For instructions on
how to use markers, see section 6.1.
Set the alarm sound at work completion
(OFF, ON).
IM AQ1210-01EN
2-15
Page 54

Example of 5 Point Markers: Line
line F–f
2.3 Display (OTDR) Conditions
Line
After you select the line marker that you want to operate from a set of multiple line markers, move
the selected line marker directly. The value of the line marker's section is calculated, and the return
loss and splice loss are measured. Each value is calculated in real time as you move the line
marker. For instructions on how to use markers, see section 6.1.
Note
Line is often used outside of Japan. Marker is often used within Japan. It is used on existing YOKOGAWA
models.
Displaying Approximation Lines
In the 4 Point (marker mode set to Marker) or 5 Point (marker mode set to Line) marker modes, you
can display the approximation lines that are used to calculate splice loss or return loss.
OFF: Approximation lines are not displayed.
ON: Approximation lines are displayed.
Example of 5 Point Markers: Line
Example of 4 Point Markers: Marker
1
Approximation line Y2–
n
Approximation
line n–N
Approximation
2
3
1 2 3
Y2
3
NfFE
2-16
IM AQ1210-01EN
Page 55

1
Ghost cursor
Optical fiber cable connection
2.3 Display (OTDR) Conditions
Ghost Cursor
The ghost cursor is used to check for secondary reflections. A secondary reflection is a reflection that
is detected in a location where no event actually occurs. The ghost cursor is automatically displayed at
twice the distance from where the cursor (primary) is placed. The ghost cursor moves in sync with the
cursor (primary).
OFF: The ghost cursor is not displayed.
ON: The ghost cursor is displayed.
Turn the rotary knob to move to the
Cursor (primary)
The actual reflection
waveform
next secondary reflection point.
2
Setting Up the OTDR Feature
Start point
Distance L
Distance 2L
Secondary reflection
waveform
• How Secondary Reflections Are Generated
The optical pulse that is generated from position I in the following figure propagates in the
direction of II.
↓
Light ray A that is reflected at connection II in the figure is reflected again at connection I and
propagates in the direction of II as light ray B.
At this point, the instrument detects A as an event.
↓
B is again reflected by connection II, and this generates reflected light ray C. At this point, the
instrument detects C as an event.
Because the instrument measures all the reflected light rays, A, C, and D, C is also detected as
an event in the same manner that an actually generated reflection is. Therefore, while there is no
actual event in this location, it appears as if an event has in fact occurred.
I II III
1)
2)
3)
1)
Distance L
Distance 2L
4)
Secondary
reflection
3)
4)
Distance Unit
Set the unit of distance to show in the screen. The default setting is km.
IM AQ1210-01EN
2-17
Page 56

Marker information
Reflection display
2.3 Display (OTDR) Conditions
Marker Information
You can display the distance from the measurement reference point to each marker on the waveform
display area.
OFF: Marker information is not displayed.
ON: Marker information is displayed.
Reflection Display (when the suffix code is -HJ)
You can set the reflection display at the calculation result display area of measurement data to either
of the following settings.
Return loss: The ratio of the incident optical power level and the reflected optical power level is
Reflection level: The reflected optical power level is displayed.
displayed.
2-18
IM AQ1210-01EN
Page 57

1
Calculation Method for Total Loss
Measurement reference point
Cumul-Loss
The integrated value of the splice losses at each event from the measurement reference point (S) is
displayed. This is the conventional calculation method.
Loss between S and E
The loss (TPA approximation method) between the measurement reference point (S) and the end of
fiber (E) is displayed.
Measurement reference point (S)
2.3 Display (OTDR) Conditions
2
Setting Up the OTDR Feature
Splice loss of each event
Splice loss
between
two points
Note
If Loss between S and E is selected, markers 1 and 2 are placed automatically at the measurement
reference point (S) and the END point (E) when event analysis is executed.
Calculation Method for Total Return Loss
Select whether to include the return loss value at the end of fiber (E) in the total return loss.
Include END The value is included in the total return loss.
Exclude END The value is not included in the total return loss.
Event No. 1
▲
S
▲
1
Event No. 2
▲
2
END point
▲
E
EEE
Display of the END Point Loss
The END point splice loss is shown in addition to return loss.
IM AQ1210-01EN
2-19
Page 58

Type 1 (without distance reference)
This method does not include the near-end
reflection in the cumulate loss value. The loss
from measurement start point S to the start
point of event No. 1 is measured.
Type 1 (with distance reference)
Type 2 (without distance reference)
This method does not include the near-end
reflection in the cumulate loss value. The loss
is measured using the same method as type
1 (without distance reference).
Type 3 (without distance reference)
This method includes the near-end reflection
in the cumulate loss value. The loss is
measured from where the approximation line
between measurement start point S and
event No. 1 intersects distance 0 km to the
start point of event No. 1.
Event No. 1
reference R and event No. 1 and the start point of event No. 1.
2.3 Display (OTDR) Conditions
Cumulative Loss Type
You can select the cumulative loss measurement method from the following three types in the event
analysis settings.
▲
Loss
S
Measurement
reference point
▲
Loss
S
Measurement
reference point
▲
1
Event No. 1
▲
1
Event No. 1
This method includes the near-end reflection in the
cumulate loss value. The distance reference is set to the
start point of the near-end reflection. The loss from distance
reference R to the start point of event No. 1 is measured.
Distance reference R
Loss
▲
1
Event No. 1
Type 2 (with distance reference)
This method does not include the near-end reflection in the
cumulate loss value. The distance reference is set to the
start point of the near-end reflection. The loss from
near-end reflection end point Y2 to the start point of event
No. 1 is measured.
Distance reference R
Y2
Loss
▲
1
Event No. 1
Type 3 (with distance reference)
This method includes the near-end reflection in the cumulate
loss value. The distance reference is set to the start point of
the near-end reflection. The loss is measured from the
intersection of the approximation line between distance
Loss
▲
S
Measurement
reference point
Distance 0 km
Event Fix Mode
Event positions can be fixed. Fixed events are handled as master events. You can configure the
instrument so that in subsequent event analysis only master events are analyzed.
How the events that are detected at positions other than the master event positions are displayed
2-20
varies depending on the Event Fix Mode as follows:
Distance reference R
▲
S
Measurement
reference point
▲
1
Event No. 1
Loss
▲
1
IM AQ1210-01EN
Page 59

1
Events other than fixed events
number of this fixed event is updated
Not detected even when an event exists.
Zooms in vertically
Zooms out vertically
2.3 Display (OTDR) Conditions
• When Event Fix Mode Is Set to Mode1
Events detected at positions other than the master event positions are also displayed in the
event list.
• When Event Fix Mode Is Set to Mode2
Only the events that are detected at the master event positions are displayed in the event list.
are also detected.
An earlier event is detected, so the
(changes from 3 to 4).
2
Setting Up the OTDR Feature
Zoom Direction
You can select the zoom behavior of the waveform display that is controlled with the arrow keys.
• Natural
The waveform is zoomed.
Zooms out horizontally
• Legacy
The waveform display range is zoomed. For example, if you expand the waveform display range
to the entire waveform, the displayed waveform will appear smaller. If you reduce the waveform
display range to a portion of the waveform, the displayed waveform will appear larger.
Zooms in horizontally
Zooms in horizontally
Zooms out vertically
Zooms out horizontally
IM AQ1210-01EN
Zooms in vertically
2-21
Page 60

Crosshair display
2.3 Display (OTDR) Conditions
Operation Lock
You can lock the following operations using a PIN (password).
Operations That Can Be Locked
• This instrument’s emission of light
• The REAL TIME and AVG keys of the OTDR function
• The light source or visible light source ON soft key when an light source option (/SLT, /HLT, /VLS)
is installed
• The LS Power Adjust soft key in an auto loss test
(LS, loopback test)
• The LS Power Adjust soft key in an multi-core loss test (LS, loopback test)
• The Loss Test START soft key for executing the LS or loopback test of the auto loss test
• The Loss Test START soft key for executing the multi-core loss test
• Changing the measurement mode of the OTDR feature
• Changing the measurement mode from Simple mode to Detail mode
• Changing the measurement mode from Simple mode to multi wavelength measurement mode
PIN
The following two PINs are available.
• User PIN
A PIN required to perform the above operations. The default value is 0000.
• Administrator PIN
A PIN required to set the user PIN and restrict the above operations.
The default value is 0000.
Cursor Display Format
You can select the cursor display format from the following.
CROSS(+): The position on the waveform is displayed with vertical and horizontal cursors that
intersect.
LINE(¦ ): The position on the waveform is displayed with a vertical cursor.
Line display
Work Completion Notice
For details, see the explanation in section 3.3.
2-22
IM AQ1210-01EN
Page 61

1
2.4 File Conditions
Set comments for file names.
Initializes the instrument’s internal memory (inside the USER/DATA folder).
Procedure
1.
2.
3.
4.
Press MENU to display the MENU screen.
For details on the MENU screen, see the Getting Started Guide, IM AQ1210-02EN.
Tap OTDR to display the OTDR screen.
Press SETUP to display the setup screen.
Tap the File tab to display the following screen.
Set the report format.
See page 2-25.
Set the file name.
See page 2-24.
See page 2-27.
File tab
2
Setting Up the OTDR Feature
Setting the Direct
Save Method
See page 2-24.
Set the file report
format.
See page 2-26.
Set the label
content.
See page 2-27.
IM AQ1210-01EN
2-23
Page 62

Set the parts of the file name
Set the save action (Direct Save, Select ID).
Set the action to be taken when you tap the save icon of the
is displayed.
For details on file operations, see section 9.6.
2.4 File Conditions
Setting the File Name
Tap File Name Setup to display the File Name Setup screen.
5.
(ID No., Wavelength, Distance Range, Pulse Width, Comment 1 to Comment 10, Company Name,
Name, Cable ID, Fiber ID, Cable Code, Originating Loc (A), Terminating Loc (B)).
Set the items that will be displayed into parts to of the file name.
1
10
Set the separator
1 2 3 1 2 3
( , _ _ ,
~
~ , ^ ^ ).
1 2 3 1 2 3
Set the ID number
(0 to 9999).
Set the tape number
start character.
Set, within the
specified tape number
type range, the tape
number start character
that will be attached to
the file name.
Set the tape
number type.
(Off, a-b(2), a-c(3),
a-d(4), a-e(5), a-f(6),
a-g(7), a-h(8))
Set comments.
See page 2-27.
2-24
Setting the Direct Save Method
Tap Direct Save Setup to display the Direct Save Setup screen.
5.
Set the file type
(*.SOR, *.pdf, *.SOR+*.PDF).
The selected save destination
displayed waveform on the measurement screen.
Displays the file list of the folder shown in Save Folder.
File name that will
be assigned
IM AQ1210-01EN
Page 63

1
Setting the Report Format
Measurement information
display (OFF, ON)
See page 2-24.
Tap Report Setup to display the Report Setup screen.
5.
Measurement result
display (OFF, ON)
Fiber surface image
display (OFF, ON)
Waveform display
(OFF, ON)
Marker information
display (OFF, ON)
Measurement condition
display (OFF, ON)
Event search condition
display (OFF, ON)
MAP display
(OFF, ON)
Overview display
(OFF, ON)
2.4 File Conditions
2
Setting Up the OTDR Feature
Report layout
Automatically arranged
according to the on/off state of
display items
Pass fail condition
display (OFF, ON)
Event list display
(OFF, ON)
Set the file name.
Note
For details on the items, see “Explanation” in this section.
IM AQ1210-01EN
2-25
Page 64
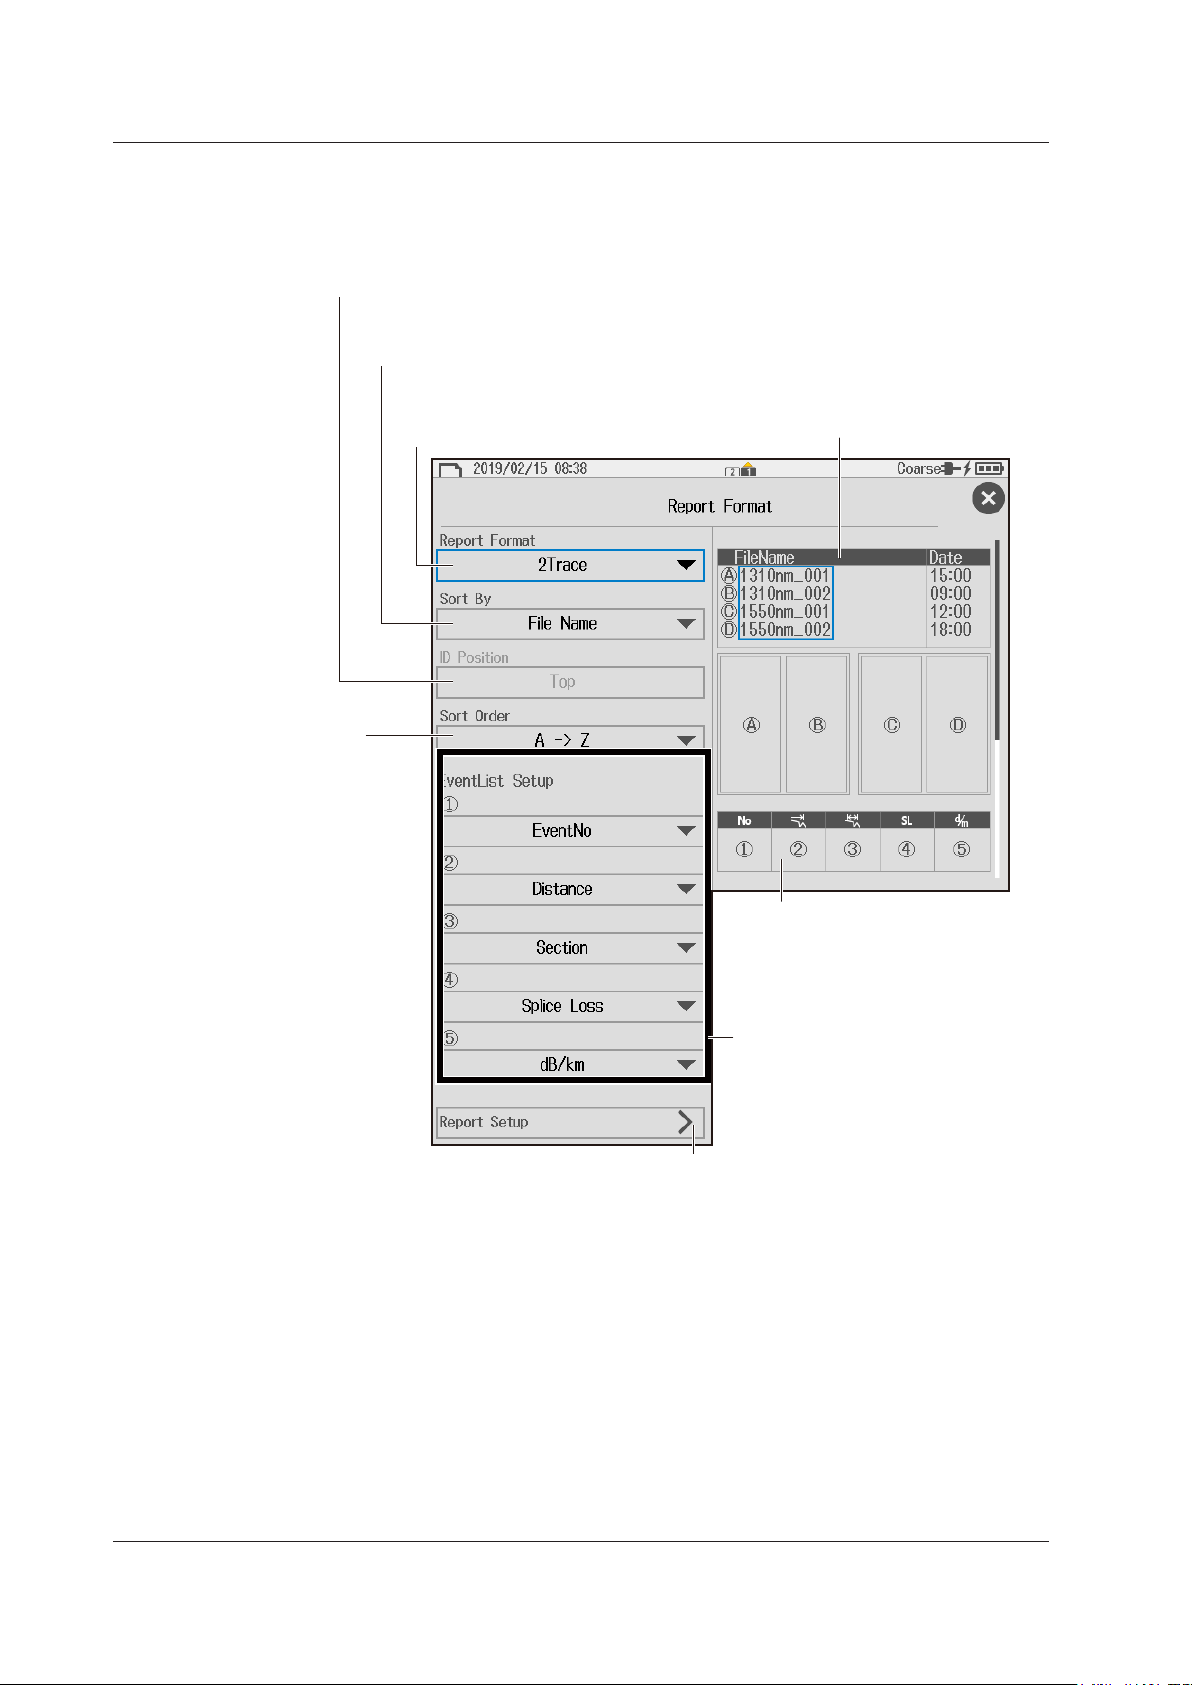
See the previous page.
ID Position (Top, Bottom)
Sort Order
(A -> Z, Z -> A)
Selects the output
sort order
2.4 File Conditions
Setting the File Report Format
5.
Tap File Report Setup to display the Report Format screen.
Set the ID position of the file name.
You can select this when the order is set to ID.
Order (File Name, Date, ID)
Select the file export order
(by file name, by date, by ID).
Number waveforms to display (1Trace, 2Trace)
Select the number of waveforms to show in a single page.
You can select the following items only when 2Trace is
selected.
Preview of the order in
which files will be
exported.
Event List preview
Automatically arranged according
to the on/off state of display items
Event list display items ON/OFF
Set the items you want to display to ON.
Up to 5 items can be set to ON.
Set the report format.
2-26
IM AQ1210-01EN
Page 65

1
Setting Comments
Set a comment (up to 30 characters).
Enter a comment by following the procedure provided in “Entering Text”
Label, Company Name, Name, Cable ID, Fiber ID, Cable Code, Originating Loc (A),
Set the current data flag
(BUILT (BC), REPAIRED
measured.
Tap Comment Setup to display the Comment Setup screen.
5.
2.4 File Conditions
Setting Labels
5.
in the Getting Started Guide, IM AQ1210-02EN.
Tap Label Setup to display the Label Setup screen.
2
Setting Up the OTDR Feature
Terminating Loc (B)
Enter a comment by following the procedure provided in “Entering Text” in the Getting Started
Guide, IM AQ1210-02EN. You can enter up to 36 characters.
Set the fiber type (652:Conventional SMF, 653:Dispersion Shifted SMF,
654:Cut-Off Shifted SMF, 655:Non-Zero Dispersion Shifted SMF, 656:NZDSF
for Wideband Transport, 657:Bend Optimized SMF, 651:Multi-Mode Fiber).
Select the check box to use the file
ID (ID number) as the fiber ID. For
details on ID numbers, see “Setting
the File Name” on page 2-24.
Direction (A -> B, B -> A)
Shows from which side the optical
fiber cable connecting the start
position (A) and stop position (B) was
(RC), OTHER (OT), and
CURRENT (CC)).
IM AQ1210-01EN
2-27
Page 66

1
2.4 File Conditions
Explanation
File Names and Comments
You can select up to 10 items to be used for file names. The items specified for fields 1 to 10 under
Name Type are displayed in order as a file name. The longest file name is 60 characters.
Item Description
ID No. Four digit number
The range is 0 to 9999. Four characters are assigned for the file name. For example, if
you set the number to “1,” “0001” will be used in the file name.
One character (tape number)
If you select to use the ID number for the file name, when Tape Number Type is set to
anything other than Off, the tape number is automatically appended to the ID number.
Example: If you have a combination of ID No. “0” and Tape Number Type “a to c (3),” the
filenameswillbesetasfollows:0000a→0000b→0000c→0001a→0001b
→0001c.
Wavelength Six characters containing the wavelength number and unit (Example: 1310 nm)
Comment Up to 30 characters. However, because the entire file name must be within 60 characters,
you may not be able to set 30 characters.
Company name
Name
Cable ID
Fiber ID
Cable Code
Start position
End position
• If the whole file name is longer than 60 characters, the excessive characters will be deleted.
• Blank cannot be specified for field
• You cannot set duplicate items for Name Type.
You can select some of the label items. For details, see the table under “Label” later in
this section.
under Name Type.
2-28
Types of Characters and Strings Allowed in File and Folder Names
The following restrictions apply to the types of characters and strings allowed in file and folder
names.
• The following exact strings cannot be used due to MS-DOS limitations:
AUX, CON, PRN, NUL, CLOCK, CLOCK$, LPT0, LPT1, LPT2, LPT3, LPT4, LPT5, LPT6, LPT7,
LPT8, LPT9, COM0, COM1, COM2, COM3, COM4, COM5, COM6, COM7, COM8, COM9
• Of those characters on the keyboard that appears on the screen, the characters that can be used
are 0-9, A-Z, a-z, _, –, =, (, ), {, }, [, ], #, $, &, ~, !, `, and @.
@ cannot be entered consecutively.
• Keep the full path name (absolute path from the root folder) within 200 characters.
If this is exceeded, an error will occur when you perform file operations (save, copy, rename,
create folder, etc.).
Full path name: When you are operating a folder, it is the path up to the folder name.
When you are operating a file, it is the path up to the file name.
Saving Directly
• Setting the File Type
Set whether to make the measurement results to be saved into waveform data or a report.
*.SOR: Saved as waveform data
*.PDF: Saved in a report format
*.SOR+*.PDF: Both waveform data and report format are saved simultaneously.
• Setting the Save Operation
Set how to save the file when you save data.
Direct Save: A file name as assigned automatically according to the file name setup
conditions, and the file is saved.
Select ID: A file name as assigned automatically according to the file name setup conditions.
Then, you set a 2-digit ID to be appended to the file name. Finally, the file is saved.
IM AQ1210-01EN
Page 67

1
Map
Measurement
conditions
2.4 File Conditions
Report Format
Measure Conditions (Job Information)
The following information is included.
Label Originating Loc
Company Name Terminating Loc
Name Current Data Flag
Fiber ID Supplier Name
Fiber Type Model Name
Cable ID Unit Name
Cable Code FW Ver.
Report creation date and time
1
Information such as label and company name can be specified on the Label Setup screen explained
in “Setting Labels.” Set these if necessary.
Measured Results (Link Summary)
The following information is included.
• Total distance
• Total loss
• Total return loss
• Number of events
• Fault events
• Pass/fail judgments
• Measured date
*1, *2
1
1
1
1 Automatically included by the instrument
2 Firmware version
2
Setting Up the OTDR Feature
Map, Waveform, Marker Information, Measurement Conditions, and Overview
These are included as shown below.
Waveform (Trace)
Marker
information
Overview
IM AQ1210-01EN
2-29
Page 68

2.4 File Conditions
• Map
The events in the event list are mapped as icons. Up to 100 events can be mapped. For a
description of icons, see section 1.3.
Start point
0km 1km 2km 3km
0.00000
Event Search Conditions
The following information is included.
• Splice loss
• Return loss
• End of fiber
• Splitter loss
• Backscatter level
• Macro bending
Pass/fail Judgment Conditions
The following information is included.
• Connector loss
• Splice loss
• Return loss
• Splitter loss
• dB/km
• Total loss
Icon display
Connector (return loss)
Connector (return loss)
2.519
2.51949 3.39012
Distance scale
value
0.870
Distance between
events
0.252
3.64268
Distance from the start point
Splice point
End point
0.310
3.95274
2-30
EventList Setup
The following information is included.
• Event number
• Distance
• Section
• Splice loss
• Return loss
• Cumulate loss
• dB/km
• Event type
• Section group index
IM AQ1210-01EN
Page 69

1
2.4 File Conditions
Report Format
If the file action is set to File Report, you can select the number of waveforms to display in a page. If
you select 2Trace, you can select the export order, sort order, and event list items.
Number of Waveforms to Display (Report Format)
1Trace: The waveform information of a single file is included in a single page.
2Trace: The waveform information of two files is included in a single page.
Sort By
Select the file export order when exporting multiple selected files to PDF.
File Name: Files are exported to PDF in order by the file name string.
Date: Files are exported to PDF in order by date.
ID: Files are exported to PDF in order by ID number.
ID Position
Set where in the file name the ID (ID number) of the selected file is located.* Files with ID numbers
set to positions other than top or bottom cannot be exported to PDF in the correct order.
* For the file name format, see “Filename Setup Screen” in section 6.3.
Top: The four digit number in the beginning of the file name is identified as the ID number.
Bottom: The four digit number in the end of the file name is identified as the ID number.
Sort Order
A -> Z: In the case of numbers, the order is 0 to 9. In the case of alphabet characters, the order
is a to z.
Z -> A: In the case of numbers, the order is 9 to 0. In the case of alphabet characters, the order
is z to a.
2
Setting Up the OTDR Feature
EventList Setup
Set the items to show in the event list. If the number waveforms the display (report format) is
2Trace, up to five items can be displayed in the event list. If five items are On, other items cannot
be set to On.
ON: Events are displayed in the event list.
OFF: Events are not displayed in the event list.
Setting Labels
You can specify the following items. If you save waveform data measured from an optical pulse to a
file in SOR format, the following label information is also saved.
Item Description
Company Name Up to 36 characters
Name Up to 36 characters
Cable ID Up to 36 characters
Fiber ID Up to 36 characters
Fiber type 652:Conventional SMF General purpose single mode
653:Dispersion Shifted SMF Dispersion shifted
654:Cut-Off Shifted SMF Cut-off shifted
655:Non-Zero Dispersion Shifted SMF Non-zero, dispersion shifted, single mode
656:NZDSF for Wideband Transport Wideband non-zero, dispersion shifted, single
mode
657:Bend Optimized SMF Bend optimized single mode
651:Multi-Mode Fiber Multi mode
Cable Code Up to 36 characters
Originating Loc (A) Up to 36 characters
Terminating Loc (B) Up to 36 characters
Current Data Flag Shows the operation state.
BUILT (BC), REPAIRED (RC), OTHER (OT), and CURRENT (CC)
IM AQ1210-01EN
2-31
Page 70

1
2
Set the wavelength.
See page 3-2.
Switches the display between
Displays the soft key menu
Chapter 3 Performing Real-time Measurement
3.1 Performing Real-time Measurement
WARNING
During measurement, light is transmitted from the light source ports. Do not disconnect the
connected optical fiber cables. Visual impairment may occur if the light enters the eye.
French
AVERTISSEMENT
Lorsque instrument génère de la lumière, la lumière est émise à travers les ports de source
lumineuse. Ne pas débrancher les câbles de fibre optique connectés. Des lésions oculaires
peuvent être causées si le faisceau lumineux pénètre l’œil.
Procedure
Real-Time Measurement Screen (OTDR screen)
Press MENU to display the MENU screen.
1.
For details on the MENU screen, see the Getting Started Guide, IM AQ1210-02EN.
Tap OTDR to display the OTDR screen.
2.
3
Performing Real-time Measurement
Utility
See chapter 7.
Save data directly.
See section 4.4.
Set the attenuation.
See sec. 2.1.
Displays the data
management buttons
See section 9.3.
Data display screen
TRACE mode and MAP mode
Real-time measurement in
progress indication
The OTDR port emitting light
Laser on indication
IM AQ1210-01EN
Set the pulse width.
See section 2.1.
Set the IOR.
See section 2.2.
Set the distance range.
See section 2.1.
Set the averaging conditions.
See section 2.1.
Expands the data
display area
3-1
Page 71

Soft key menu
During real-time measurement
3.1 Performing Real-time Measurement
Executing a Real-Time Measurement
Tap Wavelength to set the wavelength.
3.
Press REAL TIME to start a real-time measurement.
4.
During measurement, a mark appears at the top of the display to indicate that the laser light is on. Pressing
REAL TIME again stops the measurement.
Note
• You can select the initial screen that appears when the instrument starts in system settings. For details on
operation, see the explanation in section 10.1.
• If distance range and pulse width are set to auto, the instrument automatically selects the optimal values
internally immediately before starting a real-time measurement. Change these values if necessary. For
details, see section 2.1.
Soft Key Menu (during real-time measurement)
Tap the soft key menu display button.
5.
The menu that can be used during real-time measurement or the menu that can be used not during realtime measurement is displayed automatically depending on the usage condition.
3-2
IM AQ1210-01EN
Page 72

1
2
• When Real-Time Measurement Is in Progress
Cable installation
completion notification
See section 3.3.
Switches the waveform
display fresh rate
Work trace comparison
control
See section 3.4.
position were each marker
is placed
Section analysis control
See section 6.4
between the real-time measurement
Clears the snapshot waveform
3.1 Performing Real-time Measurement
Marker operation
See section 6.1.
Cuts waveform display
noise
Captures the
waveform data before
the construction
3
Performing Real-time Measurement
Clears markers
Loss monitor markers
Displays the loss at the
• When Real-Time Measurement Is Not in Progress
Marker operation
See section 6.1.
Event analysis control
See section 5.1.
Snapshot (Reference
trace) control
See section 6.3.
Set work completion.
See section 3.3.
Takes a snapshot
Moves the
snapshot
waveform up
Moves the
snapshot
waveform down
Displays the difference waveform
waveform and snapshot waveform
Switches the current trace
Can be controlled during multi
wavelength measurement.
IM AQ1210-01EN
3-3
Page 73

3.1 Performing Real-time Measurement
Explanation
Real-time Measurement
In real-time measurement, the waveform display is updated in real time. This feature is used
to monitor the waveforms. Because averaged measurement requires a certain amount of
measurement time, checking (monitoring) whether waveforms can be displayed correctly on the
data display screen before starting averaged measurement can save time. In addition, you can
operate markers and cursors during measurement. For cursor operation, see sections 3.2 and 6.1.
For marker operation, see section 6.1.
Distance Range
With the auto setting, the instrument detects the open end (end point) at the start of a real-time
measurement and automatically calculates the length of the optical fiber cable. When setting the
distance range manually, set a distance range appropriate for the length of the optical fiber cable to
be measured. For details on the appropriate distance range, see section 2.1.
Pulse Width
With the auto setting, when the distance range is set to auto, the minimum pulse width that can
measure the distance to the open end (end point) is selected. When setting the pulse width
manually, set a pulse width appropriate for the distance range. For details on the appropriate pulse
width, see section 2.1.
Attenuation
With the auto setting, an attenuation value is selected according to the distance range and the loss
in the optical fiber cable being measured. If you want to set the attenuation value manually, select a
value appropriate for the pulse width. For details on the attenuation value appropriate for the pulse
width, see section 2.1.
Switching the Waveform Display Refresh Rate
The real-time measurement waveform display updates the displayed waveform each time an optical
fiber cable is measured. This update rate can be changed according to your application.
Hi-Speed: The quality of the displayed waveforms decreases slightly, but the waveform
Reflections on the displayed waveform may saturate or may be buried in noise.
Hi-Reflection: The quality of the display waveforms is prioritized. Waveforms are displayed and
Cutting the Waveform Display Noise
This feature removes noise at the far-end point.
display is updated quickly.
updated with high precision.
Noise floor
Event waveform
Cuts noise
3-4
IM AQ1210-01EN
Page 74

1
2
3.1 Performing Real-time Measurement
Switching the Display between TRACE Mode and MAP Mode
When you start a real-time measurement, the data display screen automatically switches to TRACE
mode.
Saving Waveforms during Real-Time Measurement
If you save waveforms during real-time measurement, waveform data at that point is saved in
memory. If real-time measurement has been completed, waveforms shown on the data display
screen are saved in memory. If event analysis is performed on real-time measurement waveforms,
MAP display data is also saved in memory.
3
Performing Real-time Measurement
IM AQ1210-01EN
3-5
Page 75

3.2 Measuring with Cursors
Distance from the start point to the
See “Approximation Method” in the
The cursor moves to the position that you tap.
Procedure
Displaying the Cursors
Tap the waveform display screen. A cursor appears at the tapped position.
1.
A cursor appears at the
tapped position.
Place markers See section 6.1.
Resets waveform zoom See section 6.2.
Zooms the waveform See section 6.2.
Cursor and marker operation screen
If you do not use markers or cursors for about 8 seconds, the screen will close automatically.
cursor position on the waveform and
the level at the cursor position
Closes the window
Deletes markers
and cursors
Select the loss measurement
calculation approximation
method (TPA, LSA).
explanation section of section 2.2.
3-6
Moving the Cursor
Tap the position on the waveform display screen that you want to move the cursor to. The
2.
cursor moves to the position that you tapped. You can also drag the cursor on the waveform
display screen.
Drag
Fine movement of cursors
IM AQ1210-01EN
Page 76
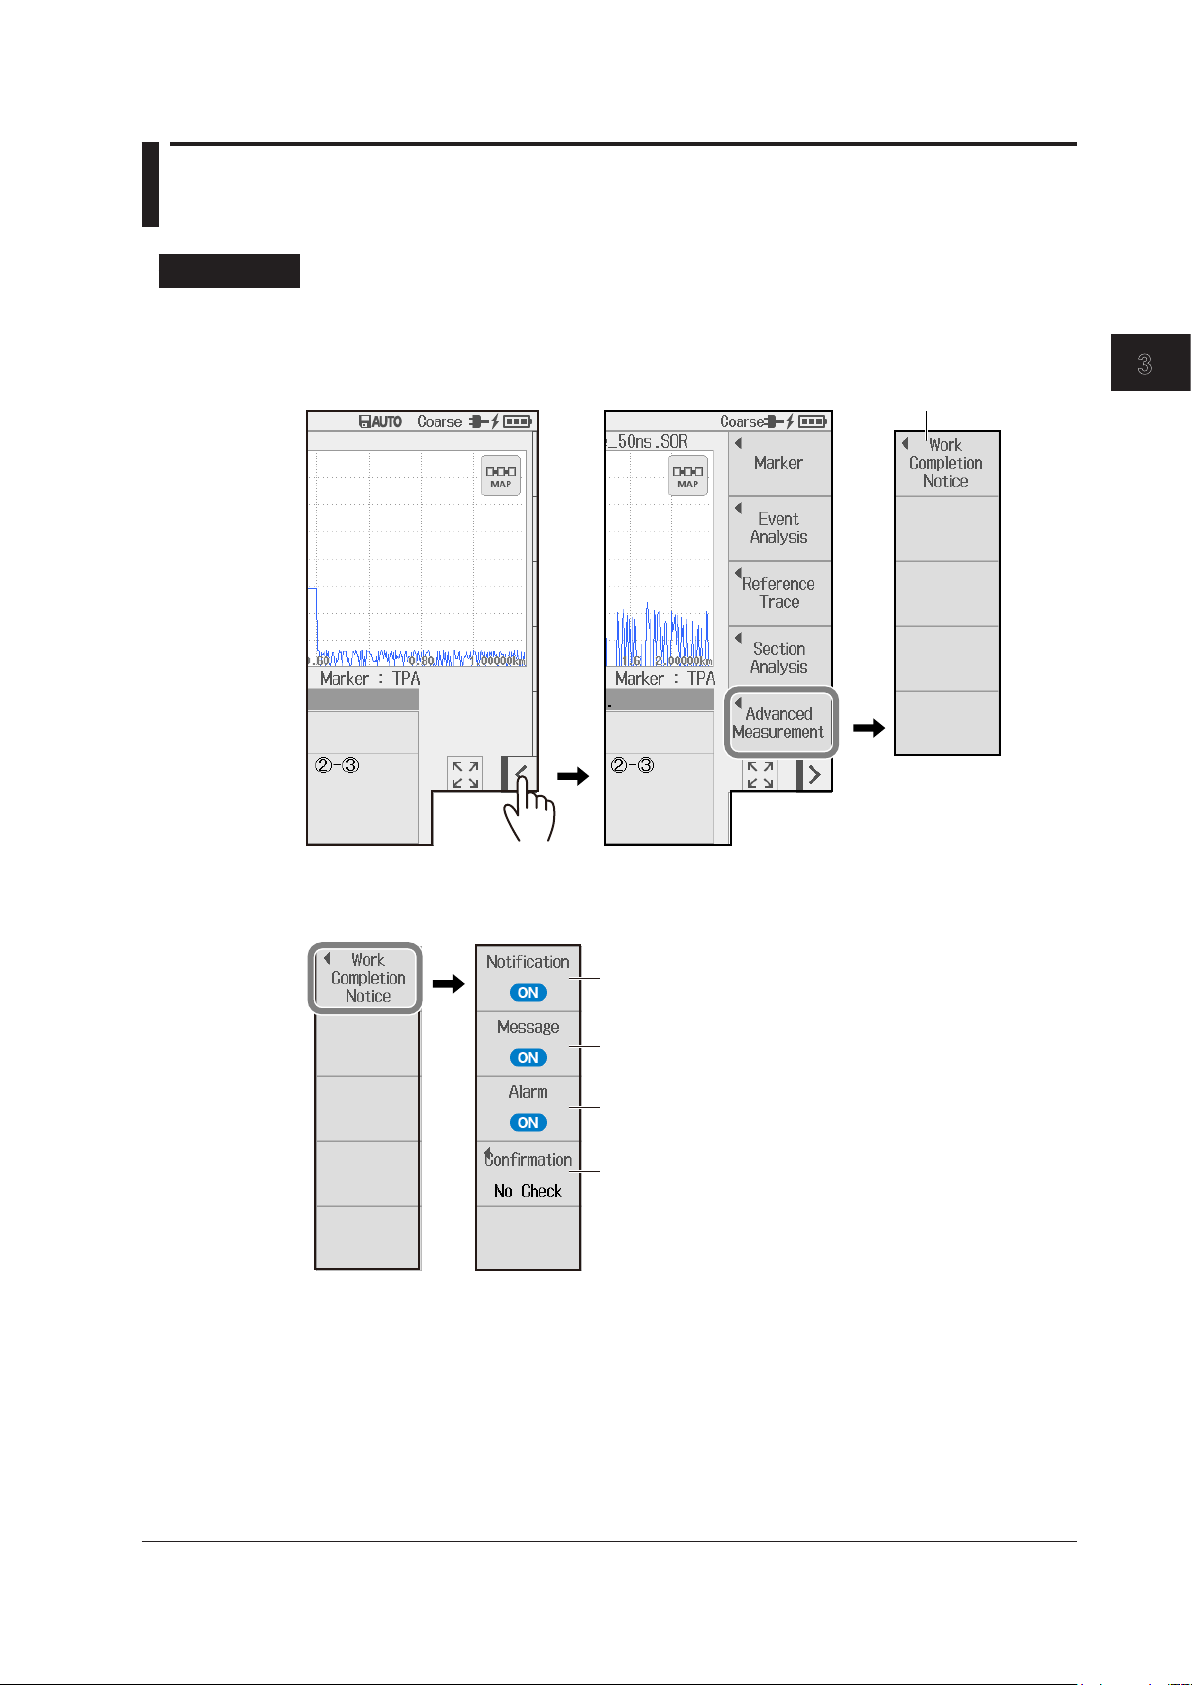
1
2
3.3 Cable Installation Completion Notification
Finishing real-time
Configure the work
completion notification.
(No Check, Check only once, Check everytime).
completion point.
Procedure
Soft Key Menu (Work Completion Notice)
Tap the soft key menu display button (when real-time measurement is not in progress).
1.
measurement
3
Performing Real-time Measurement
Tap the Advanced Measurement soft key and then the Work Completion Notice soft key.
2.
The Work Completion Notice screen appears.
Set the notification (OFF, ON).
Set the message display at work completion
(OFF, ON).
Set the alarm sound at work completion
(OFF, ON).
Set the confirmation message
Set how to display the message confirming
whether you have moved the cursor to the work
IM AQ1210-01EN
3-7
Page 77

If work completion notification is turned on,
completion check
3.3 Cable Installation Completion Notification
Issuing a Work Completion Notice
WARNING
During measurement, light is transmitted from the light source ports. Do not disconnect the
connected optical fiber cables. Visual impairment may occur if the light enters the eye.
French
AVERTISSEMENT
Lorsque instrument génère de la lumière, la lumière est émise à travers les ports de source
lumineuse. Ne pas débrancher les câbles de fibre optique connectés. Des lésions oculaires
peuvent être causées si le faisceau lumineux pénètre l’œil.
Press REAL TIME to start a real-time measurement.
3.
During measurement, a mark appears at the top of the display to indicate that the laser light is on. Pressing
REAL TIME again stops the measurement.
Tap the waveform display screen. A cursor appears at the tapped position.
4.
If Notification is set to on in step 2, the word “CheckPoint” appears at the top area of the cursor.
5.
6.
“CheckPoint” is displayed at the cursor.
A cursor appears at
the tapped position.
Set the
Work point
Place the cursor to a
position that is a little
after the installation
point.
Soft key menu display button
(OFF, ON).
Tap the soft key menu display button. The soft key menu is displayed.
Tap the Completion Check soft key to select ON.
If the prior confirmation message is set to Only once or Check everytime in step 2 on page 3-7, when you
tap the Completion Check soft key, a message appears on the screen for you to confirm whether the cursor
has been moved to the work completion point.
When the measurement to the Check Point distance is complete, a completion message is displayed.
3-8
Note
You can perform measurements efficiently by moving the cursor to a position slightly after the installation
point (depending on how fast the optical fiber cable will be installed). This is because the instrument
notifies you of the work completion, which is your sign to measure the connection loss at that point (splice,
connection, etc.).
IM AQ1210-01EN
Page 78

1
2
Explanation
Distance
Level
Extension work point
Work completion notification
Cable Installation Completion Notification
Before you check whether the work is complete, move the cursor slightly after the extension work
point or before the work completion point on the optical fiber cable, and turn on the work completion
notification. When the fiber end detection position (the event) during real-time measurement is the
same as the cursor position (CheckPoint), the instrument gives a notification (message indication and
alarm sound) that the cable installation is complete.
(splice, connection, etc.)
Construction start
position
(Event)
3.3 Cable Installation Completion Notification
Completion notification
cursor position during
optical fiber cable
extension
CheckPoint
Work completion
point
3
Performing Real-time Measurement
cursor position
CheckPoint
50km 100km
Notification
Turns on or off the work completion notice feature.
OFF: The work completion notice feature is disabled.
ON: The work completion notice feature is enabled.
Notification (Message)
OFF: Work completion is not notified with a message.
ON: Work completion is notified with a message.
Notification (Alarm)
OFF: Work completion is not notified with an alarm sound.
ON: Work completion is notified with an alarm sound.
Confirmation
No Check: A confirmation message is not displayed on the screen even if you tap the
Completion Check soft key.
Check only once: A confirmation message is displayed on the screen once when you tap the
Completion Check soft key the first time.
Check everytime: A confirmation message is displayed on the screen every time you tap the
Completion Check soft key.
IM AQ1210-01EN
3-9
Page 79

3.4 Rerouting Work
WARNING
During measurement, light is transmitted from the light source ports. Do not disconnect the
connected optical fiber cables. Visual impairment may occur if the light enters the eye.
French
AVERTISSEMENT
Lorsque instrument génère de la lumière, la lumière est émise à travers les ports de source
lumineuse. Ne pas débrancher les câbles de fibre optique connectés. Des lésions oculaires
peuvent être causées si le faisceau lumineux pénètre l’œil.
When installed fibers are moved because of road construction or other external factors (rerouting
work), using this feature enables you to compare the event waveform before the construction to that
after the construction. This makes it easy to check the presence of obstacles caused as a result of the
rerouting work.
3-10
IM AQ1210-01EN
Page 80

1
2
Procedure
During real-time
waveform data before
Step 2 to step 8 are the steps for the
rerouting work explained in this section.
Soft Key Menu (Work Trace Comparison)
3.4 Rerouting Work
Press REAL TIME to start a real-time measurement.
1.
During measurement, a mark appears at the top of the display to indicate that the laser light is on. Pressing
REAL TIME again stops the measurement.
Tap the soft key menu display button (when real-time measurement is in progress).
2.
measurement
Step 5
Captures the
the construction
3
Performing Real-time Measurement
Step 8
Step 2
Step 4
Markers for measuring splice
loss between A and B
Step 7
Markers for measuring splice
loss between C and D
Step 3,
step 6
IM AQ1210-01EN
3-11
Page 81

3.4 Rerouting Work
Measuring the Connection Loss between the Measurement Start Point and
Measurement Endpoint before the Construction
3.
4.
Capture the Waveform Data before the Construction
5.
Tap the Work Trace Comparison soft key and then the 4 Point Monitor soft key. A marker soft
key menu appears for monitoring loss values (see the previous page).
Place the A marker at the measurement start point and the B marker at the measurement end
point.
The connection loss between A and B is measured.
A
B
Tap the Work Trace Comparison soft key and then the Capture Trace soft key.
The waveforms displayed on the current screen are captured. Because markers are not captured,
separately record the connection loss value between A and B before the construction.
Measuring the Connection Loss between the Measurement Start Point and
Measurement Endpoint after the Construction
6.
7.
A
The captured waveform is displayed dimmed.
B
Tap the Work Trace Comparison soft key and then the 4 Point Monitor soft key. A marker soft
key menu appears for monitoring loss values (see the previous page).
Place the A marker at the measurement start point and the B marker at the measurement end
point.
The connection loss between A and B is measured. Check that there are no problems in the connection
loss value before the construction and the connection loss value after the construction.
A
Waveform data after construction
3-12
B
Waveform data before construction
(captured waveform)
IM AQ1210-01EN
Page 82

1
2
Waveform data after
A
C
Rerouting work
3.4 Rerouting Work
Comparing waveform data before the construction and after the construction
Tap the Work Trace Comparison soft key, the Trace Shift soft key, and then the Trace Shift
8.
Right soft key. The waveform data (captured waveform) before the construction moves to
the right side of the screen. Use Trace Shift Right or Trace Shift Left depending on the
differences in the start points before the construction and after the construction. In this example,
because the distance between the start point and the end point after the construction is long,
the waveform data before the construction is moved to the right side.
Explanation
When installed fibers are moved because of road construction or other external factors (rerouting
work), using this feature enables you to compare the event waveform before the construction to that
after the construction. This makes it easy to check the presence of obstacles caused as a result of the
rerouting work.
The markers of 4 Point Monitor are used to measure two sections as loss measurements for when the
optical fiber is switched. The measurement of the two sections is performed the marker pairs
and the marker pairs
A
construction
and D.
By overlapping the waveform data before construction and
that after construction, you can check that there are no
changes in the events.
Moved to
the right
Waveform data before construction
(captured waveform)
3
Performing Real-time Measurement
B
and B
A
B
C
D
IM AQ1210-01EN
3-13
Page 83

1
2
3
Set the wavelength.
See page 4-2.
Switches the display between
Displays the data
Displays the soft key menu
Chapter 4 Performing Averaged Measurements
4.1 Measuring in TRACE Mode
WARNING
During measurement, light is transmitted from the light source ports. Do not disconnect the
connected optical fiber cables. Visual impairment may occur if the light enters the eye.
French
AVERTISSEMENT
Lorsque instrument génère de la lumière, la lumière est émise à travers les ports de source
lumineuse. Ne pas débrancher les câbles de fibre optique connectés. Des lésions oculaires
peuvent être causées si le faisceau lumineux pénètre l’œil.
Procedure
Averaged Measurement Screen (OTDR screen TRACE mode)
Press MENU to display the MENU screen.
1.
For details on the MENU screen, see the Getting Started Guide, IM AQ1210-02EN.
Tap OTDR to display the OTDR screen.
2.
4
Performing Averaged Measurements
Utility
See chapter 7.
Save data directly.
See section 4.4.
Set the attenuation.
See sec. 2.1.
management buttons
See section 9.3.
Data display screen
Set the pulse width.
See section 2.1.
TRACE mode and MAP mode
Averaged measurement in progress indication
The OTDR port emitting light
Laser on indication
Set the distance range. See section 2.1.
Set the averaging conditions. See section 2.1.
Set the IOR. See section 2.2.
Expands the data display area
IM AQ1210-01EN
4-1
Page 84

4.1 Measuring in TRACE Mode
• Switching the Display between TRACE Mode and MAP Mode
Tap the TRACE/MAP button to set the data display screen to TRACE mode.
3.
When the data display screen is in TRACE mode, the button is MAP.
Executing an Averaged Measurement
Tap Wavelength to set the wavelength.
4.
Press AVG . The measurement begins, and the data display screen shows the waveform.
5.
During averaged measurement, the duration to average over is displayed in the top area of the screen.
Also, during measurement, a mark appears at the top of the display to indicate that the laser light is on.
When averaged measurements are completed, measurement is stopped automatically, event analysis is
executed, and the analysis results are displayed on the screen. If you press AVG again during averaged
measurement, measurement is stopped.
Note
• You can select the initial screen that appears when the instrument starts in system settings. For details on
operation, see the explanation in section 10.1.
• If distance range and pulse width are set to auto, the instrument automatically selects the optimal values
internally immediately before starting a measurement. Change these values if necessary. For details, see
section 2.1.
Soft Key Menu (during averaged measurement)
Tap the soft key menu display button.
6.
The menu that can be used during averaged measurement or the menu that can be used not during
averaged measurement is displayed automatically depending on the usage condition.
4-2
IM AQ1210-01EN
Page 85

1
2
3
Soft key menu
During averaged measurement
• When Averaged Measurement Is in Progress
Marker operation
See section 6.1.
Event analysis control
See section 5.1.
Snapshot (Reference
trace) control
See section 6.3.
Section analysis control
See section 6.4.
Set work completion.
See section 3.3.
Moves the snapshot
Moves the snapshot
Clears the snapshot waveform
4.1 Measuring in TRACE Mode
4
Performing Averaged Measurements
• When Averaged Measurement Is Not in Progress
Set comments.
See section 2.4.
Set labels.
See section 2.4.
Marker operation
See section 6.1.
Takes a snapshot
waveform up
waveform down
Displays the difference
waveform between the real-time
measurement waveform and
snapshot waveform
Switches the current trace
Can be controlled during multi
wavelength measurement.
IM AQ1210-01EN
4-3
Page 86

4.1 Measuring in TRACE Mode
Explanation
Averaged Measurement (AVG)
In averaged measurements, the data that is acquired from each pulse is averaged and displayed as
a waveform. Averaged measurements improve the signal-to-noise (S/N) ratio. This is effective when
you want to detect faint events that are buried in noise.
Distance Range
With the auto setting, the instrument detects the open end (end point) at the start of an averaged
measurement and automatically calculates the length of the optical fiber cable. When setting the
distance range manually, set a distance range appropriate for the length of the optical fiber cable to
be measured. For details on the appropriate distance range, see section 2.1.
Pulse Width
With the auto setting, when the distance range is set to auto, the minimum pulse width that can
measure the distance to the open end (end point) is selected. When setting the pulse width
manually, set a pulse width appropriate for the distance range. For details on the appropriate pulse
width, see section 2.1.
Average Count and Average Duration
With the auto setting, the average method is selected according to the distance range and the loss
in the optical fiber cable being measured.
Attenuation
With the auto setting, an attenuation value is selected according to the distance range and the loss
in the optical fiber cable being measured. If you want to set the attenuation value manually, select a
value appropriate for the pulse width. For details on the attenuation value appropriate for the pulse
width, see section 2.1.
Switching the Display between TRACE Mode and MAP Mode
You can switch the data display screen.
TRACE mode: The data display screen shows the waveform of optical pulse measurement.
MAP mode: The data display screen shows the events detected through event analysis and
displays them with icons.
4-4
IM AQ1210-01EN
Page 87
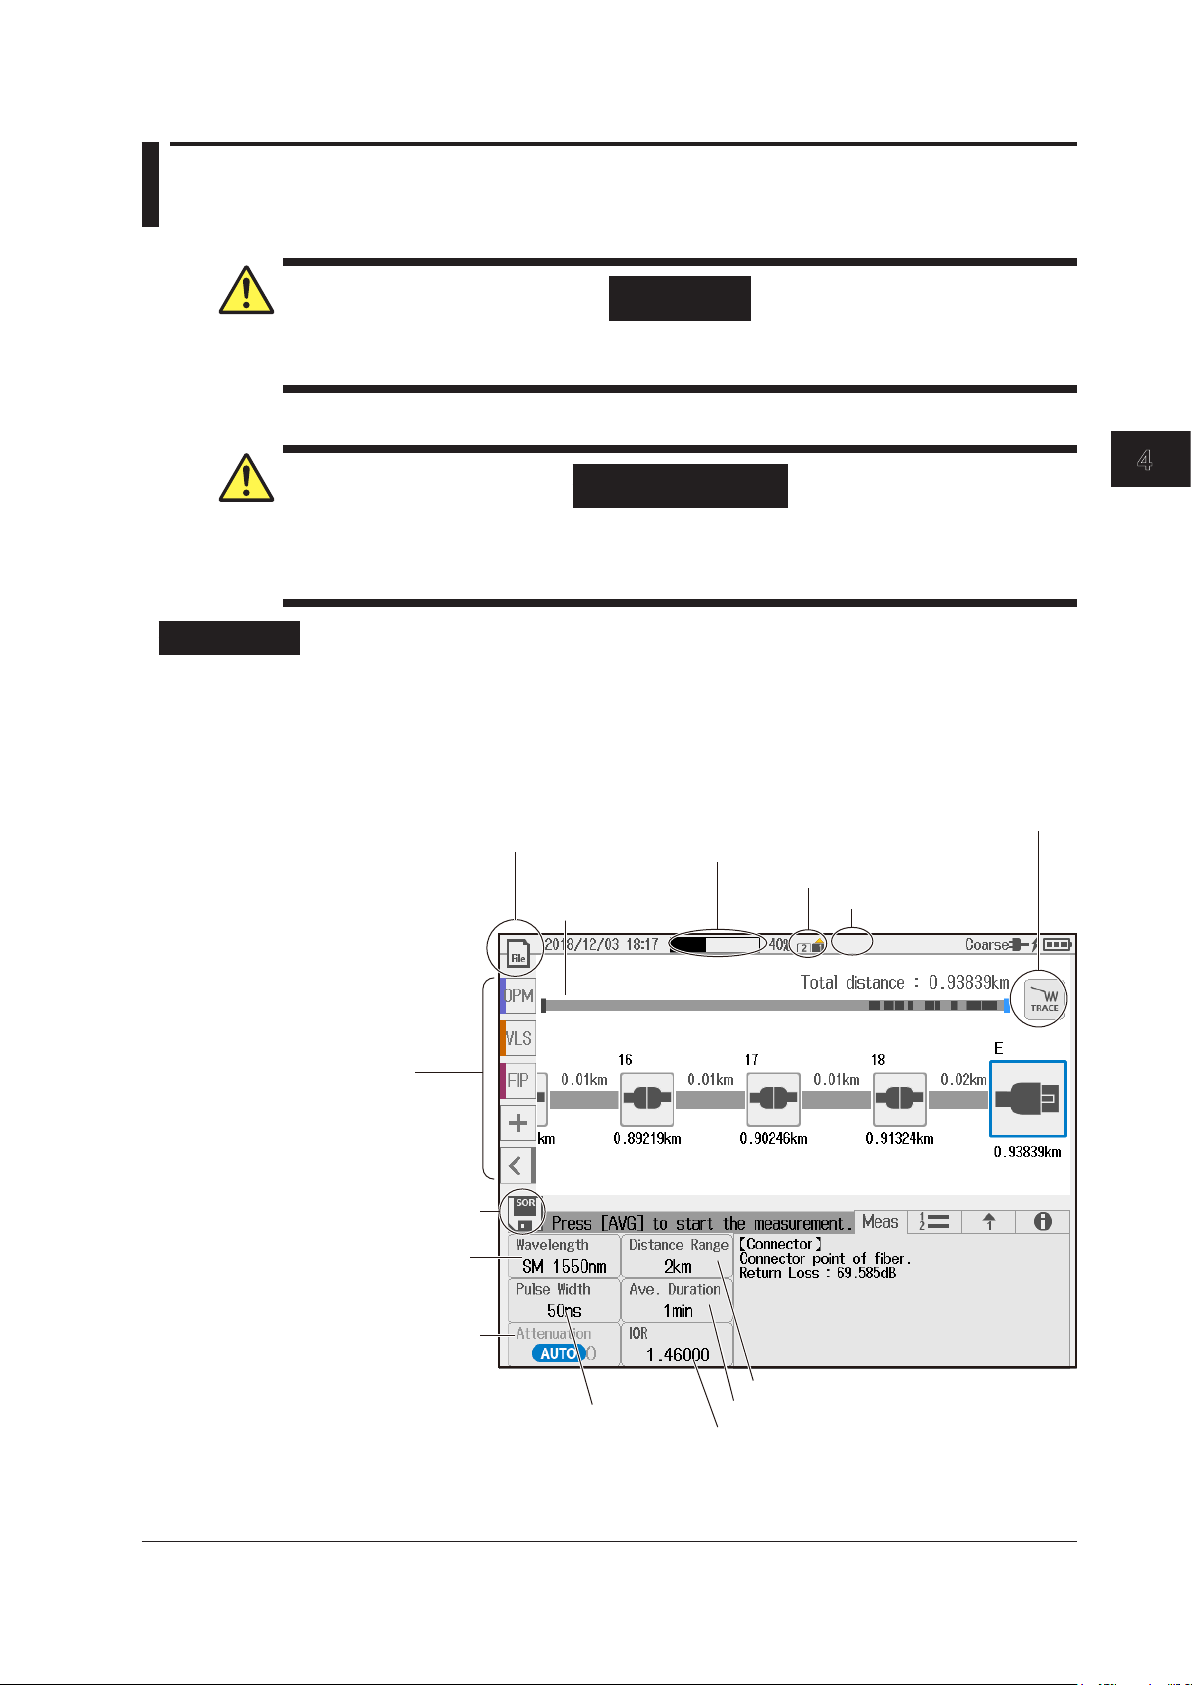
1
2
3
4.2 Measuring in MAP Mode
Set the wavelength.
See page 4-6.
Switches the display between
Displays the data
Set the IOR. See section 2.2.
WARNING
During measurement, light is transmitted from the light source ports. Do not disconnect the
connected optical fiber cables. Visual impairment may occur if the light enters the eye.
French
AVERTISSEMENT
Lorsque instrument génère de la lumière, la lumière est émise à travers les ports de source
lumineuse. Ne pas débrancher les câbles de fibre optique connectés. Des lésions oculaires
peuvent être causées si le faisceau lumineux pénètre l’œil.
Procedure
Averaged Measurement Screen (OTDR screen MAP mode)
Press MENU to display the MENU screen.
1.
For details on the MENU screen, see the Getting Started Guide, IM AQ1210-02EN.
Tap OTDR to display the OTDR screen.
2.
4
Performing Averaged Measurements
Utility
See chapter 7.
Save data directly.
See section 4.4.
Set the attenuation.
See sec. 2.1.
management buttons
See section 9.3.
Data display screen
Set the pulse width.
See section 2.1.
Averaged measurement in progress indication
TRACE mode and MAP mode
The OTDR port emitting light
Laser on indication
Set the distance range. See section 2.1.
Set the averaging conditions. See section 2.1.
IM AQ1210-01EN
4-5
Page 88

4.2 Measuring in MAP Mode
• Switching the Display between TRACE Mode and MAP Mode
Tap the TRACE/MAP button to set the data display screen to MAP mode.
4.
When the data display screen is in MAP mode, the button is TRACE.
Executing an Averaged Measurement
Tap Wavelength to set the wavelength.
5.
Explanation
In averaged measurements, the data that is acquired from each pulse is averaged, and then event
With the auto setting, the instrument detects the open end (end point) at the start of an averaged
Press AVG . The measurement begins, and the data display screen shows the waveform.
6.
During averaged measurement, the duration to average over is displayed in the top area of the screen.
Also, during measurement, a mark appears at the top of the display to indicate that the laser light is on.
When averaged measurements are completed, measurement is stopped automatically, event analysis is
executed, and the analysis results are displayed on the screen. If you press AVG again during averaged
measurement, measurement is stopped.
Note
• You can select the initial screen that appears when the instrument starts in system settings. For details on
operation, see the explanation in section 10.1.
• If distance range and pulse width are set to auto, the instrument automatically selects the optimal values
internally immediately before starting a measurement. Change these values if necessary. For details, see
section 2.1.
Averaged Measurement (AVG)
analysis is performed. Averaged measurements improve the signal-to-noise (S/N) ratio. This is
effective when you want to detect faint events that are buried in noise.
Distance Range
measurement and automatically calculates the length of the optical fiber cable. When setting the
distance range manually, set a distance range appropriate for the length of the optical fiber cable to
be measured. For details on the appropriate distance range, see section 2.1.
4-6
Pulse Width
With the auto setting, when the distance range is set to auto, the minimum pulse width that can
measure the distance to the open end (end point) is selected. When setting the pulse width
manually, set a pulse width appropriate for the distance range. For details on the appropriate pulse
width, see section 2.1.
IM AQ1210-01EN
Page 89

1
2
3
Start point
(Near-end
reflection)
4.2 Measuring in MAP Mode
Average Count and Average Duration
With the auto setting, the average method is selected according to the distance range and the loss
in the optical fiber cable being measured.
Attenuation
With the auto setting, an attenuation value is selected according to the distance range and the loss
in the optical fiber cable being measured. If you want to set the attenuation value manually, select a
value appropriate for the pulse width. For details on the attenuation value appropriate for the pulse
width, see section 2.1.
Switching the Display between TRACE Mode and MAP Mode
You can switch the data display screen.
TRACE mode: The data display screen shows the waveform of optical pulse measurement.
MAP: The data display screen shows the events detected through event analysis and displays
• Event Icon Display
The following events are displayed using icons.
Note
them with icons.
Splice loss
When the data display screen is in MAP mode, the following features cannot be used.
• Operating the cursors
• Performing marker analysis
• Zooming In on or Out of Waveforms
Return loss
Bending loss
Splitter
End point
(Fresnel
reflection)
4
Performing Averaged Measurements
IM AQ1210-01EN
4-7
Page 90

4.3 Performing Pass/Fail Judgments on Measured
Configure pass/fail judgments.
ANALYSIS tab
Pass/fail judgment (OFF, ON)
Results
Procedure
Turning On the Pass Fail Judgment Feature
Press SETUP to display the setup screen.
1.
Tap the ANALYSIS tab to display the analysis setup screen.
2.
Tap Pass Fail Judgment to display the Pass Fail Judgment screen.
3.
For description of the Pass Fail Judgment screen, see “Configuring the Pass/Fail Judgment” in section 2.2.
Tap the Pass Fail Judgment button on the Pass Fail Judgment screen.
4.
The Past Bill Judgment feature turns on. Each time you tap, the value switches between ON and OFF.
The result of the pass/fail judgment on the waveform data shown on the data display screen.
Executing an Averaged Measurement
Press AVG . The measurement begins, and the data display screen shows the waveform and
5.
the judgment result.
Note
When averaged measurements are completed, event analysis is executed automatically, and judgment
results based on whether the specified pass/fail judgment conditions are met are displayed. If waveform data
is displayed on the screen before the Pass Fail Judgment is turned on, the pass/fail judgment result appears
when the feature is turned on. For details on setting the pass/fail judgment conditions, see “Configuring the
Pass/Fail Judgment” in section 2.2.
4-8
IM AQ1210-01EN
Page 91

1
2
3
Explanation
The judgment results are
also displayed in the
event list.
If there is even a single Fail event, this turns red.
Pass judgment
Pass/fail Judgment Display in TRACE Mode
4.3 Performing Pass/Fail Judgments on Measured Results
Pass judgment
Fail judgment
In the list, rows showing Fail
events are in red.
Turns green when all events are judged as Pass.
4
Performing Averaged Measurements
Pass/fail Judgment Display in MAP Mode
Fail judgment
IM AQ1210-01EN
4-9
Page 92

4.4 Saving Measured Data
MEASURE tab
Procedure
Saving Measured Data Directly
You can save measured waveforms and event analysis data by tapping an icon on the data display
screen.
To change the save destination folder or file name, see “Setting the Direct Save Method” in section 2.4.
Tap the floppy disk icon. The measured data is saved.
1.
Turning on the Auto Save Feature for Measurement Data
Measured waveforms and event analysis data can be saved automatically when averaged
measurements are completed.
To change the save destination folder or file name, see “Configuring Auto Save (when averaged
measurement is complete)” in section 2.1.
Press SETUP to display the setup screen.
1.
Tap the MEASURE tab to display the measurement setup screen.
2.
Tap Auto Save to display the Auto Save screen.
3.
For a description of the auto save screen, see “Configuring Auto Save (when averaged measurement is
complete)” in section 2.1.
4-10
Set auto save.
IM AQ1210-01EN
Page 93

1
2
3
4.4 Saving Measured Data
Automatic saving (OFF, ON)
destination.
Tap the Auto Save button on the auto save screen.
4.
The auto save feature is turned on. Each time you tap, the value switches between ON and OFF.
For details on the auto save screen, see “Configuring Auto Save (when averaged measurement is
complete)” in section 2.1.
Explanation
Saving Directly
When you tap the floppy disk icon, measured data is saved. The file save format is shown on the
floppy disk icon.
Current save destination
When the icon displays SOR
Measured data is saved as waveforms.
When the icon displays PDF
Measured data is saved as a report file in PDF format.
4
Performing Averaged Measurements
Select the save
When the icon displays SOR+PDF
Waveform data is saved as waveforms and as a report file simultaneously.
Saving Waveforms during Averaged Measurement
You cannot save waveforms during averaged measurement. Save measured data after averaged
measurements have been completed. When measured data is saved, MAP display data is also
saved in memory.
If you set the auto save feature to on, waveforms and MAP display data are saved in memory when
averaged measurements are completed.
Saving Waveforms during Real-Time Measurement
If you save waveforms during real-time measurement, waveform data at that point is saved in
IM AQ1210-01EN
memory. If real-time measurement has been completed, waveforms shown on the data display
screen are saved in memory. If event analysis is performed on real-time measurement waveforms,
MAP display data is also saved in memory.
4-11
Page 94

1
2
3
4
Event detected as the end of the optical fiber cable: E
Chapter 5 Analyzing Events
5.1 Analyzing in TRACE Mode
Procedure
Waveform Data Display
Press MENU to display the MENU screen.
1.
For details on the MENU screen, see the Getting Started Guide, IM AQ1210-02EN.
Tap OTDR to display the OTDR screen.
2.
• Switching the Display between TRACE Mode and MAP Mode
Tap the TRACE/MAP button to set the data display screen to TRACE mode.
3.
When the data display screen is in TRACE mode, the button is MAP.
• Displaying Waveform Data
Press AVG . The measurement begins, and the data display screen shows the waveform.
4.
When averaged measurement is completed, event analysis is automatically executed, and
the event analysis results are shown on the data display screen. For details on averaged
measurement, see section 4.1.
5
Analyzing Events
Note
If you display waveform data using the following methods, you need to manually execute event analysis. See
“Soft Key Menu (during event analysis)” explained later.
• When a real-time measurement is performed
• When waveform data (without event analysis information) is loaded from a USB memory device or
internal memory Event analysis information is not included in waveform data of real-time measurement or
waveform data of averaged measurement that is aborted in the middle of a measurement.
Displaying Event Analysis Results
Measurement reference point: S
Event No.
IM AQ1210-01EN
List of events
Displayed by tapping the
List tab.
5-1
Page 95

Tab display
Soft key menu
When Real-Time Measurement or Averaged
Measurement Is Not in Progress
5.1 Analyzing in TRACE Mode
Displays the previous event
Displays the next event
Soft Key Menu (event analysis)
Tap the soft key menu display button.
4.
List
Detail
Summary
Display of separate events
Displayed by tapping the Detail tab.
Cumulative display of events
Displayed by tapping the Summary tab.
5-2
IM AQ1210-01EN
Page 96

1
2
3
4
Executing an Event Analysis
This is the same function as
5.
Note
5.1 Analyzing in TRACE Mode
Tap the Event Analysis soft key. Event analysis is performed, and the event results are
displayed on the waveform data. For details on the event analysis results, see “Displaying
Event Analysis Results” On page 5-1.
If you display waveform data using the following methods, you need to manually execute event analysis.
• When a real-time measurement is performed
• When waveform data (without event analysis information) is loaded from a USB memory device or
internal memory Event analysis information is not included in waveform data of real-time measurement or
waveform data of averaged measurement that is aborted in the middle of a measurement.
Switches the display of the event analysis results
(Summary, List, Detail)!!!
the tab used to switch to display of the analysis results.
5
Analyzing Events
Edit or fix events.
2-point markers
See page 5-9.
Selects the rotary knob function (Cursor, Event)
Editing or Fixing Events
There may be cases where, because the backscattering light level is too small at a reflection point
in an optical fiber cable, the reflection cannot be detected as an event, or there may be cases where
noise is detected as an event. In such cases, you can adjust the events by editing them as follows:
• Insert events
• Delete events
• Edit event markers
• Fix event positions
Tap the Event Edit/Fix soft key. An event edit soft key menu appears.
6.
Deletes an event
Set the distance
reference.
See page 6-6.
Edit event markers.
See page 5-6.
Fixing Events
See page 5-8.
You can delete events
when the Rotary Knob
soft key is set to Event.
Inserts an event
You can insert
events when the
Rotary Knob
soft key is set to
Cursor.
IM AQ1210-01EN
5-3
Page 97

A virtual event is inserted at the cursor position.
The inserted event is added to the
5.1 Analyzing in TRACE Mode
• Inserting an Event
Tap the Rotary Knob soft key to select Cursor.
7.
Turn the rotary knob to move the cursor to the position where you want to insert an event.
8.
Press the Ins. Event (Cursor) soft key. An event is inserted at the cursor position.
9.
Event numbers are updated automatically.
event list.
Note
• The event list can display up to 100 events.
• If you insert an event between two events that are displayed, the new event takes on the number that
follows the event on the left, and all subsequent event numbers are increased by one. You cannot insert
events to the left of the S point.
• You cannot insert events to the left of the distance reference. You can use the Set Distance Reference
soft key to move the distance reference.
For details on the distance reference, see page 6-6.
• If you insert an event to the right of the E event, the inserted event becomes the E event, and a new
number is assigned to the former E event.
5-4
IM AQ1210-01EN
Page 98

1
2
3
4
• Deleting an Event
The color of the selected event changes.
The event is deleted virtually. When the event
The deleted event is deleted from the event list.
Tap the Rotary Knob soft key to select Event.
7.
Turn the rotary knob to select the event you want to delete.
8.
Press the Del.Event (Event) soft key. The selected event is deleted.
9.
is deleted, the subsequent event numbers
are each decreased by one.
5.1 Analyzing in TRACE Mode
Note
5
Analyzing Events
• If only the S point and the E event are displayed, you cannot delete any events.
• If you delete an event, the subsequent event numbers will all be reduced by one.
• You cannot delete the S point.
IM AQ1210-01EN
5-5
Page 99

When Marker Mode Is Set to Marker
5.1 Analyzing in TRACE Mode
• Editing Event Markers
You can move an event marker to recalculate return loss and splice loss.
Press the Event MarkerEdit soft key. An event marker edit soft key menu appears.
7.
Tap the Rotary Knob soft key to select Event.
8.
Turn the rotary knob to select the event you want to edit.
9.
The color of the selected event changes.
Tap the Rotary Knob soft key to select Cursor.
10.
You can now use the marker menu.
You can select an event to edit when the
Rotary Knob soft key is set to Event.
Sets marker
Places marker at the cursor position
Sets marker
Places marker at the cursor position
Set marker Y2.
Places marker Y2 at the cursor position
Sets marker
Places marker at the cursor position
You can control the marker placed on
the selected event when the Rotary
Knob soft key is set to Cursor.
When Marker Mode Is Set to Line
Select an event marker
(C, n, N, E, F, f).
Tap this soft key to select the event
marker that you want to move.
1
2
3
1
2
3
5-6
Note
For details on how to set markers, see “4 Point Markers” on page 6-8 (marker mode is Marker).
For details on how to set line markers, see “5 Point Markers” on page 6-10 (marker mode is Line).
IM AQ1210-01EN
Page 100

1
2
3
4
Example When Marker Mode Is Set to Marker
Shows the current marker
You can edit the splice loss and return loss
Example When Marker Mode Is Set to Line
placed when event analysis
was executed
The selected event is displayed
expanded.
5.1 Analyzing in TRACE Mode
values by moving the market position.
Splice loss and return loss
of the selected event
5
Analyzing Events
Shows the current line
marker placed when event
analysis was executed
IM AQ1210-01EN
5-7
 Loading...