

Page 1

User’s
Manual
AQ1200 OTDR
Multi Field Tester
IM AQ1200-01EN
4th Edition
Page 2

Thank you for purchasing the AQ1200 OTDR (Optical Time Domain Reflectometer) Multi Field Tester.
This user’s manual explains the features, operating procedures, and handling precautions of the
AQ1200. To ensure correct use, please read this manual thoroughly before operation. Keep this
manual in a safe place for quick reference in the event that a question arises.
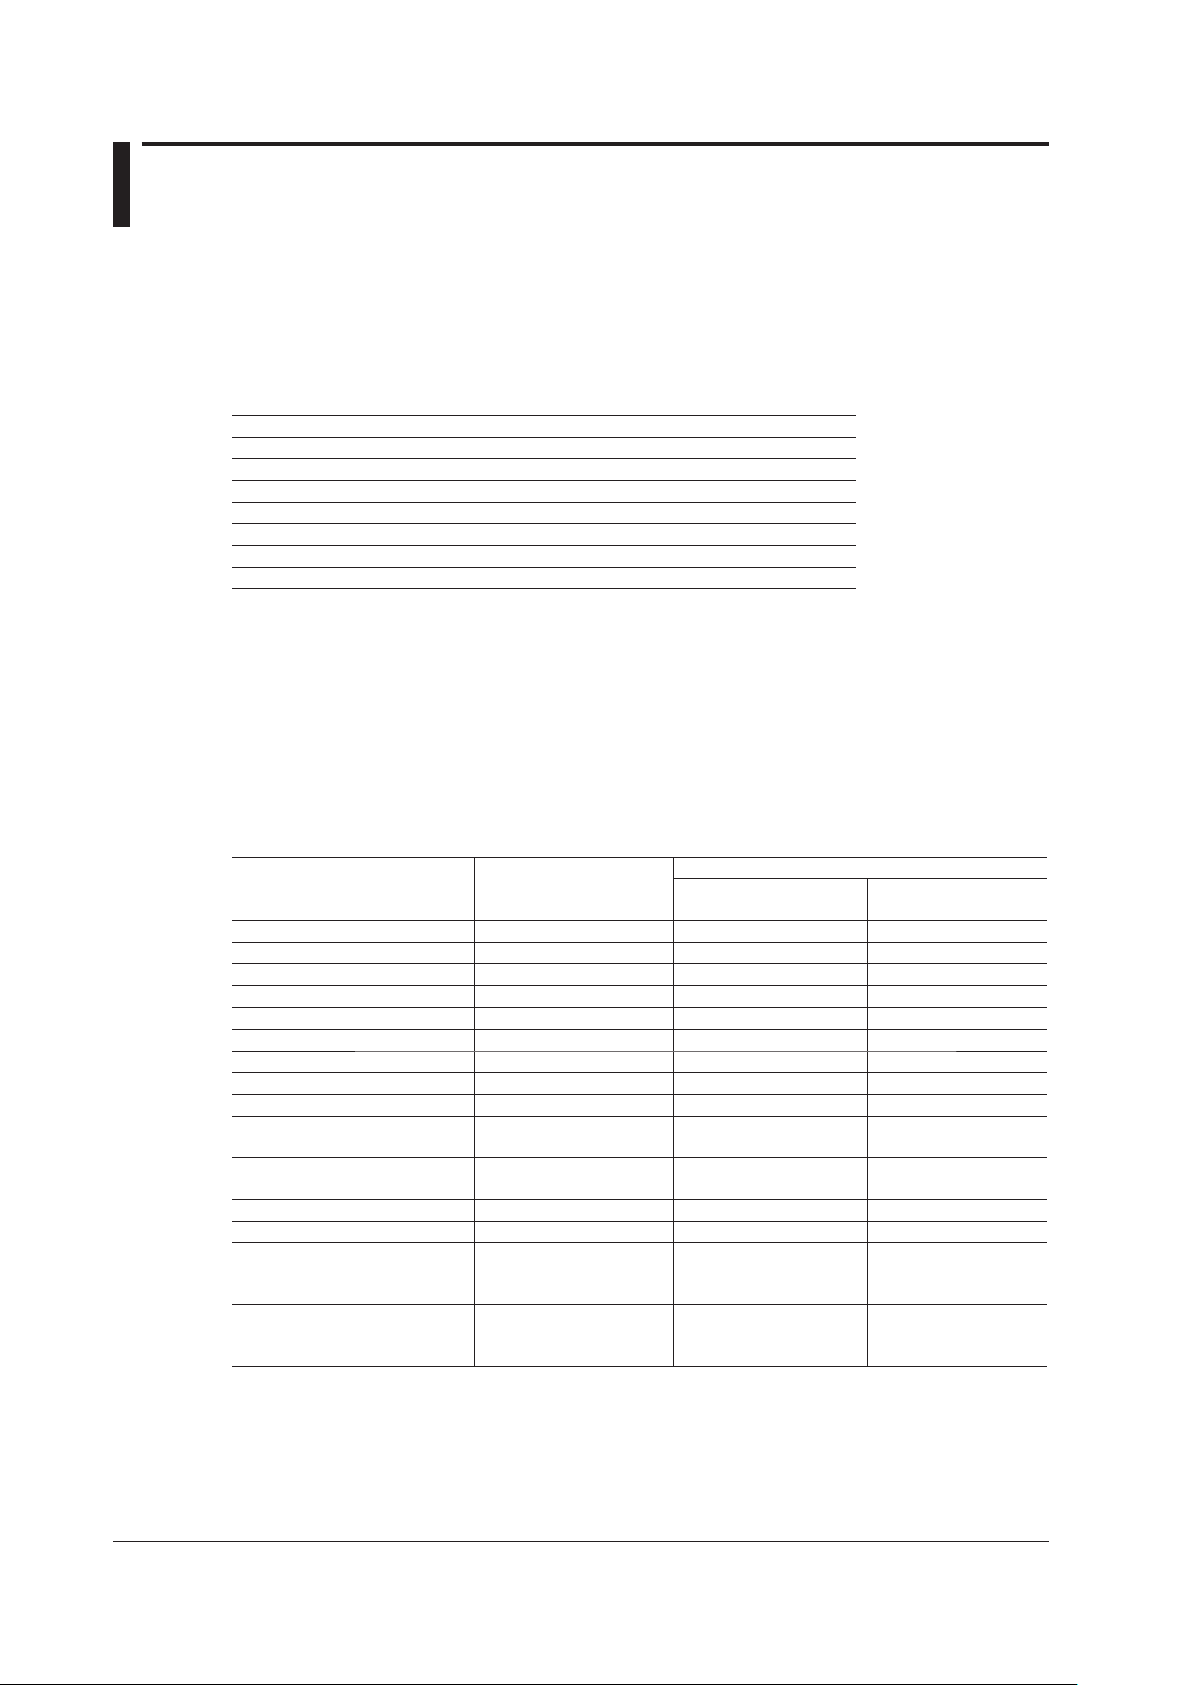
This manual is one of three AQ1200 manuals. Please read all the manuals.
Manual Title Manual No. Description
AQ1200 OTDR Multi Field Tester
Operation Guide
AQ1200 OTDR Multi Field Tester
User’s Manual (included in CD)
AQ1200 OTDR Multi Field Tester
Communication Interface User’s
Manual (included in CD)
IM AQ1200-02EN This guide focuses on the handling precautions, basic
operations, and specifications of the AQ1200.
IM AQ1200-01EN This manual. Explains all AQ1200 features, except for
the communication features, and how to use them.
IM AQ1200-17EN Explains the features related to using communication
commands to control the AQ1200.
Notes
• The contents of this manual are subject to change without prior notice as a result of continuing
improvements to the instrument’s performance and functionality. The figures given in this manual
may differ from those that actually appear on your screen.
•
Every effort has been made in the preparation of this manual to ensure the accuracy of its
contents. However
YOKOGAWA dealer.
• Copying or reproducing all or any part of the content of this manual without the permission of
YOKOGAW
, should you have any questions or find any errors, please contact your nearest
A is strictly prohibited.
Trademarks
• Microsoft, Windows, and Windows XP are either registered trademarks or trademarks of Microsoft
Corporation in the United States and/or other countries.
• Adobe, Acrobat, and PostScript are trademarks of Adobe Systems Incorporated.
•
In this manual, the TM and ® symbols do not accompany their respective registered trademark or
trademark names.
• Other company and product names are registered trademarks or trademarks of their respective
holders.
Revisions
1st Edition: February 2010
2nd Edition: February 2011
3rd Edition: July 2012
4th Edition: July 2013
4th Edition: July 2013 (YMI)
All Rights Reserved, Copyright © 2010, Yokogawa Electric Corporation
All Rights Reserved, Copyright © 2011, Yokogawa Meters & Instruments Corporation
IM AQ1200-01EN
i
Page 3
Conventions Used in This Manual
Notes
The notes and cautions in this manual are categorized using the following symbols.
Improper handling or use can lead to injury to the user or damage to the
instrument. This symbol appears on the instrument to indicate that the user must
refer to the user’s manual for special instructions. The same symbol appears
in the corresponding place in the user’s manual to identify those instructions.
In the manual, the symbol is used in conjunction with the word “WARNING” or
“CAUTION.”
WARNING
CAUTION
Calls attention to information that is important for proper operation of the
Note
Calls attention to actions or conditions that could cause serious or fatal injury to
the user, and precautions that can be taken to prevent such occurrences.
Calls attention to actions or conditions that could cause light injury to the user
or cause damage to the instrument or user’s data, and precautions that can be
taken to prevent such occurrences.
instrument.
Symbols and Conventions Used in Procedural Explanations
The contents of the procedural explanations are indicated using the following symbols.
Procedure
Explanation
Character Notations
Hard Key Names and Soft Key Names in Bold Characters
Indicate panel keys that are used in the procedure and soft keys and menu items that appear on the screen.
Carry out the procedure according to the step numbers. All procedures are
written under the assumption that you are starting operation at the beginning
of the procedure, so you may not need to carry out all the steps in a procedure
when you are changing the settings.
This section describes the setup items and the limitations regarding the
procedures. It may not give a detailed explanation of the feature. For a detailed
explanation of the feature, see chapter 2.
Unit
k Denotes 1000. Example: 12 kg, 100 kHz
ii
IM AQ1200-01EN
Page 4
3
2
1
4
5
6
7
8
9
10
11
12
13
14
15
16
17
18
19
App
Index
20
Contents
Conventions Used in This Manual .................................................................................................... ii
Chapter 1 Features
Chapter 2 Common Operations
1.1 Overview .......................................................................................................................... 1-1
1.2 Optical Pulse Measurement ............................................................................................. 1-3
1.3 Waveform Display ............................................................................................................ 1-5
1.4
1.5 Light Source and Optical Power Meters (Options) ......................................................... 1-12
1.6 Loss
1.7 Multi-Core Loss
1.8 Fault Locator .................................................................................................................. 1-16
1.9
1.10 IP T
1.11
1.12 Event Mapper ................................................................................................................. 1-20
1.13
2.1 Top Screen ....................................................................................................................... 2-1
2.2 Key, Rotary Knob, and Arrow Key Operations.................................................................. 2-5
2.3 Shortcut Keys ................................................................................................................... 2-8
2.4
aveform and Event Analysis .......................................................................................... 1-7
W
Test (Option)
Checking Fiber End Faces
est (Option) ............................................................................................................... 1-18
Multi-Core Fiber Measurement ....................................................................................... 1-19
Other Features ...............................................................................................................
Entering Strings .......................................................................................................
.......................................................................................................... 1-14
Test (Option) ......................................................................................... 1-15
............................................................................................. 1-17
1-21
....... 2-10
Chapter 3 Optical Pulse Measurement and Analysis Conditions
3.1 Selecting the Measurement Mode .................................................................................... 3-1
Simple (Full Auto) Mode
3.2 Selecting the Wavelength ................................................................................................. 3-3
3.3 Automatically Saving Measured Data .............................................................................. 3-4
3.4 Selecting the Approximation Method (Marker) ................................................................. 3-5
Detail Mode and Multi WL Mode
3.5 Setting Measurement Conditions ..................................................................................... 3-6
3.6 Setting Analysis Conditions ............................................................................................ 3-12
3.7 Setting the Pulse Light Output Level .............................................................................. 3-17
3.8 Giving Notifications When Installations
Are Complete ................................................... 3-18
Chapter 4 Measuring Optical Pulses
4.1 Performing Real-time Measurement ................................................................................ 4-1
4.2 Performing Averaged Measurements ............................................................................... 4-3
4.3 Displaying Snapshot Waveforms ...................................................................................... 4-5
Chapter 5 Waveform Display
5.1 Waveform Display Screen ................................................................................................ 5-1
5.2 Zooming the Waveform Display Scale ............................................................................. 5-2
5.3 Moving the Waveform Display Position ............................................................................ 5-5
5.4
Initializing the Waveform Display Scale ............................................................................ 5-6
5.5
Setting the Waveform Information Display ....................................................................... 5-7
IM AQ1200-01EN
iii
Page 5
iv
IM AQ1200-01EN
Contents
Chapter 6 Waveform Analysis
6.1 How to Operate the Cursor and Markers ......................................................................... 6-1
6.2 Measuring Distances ........................................................................................................ 6-8
6.3 Moving the Distance Measurement Reference Point ....................................................... 6-9
6.4 Measuring the Splice Loss .............................................................................................
6.5 Measuring the Return Loss .............................................................................................6-11
6.6
Displaying Multiple Traces
6.7 Combining Two
6.8 Displaying Differential T
6.9 Analyzing Sections ......................................................................................................... 6-18
Traces ................................................................................................... 6-14
.............................................................................................. 6-13
races ......................................................................................... 6-16
Chapter 7 Event Analysis
7.1 Displaying the Event Screen ............................................................................................ 7-1
7.2 Editing Events .................................................................................................................. 7-4
7.3 Editing the Event List ........................................................................................................ 7-8
Chapter 8 Light Source (Option)
8.1 Producing Measurement Light ......................................................................................... 8-1
8.2 Turning On the Visible Light ............................................................................................. 8-3
Chapter 9 Optical Power Meter (Option)
9.1 Making Preparations for Measurements .......................................................................... 9-1
9.2 Setting Optical Power Measurement Conditions and Holding the Display ....................... 9-2
9.3 Logging Measured Values and Saving Logged Results ................................................... 9-5
9.4
Selecting and Saving Core and Tape Numbers .............................................................
6-10
9-10
Chapter 10 PON Power Meter (Option)
10.1 Making Preparations for Measurements ........................................................................ 10-1
10.2 Setting PON System Optical Power Measurement Conditions and Holding the Display 10-2
10.3 Selecting and Saving Core and Tape Numbers .............................................................
Chapter 11 Loss Testing (Option)
11.1 Making Preparations and Adjustments for Loss Testing ..................................................11-1
11.2 Performing an Auto Loss Test..........................................................................................11-3
11.3 Performing a Loop-Back Loss Test..................................................................................11-8
Chapter 12 Multi-Core Loss Testing (Option)
12.1 Creating New Projects .................................................................................................... 12-1
12.2 Sharing Projects ............................................................................................................. 12-3
12.3 Performing a Multi-Core Loss Test ................................................................................. 12-6
12.4 Optical Power Adjustment .............................................................................................. 12-9
Chapter 13 Fault Locator
13.1 Locating Breaks (Faults) in Optical Fibers ..................................................................... 13-1
Chapter 14 Checking Fiber End Faces
14.1 Using Fiber Inspection Probes to View the Status of Optical Fiber End Faces .............. 14-1
10-5
Chapter 15 IP Testing (Option)
15.1 Performing an IP Test ..................................................................................................... 15-1
Page 6
3
2
1
4
5
6
7
8
9
10
11
12
13
14
15
16
17
18
19
App
Index
20
Contents
Chapter 16 Multi-Core Fiber Measurement
16.1 Creating a New Project .................................................................................................. 16-1
16.2 Loading a Project ........................................................................................................... 16-8
16.3 Measuring Multi-Core Fibers .......................................................................................... 16-9
Chapter 17 Event Mapper
Chapter 18 File Operation and Printing
17.1 Displaying Optical Fiber Events as Icons ....................................................................... 17-1
18.1 Connecting a USB Storage Medium to the USB Port .................................................... 18-1
18.2 Saving and Loading Data ............................................................................................... 18-2
18.3 Deleting and Copying Files ............................................................................................ 18-8
18.4
Changing File Names ................................................................................................... 18-10
18.5 Creating Folders ........................................................................................................... 18-12
18.6
Deleting and Copying
18.7 Initializing the Internal Memory ..................................................................................... 18-15
18.8 Printing .........................................................................................................................
Specifying the Items That Are Displayed in the File List
18.9
Folders ...................................................................................... 18-13
18-16
............................................... 18-17
Chapter 19 Other Operations
19.1 Configuring the Language, Beep, Start Menu, USB Function, and Screen Color .......... 19-1
19.2 Configuring Power Save Settings ................................................................................... 19-2
19.3 Resetting the AQ1200 to Its Factory Default Settings ....................................................
19.4 Setting Operation Restrictions ........................................................................................ 19-4
19.5 Assigning Menus Items
19.6 Configuring Network Settings (Option) ........................................................................... 19-7
That Are Displayed on the
Top Menu ....................................... 19-6
Chapter 20 Troubleshooting, Maintenance, and Inspection
20.1 If a Problem Occurs ........................................................................................................ 19-1
20.2 Error Messages .............................................................................................................. 19-2
20.3 Viewing the Product Information.....................................................................................
20.4 Performing a Self Test
20.5 Updating the Firmware ................................................................................................... 19-8
20.6
Backing Up Necessary Files to a PC and Initializing the Internal Memory (Firmware
version 1.12 and later) .................................................................................................... 19-9
20.7
Performing a Mechanical Inspection and Checking Operations ...................................
20.8 Replacing the Battery Pack ...........................................................................................19-11
20.9 Replacing an Optical Adapter ....................................................................................... 19-14
20.10 Routine Maintenance ................................................................................................... 19-16
20.11 Storage Precautions ..................................................................................................... 19-17
20.12 Recommended Replacement Parts ............................................................................. 19-18
20.13 Calibration ....................................................................................................................
.................................................................................................... 19-7
Appendix
Appendix 1 Data File Formats ............................................................................................... App-1
19-3
19-6
19-10
19-19
Index
IM AQ1200-01EN
v
Page 7
1
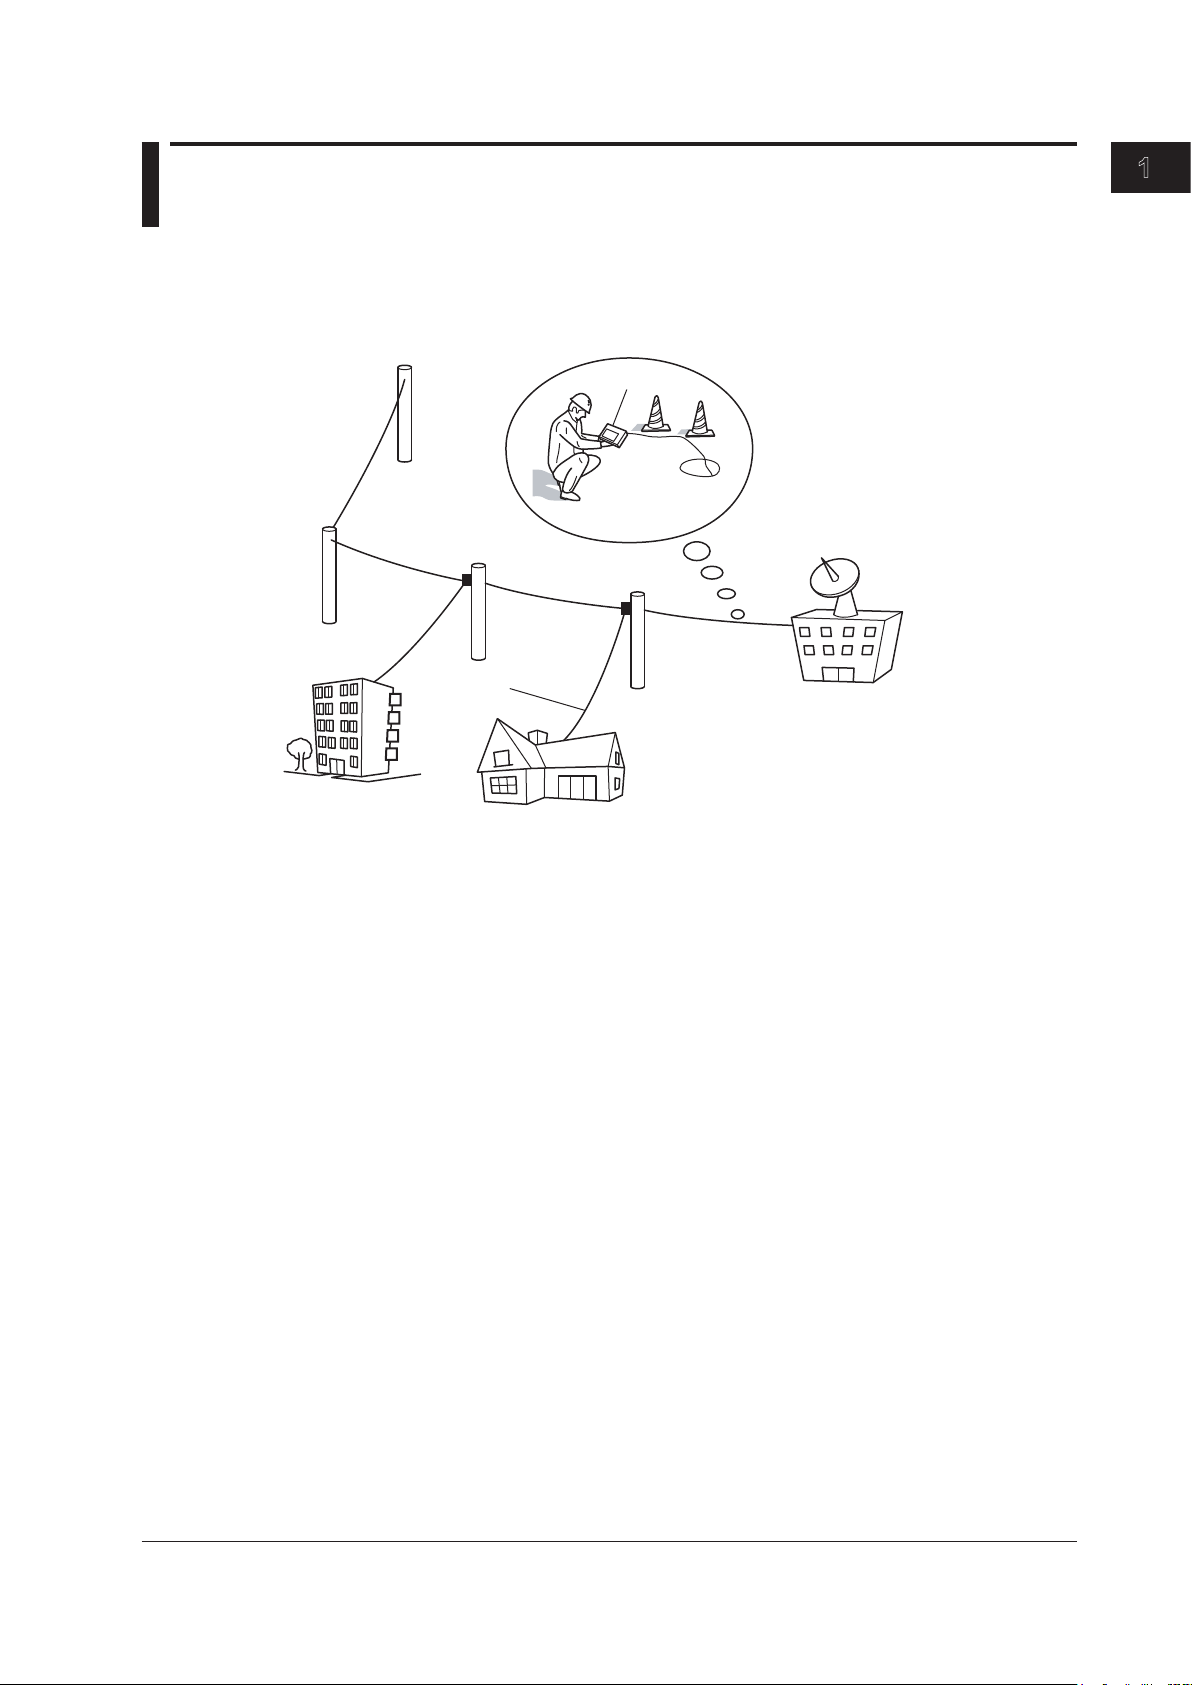
Optical fiber cable
Telephone
exchanges
Measurement
in cable
installations
AQ1200
Consumer
Corporate user
Chapter 1 Features
1.1 Overview
This instrument is an OTDR (Optical Time Domain Reflectometer) with the features listed below. It
is used in the optical fiber and line installation and maintenance servicing of access networks, which
link telephone exchanges and service providers with subscribers, and user networks, which enable
communication within a corporation or building.
Features
OTDR Features
• Optical pulse measurement
Real-time, averaged measurement
• Waveform display
Can be zoomed and moved
• Waveform analysis
• Cursor/marker, distance, splice-loss, return-loss measurement
• Multi trace analysis
• 2 way trace analysis
• Differential trace
• Section analysis
• Event analysis
• Event editing
• Event list editing
Loss Testing (/SLT or /HLT option)
• Loss-measurement light source and visible light source
• Optical power meter
• Loss measurement (loss testing)
• Multi-core loss testing
Visible light source (/VLS option)
Generation of visible light
IM AQ1200-01EN
Fault Locator
Location of breaks (faults) in optical fibers
1-1
Page 8

1.1 Overview
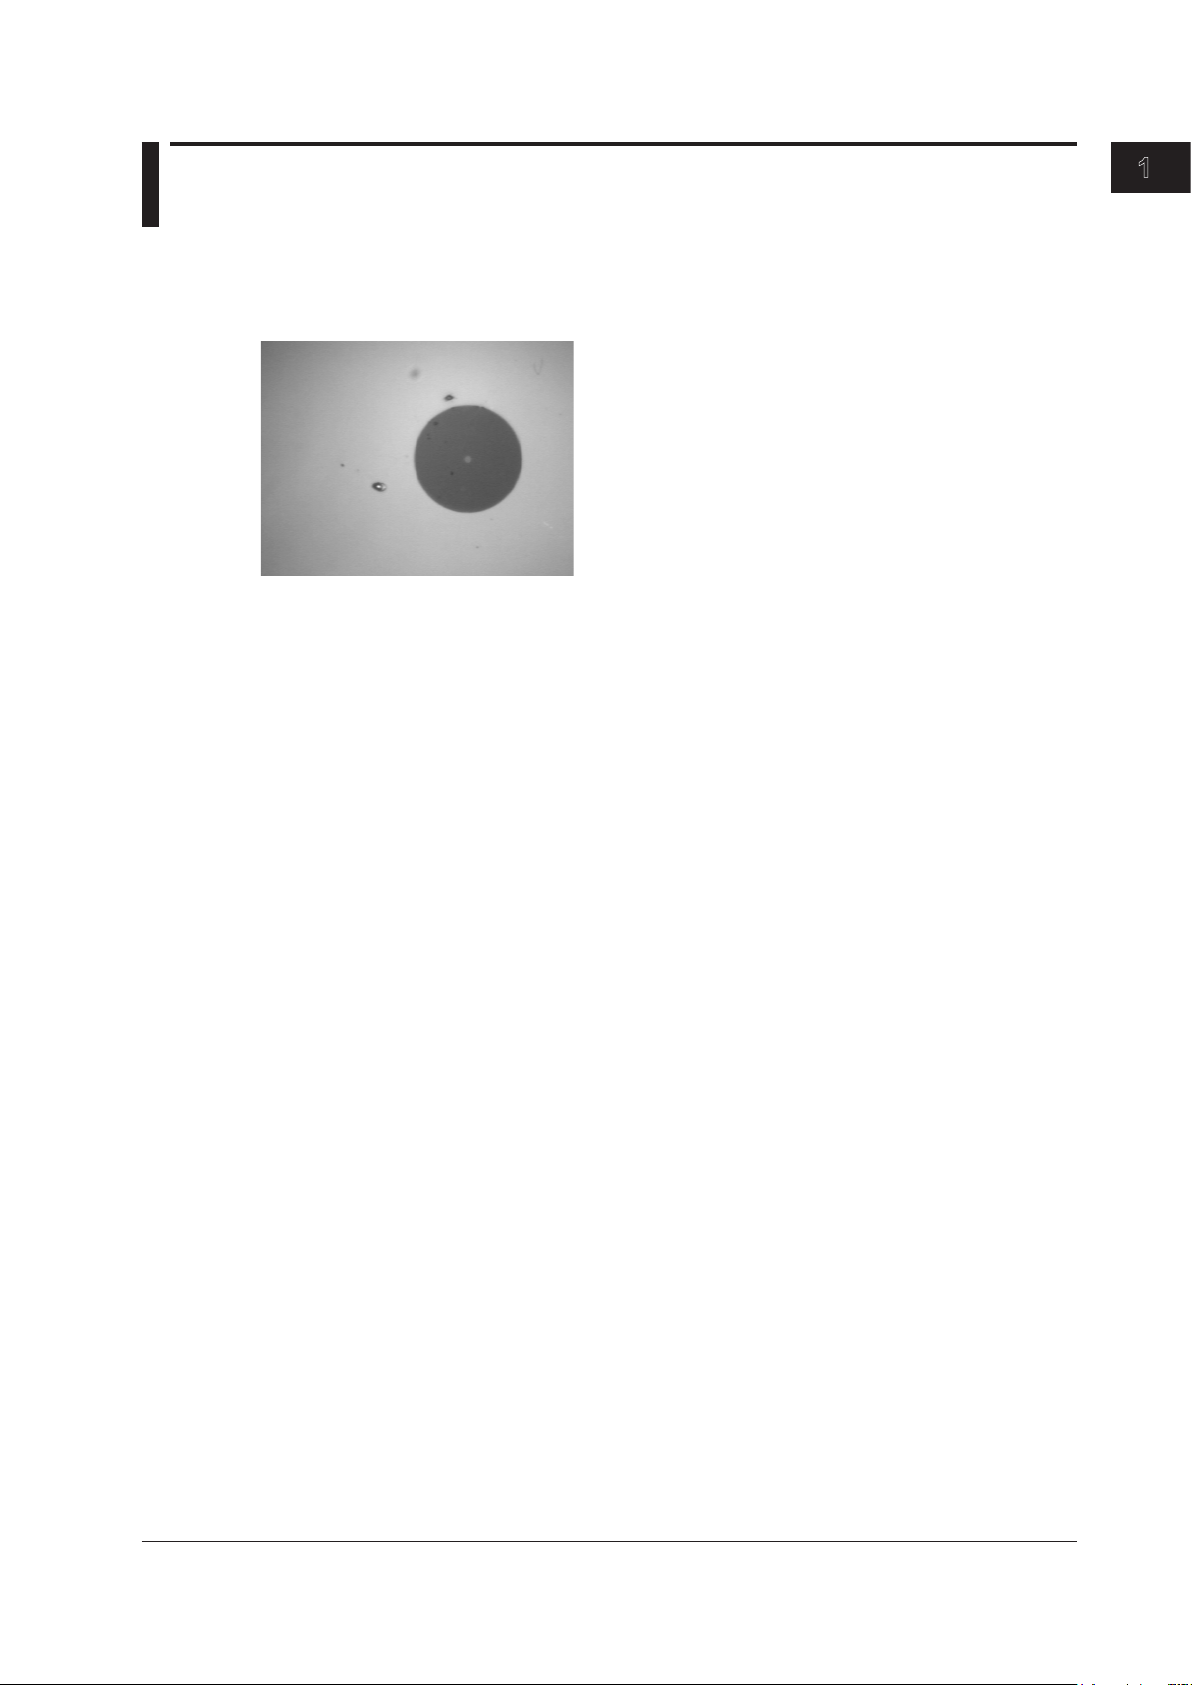
Checking Fiber End Faces
You can use a fiber inspection probe* to photograph a fiber end face and display its state on the
screen.
* For information about compatible fiber inspection probes, contact your nearest YOKOGAWA dealer.
IP Testing (/LAN option)
Simple connection testing that uses PING
PON power meter (/PPM option)
Simultaneous measurement of the optical power of different signal wavelengths (1310 nm, 1490 nm,
and 1550 nm) of a PON system
Multi-Core Fiber Measurement
Using screens and menus specific to multi-core fiber measurement, you can efficiently and completely
measure multi-core fibers.
1-2
IM AQ1200-01EN
Page 9
1
1.2 Optical Pulse Measurement
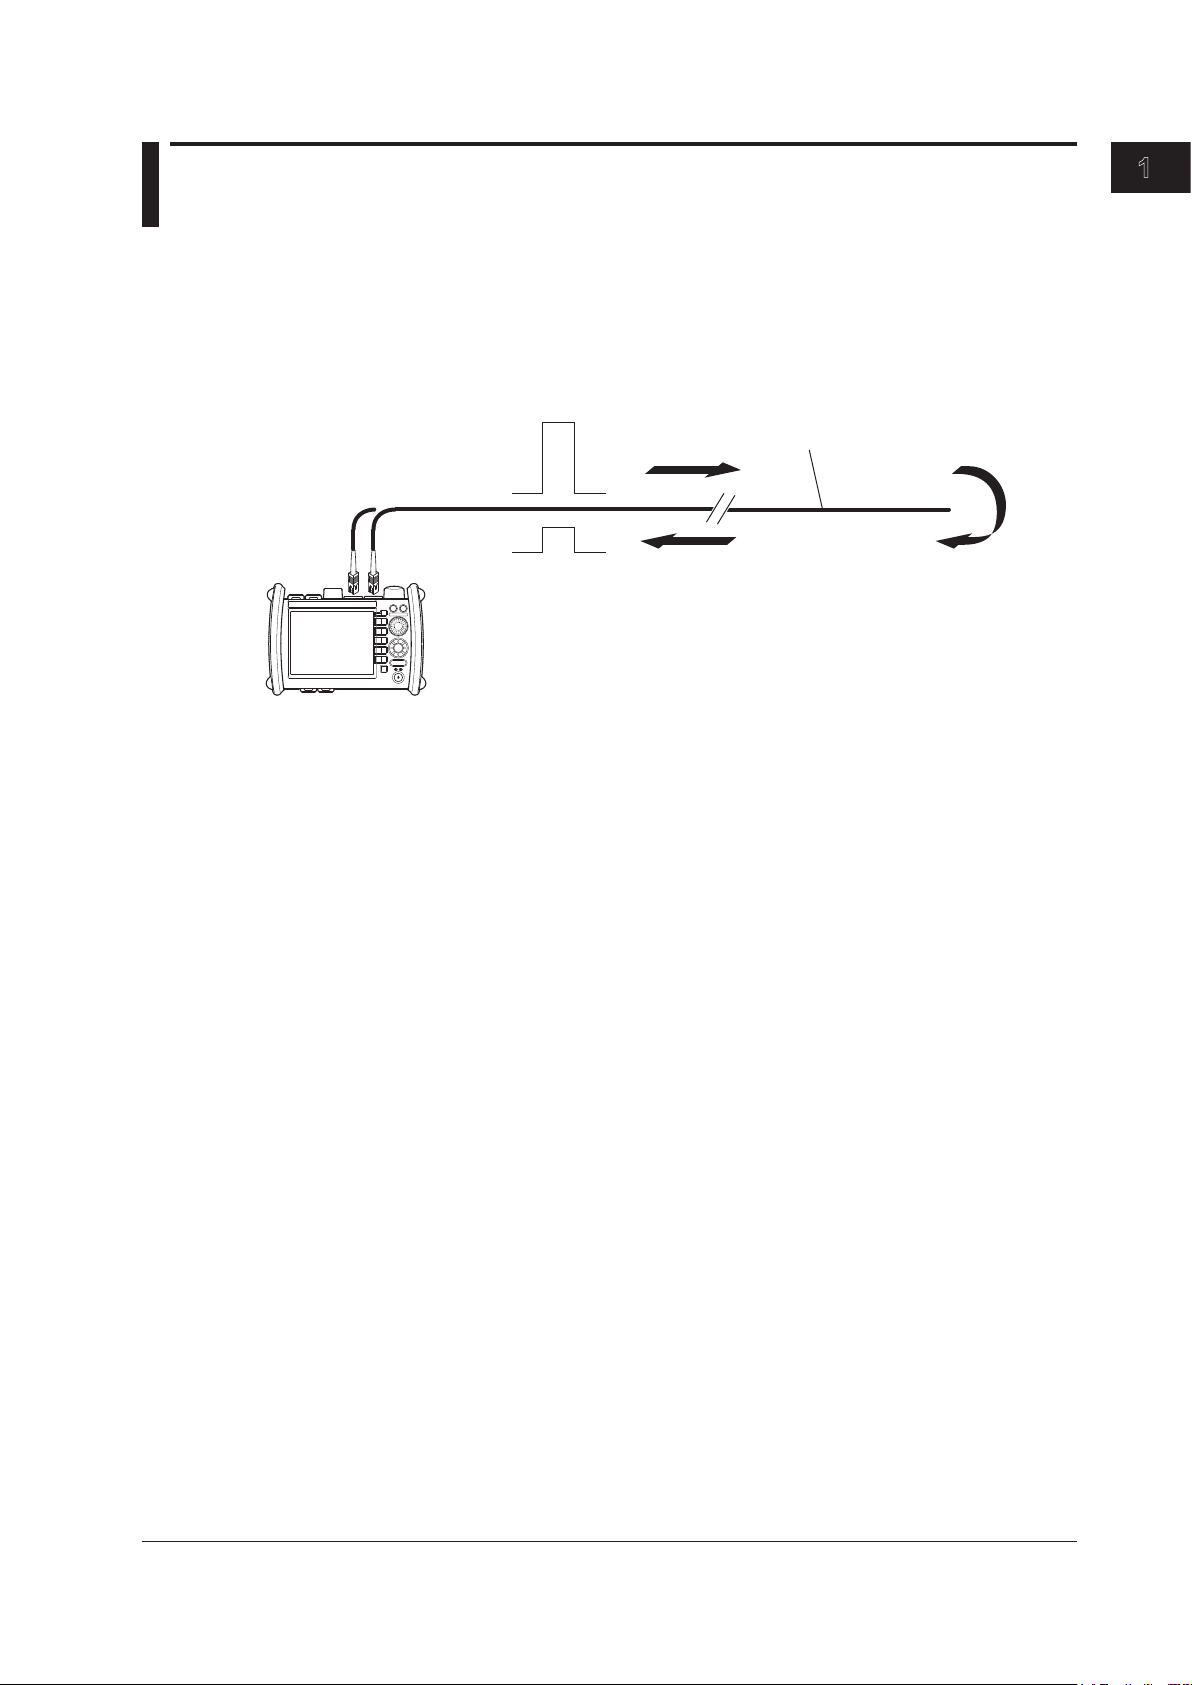
Reflection
point
Optical fiber being measured
Optical pulse generation
Reflected light
Do not bend the optical fiber.
AQ1200
OTDR/Optical port
(Optical port 2)
or
OTDR/Optical port
(Optical port 3)
The AQ1200 applies an incident optical pulse to the connected optical fiber and measures the power
level of the reflected light from the different sections of the optical fiber such as its splices, bent
sections, and the open end of the fiber. The AQ1200 uses the measured power level to determine
the distance to the different points (splices, breaks, etc.) of the optical fiber and the loss and other
phenomena that occur at those points.
Measurement Mode
The following three measurement modes are available depending on the items that you specify for
measurement conditions.
Simple
In this mode, you can set the optical wavelength and turn the automatic saving of measured data on
and off. All other measurement conditions are automatically configured or are fixed.
Features
Detail
In this mode, you can set all measurement conditions.
Multi WL
In this mode, in addition to the settings that you can specify in Detail mode, you can select up
to two optical wavelengths. The optical pulse whose wavelength you specified first is generated
and measured. Next, the optical pulse whose wavelength you specified second is generated and
measured. This operation is then repeated.
Analysis Mode
The following three analysis modes are available depending on the items that you specify for analysis
conditions.
Simple
In this mode, you can set the approximation method. All other analysis conditions are automatically
configured or are fixed.
Detail
In this mode, you can specify all analysis conditions.
Multi WL
In addition to the conditions in Detail mode, you can specify the index of refraction and the
backscattering light level for each of the two wavelengths that you specified in the measurement
Multi WL mode. You can also turn the macro bending (bending loss) display on and off.
IM AQ1200-01EN
1-3
Page 10

1.2 Optical Pulse Measurement
Real-time Measurement
In real-time measurement, you can change measurement conditions such as the wavelength, distance
range, and pulse width while waveform changes are being measured in real time.
* The measurement conditions that you can change vary depending on the measurement mode. For details
about the measurement conditions, see the explanation of the measurement modes in chapter 3.
Averaged Measurement
When you want to detect reflections, splice loss, and other faint events that are generated from
connections or splice points but are buried in noise, use averaged measurement. The AQ1200 derives
the measured data by averaging the specified number of optical pulse measurements or by averaging
optical pulse measurements over the specified duration. During averaged measurement, you cannot
change the measurement conditions. You can stop the averaged measurement before it completes.
Multi-Core Fiber Measurement
Using screens and setup menus specific to multi-core fiber measurement, you can efficiently and
completely measure multi-core fibers.
Fiber-in-Use
Some models in the AQ1200 Series use the same wavelength that is used in real communication to
make measurements.
If communication light is present in the optical fiber that you want to measure (the fiber is in use), the
communication will be affected. In this situation, the AQ1200 will not be able to perform measurements
correctly either. Take appropriate precautions to avoid communication interference. Check that there is
no communication light present in the optical fiber before you use the AQ1200.
The AQ1200 has a feature for checking whether there is communication light (fiber-in-use alarm; see
section 3.5).
*
1-4
IM AQ1200-01EN
Page 11
1
1.3 Waveform Display
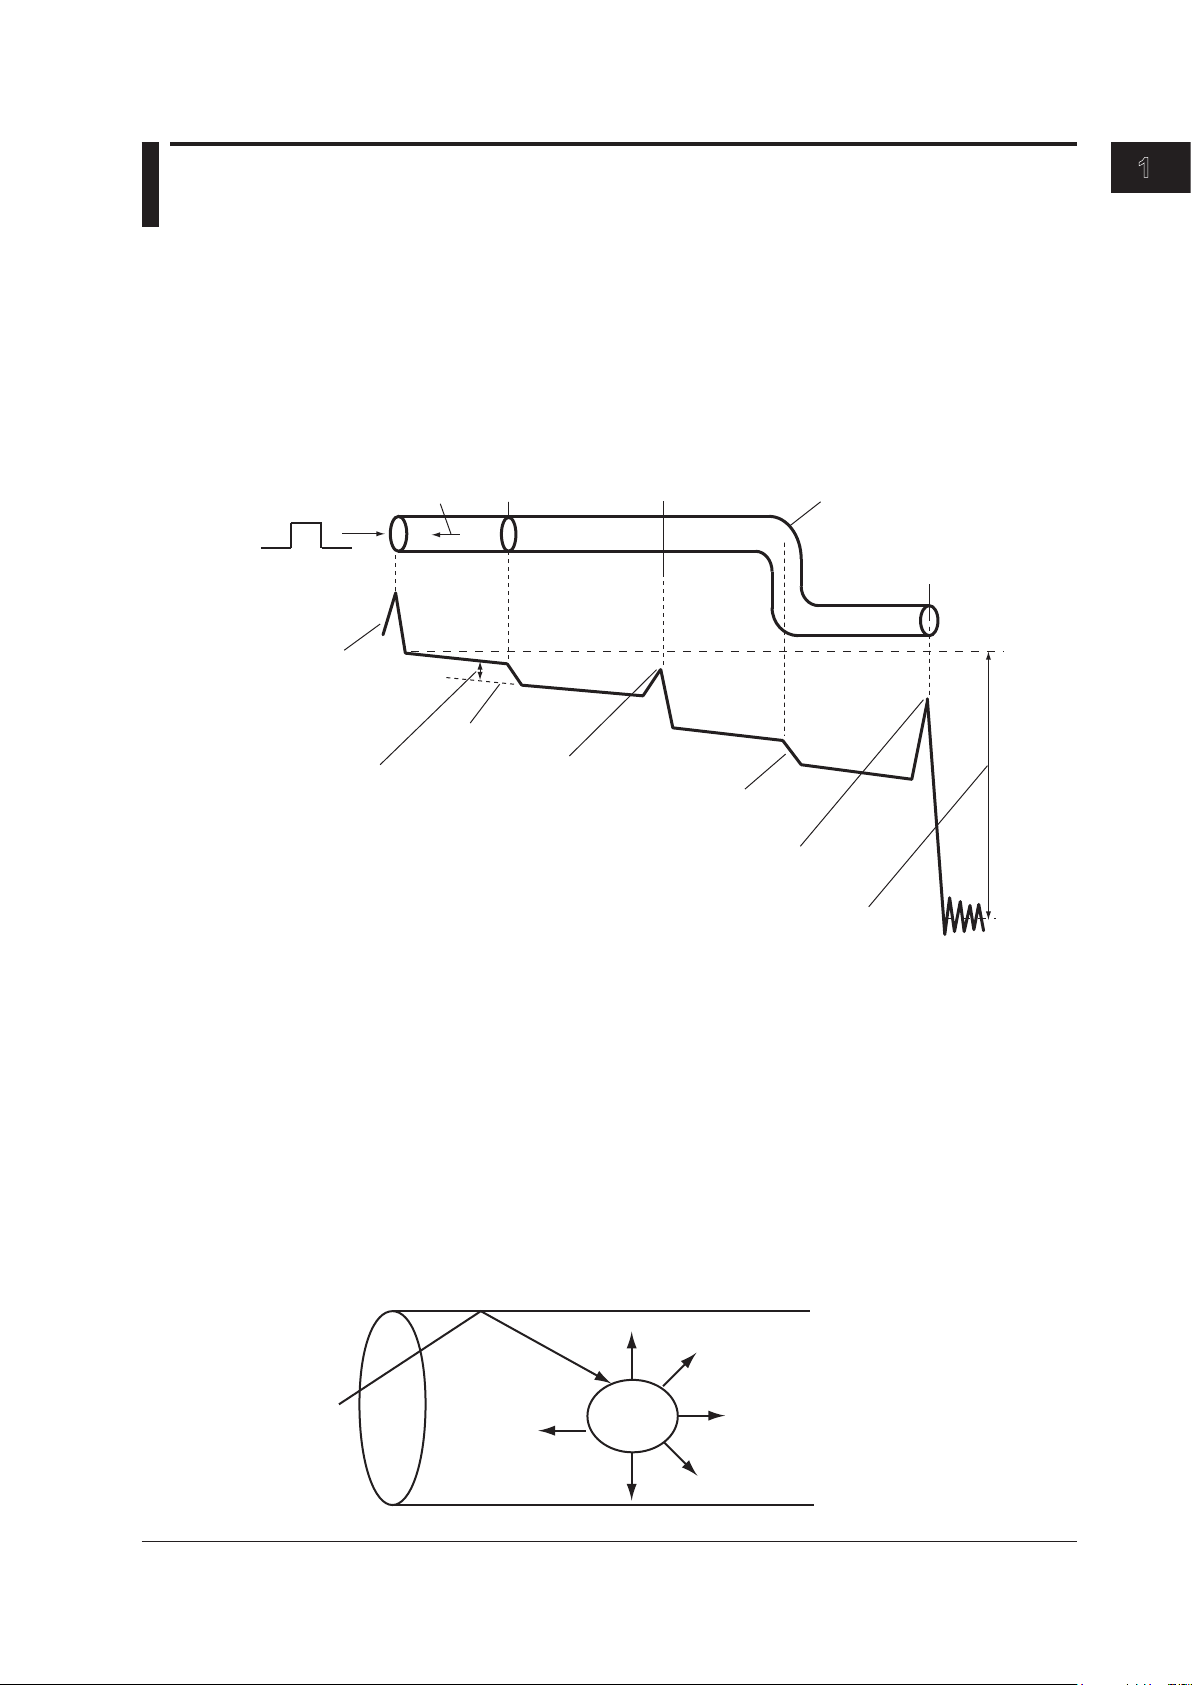
Incident ray Backscatter Splice Connector Bend
Open end of
the fiber
Near-end
reflection
Splice loss
Approximated
line
Reflection caused
by a connector
Loss caused
by bending
Reflection at the open end
of the fiber (Fresnel reflection)
Dynamic range (SNR = 1)
Optical fiber
Small
material
Incident ray
Backscatter
Optical fiber
You can display the measured result as a waveform on the screen. You can zoom the displayed
waveform and move the position that is displayed.
How to View Optical Pulse Waveforms
The optical pulse applied to the optical fiber is reflected at different points of the optical fiber such
as its connections, bent sections, and the open end of the fiber. These sections generate loss. The
measured result is displayed as a waveform that has distance represented in the horizontal direction
and loss level represented in the vertical direction. On the waveform, detected points where loss or
reflection occurs are known as events.
Features
Near-end Reflection
This is the reflection that occurs at the point where the AQ1200 and the optical fiber are connected.
This also includes the AQ1200’s internal reflection. In the section where this near-end reflection is
detected, even if there are other connections, the loss and reflections that occur at these points cannot
be detected. This section is the near-end dead zone.
When you are measuring a short distance, connect a dummy fiber to reduce the effect of the near-end
reflection.
Backscatter
When light travels through an optical fiber, Rayleigh scattering caused by changes in the density of
materials that are smaller than the light’s wavelength and inconsistencies in the fiber’s composition
IM AQ1200-01EN
generates loss in the optical fiber itself. The portion of the scattered light that travels in the direction
opposite to the direction of propagation is known as backscatter.
1-5
Page 12
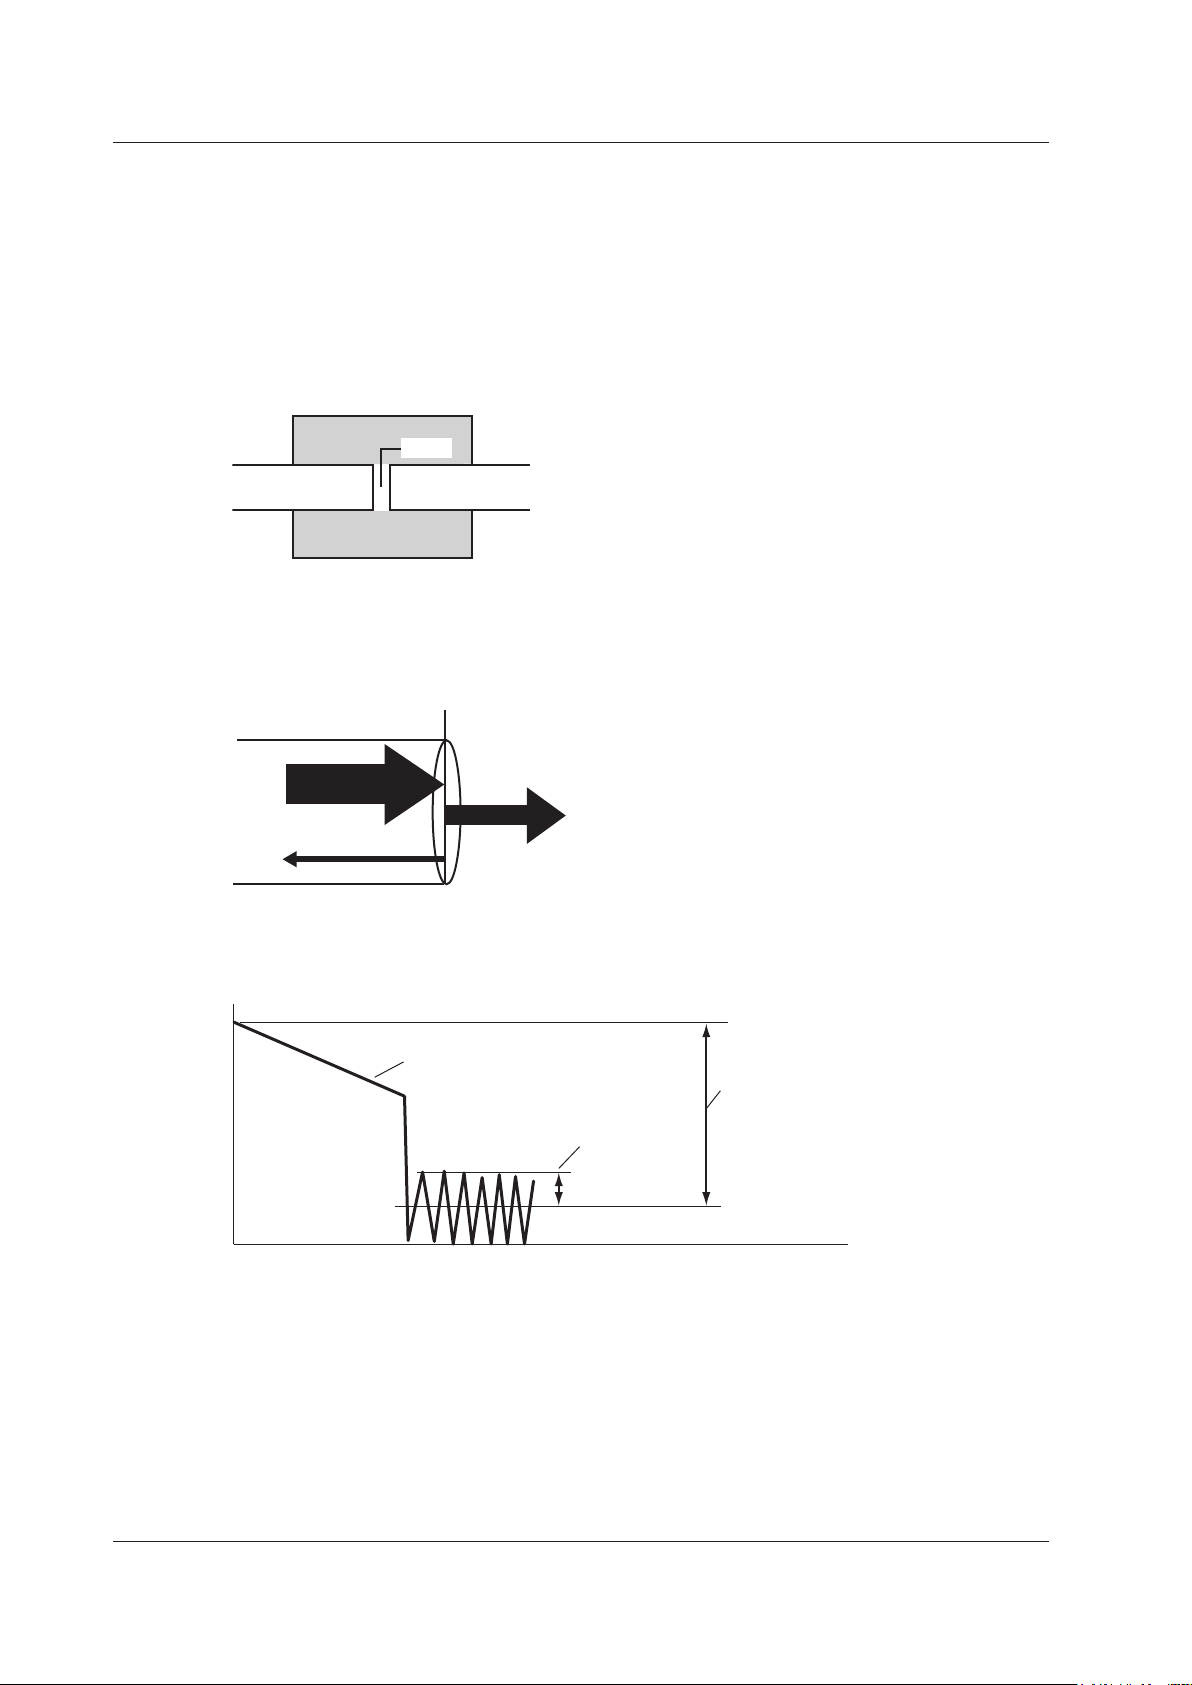
Optical fiber
Optical fiber
Connector
Gap
Glass Air
Incident ray (100%)
Reflected light (3%)
Light
(97%)
Measurement waveform
Noise peak
2.6 dB
RMS level of the noise
Dynamic range
(SNR = 1)
1.3 Waveform Display
Splice Loss
Because spliced sections of optical fibers have a great number of changes in the material’s density
and inconsistencies in the fiber’s composition, loss due to Rayleigh scattering becomes large, and
splice loss occurs in these sections.
Reflection at the Connection Point of Connectors
Using a connector to connect two optical fibers is different from splicing them together in that a small
gap remains between the two fibers. Because this gap has a different index of refraction, reflection
occurs.
Fresnel Reflection at the Open End of the Fiber
This is the reflection that occurs at locations where the index of refraction changes (glass to air) such
as where there are tears in the optical fiber or at the end of the optical fiber. When the optical fiber end
face is vertical, approximately 3% of the incident optical power (–14.7 dB) is reflected.
Dynamic Range
Dynamic range refers to the range of optical power levels that can be measured. The larger the
dynamic range, the greater the distance that optical pulses can be measured over.
Zooming the Waveform Display Scale
You can zoom the displayed waveform in the direction of the optical power level (vertically) or in the
direction of the distance (horizontally). A rectangular frame that shows the zoom position is displayed
on the overview screen that appears in the bottom right of the screen.
1-6
Moving the Waveform Display Position
You can move the displayed waveform in the direction of the optical power level (vertically) or in the
direction of the distance (horizontally). A rectangular frame that shows the display position is displayed
on the overview screen that appears in the bottom right of the screen. This is the same rectangular
frame that shows the zoom position.
IM AQ1200-01EN
Page 13

1
1.4 Waveform and Event Analysis
Pulse width
Waveform Analysis
You can use the cursor and markers to measure values such as the distance, splice loss, return loss,
or reflection level between two points.
Measuring Distance
The AQ1200 measures the time that it takes for an incident optical pulse to be reflected and return to
the device. It uses this information and the following equation to calculate the distance (L).
L = C×T/(2N) [m]
C:
The speed of light in a vacuum 2.99792 × 10
T: The time measured from when the incident pulse was generated to when the reflected light
was received [s]
N: Index of refraction
In the above equation, the division by two accounts for the fact that the measured time represents the
total time taken by the optical pulse to reach the reflection point and to return from it.
If the correct index of refraction is not specified, there will be errors in the distance measurement.
Setting the Index of Refraction
The AQ1200 has preset indices of refraction that correspond to each wavelength. For details on
the settings, see section 3.6. Contact the optical fiber manufacturer for the fiber’s correct index of
refraction.
8
[m/s]
Features
Distance Range
You must select a distance range that is longer than the cable length of the optical fiber that you
want to measure. As the distance becomes greater, the measurement time also increases. For
details on the setting range, see section 3.5.
Pulse Width
There are the following features depending on the length of the pulse width. The pulse width that
you can select varies depending on the distance range that you have specified. For details on the
settings, see section 3.5.
•
Short pulse width
You can separate and measure adjacent events (reflection points and losses). However
cannot measure long distances.
• Long pulse width
You can measure long distances. However, multiple adjacent
event.
events may be seen as one single
, you
IM AQ1200-01EN
1-7
Page 14
Event dead zone
Attenuation dead zone
1.5 dB
Do not bend the optical fiber.
AQ1200
Optical fiber being
measured
Dummy fiber
Event generation
point
Small reflection that was hidden
within a large reflection
Splice loss a (dB)
(Total loss)
(n when Marker Mode is set to Line)
(E when Marker Mode is set to Line)
2
1
d (km)
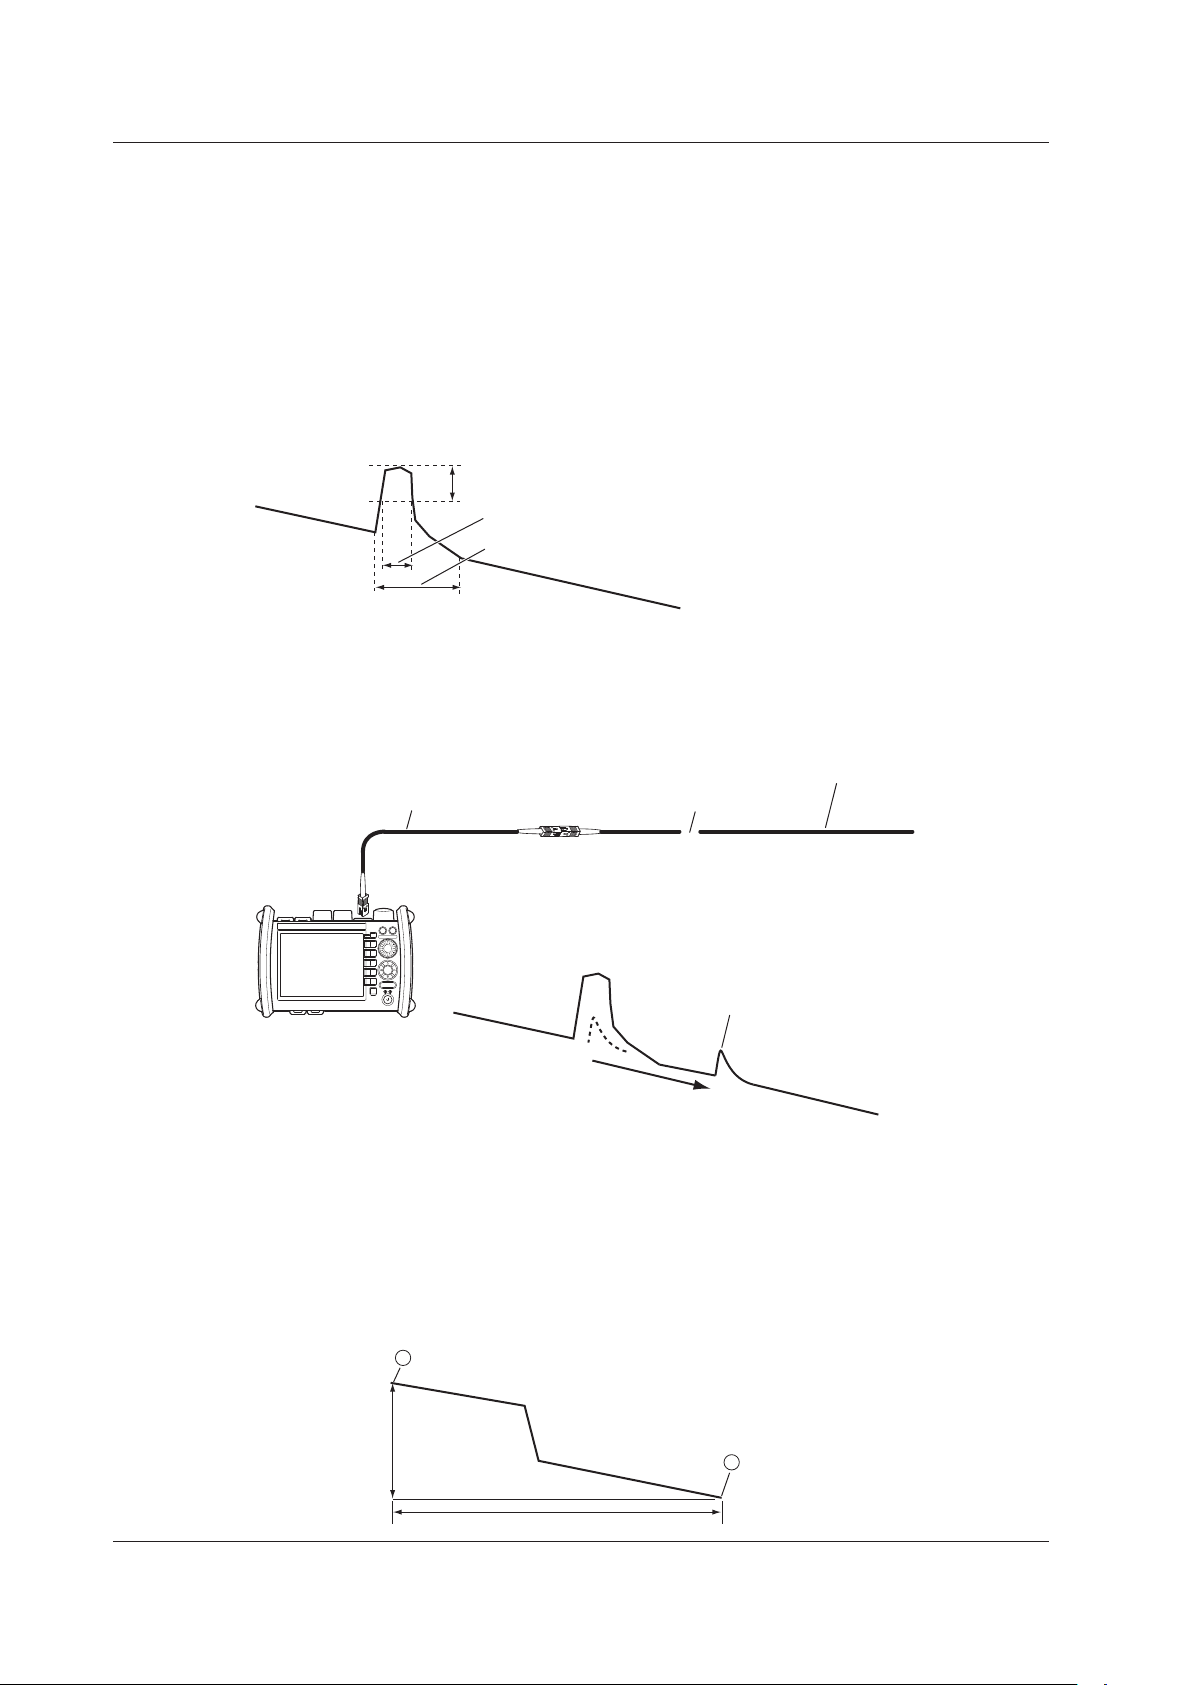
1.4 Waveform and Event Analysis
Dead Zone
An area where the influence of a large event such as a connector’s connection point makes it
impossible to recognize other events that exist in that area is a dead zone. There are the following
two types of dead zones.
•
Event dead zone
An area where adjacent reflections cannot be separated. This is the area represented by the
pulse width between the two points on the waveform at the level that is 1.5 dB below the peak
value.
•
Attenuation dead zone
An area where, because there is a large reflection, the surrounding splice losses cannot be
measured.
Near-end Dead Zone Prevention
In sections where near-end reflection is detected, loss and reflections that occur at connections
cannot be detected. If you are measuring a short distance, connect a dummy fiber to move events
that are hidden in the near-end reflection the distance of the dummy fiber.
1-8
Splice Loss
The AQ1200 measures the distance and the loss between the specified points.
2 Point Markers
The AQ1200 measures the distance and the loss between two points. If reflection is detected
between the two points, the return loss is also measured. The splice loss value changes depending
on the approximation method that you have specified. This can be used when Marker Mode is set
to Marker or Line.
IM AQ1200-01EN
Page 15
1
1
3
3
2
Y2
b(dB)
e (dB)
c (km) f (km)
Approximated line Y2–
3
2
1
3
n
NfF
a (dB)
b (dB)
c (km)
e (dB)
f (km)
E
Approximated
line F–f
Approximated
line n–N
1.4 Waveform and Event Analysis
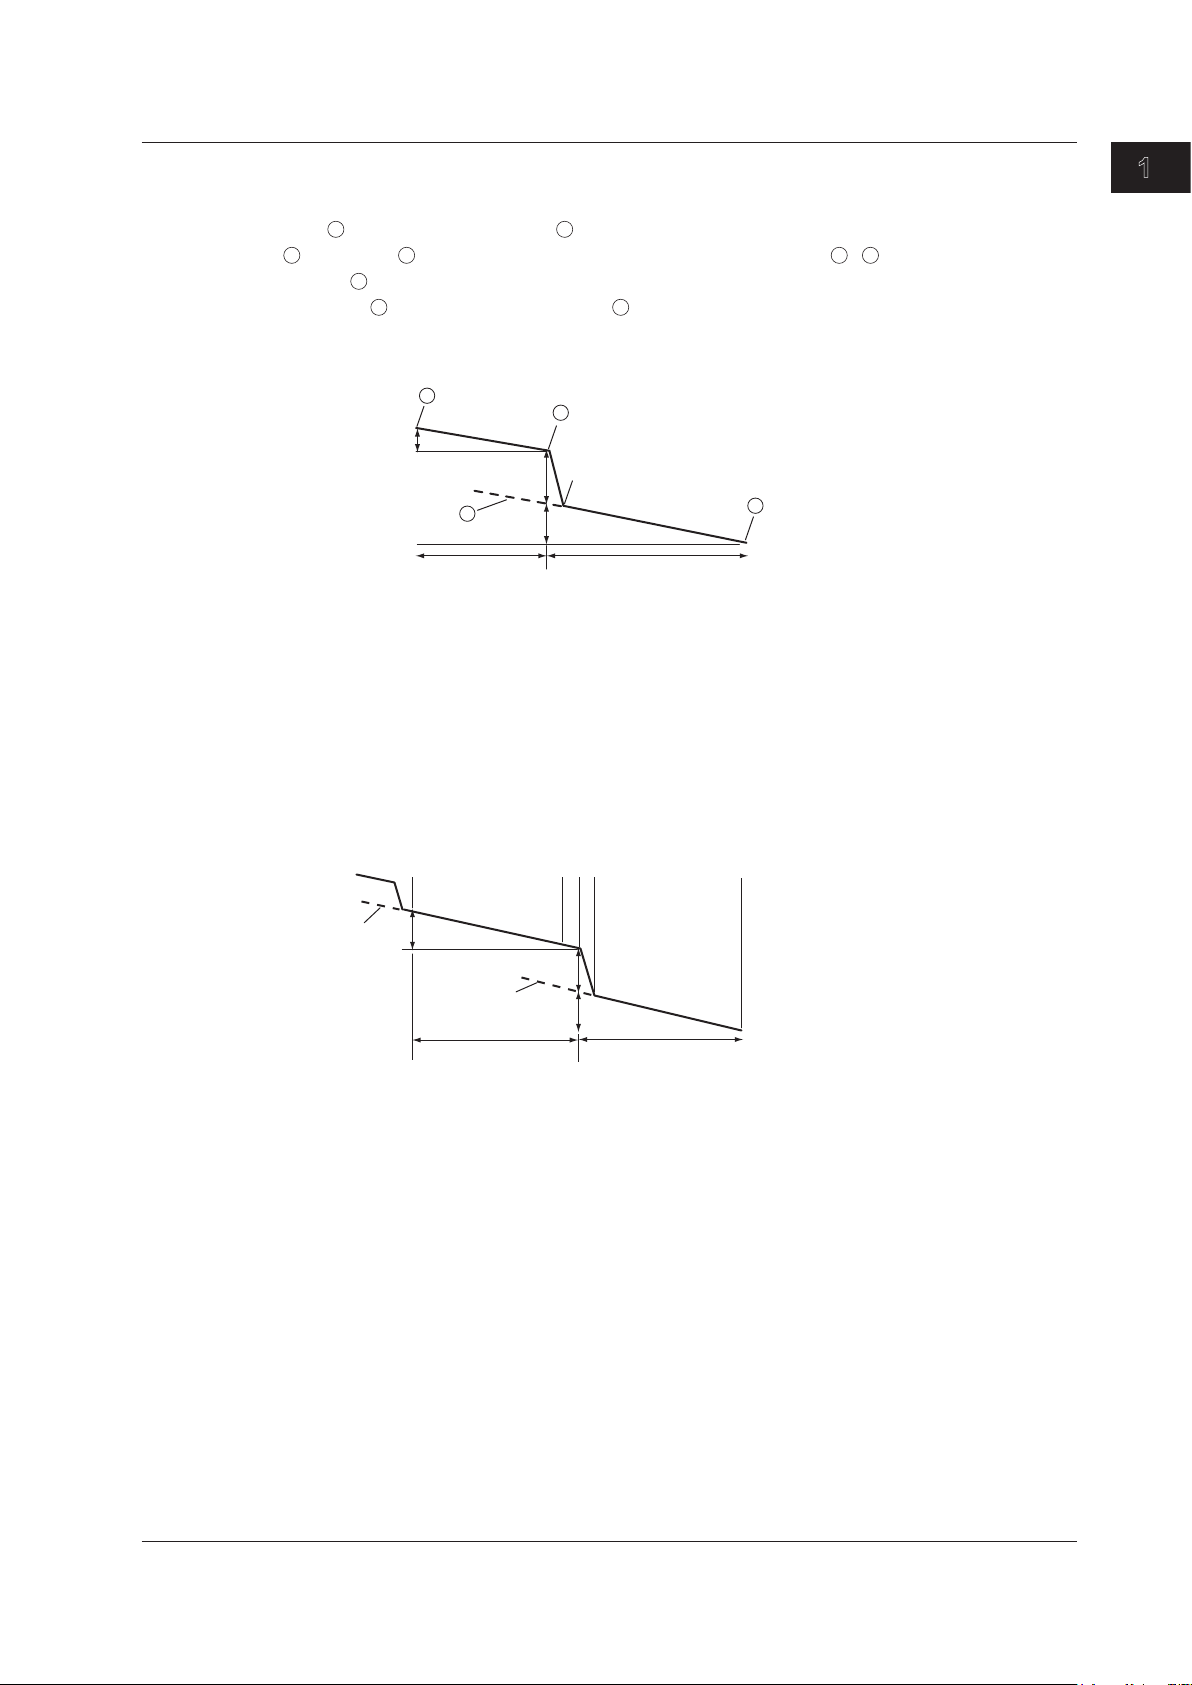
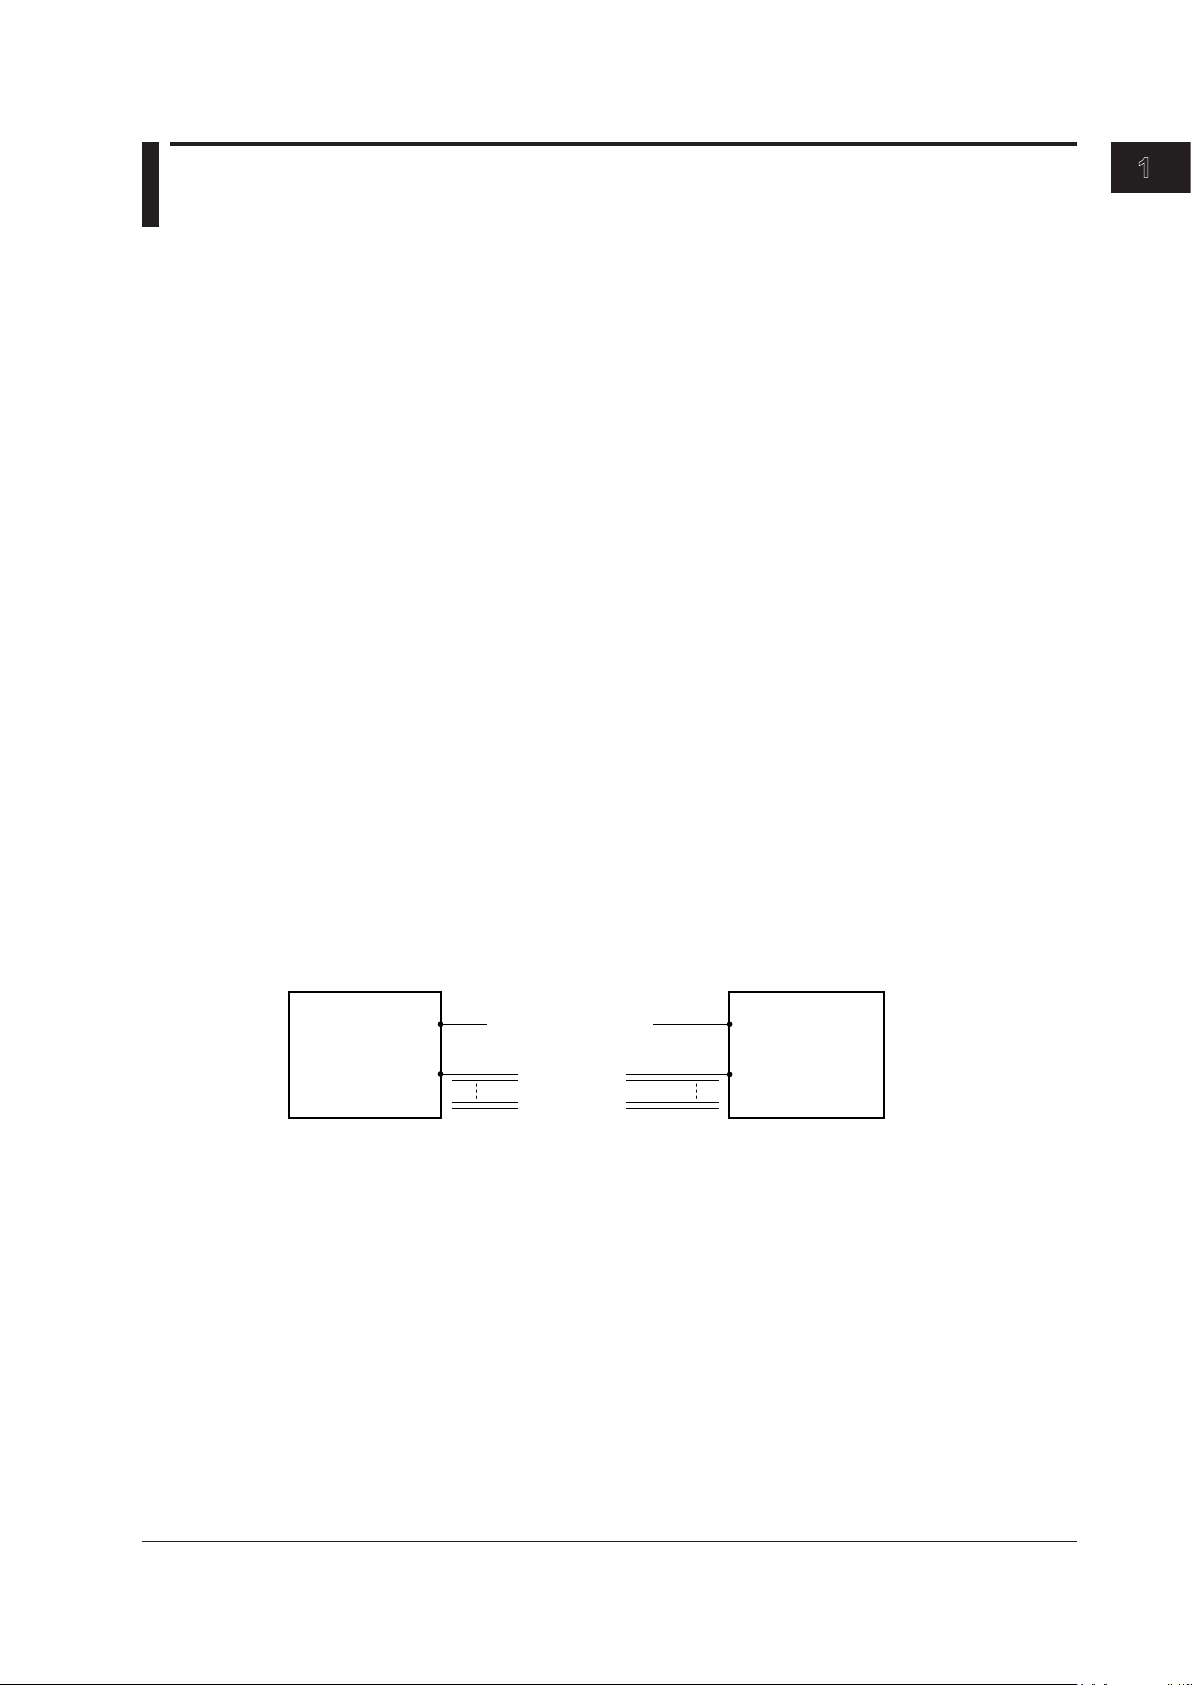
4 Point Markers
The AQ1200 uses the following four points to perform the measurement: the measurement start
point
, the splice loss start point 2, the splice loss end point Y2, and the measurement end point
. At position 2, the level difference between the approximated line 2–1 and the approximated
line Y2–
position of
is calculated as the splice loss. The splice loss changes greatly depending on the
. Set the correct position for 2. The splice loss value changes depending on the
approximation method that you have specified. This can only be used when Marker Mode is set to
Marker.
5 Point Markers
The AQ1200 uses the following five points to perform the measurement: the near-end point (n), a
point (N) that is used to calculate the near-end side’s approximated line, a point (E) where splice
loss is detected, a point (F) that is used to calculate the far-end side’s approximated line, and the
far-end point (f). At position E, the level difference between the approximated line n–N and the
approximated line F–f is calculated as the splice loss. The splice loss changes greatly depending
on the position of E. Set the correct position for E. The splice loss value changes depending on the
approximation method that you have specified. This can only be used when Marker Mode is set to
Line.
Features
IM AQ1200-01EN
Return Loss
Return loss RL is the ratio, in dB, of the reflected optical power level Pr to the incident optical power
level Pi. It is calculated using the following equation. The larger the return loss, the smaller the
reflected optical power. This implies that the performance of the measured optical line is good.
RL
= –10log(Pr/Pi) [dB]
1-9
Page 16
AQ1200
End A
End B
End A → End B
End A ← End B
▲ ▲ ▲ ▲ ▲ ▲
S 1 2 3 4 E
AQ1200
▲ ▲ ▲ ▲ ▲ ▲
S1234E
5
▲ ▲ ▲ ▲ ▲ ▲
S
1
2 3 4 E5
2 way trace analysis
B
B
S E
E
EE
B
1.4 Waveform and Event Analysis
Multi Trace Analysis
You can load up to four traces that have been measured on the AQ1200 and display them
simultaneously for comparison.
You can adjust the vertical display position of each loaded trace.
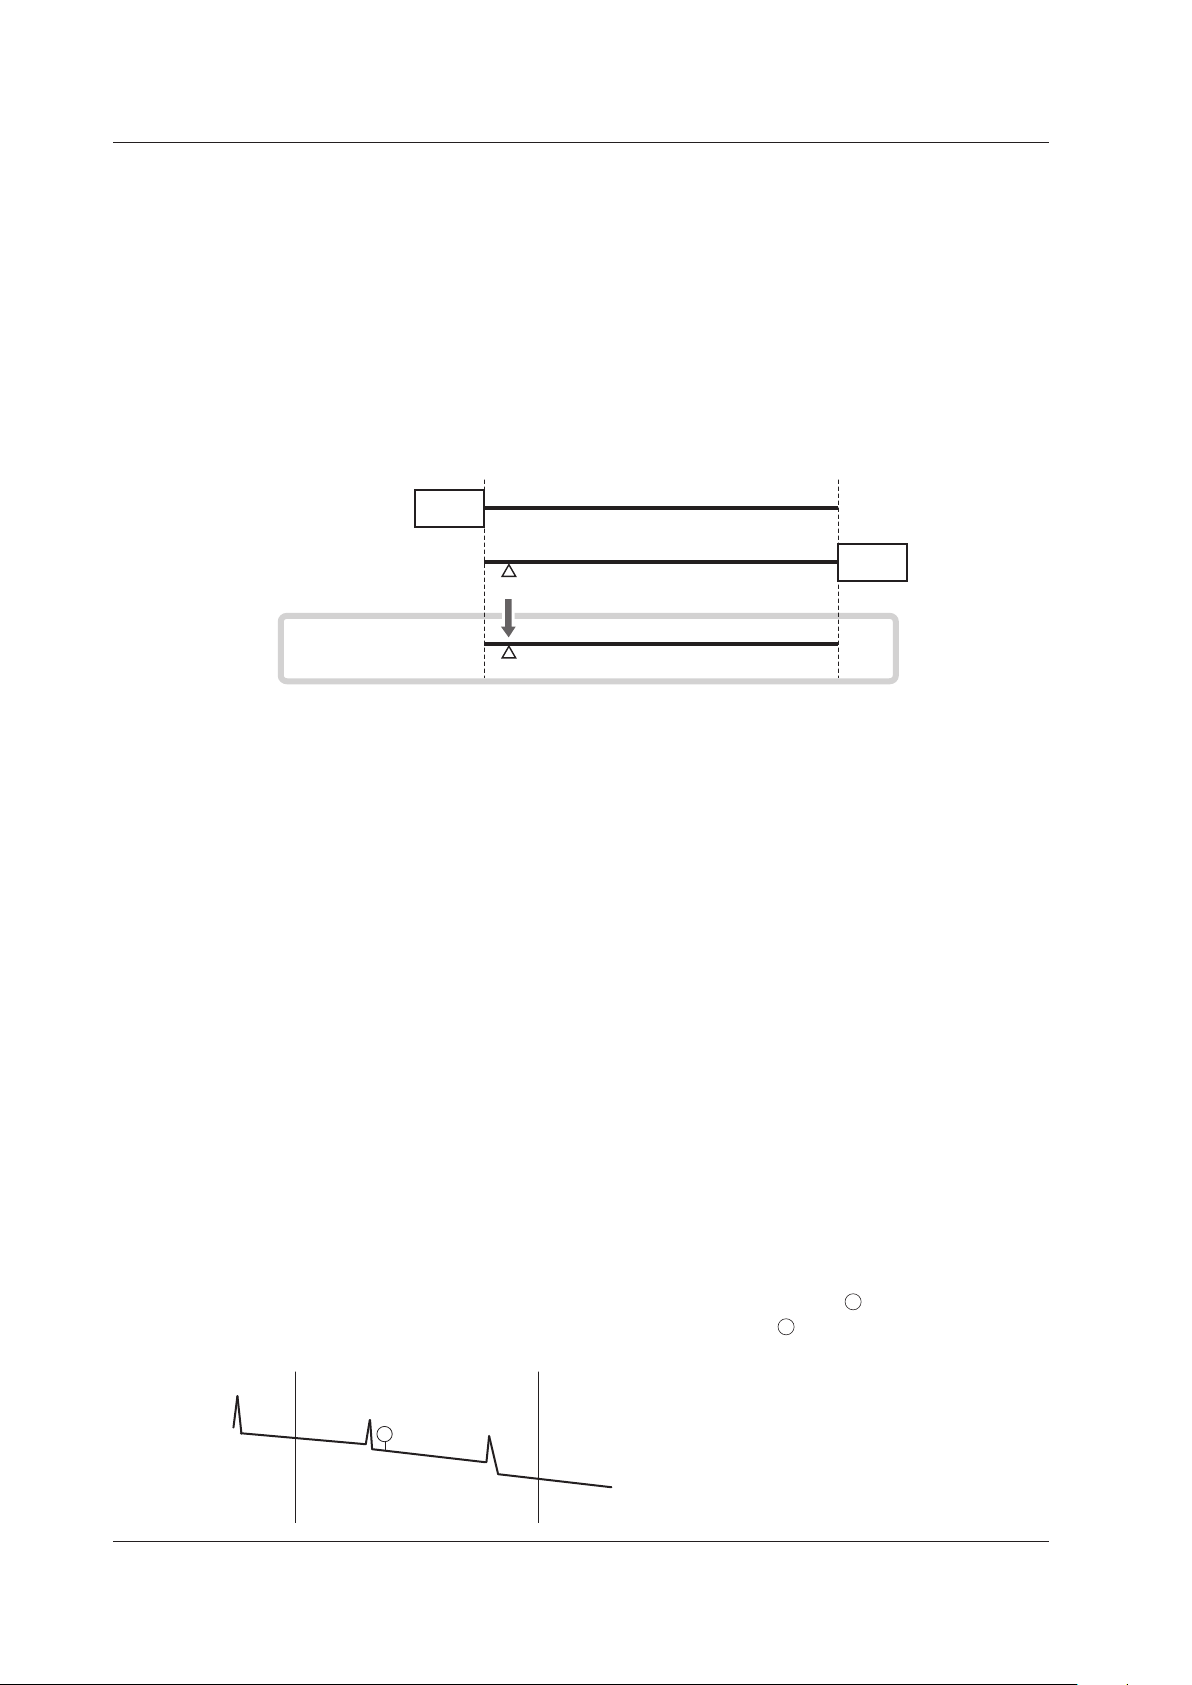
2 Way Trace Analysis
Trace events that have been measured from optical fiber cable end A to end B and those measured
from end B to end A can be combined. This combination enables displaying of events that could not
otherwise be measured because of dead zones.
In the figure below, the event that is in the near-end dead zone (point S) when measured from end A
is detected as event number 5 when measured from end B. In the 2 way trace analysis display, it is
displayed as event number 1.
An event of the other trace that exists within 6% of the position of an event of the current trace will be
considered part of the current trace event.
If multiple events of the other trace that exists within 6% of the position of an event of the current trace,
the closest event will be considered part of the current trace event.
Traces that meet the following conditions can be combined.
• Both have the same wavelength.
• Both have the same pulse width.
• Their end position of
fset is within 6%.
• Both have event lists.
Differential Trace
You can load two traces that have been measured on the AQ1200 and display their difference as a
trace.
The screen can display the loaded traces and the differential trace simultaneously.
The differential trace is the result of subtracting the values of the current trace from those of the other
trace.
You can use markers to read the following values of the differential trace.
Loss between markers (dB)
•
• Distance between markers (km)
• Loss per unit distance between markers (dB/km)
•
Distance to each marker
1-10
Section Analysis
You can set two markers, start point S and end point E, to measure the return loss and total loss in
the section that you have specified. If you specify the reference point marker
measurement, you can measure the return loss in the area between
and E.
for the return loss
IM AQ1200-01EN
Page 17
1
S
▲
▲
▲
▲
1
2
E
Measurement
reference point
Event number 1
Event number 2
Detected fiber-end event E
1.4 Waveform and Event Analysis
Event Analysis
You can search for events in the optical pulse measurement waveform and measure the splice loss
and the return loss.
Event Editing
You can insert and delete events on the event screen. When you edit an event marker, the splice loss
and the return loss can be recalculated.
Event List Editing
You can set indices of refraction for each event period on the event list. Setting the indices of refraction
in accordance with the connected fiber makes accurate distance measurements possible.
These indices only affect event analysis. The do not affect the waveform display.
You can also change event distances. However, the events shown on the screen will not change.
Features
IM AQ1200-01EN
1-11
Page 18
1.5 Light Source and Optical Power Meters (Options)
The features listed for the loss-measurement light source and optical power meters are available on
models with the /SLT, /HLT, or /PPM option. The features listed for the visible light source are available
on models with the /VLS option.
Loss-Measurement Light Source
The following measurement light wavelengths can be generated.
Model Measurement Light Wavelength
AQ1200A SM 1310 nm, SM 1550 nm
AQ1200B SM 1625 nm
AQ1200C SM 1650 nm
AQ1200E SM 1310 nm, SM 1550 nm, SM 1625 nm
AQ1205A SM 1310 nm, SM 1550 nm
AQ1205E SM 1310 nm, SM 1550 nm, SM 1625 nm
AQ1205F SM 1310 nm, SM 1550 nm, SM 1650 nm
You can produce continuous light or light that has been modulated at the selected frequency (modulation
mode).
Visible Light Source
You can produce visible light to visually identify breaks in the optical fiber under test. You can turn the
visible light on and off independently of the measurement light source.
Optical Power Meter
The two instrument types listed below are available for measuring different types of optical power.
Item
Wavelength Yes Fixed
Wavelength mode
Modulation mode
Unit
Reference
Measured value display hold Yes Yes Yes
Measured value logging Yes Yes —
4
Zero set
Average count
Maximum and minimum value
6
display
Interlocking of light source and
optical power meter settings
8
Offset
Threshold
Measurement of the optical
power from ONU to OLT for a
particular signal wavelength
Measurement of the optical
power from OLT to ONU for a
particular signal wavelength
1
2
3
5
9
Models with /SLT or /HLT
Suffix Codes
Yes (dB, dBm, W) Yes (dB, dBm, W) Yes (dBm, W)
7
10
11
Yes — —
Yes — —
Yes Yes —
Yes Yes Yes
Yes Yes Yes
Yes Yes —
Yes Yes —
Yes Yes Yes
Yes Yes Yes
— — Yes
— — Yes
Models with /PPM Suffix Codes
Normal power meter
selected
10, 11
Yes: Can be set or executed, —: Not available
PON power meter
selected
10, 11
Fixed
1-12
1 Wavelengths can be set with the wavelength mode set to Simple, Detail, or CWDM.
• Simple: You can select from a list of preset wavelengths.
• Detail: You can set the wavelength to a value from 800 to 1700 nm in 1 nm steps.
• CWDM: You can set the wavelength to a value from 1270 to 1610 nm in 20 nm steps along the CWDM
wavelength grid.
IM AQ1200-01EN
Page 19

1
1.5 Light Source and Optical Power Meters (Options)
2 You can select the modulation frequency of the incident rays from a list of presets. You can also select CW
(continuous).
3 You can make the displayed measured value the reference and display subsequent measured values as
relative values.
4 You can adjust the internal deviation of the optical power measurement section and obtain more accurate
absolute optical power values.
5 You can display averaged measured values.
6 You can display the maximum and minimum measured values.
7 You can interlock the light source and optical power meter settings when you connect an optical fiber
between the light source port of an AQ1200 and the optical power measurement port of another AQ1200.
8 You can add a specified value (the offset value) to measured optical power values.
9 You can set upper and lower threshold values and determine whether or not the measured values fall within
them.
10 You can measure the optical power of an upstream signal from the ONU (optical network unit: the user’s
optical terminal) to the OLT (optical line termination: the telephone exchange’s optical terminal). The optical
power of the 1310 nm (data wavelength) signal is measured.
11 You can measure the optical power of downstream signals from the OLT to the ONU. The optical power of
the 1490 nm (data wavelength) and 1550 nm (video wavelength) signals is measured.
Logging
You can measure short-term optical power stability. The optical power value during logging can be
displayed on a graph, and you can calculate the maximum, minimum, and average. In addition, you
can use cursors to calculate the optical power at a specified location or the maximum, minimum, and
average within a specified area. The logging results can be saved to a file in CSV format.
Features
IM AQ1200-01EN
1-13
Page 20
1.6 Loss Test (Option)
Light source (AQ1200)
Light source
port
Optical power meter (AQ1200)
Optical power
measurement
port
Fiber under
loss test
Light source and optical power meter
(AQ1200)
Light source
port
Optical power
measurement
port
Fiber under
loss test
You can easily measure optical fiber and optical line degradation. This feature is available on models
with the /SLT or /HLT option.
Auto Loss Test (Using one AQ1200 as the light source and another
as the optical power meter)
Using the AQ1200 as a light source and optical power meter, you can easily measure optical fiber and
line degradation. You can also use the AQ1100 multi-field tester series instead of the AQ1200 as the
light source or optical power meter.
Light Source
You can set up to two measurement light wavelengths and produce them in order. You can produce
a constant level of light if you use the optical power adjustment feature.
Optical Power Meter
The AQ1200 automatically identifies the measurement light from the AQ1200 that it is connected to
and measures the optical power.
• The following items can be specified or executed. For details about these items, see section 1.5.
The unit, reference, offset, and threshold values can be specif
The zero set and measured value display hold operations can be executed.
• You can attach
* Because the AQ1200 is capable of identifying optical fiber and line cores, it is possible to number cores
and tapes.
fiber information to the measured values and save them.
ied.
*
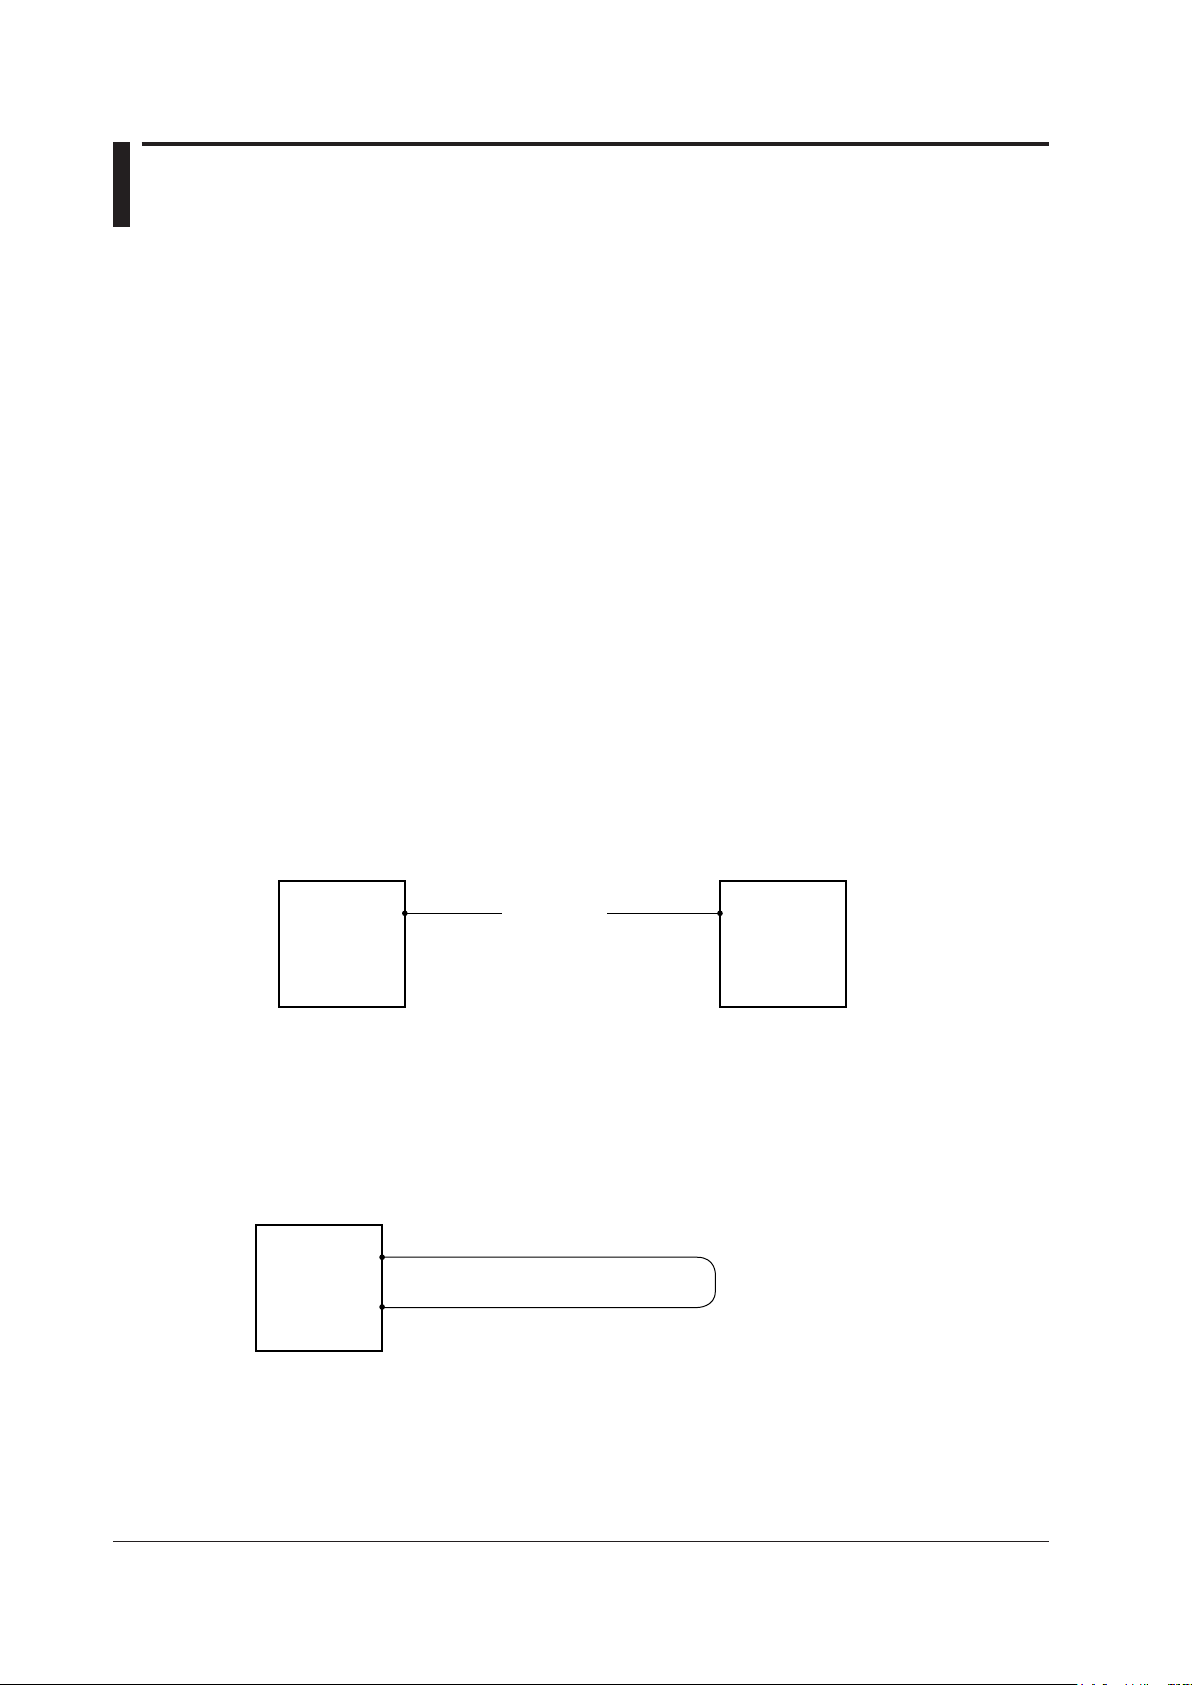
Loop-Back Loss Test (Using one AQ1200)
You can use the light source and optical power meter features on a single AQ1200 to perform a loopback loss test on an optical fiber or line. To perform loss testing, connect one end of the fiber that
you want to perform loss testing on to the AQ1200 light source port, and connect the other end to the
optical power measurement port of the same AQ1200.
1-14
IM AQ1200-01EN
Page 21
1
1.7 Multi-Core Loss Test (Option)
Master (AQ1200)
Light source port
(optical port 2)
Optical power
measurement port
Slave (AQ1200)
Light source port
Optical power
measurement port
(optical port 1)
Fiber under
loss test
Communication fiber
You can efficiently measure multi-core optical fiber and optical line degradation. This feature is
available on models with the /SLT or /HLT option.
Master and Slave
Connect two AQ1200s and specify the optical power meter as the master and the light source as the
slave. You can also use the AQ1100 multi-field tester series instead of the AQ1200 as the master or
slave.
Specifying the Optical Communication Fiber
To transfer, between the master and slave, project setup information and information about the fiber
under loss test, you must specify a fiber from the multi-core optical fiber to use for communication.
Connect one end of the optical communication fiber to the master’s light source port (optical port 2),
and connect the other end to the slave’s optical power measurement port (optical port 1).
Information That Is Transferred from Master to Slave
The following information can be transferred through the optical communication fiber from the
master to the slave.
• Project information (see below for further details)
• Loss test results
* Each time that the selected fiber’s loss test finishes, that fiber’s loss test result is automatically transferred.
*
Features
IM AQ1200-01EN
Connecting the Optical Fiber under Loss Test
All fibers other than the optical communication fiber can be tested. For each optical fiber under
loss test, connect one end to the master’s optical power measurement port, and connect the other
end to the slave’s light source port. The core and tape numbers of the fibers under loss test are
transferred from the master to the slave.
Executing a Loss Test
Transmit light from the slave. The master will automatically identify different wavelengths in the light
from the slave and measure the optical power. Continue the loss test, switching the cores between the
master and the slave in order.
Projects
You can create projects with the master. You can specify the following project information:
The project name, the number of the core to start loss testing at, the tape number type, the number
of cores, and the transmitted or measured measurement light wavelengths (up to 2).
• You can transfer projects from the master to the slave and share information.
When the master and the slave share a project and use that project to perform loss testing, if testing
•
is stopped, the data up to the stop point is saved and you can begin testing again from the next
core.
•
You can save and load projects as CSV files.
1-15
Page 22
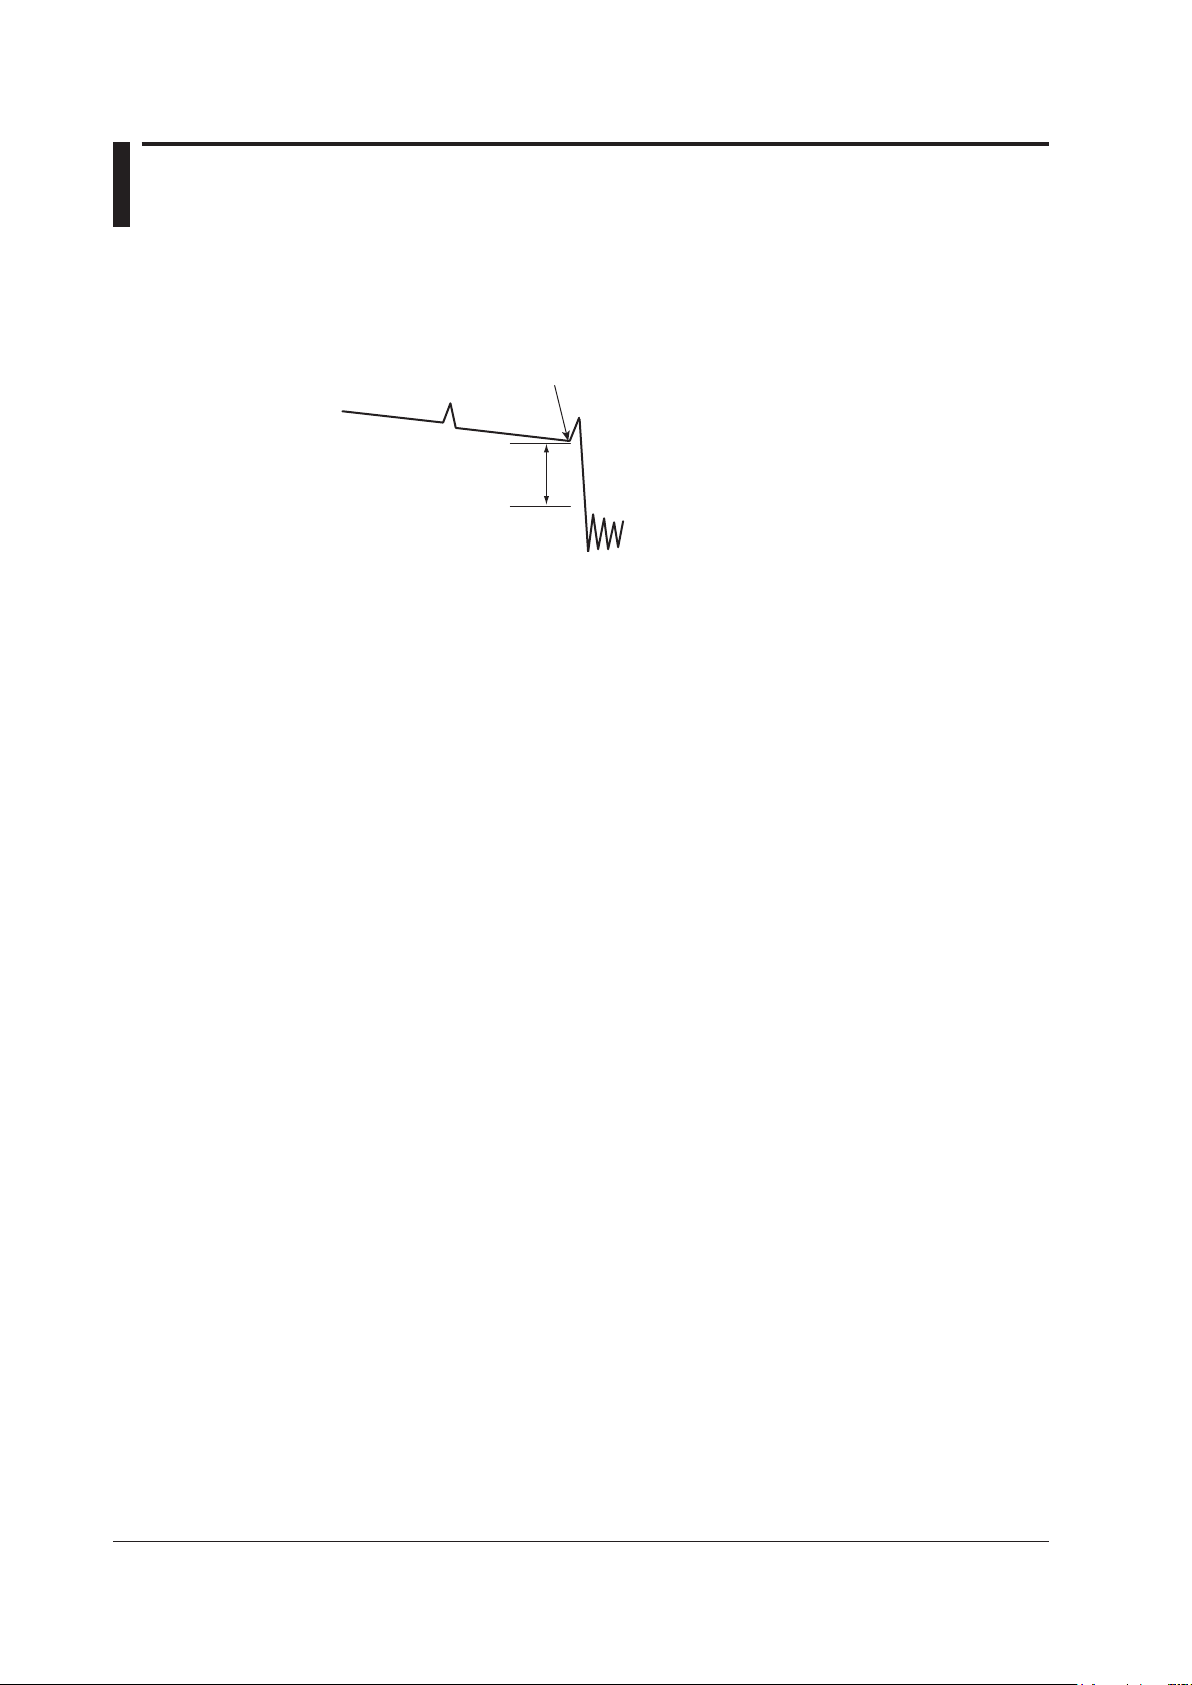
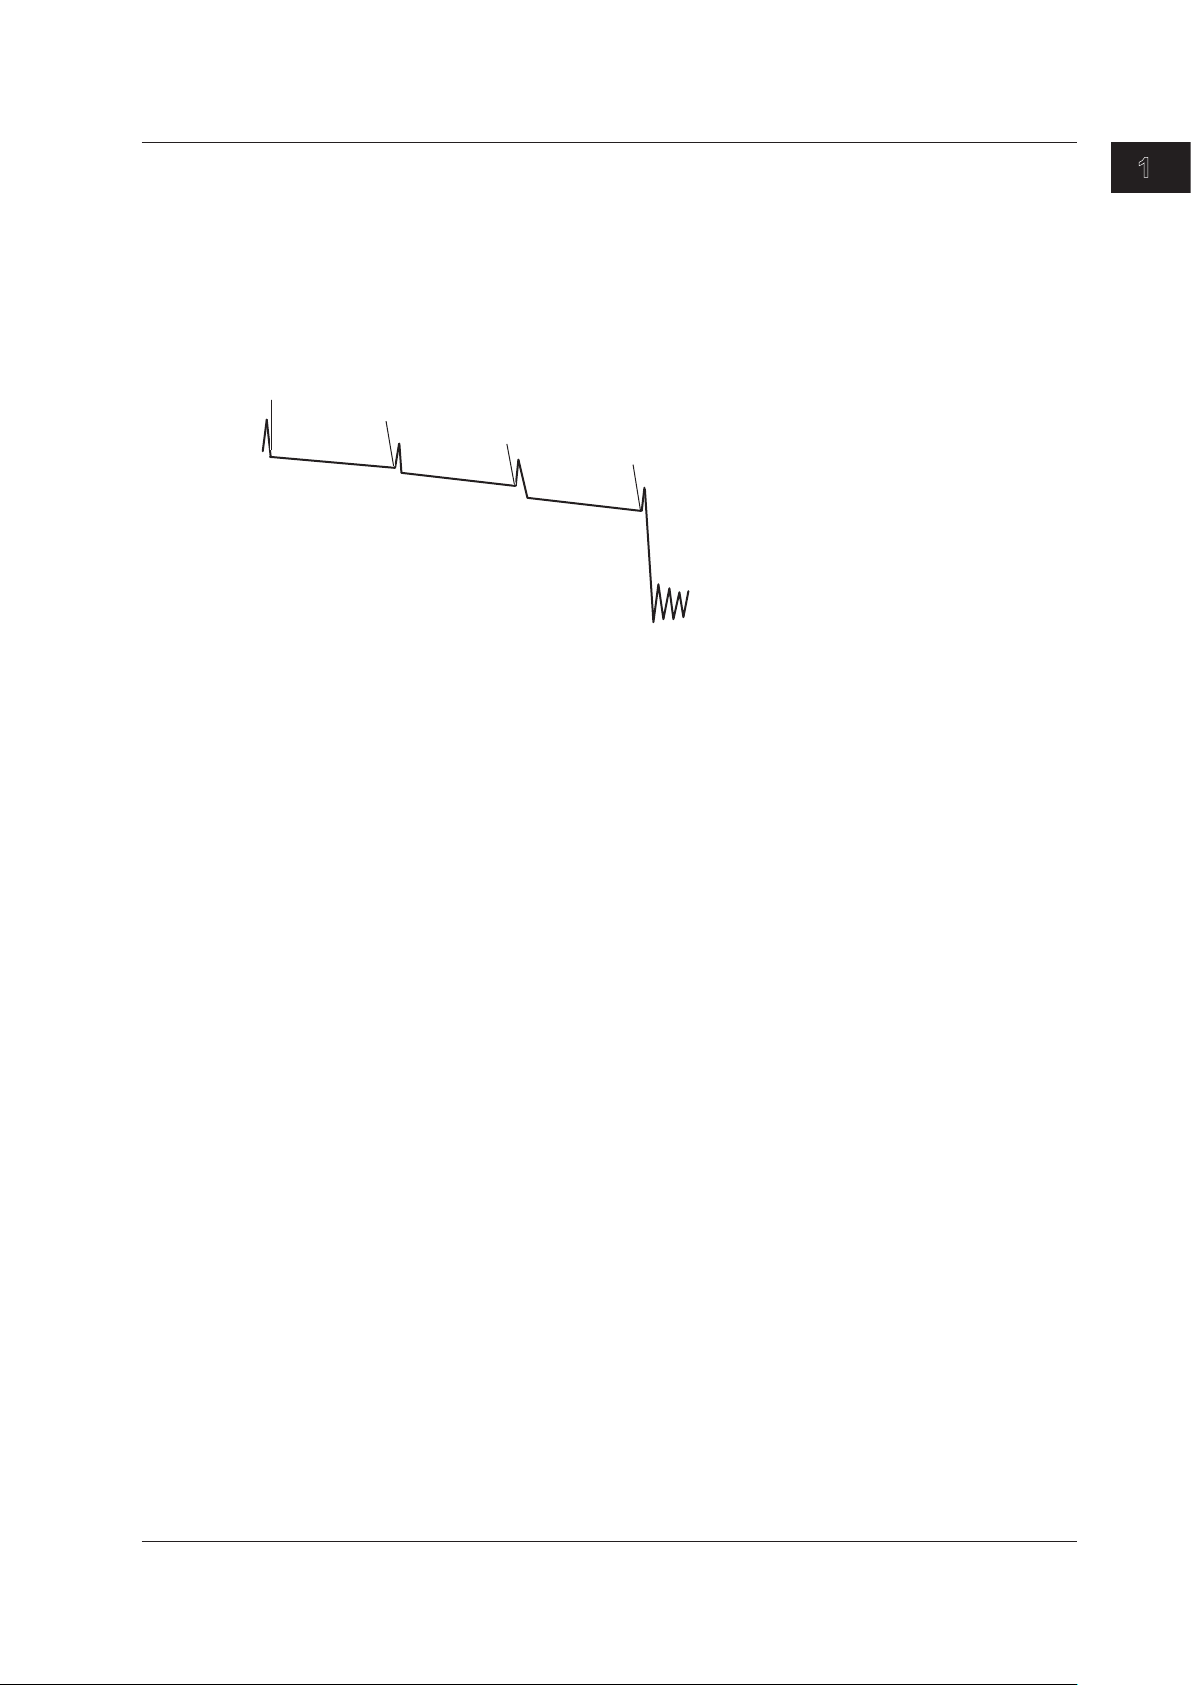
1.8 Fault Locator
Loss level that is used to determine
whether this is the fiber end face or not
Break (fault)
This feature enables you to search for breaks (faults) in an optical fiber or line. If there are no faults in
the middle of a fiber, the fiber end face is detected as a fault. You can specify the wavelength and the
loss level that is used to determine if a fault is a fiber end face or not when the AQ1200 searches for
faults. You can also zoom the display scale of the measured waveform and move the display position.
You can make measurements on the selected route.
The following five routes are available.
• Normal
Searches for faults in the fiber that connects the OLT
• OLT -> Splitter
Searches the route from the OLT to the splitter
• OLT -> Splitter -> ONU
Searches the routes from the OLT through the splitter to each ONU
• ONU -> Splitter
Searches the route from an ONU to the splitter
• ONU -> Splitter -> OLT
Searches the route from an ONU through the splitter to the OLT
1
and ONU
2
1 OLT (optical line termination): the telephone exchange’s optical terminal
2 ONU (optical network unit): the user’s optical terminal
1-16
IM AQ1200-01EN
Page 23
1
1.9 Checking Fiber End Faces
You can use a fiber inspection probe* to take a photograph that shows the state of a fiber end face.
You can display this photograph on the AQ1200 screen and save it.
* For information about compatible fiber inspection probes, contact your nearest YOKOGAWA dealer.
Features
IM AQ1200-01EN
1-17
Page 24

1.10 IP Test (Option)
You can check whether or not the network layer of an Ethernet LAN line is established. Before
performing an IP test, make sure that the optical fiber or line is connected physically.
IP testing is available on models with the /LAN option.
Ping Test
To ping an address (perform a simple IP test), specify the address and configure the Tx frame settings
listed below. The results of pinging the address appear on the screen.
The frame length, Tx mode (continuation, number of frames to send, and transmission time), and
measurement interval
1-18
IM AQ1200-01EN
Page 25

1
1.11 Multi-Core Fiber Measurement
Multi-core fiber measurement takes time and effort. This feature makes it possible to efficiently
measure multi-core fibers through a dedicated menu.
Projects
Items that you need to specify in order to make multi-core measurements such as measurement
conditions, analysis conditions, and core information are managed in projects.
By creating a project before a measurement, you can measure cores under the same conditions.
You can save projects to files. You can load a previously saved project and make measurements under
the same conditions.
List
Cores are listed. You can easily distinguish between cores that have been measured, cores that have
not been measured, and cores that do not to be measured. This list prevents you from forgetting
measurements and from making unnecessary measurements. (You can make measurements
efficiently.)
Measurement Result Storage
Measurement results of each core are automatically saved to a folder that is automatically created in
the folder that the project file is saved in. The folder will have the same name as the project file.
Features
IM AQ1200-01EN
1-19
Page 26
1.12 Event Mapper
Near-end
reflection
Splice loss
Reflection caused
by a connector
Loss caused
by bending
Reflection at the open end
of the fiber (Fresnel reflection)
Reflection caused
by a splitter
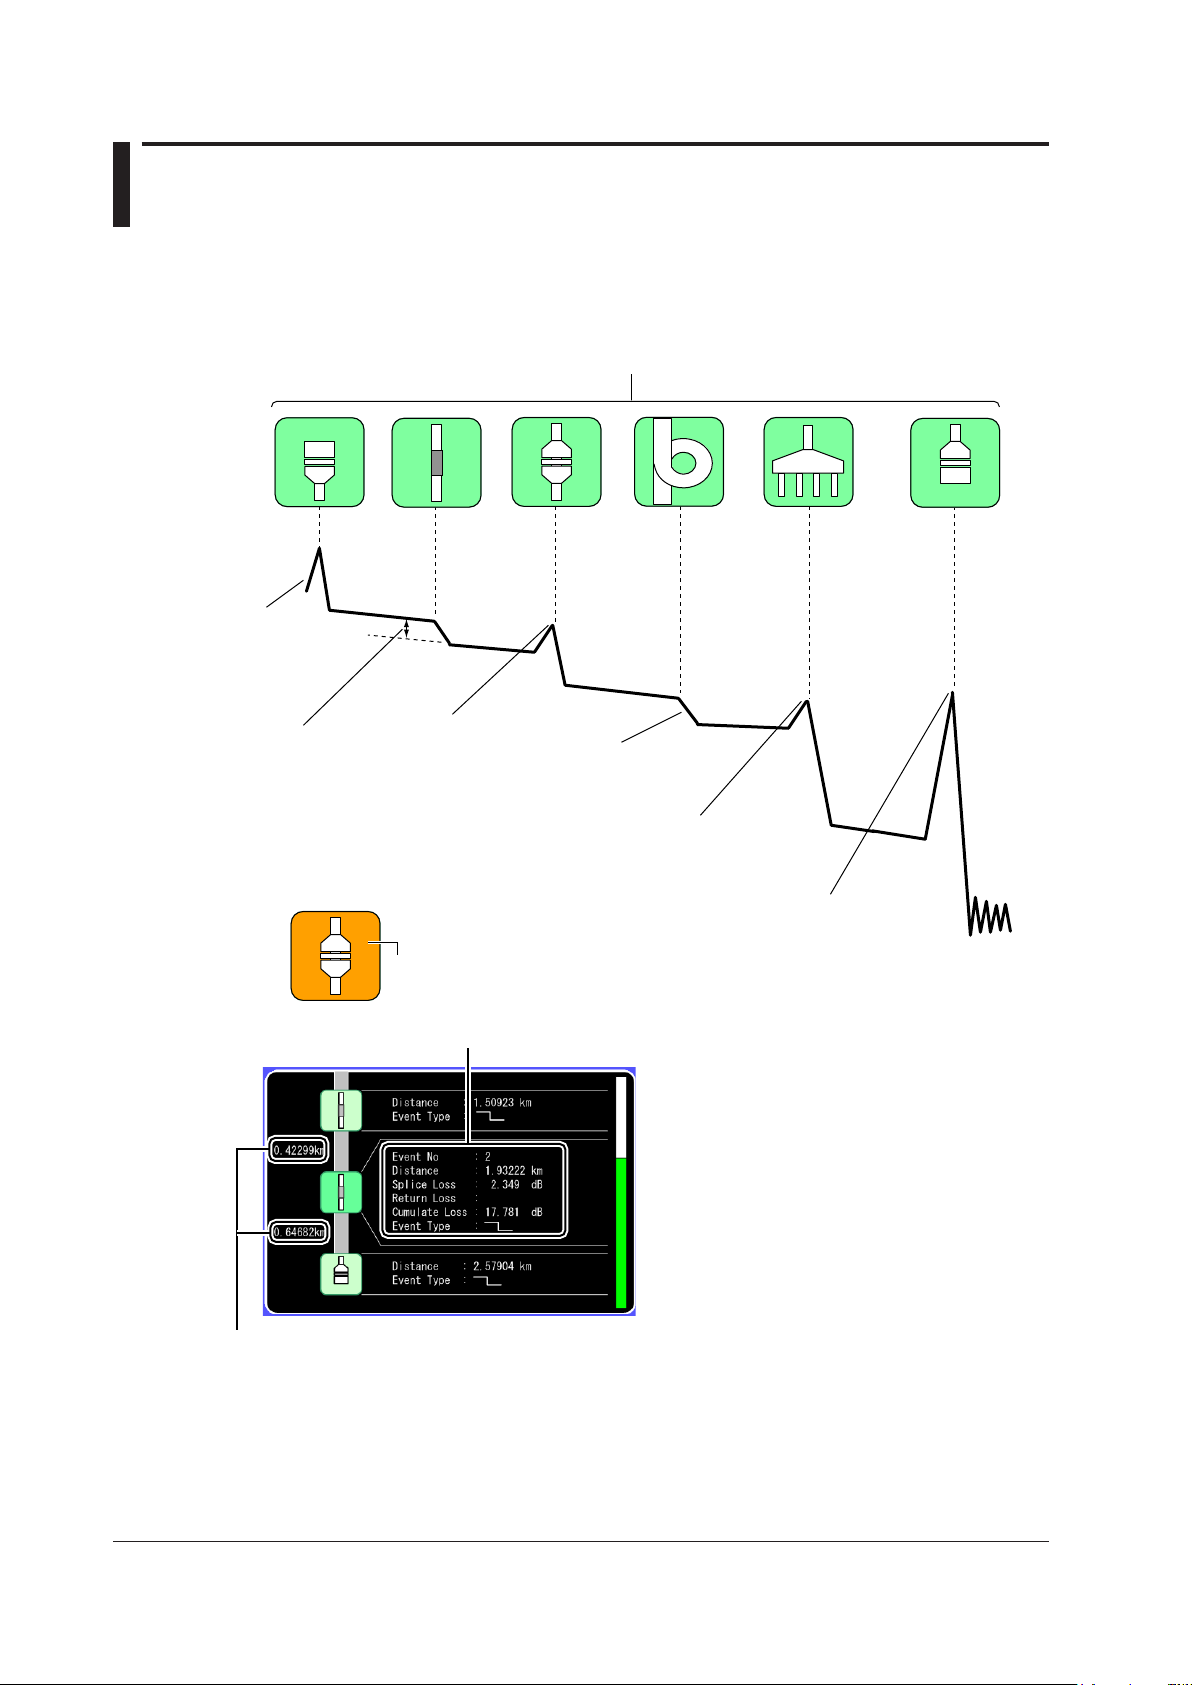
Each event is displayed as an icon. You can also switch to the waveform display using soft keys.
If an event is determined to be a fault event,
the icon background is displayed in orange.
Detailed analysis results of the selected icon (event)
Distance between events
You can display measured result events as icons on the screen. Detailed event analysis results are
displayed along with the displayed icons. In addition, if fault events (see section 3.6) are specified,
icons are displayed in different colors depending on the results of pass/fail judgments.
1-20
IM AQ1200-01EN
Page 27

1
1.13 Other Features
The AQ1200 also has the following features.
• Data saving and loading
• Language selection
• Beep on/off
• Startup menu selection
• USB function selection (storage/communication)
• Screen color selection
• Current date and time configuration (see the operation guide, IM AQ1200-02EN)
• Power save settings
• Network settings (on models with the /LAN option)
• Setup information initialization (to the factory default values)
• AQ1200 information display (model, serial no., suffix code, version, etc.)
• Self test execution
• Firmware version updating
Features
IM AQ1200-01EN
1-21
Page 28
2
1
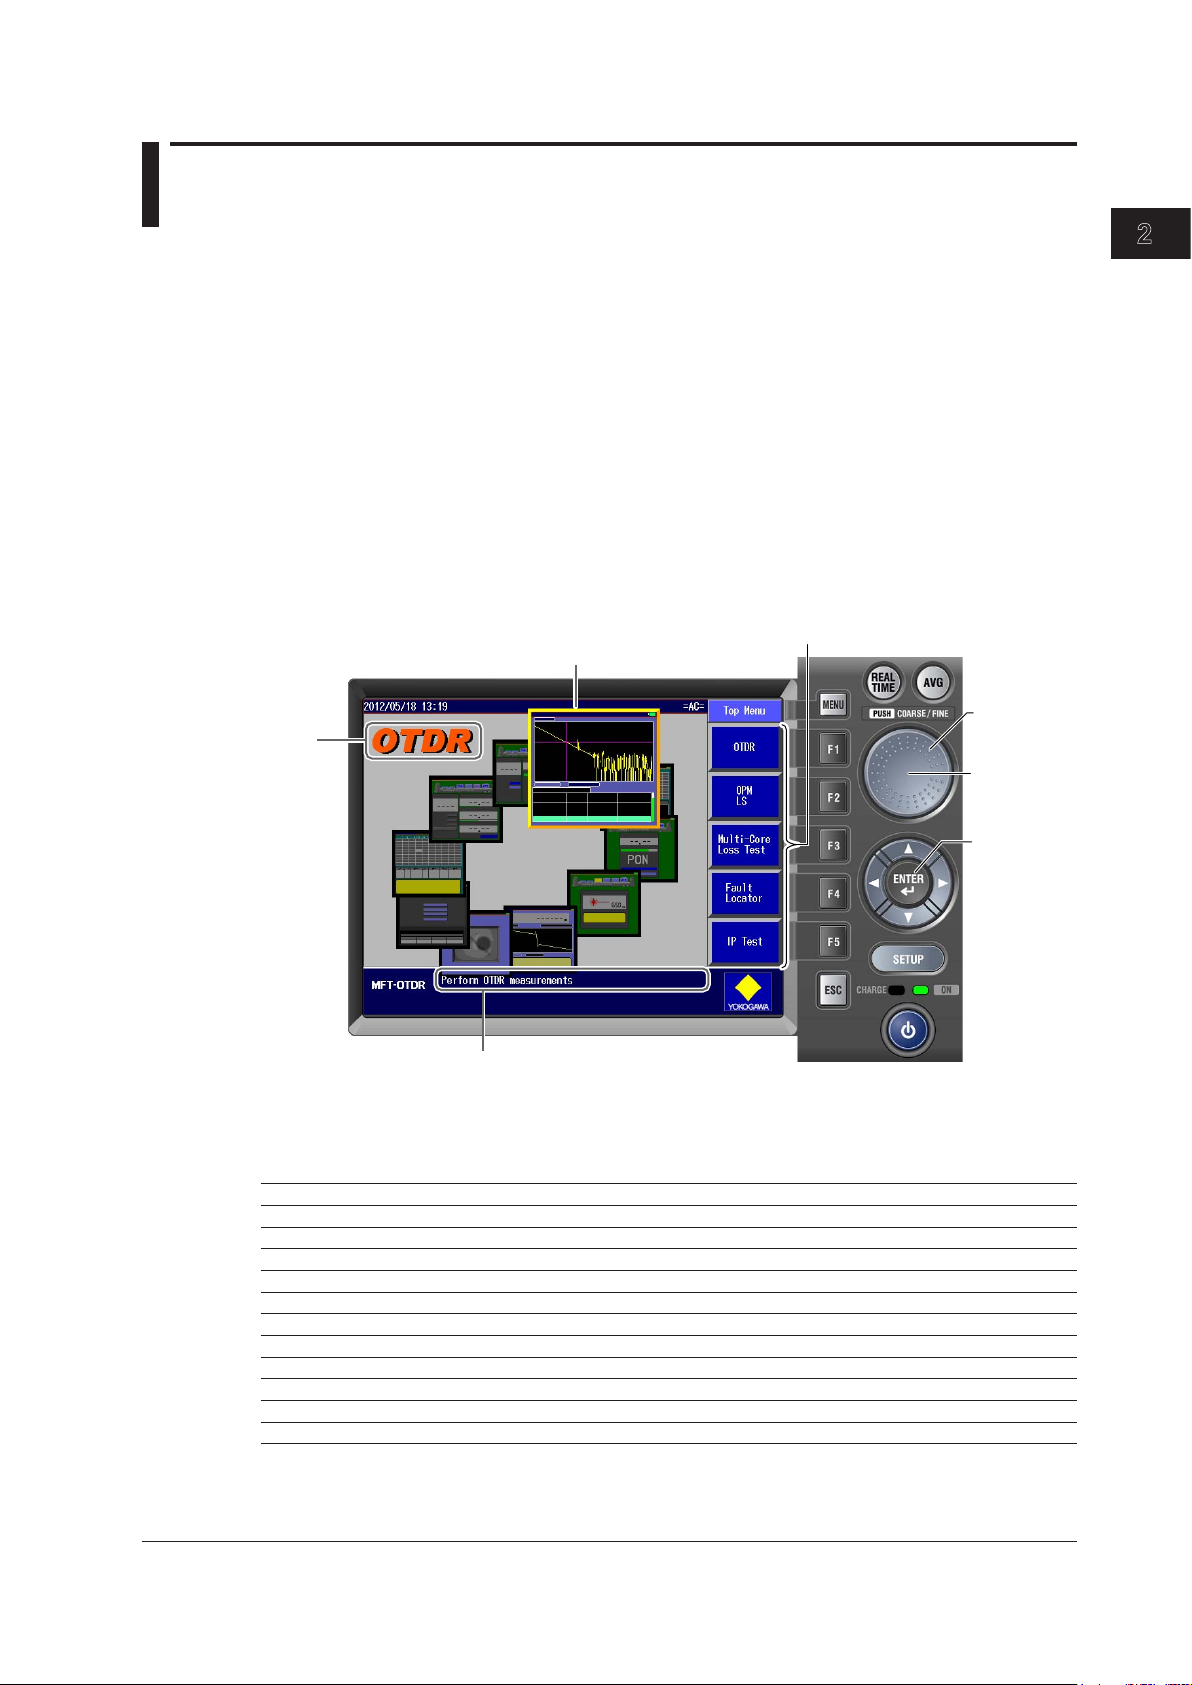
Displays a term that
represents the selected
feature
• OTDR
• LS_OPM
• Auto Loss Test
• Multi-Core Loss Test
• IP Test
•
Fiber Inspection Probe
• Fault Locator
• Visible Light Source
• PON_OPM
• Multi-Core Fiber Meas
• OTDR Event Mapper
Top Menu
Displays an image that shows
the selected feature
Rotary knob
ENTER key
The center
of the rotary
knob
Displays an explanation of the selected feature
Chapter 2 Common Operations
2.1 Top Screen
When you turn the AQ1200 on and it starts, the top screen appears. First select a feature from this top
screen, and then configure the feature or carry out the measurement that corresponds to the feature
you have selected.
Turn on the AQ1200.
1.
Use the rotary knob to select the feature.
2.
An image that shows the selected feature is displayed, and the feature name is displayed in the upper left
of the screen.
Press the center of the rotary knob or ENTER to confirm your selection.
3.
The setup or measurement operation menu for the selected feature is displayed.
In this manual, steps 2 and 3 above are described as shown below.
Example: To select the OTDR feature and confirm it:
“Using the
rotary knob and ENTER, select OTDR.”
Common Operations
IM AQ1200-01EN
Procedural Explanations of Features
For explanations of the procedures to perform after you have selected and confirmed a feature, see
the chapters or sections that are listed in the following table.
Function Reference
OTDR (optical pulse measurement) Chapters 3 to 7
LS_OPM (power meter and light source) Chapters 8 and 9
Auto loss test (auto loss test and loopback loss test) Chapter 11
Multi-core loss test Chapter 12
IP test Chapter 15
Fiber inspection probe (fiber end face check) Chapter 14
Fault locator Chapter 13
Visible light source Section 8.2
PON_OPM (PON power meter)
Multi-Core Fiber Meas (multi-core fiber measurement)
OTDR Event Mapper
1
3
1 AQ1200 firmware versions 1.10 and later support this feature.
2 AQ1200 firmware versions 2.01 and later support this feature.
3 AQ1200 firmware versions 2.03 and later support this feature.
2
Chapter 10
Chapter 16
Chapter 17
2-1
Page 29
• OTDR Top Menu (during real-time measurement)
When not
measuring
During real-time
measurement
After real-time
measurement
Attenuation
command
Waveform
Analysis
Command
Measurement
Condition
Command
Waveform
Analysis
Command
2.1 Top Screen
Top Menu
• You can also use the soft keys (F1 to F5) on the right side of the top menu to select a feature and
display its setup or measurement operation menu.
• The feature that you have used the rotary knob and ENTER to select is displayed in the top position
(soft key F1) of the top menu.
• If you use the rotary knob and ENTER to select a feature that is already displayed in the top menu,
the feature will move to the top position of the top menu. If you press a soft key (F1 to F5), the
feature that you have selected will also be moved to the top position.
• Up to five features can be displayed. When you exceed this number, the feature that was displayed
in the position by soft key F5 is deleted from the top menu.
• You can configure the top menu that is displayed when the AQ1200 starts. For details, see section
19.1.
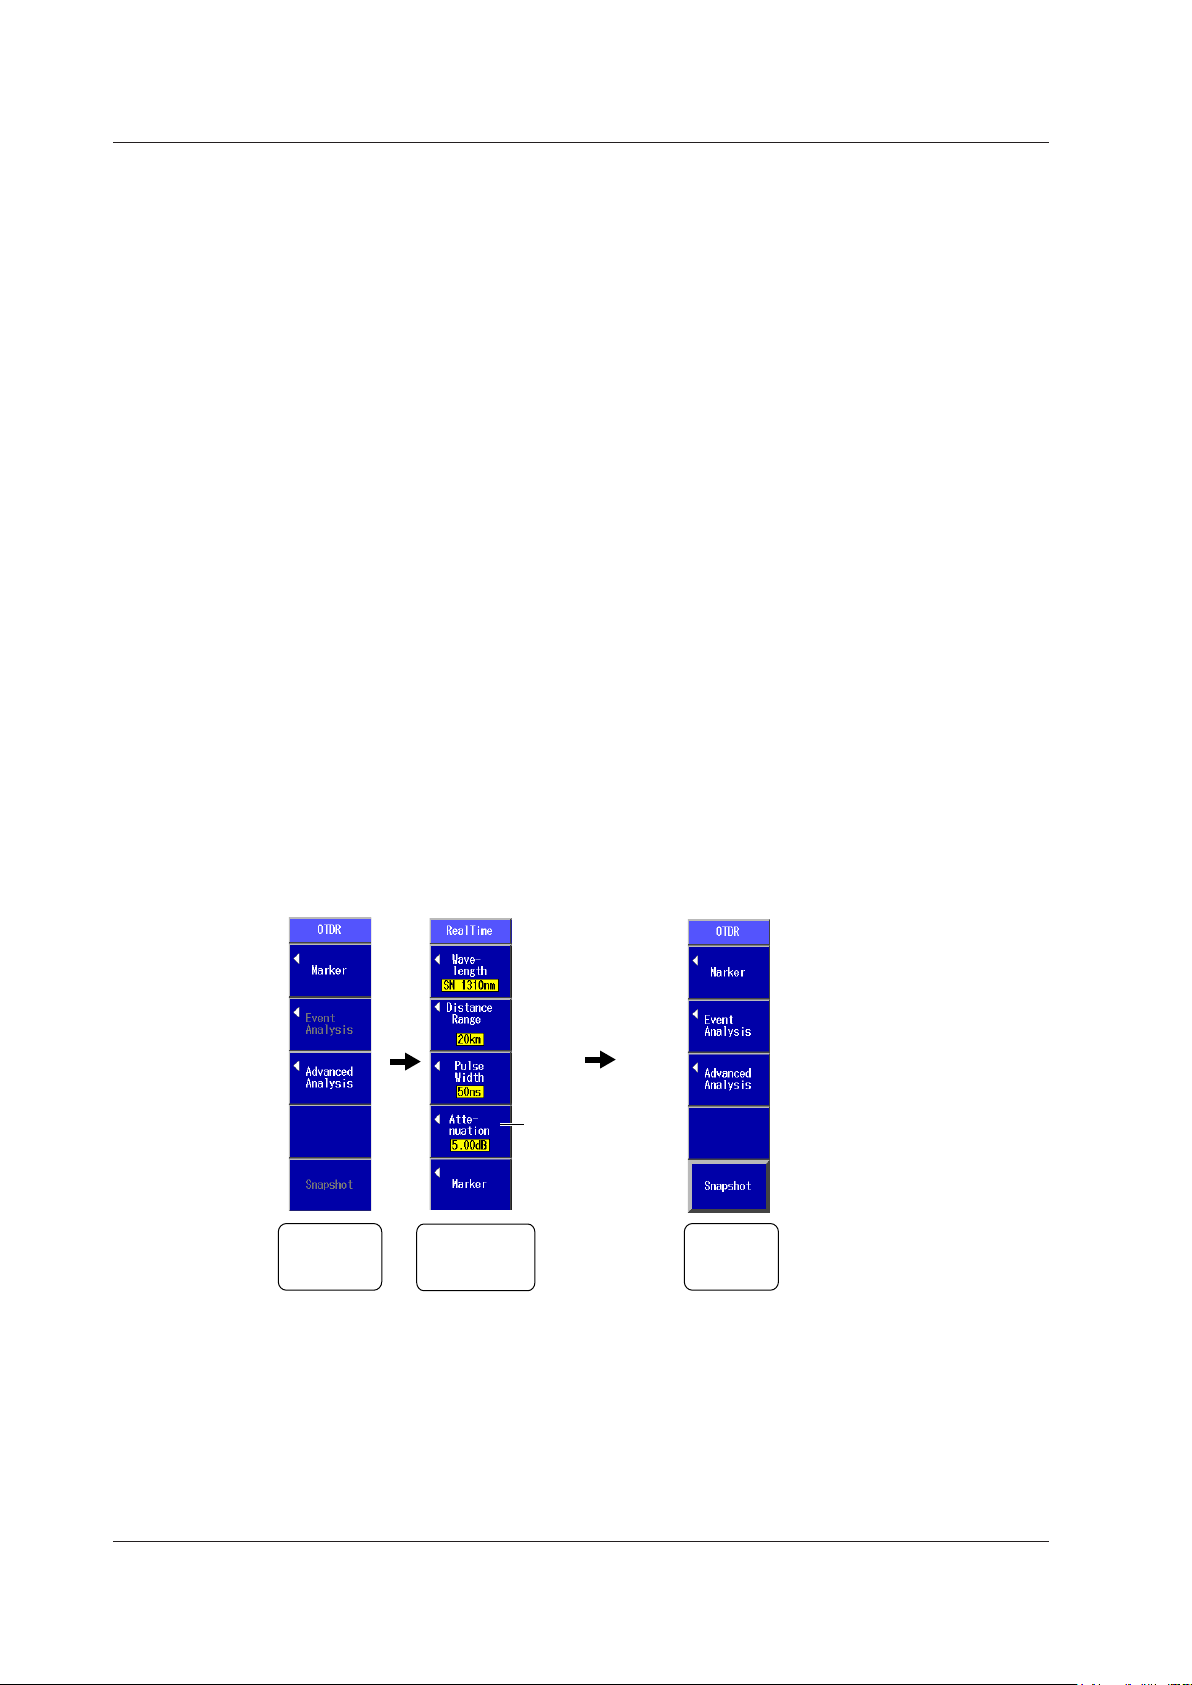
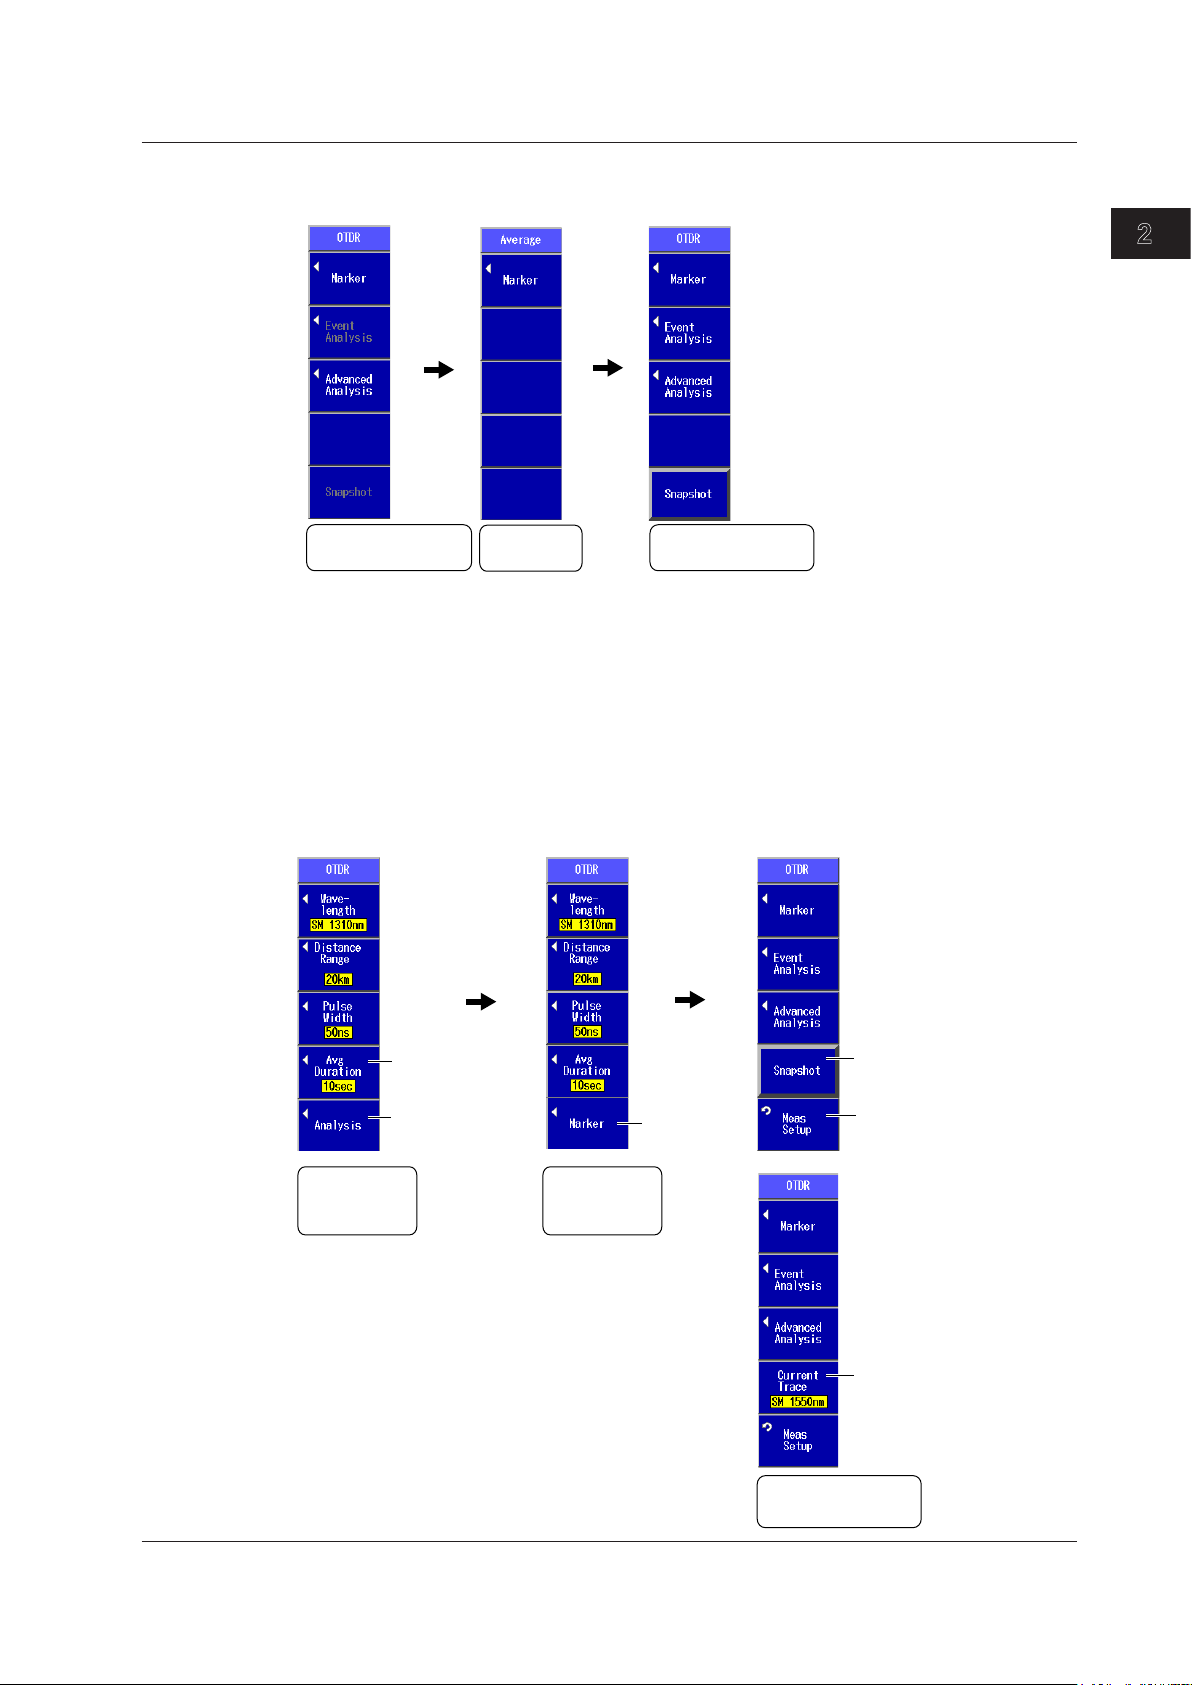
OTDR Top Menu
If you select the OTDR feature from the top menu, the OTDR menu (OTDR top menu) will appear.
On AQ1200s with firmware version 2.03 and later, the OTDR top menu varies depending on the suffix
code.
If the Suffix Code Is Not -HE (-HJ for example)
The OTDR top menu is the same as that of the previous version.
• The OTDR top menu will contain waveform analysis commands.
• During real-time measurement, marker and measurement condition commands appear.
The F4 soft key will show the attenuation command.
• When real-time measurement finishes, the menu will return to displaying waveform analysis
commands.
• During averaged measurement, the marker command appears.
• When averaged measurement finishes, the menu will return to displaying waveform analysis
commands.
2-2
IM AQ1200-01EN
Page 30
2
1
Waveform Analysis
Command
Marker
Command
Waveform Analysis
Command
• OTDR Top Menu (during averaged measurement)
When not
measuring
During averaged
measurement
After averaged
measurement
[Detail mode]
• OTDR Top Menu (during real-time measurement)
When not
measuring
During real-time
measurement
After real-time
measurement
Average duration
command
(see section 3.5)
Switches to
waveform analysis
commands
Marker
command
Displays/clears
snapshot waveforms
Switches to measurement
condition setting commands
Multi WL mode
Switches the
displayed waveform
Measurement
Condition
Command
Measurement
Condition
Command
Waveform Analysis
Command
2.1 Top Screen
Common Operations
If the Suffix Code Is -HE
• The OTDR top menu will contain measurement condition setting commands.
The F4 soft key will show the average duration command.
The F5 soft key will show a command for switching to waveform analysis commands.
• During real-time measurement, measurement condition setting commands appear.
• When real-time measurement finishes, the menu will change to displaying waveform analysis
commands.
IM AQ1200-01EN
2-3
Page 31
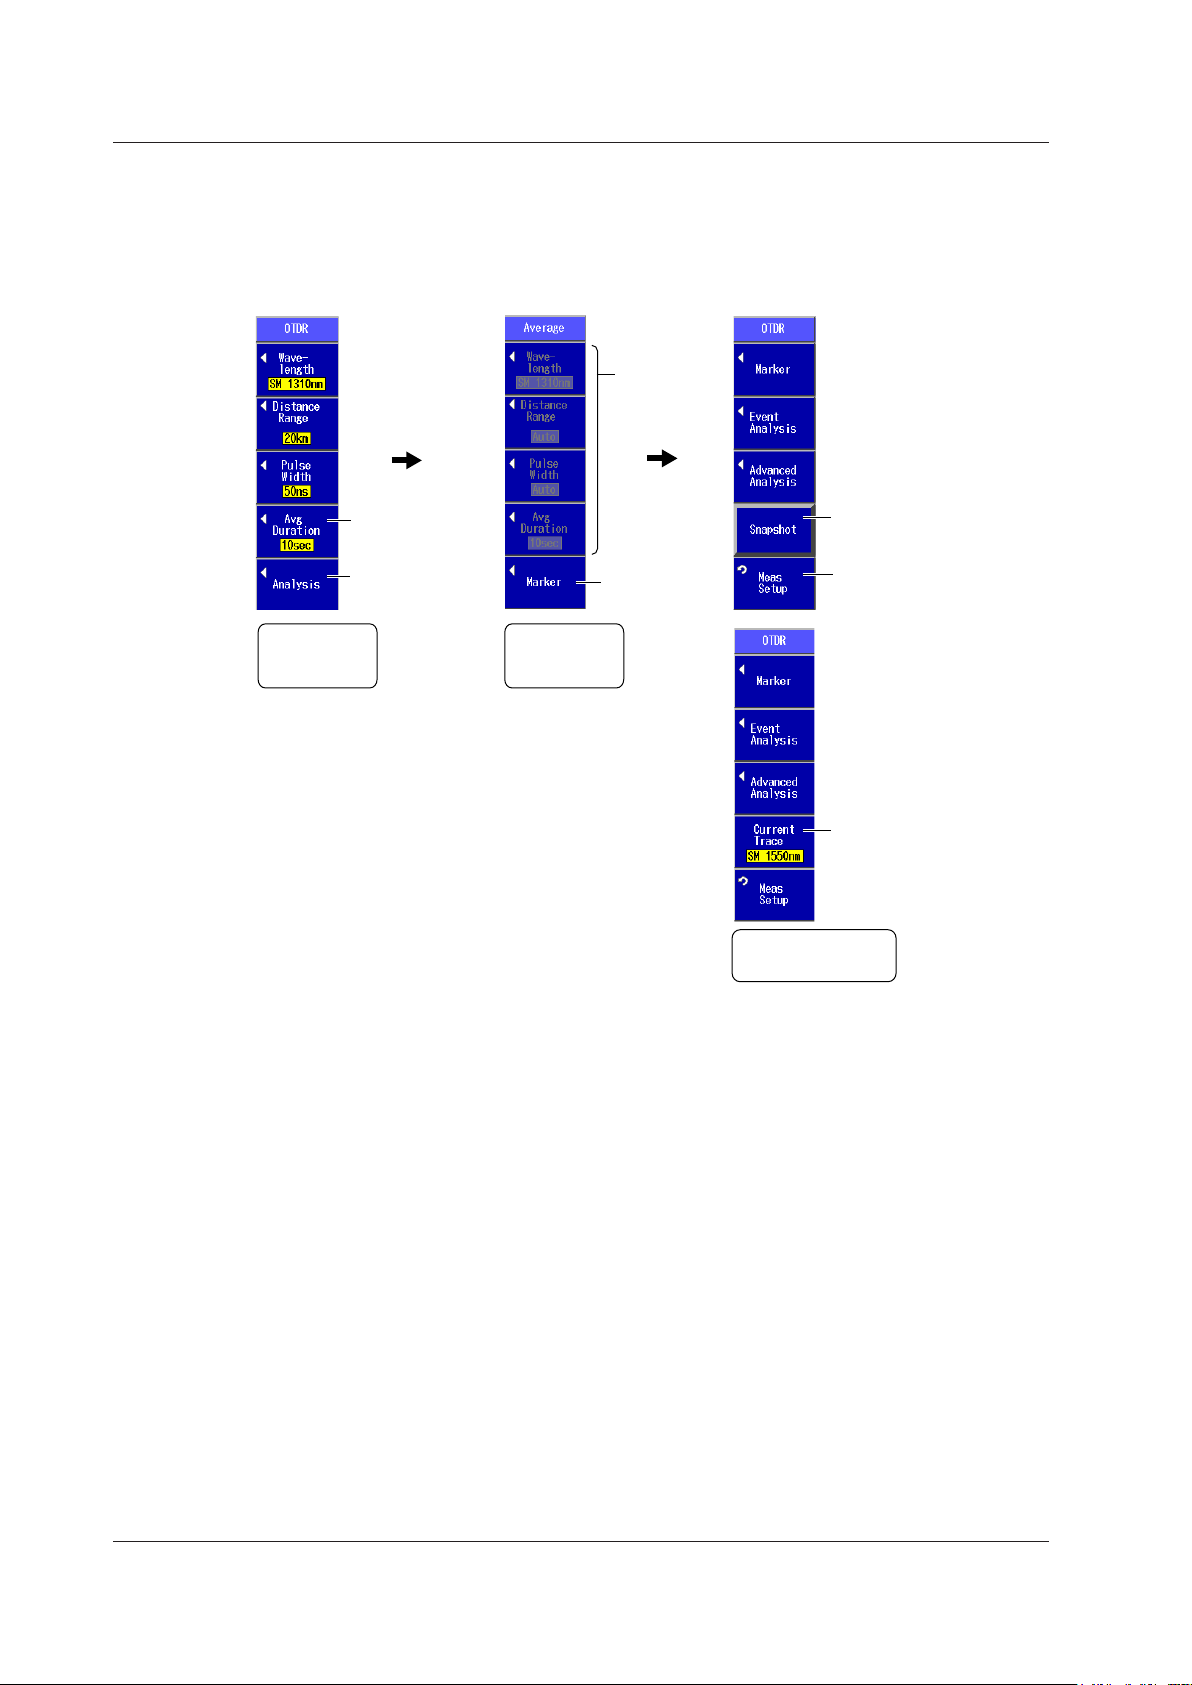
Detail mode
• OTDR Top Menu (during averaged measurement)
When not
measuring
During averaged
measurement
After averaged
measurement
Average duration
command
(see section 3.5)
Switches to
waveform analysis
commands
Marker
command
Displays/clears
snapshot waveforms
Switches to
measurement condition
setting commands
Multi WL mode
Switches the
displayed waveform
Measurement
Condition
Command
Measurement
Condition
Command
Waveform Analysis
Command
During
measurement,
the operation
can not be
perform.
2.1 Top Screen
• During averaged measurement, marker and measurement condition commands (cannot be used
during measurement) appear.
• When averaged measurement finishes, the menu will display waveform analysis commands.
2-4
IM AQ1200-01EN
Page 32

2
1
2.2 Key, Rotary Knob, and Arrow Key Operations
Below are the different types of menu
operations that you may encounter.
When you press a soft key,
the selected setting switches. The setting
changes each time you press the soft key.
a selection menu appears.
When you press a soft key that corresponds
to an option, the selected item is confirmed,
or the selected operation is executed.
the selected item is confirmed, or the
operation is executed.
Soft keys
MENU
MENU
ESC ESC
The settings that the soft keys are used to
configure and the actions that pressing them
cause are explained.
Options and ranges are listed afterwards.
Set the start point.
Set the start point marker to the cursor position.
Set the end point.
Set the end point marker to the cursor position.
Specify from markers.
When the and markers or the n and E
markers are already present, change these
markers to the start point and end point markers.
1 2
Press to configure more settings.
Change the reference point, or delete all the
specified markers from the displayed menu.
Set the approximation method (LSA, TPA).
Key Operations
Key operations are explained below using an example. Here we will examine the steps you would take
to select the section analysis menu from the top screen.
Use the rotary knob and ENTER to select OTDR. Or, press the OTDR soft key on the top
1.
menu.
The OTDR menu appears.
Press the Advanced Analysis soft key.
2.
The waveform analysis menu appears.
Press the Section Analysis soft key.
3.
The section analysis menu appears.
Common Operations
In this manual, the above key operation is described as shown below.
Example of an Explanation in This Manual
Use the rotary knob and ENTER to select OTDR.
1.
Press the Advanced Analysis soft key.
2.
Press the Section Analysis soft key. The following screen appears.
3.
Or
Press the
menu appears.
IM AQ1200-01EN
OTDR soft key > Advanced Analysis soft key > Section Analysis soft key. The following
2-5
Page 33

2.2 Key, Rotary Knob, and Arrow Key Operations
This manual explains procedures in accordance with the following guidelines.
• The following types of procedures are simplified.
- Repetitive operations.
- Detailed operations for proceeding to the desired setup menu or dialog box and information
about the accompanying screen changes.
• Step numbers are used in soft key explanations when there are many operations and when
operations must be performed in different menus.
The explanation for returning to the previous menu is omitted.
•
2-6
IM AQ1200-01EN
Page 34

2
1
To return to the top menu, press .
The item at the cursor location is highlighted.
Below are the different types of setup operations that you may encounter.
Pressing ENTER display a menu.
Each time you press ENTER, the selected setting switches.
Pressing ENTER displays a text box.
Pressing ENTER confirms the selected item or executes its corresponding
action.
• Using the rotary knob or the up and down arrow
keys, move the cursor to the item you want to select.
• Press ENTER to confirm the selected item.
• To reset the selected item to its previous setting, press
ESC.
• To increase or decrease a value, use the rotary
knob or the up and down arrow keys.
To move between digits, use the left and right
arrow keys.
• Press ENTER to confirm the entered value.
• To reset the selected item to its previous setting,
press ESC.
MENU
Performs zero set
Set the wavelength mode (Simple, Detail, CWDM).
Set the average count (1, 10, 50, 100).
Turns the display of the max/min value menu on and
off
Turns the interlocking of the light source and optical
power meter settings on and off
Set the offset (–9.900 to 9.900 dB).
Set the upper threshold value (–80.00 to 40.00 dB).
Set the lower threshold value (–80.00 to 40.00 dB).
The settings that the items are used to configure and the
actions that selecting them cause are explained.
Options and ranges are listed afterwards.
2.2 Key, Rotary Knob, and Arrow Key Operations
Rotary Knob and Arrow Key Operations
We will use the dialog box that appears when you press the OPM Setup soft key as an example to
explain the rotary knob and arrow key operations.
Press the OPN Setup soft key.
1.
The OPN Setup dialog box appears.
Use the rotary knob or the arrow keys to move the cursor to the item that you want to
2.
configure or execute.
The item at the cursor location is highlighted.
Press ENTER.
3.
Common Operations
In this manual, the above rotary and arrow key operations are described as shown below.
Example of an Explanation in This Manual
Press the OPN Setup soft key. The following screen appears.
This manual omits the following descriptions.
• How to operate the rotary knob, arrow key, and ENTER key
• How to reset the selected item to its previous setting
• How to return to the previous menu
IM AQ1200-01EN
2-7
Page 35

2.3 Shortcut Keys
Set the action that is executed when you press the
rotary knob.
(No action, file menu, print menu, scale menu, visible
light source menu, save, print, coarse/fine)
Set the action that is executed when you hold down
the SETUP key.
(No action, file menu, print menu, scale menu, visible
light source menu, save, print, coarse/fine, light
source menu)
Rotary knob indicator SETUP key indicator
An indicator that represents the action that has
been assigned to the SETUP key is displayed.
An indicator that represents the action that has
been assigned to the rotary knob is displayed.
If no action is assigned, nothing is displayed.
An indicator that represents
the setup status of the pulse
light output level is displayed.
An indicator that represents the setup
status of the marker approximation
method is displayed.
The AQ1200’s OTDR feature has a shortcut key feature. You can use the rotary knob and the SETUP
key as shortcut keys. You can assign actions to each shortcut key.
Using the rotary knob and ENTER, select OTDR.
1.
Press SETUP, the System Setup soft key, and then the OTDR soft key to display the following
2.
screen.
Note
• The shortcut feature is only enabled when you are operating the OTDR feature. Also, you can only make
shortcut assignments when you are using the OTDR feature.
• The shortcut feature does not function on the top screen.
• You can assign the same action to both the rotary knob and the SETUP key.
Status Indicators
The indicators that represent the following AQ1200 actions and statuses are displayed in the lowerright of the screen.
• The actions assigned to the rotary knob and the SETUP key
• Status of the pulse light output level
•
Status of the marker approximation method
2-8
IM AQ1200-01EN
Page 36
2
1
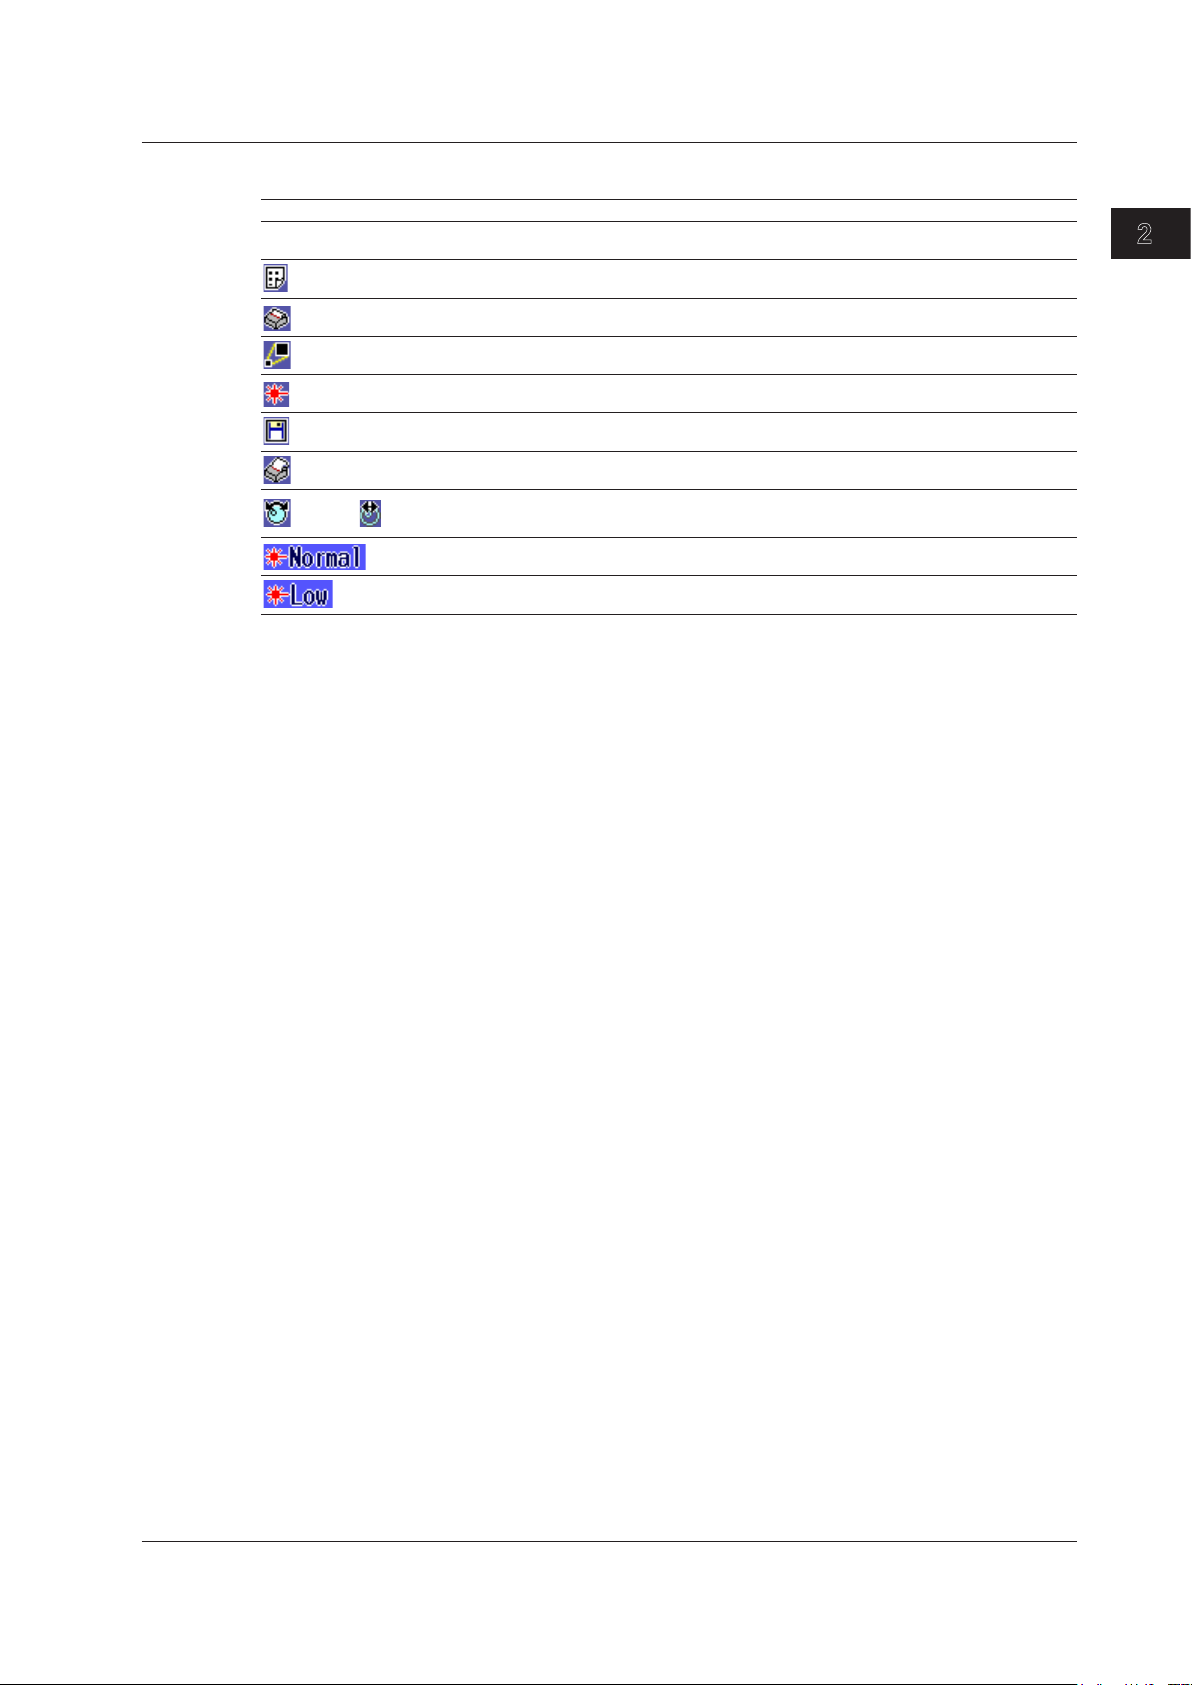
Meaning of the Status Indicators
Status Indicator Meaning
None No action assigned
Displays the file menu
Displays the print menu
Displays the scale menu
Displays the visible light source menu
Starts saving
Starts printing
Coarse / Fine
Switches the resolution between coarse and fine for the cursor movement that you control
by turning the rotary knob
Normal pulse light output level
Low pulse light output level
2.3 Shortcut Keys
Common Operations
IM AQ1200-01EN
2-9
Page 37

2.4 Entering Strings
Character input dialog box
Edit screen
Confirms
the input
SpaceSwitches between
uppercase and
lowercase letters
Keyboard
Input history
Strings that you have entered in the past remain in
the input history. You can enter these strings (see
the next page).
Moves the cursor to the left
Moves the cursor to the right
Deletes the previous character
Confirms the entered string
After you have selected a setup item and pressed ENTER, a character input dialog box will appear if it
is necessary. This section explains the operations that you can perform after the dialog box appears.
Entering Strings
Using the rotary knob and ENTER, enter a string. The string that you entered appears in the
1.
edit screen.
Press the various soft keys to edit the string as necessary.
2.
After you have finished entering and editing the string, press the OK soft key to confirm the
3.
string that you entered and close the character input dialog box. The string be applied to the
relevant item.
You can also confirm the string by moving the cursor to ENT on the displayed keyboard and then pressing
ENTER.
Note
• If there is a limit to the length of the string, you will not be able to enter characters after the limit is
reached.
• You can also enter strings using a USB keyboard.
2-10
IM AQ1200-01EN
Page 38

2
1
2.4 Entering Strings
Entering Strings from the History
Using the rotary knob and ENTER, select to display the input history screen.
1.
Using the rotary knob and ENTER, choose the string that you want to enter. The string
2.
appears in the edit screen.
Note
Entered strings are saved to the input history when you confirm them. Up to 50 strings can be saved. Newer
strings appear at the top of the input history.
Common Operations
IM AQ1200-01EN
2-11
Page 39

3
2
1
Set the measurement mode (Simple, Detail, Multi WL, PON).
The Multi WL option is not available on the AQ1200B
and AQ1200C.
Chapter 3
Optical Pulse Measurement and Analysis Conditions
3.1 Selecting the Measurement Mode
Procedure
Measurement Screen
Explanation
Simple Mode
In this mode, the absolute minimum amount of measurement conditions are set manually. You only
have to set the wavelength.
The following measurement conditions are set to the optimum values when measurement starts.
•
Distance range
• Pulse width
• Event search
The measurement conditions that are available when the
listed below. You can view these conditions in the measurement condition information (see section 5.1)
that is displayed on the screen.
Item Setup
Distance range Automatic
Pulse width Automatic
Attenuation Automatic
Duration to average over Automatic
Average method Hi-reflection
Average unit Time
Sample interval Standard
Using the rotary knob and ENTER, select OTDR.
1.
Press SETUP and then the Meas Setup soft key to display the following screen.
2.
AQ1200 is in Simple (Full Auto) mode are
Optical Pulse Measurement and Analysis Conditions
For the procedures to set the Simple mode measurement conditions, see sections 3.2 to 3.4.
Detail Mode
In this mode, all measurement conditions are set manually.
For the procedures to set the Detail mode measurement conditions, see sections 3.5 and 3.6.
Multi WL Mode
You can perform consecutive measurements over multiple wavelengths.
Depending on the AQ1200 model, the wavelengths that can be measured and the number of
waveforms that can be displayed vary.
For the procedures to set the Multi WL mode measurement conditions, see sections 3.5 and 3.6.
IM AQ1200-01EN
3-1
Page 40

Set the number of splitter stages (1, 2).
Image when the route is set to ONU -> OLT
Select the number of splits
from the following:
2, 4, 8, 16, 32, 64, 128
The maximum total number of
splits is 128.
Set the route (OLT -> ONU or ONU -> OLT).
The settings change to values
that are suitable for the
measurement of the specified
number of stages and splits.
You can also change the settings
according to your measurement
conditions.
3.1 Selecting the Measurement Mode
PON Mode
In PON mode, you can set the measurement route details such as the number of splitter splits and
measurement direction. In addition, an image of the specified route is displayed.
3-2
IM AQ1200-01EN
Page 41

3
2
1
3.2 Selecting the Wavelength
Set Mode to “Simple.”
Set the wavelength .
The available options vary depending on the model.
For details, see the explanation in section 3.5.
<Simple (Full Auto) Mode>
Procedure
Measurement Screen
Explanation
Selecting the Measurement Wavelength
For details, see “Explanation” in section 3.5.
Using the rotary knob and ENTER, select OTDR.
1.
Press SETUP and then the Meas Setup soft key.
2.
Using the rotary knob and ENTER, set Mode to Simple to display the following screen.
3.
Optical Pulse Measurement and Analysis Conditions
IM AQ1200-01EN
3-3
Page 42

3.3 Automatically Saving Measured Data
Turns automatic saving of the measured result on or off
Set Mode to “Simple.”
<Simple (Full Auto) Mode>
Procedure
Measurement Screen
Using the rotary knob and ENTER, select OTDR.
1.
Press SETUP and then the Meas Setup soft key.
2.
Using the rotary knob and ENTER, set Mode to Simple to display the following screen.
3.
Explanation
Automatically Saving the Measured Results
For details, see “Explanation” in section 3.5.
3-4
IM AQ1200-01EN
Page 43
3
2
1
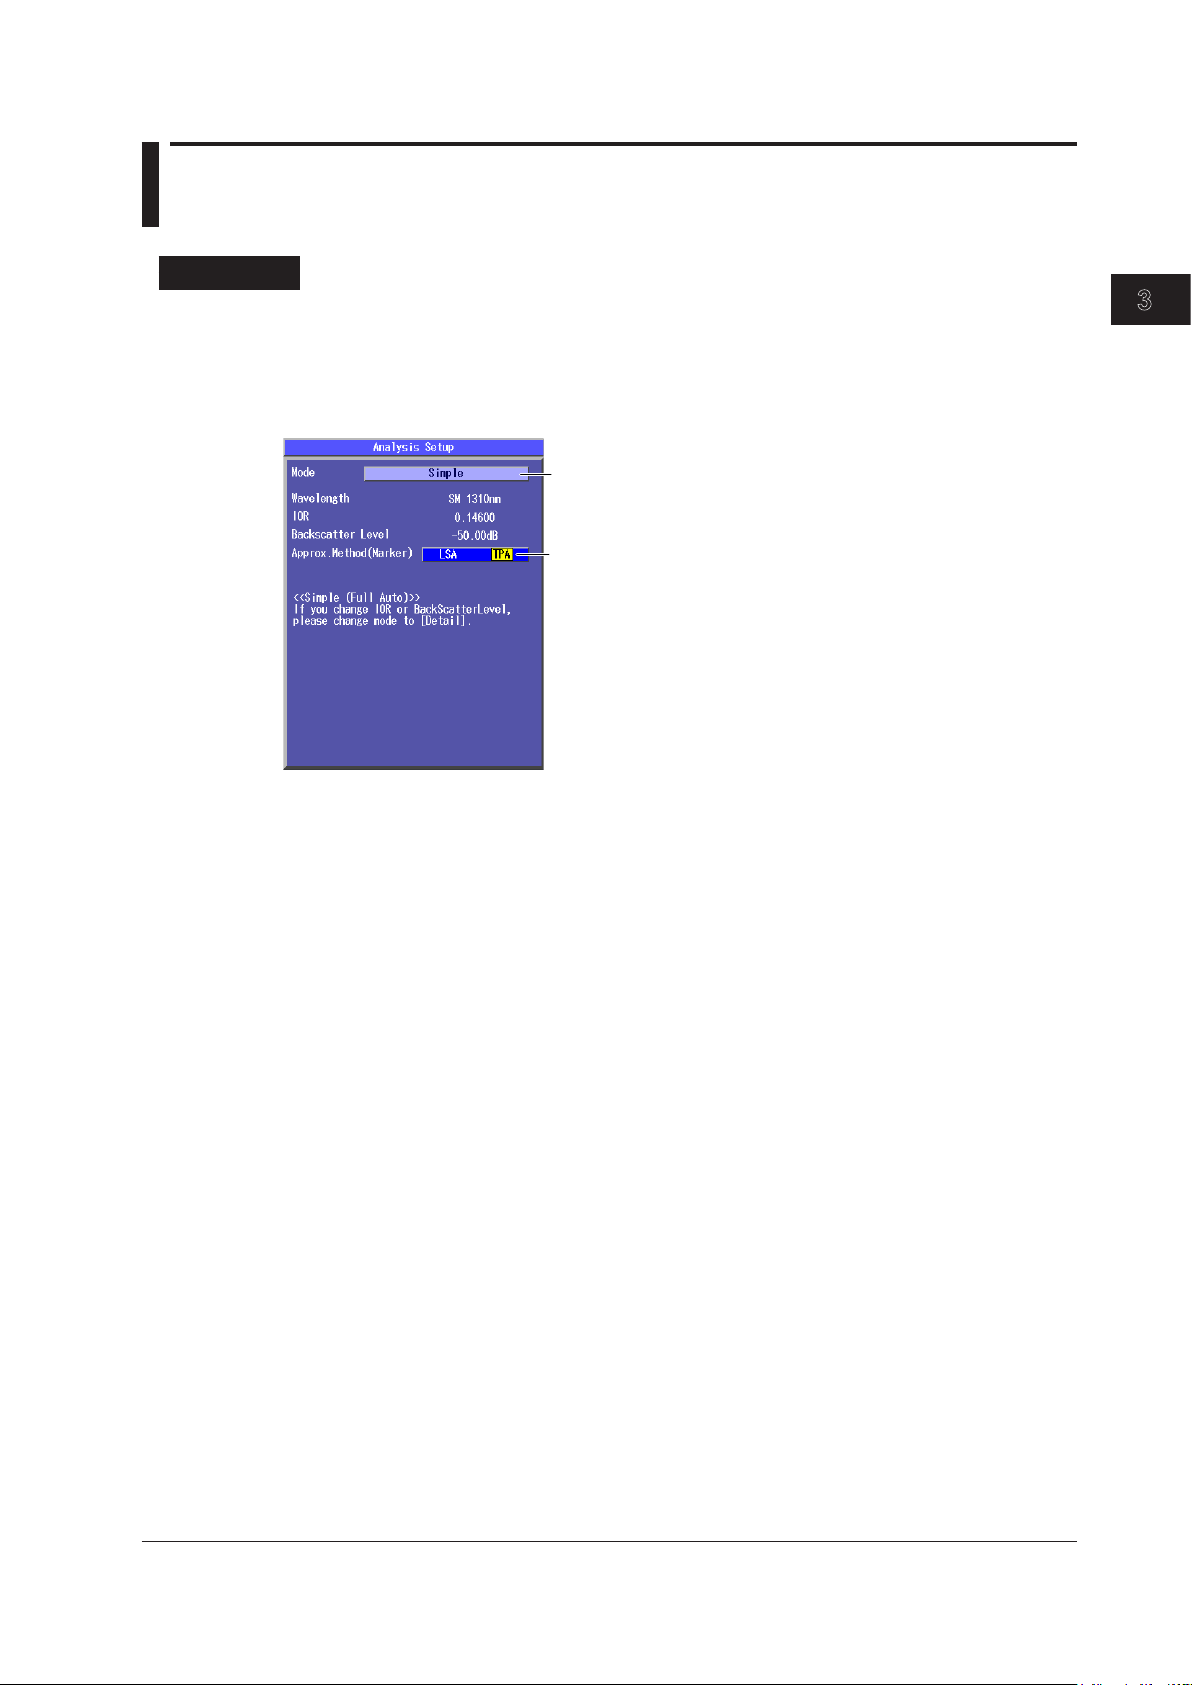
3.4 Selecting the Approximation Method (Marker)
Set the approximation method (LSA, TPA).
Set Mode to “Simple.”
<Simple (Full Auto) Mode>
Procedure
Analysis Setup Screen
Using the rotary knob and ENTER, select OTDR.
1.
Press SETUP and then the Analysis Setup soft key.
2.
Using the rotary knob and ENTER, set Mode to Simple to display the following screen.
3.
Approximation Method (Marker)
For details, see section 3.6.
Optical Pulse Measurement and Analysis Conditions
IM AQ1200-01EN
3-5
Page 44

3.5 Setting Measurement Conditions
Set the average method (Hi-Speed, Hi-Reflection).
Set the average unit (Times, Duration).
Set the event search (Auto, Manual).
Turns the fiber-in-use alarm on or off
Turns the plug check on or off
Initializes the settings
Press to reset the settings
to their factory defaults.
Set Mode to “Detail” or “Multi WL.”
The Multi WL option is not available on the AQ1200B and AQ1200C.
Set the distance range (Auto, 500m, 1km, 2km, 5km, 10km, 20km, 50km, 100km,
200km, 300km, 400km, 512km).
Set the pulse width (Auto, 3ns, 10ns, 20ns, 50ns, 100ns, 200ns, 500ns, 1µs,
2µs, 5µs, 10µs, 20µs).
Set the attenuation (Auto, 0.00dB, 2.50dB, 5.00dB, 7.50dB, 10.00dB,
12.50dB, 15.00dB, 17.50dB, 20.00dB, 22.50dB, 25.00dB, 27.50dB, 30.00dB).
Set the sample interval (Normal, High Resolution, 5cm, 10cm,
20cm, 50cm, 1m, 2m, 4m, 8m, 16m, 32m).
Set the average count or the duration to average over.
• When the unit is times:
(Auto, 2^10, 2^11, 2^12, 2^13, 2^14, 2^15, 2^16, 2^17, 2^18,
2^19, 2^20)
• When the unit is duration:
(Auto, 5sec, 10sec, 20sec, 30sec, 1min, 3min, 5min, 10min,
20min, 30min)
Set whether measured results are saved automatically or not.
Press ENTER to display the File Setup screen. See the File Setup
screen that is described below.
Set the wavelength.
You can specify Wavelength 2 and Wavelength 3 when Mode is set to Multi WL. The available
options vary depending on the model. For details, see the explanation later in this section.
Turns the PON on or off
Turns automatic saving on or off
Select a drive (Int.Memory, USB Memory).
See section 17.2.
• File list display (when the mode is UserDefine)
• Current save destination
Set how the automatically generated save-destination
folders are named (Date, UserDefine).
Selecting UserDefine enables the File List button.
Select to display the File List screen for setting the
save destination.
<Detail Mode and Multi WL Mode>
Procedure
Measurement Screen
Using the rotary knob and ENTER, select OTDR.
1.
Press SETUP and then the Meas Setup soft key.
2.
Using the rotary knob and ENTER, set Mode to Detail or Multi WL to display the following
3.
screen.
3-6
File Setup Screen
Use this screen to configure the automatic saving of measured results. For details about these
settings, see section 18.2.
IM AQ1200-01EN
Page 45

3
2
1
Use this screen to specify the folder where files will be saved to.
Folder path of the folder that you want to save to
The number of folders and files in
the folder that you want to save to
Explanation
Measurement Wavelength
There are three instrument types, with the measurement light wavelengths listed below. Select a
wavelength from the available settings on the AQ1200 that you are using.
Model Measurement Light Wavelength Output Port
AQ1200A SM 1310 nm, SM 1550 nm
AQ1200C SM 1650 nm
AQ1200E SM 1310 nm, SM 1550 nm Optical port 2
AQ1205A SM 1310 nm, SM 1550 nm Optical port 2
AQ1205E SM 1310 nm, SM 1550 nm Optical port 2
AQ1205F SM 1310 nm, SM 1550 nm Optical port 2
3.5 Setting Measurement Conditions
File List Screen
Optical Pulse Measurement and Analysis Conditions
Optical port 2AQ1200B SM 1625 nm
SM 1625 nm Optical port 3
SM 1625 nm Optical port 3
SM 1650 nm Optical port 3
On the AQ1200A, AQ1200B, AQ1200C, and AQ1205A, the light for a single mode (SM) optical fiber is
emitted from optical port 2.
On the AQ1200E, AQ1205E, and AQ1205F, light with a 1310 nm or 1550 nm wavelength is transmitted
from optical port 2, and light with a 1625 nm or 1650 nm wavelength is transmitted from optical port 3.
Firmly connect the optical fiber to the port that the light with the selected wavelength will be transmitted
from.
Setting Wavelengths in Multi WL Measurement Mode
If the measurement mode is set to Multi WL, you can measure with both the 1310 nm wavelength
and 1550 nm wavelength at the same time.
Depending on the model, you can set the wavelengths as shown below.
Model Wavelength 1 Wavelength 2 Wavelength 3
AQ1200A SM 1310nm SM 1550nm/OFF ─
AQ1200E SM 1310nm SM 1550nm/OFF OFF
AQ1205A SM 1310nm SM 1550nm/OFF ─
AQ1205E SM 1310nm SM 1550nm/OFF OFF
AQ1205F SM 1310nm SM 1550nm/OFF OFF
IM AQ1200-01EN
* The AQ1200B and AQ1200C do not have Multi WL mode.
SM 1550nm SM 1310nm/OFF ─
SM 1550nm SM 1310nm/OFF OFF
SM 1625nm OFF ─
SM 1550nm SM 1310nm/OFF ─
SM 1550nm SM 1310nm/OFF OFF
SM 1625nm OFF ─
SM 1550nm SM 1310nm/OFF OFF
SM 1650nm OFF ─
3-7
Page 46

3.5 Setting Measurement Conditions
Distance Range
Specify a distance range that matches the cable length. The distance range that you can select varies
depending on the wavelength. Specify a distance range value that is greater than the length of the
optical fiber that you will measure. If you specify a shorter value, the AQ1200 will not be able to perform
measurements properly. The longer the distance that you specify, the more time measurements will
take. When you specify the distance range, the optimum pulse width and attenuation values are set
automatically.
Cable Length Distance Range
Unknown Automatic
0 m to 400 m 500 m
400 m to 800 m 1 km
800 m to 1.6 km 2 km
1.6 km to 4 km 5 km
4 km to 8 km 10 km
8 km to 16 km 20 km
16 km to 40 km 50 km
40 km to 80 km 100 km
80 km to 160 km 200 km
160 km to 240 km 300 km
240 km to 320 km 400 km
320 km to 410 km 512 km
Pulse Width
The pulse width has the following characteristics.
• A short pulse width enables you to measure with a high resolution, but you cannot measure long
distances.
• A long pulse width enables you to measure long distances, but you cannot measure with a high
resolution.
The pulse widths that you can select vary depending on the distance range, as shown in the following
table.
Distance Range Selectable Pulse Widths
500 m 3 ns, 10 ns, 20 ns, 50 ns, 100 ns, 200 ns, 500 ns
1 km 3 ns, 10 ns, 20 ns, 50 ns, 100 ns, 200 ns, 500 ns, 1 μs
2 km 3 ns, 10 ns, 20 ns, 50 ns, 100 ns, 200 ns, 500 ns, 1 μs
5 km 3 ns, 10 ns, 20 ns, 50 ns, 100 ns, 200 ns, 500 ns, 1 μs
10 km or 20 km 3 ns, 10 ns, 20 ns, 50 ns, 100 ns, 200 ns, 500 ns, 1 μs
50 km or greater 3 ns, 10 ns, 20 ns, 50 ns, 100 ns, 200 ns, 500 ns, 1 μs, 2 μ, 5 μs, 10 μs, 20 μs
• When the distance range is set automatically, you cannot select the pulse width.
• When you specify the pulse width, the attenuation is automatically set to the optimum value.
Also, dead zones are larger with long pulse widths.
3-8
Attenuation
If large reflections are caused by optical connectors or by breaks in the optical fiber, the waveform may
be saturated. Specify attenuation to prevent the waveform from being saturated.
The attenuations that you can select vary depending on the pulse width, as shown in the following
table.
Pulse Width Selectable Attenuations
3 ns to 50 ns 0 dB, 2.50 dB, 5.00 dB, 7.50 dB, 10.00 dB, 12.50 dB, 15.00 dB
100 ns to 1 μs 0 dB, 2.50 dB, 5.00 dB, 7.50 dB, 10.00 dB, 12.50 dB, 15.00 dB, 17.50 dB, 20.00 dB
2 μs to 5 μs 0 dB, 2.50 dB, 5.00 dB, 7.50 dB, 10.00 dB, 12.50 dB, 15.00 dB, 17.50 dB, 20.00 dB,
22.50 dB, 25.00 dB
10 μs, 20 μs 0 dB, 2.50 dB, 5.00 dB, 7.50 dB, 10.00 dB, 12.50 dB, 15.00 dB, 17.50 dB, 20.00 dB,
22.50 dB, 25.00 dB, 27.50 dB, 30.00 dB
• If the distance range or pulse width is set automatically, or if the average method is set to high
reflection, you cannot select the attenuation.
• If the waveform is saturated, you cannot perform measurements with high sensitivity, so specify a
large value.
IM AQ1200-01EN
Page 47

3
2
1
If reflections are large, the waveform
may be saturated.
3.5 Setting Measurement Conditions
Sample Interval
The maximum number of sample data points is 128000. The shortest sample interval is determined by
the distance range.
Normal: The
Hi-Resolution: The AQ1200 uses the shortest sample interval to
If you use a short sample interval, you can measure for finer changes. However, the data size of the
measured result becomes large. The sample intervals that you can select vary depending on the
distance range, as shown in the following table.
Distance Range Selectable Sample Intervals
500 m 5 cm, 10 cm, 20 cm, 50 cm, 1 m
1 km 5 cm, 10 cm, 20 cm, 50 cm, 1 m, 2 m
2 km 5 cm, 10 cm, 20 cm, 50 cm, 1 m, 2 m, 4 m
5 km 10 cm, 20 cm, 50 cm, 1 m, 2 m, 4 m, 8 m
10 km 20 cm, 50 cm, 1 m, 2 m, 4 m, 8 m
20 km 50 cm, 1 m, 2 m, 4 m, 8 m, 16 m
50 km 1 m, 2 m, 4 m, 8 m, 16 m
100 km 1 m, 2 m, 4 m, 8 m, 16 m
200 km, 300 km
400 km, 512 km
AQ1200 uses the optimum sample interval for the measurement method to
perform measurements.
perform measurements.
4 m, 8 m, 16 m, 32 m
Average Method
Hi-Speed
In Hi-Speed mode, all sections are measured according to the specified attenuation. If the specified
attenuation value is not appropriate and a large reflection occurs, the waveform for that section may
be saturated.
Optical Pulse Measurement and Analysis Conditions
Hi-Reflection
In Hi-Reflection mode, the AQ1200 can perform measurements correctly even if large reflections
(excluding extremely large reflections caused by sections of the fiber such as the open end of
the fiber) occur. In Hi-Reflection mode, the AQ1200 sets the optimum attenuation according to
the backscattering light level for each section, and performs the measurement. Therefore, the
measurement time is longer than in Hi-Speed mode. The partitioning of the optical fiber into
sections and the specifying of the optimum attenuation are done automatically.
Note
We recommend that you use Hi-Speed mode when you are measuring a short optical fiber that has no
reflections.
Average Unit
Duration: Measurements are performed only over the specified duration. If you specify a short
T
imes: Measurements are performed only the specified numb
duration, depending on the measurement conditions, measurements may not have finished
when the specified time elapses.
er of times.
IM AQ1200-01EN
3-9
Page 48

3.5 Setting Measurement Conditions
Average Count and Average Duration
You can select the following values.
Duration: 5sec, 10sec, 20sec, 30sec, 1min, 3min, 5min, 10min, 20min, 30min
Sec is seconds, and min is minutes.
Times: 2^10 (1024 times), 2^11 (2048 times), 2^12 (4096 times), 2^13 (8192 times), 2^14 (16384
times), 2^15 (32768 times), 2^16 (65536 times), 2^17 (131072 times), 2^18 (262144
times), 2^19 (524288 times), 2^20 (1048576 times)
2^10 is 2 to the power of 10 (1024 times).
•
The maximum average count is 2^20. If you specify a duration to average over that causes this
number of times to be exceeded, the measurement will finish before the duration to average over
elapses.
• Due to the influence of other measurement conditions, a measurement may take less time than the
duration you have specified or it may not complete when the specified duration elapses.
• If you specify a large value for the number of times or the duration, you can perform highly precise
measurements, but the measurement time becomes longer. Keep the
the loss of the optical fiber under measurement in mind when you specify these values.
• The display of the duration or the number of times is determined by the specified average unit.
• If
Auto is selected, one of the options above is used.
Event Search
The event search is a feature that automatically searches for losses and reflections in the data that is
acquired during averaged measurements. On the waveform, detected losses or reflections are known
as events.
For details on analyzing detected events, see chapter 7.
Automatic:
Manual:
After averaged measurements complete, events are automatically searched for and
listed, and the event analysis menu is displayed.
After averaged measurements complete, the waveform is displayed, but events are
not searched for.
AQ1200’s dynamic range and
Auto Save
You can configure the AQ1200 to automatically save the measured data that it has acquired to the
specified folder after averaged measurements complete.
Off:
On: Measured data is saved automatically when averaged measurements complete.
Note
Measured data is not saved when averaged measurements complete. For details on saving
data manually, see section 18.2.
• If auto save is turned on, measured data is automatically saved after averaged measurements complete,
so be sure to specify the folder where measured data will be saved to before you start measuring.
• If you want to change the selected drive, first set Auto Save to On.
You cannot change the selected drive while Auto Save is set to Off.
• For the file name format settings, see section 18.2.
3-10
IM AQ1200-01EN
Page 49

3
2
1
3.5 Setting Measurement Conditions
Fiber-in-Use Alarm
Some models in the AQ1200 Series use the same wavelength that is used in real communication to
make measurements. If communication light is present in the optical fiber that you want to measure,
the communication will be affected. When this communication light is present, we say that the fiber is
in use.
The fiber-in-use alarm is a feature that checks if communication light is being transmitted along the
optical fiber that you are trying to measure. If the fiber is in use, an alert message is displayed that
suggests you stop the measurement. If the input level of the communication light is –20 dBm to 0
dBm, to prevent damage to the AQ1200, the alert message is displayed repeatedly. If this occurs, stop
measuring. For details on starting and stopping measurements, see chapter 4. For details about the
message, see section 19.2.
On the AQ1200B and AQ1200C, because the light received at the wavelength for optical
communication is blocked (not detected), fiber-in-use alarms do not occur.
Plug Check
The plug check is a feature that checks the state of the connection between the AQ1200 and an optical
fiber. When you turn this feature on, you can prevent light from being transmitted from the AQ1200 light
source port if an optical fiber is not connected to the AQ1200 or if the fiber is not connected correctly.
Of
f: Plugs are not checked.
Plugs are checked.
On:
Optical Pulse Measurement and Analysis Conditions
PON (Passive optical network)
If the optical fiber that you are trying to measure is connected to a PON system, because an
optical splitter for splitting the optical fiber is installed in the system, you will not be able to measure
optical pulses that are reflected from a position further away than the optical splitter using normal
measurement. This feature enables you to correctly measure optical pulses that are reflected from
positions such as this.
Of
f: Optical pulses excluding those from PON systems can be measured.
PON system optical pulses can be measured.
On:
IM AQ1200-01EN
3-11
Page 50

3.6 Setting Analysis Conditions
Set the fault event to On or Off.
If you set it to On, the following screen appears.
Set Mode to “Detail.”
Displays the specified wavelength
Set the index of refraction (1.30000 to 1.79999).
Set the backscattering light level (–10.00dB to –64.99dB).
Set the approximation method (marker; LSA, TPA).
Set the approximation method (event; LSA, TPA).
Set the event’ s splice loss (0.01dB to 9.99dB).
Set the event’ s return loss (20dB to 70dB).
Set the end of fiber (Fresnel reflection; 3dB to 65dB).
Turns splitter detection on or off
Threshold for splitter detection
Set the fault event’s splice loss (0.01dB to 9.99dB).
Set the fault event’s return loss (20dB to 70dB).
Set the fault event’s PASS/FAIL judgement display
(Display, Hide).
Initializes the settings
Press to reset the settings to
their factory defaults.
Set Mode to “Multi WL.”
Set macro bending to On or Off.
If you set it to On, the following screen appears.
Turns the macro bending (bending loss)
display on or off
Set the macro bending threshold
(0.001dB to 99.999dB).
<Detail Mode and Multi WL Mode>
Procedure
Analysis Setup Screen
Using the rotary knob and ENTER, select OTDR.
1.
Press SETUP and then the Analysis Setup soft key.
2.
Using the rotary knob and ENTER, set Mode to Detail or Multi WL to display the following
3.
screen.
Detail Mode
Multi WL Mode
For each wavelength set in the measurement conditions, set the index of refraction and backscatter
level. In addition to the settings for Detail mode, you can set macro bending (bending loss).
3-12
IM AQ1200-01EN
Page 51

3
2
1
Explanation
1 2
Approximated line
calculation range
Index of Refraction
The AQ1200 uses indices of refraction in the calculations that it performs to measure distance. If you
do not set the correct index of refraction, the distance measurement will be incorrect.
The AQ1200 has the following preset indices of refraction that correspond to each wavelength.
You can specify a value from 1.30000 to 1.79999.
Backscattering Light Level
Light that travels through an optical fiber displays a phenomenon known as Rayleigh scattering. Due
to this phenomenon, a portion of the light is sent backwards, in the direction opposite to the direction
of propagation. This phenomenon is known as backscattering. The backscattering light level setting
is used when the AQ1200 calculates the return loss and total return loss. If you do not set the correct
backscattering light level, the return loss and total return loss measurements will be incorrect.
The AQ1200 has the following preset backscattering light levels that correspond to each wavelength.
You can specify a value from -10.00 to -64.99.
1310 nm: 1.46000
1550 nm: 1.46000
1625 nm: 1.46000
1650 nm: 1.46000
1310 nm:
1550 nm: –52 dB
1625 nm: –53 dB
1650 nm:
–50 dB
–53 dB
3.6 Setting Analysis Conditions
Optical Pulse Measurement and Analysis Conditions
Approximation Method
When the AQ1200 calculates splice loss, it extrapolates straight lines. These straight lines are known
as approximated lines.
There are the following two kinds of approximated lines.
•
Least squares approximation (written as LSA below)
• Two point approximation (written as TPA below)
LSA
The AQ1200 calculates the loss between two points by using the least squares method on all the
data between the two points.
This method has the following characteristics.
Merits: Because all the data between the two points is used, errors in the calculated value
are small.
Fluctuations in the calculated values are reduced, and highly reproducible values can
be obtained.
Demerit: If a large reflection or splice loss is present in the section whose loss is being
calculated, those values are also included in the calculation, so large errors result.
If no reflection and splice loss events are present in the sectio
a value that has a smaller degree of error than the TP
A.
n being calculated, the LSA provides
IM AQ1200-01EN
3-13
Page 52

1
2
Approximated line
calculation points
3.6 Setting Analysis Conditions
TPA
The AQ1200 uses the difference between the levels of the two specified points to calculate the loss.
The level of fluctuation and reproducibility in the calculated value may vary greatly. If reflection and
splice loss events are present in the section being calculated, the TPA provides a value that has a
smaller degree of error than the LSA.
Event Search Conditions
Splice Loss
If a splice loss that exceeds the specified threshold occurs, it is detected as an event.
The range is 0.01 dB to 9.99 dB.
Return Loss
If a return loss that is less than or equal to the specified threshold occurs, it is detected as an event.
The larger the reflection, the smaller the return loss, so events (reflections) are detected when the
return loss is less than or equal to the threshold.
The range is 20 dB to 70 dB.
Fiber Ends (Fresnel reflection)
If a reflection that exceeds the specified threshold occurs, it is detected as the end of the fiber.
The range is 3 dB to 65 dB.
Splitter Search
ON Losses (reflections) that exceed splitter loss are displayed as splitters.
The threshold at the end of the fiber is automatically set to its maximum value.
OFF Losses (reflections) that exceed splitter loss are displayed as normal events.
Splitter Loss
Events whose loss exceeds this value are assumed to be splitters.
3-14
IM AQ1200-01EN
Page 53

3
2
1
Judgment result
Fault event
3.6 Setting Analysis Conditions
Fault Events
Display
Events that are greater than or equal to the specified threshold (or reflections that are less than or
equal to the specified threshold) are displayed as fault events.
Off:
On: Events that have exceeded their threshold values are displayed with an asterisk
Splice Loss and Return Loss
Set the threshold values that are used to display events as faults.
Splice loss: The range is 0.01 dB to 9.99 dB.
Return loss: The range is 20 dB to 70 dB.
Because the end of fibers is handled as either a splice loss or a reflection, there is no fault event
just for the end of fibers.
PASS/FAIL Judgement
If you have turned the fault event display on, you can display the result of PASS/FAIL judgment in
the lower left of the waveform display area.
Display: FAIL or PASS and the number of fault events are displayed.
Hide: The judgment is not displayed.
Events that have exceeded their threshold values are not displayed with an asterisk
attached to them.
attached to them.
Optical Pulse Measurement and Analysis Conditions
IM AQ1200-01EN
3-15
Page 54

Detection of a bending loss
Move the cursor to a bending
loss event to display the values.
1550 nm wavelength
1310 nm wavelength
Bending loss events are displayed in this event list.
3.6 Setting Analysis Conditions
Macro Bending (Bending Loss)
When an optical pulse measurement is performed in Multi WL measurement mode, you can compare
the difference between the splice losses at wavelengths of 1310 nm and 1550 nm and display on the
screen bending loss events that are caused by bends in the fiber.
Display
This function displays the detected bending losses in the event list on the event screen when optical
pulses are measured.
On: The bending losses are displayed in the event list.
Off: The bending losses are not displayed in the event list.
Threshold
This is the threshold of the difference between the splice losses of the 1310 nm wavelength and the
1550 nm wavelength when optical pulses are measured.
When the difference between the splice losses of the two wavelengths for the same event is larger
than this value, the event is detected as a bending loss.
In this example, the current trace has been set to the waveform with 1550 nm wavelength.
The waveform with 1310 nm wavelength, which is the waveform being compared, is displayed in
gray.
If you switch the current trace to the waveform with 1310 nm wavelength, the waveform with 1550
nm wavelength, which is the waveform being compared, will be displayed in gray. In this situation,
the bending loss event for 1550 nm wavelength (event number 3) will be displayed on the waveform
with 1310 nm wavelength, which is the current trace.
Note
• If the waveforms of the two wavelengths are not being acquired, bending losses cannot be detected.
• The waveform being compared (displayed in gray) is not displayed when Display next to Macro Bending
is set to Off.
• For details on the event list, see chapter 7.
• For details on switching the current trace, see section 4.2.
3-16
IM AQ1200-01EN
Page 55

3
2
1
3.7 Setting the Pulse Light Output Level
Set the pulse light output level
(Low, Normal).
Procedure
Using the rotary knob and ENTER, select OTDR.
1.
Press SETUP, the System Setup soft key, and then the OTDR soft key to display the following
2.
screen.
Explanation
Pulse Light Output Level
The AQ1200B uses an optical pulse wavelength of 1625 nm. The AQ1200C uses an optical pulse
wavelength of 1650 nm. Even though these differ from the wavelength for optical communication, if
communication light is present in the optical fiber (the fiber is in use), the communication itself may be
affected.
If a filter that blocks measurement light at 1625 nm or 1650 nm is not attached to the optical fiber that
you are trying to measure, you can perform measurements without affecting the communication light
that is present in the optical fiber by lowering the pulse light output level.
Normal:
Low:
Pulse light is generated at the maximum power.
Pulse light is generated at low power.
Optical Pulse Measurement and Analysis Conditions
You cannot set the pulse light output level on the AQ1200A or AQ1205A.
IM AQ1200-01EN
3-17
Page 56

3.8 Giving Notifications When Installations Are
Configure the work completion notification.
Press ENTER to display the Work completion notice setting
dialog box.
(See the Work completion notice setting dialog box below.)
Turns notifications on or off
Set how to display the real-time measurement
confirmation message
(No Check, Check only once, Check everytime).
Turns the alarm notification upon work completion
on or off
Turns the message display upon work completion
on or off
Work start
position
Distance
Level
Extension work point
(splice, connection, etc.)
CheckPoint
Completion notification
cursor position during
optical fiber extension
Work completion
point
CheckPoint
Work completion
notification cursor
position
50 km 100 km
(Event)
Complete
Procedure
Using the rotary knob and ENTER, select OTDR.
1.
Press SETUP, the System Setup soft key, and then the OTDR soft key to display the following
2.
screen.
Work Completion Notice Setting Dialog Box
Configure the work completion notification.
Explanation
Before you check whether the work is complete, move the cursor to the fiber end point after the optical
fiber has been installed (the extension work point or the work completion point) and turn on the work
completion confirmation notification. When the fiber end detection position (the event) during real-time
measurement is the same as the cursor position (CheckPoint), the AQ1200 gives a notification that the
installation is complete.
3-18
IM AQ1200-01EN
Page 57

3
2
1
3.8 Giving Notifications When Installations Are Complete
Message Display
Off: Messages are not displayed.
On: Completion messages are displayed on the screen.
Alarm
Off: The AQ1200 does not sound an alarm.
On: The AQ1200 sounds an alarm.
Confirmation
When the AQ1200 checks the work completion, a message confirming whether you have set the
cursor to a position that is a little after the installation point is displayed.
No Check: The confirmation message is not displayed.
Check only once:
Check everytime: The message is displayed each time before the AQ1200 performs work
After you start the AQ1200, the message is only displayed before the AQ1200
performs work completion notification for the first time.
completion notification.
Optical Pulse Measurement and Analysis Conditions
IM AQ1200-01EN
3-19
Page 58

3
2
1
4
Set the wavelength (1310nm, 1550nm).
You cannot set the wavelength on the
AQ1200B and AQ1200C.
Set the distance range (Auto, 500m,
1km, 2km, 5km, 10km, 20km, 50km,
100km, 200km, 300km, 400km, 512km).
Set the pulse width (Auto, 3ns, 10ns,
20ns, 50ns, 100ns, 200ns, 500ns, 1µs,
2µs, 5µs, 10µs, 20µs).
Press to configure marker settings.
(See section 6.1.)
Waveform display screen
(See section 5.1.)
Set the attenuation (Auto, 0.00dB,
2.50dB, 5.00dB, 7.50dB, 10.00dB,
12.50dB, 15.00dB, 17.50dB, 20.00dB,
22.50dB, 25.00dB, 27.50dB, 30.00dB).
Laser on indication
Chapter 4
Measuring Optical Pulses
4.1 Performing Real-time Measurement
In real-time measurement, you can view waveform changes in real time. You can change the
conditions while measurement is being performed.
WARNING
• During measurement, do not remove the optical fiber cable, because light is emitted from
the light source port. Visual impairment may occur if the light enters the eye.
• Close the covers of any light source ports that do not have optical fiber cables connected
to
them. On models with two or more light source ports, visual impairment may occur if light
that is mistakenly emitted from the wrong port enters the eye.
Procedure
Starting and Stopping Measurements
Using the rotary knob and ENTER, select OTDR.
1.
Press REAL TIME to start the measurement and display the measured waveform on the
2.
screen. The soft key menu switches to the real-time menu.
A mark appears on the display to indicate that the laser light is on.
During real-time measurement, press REAL TIME to stop the measurement. The soft key menu
3.
switches to the OTDR menu.
The mark that indicates that the laser light is on disappears from the display.
Measuring Optical Pulses
Setting the Work Completion Point
Move the cursor to a position that is a little after the installation point.
3.
Press the Completion Check soft key to select ON.
4.
Measurement starts. If the fiber end moves the distance indicated by the cursor position, the
IM AQ1200-01EN
• When Confirmation is set to “Check only once” or “Check everytime”
A message appears asking whether you have moved the cursor to the work completion point. Click OK.
AQ1200 displays a message or sounds an alarm. Press REAL TIME to clear the message or
turn off the alarm.
4-1
Page 59

Set the work completion confirmation (ON, OFF).
Fiber end
Move the cursor to a position that is a little
after the installation point.
(Example: When the planned installation
point is at 30 km.)
You can perform measurements efficiently by moving the cursor to a position a little after
the installation point (depending on how fast fiber will be installed). This is because the
AQ1200 notifies you of the work completion, which is your sign to measure the connection
loss at that point (splice, connection, etc.).
If work completion notification is turned on, “CheckPoint”
is displayed at the cursor.
4.1 Performing Real-time Measurement
Note
The Completion Check soft key is only displayed when work completion notification is turned on.
For the setup procedure, see section 3.8. Work completion confirmation is turned off automatically when
measurement is stopped.
Explanation
Real-time Measurement
Measurement conditions are set before the actual measurement takes place, but during real-time
measurement you can change the measurement conditions and adjust markers and the cursor. When
you stop the measurement, the AQ1200 returns to the previous screen.
•
In Simple (Full-Auto) mode, you can only change the wavelength.
ou cannot change the attenuation if the averaging mode is set to Hi-Reflection. For details, see
• Y
section 3.5.
Wavelength Settings
• The “Wavelength 1” that has been set in the Multi WL mode measurement conditions is the
default wavelength in real-time measurement.
• On the AQ1200B, the wavelength is fixed to 1625 nm. On the AQ1200C, the wavelength is fixed
to 1650 nm.
•
If you set “Wavelength 1” to 1625 nm or 1650 nm on the AQ1200E,
cannot set “Wavelength 2” or “Wavelength 3” to 1310 nm or 1550 nm, which are emitted from a
different output port.
AQ1205E, or AQ1205F, you
Installation Completion Notification
Move the cursor to a position a little after the installation point before you perform real-time
measurement. If the fiber end detection position is the same as the cursor position when you perform
real-time measurement, the AQ1200 displays a message on the screen or sounds an alarm. For
details, see section 3.8.
4-2
IM AQ1200-01EN
Page 60

3
2
1
4
4.2 Performing Averaged Measurements
Select the marker
(see section 6.1).
Waveform display screen
(see section 5.1)
Laser on indication Averaging duration or progress
In averaged measurements, the data that is acquired from each pulse is averaged and displayed. By
performing averaged measurements, you can improve the signal-to-noise (S/N) ratio.
This is effective when you want to detect faint events that are buried in noise.
Procedure
Starting and Stopping Measurements
WARNING
• During measurement, do not remove the optical fiber cable, because light is emitted from
the light source port. Visual impairment may occur if the light enters the eye.
• Close the covers of any light source ports that do not have optical fiber cables connected
to
them. On models with two or more light source ports, visual impairment may occur if light
that is mistakenly emitted from the wrong port enters the eye.
Using the rotary knob and ENTER, select OTDR.
1.
Press AVG. The measurement begins, and the measured waveform is displayed on the screen.
2.
The Average menu appears. The average time or progress is displayed in the upper right of the screen.
During measurement, a mark appears at the top of the display to indicate that the laser light is on.
Measuring Optical Pulses
When the average measurement completes in accordance with the specified conditions, the
measurement stops automatically.
The OTDR menu appears.
To stop the average measurement in progress, press AVE.
IM AQ1200-01EN
4-3
Page 61
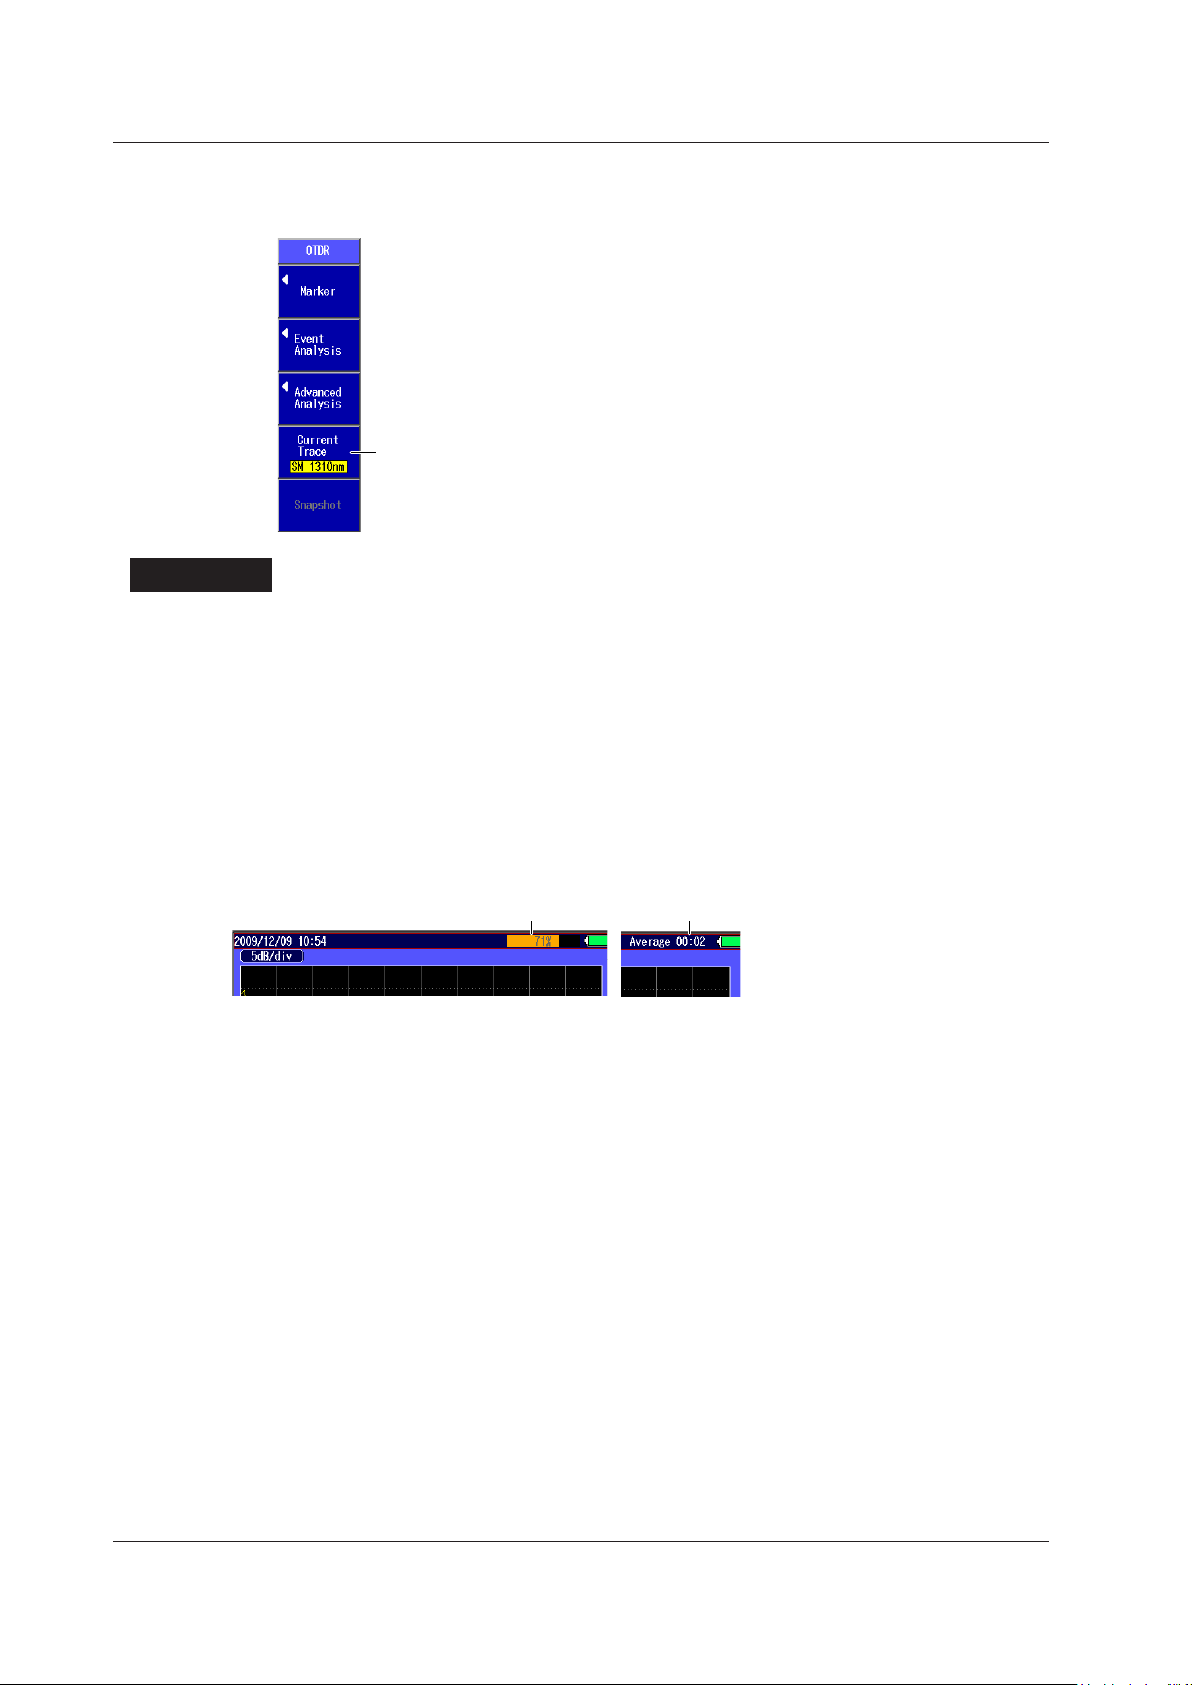
Switches the current trace (1310nm, 1550nm)
Duration to average overProgress bar at 71%
4.2 Performing Averaged Measurements
Switching the Current Trace (in Multi WL mode)
Press the Current Trace soft key to switch the current trace.
3.
Explanation
Averaged Measurement
A progress bar is displayed during averaged measurement. When the measurement finishes, the
progress bar stops automatically. If you set Avg Duration to Auto, the duration to average over is
displayed at the top of the screen. If you specify a setting other than Auto, a value that indicates the
progress is displayed. When the measurement completes correctly, 100% is displayed. The time that
the measurement takes to complete varies depending on settings such as the distance range and the
average count.
If you are using markers to perform an averaged measurement, when the measurement completes
correctly (100%), the AQ1200 automatically closes the marker measurement screen.
If Event Search is set to Auto, the event screen appears when the measurement is completed
correctly.
Measured data can automatically be saved when averaged measurements are completed. For the
setup procedure, see section 3.5.
Current Trace
You can only analyze the current trace using markers and cursors.
In Multi WL measurement mode, the Current Soft key is enabled when measurement of multiple
wavelengths are completed. Press the Current Trace soft key to select the waveform that you want to
analyze.
Limitations on Multi Wavelength Trace Display
When you are in the event analysis menu, only the current trace is displayed. When you finish event
analysis, the multi wavelength trace display returns.
Disabling of the Multi Wavelength Trace Display
In the following situations, waveform data other than the current trace is cleared.
• When waveform data is loaded from a file.
• When waveform analysis (multi trace analysis, 2 way trace analysis, or differential trace analysis)
is executed.
• When you exit Multi WL measurement mode. The current trace remains displayed.
4-4
IM AQ1200-01EN
Page 62

3
2
1
4
4.3 Displaying Snapshot Waveforms
Take/clear a snapshot.
If you press this soft key when “Snapshot” is displayed, a snapshot will be taken
of the displayed waveform, and the soft key will switch to display “Clear
Snapshot.”
If you press this soft key when “Clear Snapshot” is displayed, the snapshot
waveform will be cleared, and the soft key will switch to display “Snapshot.”
Snapshot waveform
The waveform is displayed in white.
Waveform being measured
You can measure waveforms while retaining the previous waveform on the screen (a snapshot). The
AQ1200 displays the measured waveform and the snapshot waveform at the same time.
Procedure
Snapshot Screen
Using the rotary knob and ENTER, select OTDR.
1.
Display the waveform on the screen, and then press the Snapshot soft key. The soft key’s
2.
display color changes momentarily, and a snapshot waveform appears.
The text displayed on the soft key changes from “Snapshot” to “Clear Snapshot.”
Measuring Optical Pulses
Explanation
Snapshot
You can also take a snapshot of waveforms that you load from files. For details on loading waveforms,
see section 18.2. You cannot take snapshots in Multi WL mode.
IM AQ1200-01EN
4-5
Page 63
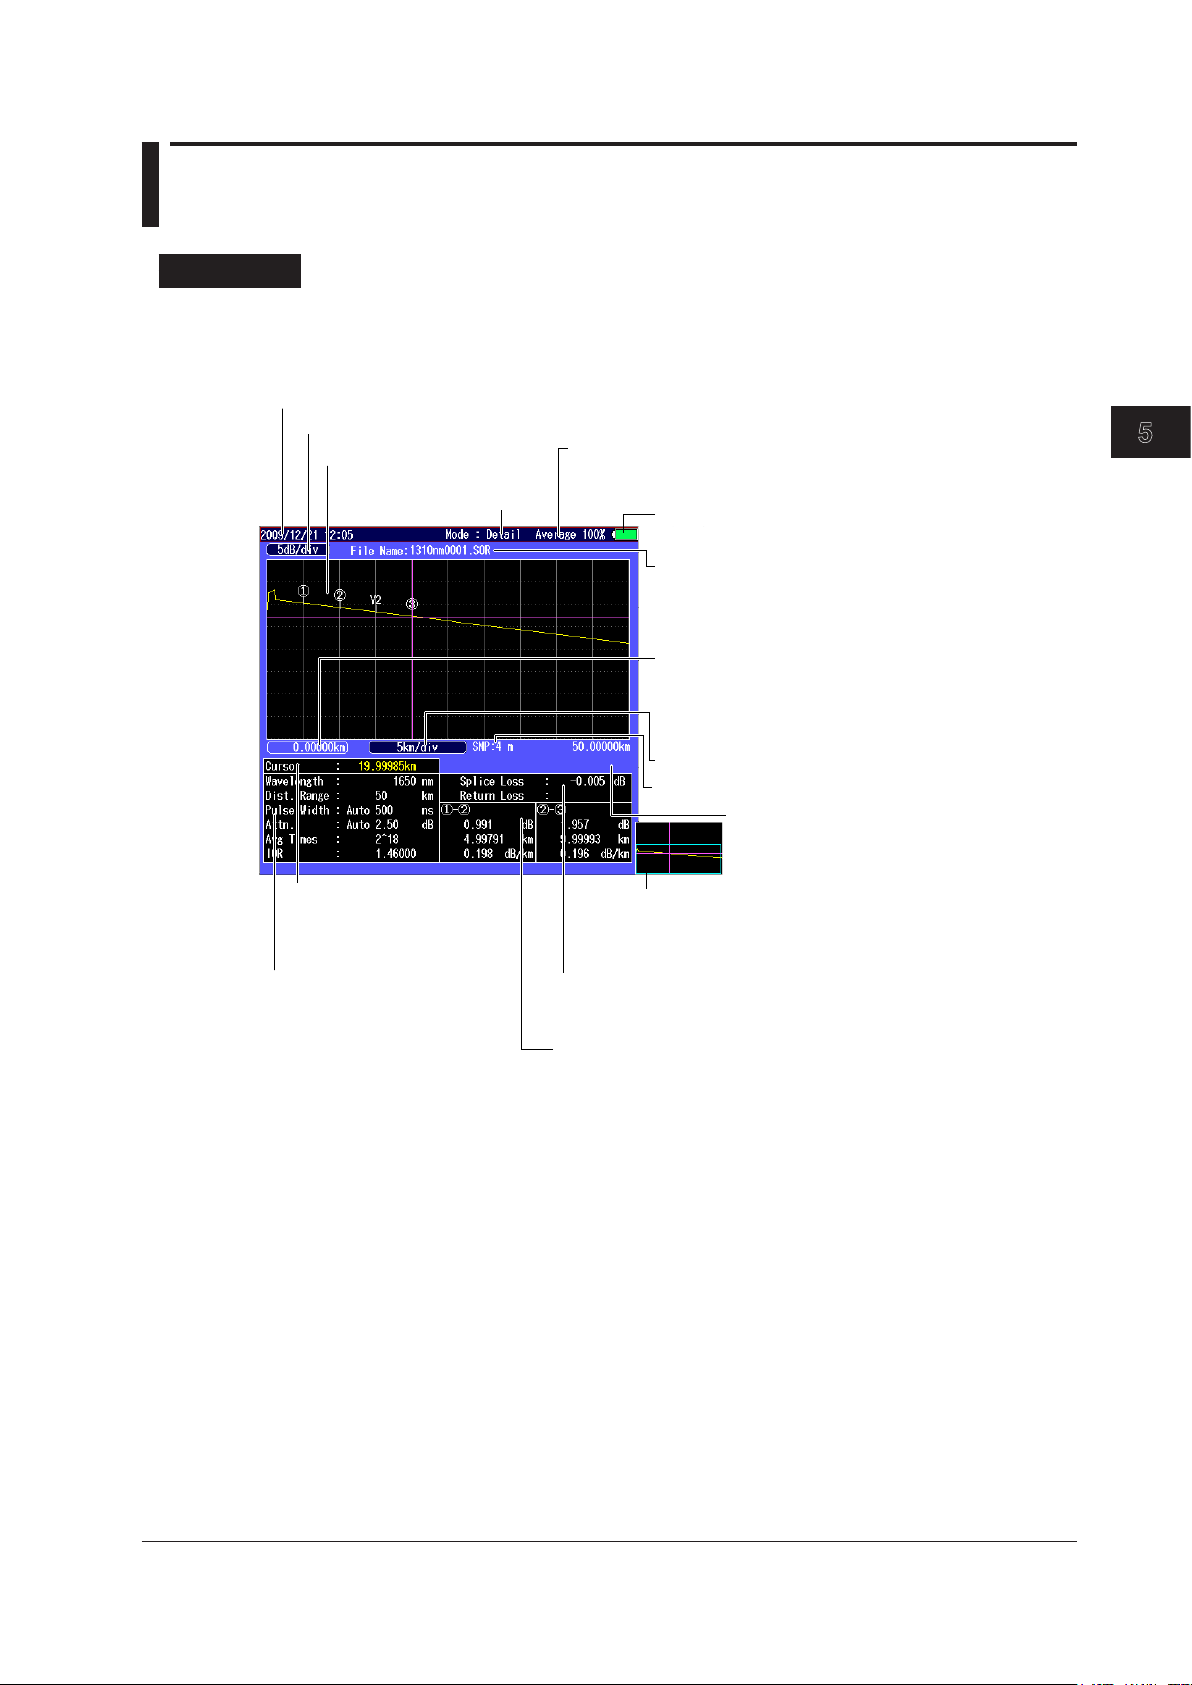
3
2
1
4
5
Date and time
See the operation guide, IM AQ1200-02EN.
Value per division on the vertical axis
File name
The name of the measurement data file that
is currently displayed is shown here. For
details on file names, see section 17.2.
Measurement mode
(See section 3.1.)
Progress during averaged measurements (AVG)
The progress bar behind the characters indicates how
far measurement has proceeded. (See section 4.2.)
Remaining battery power/AC
See the operation guide, IM AQ1200-02EN.
Position of the left edge of the screen
When the distance reference is set, the position of the
distance reference is 0, and this displays the distance
from the distance reference to the position of the left edge
of the screen as a negative value.
Distance per division on the horizontal axis
Waveform display area
Sample interval (See section 3.5.)
Position of the right edge of the screen
When the distance reference is set, this displays
the distance from the distance reference to the
position of the right edge of the screen.
Full screen display of the waveform display area
The section that is displayed in the waveform display
area is represented by a box (overview). (See sections
5.2 and 5.3.)
Distance from the horizontal
axis’ measurement reference
point to the cursor position
(See section 6.1.)
Measurement conditions
(See section 3.5.)
Marker section measured values
The attenuation, distance, and attenuation per
km between the markers are displayed.
Splice loss/return loss
The values that are calculated from the specified markers are displayed.
(See chapter 6.)
Chapter 5 Waveform Display
5.1 Waveform Display Screen
Procedure
Display Screen
Using the rotary knob and ENTER, select OTDR to display the following screen.
1.
Waveform Display
IM AQ1200-01EN
5-1
Page 64

5.2 Zooming the Waveform Display Scale
Enables zooming
Press this soft key to enable
the arrow keys to zoom the
display in and out.
Enables moving in the vertical
and horizontal directions
(See section 5.3.)
Set the amount the cursor moves
(Fine, Coarse).
Set whether to move the cursor a
small amount or a large amount.
Auto Zoom
Automatically zooms in on
the waveform at the
cursor position.
Initializes the display scale and
position (see section 5.4)
Overview display
This indicates where in the entire
waveform display area the currently
displayed waveform area is.
Procedure
Switching between Zooming and Moving the Displayed Waveform
Using the rotary knob and ENTER, select OTDR.
1.
Press SETUP and then the Scale soft key to display the following screen.
2.
Zooming the Displayed Waveform
Press the arrow keys to zoom the displayed waveform in or out.
1.
Note
You can zoom the waveform during measurement or when measurements are stopped.
5-2
IM AQ1200-01EN
Page 65

3
2
1
4
5
Explanation
Press the left arrow key to zoom the waveform display horizontally.
Cursor position
Cursor position
Press the down arrow key to zoom the waveform display vertically.
Cursor position
Cursor position
Zooming In and Out
You can press the arrow keys to zoom the displayed waveform in or out.
When the cursor is displayed, the waveform is zoomed at the cursor position.
When the cursor is not displayed, the waveform is zoomed at the left edge of the display.
5.2 Zooming the Waveform Display Scale
Down arrow key:
Up arrow key: Zoom out on the waveform in the vertical direction.
Left arrow key: Zoom in on the waveform in the horizontal direction.
Right arrow key:
Zoom in on the waveform in the vertical direction.
Zoom out on the waveform in the horizontal direction.
Waveform Display
IM AQ1200-01EN
5-3
Page 66

When the entire waveform is being displayed
Everything within the box is displayed.
When the display is zoomed horizontally
The area shown within the box is zoomed and
displayed in the waveform display area.
When the display is then zoomed
vertically
The area shown within the box is zoomed
and displayed in the waveform display area.
5.2 Zooming the Waveform Display Scale
Auto Zoom
The auto zoom feature contains the following two types of zoomed displays.
• Zoom the waveform at the cursor position
The cursor on the waveform display screen is shown in the center of the zoomed display.
• Zoom the waveform at event positions
When the AQ1200 has detected events during event analysis, the selected event is zoomed and
displayed.
Overview Display
The overview display is linked to the zoomed waveform display. The blue box indicates where in the
entire waveform display area the zoomed waveform display is showing.
5-4
IM AQ1200-01EN
Page 67

3
2
1
4
5
5.3 Moving the Waveform Display Position
Enables moving in the vertical and
horizontal directions
Press this soft key to enable the arrow
keys to move the display.
Set the amount the cursor moves
(Fine, Coarse). See section 5.2.
Enables zooming
(See section 5.2.)
Initializes the display scale and
position (see section 5.4)
Overview display
This indicates where in the entire
waveform display area the currently
displayed waveform area is.
Executes auto zoom
(See section 5.2.)
When you select to shift the
vertical and horizontal axes,
“Shift” is displayed.
When you move the screen,
the box that represents the
display area also moves.
Procedure
Switching between Zooming and Moving the Displayed Waveform
Using the rotary knob and ENTER, select OTDR.
1.
Press SETUP and then the Scale soft key to display the following screen.
2.
Waveform Display
Explanation
IM AQ1200-01EN
Moving the Displayed Waveform
Press the arrow keys to move the displayed waveform.
1.
Note
You can move the displayed waveform during measurement or when measurements are stopped.
Shifting the Horizontal and Vertical Axes
You can move the screen by pressing the arrow keys.
Down arrow key: The screen moves down.
Up arrow key: The screen moves up.
Left arrow key: The screen moves left.
Right arrow key: The screen moves right.
Overview Display
The green box indicates where in the entire waveform display area the currently displayed waveform
area is.
5-5
Page 68

5.4 Initializing the Waveform Display Scale
Initializes the
display scales
Enables zooming
(See section 5.2.)
Enables moving in the vertical and
horizontal directions
(See section 5.3.)
Executes auto zoom
(See section 5.2.)
Set the amount the cursor moves
(Fine, Coarse).
See section 5.2.
Procedure
Initializing the Display Scale
Using the rotary knob and ENTER, select OTDR.
1.
Press SETUP and then the Scale soft key to display the following screen.
2.
Explanation
Initialization
When you initialize the display scale, the waveform is displayed with the total distance range that has
been specified.
5-6
IM AQ1200-01EN
Page 69

3
2
1
4
5
5.5 Setting the Waveform Information Display
Configure the shortcut key.
(See section 2.3.)
Set the marker mode (Marker, Line).
Set the event fix mode (Mode1, Mode2)
(See section 7.2)
Set the distance unit (km, mi(mile), kf(kfeet))*.
System setup screen
Display setup screen
Turns the ghost cursor display on or off
Turns the approximated line display on or off
Turns the marker information display on or off
Turns the event auto zoom on or off
Turns the scale display on or off
Turns the tooltip display on or off
Turns the cursor dB value display on or off
Set the pulse light output level (See section 3.7)
Set the cursor display method (CROSS(+), Line( )).
Select the events to display.
* Displayed when the language is not set to “Japanese”
in the system setup.
If set to “Japanese,” you can select whether to display
the return loss or reflection level for the reflection
value. (See section 5.5 in IM AQ1200-01JA.)
Example of when the distance unit is set to mile
All the distance units on the screen become miles (mi).
Procedure
Waveform Display Information Setup Screen
Using the rotary knob and ENTER, select OTDR.
1.
Press SETUP, the System Setup soft key, and then the OTDR soft key to display the following
2.
screen.
Waveform Display
Distance Unit
Explanation
You can select the distance unit that is displayed on the screen from the units shown below. If you set
the AQ1200 language to JAPANESE, the distance unit is fixed to km.
km, mile, kfeet
IM AQ1200-01EN
5-7
Page 70

Marker
Line
dB value
Scale display on
Scale display off
Scale value
5.5 Setting the Waveform Information Display
Marker Mode
Marker
Move the cursor to the location that you want to measure, and set a marker. When you are
measuring return loss and splice loss, they are calculated automatically when you set all the
markers that are necessary for the measurement method that you are using.
Line
After you select the line marker that you want to operate from a set of multiple line markers, move
the selected line marker directly. The value of the line marker’s section is calculated, and the return
loss and splice loss are measured. Each value is calculated in real time as you move the line
marker.
Note
Line is often used outside of Japan. Marker is often used within Japan. It is used on existing YOKOGAWA
models.
Displaying the Cursor dB Values
You can display not only the distance at the cursor position, but also the dB value.
Off: Only the distance at the cursor position is displayed.
On: The distance and the dB value at the cursor position are displayed.
Displaying the Scale
You can display the scale values on the vertical and horizontal axes.
Off: The scale values are not displayed.
On: The scale values are displayed.
5-8
IM AQ1200-01EN
Page 71

3
2
1
4
5
Ghost cursor
Turn the rotary knob to move to the next secondary reflection detection point.
Secondary reflection
Distance 2L
Distance L
Optical fiber cable connection
I
II
III
A
B
A
C
D
C
D
5.5 Setting the Waveform Information Display
Ghost Cursors
Ghost cursors are used to check for secondary reflections. A secondary reflection is a reflection that is
detected in a location where no event actually occurs.
Off: Ghost cursors are not displayed.
On: Ghost cursors are displayed.
Waveform Display
How Secondary Reflections Are Generated
The optical pulse that is generated from position I in the following figure propagates in the direction
of II.
↓
Light ray A that is reflected at connection II is reflected again a
direction of II as light ray B.
At this point, the AQ1200 detects A as an event.
↓
B is again reflected by connection II, and this generates reflected light ray C. At this point, the
AQ1200 detects C as an event.
Because the AQ1200 measures all the reflected light rays, A, C, and D, C is also detected as an
event in the same manner that an actually generated reflection is. Therefore, while there is no
actual event in this location, it appears as if an event has in fact occurred.
t connection I and propagates in the
IM AQ1200-01EN
5-9
Page 72

Approximated lines
Marker information
Tooltip
5.5 Setting the Waveform Information Display
Approximated Lines
In the 4 Point or 5 Point marker modes, you can display the approximated lines that are used to
calculate splice loss or return loss.
Off: Approximated lines are not displayed.
On: Approximated lines are displayed.
Marker Information
You can display the distance from the measurement reference point to each marker on the waveform
display area.
Off: Marker information is not displayed.
On: Marker information is displayed.
Event Auto Zoom
When events have been detected, you can zoom in on the event at the cursor position or the selected
event. Each time that you select a different event, the zoom ratio of the vertical and horizontal axes is
adjusted automatically. For details about event editing, see section 7.2.
Tooltips
You can configure the AQ1200 to display an explanation screen (Tooltip) for each measurement
condition when it is selected.
Off: Tooltips are not displayed.
On:
Tooltips are displayed.
5-10
IM AQ1200-01EN
Page 73
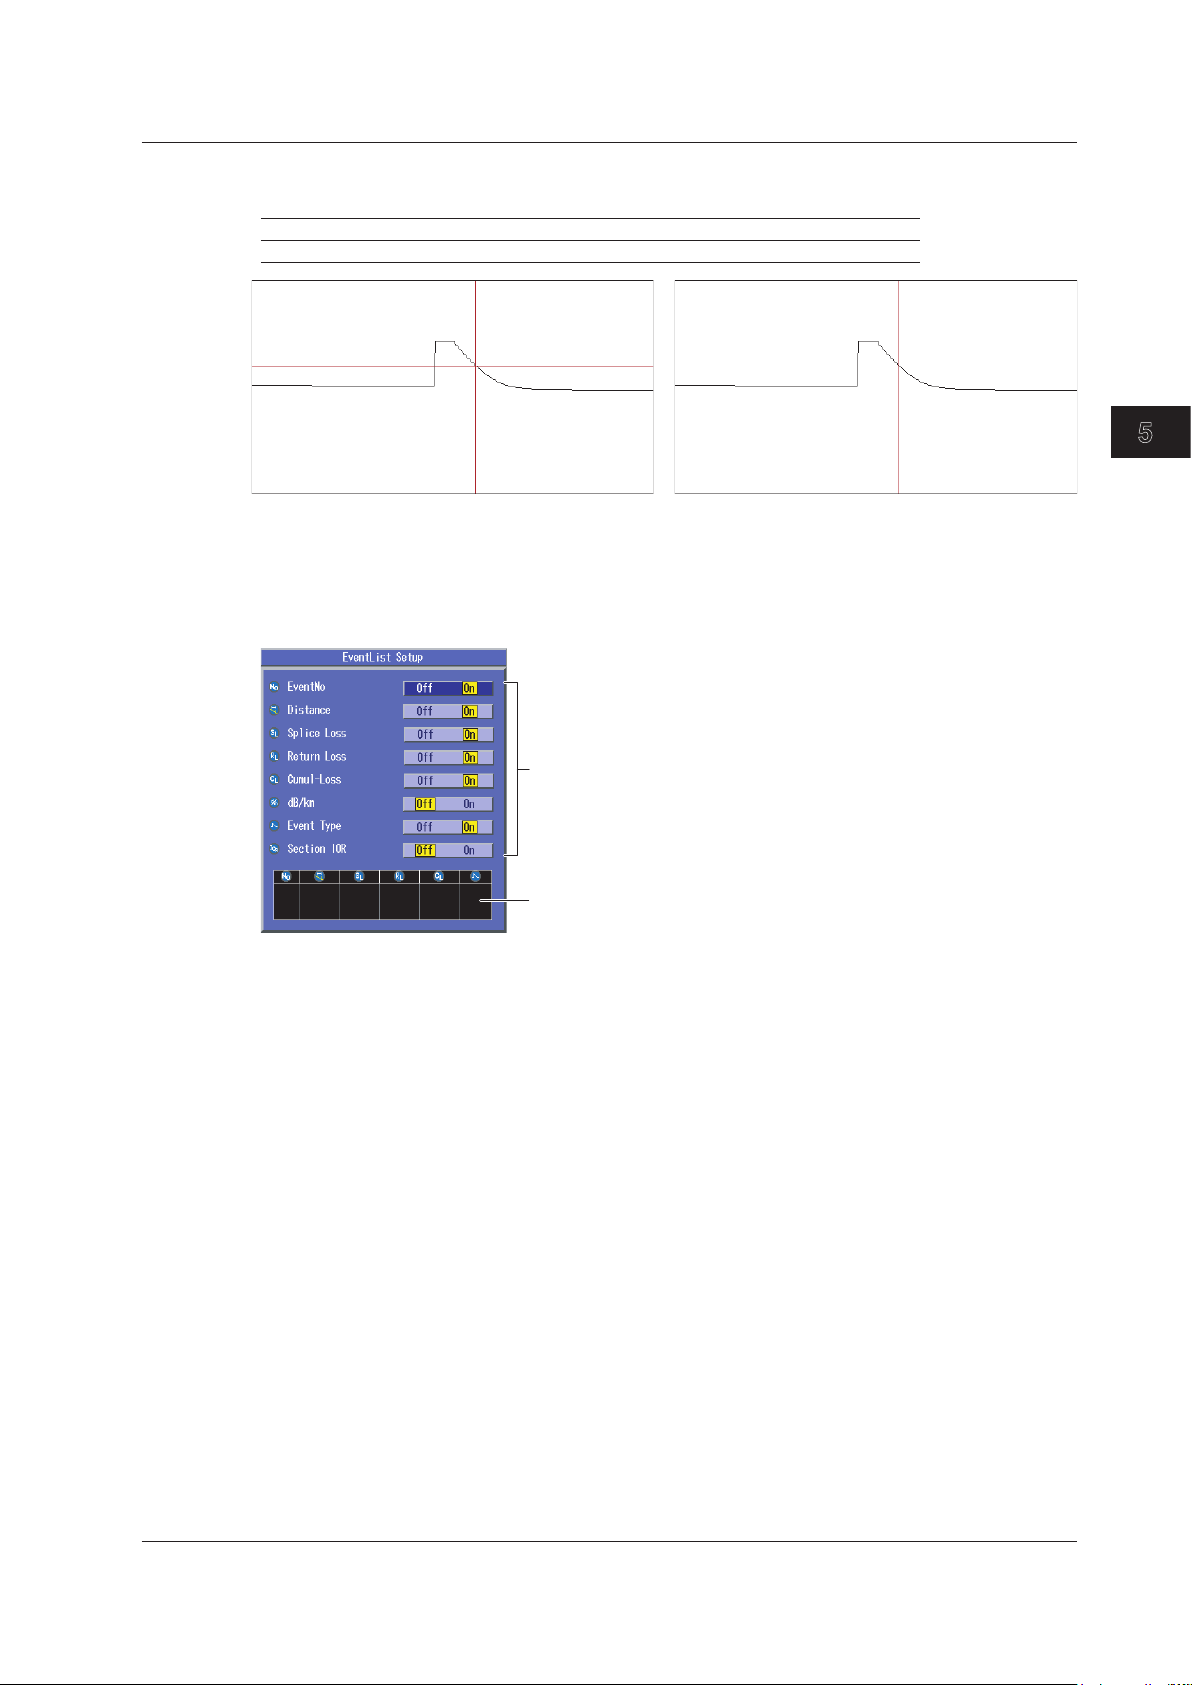
3
2
1
4
5
Crosshair display
Line display
Select the items to display.
Preview
5.5 Setting the Waveform Information Display
Selecting the Cursor Type
You can select the cursor type from the following:
Cross(+) Uses a crosshair to indicate a position on the waveform.
Line( ¦ ) Uses a line to indicate a position on the waveform.
Event List
In event analysis, you can select which items to display in the event list of the event screen. Up to six
items can be displayed in the event list.
Waveform Display
IM AQ1200-01EN
5-11
Page 74
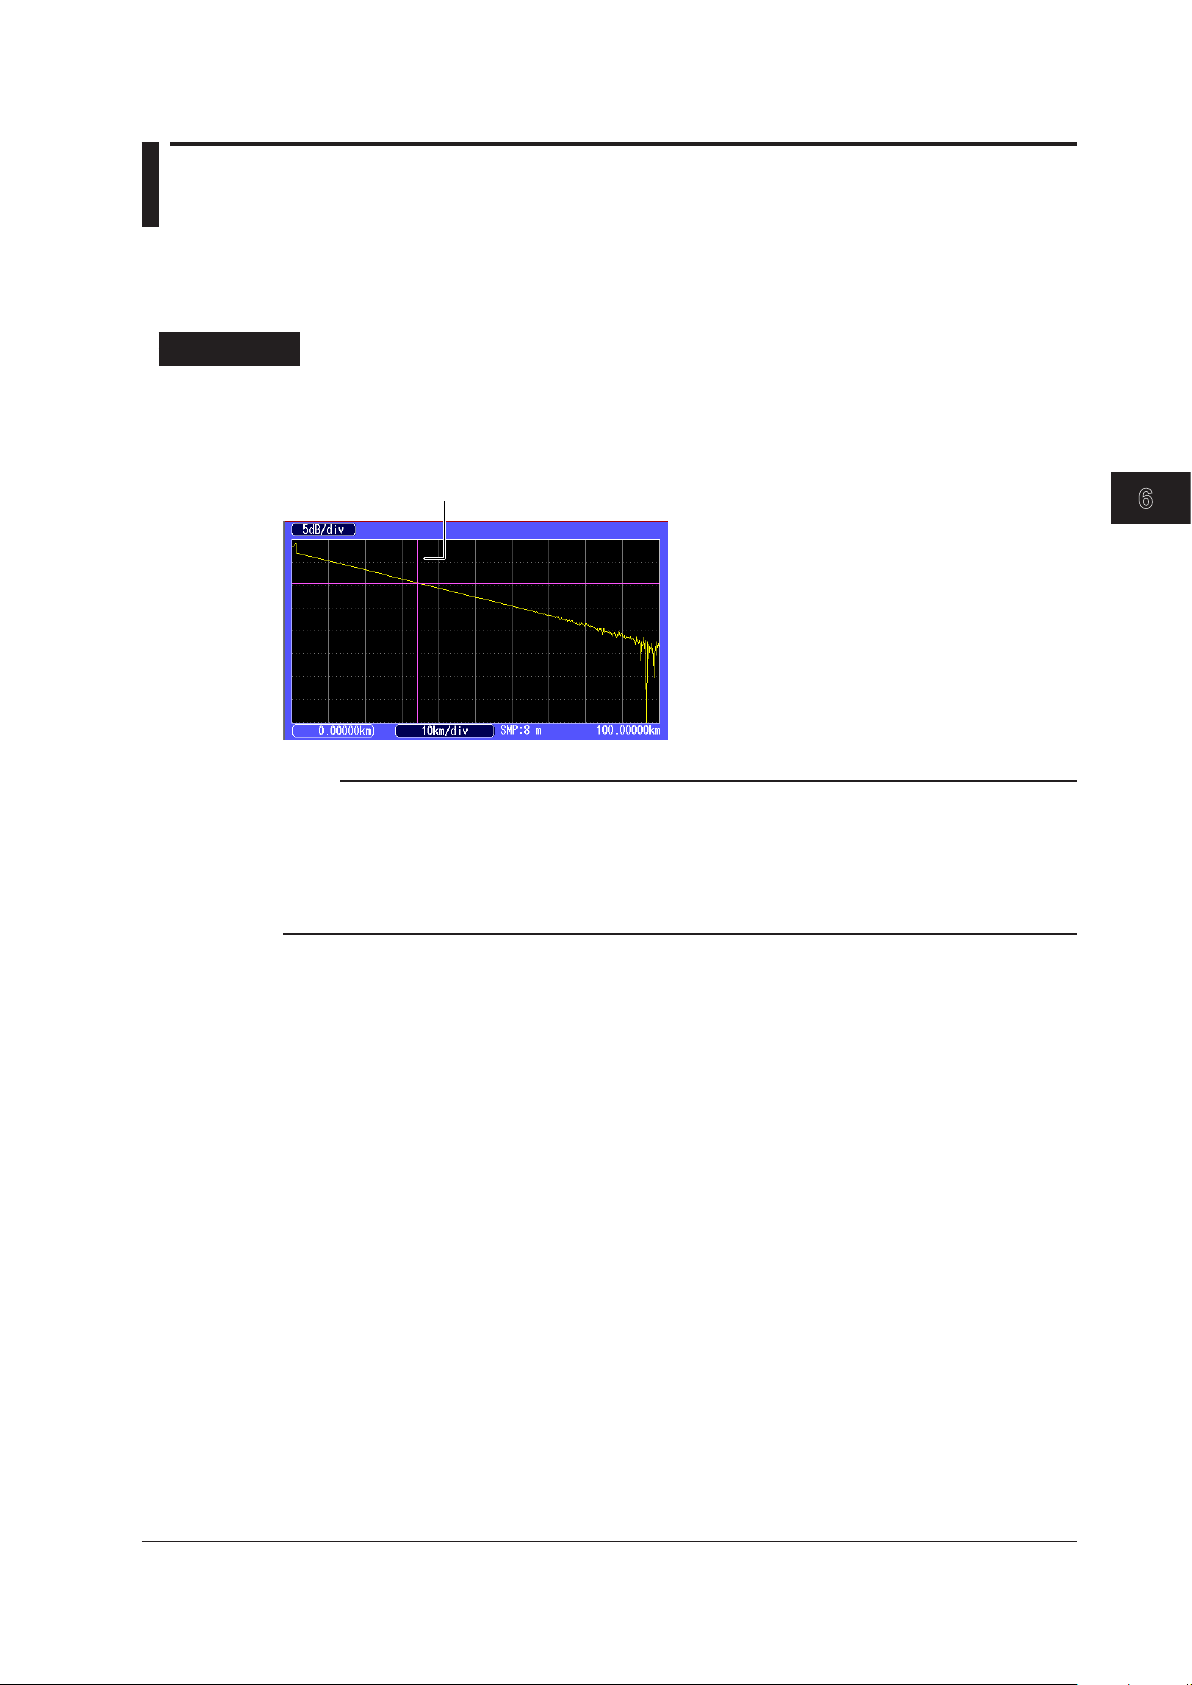
3
2
1
4
5
6
Cursor
Chapter 6 Waveform Analysis
6.1 How to Operate the Cursor and Markers
You can use markers to measure values such as the distance, splice loss, or return loss between two
points. This section will explain how to operate the cursor and markers. For information on the splice
loss and return loss measurements, see sections 6.2 and later.
Procedure
Displaying and Moving the Cursor
Using the rotary knob and ENTER, select OTDR to display the following screen.
1.
Turn the rotary knob to display the cursor.
2.
Waveform Analysis
Note
• The direction that the cursor moves differs depending on the direction that you rotate the rotary knob.
Clockwise: The cursor moves to the right.
Counterclockwise: The cursor moves to the left.
• If you turn the rotary knob counterclockwise to the point where the cursor reaches the left side of the
screen, the cursor will disappear. If you reach the final measured point, the cursor will not move forward
even if you turn the rotary knob clockwise.
Setting the Amount That the Cursor Moves
If you assign Coarse/Fine to a shortcut key, you can select whether the cursor moves a large amount
or a small amount each time that you turn the rotary knob.
Coarse: The cursor moves a large amount.
Fine:
The cursor moves a small amount.
For the shortcut key setup procedure, see section 2.3.
IM AQ1200-01EN
6-1
Page 75
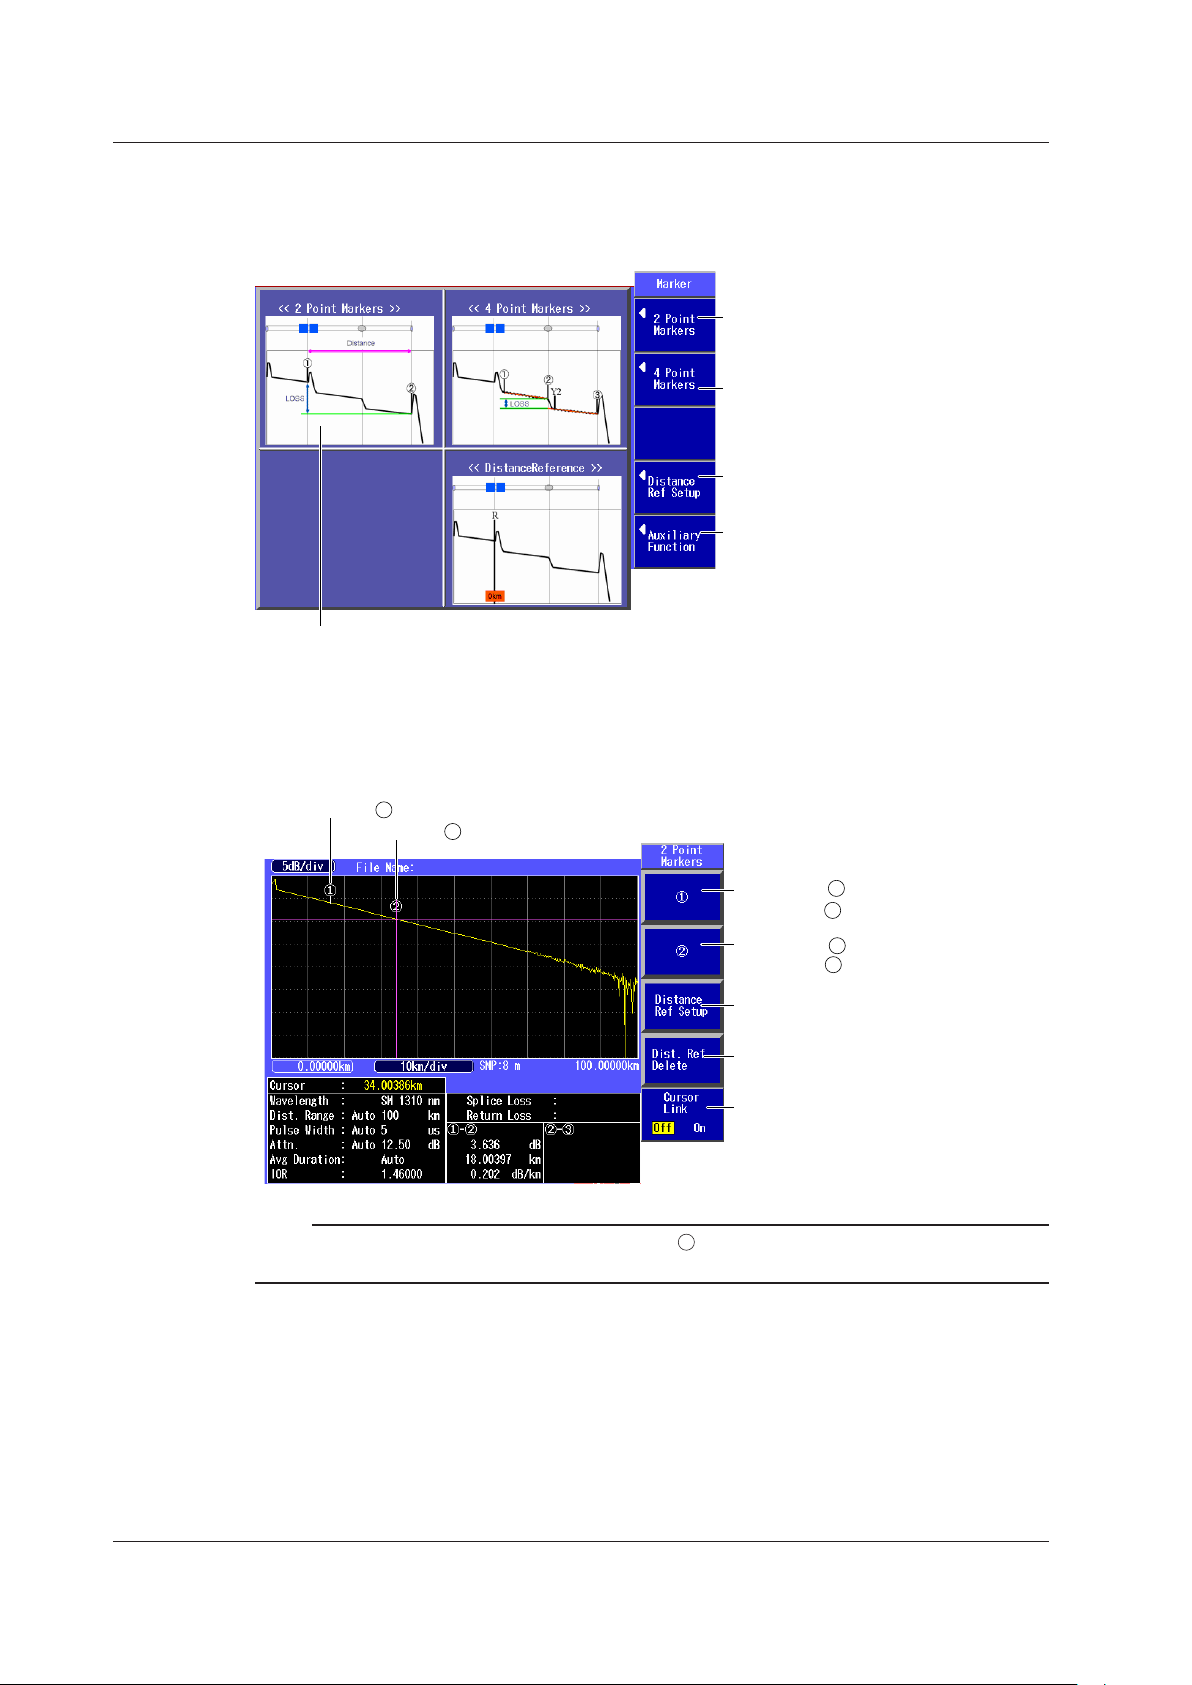
Press to switch to the screen that is
used to measure the two-point markers.
See “2 Point” later in this section.
Press to switch to the screen that is
used to measure the four-point markers.
See “4 Point” later in this section.
Switches to the screen that is used to
move the measurement reference point
Switches to the screen that is used
to delete markers and the cursor
A marker measurement outline is displayed
on the screen. For details, see “Explanation”
later in this section.
1
2
Set marker .
Set marker to the cursor position.
Set marker .
Set marker to the cursor position.
See “Distance Reference” later in this
section.
See “Distance Reference” later in this
section.
Turns the cursor link on or off
Marker
2
Marker
1
2
1
6.1 How to Operate the Cursor and Markers
Displaying Markers (Marker mode: Marker)
Using the rotary knob and ENTER, select OTDR.
1.
Press the Marker soft key to display the following screen.
2.
2 Point Markers
Press the 2 Point Markers soft key shown above to display the following screen.
3.
Note
When you set the marker positions, set them so that the 1 marker is the measurement start point (the
distance reference).
6-2
IM AQ1200-01EN
Page 76

3
2
1
4
5
6
2
Set marker .
Set marker to the cursor position.
Set marker .
Set marker to the cursor position.
Turns the cursor
link on or off
Marker
2
Marker
Set marker Y2.
Set marker Y2 to the cursor position.
3
Set marker .
Set marker to the cursor position.
Marker Y2
3
Marker
1
1
Press to set all markers
together.
See “Distance Reference”
later in this section.
See “Distance Reference”
later in this section.
1
2
3
Set the distance reference.
Set the distance reference
(marker R) to the cursor position.
Delete the distance reference.
Delete the distance reference (marker R).
6.1 How to Operate the Cursor and Markers
4 Point Markers
Press the 4 Point Markers soft key shown on the previous page to display the following screen.
3.
Waveform Analysis
Note
Set the markers in the order shown above, starting with the measurement start point (the distance reference).
Distance Reference
Press the Distance Ref Setup soft key shown on the previous page to display the following
3.
screen.
IM AQ1200-01EN
Note
The color of the displayed waveform to the left of the specified distance reference changes.
6-3
Page 77
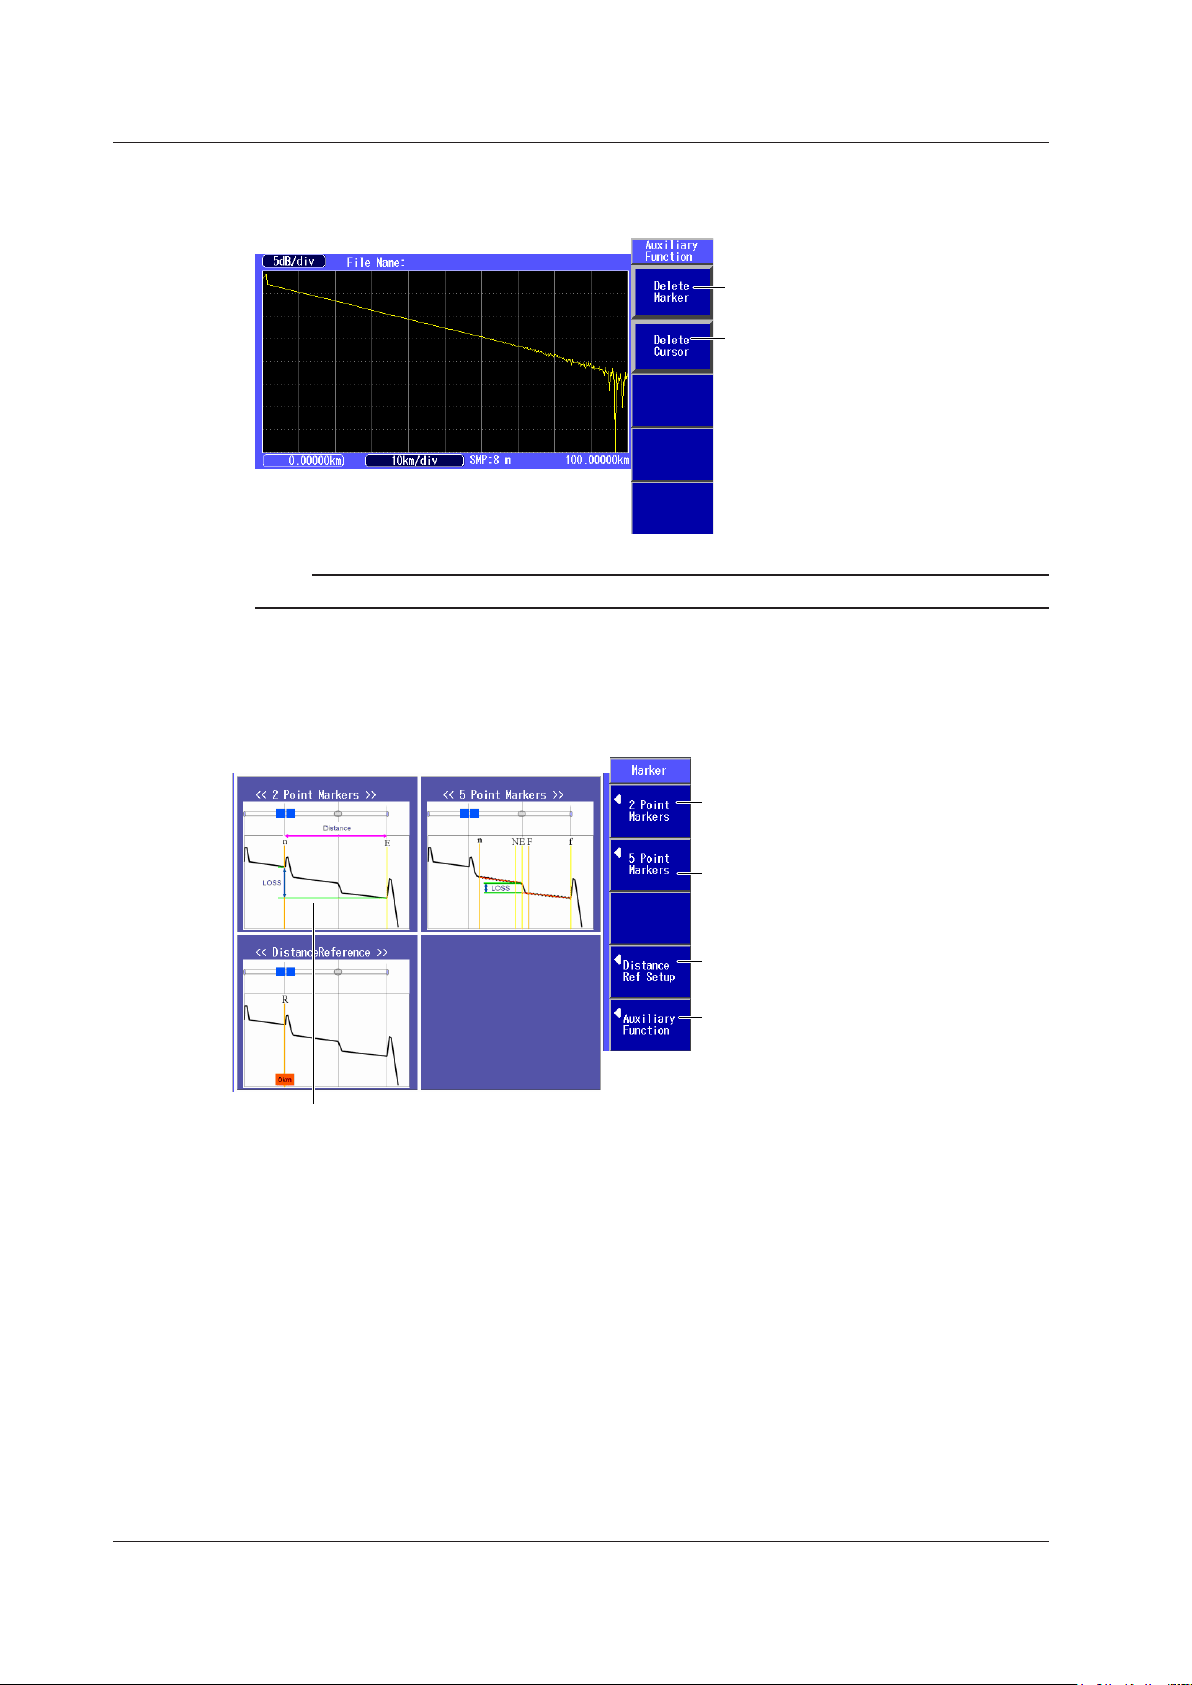
Delete the markers.
Delete the cursor.
Press to switch to the screen that is
used to measure the two-point markers.
See “2 Point” later in this section.
Press to switch to the screen that is
used to measure the five-point markers.
See “5 Point” later in this section.
Switches to the screen that is used to
move the measurement reference point
Switches to the screen that is used to
delete markers and the cursor
A marker measurement outline is
displayed on the screen. For details, see
“Explanation” later in this section.
6.1 How to Operate the Cursor and Markers
Deleting Markers or the Cursor
Press the Auxiliary Function soft key shown on page 6-2 to display the following screen.
3.
Note
For details on the marker modes, see section 5.5.
Displaying Markers (Marker mode: Line)
Using the rotary knob and ENTER, select OTDR.
1.
Press the Marker soft key to display the following screen.
2.
6-4
IM AQ1200-01EN
Page 78
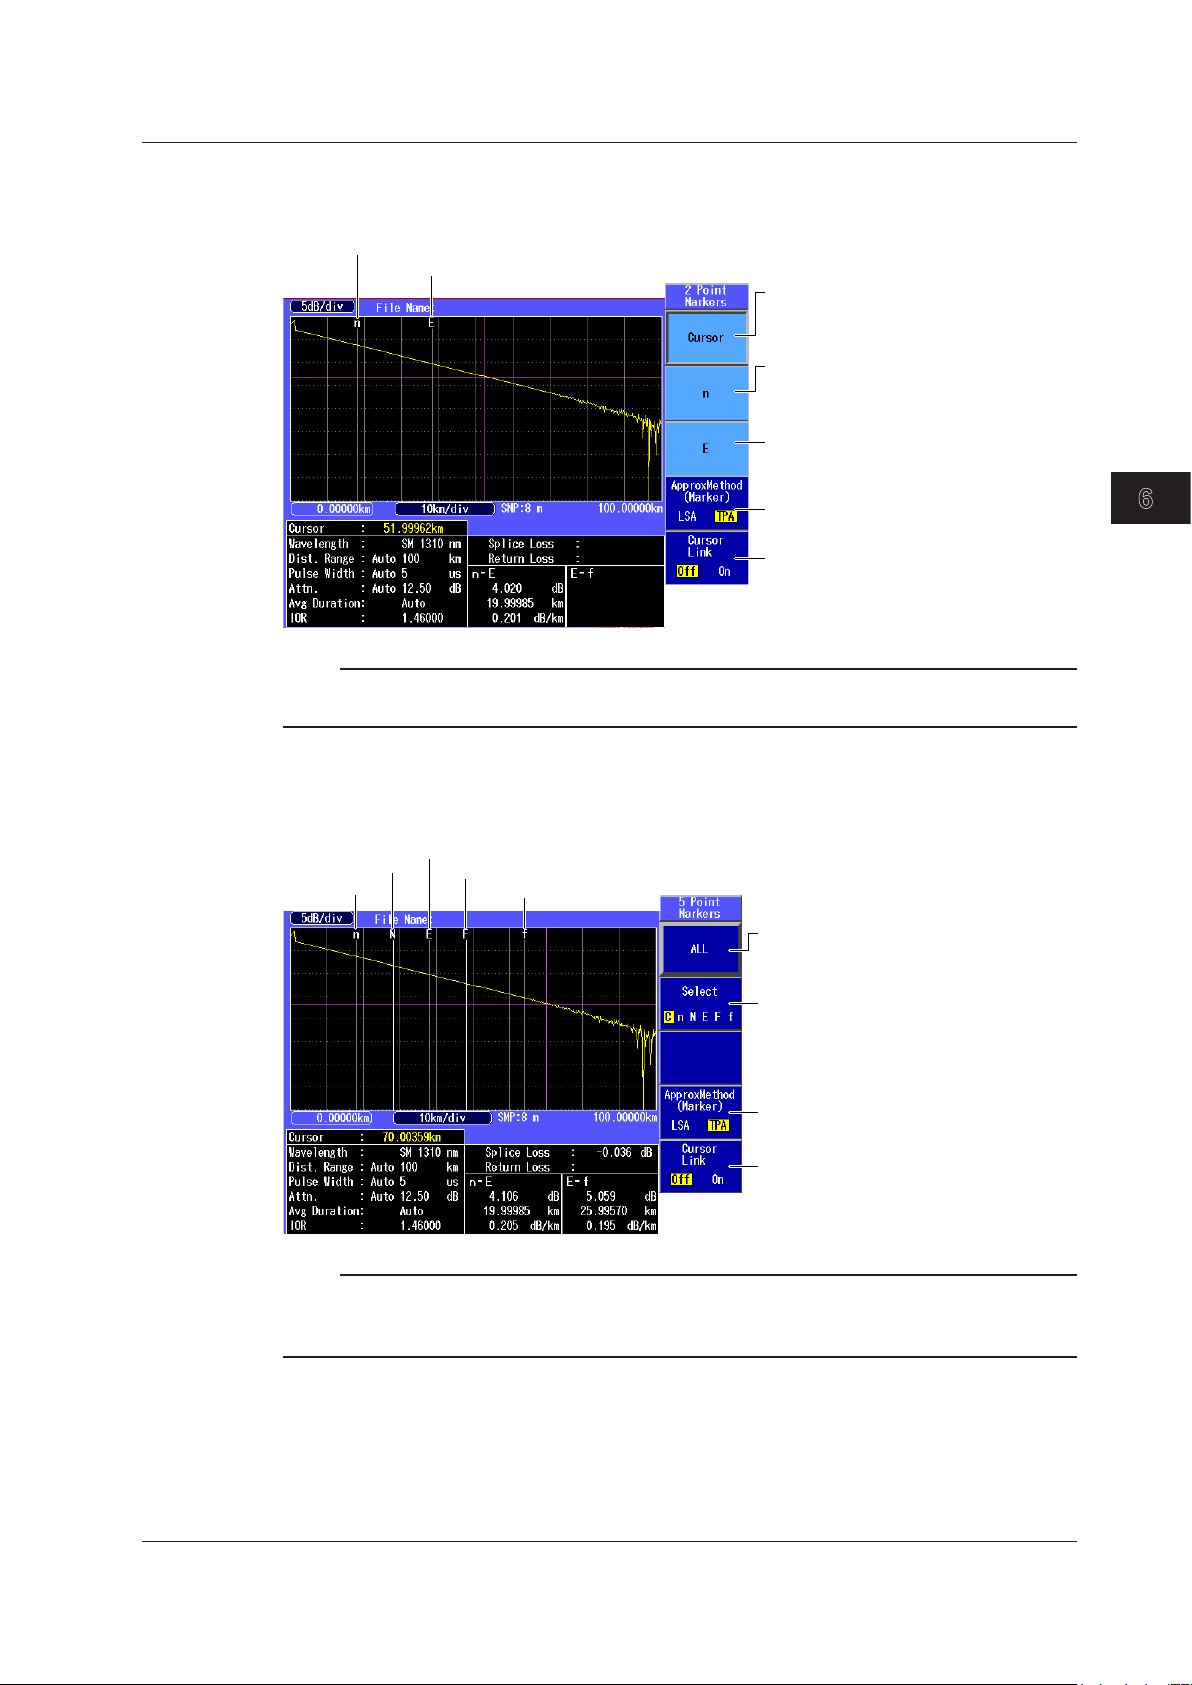
3
2
1
4
5
6
Set the cursor.
Turn the rotary knob to display and
then move the cursor.
Set marker n.
Turn the rotary knob to display and
then move marker n.
Set the approximation method
(see section 3.4).
Turns the cursor link on or off
Marker n
Marker E
Set marker E.
Turn the rotary knob to display and
then move marker E.
Press to set all markers
together.
All markers are displayed together.
Select the marker.
Press this soft key to select the
marker that you are operating.
Set the approximation method
(see section 3.4).
Turns the cursor link on or off
Marker n
Marker E
Marker N
Marker F
Marker f
6.1 How to Operate the Cursor and Markers
2 Point Markers
Press the 2 Point Markers soft key shown on the previous page to display the following screen.
3.
Note
When you set the marker positions, set them so that the n marker is the measurement start point (the
distance reference).
Waveform Analysis
IM AQ1200-01EN
5 Point Markers
Press the 5 Point Markers soft key shown on the previous page to display the following screen.
3.
Note
• Only perform collective settings on all the markers when the cursor is displayed.
• Press the soft key to select either the cursor or a marker, and then turn the rotary knob to display and
move it. “C” represents that the cursor is selected.
6-5
Page 79
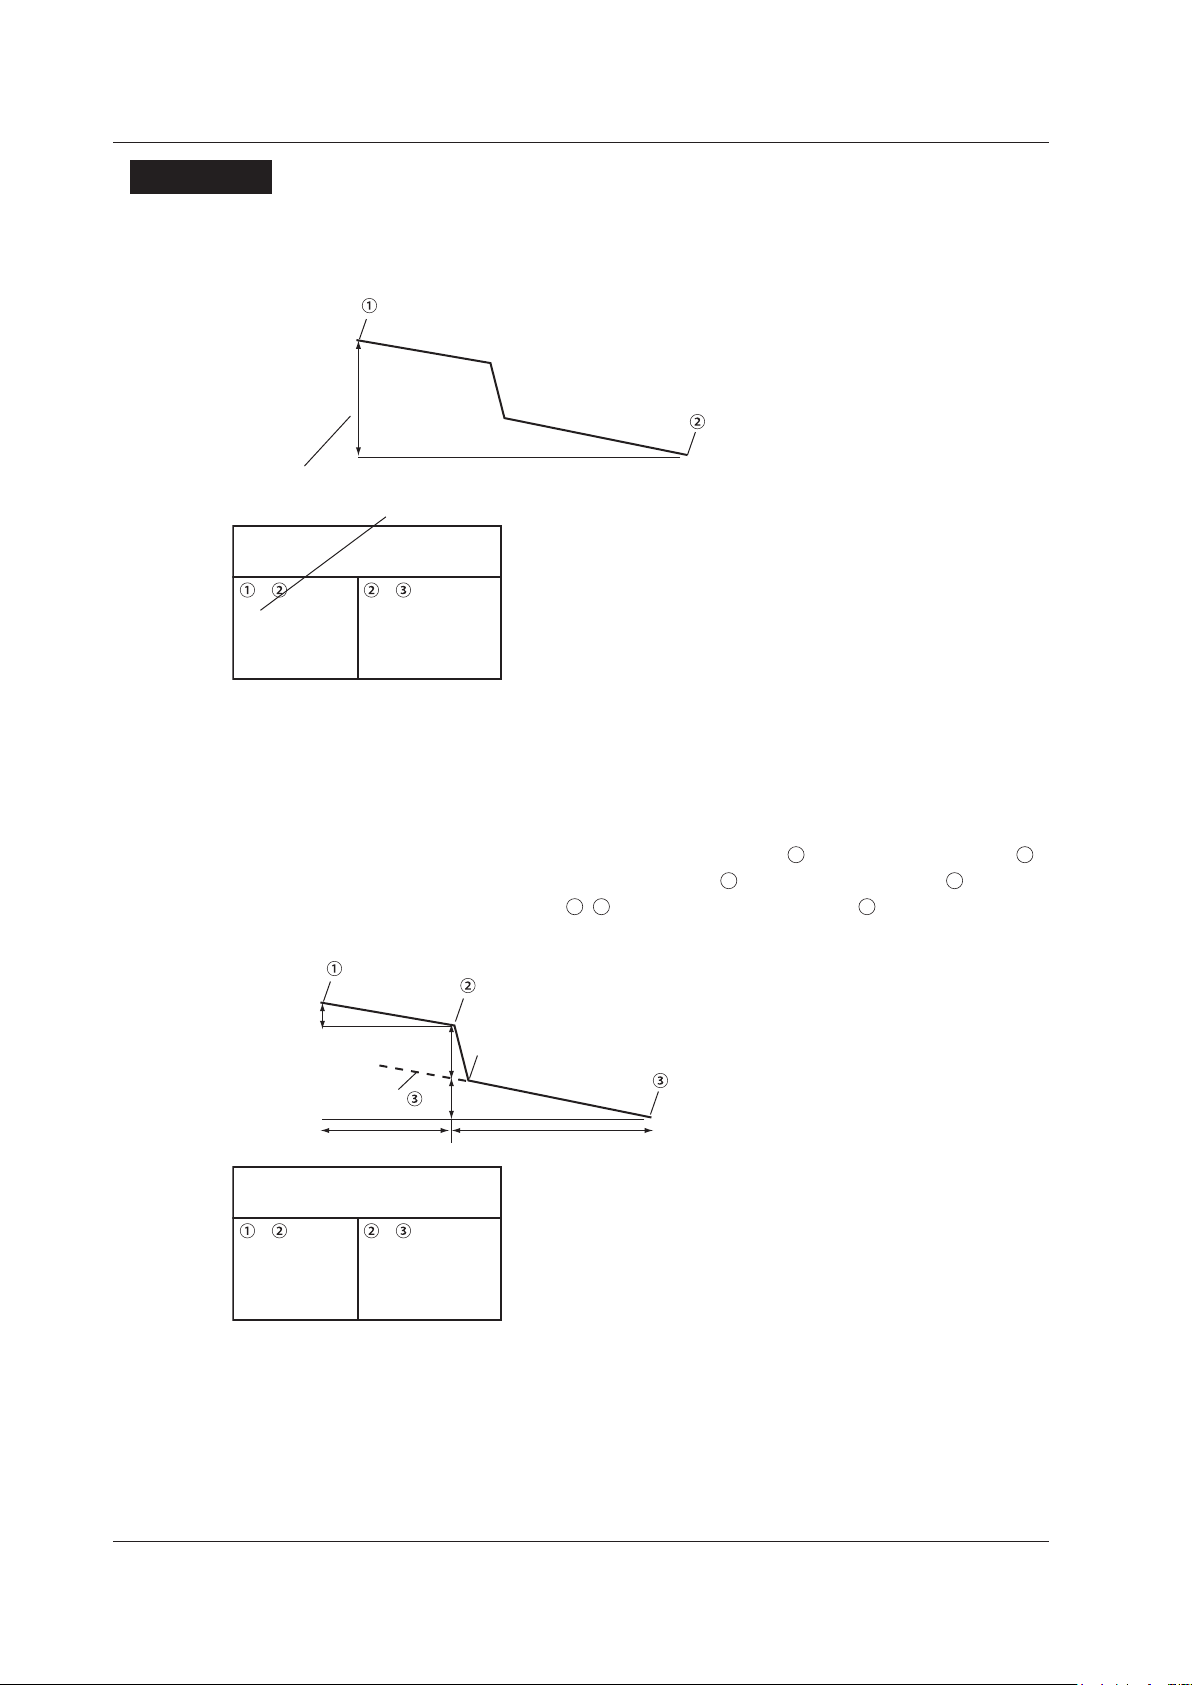
Splice loss (total loss)
20 km (example)
20 dB (example)
(n in Line mode.)
(E in Line mode.)
Splice loss:
Return loss:
– –
20
20
1
dB
km
dB/km
Splice loss
1
3
1–2
Y2
b
a
e
c f
Approximated line Y2–
Splice loss:
Return loss:
b
c
b/c
dB
km
dB/km
a dB
e
f
e/f
dB
km
dB/km
– –
6.1 How to Operate the Cursor and Markers
Explanation
2 Point Markers
The AQ1200 measures the distance and the loss between two points. If reflection is detected between
the two points, the return loss is also measured.
The measured loss value differs depending on the specified approximation method. For details on the
approximation methods, see section 3.6.
4 Point Markers
This mode is only enabled when the Marker Mode is set to Marker. The AQ1200 uses the following
four points to perform the measurement: the measurement start point
the splice loss end point Y2, and the measurement end point
difference between the approximated line
and the approximated line Y2–3 is calculated as the
. At the position of marker 2, the level
splice loss.
, the splice loss start point 2,
6-6
IM AQ1200-01EN
Page 80

3
2
1
4
5
6
n
NfF
a
b
c
e
f
Approximated line F–f
Approximated line n–N
E
Splice loss:
Return loss:
b
c
b/c
dB
km
dB/km
a dB
e
n – E E – f
f
e/f
dB
km
dB/km
6.1 How to Operate the Cursor and Markers
5 Point Markers
This mode is only enabled when the Marker Mode is set to Line. The AQ1200 uses the following five
points to perform the measurement: the near-end point (n), a point (N) that is used to calculate the
near-end side’s approximated line, a point (E) where splice loss is detected, a point (F) that is used to
calculate the far-end side’s approximated line, and the far-end point (f). At the position of marker E, the
level difference between the approximated line n–N and the approximated line F–f is calculated as the
splice loss.
Waveform Analysis
• The measured loss value differs depending on the specified approximation method.
• Set the correct position for the E line. The splice loss changes greatly depending on the position of E.
Distance Reference
Normally, the location where the AQ1200 and the optical fiber are connected is the measurement
reference point. This reference point is the distance reference. It is used to calculate the distance to
the cursor and markers. If you are using a dummy fiber to perform measurements, move the distance
reference the length of the dummy fiber before performing measurements.
Cursor Link (Moving all markers together)
You can move all markers while maintaining the distance between them.
IM AQ1200-01EN
6-7
Page 81

6.2 Measuring Distances
Cursor
Distance from the measurement start position to the cursor
Measurement start position
Distance between
markers
Distance between markers
By placing the cursor on the acquired waveform, you can measure the distance to events such as
reflections and splice losses.
Procedure
Using the Cursor to Measure the Distance
Follow the procedure below to measure the distance between the distance reference and the cursor.
Using the rotary knob and ENTER, select OTDR to display the following screen.
1.
Turn the rotary knob to display the cursor.
2.
Move the cursor to a position where an event is displayed.
3.
Note
• For details on the cursor, see section 6.1.
• The location where the AQ1200 and the optical fiber are connected is the distance reference. To perform
more accurate measurements, zoom in on the waveform.
Using Markers to Measure the Distance
Follow the procedure below to measure the distance between two markers.
Using the rotary knob and ENTER, select OTDR.
1.
Press the Marker soft key and then the 2 Point Markers soft key to display the following
2.
screen.
Set marker 1 and marker 2 at positions where events are displayed.
3.
6-8
Note
• Place the markers so that marker 1 (or marker n if Marker Mode is set to Line) is the measurement
start point (the distance reference). (The figure shown above is an example where Marker Mode is set to
Marker.)
• For details on the soft keys, see section 6.1.
IM AQ1200-01EN
Page 82

3
2
1
4
5
6
6.3 Moving the Distance Measurement Reference
Distance reference (marker R)
Original reference
point
If you set the distance reference, the
distance from the distance reference
to the cursor is measured
Cursor
Point
Procedure
Moving the Distance Reference
Using the rotary knob and ENTER, select OTDR.
1.
Press the Marker soft key and then the Distance Ref Setup soft key to display the following
2.
screen.
Turn the rotary knob to move the distance reference (marker R) to the measurement start point.
3.
Waveform Analysis
Note
For details on the soft keys, see section 6.1.
IM AQ1200-01EN
6-9
Page 83

6.4 Measuring the Splice Loss
Measurement start position
Set marker .
1
Splice loss event start position
Set marker .
2
Splice loss event end position
Set marker Y2.
Measurement end position
Set marker .
3
Measured splice loss (result)
Near-end point
Set marker n.
Point that is used to calculate the
near-end side’s approximated line
Set marker N.
Point where splice loss is detected
Set marker E.
Far-end point
Set marker f.
Measured splice loss (result)
Point that is used to calculate the
far-end side’s approximated line
Set marker F.
Procedure
When Marker Mode Is Set to Marker
Using the rotary knob and ENTER, select OTDR.
1.
Press the Marker soft key and then the 4 Point Markers soft key to display the following
2.
screen.
When Marker Mode Is Set to Line
Using the rotary knob and ENTER, select OTDR.
1.
Press the Marker soft key and then the 5 Point Markers soft key to display the following
2.
screen.
Note
• For details on the soft keys, see section 6.1.
• For details on the marker modes, see section 5.5.
6-10
IM AQ1200-01EN
Page 84

3
2
1
4
5
6
6.5 Measuring the Return Loss
Event detection start position
Set marker .
1
Event detection end position
Set marker .
2
Measured return loss (result)
Peak value
The AQ1200 detects the peak
between the markers, and calculates
the level between the peak and the
rising start point of the event.
Event detection start position
Set marker n.
Event detection end position
Set marker E.
Measured return loss (result)
Peak value
The AQ1200 detects the peak
between the markers, and calculates
the level between the peak and the
rising start point of the event.
Procedure
When Marker Mode Is Set to Marker
Using the rotary knob and ENTER, select OTDR.
1.
Press the Marker soft key and then the 2 Point Markers soft key to display the following
2.
screen.
Waveform Analysis
When Marker Mode Is Set to Line
Using the rotary knob and ENTER, select OTDR.
1.
Press the Marker soft key and then the 2 Point Markers soft key to display the following
2.
screen.
IM AQ1200-01EN
Note
• For details on the soft keys, see section 6.1.
• For details on the marker modes, see section 5.5.
6-11
Page 85

6.5 Measuring the Return Loss
Explanation
Return Loss
• If “<” is displayed next to the return loss value, the measured waveform is saturated. If the waveform
is saturated, the actual reflection value is larger than the value shown. To prevent a waveform from
being saturated, you can:
•
Select a large attenuation value, and perform the measurement again.
• Select Hi-Reflection for the average method, and perform the
• Select a large pulse width value, and perform the measurement again.
• When reflections are small (less than or equal to about 0.5 dB), the return loss is not displayed.
measurement again.
6-12
IM AQ1200-01EN
Page 86

3
2
1
4
5
6
6.6 Displaying Multiple Traces
Load traces to display
in Trace 1 to Trace 4.
Load trace data.
The file operation screen appears
(see section 17.2).
Moves the trace up
Moves the display position of the
loaded trace up.
Moves the trace down
Moves the display position of the
loaded trace down.
Clears the displayed traces
Clears the display of the loaded traces.
Selects the current trace
(Trace 1, Trace 2, Trace 3,
Trace 4)
Procedure
Multi Trace Analysis Screen
Use the rotary knob and ENTER to select OTDR.
1.
Press the Advanced Analysis soft key and then the MultiTrace soft key. The MultiTrace menu
2
.
appears.
Waveform Analysis
Explanation
Loading Trace Data
Up to four traces can be loaded. Loaded traces are displayed on a single screen, so you can compare
them. The type of file that you can load is SOR.
Loaded traces are displayed in line with the current trace. They are displayed at the 0 m position on
the horizontal axis or so that their distance references match that of the current trace. Each loaded
trace can be moved vertically as you like.
Current Trace
You can select the current trace from Trace 1 to Trace 4.
When you expand or reduce the current trace, other traces are adjusted accordingly.
Cursors are displayed on the current trace. Return loss and splice loss that are displayed in the
measurement conditions are those of the current trace.
IM AQ1200-01EN
6-13
Page 87
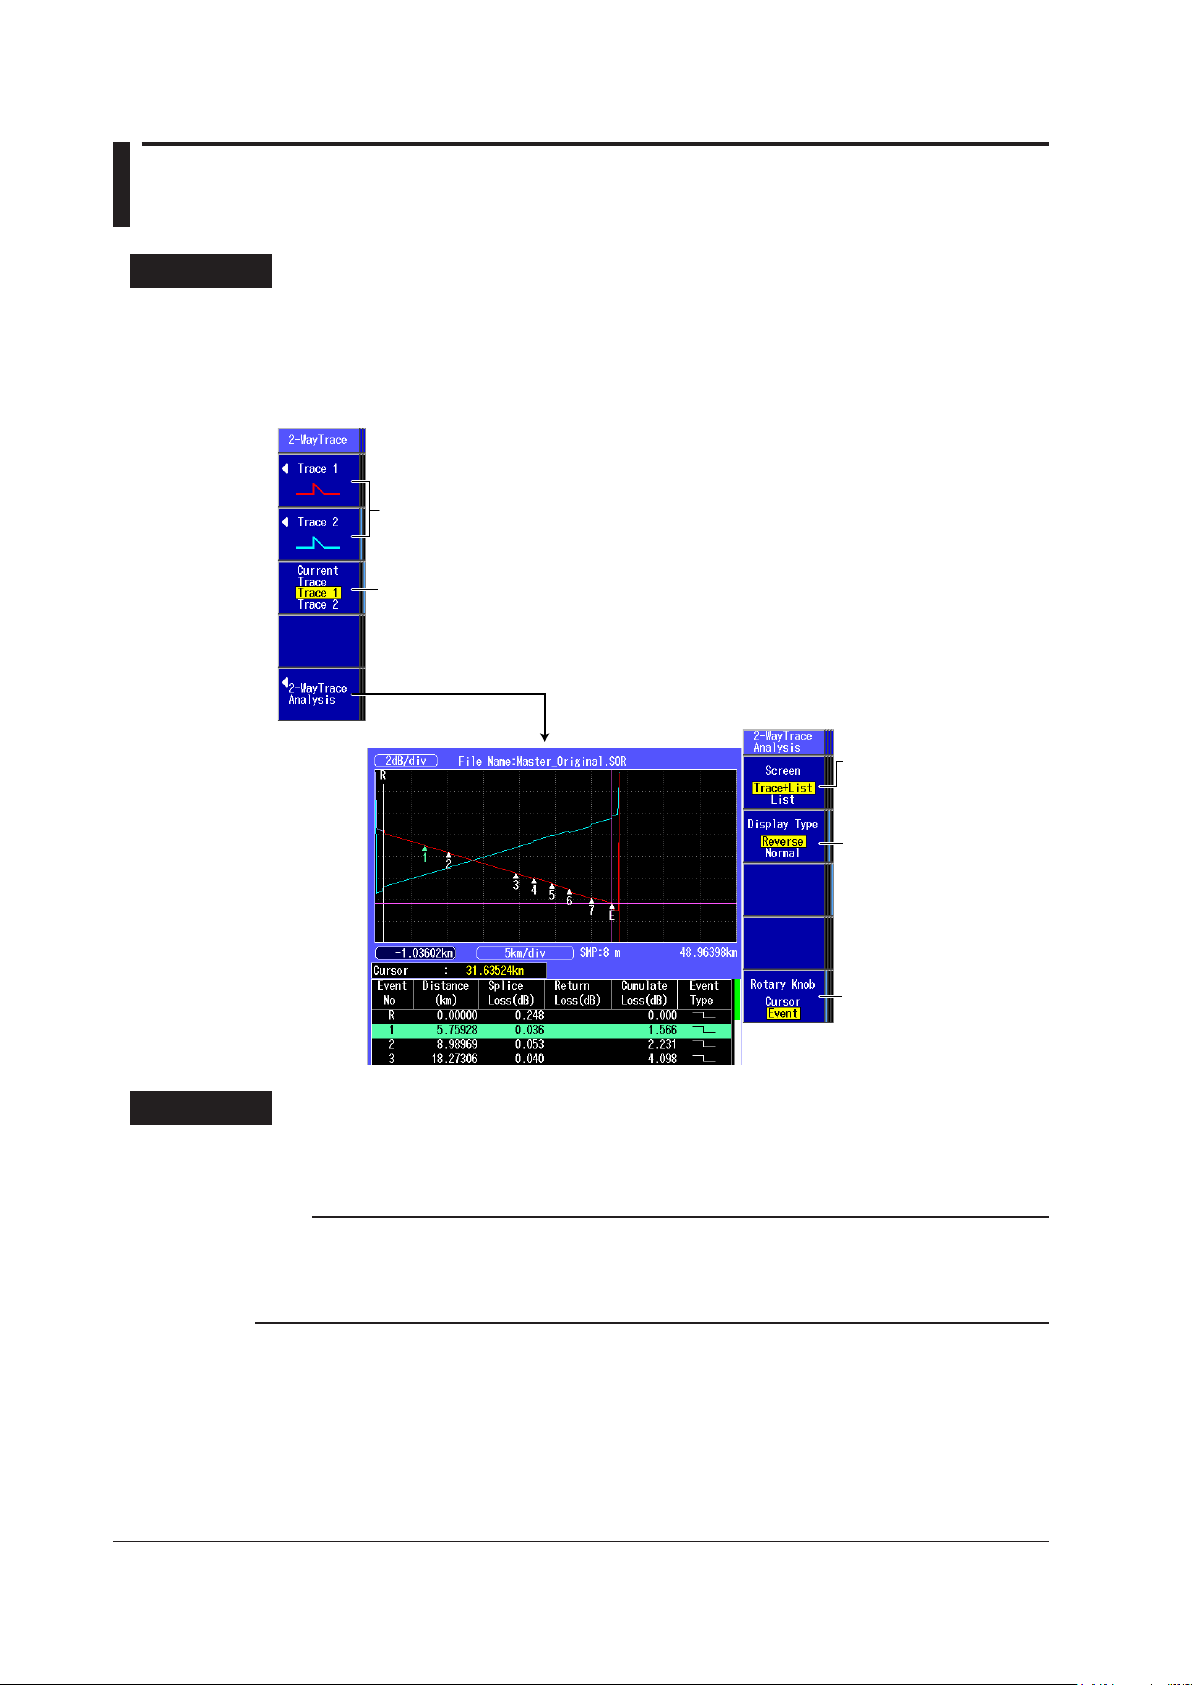
6.7 Combining Two Traces
Selects the current trace
(Trace 1, Trace 2)
Executes 2 way trace analysis
The event screen of 2 way trace analysis appears.
Load traces to display in Trace 1 and Trace 2.
The file operation screen appears
(see section 17.2).
Screen
(Trace+List, List)
See section 7.1.
Display type
(Reverse, Normal)
Selects the rotary knob
function (Cursor, Event)
Procedure
2-WayTrace Screen
Use the rotary knob and ENTER to select OTDR.
1.
Press the Advanced Analysis soft key and then the 2-WayTrace soft key. The following screen
2
.
appears.
Explanation
Loading Trace Data
The type of file that you can load is SOR.
Note
Traces that meet the following conditions can be combined.
• Event lists are available.
• The wavelengths and pulse widths of the two traces are the same.
• The distances from the measurement reference (S) to the end event (E) are the same.
6-14
Current Trace
The current trace can be set to one of the combined traces.
Cursors are displayed on the current trace.
IM AQ1200-01EN
Page 88

3
2
1
4
5
6
Top trace
(end A → end B)
Bottom trace
(end A ← end B)
Distance reference
(0 m position)
of the bottom trace
End point of the top trace
▲
▲
1
2
▲
2
▲
3
6.7 Combining Two Traces
Event Screen of 2 Way Trace Analysis
The horizontal axes of the combined traces are aligned so that the end point of the top trace (end A →
end B) match the 0 m position (distance reference) of the bottom trace (end A ← end B).
As shown in the above figure, markers are added only to the trace in which events are found.
Event numbers are the same as the event list numbers after the combining of the traces.
Display Type
• Reverse: The display direction of the trace that is not the current trace is reversed.
• Normal: The display direction of the trace that is not the current trace is not reversed.
Waveform Analysis
IM AQ1200-01EN
6-15
Page 89

6.8 Displaying Differential Traces
Selects the current trace
(Trace 1, Trace 2)
Executes differential trace analysis
The differential trace analysis screen appears.
Load traces to display in Trace 1 and Trace 2.
The file operation screen appears
(see section 17.2).
When marker mode is set to Marker When marker mode is set to Line
Procedure
Differential Trace Screen
Use the rotary knob and ENTER to select OTDR.
1.
Press the Advanced Analysis soft key and then the Diff. Trace soft key. The following screen
2
.
appears.
Explanation
Loading Trace Data
The type of file that you can load is SOR.
Note
A differential trace of traces that meet the following conditions can be displayed.
• Sample interval
• Measurement start position
Current Trace
The current trace can be set to one of the traces that are used for taking the difference.
Cursors are displayed on the current trace. Return loss and splice loss that are displayed in the
measurement conditions are those of the current trace.
6-16
IM AQ1200-01EN
Page 90

3
2
1
4
5
6
6.8 Displaying Differential Traces
Differential Trace Analysis
The differential trace is the result of subtracting the values of the current trace from those of the other
trace.
Marker Features
You can place cursors and markers on the differential trace.
You can display the distance at each cursor position as well as the following values between
markers.
• Loss (dB)
• Distance (km)
• dB/km
For the operations when marker mode is set to Marker, see “4 Point Markers” in section 6.1.
•
• For the operations when marker mode is set to Line, see “5 Point Markers” in section 6.1.
• The return loss and splice loss of differential traces cannot be saved.
Waveform Analysis
IM AQ1200-01EN
6-17
Page 91

6.9 Analyzing Sections
Analysis start position
Set marker S.
Analysis end position
Set marker E.
Set the start point.
Set the start point marker to the cursor
position.
Set the end point.
Set the end point marker to the cursor
position.
Specify from markers.
When the and markers or the n and
E markers are already present, change
these markers to the start point and end
point markers.
1 2
Press to configure more settings.
See “Adjusting the Reference Level” below.
Set the approximation method
(see section 3.4).
Section S–E analysis
results
Marker position
Set the reference level adjustment.
Set marker to the cursor position.
Clear the settings.
Press this to delete the start point,
end point, and reference level
adjustment markers.
B
B
B
Marker
This is the reference point for the return loss measurement. The measured value
between S and E is the splice loss, but the measured value between and E is the
return loss. In the example shown here, the return loss from the event detection point
onwards is being measured.
B
Measured value between and E
Follow the procedure below to measure the return loss and the total loss for the specified section.
Procedure
Section Analysis Screen
Using the rotary knob and ENTER, select OTDR.
1.
Press the Advanced Analysis soft key, and then the Section Analysis soft key to display the
2.
following screen.
6-18
Adjusting the Reference Level
Press the More soft key to display the following screen.
3.
IM AQ1200-01EN
Page 92

3
2
1
4
5
6
Explanation
1
Section Analysis
In sections 6.2 to 6.5, each item was measured with the distance reference as the reference point, but
in section analysis, each item is measured with the location that is specified as the start point within
the specified section as the reference point.
The distance, return loss, total loss, and loss per division (dB/km) between the S and E markers are
displayed on the screen.
Marker Auto Setup
You can automatically set marker 1 or marker n as the start point and marker 2 or marker E as the
end point.
You can use this feature to automatically set markers on waveform data in which marker
and E are already set.
Adjusting the Reference Level
If you set marker B, which represents the reference point, the return loss is measured with this
location as the reference. The AQ1200 uses the backscattering light level of the reference point to
calculate the return loss. If you do not set the reference point, the start point is used as the reference
point.
6.9 Analyzing Sections
and 2 or n
Waveform Analysis
IM AQ1200-01EN
6-19
Page 93
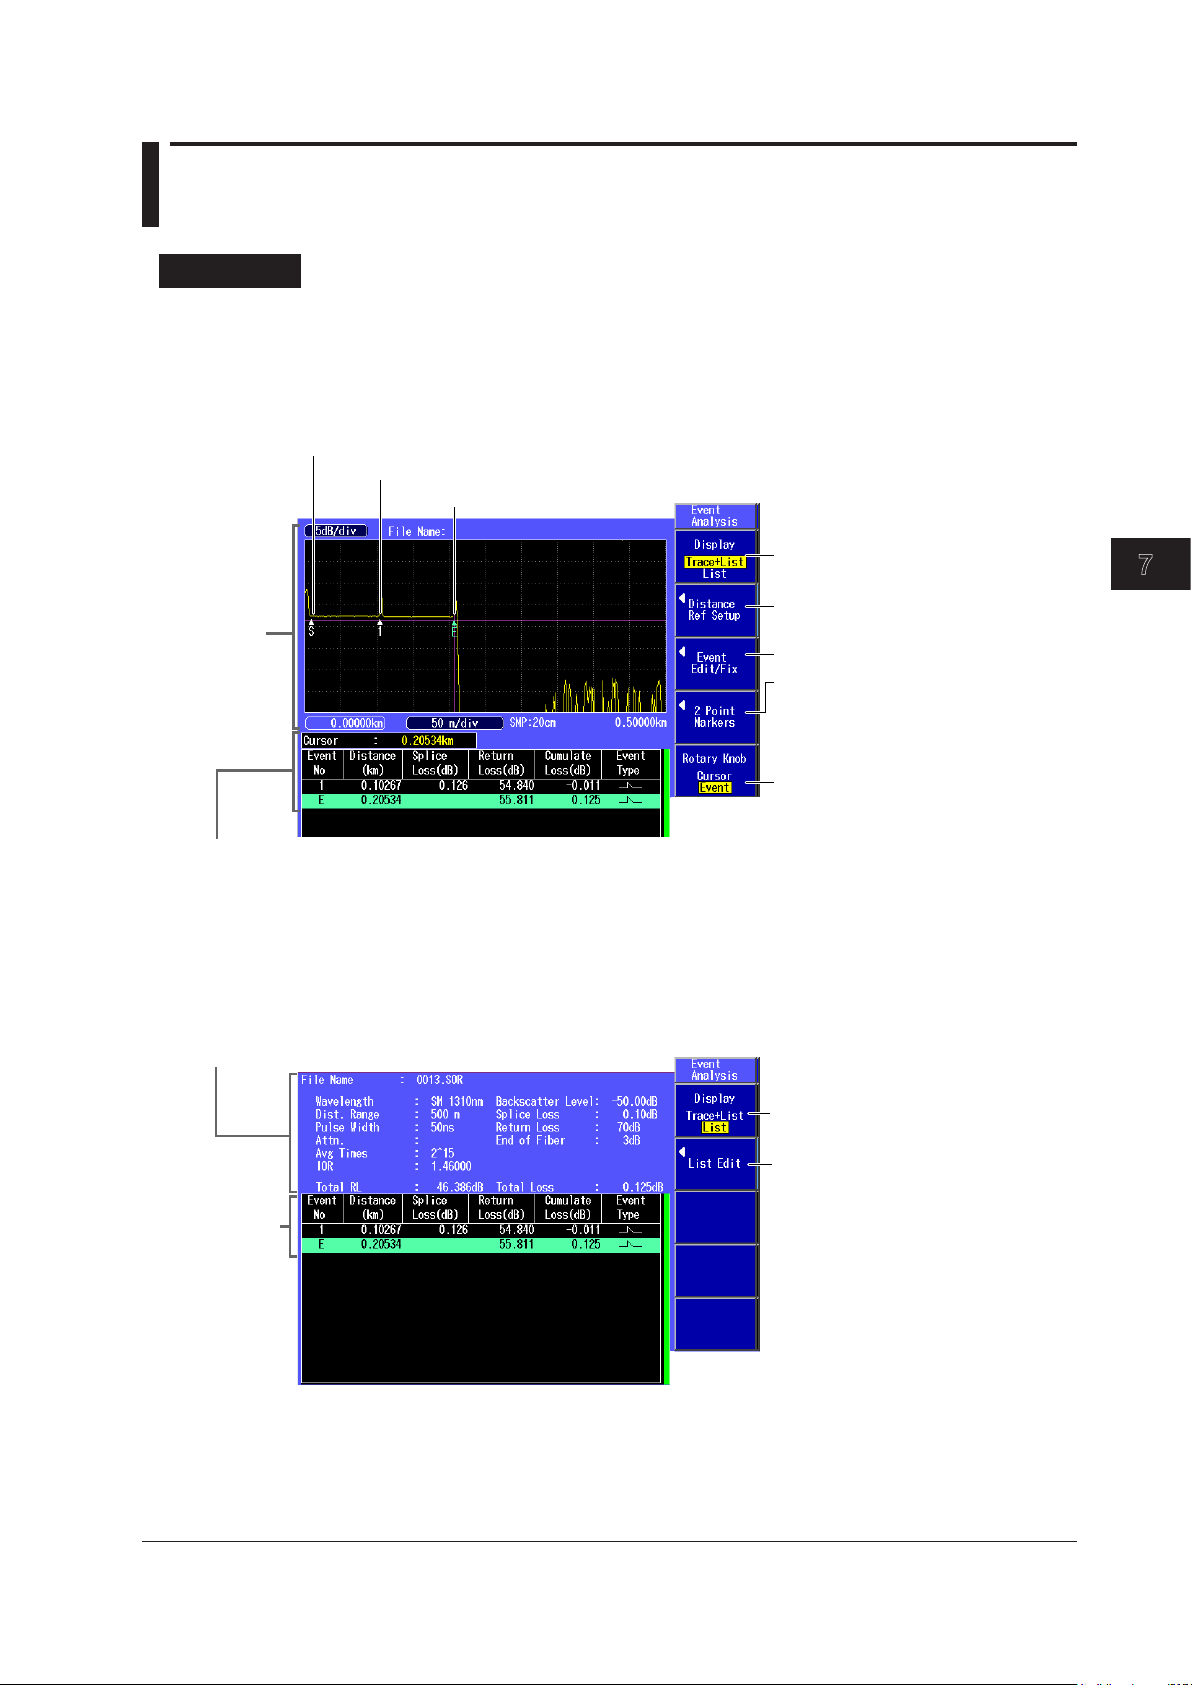
Chapter 7 Event Analysis
3
2
1
4
5
6
7
Set the displayed items to
“Trace+List.”
Press to move the distance reference
(see section 6.3).
Edit or fix events (see section 7.2).
Select the rotary knob function
(Cursor, Event).
Press to configure the two-point
markers.
See “2 Point Markers” later in this section.
For details on the two-point markers, see
section 6.1.
Measurement reference point: S
Event number 1
Detected fiber-end event
List display
The analysis results of detected events are displayed in the event list.
For setting the items to display in the event list, see section 5.5.
Waveform
display
Set the displayed items to “List.”
Measurement conditions
For details on the measurement conditions,
see section 3.5.
List display
Edit the event list (see section 7.3).
7.1 Displaying the Event Screen
Procedure
Event Screen
Screen display items: Trace+List
Using the rotary knob and ENTER, select OTDR.
1.
Press the Event Analysis soft key to display the following screen.
2.
Event Analysis
Screen display item: List
3.
IM AQ1200-01EN
Press the Display soft key to select List. The following screen appears.
7-1
Page 94

7.1 Displaying the Event Screen
A
A
Marker
Set the start point to the cursor position.
B
Marker
Set the end point to the cursor position.
Analysis start position
Set marker .
Analysis end position
Set marker .
Section analysis between and
The section distance and section
loss are displayed.
A B
A
B
2 Point Markers
Using the rotary knob and ENTER, select OTDR.
1.
Press the Event Analysis soft key and then the 2 Point Markers soft key to display the
2.
following screen. The distance between marker
and B is measured.
Explanation
Event Screen
Event Number
A number is displayed on the waveform next to the event. The numbers are ordered from the left
of the display. If there is an asterisk to the left of an event’s number, the event is a fault event. For
details about fault events, see section 3.6.
Distance
The distance from the measurement reference point to each event is displayed. If you move the
distance reference, which is the measurement reference point, the distance from the distance
reference to each event is displayed. For details about the distance reference, see section 6.3.
Splice Loss
The splice loss for each event is displayed. When the fault event display is turned on, splice losses
that exceed the fault event threshold are displayed in red characters.
Return Loss
The return loss for each event is displayed. When the fault event display is turned on, return losses
that exceed the fault event threshold are displayed in red characters.
Cumulate Loss
The loss from the measurement reference point is displayed. If the distance reference is specified,
7-2
the distance reference is the measurement reference point. If the distance reference is not
specified, the measurement reference point (S) is the measurement reference.
Event Types
The type of each event is displayed using the following symbols.
: Reflection
: Positive splice loss
: Negative splice loss
: Macro bending (bending loss)
IM AQ1200-01EN
Page 95

7.1 Displaying the Event Screen
3
2
1
4
5
6
7
Section Group Index (Section IOR)
The index of refraction between events is displayed.
Rotary Knob Feature
You can select the operation that occurs when you turn the rotary knob from the following.
Cursor: The cursor moves continuously.
Event: The cursor moves directly between detected events.
Event Detection
Events are detected automatically. For details, see section 3.5.
Event Analysis
IM AQ1200-01EN
7-3
Page 96
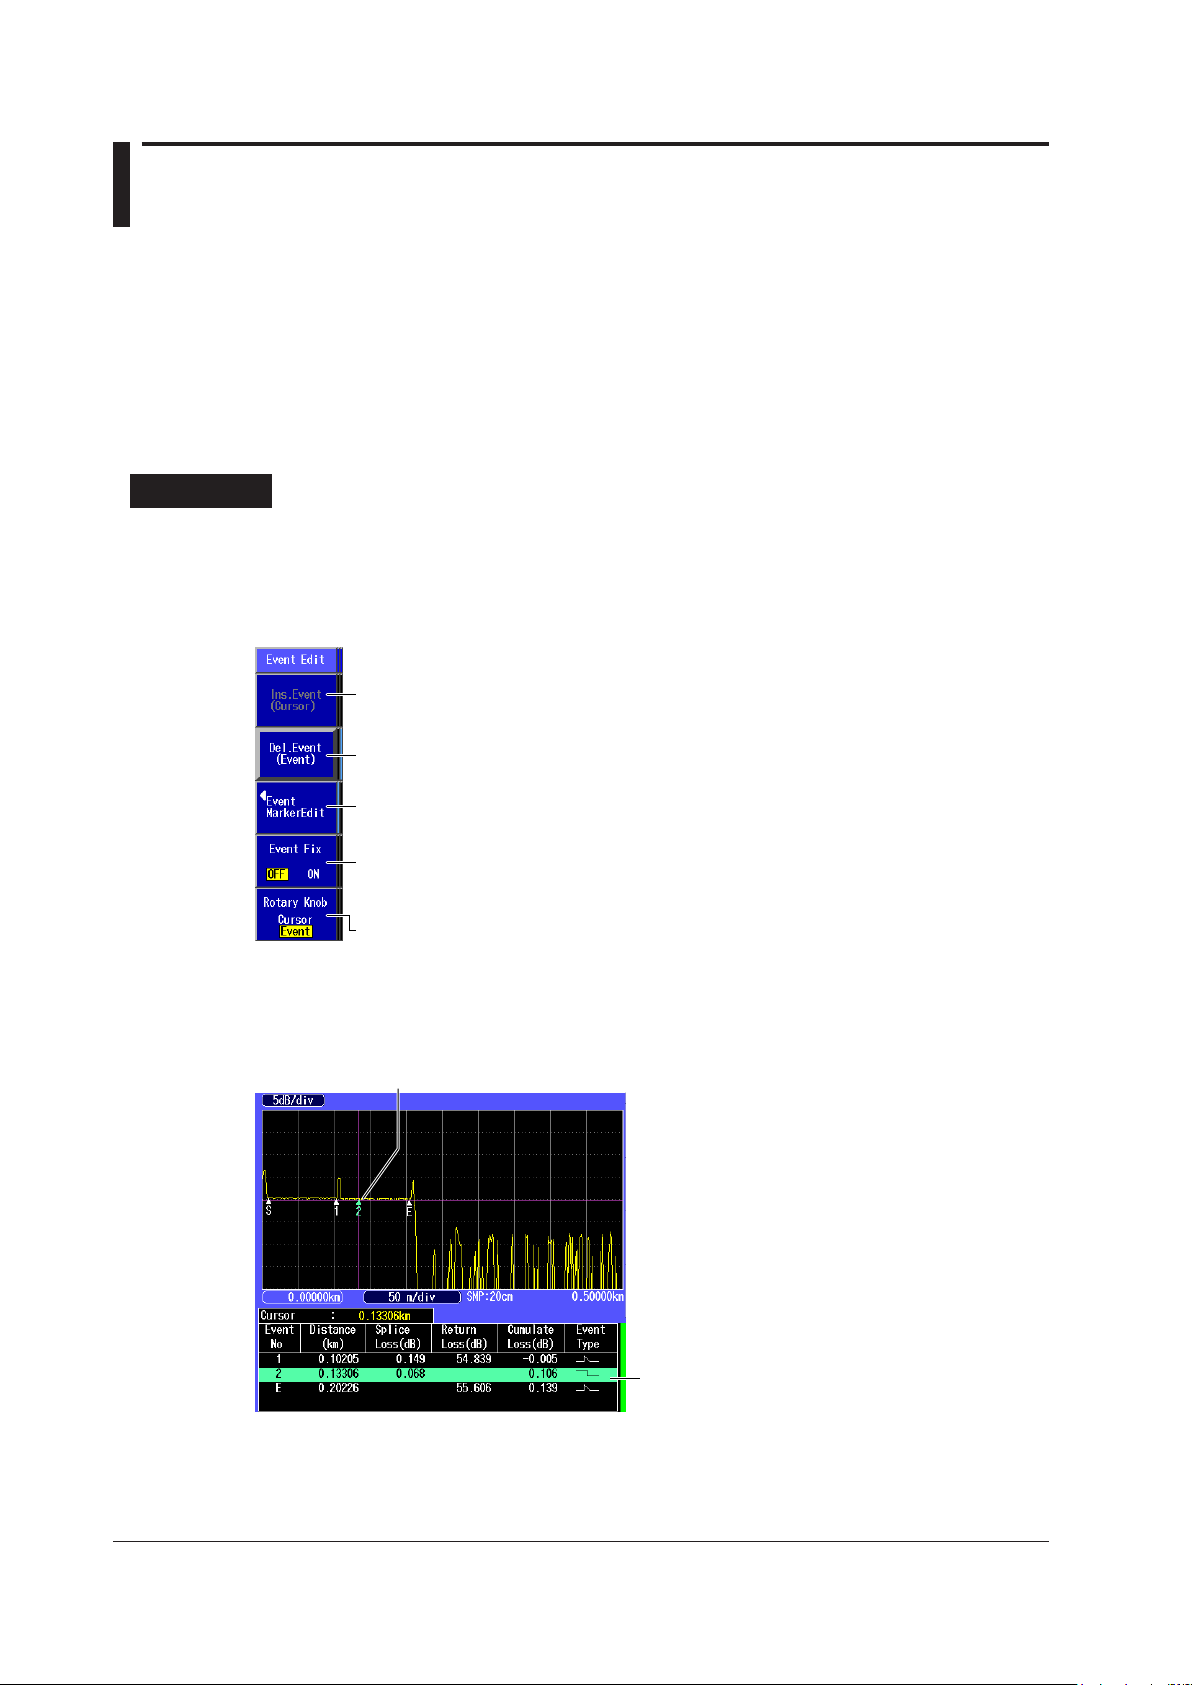
7.2 Editing Events
Inserts an event
You can insert events when Cursor is selected on the Rotary Knob soft key.
Deletes an event
You can delete events when Event is selected on the Rotary Knob soft key.
Selects the rotary knob function (Cursor, Event)
Turns the event position fix feature on or off
ON: Event positions are fixed.
OFF: Event positions are not fixed.
Edit event markers.
See “Editing an Event Marker” described later.
A virtual event is inserted at the cursor position.
The inserted event is added to the event list.
There may be cases where, because the backscattering light level is too small at a reflection point in
an optical fiber, the reflection cannot be detected as an event, or there may be cases where noise is
detected as an event.
In such cases, you can adjust the events by editing them as follows:
•
Inserts events
• Deletes events
• Edit event markers
•
Turn the event position fix feature on and off
Procedure
Editing Events
Using the rotary knob and ENTER, select OTDR.
1.
Press the Event Analysis soft key and then the Event Edit/Fix soft key to display the following
2.
screen.
Inserting an Event
Press the Rotary Knob soft key to select List. Press the Ins. Event soft key. The following
3.
screen appears.
7-4
IM AQ1200-01EN
Page 97

3
2
1
4
5
6
7
7.2 Editing Waveforms
The selected event’s color changes.
The event is deleted virtually.
When the event is deleted, the
subsequent event numbers are
each decreased by one.
The deleted event is deleted
from the event list.
Set the rotary knob function to Cursor.
Sets marker .
Marker moves to the cursor position.
Sets marker .
Marker moves to the cursor position.
Set marker Y2.
Marker Y2 moves to the cursor position.
3
Sets marker .
Marker moves to the cursor position.
1
1
2
3
2
Detail display
Deleting an Event
Press the Rotary Knob soft key to select Event.
3.
Use the rotary knob to select the event that you want to delete. Press the Del. Event soft key.
4.
Editing an Event Marker
You can move an event marker to recalculate return loss and splice loss.
Press the Rotary Knob soft key to select Event.
3.
Turn the rotary knob to move the cursor to the event that you want to edit.
4.
The selected event’s color changes.
Press the Event MarkerEdit soft key. The Event MarkerEdit menu appears, and event markers
5.
are displayed.
Event Analysis
When Marker Mode Is Set to Marker
Turn the rotary knob to move the cursor on the waveform to the position that you want to move
6.
IM AQ1200-01EN
an event to.
Press the appropriate event marker soft key.
7.
The event moves to the cursor position. The reflection loss and splice loss are recalculated and displayed
in the detail display area at the bottom of the screen.
Note
For details on each event marker, see “4 Point Markers” in section 6.1.
7-5
Page 98

7.2 Editing Waveforms
Set the rotary knob function to Cursor.
Selects an event marker (C, n, N, E, F, f)
Press this soft key to select the event marker that
you want to move.
When Marker Mode Is Set to Line
Press the Select soft key to select the event marker that you want to move.
6.
Turn the rotary knob to move the event marker.
7.
The reflection loss and splice loss are recalculated and displayed in the detail display area at the bottom of
the screen.
Note
For details on each event marker, see “5 Point Markers” in section 6.1.
Explanation
Inserting Events
• The event list can display up to 100 events.
• If you insert an event between two events that are displayed, the new event takes on the number
• You cannot insert events to the left of the distance reference. Y
• If you insert an event to the right of the E event, the inserted event becomes the E event, and a new
Deleting Events
• If only the S point and the E event are displayed, you cannot delete any events.
• If you delete an event, the subsequent event numbers will all be reduced by one.
• You cannot delete the S point.
• If you set a distance reference (R point), the S point disappears from the screen. In this situation,
• If you delete the E event, the event that has the largest number becomes the E event.
Editing Event Markers
Event markers are used to calculate the splices losses and reflection losses at event positions.
Normally, event markers are automatically assigned, but when event markers are assigned to noise
and other undesirable waveforms, correct values cannot be calculated. In such cases, you can obtain
correct values by moving event markers.
that follows the event on the left, and all subsequent event numbers are increased by one. You
cannot insert events to the left of the S point.
ou can use the Distance Ref Setup
soft key to move the distance reference. For details about the distance reference, see section 6.3.
number is assigned to the former E event.
the measurement reference point is the distance reference. If you delete the distance reference, the
S point is displayed again at its original position.
7-6
Turning the Event Position Fix Feature On and Off
Event positions can be fixed. Fixed events are handled as master events. You can configure the
AQ1200 so that in subsequent event analysis only master events are handled.
IM AQ1200-01EN
Page 99
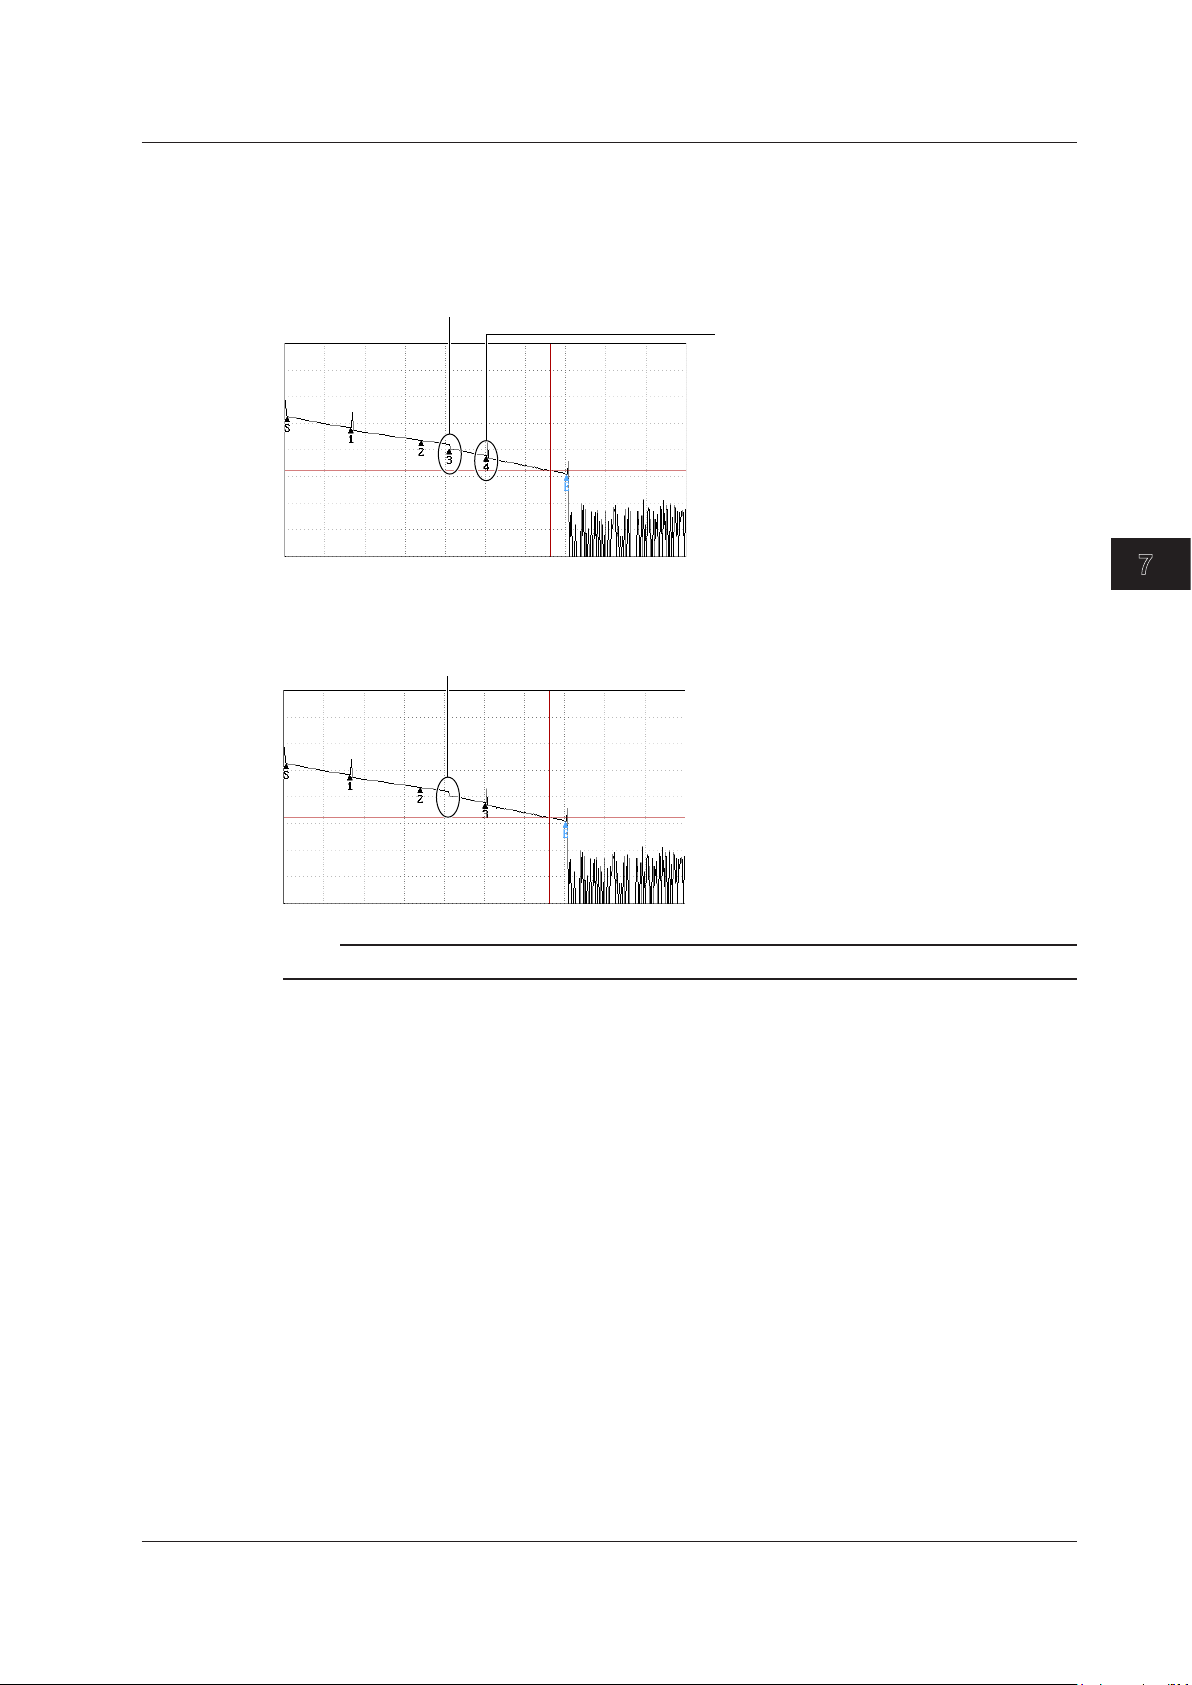
3
2
1
4
5
6
7
Events other than fixed events are also detected.
An earlier event is detected, so the
number of this fixed event is
updated (changes from 3 to 4).
Not detected even when an event exists.
7.2 Editing Waveforms
How the events that are detected at positions other than the master event positions are displayed
varies depending on the Event Fix Mode as follows:
When Event Fix Mode Is Set to Mode1
Events detected at positions other than the master event posit
ions are displayed in the event list.
When Event Fix Mode Is Set to Mode2
Only the events that are detected at the master event positions are displayed in the event list.
Note
For setting the Event Fix Mode, see section 5.5.
Event Analysis
IM AQ1200-01EN
7-7
Page 100

7.3 Editing the Event List
Edit the distance.
Edit the section
group Index.
Edit the return loss
(see section 6.5).
Move the cursor to the event that you want to edit.
Procedure
Editing Events
Use the rotary knob and ENTER to select OTDR.
1.
Press the Event Analysis soft key and then the Display soft key to select List.
2.
Use the arrow keys or the rotary knob to move the cursor to the event that you want to edit.
3.
Press the List Edit soft key. The List Edit screen appears.
4.
Explanation
Editing Distances
• When you change the distance of an event, the section group index (section IOR) is recalculated.
• When you change the distance of an event but the event cannot be set at the specified position, the
distance is adjusted to a position where the event can be set.
• Changing the distance of an event affects the values of other events.
ou cannot change the distance of the distance reference (point R).
• Y
Editing Return Losses
When you change the return loss of an event, the backscatter level is recalculated. The return losses
of other events are measured on the basis of the recalculated backscatter level.
Editing Section Group Indices (Section IORs)
• When you change the section group index of an event, the distance is recalculated.
• You cannot change the section group index of the distance reference (point R).
7-8
IM AQ1200-01EN
 Loading...