

Page 1
WICHTIGER HINWEIS
DIGITALES SPEICHEROSZILLOSKOP
BEST.-NR.: 12 24 42 / 12 24 43 / 12 24 44 / 12 24 52 / 12 24 54 / 12 24 55
VERSION 03/12
IMPORTANT NOTE
VERSION 03/12
DIGITAL STORAGE OSCILLOSCOPE
ITEM NO.: 12 24 42 / 12 24 43 / 12 24 44 / 12 24 52 / 12 24 54 / 12 24 55
Sehr geehrte Kundin, sehr geehrter Kunde,
bitte beachten Sie, dass Sie zur Installation der Software „Freewave“ unter der 64-Bit Version von Windows 7
die zwei folgenden Programme benötigen:
Microsoft .NET Framework Version 4.0 (Vollversion)1.
Zum Download erhältlich unter:
http://www.microsoft.com/download/en/details.aspx?displaylang=en&id=17718
Microsoft Visual C++ 2010 Redistributable Package (x64)2.
Zum Download erhältlich unter:
http://www.microsoft.com/download/en/details.aspx?id=14632
Vielen Dank für Ihr Verständnis.
Ihr VOLTCRAFT-Team
Impressum
Dieser Hinweis ist eine Publikation von Voltcraft®, Lindenweg 15, D-92242 Hirschau, Tel.-Nr. 0180/586 582 7
(www.voltcraft.de).
Alle Rechte einschließlich Übersetzung vorbehalten. Reproduktionen jeder Art, z. B. Fotokopie, Mikroverlmung, oder die Erfassung in
elektronischen Datenverarbeitungsanlagen, bedürfen der schriftlichen Genehmigung des Herausgebers. Nachdruck, auch auszugsweise,
verboten.
Dieser Hinweis entspricht dem technischen Stand bei Drucklegung. Änderung in Technik und Ausstattung vorbehalten.
© Copyright 2012 by Voltcraft® V1_0312_02-SB
Dear Customer,
please note that the following two programs are required for installing the “Freewave” software using the
64-bit version of Windows 7:
Microsoft .NET Framework Version 4.0 (full version)1.
Available for download at:
http://www.microsoft.com/download/en/details.aspx?displaylang=en&id=17718
Microsoft Visual C++ 2010 Redistributable Package (x64)2.
Available for download at:
http://www.microsoft.com/download/en/details.aspx?id=14632
Thank you for your kind attention.
Your VOLTCRAFT team
Legal notice
This note is a publication by Voltcraft®, Lindenweg 15, D-92242 Hirschau/Germany, Phone +49 180/586 582 7
(www.voltcraft.de).
All rights including translation reserved. Reproduction by any method, e.g. photocopy, microlming, or the capture in electronic data processing
systems require the prior written approval by the editor. Reprinting, also in part, is prohibited.
This note represents the technical status at the time of printing. Changes in technology and equipment reserved.
© Copyright 2012 by Voltcraft® V1_0312_02-SB
Page 2

REMARQUE IMPORTANTE
VERSION 03/12
OSCILLOSCOPE NUMÉRIQUE À MÉMOIRE
Nº DE COMMANDE : 12 24 42 / 12 24 43 / 12 24 44 / 12 24 52 / 12 24 54 / 12 24 55
BELANGRIJKE INFORMATIE
VERSIE 03/12
DIGITAAL GEHEUGENOSCILLOSCOOP
BESTELNR.: 12 24 42 / 12 24 43 / 12 24 44 / 12 24 52 / 12 24 54 / 12 24 55
Chère cliente, cher client,
Attention : l’installation du logiciel « Freewave » sous Windows 7 64 bits requiert les deux applications
ci-après :
Microsoft .NET Framework Version 4.0 (version complète)1.
Adresse de téléchargement :
http://www.microsoft.com/download/en/details.aspx?displaylang=en&id=17718
Microsoft Visual C++ 2010 Redistributable Package (x64)2.
Adresse de téléchargement :
http://www.microsoft.com/download/en/details.aspx?id=14632
Merci de votre attention.
Votre équipe VOLTCRAFT
Informations légales
Cette remarque est une publication de la société Voltcraft®, Lindenweg 15, D-92242 Hirschau/Allemagne, Tél. +49 180/586 582 7
(www.voltcraft.de).
Tous droits réservés, y compris de traduction. Toute reproduction, quelle qu’elle soit (p. ex. photocopie, microlm, saisie dans des installations de
traitement de données) nécessite une autorisation écrite de l’éditeur. Il est interdit de le réimprimer, même par extraits.
Cette remarque correspond au niveau technique du moment de la mise sous presse. Sous réserve de modications techniques et de
l’équipement.
© Copyright 2012 by Voltcraft® V1_0312_02-SB
Geachte klant,
denk er aan dat voor het installeren van de software “Freewave” onder de 64-bit versie van Windows 7 de
twee onderstaande programma’s nodig zijn:
Microsoft .NET Framework Version 4.0 (complete versie)1.
Voor download beschikbaar onder:
http://www.microsoft.com/download/en/details.aspx?displaylang=en&id=17718
Microsoft Visual C++ 2010 Redistributable Package (x64)2.
Voor download beschikbaar onder:
http://www.microsoft.com/download/en/details.aspx?id=14632
Dank u voor uw aandacht.
Uw VOLTCRAFT-team
Colofon
Deze informatie is een publicatie van de rma Voltcraft®, Lindenweg 15, D-92242 Hirschau/Duitsland, Tel. +49 180/586 582 7
(www.voltcraft.de).
Alle rechten, vertaling inbegrepen, voorbehouden. Reproducties van welke aard dan ook, bijvoorbeeld fotokopie, microverlming of de registratie
in elektronische gegevensverwerkingsapparatuur, vereisen de schriftelijke toestemming van de uitgever. Nadruk, ook van uittreksels, verboden.
Deze informatie voldoet aan de technische stand bij het in druk bezorgen. Wijziging van techniek en uitrusting voorbehouden.
© Copyright 2012 by Voltcraft® V1_0312_02-SB
Page 3

DIGITAL STORAGE OSCILLOSCOPE
OPERATING INSTRUCTIONS
Item No. :
12 24 52 VDO-2072A / 70 MHz
12 24 54 VDO-2152A / 150 MHz
12 24 55 VDO-2102A / 100 MHz
Version 08/11
Page 4

TABLE OF CONTENTS
1. INTRODUCTION 7
2. SAFETY INSTRUCTIONS 8
Safety Symbols 8
Safety Guidelines 9
Power cord for the United Kingdom 12
3. GETTING STARTED 13
Main Features 13
Panel Overview 15
Front Panel 15
Rear Panel 19
Display 20
Setting up the Oscilloscope 21
4. QUICK REFERENCE 24
Menu Tree and Shortcuts 24
CH1/CH2 key 25
Cursor key 1/2 26
Cursor key 2/2 26
Display key 27
Autoset key 27
Hardcopy key 27
Help key 28
Horizontal menu key 28
Math key 1/2 (+/-/x) 29
Math key 2/2 (FFT/FFT rms) 30
Measure key 31
Run/Stop key 31
Save/Recall key 1/10 32
Save/Recall key 2/10 32
Save/Recall key 3/10 33
Save/Recall key 4/10 33
Save/Recall key 5/10 34
Save/Recall key 6/10 34
Save/Recall key 7/10 35
Save/Recall key 8/10 35
Save/Recall key 9/10 36
2
Page 5

Save/Recall key 10/10 36
Trigger key 1/6 37
Trigger key 2/6 37
Trigger key 3/6 38
Trigger key 4/6 38
Trigger key 5/6 39
Trigger key 6/6 39
Utility key 1/11 (Utility #1) 40
Utility key 2/11 (Utility #2) 40
Utility key 3/11 (Utility #3) 41
Utility key 4/11 (Hardcopy -Save All) 41
Utility key 5/11 (Hardcopy -Printer) 42
Utility key 6/11 (Hardcopy -Save Image) 42
Utility key 7/11 (Probe compensation) 43
Utility key 8/11 (Go-NoGo) 43
Utility key 9/11 (Data Logging 1/2) 44
Utility key 10/11 (Data Logging 2/2) 44
Utility key 11/11 (Self CAL Menu) 44
Default Settings 45
Built-in Help 46
5. MEASUREMENT 47
Basic Measurements 47
Activating a channel 47
Using Autoset 48
Running and stopping the trigger 50
Changing the horizontal position and scale 51
Changing the vertical position and scale 52
Using the probe compensation signal 53
Automatic Measurements 55
Measurement items 55
Automatic measurement gating 57
Automatically measuring the input signals 58
Cursor Measurements 61
Using the horizontal cursors 61
Using the vertical cursors 62
Math Operations 63
Overview 63
3
Page 6

Adding, subtracting or multiplying signals 64
Using the FFT function 65
Go No-Go Testing 67
Overview 67
Edit: NoGo When 68
Edit: Source 68
Edit: NoGo Violation Conditions 69
Edit: Template (boundary) 69
Run Go-NoGo Tests 73
Data Logging 74
Overview 74
Edit: Source 75
Edit: Setup Parameters 75
Run Data logging 77
6. CONFIGURATION 78
Acquisition 78
Selecting the acquisition mode 78
Selecting Delay mode 80
Real time vs Equivalent time sampling mode 82
Display 83
Selecting vector or dot drawing 83
Accumulating the waveform 83
Adjusting the display contrast 84
Selecting the display grid 84
Horizontal View 85
Moving the waveform position horizontally 85
Selecting the horizontal scale 85
Selecting the waveform update mode 86
Zooming the waveform horizontally 87
Viewing waveforms in the X-Y mode 88
Horizontal Adjustment Menu 89
Vertical View (Channel) 91
Moving the waveform position vertically 91
Selecting the vertical scale 91
Selecting the coupling mode 91
Expand Vertical Scale Center / Ground 92
Inverting the waveform vertically 93
4
Page 7

Limiting the waveform bandwidth 94
Selecting the probe attenuation level 94
Trigger 96
Trigger type 96
Trigger parameter 96
Conguring Holdoff 98
Conguring the edge trigger 99
Conguring the video trigger 100
Conguring the pulse width trigger 101
Manually triggering the signal 103
Rear Panel USB Port Interface 104
Remote Control Interface 105
System Settings 107
Viewing the system information 107
Selecting the language 107
7. SAVE/RECALL 109
File Structures 109
Display image le format 109
Waveform le format 109
Setup le format 112
Using the USB le utilities 113
Quick Save (HardCopy) 115
Save 117
File type / source / destination 117
Saving the panel settings 118
Saving the waveform 119
Saving the display image 121
Saving all (panel settings, display image, waveform) 122
Recall 124
File type / source / destination 124
Recalling the default panel settings 125
Recalling a reference waveform to the display 126
Recalling panel settings 126
Recalling a waveform 127
Recall Image 129
8. PRINT 131
Print (Hardcopy) 131
5
Page 8

9. MAINTENANCE 134
Vertical Resolution Calibration 134
Probe Compensation 135
10. FAQ 137
The input signal does not appear in the display. 137
I want to remove some contents from the display. 137
The waveform does not update (frozen). 138
The probe waveform is distorted. 138
Autoset does not catch the signal well. 138
I want to clean up the cluttered panel settings. 138
The saved display image is too dark on the background. 138
The accuracy does not match the specications. 139
The oscilloscope will not allow a 2M waveform to be saved. 139
11. APPENDIX 140
Fuse Replacement 140
VDO-2000A Series Specications 141
Model-specic specications 141
Common specications 142
Probe Specications 144
VDO-2072A / VDO-2102A / VDO-2152A Probe 144
Dimensions 145
12. DISPOSAL 145
6
Page 9

1. INTRODUCTION
Dear Customer,
In purchasing this Voltcraft® product, you have made a very good decision for which we would like
to thank you.
Voltcraft® - In the eld of measuring, charging and network technology, this name stands for
high-quality products which perform superbly and which are created by experts whose concern is
continuous innovation.
From the ambitious hobby electronics enthusiast to the professional user, products from the
Voltcraft® brand family provide the optimum solution even for the most demanding tasks. And the
remarkable feature is: we offer you the mature technology and reliable quality of our Voltcraft®
products at an almost unbeatable price-performance ratio. In this way, we aim to establish a long,
fruitful and successful co-operation with our customers.
We wish you a great deal of enjoyment with your new Voltcraft® product!
All names of companies and products are trademarks of the respective owner. All rights
reserved.
7
Page 10
2. SAFETY INSTRUCTIONS
This chapter contains important safety instructions that should be followed when operating and
storing the oscilloscope. Read the following before any operation to ensure your safety and to keep
the oscilloscope in the best condition.
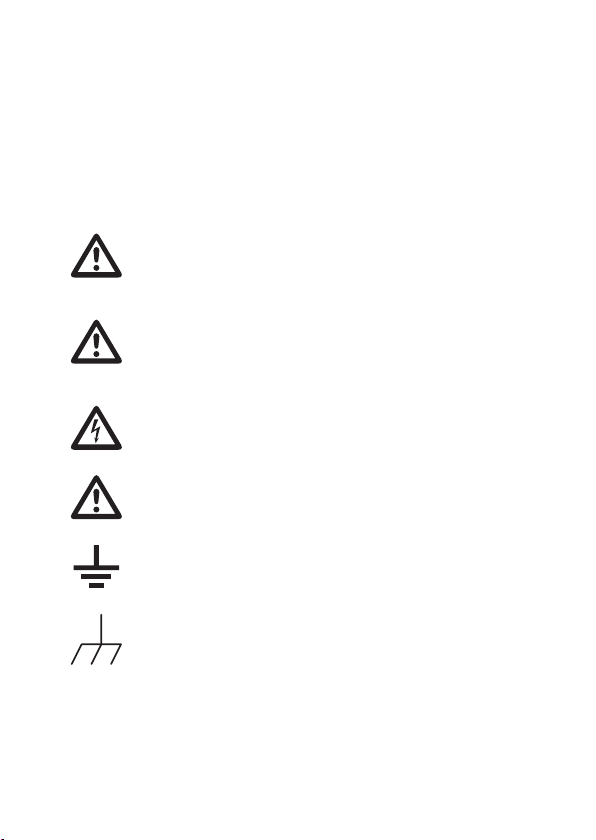
Safety Symbols
These safety symbols may appear in this manual or on the oscilloscope.
Warning: Identies conditions or practices that could result in injury or loss of life.
WARNING
Caution: Identies conditions or practices that could result in damage to the
oscilloscope or to other objects or property.
CAUTION
DANGER High Voltage
Attention: Refer to the Manual
Protective Conductor Terminal
Earth (Ground) Terminal
8
Page 11

Safety Guidelines
General
Guideline
• Make sure the BNC input voltage does not exceed 300V peak.
• Never connect a hazardous live voltage to the ground side of the BNC
connectors. It might lead to re and electric shock.
• Do not place heavy objects on the oscilloscope.
• Avoid severe impact or rough handling that may damage the oscilloscope.
• Avoid discharges of static electricity on or near the oscilloscope.
• Use only mating connectors, not bare wires, for the terminals.
• Do not block the cooling fan vent.
• Do not perform measurements at power sources and building installation sites
(Note below).
• The oscilloscope should only be disassembled by a qualied technician.
(Measurement categories) EN 61010-1:2001 species the measurement
categories and their requirements as follows. The unit falls under category II.
• Measurement category IV is for measurement performed at the source of a
low-voltage installation.
• Measurement category III is for measurement performed in a building
installation.
• Measurement category II is for measurement performed on circuits directly
connected to a low voltage installation.
• Measurement category I is for measurements performed on circuits not directly
connected to Mains.
9
Page 12

Power Supply • AC Input voltage: 100 ~ 240V AC, 47 ~ 63Hz
WARNING
Fuse • Fuse type: T1A/250V
• The power supply voltage should not uctuate more than 10%.
• Connect the protective grounding conductor of the AC power cord to an earth
ground.
• To ensure re protection, replace the fuse only with the specied type and
rating.
• Disconnect the power cord before replacing the fuse.
• Make sure the cause of fuse blowout is xed before replacing the fuse.
Cleaning the
oscillo-scope
Operation
Environment
10
• Disconnect the power cord before cleaning the oscilloscope.
• Use a soft cloth dampened in a solution of mild detergent and water. Do not
spray any liquid into the oscilloscope.
• Do not use chemicals containing harsh products such as benzene, toluene,
xylene, and acetone.
• Location: Indoor, no direct sunlight, dust free, almost non-conductive pollution
(Note below)
• Relative Humidity: ≤ 80%, 40°C or below
≤ 45%, 41°C~50°C
• Altitude: < 2000m
• Temperature: 0°C to 50°C
Page 13

(Pollution Degree) EN 61010-1:2001 species pollution degrees and their
requirements as follows. The oscilloscope falls under degree 2.
Pollution refers to “addition of foreign matter, solid, liquid, or gaseous (ionized
gases), that may produce a reduction of dielectric strength or surface resistivity”.
• Pollution degree 1: No pollution or only dry, non-conductive pollution occurs.
The pollution has no inuence.
• Pollution degree 2: Normally only non-conductive pollution occurs. Occasionally,
however, a temporary conductivity caused by condensation must be expected.
• Pollution degree 3: Conductive pollution occurs, or dry, nonconductive pollution
occurs which becomes conductive due to condensation which is expected. In
such conditions, equipment is normally protected against exposure to direct
sunlight, precipitation, and full wind pressure, but neither temperature nor
humidity is controlled.
Storage
environment
• Location: Indoor
• Storage Temperature: -10°C~60°C, no condensation
• Relative Humidity: 93% @ 40°C
65% @ 41°C ~60°C
11
Page 14
Power cord for the United Kingdom
When using the oscilloscope in the United Kingdom, make sure the power cord meets the following
safety instructions.
NOTE: This lead/appliance must only be wired by competent persons
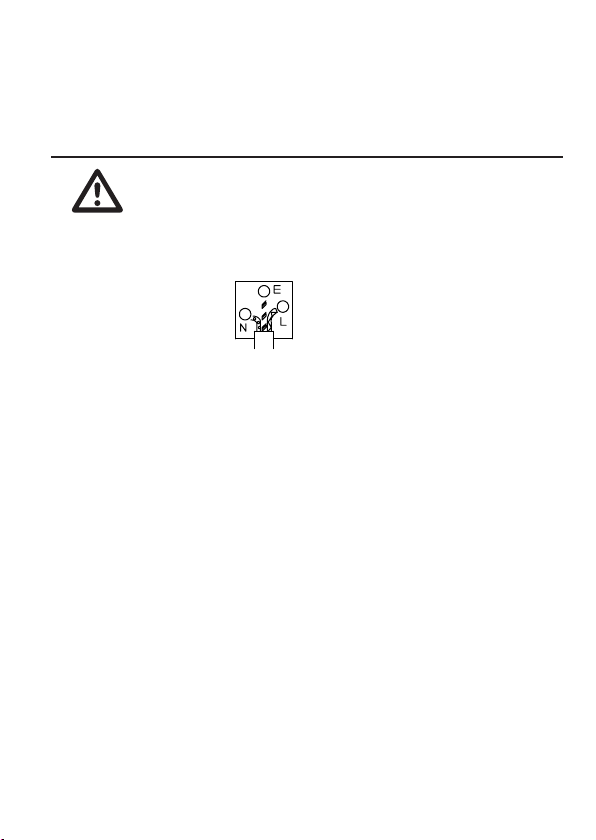
WARNING: THIS APPLIANCE MUST BE EARTHED
IMPORTANT: The wires in this lead are coloured in accordance with the following code:\
Green / Yellow: Earth
Blue: Neutral
Brown: Live (Phase)
As the colours of the wires in main leads may not correspond with the coloured marking identied in
your plug/appliance, proceed as follows:
The wire which is coloured Green & Yellow must be connected to the Earth terminal marked with
either the letter E, the earth symbol or coloured Green/Green & Yellow.
The wire which is coloured Blue must be connected to the terminal which is marked with the letter
N or coloured Blue or Black.
The wire which is coloured Brown must be connected to the terminal marked with the letter L or P
or coloured Brown or Red.
If in doubt, consult the instructions provided with the equipment or contact the supplier.
This cable/appliance should be protected by a suitably rated and approved HBC mains fuse: refer
to the rating information on the equipment and/or user instructions for details. As a guide, a cable of
0.75mm2 should be protected by a 3A or 5A fuse. Larger conductors would normally require
13A types, depending on the connection method used.
Any exposed wiring from a cable, plug or connection that is engaged in a live socket is extremely
hazardous. If a cable or plug is deemed hazardous, turn off the mains power and remove the cable,
any fuses and fuse assemblies. All hazardous wiring must be immediately destroyed and replaced
in accordance to the above standard.
12
Page 15

3. GETTING STARTED
The Getting started chapter introduces the oscilloscope’s main features, appearance, and set up
procedure.
Main Features
Model name Frequency bandwidth Input channels
VDO-2072A DC – 70MHz (–3dB) 2
VDO-2102A DC – 100MHz (–3dB) 2
VDO-2152A DC – 150MHz (–3dB) 2
Performance
Features
• 1 GS/s real-time sampling rate
• 25GS/s equivalent-time sampling rate
• 2M points record length
• Up to 10ns peak detection
• 2mV~10V vertical scale
• 1ns ~ 50s time scale
• 5.6 inch color TFT display
• Saving and recalling setups and waveforms
• 27 automatic measurements
• Multi-language menu (12 languages)
• Math operation: Addition, Subtraction, multiplication, FFT, FFT RMS
• Data logging
• Go-NoGo testing
• Edge, video, pulse width trigger
• Compact size: (W) 310 x (D) 140 x (H) 142 mm
• Probe factor from 0.1X~2000X voltage/current
13
Page 16

Interface • USB 2.0 full-speed interface for saving and recalling data
• Calibration output
• External trigger input
• USB slave interface for remote control
• PictBridge Printer compatible
14
Page 17
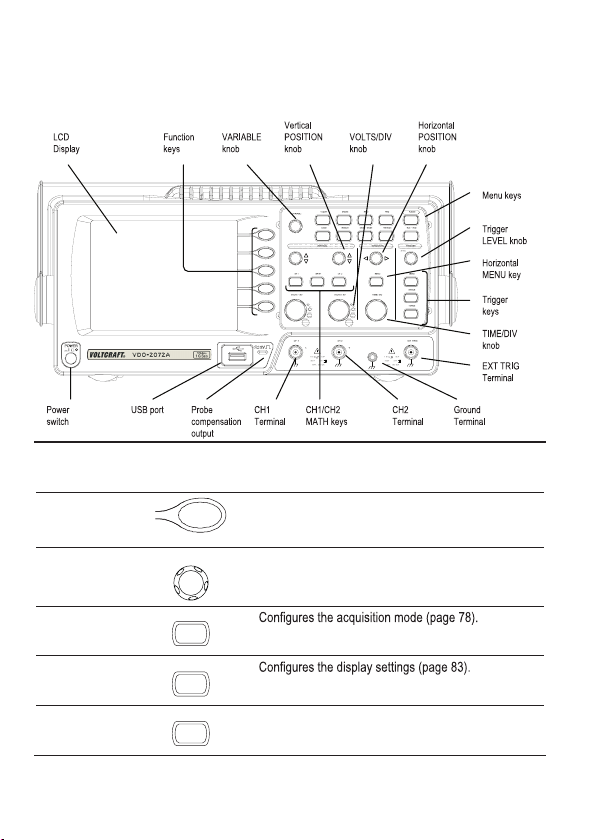
Panel Overview
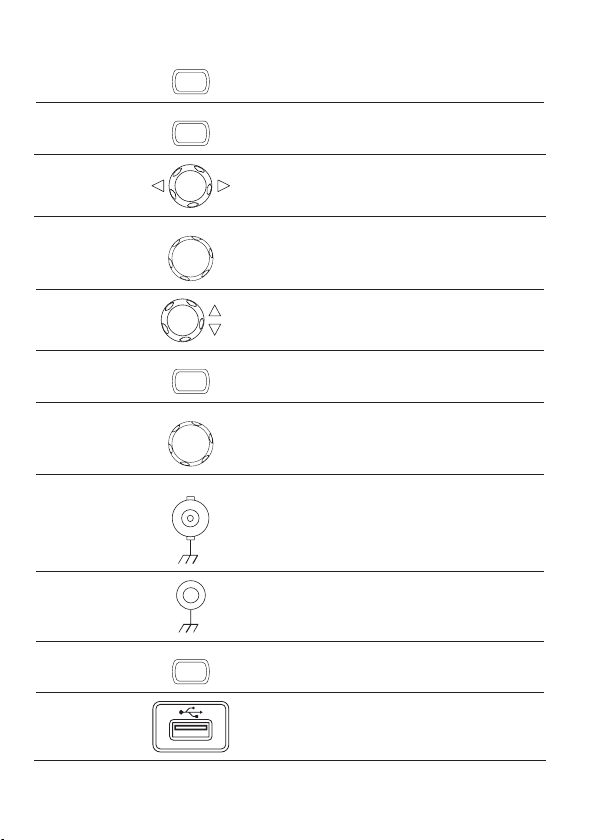
Front Panel
LCD display TFT color, 320 x 234 resolution, wide angle view LCD display.
Function keys:
F1 (top) to
F5 (bottom)
Variable knob
Acquire key
Display key
Cursor key
VARIABLE
Acquire
Display
Cursor
Activates the functions which appear in the left side of
the LCD display.
Increases or decreases values and moves to the next
or previous parameter.
Runs cursor measurements (page 61).
15
Page 18

Utility key
Help key
Utility
Help
Congures the Hardcopy function (page 115), shows
the system status (page 107), selects the menu
language (page 107), runs the self calibration (page
134), congures the probe compensation signal (page
135), and selects the USB host type(page 104).
Shows the Help contents on the display (page 46).
Autoset key
Measure key
Save/Recall key
Hardcopy key
Run/Stop key
Trigger level
knob
Trigger menu
key
Single trigger
key
Measure
Save/Recall
Hardcopy
Run/Stop
TRIGGER
LEVEL
Autoset
MENU
Single
Automatically congures the horizontal, vertical, and
trigger settings according to the input signal (page 48).
Congures and runs automatic measurements (page
55).
Saves and recalls images, waveforms, or panel settings
(page 109).
Stores images, waveforms, or panel settings to USB
(page 115), or prints screen images to a PictBridge
compatible printer (page 131).
Runs or stops triggering (page 50).
Sets the trigger level (page 96).
Congures the trigger settings (page 96).
Selects the single triggering mode (page 103).
16
Page 19
Trigger force
key
Horizontal menu
key
FORCE
MENU
Acquires the input signal once regardless of the trigger
condition at the time (page 103).
Congures the horizontal view (page 85).
Horizontal
Moves the waveform horizontally (page 85).
position knob
TIME/DIV knob
Vertical position
TIME/DIV
Selects the horizontal scale (page 85).
Moves the waveform vertically (page 91).
knob
CH1/CH2 key
CH1
Congures the vertical scale and coupling mode for
each channel (page 91).
VOLTS/DIV
VOLTS/DIV
Selects the vertical scale (page 91).
knob
Input terminal CH1 Accepts input signals: 1MΩ±2% input impedance, BNC
terminal.
Ground terminal
Accepts the DUT ground lead to achieve a common
ground.
MATH key
MATH
Performs math operations (page 63).
USB port Facilitates transferring waveform data, display images,
and panel settings (page 109).
17
Page 20

Probe
compensation
output
External trigger
input
EXT TRIG
Outputs a 2Vp-p, square signal for compensating the
probe (page 135) or demonstration.
Accepts an external trigger signal
(page 96).
Power switch
Powers the oscilloscope on or off.
18
Page 21
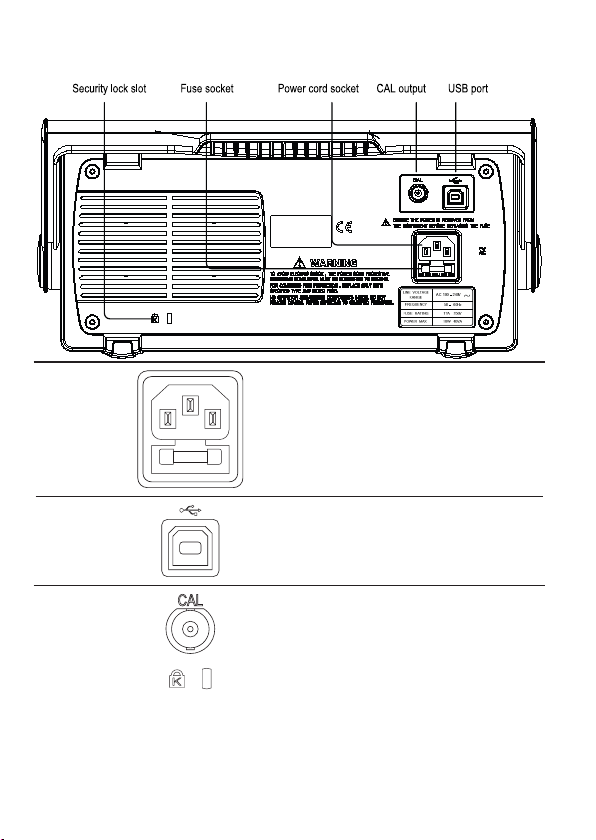
Rear Panel
Power cord
socket
Fuse socket
USB slave port
Calibration
output
Security lock
slot
USE ONLY WITH A 250V FUSE
Power cord socket accepts the AC mains, 100 ~ 240V,
50/60Hz.
The fuse socket holds the AC main fuse, T1A/250V.
For the fuse replacement procedure, see page 140.
Accepts a type B (slave) male USB connector for
remote control of the oscilloscope (page 104) or to print
directly to a PictBridge compatible printer.
Outputs the calibration signal used in vertical scale
accuracy calibration (page 134).
Standard laptop security lock slot
for ensuring the security of the
VDO-2000A.
19
Page 22
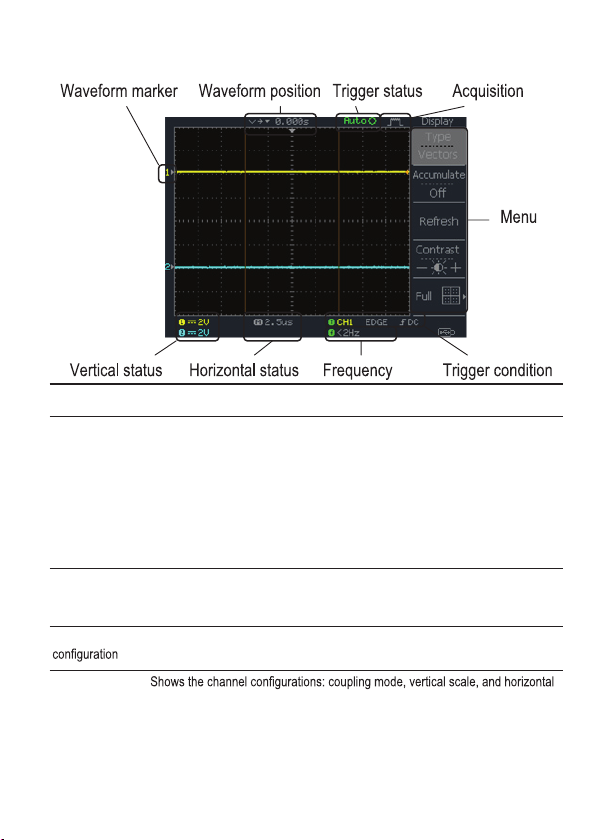
Display
Waveforms Channel 1: Yellow Channel 2: Blue
Trigger status Trig’d A signal is being triggered
Trig? Waiting for a trigger condition
Input signal
frequency
Trigger
Horizontal status
Vertical status
Auto Updating the input signal regardless of trigger condi-
STOP Triggering is stopped
For trigger setting details, see page 96.
Updates the input signal frequency (the trigger source signal) in real-time.
“< 2Hz” Indicates that the signal frequency is less than the lower frequency limit
(2Hz) and thus not accurate.
Shows the trigger source, type, and slope. In case of the Video trigger, shows
the trigger source and polarity.
scale.
tions
20
Page 23
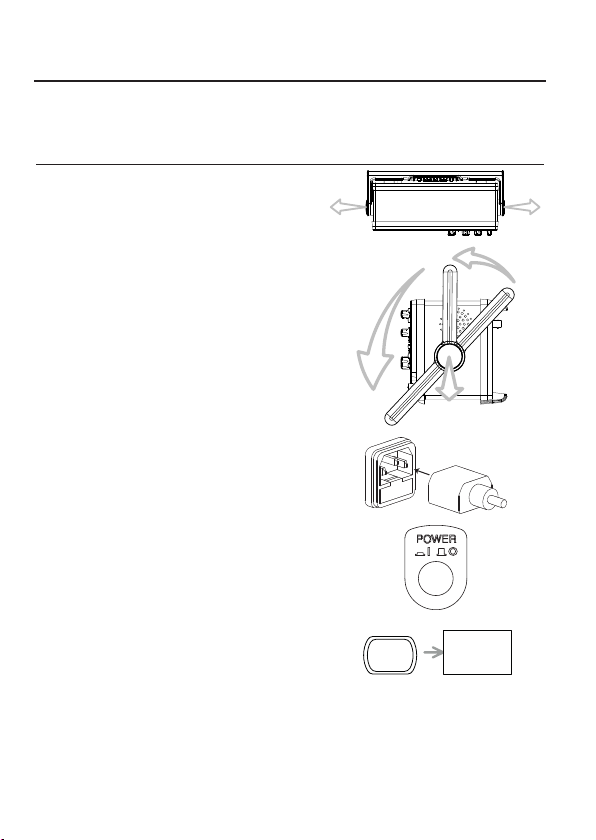
Setting up the Oscilloscope
Background This section describes how to set up the oscilloscope properly including adjusting
Procedure
the handle, connecting a signal, adjusting the scale, and compensating the
probe. Before operating the oscilloscope in a new environment, run these steps
to make sure the oscilloscope is functionally stable.
1. Pull both bases of the handle out
slightly.
2. Turn to one of the three preset
positions.
3. Connect the power cord.
4. Press the power switch. The
display will become active in
approximately 10 seconds.
5. Reset the system by recalling the
factory settings. Press the Save/
Recall key, then Default Setup.
For details regarding the factory
settings, see page 45.
Save/Recall
Default
Setup
21
Page 24
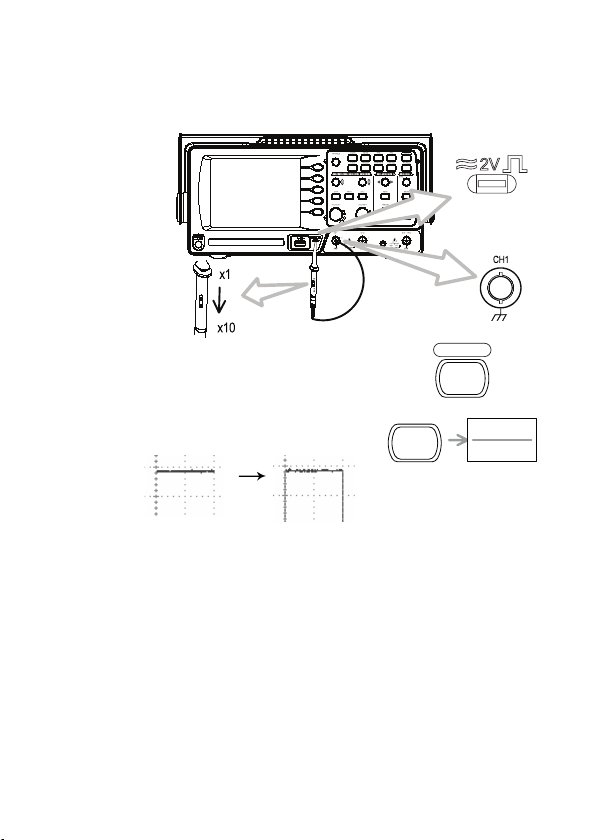
6. Connect the probe between the Channel1 input terminal and probe
compensation signal output (2Vp-p, 1kHz square wave).
7. Set the probe attenuation to x10.
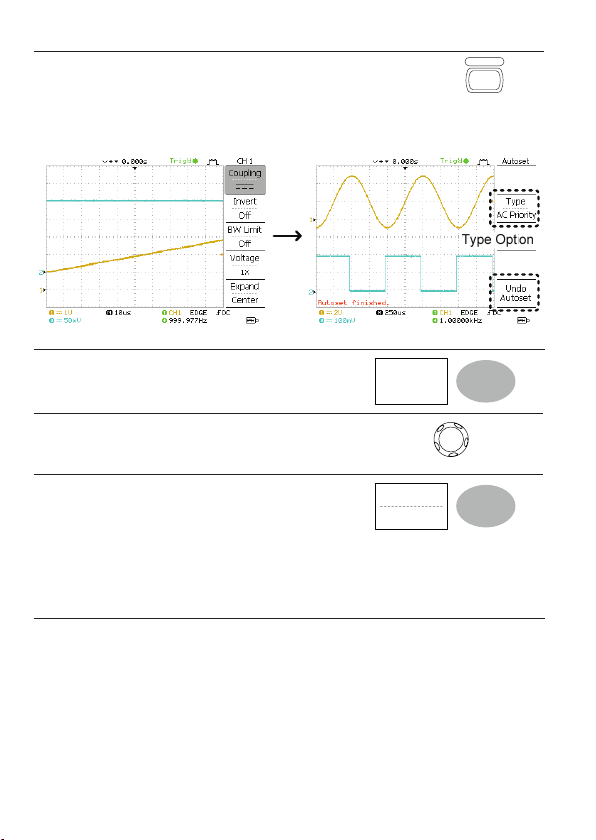
8. Press the Autoset key. A square
waveform will appear in the center of
the display. For details on Autoset, see
page 48.
9. Press the Display key, then Type and
select the vector waveform type.
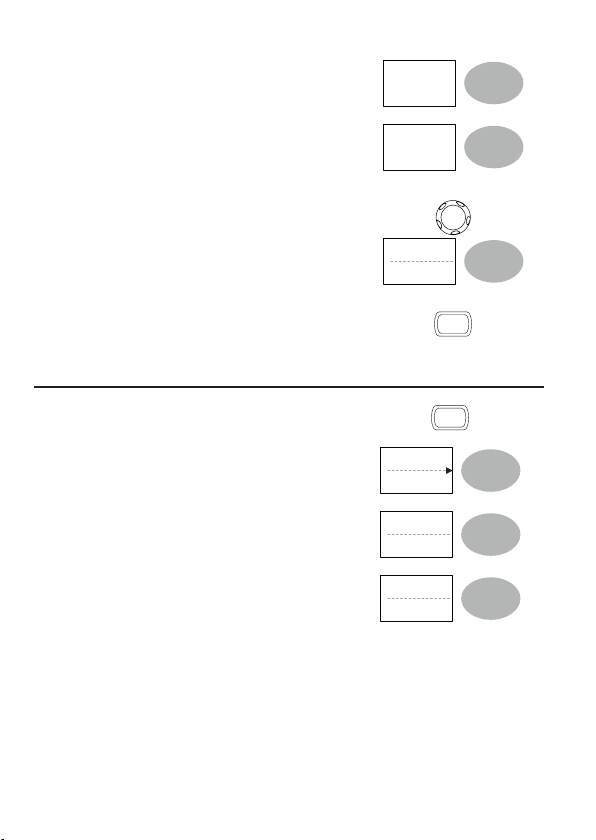
10. Turn the adjustment point on the probe to atten the square waveform edge.
22
Display
Autoset
Type
Vectore
Page 25
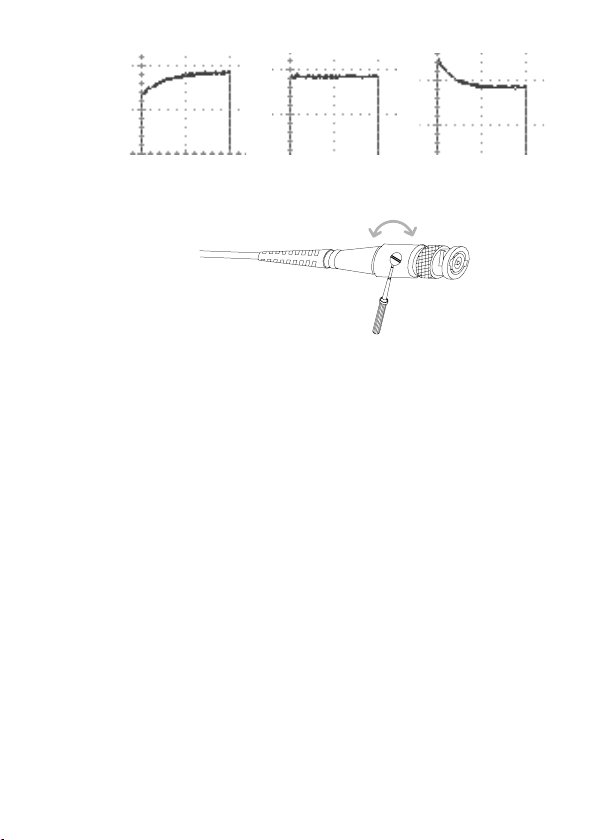
Over Under
Compensation Normal Compensation
11. Setting up the oscilloscope is complete. You may continue with the other
operations.
Measurement: page 47
Conguration: page 78
23
Page 26

4. QUICK REFERENCE
This chapter lists the oscilloscope menu tree, operation shortcuts, built-in help coverage, and
default factory settings. Use this chapter as a handy reference to access the oscilloscope functions.
Menu Tree and Shortcuts
Conventions Examples
Normal = Press the functional key for “Normal”
Average
Normal ~ Average = Select a menu from “Normal” to “Average” and press its functionality key
= Repeatedly press the functional key for “Average”
Normal→VAR
24
= Press the functionality key for “Normal”, and then use the Variable knob
Page 27
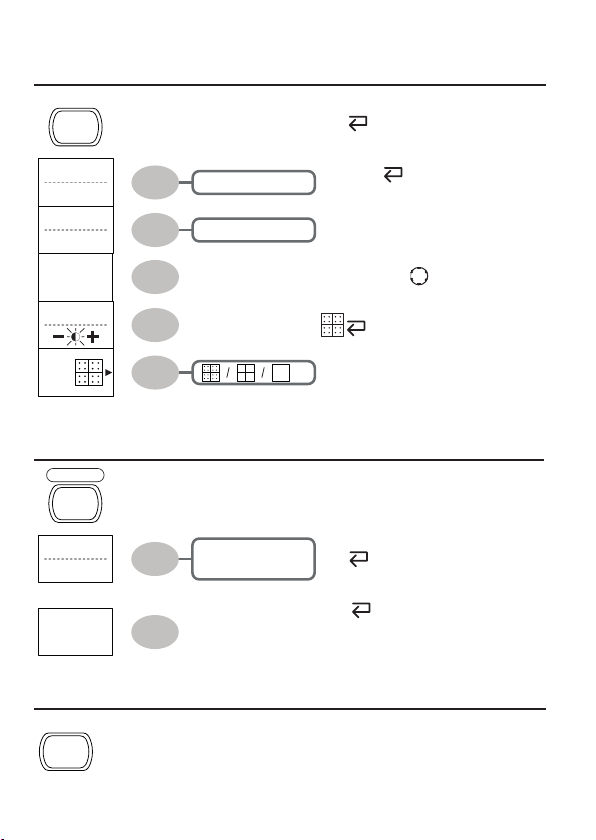
Acquire
Normal
Average
Peak
Detect
Delay
On
Sample Rate
500MS/s
CH1/CH2 key
2/ 4/ 8/ 16/ 32/
64/ 128/ 256
On / Off
Select acquisition mode
Normal ~ Peak-Detect
Select average number
Average
Turn Delay on/off
Delay On
CH1
Coupling
Invert
Off
BW Limit
Off
Voltage
x1
Expand
Center
On / Off
On / Off
Voltage / Current
Center / Ground
Turn channel on / off
CH 1/2
Select coupling mode
Coupling
Invert waveform
Invert
Turn bandwidth limit on / off
BW Limit
Select probe type
Voltage↔Current
Select probe attenuation
VAR
(0.1x~2000x) (1-2-5 step)
Expand type
Expand
25
Page 28
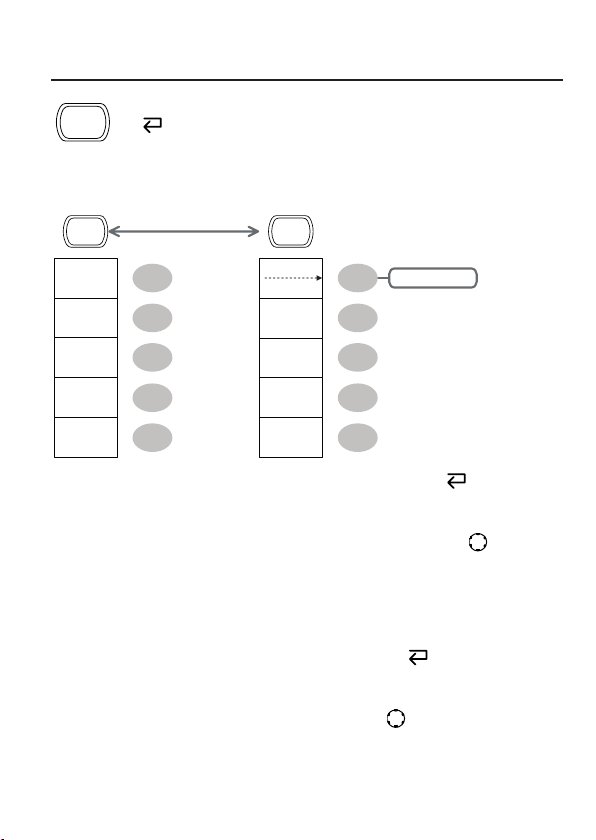
Cursor key 1/2
Cursor
Source
CH1
X1
- 5.000uS
0.000uV
X2
5.000uS
0.000uV
X1X2
∆: 10.00uS
ƒ: 100.0kHz
0.000uV
Cursor key 2/2
Cursor
Source
CH2
Y1
123.4mV
Y2
12.9mV
Y1Y2
110.5mV
CH1 / 2 / MATH
CH1 / 2 / MATH
Turn cursor on/off
Cursor
Move X1 cursor
X1 → VAR
Move X2 cursor
X2 → VAR
Move both X1 and X2 cursor
X1X2 → VAR
Switch to Y cursor
X↔Y
Turn cursor on / off
Cursor
Move Y1 cursor
Y1 → VAR
Move Y2 cursor
Y2 → VAR
Move both Y1 and Y2 cursor
Y1Y2 → VAR
Switch to X cursor
X↔Y
26
Page 29
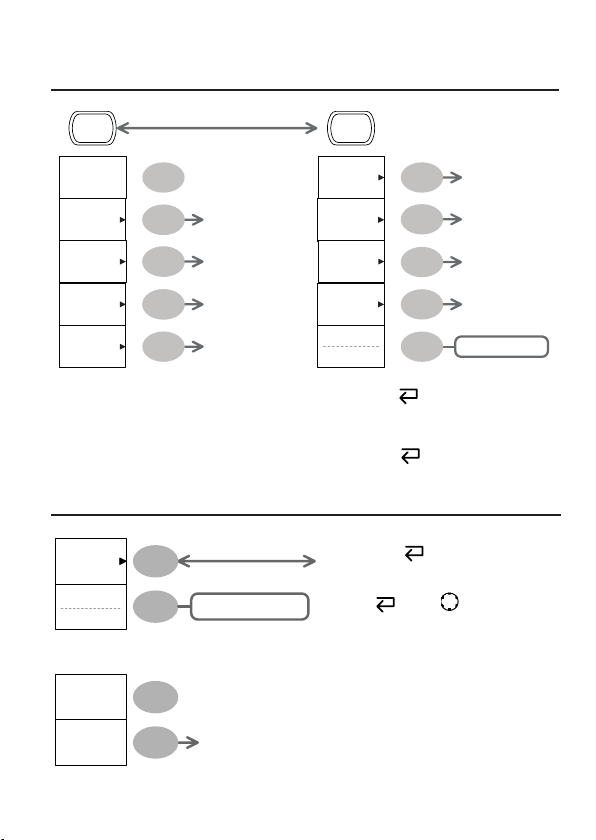
Display key
Display
Type
Vectors
Accumulate
Off
Refresh
Contrast
Full
Autoset key
Autoset
Type
Fit Screen
Undo
Vectors / Dots
On / Off
Fit Screen
AC Priority
Select waveform type
Type
Waveform accumulate On/Off
Accumulate
Refresh accumulation
Refresh
Set display contrast
Contrast → VAR
Select display grid
Automatically nd the signal and set the
scale
Autoset
Change the Type of Autoset mode.
(available for a few seconds)
Type
Undo Autoset
Undo
(available for a few seconds)
Hardcopy key
Hardcopy
→ See Utility key (page 40)
27
Page 30
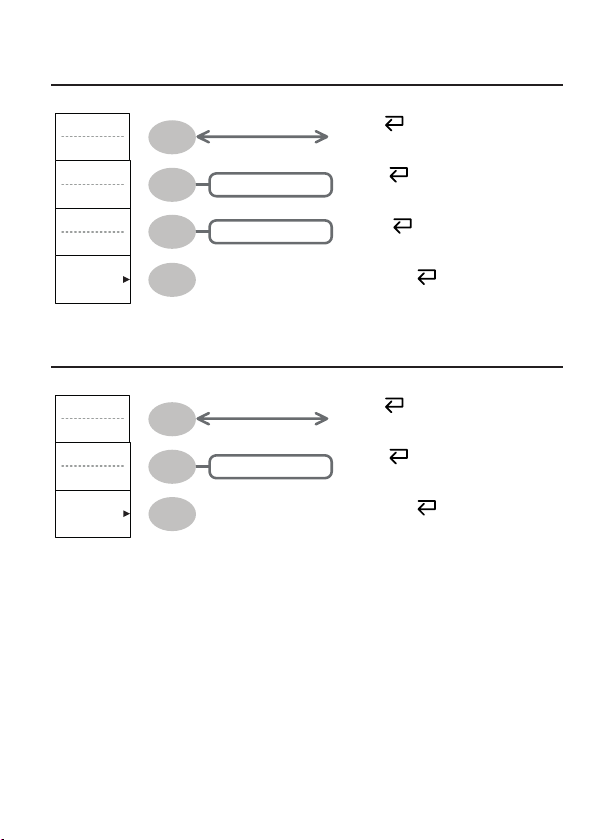
Help key
Help
Turn help mode on/off
Help
Horizontal menu key
MENU
Window
Window
Zoom
Roll
XY
MENU
H Pos Adj
Fine
Reset
Hor Pos
Set / Clear
180.0uS
Previous
180.0uS
Next
340.0uS
Fine / CoarseMain
Switch from Horizontal Menu to Horizontal Position Menu. Horizontal MENU
Select main (default) display Main
Select window mode Window → TIME/DIV
Zoom in window mode Window Zoom
Select window roll mode Roll
Select XY mode XY
Toggle adjustment mode
H Pos Adj
Reset horizontal marker Reset
Set Horizontal marker/delete horizontal marker. HOR
→ Set / Clear
Navigate to previous horizontal marker. Previous
Navigate to next horizontal marker. Next
28
Page 31

Math key 1/2 (+/-/x)
MATH
Operation
CH1 + CH2
Position
0.00 Div
Unit / Div
2V
CH1 + CH2
CH1 - CH2
CH1 x CH2
FFT
FFT rms
-12div ~ +12div
200mV ~ 10V/div
Math on / off
Math
Select math operation type
(+ / – / x / FFT / FFT rms)
Operation
Set result position
Position →VAR
Math result Volt/Div
Unit/Div→VOLTS/DIV(CH2)
29
Page 32

Math key 2/2 (FFT/FFT rms)
MATH
Operation
FFT
Source
CH1
Window
Hanning
Vertical
2V
0.00 Div
Zoom
1X
0.0000Hz
CH1 + CH2
CH1 - CH2
CH1 x CH2
FFT
FFT rms
CH1/2
Flattop /
Rectangular /
Blackman / Hanning
-12div ~ +12div
20 / 10 / 5 / 2 / 1 dB
1 / 2 / 5 / 10 / 20X
Math on / off
Math
Select math operation type
(+ / – / x / FFT / FFT rms)
Operation
Select FFT source channel
Source
Select FFT window
Window
Select FFT result position
Vertical → VAR
Select vertical scale
Vertical → VOLTS/DIV
Select vertical units
Vertical
Select Zoom level
Zoom(X) → VAR
Select Horizontal position
Zoom(Hz) → VAR
30
Page 33

Measure key
Measure
Vpp
1:204mV
2: 300mV
Vavg
1: 1.93mV
2: 28.0mV
Frequency
1: 1.000kHz
2: 3.003kHz
Duty Cycle
1: 50.01%
2: 49.88%
Rise Time
1. 76.20us
2. 70.11us
Measure
Source 1
CH1
Source 2
CH2
Voltage
Vpp
Previous
Menu
View all/Select
Measurements
(Voltage/
Time/Delay)
Turn on / off measurement Measure
Select measurement type Voltage/Time/Delay
Select measurement item VAR or Icon(F3) / → VAR
Go back to previous menu Previous Menu
Run/Stop key
Run/Stop
Freeze / unfreeze waveform or trigger
Run/Stop
31
Page 34
Save/Recall key 1/10
Save/Recall
Default
Setup
Recall
Setup
Recall
Waveform
Recall
Image
Display
Refs.
To Recall Setup
To Recall Waveform
To Recall Image
To Display Refs
Save/Recall
Save
Setup
Recall
Waveform
Save
Image
Save
All
CSV Format
Fast
Switch to Save or Recall menu Save/Recall
Recall default setup Default Setup
Change CSV format CSV Format
Save/Recall key 2/10
Recall Setup
Recall
Setup
Source
Memory
Recall
File
Utilities
Memory/USB
(USB only)
To File Utilities
Select other menu
Recall Setup
Select setup source
Source
Recall setup
Recall
Go to USB le utilities
File Utilities
→ VAR
To Save Setup
To Save Waveform
To Save Image
To Save All
Fast / Detail
32
Page 35

Save/Recall key 3/10
Recall Waveform
Recall
Waveform
Source
Memory
Destination
Recall
File
Utilities
Save/Recall key 4/10
Recall Image
Recall
Image
Source
USB
Ref Image
Off
Recall
File
Utilities
Memory/USB
Ref A/B
(USB only)
To File Utilities
On / Off
(USB only)
To File Utilities
Select other menu
Recall Waveform
Select waveform source
Source
Select waveform destination
Destination → VAR
Recall waveform
Recall
Go to USB le utilities
File Utilities
Select other menu
Recall Image
Turn reference image on/off
Ref image
Recall waveform
Recall
Go to USB le utilities
File Utilities
VAR
33
Page 36

Save/Recall key 5/10
Display Refs.
Display
Refs.
Ref. A Off
Ref. B Off
Ref. A On
1V
2.5ms
Save/Recall key 6/10
Save Setup
Save
Setup
Destination
Memory
Save
File
Utilities
On / Off
On / Off
Memory / USB
(USB only)
To File Utilities
Select other menu
Save Setup
Turn ref. waveform A on/off
Ref.A
Turn ref. waveform A on/off
Ref.B
Select other menu
Save Setup
Select destination
Destination
Save setup
Save
Go to USB le utilities
File Utilities
→
VAR
34
Page 37

Save/Recall key 7/10
Save Waveform
Save
Waveform
Source
Destination
Memory
Save
File
Utilities
Save/Recall key 8/10
Save Image
Save
Image
Ink Saver
Off
Destination
USB
Save
File
Utilities
CH1/2/Math
Ref A/B
Memory
USB Normal
USB 1M
USB 2M / Refs.
(USB only)
To File Utilities
On / Off
(USB only)
To File Utilities
Select other menu
Save Waveform
Select source
Source
Select destination
Destination
Save waveform
Save
Go to USB le utilities
File Utilities
Select other menu
Save Image
Turn on / off ink saver
Ink Saver
Save all
Save
Go to USB le utilities
File Utilities
→VAR
→VAR
35
Page 38

Save/Recall key 9/10
Save All
Save
All
Ink Saver
Off
Destination
USB
Save
File
Utilities
Save/Recall key 10/10
File Utilities
Select
New
Folder
Rename
Delete
Previous
Menu
On / Off
USB Normal
USB 1M / USB 2M
(USB only)
To File Utilities
Enter
Character
Back
Space
Save
Previous
Menu
Select other menu
Save All
Turn on/off ink saver
Ink Saver
Select destination
Destination
→ VAR
Save all
Save
Go to USB le utilities
File Utilities
Select le/folder
VAR → Select
Create or rename folder / le
New Folder / Rename
VAR
→Enter character / Backspace /
Save / Previous menu
Delete folder / le
Delete
Go to previous menu
Previous menu
36
Page 39

Trigger key 1/6
Trigger Type Trigger Holdoff
MENU MENU
Type
Edge
Source
CH1
Slope /
Coupling
Mode
Auto
Trigger key 2/6
Video Trigger
Type
Video
Source
CH1
Standard
NTSC
Polarity
Line
Holdoff
40.0ns
Set to
Minimum
CH1/2
NTSC / SECAM / PAL
Field 1 / Field 2 / Line
Select Trigger type or Trigger
Holdoff menu
Type
Select video trigger type
Type
Select trigger source
Source
Select video standard
Standard
Select video polarity
Polarity
Select video eld / line
Line
→ VAR
37
Page 40

Trigger key 3/6
Edge Trigger
Type
Edge
Source
CH1
Slope /
Coupling
Mode
Auto
Trigger key 4/6
Pulse Trigger
Type
Pules
Source
CH1
When <
20.0ns
Slope /
Coupling
Mode
Auto
CH1/2Ext/Line
To Slope / Coupling
Auto / Normal
CH1/2/Ext/Line
> / < / = / ≠
20ns ~ 10s
To Slope / Coupling
Auto / Normal
Select edge trigger type
Edge
Select trigger source
Source
Go to slope/coupling menu (page 39)
Slope/Coupling
Select trigger mode
Mode
Select pulse trigger type
Type
Select trigger source
Source
Select pulse trigger condition and pulse width
When
→ VAR
Go to slope/coupling menu (page 39)
Slope/Coupling
Select trigger mode
Mode
38
Page 41

Trigger key 5/6
Coupling/Slope
Slope
Coupling
AC
Rejection
Off
Noise Rej
Off
Previous
Menu
Trigger key 6/6
Trigger Holdoff
Holdoff
40.0ns
Set to
Minimum
/
AC/DC
LF / HF / Off
On / Off
40ns ~ 2.5s
Select trigger slope type
Slope
Select trigger coupling mode
Coupling
Select frequency rejection
Rejection
Turn noise rejection on / off
Noise Rej
Go back to previous menu
Previous Menu
Select Holdoff time
VAR
Set to minimum Holdoff time
Set to Minimum
39
Page 42

Utility key 1/11 (Utility #1)
Utility
Hardcopy
Menu
ProbeComp
Menu
Language
English
System
Info.
More
To Hardcopy
menu
To Probe
Comp menu
English/
Chinese(T) etc
Utility # 2 menu
Utility key 2/11 (Utility #2)
Utility
Go-NoGo
Menu
No Go When
Data logging
Menu
More
To Go-NoGo
Menu
To Data
Logging menu
To Utility #3 menu
Go to hardcopy menu
Hardcopy
Go to probe compensation menu
ProbeComp
Select language
Language
Show system information
System Info.
Go to the next Utility menu
More
Go to the Go-NoGo menu
Go-NoGo
Set the NoGo conditions to inside
/outside limits
No Go When
Go to the Data Logging Menu
Data Logging
Go to the next Utility menu
More
40
Page 43

Utility key 3/11 (Utility #3)
Calibration
Self CAL
Menu
USB Port
Auto Detect
More
To Self CAL menu
Auto Detect
Computer
Printer
To Utility #1 menu
Utility key 4/11 (Hardcopy -Save All)
Hardcopy - Save All
Function
Save All
Ink Saver
Off
Mem Leng
USB 1M
CSV Format
Fast
Previous
Menu
On / Off
USB Normal
USB 1M / 2M
Fast / Detail
Enter self calibration
Self CAL
Select USB port interface
USB Port
Go to the rst Utility menu
More
Select Hardcopy function
Function
Turn on/off Ink saver
Ink Saver
Set the memory length
Mem Leng
Change CSV format
CSV Format
Go to previous menu
Previous Menu
41
Page 44
Utility key 5/11 (Hardcopy -Printer)
Hardcopy - Printer
Function
Printer
Ink Saver
Off
Page Size
Default
Previous
Menu
On / Off
Default / 4x6 / A4
Utility key 6/11 (Hardcopy -Save Image)
Hardcopy - Save Image
Function
Save Image
Ink Saver
Off
Previous
Menu
On / Off
Select Hardcopy function
Function
Turn on/off Ink saver
Ink Saver
Set default page size
Page Size
Go to previous menu
Previous Menu
Select Hardcopy function
Function
Turn on/off Inksaver
Ink Saver
Go to previous menu
Previous Menu
42
Page 45

Utility key 7/11 (Probe compensation)
Probe compensation
Wave Type
Frequency
1K
Duty Cycle
50%
Default
1kHz
Previous
Menu
Utility key 8/11 (Go-NoGo)
Edit
Template
Max
Source
W01
Tolerance
0.4%
Save &
Create
Previous
Menu
Max / Min / Auto
Auto: CH1, CH2
Max|Min: Ref A /
Ref B, W01~W15
0.4% ~ 40%
0.4DIV ~ 40DIV
/
( only)
1k ~ 100k
( only)
5% ~ 95%
To previous menu
Select probe compensation signal
Wave Type
Set frequency for square wave
Frequency → VAR
Set duty cycle for square wave
Duty Cycle → VAR
Go to previous menu
Previous Menu
Switch between templates
Template
Select the template source
Source
Set the tolerance (% or Divisions)
Tolerance
Save the template
Save & Create
Go back to previous menu
Previous Menu
→ VAR
43
Page 46

Utility key 9/11 (Data Logging 1/2)
Data logging
Data logging
Off
Source
CH1
Setup
File
Utilities
Previous
Menu
On / Off
CH1 / CH2
To the Edit menu
(USB only)
To File Utilities
To previous menu
Utility key 10/11 (Data Logging 2/2)
Edit
Save
Waveform
Interval
2 secs
Duration
5 mins
Previous
Menu
Waveform / Image
2 secs ~ 30 mins
5 mins ~ 100 hrs
To previous menu
Utility key 11/11 (Self CAL Menu)
Turn Data Logging On/Off
Data logging
Set the logging source
Source
Go to the Data Logging Edit menu
Setup
Go to the File Utilities menu
File Utilities
Go back to previous menu
Previous Menu
Save the logs as waveform data or
as image les
Save
Set the logging interval
Interval → VAR
Set the duration of the record log
Duration → VAR
Go back to previous menu
Previous Menu
Self Cal.
Vertical
44
Start Vertical
Calibration
Start Vertical Calibration
Vertical
Page 47

Default Settings
Here are the factory installed panel settings which appear
when pressing the Save/Recall key → Default Setup.
Acquisition Mode: Normal
Channel Scale: 2V/Div
Coupling: DC
BW limit: Off
Cursor Source: CH1 Cursor: Off
Display Type: Vectors Accumulate: Off
Grid: Full
Horizontal Scale: 2.5us/Div
H Pos Adj: Fine
Math Type: + (Add)
Unit/Div: 2V
Measure Item: Vpp, Vavg, Frequency, Duty Cycle, Rise Time
Trigger Type: Edge
Mode: Auto
Coupling: DC
Noise Rejection: Off
Utility Hardcopy: SaveImage, InkSaver On ProbeComp: Square wave,
Go-NoGo Go-NoGo: Off
When:
Save/Recall
Invert: Off
Probe attenuation voltage: x1
Channel 1 & 2: On
Mode: Main Timebase
Hor Pos: 0
Position: 0.00 Div
Source: Channel1
Slope:
Rejection: Off
1k, 50% duty cycle
Source: CH1
Violating: Stop
Default
Setup
45
Page 48

Data Logging Data logging: Off
Setup: Waveform
Duration: 5 mins
Built-in Help
Source: CH1
Interval: 2 secs
The Help key shows the contents of the built-in help support.
When you press a function key, its descriptions appear in the display.
Applicable keys
Acquire
(Vertical) (Horizontal) (Trigger)
CH1 CH2
Display
Measure Save/Recall Hardcopy Run/StopCursor
MATH
Utility Help
Procedure 1. Press the Help key. The display
changes to the Help mode.
2. Press a functional key to access its
help contents. (example: Acquire key)
3. Use the Variable knob to scroll the Help
contents up and down.
4. Press the Help key again to exit the
Help mode.
Help
Autoset
MENUMENU
Single
FORCE
Help
Acquire
VARIABLE
Help
46
Page 49

5. MEASUREMENT
The Measurement chapter describes how to properly observe a signal using the oscilloscope’s
basic functions, and how to observe a signal in a detailed manner using some of the advanced
functions such as:
Automatic measurements, cursor measurements, and math operations.
Basic Measurements
This section describes the basic operations required in capturing and viewing an input signal. For
more detailed operations, see the following chapters.
• Measurements → from page 47
• Conguration → from page 78
Activating a channel
Activating a
channel
To activate an input channel, press the
Channel key, CH1 or CH2. The channel
indicator appears at the left side of the display
and the channel icon changes accordingly.
CH1 CH2
or
47
Page 50

Channel 1 off Channel 1 on
Channel
indicator
Channel icon
De-activating a
channel
Using Autoset
Background
48
To de-activate the channel, press the Channel key twice (once if the channel menu
is already selected).
settings to the best viewing conditions, in the following way.
• Selecting the horizontal scale
• Positioning the waveform horizontally
• Selecting the vertical scale
• Positioning the waveform vertically
• Selecting the trigger source channel
• Activating the channels
AC Priority Mode or Fit Screen Mode.
AC Priority mode will scale the waveform to
the screen removing any DC component.
best scale, including any DC components (offset).
Page 51
Procedure 1. Connect the input signal to the oscilloscope and press
the Autoset key.
2. The waveform(s) appears in the center of the display.
Before Autoset After Autoset
Undoing the
Autoset
To undo the Autoset, press Undo (available
for a few seconds).
Undo
Autoset
Undo option
Adjusting the
trigger level
If the waveform is still unstable, try
adjusting the trigger level up or down by
using the Trigger Level knob.
Change Modes To change the type of mode, press Type
(available for a few seconds). The Type
icon will change to next type.
Type Fit Screen, AC Priority
The next time the Autoset key is pressed,
the new mode will be activated.
LEVEL
Type
AC Priority
49
Page 52

Fit Screen AC Priority
Limitation Autoset does not work in the following situation.
• Input signal frequency less than 2Hz
• Input signal amplitude less than 30mV
Running and stopping the trigger
Background In the trigger Run mode, the oscilloscope constantly searches for a trigger
condition and updates the signal onto the display when thecondition is met.
In the trigger Stop mode, the oscilloscope stops triggering and thus the last
acquired waveforms stay in the display. The trigger icon at the top of the display
changes into Stop mode.
Pressing the Trigger Run/Stop key switches between the
Run and Stop mode.
Trigger Run mode Trigger Stop mode
50
Run/Stop
Page 53

Waveform
operation
Waveforms can be moved or scaled in both the Run and Stop mode. For details,
see page 85 (Horizontal position/scale) and page 91 (Vertical position/scale).
Changing the horizontal position and scale
For more detailed congurations, see page 85.
Setting the
horizontal
position
The horizontal position knob moves the waveform
left or right.
The position indicator moves along with thewaveform and the distance from the
center point is displayed as the offset in the upper side of the display.
Horizontal offset
Position indicator
Selecting the
horizontal
scale
Range 1ns/Div ~ 10s/Div, 1-2.5-5 increment
To select the timebase (scale), turn the TIME/DIV
knob; left (slow) or right (fast).
TIME/DIV
51
Page 54

Horizontal scale: 50us/div Horizontal scale: 250us/div
Changing the vertical position and scale
For more detailed conguration, see page 91.
Set vertical
position
Select vertical
scale
52
To move the waveform up or down, turn the vertical
position knob for each channel.
As the waveform moves, the vertical position of the cursor appears at the bottom
left corner of the display.
Run/Stop mode The waveform can be moved vertically in
both Run and Stop mode.
To change the vertical scale, turn
VOLTS/DIV
the VOLTS/DIV knob; left (down)
or right (up).
Range 2mV/Div ~ 10V/Div, 1-2-5 increments
The vertical scale indicator for each channel on the bottom left of the display
changes accordingly.
Page 55

Using the probe compensation signal
Background This section introduces how to use
the probe compensation signal for
general usage, in case the DUT
signal is not available or to get a
second signal for comparison. For
probe compensation details, see
page 135.
Note that the frequency accuracy and duty factor are not guaranteed. Therefore
the signal should not be used for reference purpose.
Waveform type
View the probe
compensation
1. Connect the probe between the compensation signal output and Channel
input.
waveform
2. Press the Utility key.
3. Press ProbeComp.
Square waveform used for probe
compensation. 1k ~ 100kHz, 5% ~ 95%.
Demonstration signal for showing
the effects of peak detection. See page
78 for peak detection mode details.
Utility
ProbeComp
Menu
53
Page 56

4. Press Wave Type repeatedly to
select the wave type.
Wave Type
Probe
compensation
5. (For only) To change
thefrequency, press Frequency
and use the Variable knob.
Range 1kHz ~ 100kHz
6. (For only) To change
the duty cycle, press Duty Cycle
and use the Variable knob.
Range 5% ~ 95%
For probe compensation details, see page 135.
Frequency
1 K
VARIABLE
Duty Cycle
50%
VARIABLE
54
Page 57

Automatic Measurements
The automatic measurement function measures input signal attributes and updates them in the
display. Up to 5 automatic measurement items can be updated at any one time on the side menus.
All automatic measurement types can be displayed on screen if necessary.
Measurement items
Overview Voltage type Time type Delay type
Voltage
measurement
items
Vpp
Vmax
Vmin
Vamp
Vhi
Vlo
Vavg
Vrms
ROVShoot
FOVShoot
RPREShoot
FPREShoot
Vpp Difference between positive
Vmax
Vmin Negative peak voltage.
Frequency
Period
RiseTime
FallTime
+Width
-Width
Dutycycle
and negative peak voltage
(=Vmax − Vmin)
Positive peak voltage.
FRR
FRF
FFR
FFF
LRR
LRF
LFR
LFF
Vamp Difference between global
Vhi
high and global low voltage
(=Vhi − Vlo)
Global high voltage.
55
Page 58

Vlo Global low voltage.
Vavg Averaged voltage of the rst cycle.
Vrms RMS (root mean square) voltage.
ROVShoot Rise overshoot voltage.
FOVShoot Fall overshoot voltage.
RPREShoot Rise preshoot voltage.
FPREShoot Fall preshoot voltage.
Time
measurement
items
Delay
measurement
items
56
Freq Frequency of the waveform.
Period Waveform cycle time
Risetime
Falltime
+Width
–Width Negative pulse width.
Duty Cycle Ratio of signal pulse
FRR
(=1/Freq).
Rising time of the pulse
(~90%).
Falling time of the pulse
(~10%).
Positive pulse width.
compared with whole cycle
=100x (Pulse Width/Cycle)
Time between:
Source 1 rst rising edge and
Source 2 rst rising edge
Page 59

FRF
FFR
FFF
LRR
LRF
LFR
LFF
Automatic measurement gating
Time between:
Source 1 rst rising edge and
Source 2 rst falling edge
Time between:
Source 1 rst falling edge and
Source 2 rst rising edge
Time between:
Source 1 rst falling edge and
Source 2 rst falling edge
Time between:
Source 1 rst rising edge and
Source 2 last rising edge
Time between:
Source 1 rst rising edge and
Source 2 last falling edge
Time between:
Source 1 rst falling edge and
Source 2 last rising edge
Time between:
Source 1 rst falling edge and
Source 2 last falling edge
Background Automatic measurements can be restricted to a specic area (gating). When
Turn gating on
cursors are turned on, the area between the cursors is used for automatic
measurements. When cursors are turned off, measurements are derived from all
the points that are displayed on screen.
1. Turn on cursors to enable gated automatic
measurements.
page 61
57
Page 60

2. Press the Measure key.
3. The measurement results appear on the menu bar, constantly updated. All
measurements are derived from the cursor positions. See Automatically
measuring the input signals for more details (page 58).
Horizontal Cursor
Turn gating off 4. Turn off cursors to turn off gated automatic
measurements.
Automatically measuring the input signals
Measure
page 61
Viewing the
measurement
result
58
1. Press the Measure key.
2. The measurement results appear on the menu bar,
constantly updated. 5 measurement slots (F1 to F5) can
be customized.
Measure
Page 61

Editing a
measurement
item
3. Press the corresponding menu key (F1~F5)
to select the measurement slot to be edited.
4. The editing menu appears.
Voltage
Vpp
Change
measurement
item
Change
measurement
source
5. Use the Variable knob to select a different
measurement item.
6. Press Source 1 repeatedly to change Source1
from CH1 to CH2 or MATH.
Range CH1, 2, Math
VARIABLE
Source 1
CH1
59
Page 62

7. Press Source 2 repeatedly to change the
channel for Source2.
Source 2
CH2
Range CH1, 2, Math
View all
measurements
8. Press F3 to view all measurement items.
Voltage
Vpp
9. All the measurements appear in the center of
the screen.
10. Press F3 again to return.
Note All the editing operations can still be performed when viewing all the measurement
items.
11. Press Previous Menu to conrm the item
selection and to go back to the measurement
results view.
Previous
Menu
60
Page 63

Cursor Measurements
Cursor lines, horizontal or vertical, show the precise position of the input waveforms or the math
operation results. The horizontal cursors can track time, voltage/current* and frequency, whilst the
vertical cursors can track voltage/current*. All measurements are updated in real-time. *probe type
dependant (page 94).
Using the horizontal cursors
Procedure 1. Press the Cursor key. The cursors appear in
Cursor
the display.
2. Press X↔Y to select the horizontal (X1&X2)
cursor.
3. Press Source repeatedly to select the source
channel.
Range CH1, 2, MATH
Source 1
CH1
4. The cursor measurement results will appear in the menu, F2 to F4.
Parameters X1 Time position of the left cursor. (relative to zero)
X2 Time position of the right cursor. (relative to zero)
X1X2 The difference between the X1 and X2.
Δ: us The time difference between X1 and X2.
f: Hz The time difference converted to frequency.
V/A The voltage/current difference from X1 and X2.
61
Page 64

Moving the
horizontal
cursors
M1:dB Position of the left cursor in dB.
M2:dB Position of the right cursor in dB.
Δ: dB The dB difference between M1 and M2.
Div: The frequency per division.
To move the left cursor, press X1 and then use
the Variable knob.
To move the right cursor, press X2 and then
use the Variable knob.
X1
-5.000uS
0.000uV
X2
5.000uS
0.000uV
To move both cursors at once, press X1X2
and then use the Variable knob.
Remove cursors Press Cursor to remove the onscreen cursors.
Using the vertical cursors
Procedure 1. Press the Cursor key.
2. Press X↔Y to select the vertical (Y1&Y2)
cursor.
3. Press Source repeatedly to select the
source channel.
Range CH1, 2, MATH
4. The cursor measurement results will appear in the menu.
Parameters
62
Y1 Voltage level of the upper cursor
Y2 Voltage level of the lower cursor
Cursor
Cursor
Source
CH1
Page 65

Y1Y2 The difference between the upper and lower cursor
V/A The voltage/current difference (Y1-Y2).
Moving the
vertical cursors
Remove cursors Press Cursor to remove the onscreen
To move the upper cursor, press Y1 and then
use the Variable knob.
To move the lower cursor, press Y2 and then
use the Variable knob.
To move both cursors at once, press Y1Y2
and then use the Variable knob.
Y1
123.4mV
Y2
12.9mV
Y1Y2
10.5mV
Cursor
cursors.
Math Operations
The Math operations can add, subtract, multiply or perform FFT/FFT RMS on the input waveforms.
The resulted waveform can be measured using the cursors, and saved or recalled just like normal
input signals.
Overview
Addition (+) Adds the amplitude of CH1 & CH2 signals.
Subtraction (–) Extracts the amplitude difference between CH1 & CH2.
Multiplication (×) Multiplies CH1 and CH2.
FFT Performs a FFT calculation on a signal. Four types of FFT windows are available:
Hanning, Flattop, Rectangular, and Blackman.
FFT RMS Performs a FFT RMS calculation on a signal. RMS is similar to FFT, however
the amplitude is calculated as RMS and not dB. Four types of FFT windows are
available: Hanning, Flattop, Rectangular, and Blackman.
63
Page 66

Hanning FFT
window
Frequency resolution Good
Amplitude resolution Not good
Suitable for.... Frequency measurement on
Flattop FFT
window
Frequency resolution Not good
Amplitude resolution Good
Suitable for.... Amplitude measurement on
Rectangular
FFT window
Frequency resolution Very good
Amplitude resolution Bad
Suitable for.... Single-shot phenomenon (this
Blackman FFT
window
Frequency resolution Bad
Amplitude resolution Very good
Suitable for.... Amplitude measurement on
Adding, subtracting or multiplying signals
periodic waveforms
periodic waveforms
mode is the same as having no
window at all)
periodic waveforms
Procedure 1. Activate both CH1 and CH2.
2. Press the Math key.
64
CH1 CH2
MATH
Page 67
3. Press Operation repeatedly to
select addition (+), subtraction (–) or
multiplication (×).
4. The math measurement result appears in
the display.
Operation
CH1 + CH2
Unit / Div
2V
5. To move the math result vertically, use
the Variable knob. The position will be
displayed in Posistion.
6. To clear the math result from the display,
press the Math key again.
Using the FFT function
Procedure 1. Press the Math key.
2. Press Operation repeatedly to select
FFT or FFT RMS
3. Press Source repeatedly to select the
source channel.
4. Press Window repeatedly to select the
FFT window type.
VARIABLE
Position
0.00 Div
MATH
MATH
Operation
FFT
Source
CH1
Window
Hanning
65
Page 68

5. The FFT result appears. The horizontal scale changes from time to frequency,
and the vertical scale from voltage to dB or RMS.
6. To move the FFT waveform vertically,
press Vertical repeatedly until Div is
selected. Use the Variable knob to
change the vertical scale.
Vertical
2V
0.00 Div
VARIABLE
Range –12.00 Div ~ +12.00 Div
7. To select the vertical scale of an FFT
waveform, press Vertical repeatedly until
dB is selected. Use the Variable knob to
change the vertical scale.
Vertical
1 dB
0.00 Div
VARIABLE
Range 1, 2, 5, 10, 20 dB/Div
8. To select the vertical scale of an FFT
VOLTS/DIV
rms waveform, use the VOLTS/DIV knob
to change the vertical scale. The scale
will be shown in the Vertical soft-key.
Range Volts/Div
9. To zoom in on the FFT/FFT rms
waveform, press Zoom repeatedly until
X is selected. Use the Variable knob to
change the Zoom level.
Zoom
1X
0.0000Hz
VARIABLE
Range 1/2/5/10/20X
66
Page 69

10. To move the FFT/FFT rms waveform
horizontally, press Zoom repeatedly until
Hz is selected. Use the Variable knob to
change the horizontal position.
Zoom
1X
0.0000Hz
VARIABLE
Range 0~50.000MHz
11. To clear the FFT result from the display,
MATH
press the Math key again.
Go No-Go Testing
Overview
Background Go-NoGo testing checks if a waveform conforms to a user-specied
Settings Item Default Details
maximum and minimum boundary (template). The testing can be
set to stop or continue each time the template has or has not been
violated by the input waveform.
NoGo criteria: When inside
Inside Page 68
or outside the boundary
Source Channel 1 Page 68
Test continue or stop when
Stop Page 69
NoGo occurs
Boundary (template) – selects
Auto (0.4%) Page 69
the minimum and maximum
boundaries (template) from a
single waveform
Run Tests Page 73
67
Page 70

Edit: NoGo When
Procedure 1. Press the Utility key.
2. Press the More key.
3. Press No Go When repeatedly to select
the NoGo conditions.
NoGo when the waveform is inside the boundary (template)
NoGo when the waveform is outside of the boundary (template)
Edit: Source
Procedure 1. Press the Utility key.
2. Press the More key.
3. Press the Go-NoGo Menu key.
4. Press Source repeatedly to select the
source channel (CH1 or CH2).
Utility
More
NoGoWhen
Utility
More
Go-NoGo
Menu
Source
CH1
68
Page 71

Edit: NoGo Violation Conditions
Procedure 1. Press the Utility key.
2. Press the More key.
3. Press the Go-NoGo Menu key.
4. Press Violating repeatedly to select the
NoGo conditions.
Stop Stops the test when the NoGo conditions have been met.
Continue The tests continue even when the NoGo conditions have been met.
Utility
More
Go-NoGo
Menu
Violating
Stop
Edit: Template (boundary)
Background The NoGo template sets the upper and lower amplitude boundary. Two methods
are available: Min/Max and Auto.
Min/Max Selects the upper boundary (Max) and lower boundary
(Min) as separate waveforms, from the internal memory.
The upper boundary is saved to Ref A, the lower
boundary is saved to Ref. B.
Advantage: The template shape and distance
(allowance) between the source signal are fully
customizable.
69
Page 72

Disadvantage: The waveforms (templates) have to be
stored internally prior to this selection.
Auto Creates the upper and lower boundary (template)
from the source signal, not from an internally stored
waveform.
Advantage: No need to store the waveforms prior to
this selection.
Disadvantage: The template shape is proportional to the
source signal. The distance (allowance) between the
source signal and the upper and lower template is the
same.
Procedure 1. The template is based on the source signal. Ensure the source signal appears
on the display.
2. Press the Utility key.
Utility
3. Press the More key.
More
4. Press the Go-NoGo Menu key.
5. Press the Template Edit key.
6. Press Template repeatedly to select the
upper (Max) or lower (Min) boundaries.
Go - NOGO
Menu
Template
Edit
Template
Max
70
Page 73

7. Press Source and use the Variable knob
to select the waveform template.
Max Waveform A: Ref A, W01~W15
Min Waveform B: Ref B, W01~W15
8. Press Position and use the Variable
knob to set the waveform amplitude.
9. Repeat steps 5-7 for the other template setting (Max or Min).
10. When both Max and Min templates have
been congured, press Save & Create to
save the templates.
Source
W01
VARIABLE
Source
W01
VARIABLE
Save&
Create
Max: Waveform A
Position
Min: Waveform B
71
Page 74

Auto 1. The template is based on the source signal. Ensure the source signal appears
on the display.
2. Press the Utility key. Utility
3. Press the More key.
4. Press the Go-NoGo Menu key.
5. Press the Template Edit key.
6. Press Template repeatedly to select the
Auto template.
7. Press Source and use the Variable knob
to select the template source.
Source CH1, CH2
8. Press Tolerance repeatedly to choose
the tolerance units, % or Div. Use the
Variable knob to set the tolerance. The
tolerance is for both the horizontal and
vertical axis.
% 0.4% ~ 40.0%
More
Go - NOGO
Menu
Template
Edit
Template
Auto
Source
CH1
VARIABLE
Tolerance
0.4%
VARIABLE
72
Page 75

Div 0.04 Div ~ 4.0 Div
9. When the Auto template has been
congured, press Save & Create to save
the template.
Auto template
Run Go-NoGo Tests
Save&
Create
Tolerance
Source waveform
Procedure 1. Press the Utility key.
2. Press the More key.
3. Press the Go-NoGo Menu key.
Ensure the source signal and boundary templates appear on the screen.
Utility
More
Go - NOGO
Menu
73
Page 76

4. Press Go-NoGo. The test starts and
stops according to the conditions set on
page 68, 69. To stop the test that has
already started, press Go-NoGo again.
5. The test results appear in the Ratio soft-
key. The numerator denotes the total
number of failed tests. The denominator
denotes the total number of tests.
Numerator: Number of “failed“ tests.
Denominator: Total number of tests.
Go - NOGO
Menu
Ratio:
2BMP
9BMP
Data Logging
Overview
Background The Data logging function allows you to log data or a screen image
over timed intervals for up to 100 hours to a USB ash drive.
The data or images are stored to a USB ash drive in a directory
named LogXXXX. LogXXXX is incremented each time the data
logging function is used.
The les saved in the LogXXXX directory are named DSXXXX.
CSV, or DSXXXX.BMP for data or image les, respectively. At each
timed interval data or an image le is saved and the le number
incremented. For example, DS0000 is the rst logged data, DS0001
is the second and so on.
74
Page 77

Edit: Source
Procedure 1. Press the Utility key.
Utility
2. Press the More key.
More
3. Press the Data logging Menu key.
4. Press Source repeatedly to select the
source channel (CH1 or CH2).
Data logging
Menu
Source
W01
Edit: Setup Parameters
Background The logging function must set the type of data that will be logged (waveform/
Procedure
image), the capture interval time and the duration of the data logging.
1. Press the Utility key.
Utility
2. Press the More key.
More
3. Press the Data logging Menu key.
Data logging
Menu
4. Press the Setup key.
Setup
75
Page 78

5. Press Save repeatedly to log data or
screen images.
6. Press Interval and use the Variable knob
to select the interval time.
Interval 2 secs~ 2min (duration = 5 min)
time 2 secs~ 5 min (duration 5~ 30 min)
2 secs~ 30 min (duration 30+ min)
7. Press Duration and use the Variable
knob to set the duration time.
Duration 5 mins ~ 100 hours
Save
Waveform
Interval
2 mins
VARIABLE
Duration
5 mins
VARIABLE
8. Press Previous menu to return to the
Data logging menu. Data logging is now
ready to begin.
Previous
Menu
76
Page 79

Run Data logging
Background Ensure the data source (page 75) and data logging setup has been set (page 75).
Procedure
1. Insert a USB ash drive into the USB
front panel port.
2. Press the Utility key.
3. Press the More key.
4. Press the Data logging Menu key.
5. Press Data logging to turn data logging
On. Data/image les start logging to the
USB ash drive automatically. To stop
the Data logging, press the Data logging
key again.
Utility
More
Data logging
Menu
Data logging
On
77
Page 80

6. CONFIGURATION
The Conguration chapter describes how to congure panel settings to make measurements and
observations suited to the application needs.
Acquisition
The acquisition process samples the analog input signals and converts them into digital format for
internal processing. You may select the normal, average, or peak detect acquisition mode.
Selecting the acquisition mode
Procedure 1. Press the Acquire key.
2. Select the acquisition mode
between Normal, Average and
Peak Detect.
Range Normal All of the acquired data is used to
draw the waveform.
78
Acquire
Normal
Average
Peak
Detect
Page 81

Average Multiple data is averaged to form a
waveform. This mode is useful for
drawing a noise-free waveform. To select
the number, press Average repeatedly.
Average number: 2, 4, 8, 16, 32, 64,
128, 256
Peak detect To activate the Peak detect mode, press
Peak-Detect. Only the minimum and
maximum value pairs for each acquisition
interval (bucket) are used. This mode is
useful for catching abnormal glitches in
a signal.
Peak detect
effect using the
probe comp.
waveform
1. One of the probe compensation
waveforms can demonstrate the peak
detection mode. Connect the probe to
the probe compensation output.
2. Press the Utility key.
3. Press ProbeComp.
4. Press Wave Type and select the
waveform.
5. Press the Autoset key. The oscilloscope
positions the waveform in the center of
the display.
6. Press the Acquire key
Utility
ProbeComp
Menu
Wave Type
Autoset
Acquire
79
Page 82

7. Press Normal.
Normal
8. Press Peak-Detect and see that a spike
noise is captured.
Peak
Detect
Example The peak detect mode reveals the occasional glitch.
Normal mode Peak detect mode
Selecting Delay mode
Background When delay time is ON, the displayed output is delayed for a dened amount of
Delay On With Delay On the expansion point and trigger point become separated by the
time from the trigger point. Using the delay function is useful for observing an area
of the waveform that occurs some time after the trigger point.
amount of delay time. As the delay time is increased the trigger point moves left
from the expansion point. When the horizontal scale is adjusted, the waveform
expands from the expansion point, not the trigger point.
80
Page 83

Delay Off With Delay Off the expansion point and trigger point are always in the same
position. Thus when the horizontal scale is adjusted, the waveform expands from
the trigger point.
Procedure 1. Press the Acquire key.
2. Press Delay On/Off to toggle Delay On/
Off.
3. Use the Horizontal Position knob to
increase or decrease the delay time
when Delay is set to On.
4. Adjust the horizontal scale to zoom into
the waveform.
Acquire
Delay
On
TIME/DIV
81
Page 84

Real time vs Equivalent time sampling mode
Background The oscilloscope automatically switches between two sampling modes, Real-time
Real-time
sampling
Equivalent-time
sampling
and Equivalenttime, according to the number of active channels and sampling
rate.
Once sampled data is used to reconstruct a single waveform. Short-time events
might get lost if the sampling rate gets too high. This mode is used when the
sampling rate is relatively low (1GSa/s or lower).
Multiple numbers of sampled data are accumulated to reconstruct a single
waveform. ETS restores more waveform detail but takes longer to update the
waveform. This mode is used when the sampling rate becomes higher than
1GSa/s. The maximum equivalent-time sampling rate is 25GSa/s.
82
Page 85

Display
The Display section describes how to congure the display settings:
drawing type, waveform accumulation, contrast adjustment, and grid settings.
Selecting vector or dot drawing
Procedure 1. Press the Display key.
2. Press Type repeatedly to select the
waveform drawing.
Display
Type
Vectors
Types Dots Only the sampled dots are displayed.
Vectors The sampled dots are connected by lines.
Accumulating the waveform
Background Accumulation preserves the old waveform drawings and overwrites new
Procedure
waveforms on top of it. It is useful for observing waveform variation.
1. Press the Display key.
2. Press Accumulate on the waveform
accumulation.
Display
Accumulate
On
3. To clear the accumulation and start it
over (refresh), press Refresh.
Refresh
83
Page 86

Example
Accumulation off Accumulation on
Adjusting the display contrast
Procedure 1. Press the Display key.
2. Press Contrast.
Turn the Variable knob left to lower the
Contrast
VARIABLE
contrast (dark display) or right to raise the
contrast (bright display).
Selecting the display grid
Procedure 1. Press the Display key.
2. Press the grid icon repeatedly to select
the grid.
Parameters Shows the full grid.
84
Full
Shows the outer frame and X/Y axis.
Shows only the outer frame.
Display
Display
Page 87

Horizontal View
The Horizontal view section describes how to congure the horizontal scale, position, waveform
update mode, window zoom, and X-Y mode.
Moving the waveform position horizontally
Procedure The horizontal position knob moves the waveform left or
right. The position indicator at the top of the display shows
the center and current position.
Center position Moving right
Selecting the horizontal scale
Select horizontal
scale
To select the timebase (scale), turn the TIME/DIV knob; left
(slow) or right (fast).
Range 1ns/Div ~ 50s/Div, 1-2.5-5-10 increment
The timebase indicator at the bottom of the display updates the current horizontal
scale.
TIME/DIV
85
Page 88

Selecting the waveform update mode
Background The display update mode is switched automatically or manually according to the
horizontal scale.
Main mode Updates the whole displayed waveform at once. The main mode is automatically
Roll mode Updates and moves the waveform gradually from the right side of the display
Selecting the
Roll mode
manually
selected when the horizontal scale (timebase) is fast.
Horizontal scale ≤100ms/div
Trigger All modes available
to the left. The Roll mode is automatically selected when the horizontal scale
(timebase) is 50ms or slower.
When in the Roll mode, an indicator appears at the bottom of the display. When
in roll mode the record length is 2M (1 channel) or 1M (2 channel).
Main mode Roll mode
Timebase ≥50ms/div (≤1.25MS/s)
Trigger Auto mode only
1. Press the Horizontal menu key.
MENU
2. Press Roll. The horizontal scale automatically
becomes 50ms/div and the waveform starts
scrolling from the right side of the display (If the
Roll
oscilloscope is already in the Roll mode, there
will be no change).
86
Page 89

Zooming the waveform horizontally
Procedure/
1. Press the Horizontal Menu key.
range
2. Press Window.
3. Use the horizontal position knob to move the
zoom range sideways, and TIME/DIV knob to
change the zoom range width.
The width of the bar in the middle of the display is the actual zoomed area.
Zoom range 1ns ~ 25s
4. Press Window Zoom. The specied range gets
zoomed.
Example
Setting the zoom width Zooming in
Zooming width
MENU
Window
TIME/DIV
Window
Zoom
87
Page 90

Viewing waveforms in the X-Y mode
Background The X-Y mode compares the voltage of Channel 1 and Channel 2 waveforms in a
single display. This mode is useful for observing the phase relationship between
the two waveforms.
Procedure
1. Connect the signals to Channel 1 (X-axis)
and Channel 2 (Y-axis).
2. Make sure both Channel 1 and 2 are
CH1 CH2
activated.
3. Press the Horizontal key.
MENU
4. Press XY. The display shows two
XY
Adjusting the
X-Y mode
waveform
waveforms in X-Y format; Channel 1 as
X-axis, Channel 2 as Y-axis.
Horizontal position CH1 Position knob
Horizontal scale CH1 Volts/Div knob
Vertical position CH2 Position knob
Vertical scale CH2 Volts/Div knob
Example
88
Page 91

Horizontal Adjustment Menu
Background The horizontal adjustment menu allows markers to be set at different times
relative to the Horizontal position marker at 0 seconds. Each marker is linked to
the mark directly before and after (in time). There can be up to 30 markers linked
together.
1. Press the Horizontal menu key twice to
MENU MENU
enter the horizontal adjustment menu
2. Press H Pos Adj to toggle between coarse
and ne adjustments.
H Pos Adj
Fine
3. Adjust the horizontal position with the
horizontal position knob.
Set marker 4. Press Set/Clear to create a marker at the
current horizontal position.
Delete marker 5. If there is already a marker at the current
horizontal position press Set/Clear to delete
the current marker.
Reset horizontal
position
6. Press Reset to reset the horizontal position
to 0 seconds when the trigger is running, or
to the last position before the trigger was
Set / Clear
180.0uS
Set / Clear
180.0uS
Reset
Hor Pos
stopped.
89
Page 92

Navigate
markers
7. Press Previous to go to the previous
marker.
Previous
180.0uS
8. Press Next to go to the next marker.
Position
Indicator Marker
Next
340.0uS
90
Page 93
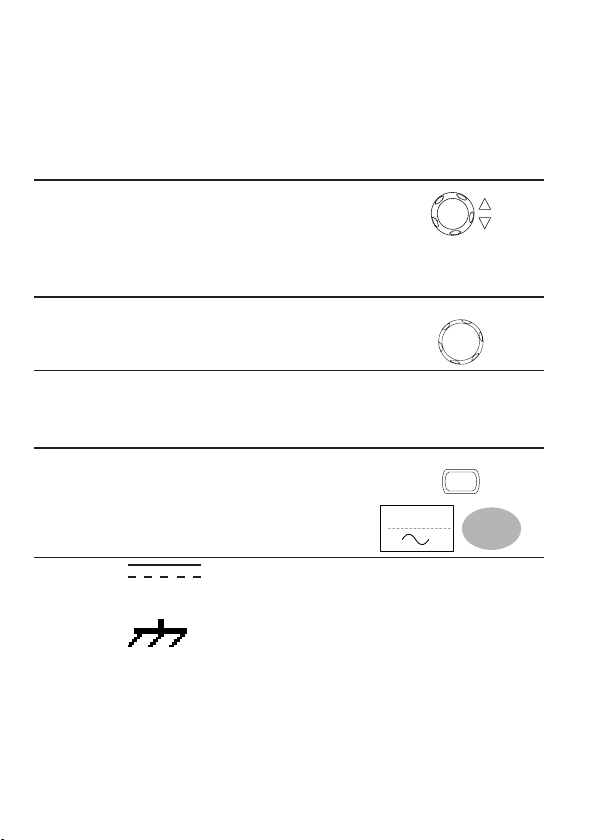
Vertical View (Channel)
The Vertical view section describes how to set the vertical scale, position, bandwidth limitation,
coupling mode, and attenuation.
Moving the waveform position vertically
Procedure To move the waveform up or down, turn the
vertical position knob for each channel.
Selecting the vertical scale
Procedure To change the vertical scale, turn the VOLTS/
DIV knob; left (down) or right (up).
Range 2mV/Div ~ 10V/Div, 1-2-5 increments
VOLTS/DIV
Selecting the coupling mode
Procedure 1. Press the Channel key.
2. Press Coupling repeatedly to select the
coupling mode.
Range DC coupling mode. The whole
portion (AC and DC) of the
signal appears on the display.
Ground coupling mode. The
display shows only the zero
voltage level as a horizontal
line. This mode is useful for
measuring the signal amplitude
with respect to the ground
level.
CH1
Coupling
91
Page 94

Expand Vertical Scale Center / Ground
AC coupling mode. Only the AC
portion of the signal appears on
the display. This mode is useful
for observing AC waveforms
mixed with DC signal.
Background Normally when the vertical scale is increased, the scaled image is centered from
ground. However a signal with a voltage bias could be obscured when the vertical
scale is increased. The Expand Center function expands the image from the center
of the signal, rather than ground.
Expand Ground
Position Indicator
Position Indicator
Expand Center
Position Indicator
Position Indicator
92
Page 95

Procedure 1. Press the Channel key.
CH1
2. Press F5 to toggle between Expand Center
and Expand Ground.
3. To change the vertical scale, turn the VOLTS/
DIV knob; left (down) or right (up).
4. The vertical scale indicator on the bottom left
of the display changes accordingly.
Inverting the waveform vertically
Procedure 1. Press the Channel key.
2. Press Invert. The waveform becomes inverted
(upside down) and the Channel indicator in the
display shows a down arrow.
Original Inverted
Expand
Center
VOLTS/DIV
CH1
Invert
Off
93
Page 96

Limiting the waveform bandwidth
Background Bandwidth limitation puts the input signal into a 20MHz (−3dB) low-pass lter. This
function is useful for cutting off high frequency noise to see the clear waveform
shape.
Procedure 1. Press the Channel key.
2. Press BW Limit to turn on or off the limitation.
When turned on, the BW indicator appears next to
the Channel indicator in the display.
CH1
BW Limit
Off
Example BW Limit Off BW Limit On
Selecting the probe attenuation level
Background The probe can be set to either voltage or current. A signal probe has an
attenuation switch to lower the original DUT signal level to the oscilloscope input
range, if necessary. The probe attenuation selection adjusts the vertical scale
so that the voltage or current level on the display reects the real value, not the
attenuated level.
Procedure 1. Press the Channel key.
CH1
94
Page 97

2. Press F4 repeatedly to select voltage or current
probes.
3. Use the variable knob to edit the voltage or
Probe
x1
VARIABLE
current attenuation..
4. The voltage/current scale in the channel indicator
changes accordingly. There is no change in the
waveform shape.
Range 0.1X~2000X (1-2-5 steps)
Note The attenuation factor adds no inuence on the real signal; it only changes the
voltage/current scale on the display.
95
Page 98

Trigger
The Trigger function congures the conditions by which the oscilloscope captures the incoming
signals.
Trigger type
Edge Triggers when the signal crosses an amplitude threshold in either positive or
negative slope.
Video Extracts a sync pulse from a video format signal and triggers on a specic line
Pulse Triggers when the pulse width of the signal matches the trigger settings.
Indicators Edge / Pulse Video
or eld.
(CH1, Edge, Rising edge,
DC coupling)
(CH1, Video, Positive polarity, NTSC
standard)
Trigger parameter
Trigger source CH1, 2 Channel 1, 2 input signals
Line AC mains signal
Ext External trigger input
signal
Trigger mode Auto The oscilloscope updates the input signal regardless of the
trigger conditions (if there is no trigger event, the oscilloscope
generates an internal trigger). Select this mode especially
when viewing rolling waveforms at a slow timebase.
96
EXT TRIG
Page 99

The Auto trigger status appears in the upper right corner of
the display.
Single The oscilloscope acquires the input
SINGLE
signals once when a trigger event
occurs, then stops acquiring.
Pressing the Single key again will repeat the process. The
Single trigger status appears in the upper right corner of the
display.
(Searching) (Triggered)
Normal The oscilloscope acquires and updates the input signals only
when a trigger event occurs.
The Normal trigger status appears in the upper right corner
of the display.
(Searching) (Triggered)
Holdoff The holdoff function denes the waiting period before the VDO-2000A starts trig-
gering again after a trigger point. The Holdoff function ensures a stable display.
Video standard
(video trigger)
NTSC National Television System Committee
PAL Phase Alternative by Line
SECAM SEquential Couleur A Mémoire
Sync polarity
(video trigger)
Video line
Selects the trigger point in the video signal.
Positive polarity
Negative polarity
(video trigger)
eld 1 or 2
97
Page 100

line 1~263 for NTSC, 1~313 for PAL/SECAM
Pulse condition
Sets the pulse width (20ns ~ 10s) and the triggering condition.
(pulse trigger)
> Longer than = Equal to
< Shorter than ≠ Not equal to
Trigger slope
Triggers on the rising edge.
Triggers on the falling edge.
Trigger coupling AC
DC
Frequency
LF
rejection
HF
Noise rejection Rejects noise signals.
Trigger level
LEVEL
Triggers only on AC component.
Triggers on AC + DC component.
Puts a high-pass lter and rejects the frequency below 50kHz.
Puts a low-pass lter and rejects the frequency above 50kHz.
Using the trigger level knob moves the trigger point up or
down.
Conguring Holdoff
Background The Holdoff function denes the waiting period before VDO-2000A starts
triggering again after the trigger point. The holdoff function is especially useful
for waveforms with two or more repetitive frequencies or periods that can be
triggered.
Panel operation 1. Press the Trigger menu key twice.
2. To set the Holdoff time, use the Variable knob.
The resolution depends on the horizontal scale.
Range 40ns~2.5s
98
MENU MENU
VARIABLE
Short Long
 Loading...