

VDO MAP 7w Plus GPS, MAP 7wi Plus GPS, MAP cx Plus GPS, MAP 7cwi Plus GPS, MAP 11csE Plus GPS User Manual
...Page 1
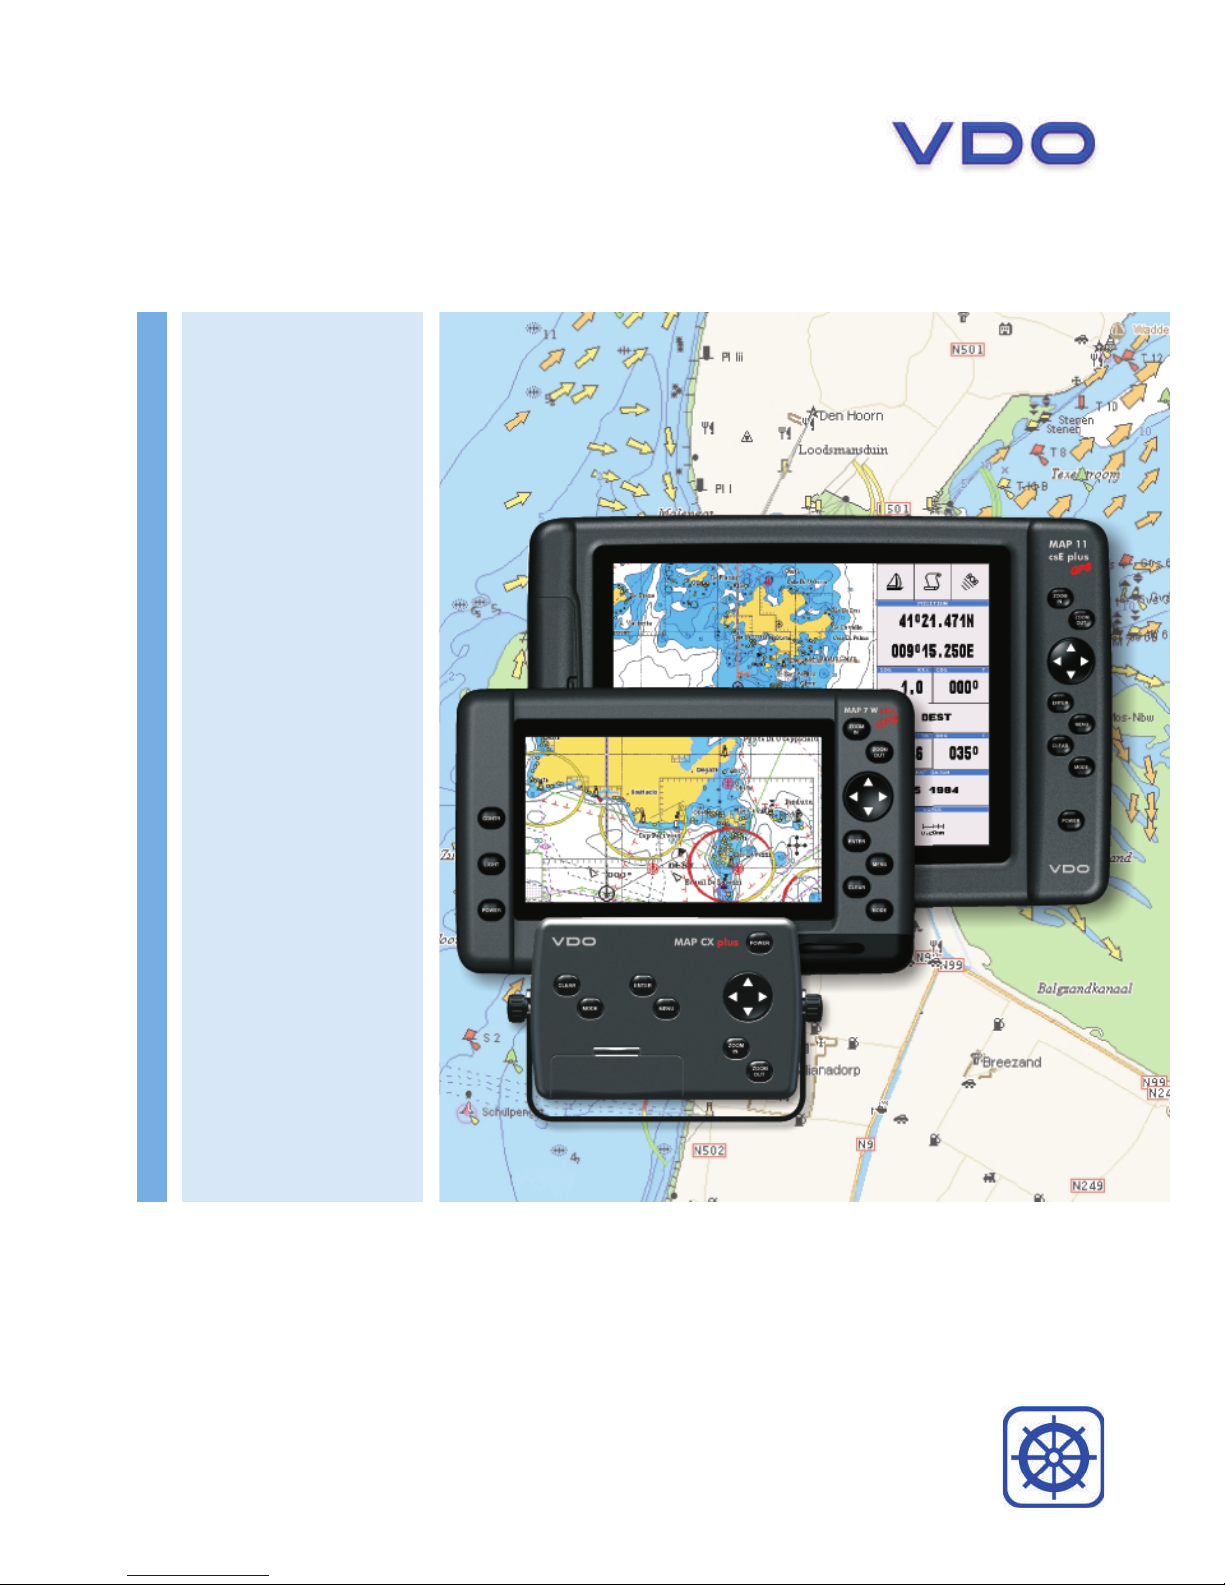
VDO Chart Plotters
www.vdo-marine.com
_ MAP 7 V GPS
_ MAP 7 cs GPS
_ MAP 7 W/Wi/Plus GPS
_ MAP 11 csE/Plus GPS
Page 2

CHART PLOTTER NAME DESCRIPTION SOFTWARE
MAP 7w Plus GPS 7" Sunlight Readable WVGA Color Display S4egVD8wc
External Smart GPS Receiver & Video Input
MAP 7wi Plus GPS 7" Sunlight Readable WVGA Color Display S4igVD8wc
Internal GPS Receiver & Video Input
MAP 7cwi Plus GPS 7" Sunlight Readable WVGA Color Display S4igVD8wc
Internal GPS Receiver & Fish Finder & Video Input
MAP 11csE Plus GPS 11" Sunlight Readable Color Display S5egVD11c
External Smart GPS Receiver & Video Input
MAP cx Plus GPS Controller S5egVDctc
External Smart GPS Receiver & Video Input
Copyright 2009 VDO Marine - Germany
All rights reserved. Printed in Italy. No part of this publication may be reproduced or distributed in any form or by any
means, or stored in a database or retrieval system, without prior written permission of the publisher.
User Manual
code: (E1600-050309e)
Page 3

4
User Manual
Page 4

5
User Manual
Contents
About this User Manual ............................................................................... 11
INTRODUCTION ............................................................................... 11
CONVENTIONS USED ............................................................................... 11
EXPERT FUNCTIONS ............................................................................... 11
HOW THIS USER MANUAL IS ORGANIZED ............................................................ 12
IF YOU NEED ASSISTANCE ............................................................................... 12
Important Information ............................................................................... 13
WARNING ............................................................................... 13
CAUTION ............................................................................... 13
CLEANING PROCEDURE FOR THE PLOTTER SCREEN ............................................... 13
1. Overview ............................................................................... 15
1.1 CHART PLOTTER ............................................................................... 15
1.2 C-MAP BY JEPPESEN MAX CARTOGRAPHY INFORMATION ..................................... 15
Data Features ............................................................................... 15
Presentation Features ............................................................................... 16
Cartographic Data related Features .............................................................. 16
MAX and NT/NT+ C-CARD coexistence .......................................................... 17
1.3 GPS ............................................................................... 17
How GPS works ............................................................................... 17
Position Fixing Accuracy: HDOP .................................................................... 18
2. Getting Started ............................................................................... 19
2.1 SWITCHING ON/OFF ............................................................................... 19
Switching On ............................................................................... 19
Switching Off ............................................................................... 19
2.2 CHANGING BACKLIGHT AND CONTRAST ....................................................... 19
2.3 SELECTING THE USER INTERFACE LANGUAGE ............................................... 19
2.4 SELECTING THE CHART LANGUAGE
E
........................................................................................................
20
2.5 USING C-MAP BY JEPPESEN DATA C-CARD ........................................................ 20
2.6 SIMULATION MODE ............................................................................... 20
2.7 CONTROLLING THE DISPLAY ....................................................................... 21
Changing Display Mode ............................................................................... 21
Chart with Engine Data ............................................................................... 23
Engine Data page ............................................................................... 23
Moving around the Chart and Changing Chart Scale ........................................ 24
Finding Your Boat Position ........................................................................... 24
Selecting Screen AmplifierE.......................................................................... 24
Selecting Map Orientation
E
...............................................................................................................................
24
2.8 NAVIGATION TO A SINGLE DESTINATION ..................................................... 24
2.9 EBL/VRM FUNCTION ............................................................................... 25
Inserting EBL/VRM ............................................................................... 25
Deleting EBL/VRM ............................................................................... 25
Editing EBL/VRM ............................................................................... 25
2.10 MAN OVERBOARD (MOB) ............................................................................ 25
Inserting MOB ............................................................................... 25
Deleting MOB ............................................................................... 25
3. Operations ............................................................................... 27
3.1 USER POINTS: MARKS AND WAYPOINTS ....................................................... 27
Creating Waypoint ............................................................................... 27
Page 5

6
User Manual
Creating Mark ............................................................................... 27
Selecting the User Points List page ............................................................... 27
Editing User Point ............................................................................... 27
Deleting User Point ............................................................................... 27
Moving User Point ............................................................................... 27
Locating User Point on Map ......................................................................... 28
Sending/Receiving User Points ..................................................................... 28
3.2 ROUTES ............................................................................... 28
Selecting Active Route ............................................................................... 28
Creating a Route ............................................................................... 28
Inserting Route name ............................................................................... 28
Selecting Route Color ............................................................................... 28
Deleting Route ............................................................................... 28
Following a Route (Activate the Navigation) ................................................... 29
Inserting Waypoint ............................................................................... 29
Reversing Route ............................................................................... 29
Selecting Route Report page ........................................................................ 29
Sending/Receiving RouteE........................................................................... 29
Safe Route Checking ............................................................................... 29
3.3 GOTO FUNCTION ............................................................................... 30
Navigation to Waypoint ............................................................................... 30
Deleting destination ............................................................................... 30
3.4 USING TRACK ............................................................................... 31
Setting up a Track Step .............................................................................. 31
Selecting Track Color ............................................................................... 31
Displaying Track ............................................................................... 31
Activating/Deactivating Track Recording ........................................................ 31
Clearing Track ............................................................................... 31
Selecting Track Number .............................................................................. 31
3.5 INFO ............................................................................... 32
Setting Automatic InfoE............................................................................... 32
Selecting Automatic Info ............................................................................. 32
Displaying Expanded Info page (Full Info) ...................................................... 32
Info Tree and Expanded Info page ................................................................ 32
Info on objects with Pictures ........................................................................ 32
Quick Info on Lakes ............................................................................... 33
Full Info on Lakes ............................................................................... 34
3.6 PORT & TIDE INFO ............................................................................... 34
Getting Port Info ............................................................................... 34
Getting Tide Info ............................................................................... 35
3.7 FIND FUNCTION ............................................................................... 36
Finding Nearest Services ............................................................................. 36
Finding Tide Stations ............................................................................... 36
Finding Wrecks ............................................................................... 37
Finding Obstructions ............................................................................... 37
Finding Port By Name ............................................................................... 37
Finding Port By Distance ............................................................................. 37
Finding Lakes Information ........................................................................... 37
Finding Lakes By Name ............................................................................... 38
Finding Points Of Interest ............................................................................ 38
Finding Coordinates ............................................................................... 38
3.8 ALARMS ............................................................................... 38
Arrival Alarm ............................................................................... 38
XTE Alarm ............................................................................... 38
Anchor Alarm ............................................................................... 38
Depth Alarm ............................................................................... 38
Audible Alarm ............................................................................... 39
Grounding Alarm ............................................................................... 39
Grounding Alarm Range .............................................................................. 39
Grounding Alarm Report
E
...................................................................................................................................
39
Page 6

7
User Manual
External Alarm ............................................................................... 39
3.9 USER C-CARD ............................................................................... 39
User C-CARD page ............................................................................... 39
Formatting User C-CARD ............................................................................. 40
Saving File on User C-CARD ......................................................................... 40
Loading File from User C-CARD .................................................................... 40
Deleting File from User C-CARD .................................................................... 40
Changing User C-CARD ............................................................................... 41
4. User Setting Up ............................................................................... 43
4.1 MAP MENU ............................................................................... 43
Zoom Type
E
............................................................................... 43
Fonts & Symbols
E
............................................................................... 43
Perspective View
E
............................................................................... 43
Dynamic Nav Aids ............................................................................... 44
Map Orientation
E
............................................................................... 44
Mixing Levels
E
............................................................................... 44
Safety Status BarE (DSI = Data Safety Indicator) ........................................... 44
Satellite Imagery ............................................................................... 45
Palette ............................................................................... 45
Currents Prediction ............................................................................... 46
4.2 OTHER MAP CONFIGURATIONS .................................................................... 46
Display Mode ............................................................................... 46
Marine Settings ............................................................................... 46
Depth Settings ............................................................................... 47
Land Settings ............................................................................... 47
Chart Settings ............................................................................... 47
Underwater Objects Settings ....................................................................... 48
4.3 CONFIGURATIONS ............................................................................... 48
4.4 ADVANCED SETTINGS ............................................................................... 49
Setup menu ............................................................................... 49
Navigate Menu ............................................................................... 49
CompassE menu ............................................................................... 50
External EngineE menu ............................................................................... 50
4.5 AIS ............................................................................... 51
AIS System Definitions ............................................................................... 51
AIS Menu ............................................................................... 52
To set the chart plotter for receiving AIS ....................................................... 53
Quick Info on AIS Target ............................................................................. 53
4.6 SYSTEM INFORMATION ............................................................................... 53
World Background Charts ............................................................................ 53
Worldwide Background Update ..................................................................... 53
Expert Functions ............................................................................... 53
4.7 INPUT/OUTPUT ............................................................................... 54
Internal GPS Setup Menu ............................................................................ 54
Fish Finder Transmission ............................................................................. 54
Autopilot ConnectionE............................................................................... 54
External NMEA Connection
E
.............................................................................................................................
54
C-COM GSM PLUS ConnectionE..................................................................... 54
NMEA Output ............................................................................... 55
Send/Receive Routes & Marks
E
......................................................................................................................
55
C-Link
E
............................................................................... 55
External NMEA
E
............................................................................... 55
External Signal ............................................................................... 55
AUX IN I/O Cable Wiring page ...................................................................... 56
Quick Disconnect Cable Wiring page ............................................................. 56
Power I/O Cable Wiring page ....................................................................... 56
GPS Cable Wiring page ............................................................................... 56
Engine Cable Wiring pageE........................................................................... 56
Video Input
E
............................................................................... 56
Page 7

8
User Manual
4.8 C-WEATHER SERVICEE............................................................................... 57
Weather ServiceE Menu ............................................................................... 57
Download
E
............................................................................... 58
Copy from CARD
E
............................................................................... 58
Forecast
E
............................................................................... 58
Real Time View
E
............................................................................... 59
Type of Data
E
............................................................................... 59
4.9 FISH FINDER
E
............................................................................... 59
4.10 RADAR
E
............................................................................... 59
5. C-LINK
E
............................................................................... 61
5.1 C-LINK
E
............................................................................... 61
How C-LinkE system works .......................................................................... 61
C-LinkE serial connection ............................................................................. 61
5.2 C-LINKE NAVIGATION DATA TRANSFER ......................................................... 61
Operations ............................................................................... 62
Master Chart Plotter ............................................................................... 62
Slave Chart Plotter ............................................................................... 63
C-LinkE Navigation Data: Acquisition and Display ............................................ 63
Graphical representation on Map Display ....................................................... 64
Route Data Report ............................................................................... 64
Quick Info ............................................................................... 65
6. MOBILARM System ............................................................................... 67
6.1 SOFTWARE SETUP ............................................................................... 67
6.2 MOBILARM STATUS ............................................................................... 67
6.3 MOBILARM PTX ............................................................................... 68
6.3.1 PTX is received ............................................................................... 68
6.3.2 PTX is received again ........................................................................ 68
6.4 PLACING CURSOR ON THE PTX ICON ............................................................ 69
6.4.1 Delete PTX ............................................................................... 69
6.4.2 Goto PTX ............................................................................... 69
6.4.3 MOBILARM PTX List Page .................................................................. 69
6.4.4 Show PTX ............................................................................... 70
7. Fish Finder ONLY FOR MAP 7 CWI PLUS GPS .......................................................... 71
7.1 SETTING THE INTERNAL FISH FINDER ON ..................................................... 71
7.2 UNDERSTANDING THE FISH FINDER PAGE .................................................... 71
7.2.1 Understanding the Echogram display .................................................. 73
7.3 DISPLAYING THE FISH FINDER PAGE ............................................................ 74
7.3.1 How to select the Fish Finder page ..................................................... 74
7.3.2 Fish Finder Full page ......................................................................... 74
7.3.3 Dual Frequency page ........................................................................ 75
7.3.4 Zoom page ............................................................................... 75
7.3.5 Chart/Fish page ............................................................................... 76
7.3.6 Fish Finder and Radar pages .............................................................. 76
7.4 ZOOM MODES ............................................................................... 77
7.4.1 The Bottom Lock Zoom ..................................................................... 77
7.4.2 The Marker Zoom ............................................................................ 77
7.5 FISH FINDER SETUP MENU .......................................................................... 78
7.5.1 Preset Mode ............................................................................... 78
7.5.2 Gain Mode ............................................................................... 78
7.5.3 Range Mode ............................................................................... 78
7.5.4 Depth ............................................................................... 78
7.5.5 Shift ............................................................................... 78
7.5.6 Bottom Range ............................................................................... 79
7.5.7 Frequency ............................................................................... 79
7.5.8 Interference Rejection ...................................................................... 79
7.5.9 Sensitivity Menu .............................................................................. 79
7.5.10 Display Setup Menu ......................................................................... 79
Page 8

9
User Manual
7.5.11 Transducer Setup Menu .................................................................... 80
7.5.12 Alarms Menu ............................................................................... 80
7.5.13 Load Settings from User C-Card ......................................................... 80
7.5.14 Save Settings to User C-Card ............................................................ 80
7.5.15 Restore Current Preset Defaults ......................................................... 80
7.6 TRANSDUCERS ............................................................................... 80
8. Maintenance ............................................................................... 81
8.1 SYSTEM TEST ............................................................................... 81
RAM Menu ............................................................................... 81
DIM Menu ............................................................................... 81
Cartridges ............................................................................... 81
Serial Ports ............................................................................... 82
Modem test ............................................................................... 82
External Alarm ............................................................................... 82
Engine Menu ............................................................................... 82
9. Terms ............................................................................... 83
MAP 7w & MAP 7wi Plus GPS ............................................................................... 89
FEATURES & FUNCTIONS ............................................................................... 89
TECHNICAL SPECIFICATIONS ............................................................................. 90
INSERTING/REMOVING PROCEDURE ................................................................... 90
Inserting the C-CARD ............................................................................... 90
Removing the C-CARD ............................................................................... 90
CHART PLOTTER DIMENSIONS ........................................................................... 91
INSTALLATION AND REMOVING .......................................................................... 91
EXTERNAL WIRING ............................................................................... 92
TYPICAL CONNECTIONS ............................................................................... 93
MAP 7cwi Plus GPS ............................................................................... 95
FEATURES & FUNCTIONS ............................................................................... 95
TECHNICAL SPECIFICATIONS ............................................................................. 96
FF MODULE 600W-50-200KHz ............................................................................ 96
TECHNICAL SPECIFICATIONS ............................................................................. 96
INSERTING/REMOVING PROCEDURE ................................................................... 96
Inserting the C-CARD ............................................................................... 96
Removing the C-CARD ............................................................................... 97
CHART PLOTTER DIMENSIONS ........................................................................... 97
INSTALLATION AND REMOVING .......................................................................... 97
EXTERNAL WIRING ............................................................................... 98
TYPICAL CONNECTIONS ............................................................................... 98
MAP 11csE Plus GPS ............................................................................. 101
FEATURES & FUNCTIONS ............................................................................. 101
TECHNICAL SPECIFICATIONS ........................................................................... 102
INSERTING/REMOVING PROCEDURE ................................................................. 102
Inserting the C-CARD ............................................................................. 102
Removing the C-CARD ............................................................................. 103
CHART PLOTTER DIMENSIONS ......................................................................... 103
INSTALLATION AND REMOVING ........................................................................ 103
EXTERNAL WIRING ............................................................................. 104
TYPICAL CONNECTIONS ............................................................................. 104
GPS Connection ............................................................................. 104
Autopilot Connection ............................................................................. 105
External NMEA Connection ........................................................................ 105
C-COM Connection ............................................................................. 106
External Alarm Connection ........................................................................ 106
Page 9

10
User Manual
MAP cx Plus GPS ............................................................................. 107
FEATURES & FUNCTIONS ............................................................................. 107
TECHNICAL SPECIFICATIONS ........................................................................... 108
INSERTING/REMOVING PROCEDURE ................................................................. 108
Inserting the C-CARD ............................................................................. 108
Removing the C-CARD ............................................................................. 108
CONTROLLER DIMENSIONS ............................................................................. 109
INSTALLATION AND REMOVING ........................................................................ 109
EXTERNAL WIRING ............................................................................. 110
TYPICAL CONNECTIONS ............................................................................. 111
GPS Connection ............................................................................. 111
Autopilot Connection ............................................................................. 111
External NMEA Connection ........................................................................ 112
External Alarm Connection ........................................................................ 112
C-COM GSM PLUS Connection .................................................................... 112
Specification of CAN Interfaces MAP 11CSE PLUS GPS .......................................... 113
List of the SAE J1939/71 measuring values October 1998 .................................... 113
List of the SAE J1939/71 used October 1998 ..................................................... 113
Easy Link Interface Specifications ...................................................................... 113
Installing the Smart GPS External
MAP 7W PLUS GPS/MAP 11CSE PLUS GPS/MAP CX PLUS GPS ..................................... 115
Installing ............................................................................. 115
Dimensions ............................................................................. 116
Analytical Index ............................................................................. 117
Page 10

11
User Manual
About this User Manual
INTRODUCTION
The chart plotter is a state-of-the-art computerized electronic chart system, designed as a sophisticated navigation aid. User friendly operations make the chart
plotter easy to operate. All calculations and information necessary for navigation
are performed and displayed on the screen quickly and accurately providing all of
the facilities of a conventional GPS but with the added benefit of a powerful electronic chart display. The cartographic information is obtained from C-MAP BY JEPPESEN
C-CARD (cartography data cards) that are available through your local dealer. For
additional information on C-MAP BY JEPPESEN Cartography visit web site at
www.jeppesen.com.
CONVENTIONS USED
Throughout this User Manual, the labelled keys are shown in capital letters enclosed in square brackets, for example [ENTER].
Menu operations are in bold characters listed by keys sequence with the menu
names enclosed between inverted commas, for example [MENU] + "OTHER
MAP CONFIGURATIONS" + [ENTER] means: press the [MENU] key, using the
cursor key select the Other Map Configurations menu and then press [ENTER].
Any menu operation and function activation in this User Manual is related to all
chart plotter models. Whenever it is necessary, a note has been inserted for those
models with differences.
EXPERT FUNCTIONS
It is possible to expand the functions set available on the chart plotter. When the
chart plotter comes from factory or after a RAM Clear (see Chapter 8), only those
menus/items are visible, which are of importance for the basic functions. Due to
this, the chart plotter handling has been considerably simplified for the majority
of users.
Also there are functions which are rarely used, the Expert Functions. These are
need to be activated before their use.
The Expert Functions can be activated selecting the About page (see Par. 4.6) and
then pressing [MODE] for 1 second.
The items shown in gray color are the basic functions, they are always active and
visible in the chart plotter menus. The others are the Expert Functions; you could
turn from "Off" to "On" for making visible the desired function in the chart plotter
menus, and then for using in the chart plotter handling.
For example, the Cursor Control function is an Expert Function. To activate it
follow this procedure:
[MENU] + [MENU] + "About..." + [ENTER] + [MODE] for 1 second + "MENU"
+ [ENTER] + "ADVANCED SETTINGS" + [ENTER] + "SIMULATION" + [ENTER]
+ "CURSOR CONTROL" + [ENTER] + "ON" + [ENTER]
Then, this function is shown in the Simulation Menu, and you could enable or
disable it:
[MENU] + [MENU] + "ADVANCED SETTINGS" + [ENTER] + "SIMULATION"
+ [ENTER] + "CURSOR CONTROL" + [ENTER] + "ON" + [ENTER]
Page 11

12
User Manual
Throughout this User Manual, the Expert Functions are shown as FunctionName
E,
for example Cursor ControlE. Remember that it is possible to show these functions
into a chart plotter menu only if they have been activated.
HOW THIS USER MANUAL IS ORGANIZED
♦ CHAPTER 1: Overview
Introduction to the basic information on your chart plotter, its features
and use.
♦ CHAPTER 2: Getting Started
Overview of the controls and how to start using the chart plotter.
♦♦
♦♦
♦ CHAPTER 3: Operations
Description of the operation procedures of the chart plotter in detail.
♦ CHAPTER 4: User Setting Up
Set up of the chart plotter, the charting preferences and the GPS options.
♦ CHAPTER 5: C-Link
C-Link system is a feature which allows to sharing the same cartographic data between two chart plotter units linked via serial I/O port.
♦ CHAPTER 6: Mobilarm System
Mobilarm system is an automated crew monitoring system dedicated to
monitoring onboard crew by maintaining a constant link between the
crew member and the boat.
♦ CHAPTER 7: Fish Finder (MAP 7cwi Plus GPS)
Introduction to the basic information on the internal Fish Finder, its
features and use.
♦ CHAPTER 8: Maintenance
User maintenance guidelines.
♦ CHAPTER 9: Terms
List of the terms and abbreviations used in the User Manual.
♦ MAP 7w Plus GPS & MAP 7wi Plus GPS
Introduction to the basic information on MAP 7w Plus GPS/MAP 7wi Plus
GPS chart plotter, its features and use. Installation of the chart plotter.
♦ MAP 7cwi Plus GPS
Introduction to the basic information on MAP 7cwi Plus GPS chart plotter with internal Fish Finder, its features and use. Installation of the
chart plotter.
♦ MAP 11csE Plus GPS
Introduction to the basic information on MAP 11csE Plus GPS chart
plotter, its features and use. Installation of the chart plotter.
♦ MAP cx Plus GPS
Introduction to the basic information on MAP cx Plus GPS controller, its
features and use. Installation of the controller.
Analytical Index is to be found at the end of this User Manual.
IF YOU NEED ASSISTANCE
If your chart plotter does not operate properly, please refer to Chapter 8. Most
common operating difficulties can be diagnosed using these tests.
If you still need assistance, call your local dealer, reporting the information available in the System Information page.
Page 12

13
User Manual
Important Information
WARNING
Electronic charts displayed by the chart plotter are believed to be accurate and
reliable, but they are not intended to replace official charts which should remain
your main reference for all the matters related to the execution of a safe navigation. For this reason we would like to remind you that you are required to carry on
board and use the officially published and approved nautical charts.
CAUTION
♦ Please read through this manual before the first operation. If you have any
questions, please contact the Company's customer service or your local
dealer.
♦ The chart plotter is not built water proof. Please give attention to avoid
water intrusion into the chart plotter. Water damage is not covered by the
warranty.
♦ Extensive exposure to heat may result in damage to the chart plotter.
♦ Connection to the power source with reversed polarity will damage the chart
plotter severely. This damage is not covered by the warranty.
♦ The chart plotter contains dangerous high voltage circuits which only expe-
rienced technicians MUST handle.
♦ The C-MAP BY JEPPESEN C-CARDs are available from your local dealer.
♦ Exposure of the display to UV rays may shorten the life of the liquid crystals
used in your plotter. This limitation is due to the current technology of the
LCD displays.
♦ Avoid overheating which may cause loss of contrast and, in extreme cases,
a darkening of the screen. Problems which occur from overheating are reversible when temperature decreases.
WARNING ON SERIAL PORTS CONNECTION
Please be aware that the serial ports are not opto-isolated and then the
external device is electrically connected to the chart plotter. This allow the
connection of high speed devices, like Radar or Fish Finder. If you are
connecting a NMEA0183 device and you would like to isolate it from the chart
plotter, you have to add the opto-isolator externally.
CLEANING PROCEDURE FOR THE PLOTTER SCREEN
Cleaning of the plotter screen is a very important operation and must be done
carefully. Since the surface is covered by a antireflective coating, the procedure
for cleaning all the surfaces can be performed in the following procedure. You
need a tissue and a cleaning spray containing Isopropanole (a normal spray cleaner
sold for the PC screen, for example PolaClear by Polaroid). Fold the tissue or lens
tissue into a triangular shape, moisten the tip and use the index finger behind a
corner to move the tissue across the surface, in overlapping side to side strokes.
If the tissue is too wet, a noticeable film will be left in its path and you will need
to repeat the process. If too dry, the tissue won’t glide easily, and may damage
the surface.
NOTE We will not be liable for errors contained herein, or for incidental or
consequential damages in connection with the performance or use of this
material.
Page 13

14
User Manual
Safety Instructions
Please respect all instructions of this manual.
The use of the chart plotter system does not relieve you of your responsibility for your ship, which
requires good seamanship.
Always use your personal experience when interpreting the displayed values.
Safety Instructions concerning the installation
The chart plotter system should be installed by your shipyard or by a electronic specialist.
Use adeguate working clothes when you install the system. Avoid clothing that may be caught by
moving parts. Use a hair net if you have long hair.
Remove all metallic or electrically conducting jewellery, such as chains, bracelets, rings, etc. when you
working on the on-board electronics.
Disconnect the minus polarity at the battery before starting your work to prevent the risk of a shortcircuit. Short-circuits can cause cable harness fires, battery explosions and damages of electronic
memory systems. Please note that when you disconnect the battery, all volatile electronic memories
will lose their contents, and will have to be re-programmed.
Run the engine compartment blower for a certain time before starting work in a gasoline engine
compartment.
Check that there is enough room behind the installation opening. Pre-drill the opening and complete
with keyhale saw (respect the safety instructions of the hand of tool manufacturer).
Use insulated tools if you must work disabling the power supply.
The electrical outputs of the chart plotter and the cables connected to it must be protected against
direct contact or damage. This means that the cables must have a sufficient insulation resistence or
voltage rating, and that touching the contact points is prevented.
Electrically conducting parts of the connected loads must also be protected by adequate measures
against a direct contact. The use of non-insulated wires and contacts is strictly forbidden.
Safety Instructions concerning the maintenance
Reapairs of the chart plotter system components can only be made by specialists authorized by VDO.
The system fulfills the applicable safety regulations.
Note: Capacitors in the unit can reatin their charge, even if the unit is separated from its power supply.
Check that replacement fuses are of the indicated type and current rating. The use of temporarily
repaired fuses or jumpering the fuse holder is strictly forbidden.
Page 14

15
User Manual
1. Overview
1.1 CHART PLOTTER
KEY DESCRIPTION ctc 7w/wi 11csE
Cursor Key in the display screen moves the cursor quickly and accurately x x x
in the menu page(s) scrolls the desired option x x x
in Home mode, allows to exit from Home mode x x x
in Video mode, UP/DOWN adjust the Brightness x x
in Video mode, LEFT/RIGHT adjust the Color x x
POWER turns On/Off the chart plotter x x x
activates the backlight and contrast menu x x
in Video mode, activates the Adjustment Mode x x
LIGHT adjusts the backlight of the display x
in Video mode, activates the Adjustment Mode x
CONTRAST adjusts the contrast of the display x
in Video mode, activates the Adjustment Mode x
MODE selects the screen configuration you wish x x x
in Video mode, changes the Contrast x x
CLEAR if you are into a menu, exits from menu or leaves a menu x x x
without making changes
if you are not into a menu, sets the Home mode: the cursor x x x
is centered on ship's position
for 1 second activates the Video Input 2 x
ENTER if you are in chart page, opens a menu to place Marks, x x x
Waypoints, Goto, EBL & VRM
if you are in chart page, opens a menu to place MOB x x x
if you are into a menu, confirms selection x x x
for 1 second activates the Video Input 1 x x
MENU opens the Map menu x x x
if pressed twice selects the Functions menu x x x
ZOOM IN increases the chart scale and zooms in on your display x x x
in Video mode, adjusts the Hue Phase x x
ZOOM OUT decreases the scale and shows a wider view x x x
in Video mode, adjusts the Hue Phase x x
1.2 C-MAP BY JEPPESEN MAX CARTOGRAPHY
INFORMATION
MAX is a major evolution of the product technology. Key points are:
Data Features
♦ ISO Certification (electronic chart production process with quality
certification)
♦ Extra Large Coverage (all the C-MAP By Jeppesen electronic chart
detail and a huge coverage without having to change cartridge)
Page 15

16
User Manual
♦ Official data source (data based on use of official data sources)
♦ Detailed World Background (worldwide background chart with details)
♦ Depths & Land Elevation (color shading of sea depth and land alti-
tude for improved chart reading)
♦ Bathymetric & Spot Soundings (additional Data Base with depth
and bathy information for an extraordinary view of the seabed depth)
♦ Detailed Port Plan (complete port and marina charts with detail)
♦ Search & Find (quickly locates chart contents and objects)
♦ Tides Preview (dynamic simulation of tides)
♦ Dynamic Currents (current arrows dynamically display direction and
speed)
♦ Dynamic Nav-Aids (displays Nav-Aids in true color and with real in-
terval lighting)
♦ Port Info (all the information of the available services in the ports and
how to contact them)
♦ Enhanced Port Info & Roads (details of the available facilities and
services in ports and surrounding areas)
♦ Object Info (indicates restricted area details and related information)
♦ Quick Info (full information on objects, buoys, wrecks, shoals and
Nav-Aids)
♦ Photos & Diagrams (high definition pictures of ports, piers, bridge
diagrams and nav-aids)
♦ Multilanguage Support (displays charts in the local character set)
♦ True-Type Font (improves text on chart for optimal reading)
Presentation Features
♦ Clear View (advanced legibility techniques providing more chart data
on the screen)
♦ Clear Info (sophisticated "Human Dictionary" to translate Nav-Aid ab-
breviations found on paper charts)
♦ Dynamic Nav-Aids (an innovative and dynamic presentation mode)
♦ Flexi-Zoom (increased Under and Over Zoom between chart levels,
resulting in optimal scale display for any situation)
♦ Dynamic Elevation Data (optimized palettes including the NOAA color
palette)
♦ Perspective View ("Real World" perspective view of the chart, up-
dated real-time during navigation)
♦ Smooth-Zoom (smooth transition of cartographic levels)
♦ Enhanced Turbo-Zoom (extra fast cartography level change display-
ing the most important cartographic objects)
♦ Enhanced Mixing Levels (seamless data presentation)
♦ Off-line redraw (cartography level transition without image
construction)
Cartographic Data related Features
♦ Guardian Alarm (automatic control and alarm over obstacles on charts
in front of your boat)
♦ Safety Toolbar (interactive alarm system for situational awareness on
screen)
♦ Safety Route Check (sophisticated function checking dangerous ob-
jects along your navigation route)
Page 16
17
User Manual
MAX and NT/NT+ C-CARD coexistence
♦ When NT
+
data and MAX data cover different areas, the chart plotter
gets data from both charts (depending on the current position).
♦ When NT
+
data and MAX data cover the same area, the chart plotter
gets data only from MAX chart.
1.3 GPS
For centuries, sailors have been searching for a reliable and precise method of
travelling the world's waterways. From celestial navigating to the modern navigation
techniques as Loran, Decca Navigator, Omega or Transit Satnav, each system has
had its problems with weather, range and reliability. Without doubt, the "Global
Positioning System", or GPS for short, is the most significant advance in navigation:
it gives the navigator a position 24 hours a day, 365 days a year in any weather
condition.
GPS is a satellite based navigation system which provides suitably equipped users
with accurate position, velocity and time data. Originally the GPS, developed by
the U.S. Department of Defence, was conceived for military purposes, but now it
is used in a host of civilian applications. GPS navigation uses satellite signals to
determine your position in relation to a set of satellites orbiting the earth. The
GPS constellation of satellites continuously send radio signals, containing the precise
position for each satellite back to earth. By knowing the position of 3 or 4 satellites
and calculating various time differences between transmitted signals, the GPS
receiver can determine its present position anywhere on earth, and thanks to
continuous updates, calculate speed and course information.
How GPS works
Currently, the GPS constellation consists of 26 orbiting satellites (including 3
spares), but this number will increase in the future.
The GPS receiver computes an accurate position by calculating the distance to the
GPS satellites that orbit the earth. Signals are required from 3 satellites for two
dimensional (2D) position calculation whilst 4 satellites are required for three
dimensional (3D) position calculation. As mentioned earlier, GPS satellites are not
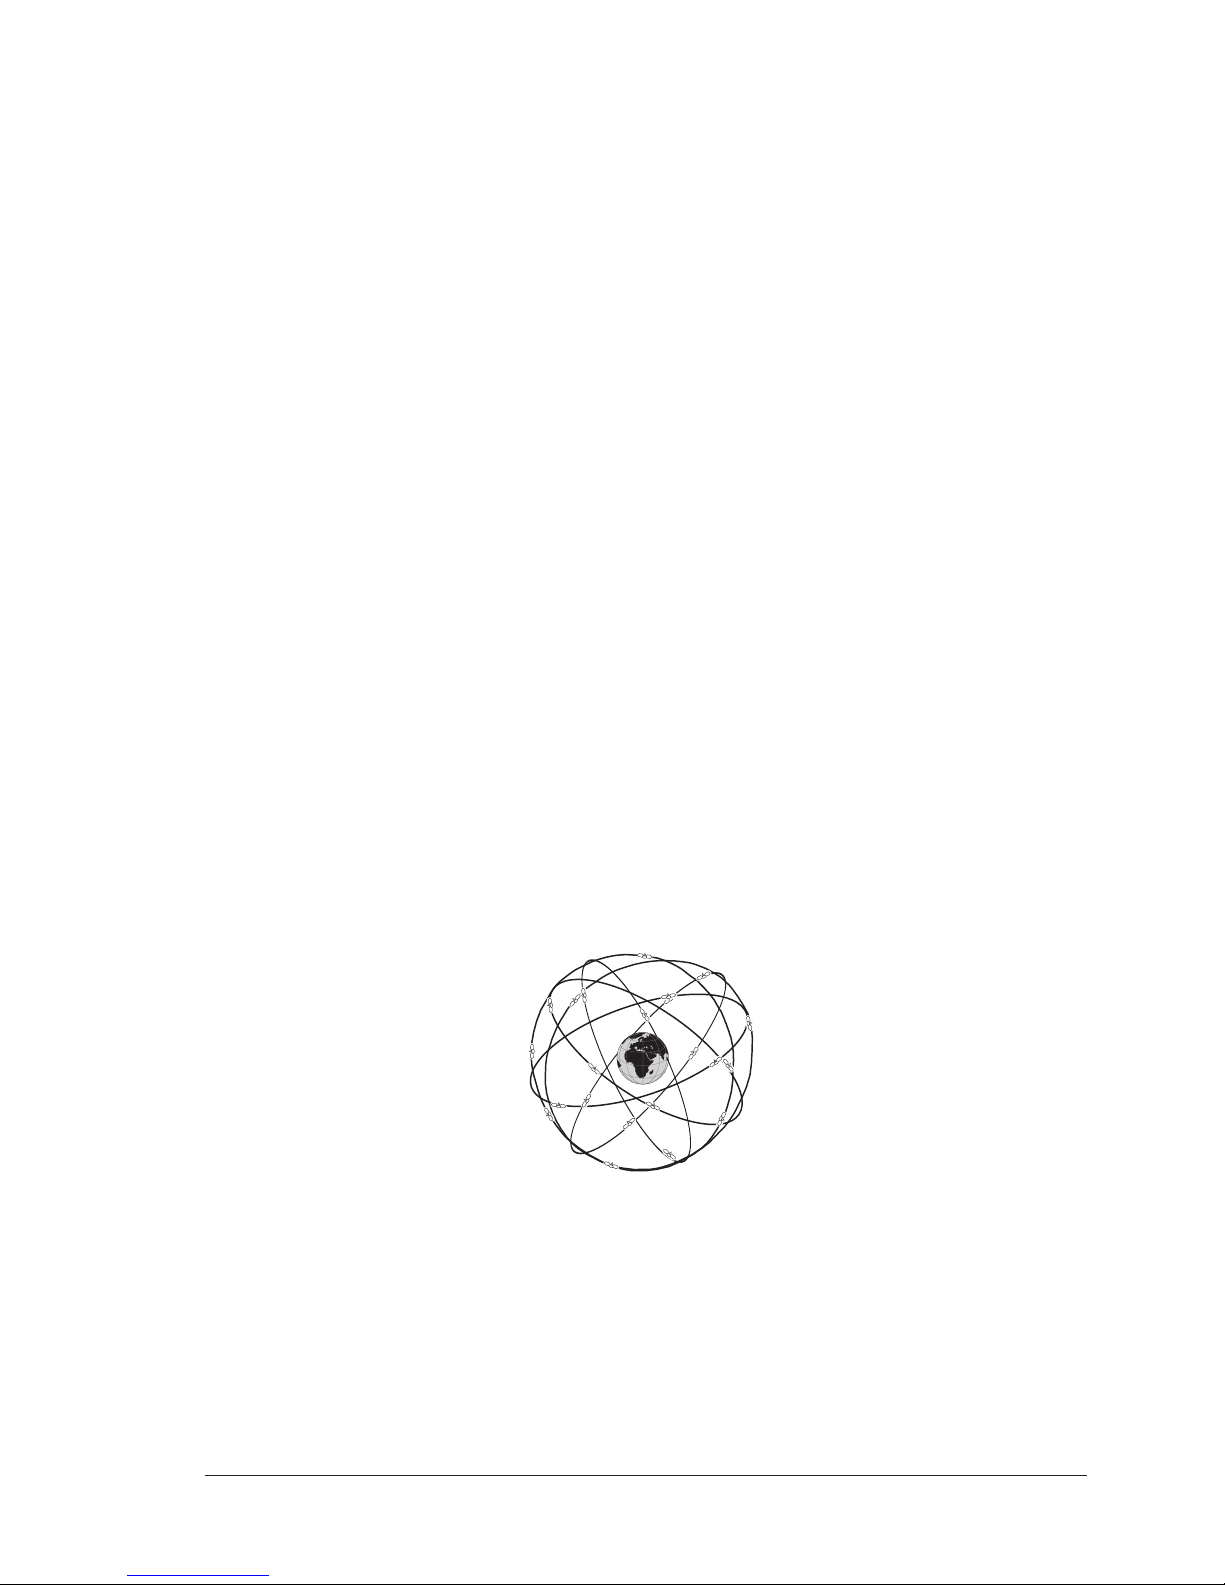
geostationary, but they are orbiting the earth as illustrated on the following figure:
16
13
11
14
9
7
2
4
18
19
20
17
3
8
6
1
10
5
15
21
Fig. 1.3 - The GPS constellation
Note that position is repeatedly fixed through the following three steps while any
3 satellites are in line of sight.
The position calculation procedure is indicated in the following three steps:
1. GPS satellites continuously transmit their own precise orbital data and
the GPS receiver computes their locations by receiving this data.
2. In this receiving process, the GPS receiver measures very accurate
distances to the satellites, using the "Spread Spectrum Modulation"
method. Excellence in GPS's position-fixing accuracy is mainly due to
this technology.
Page 17
18
User Manual
3. When the satellite locations and their distances are known, the GPS
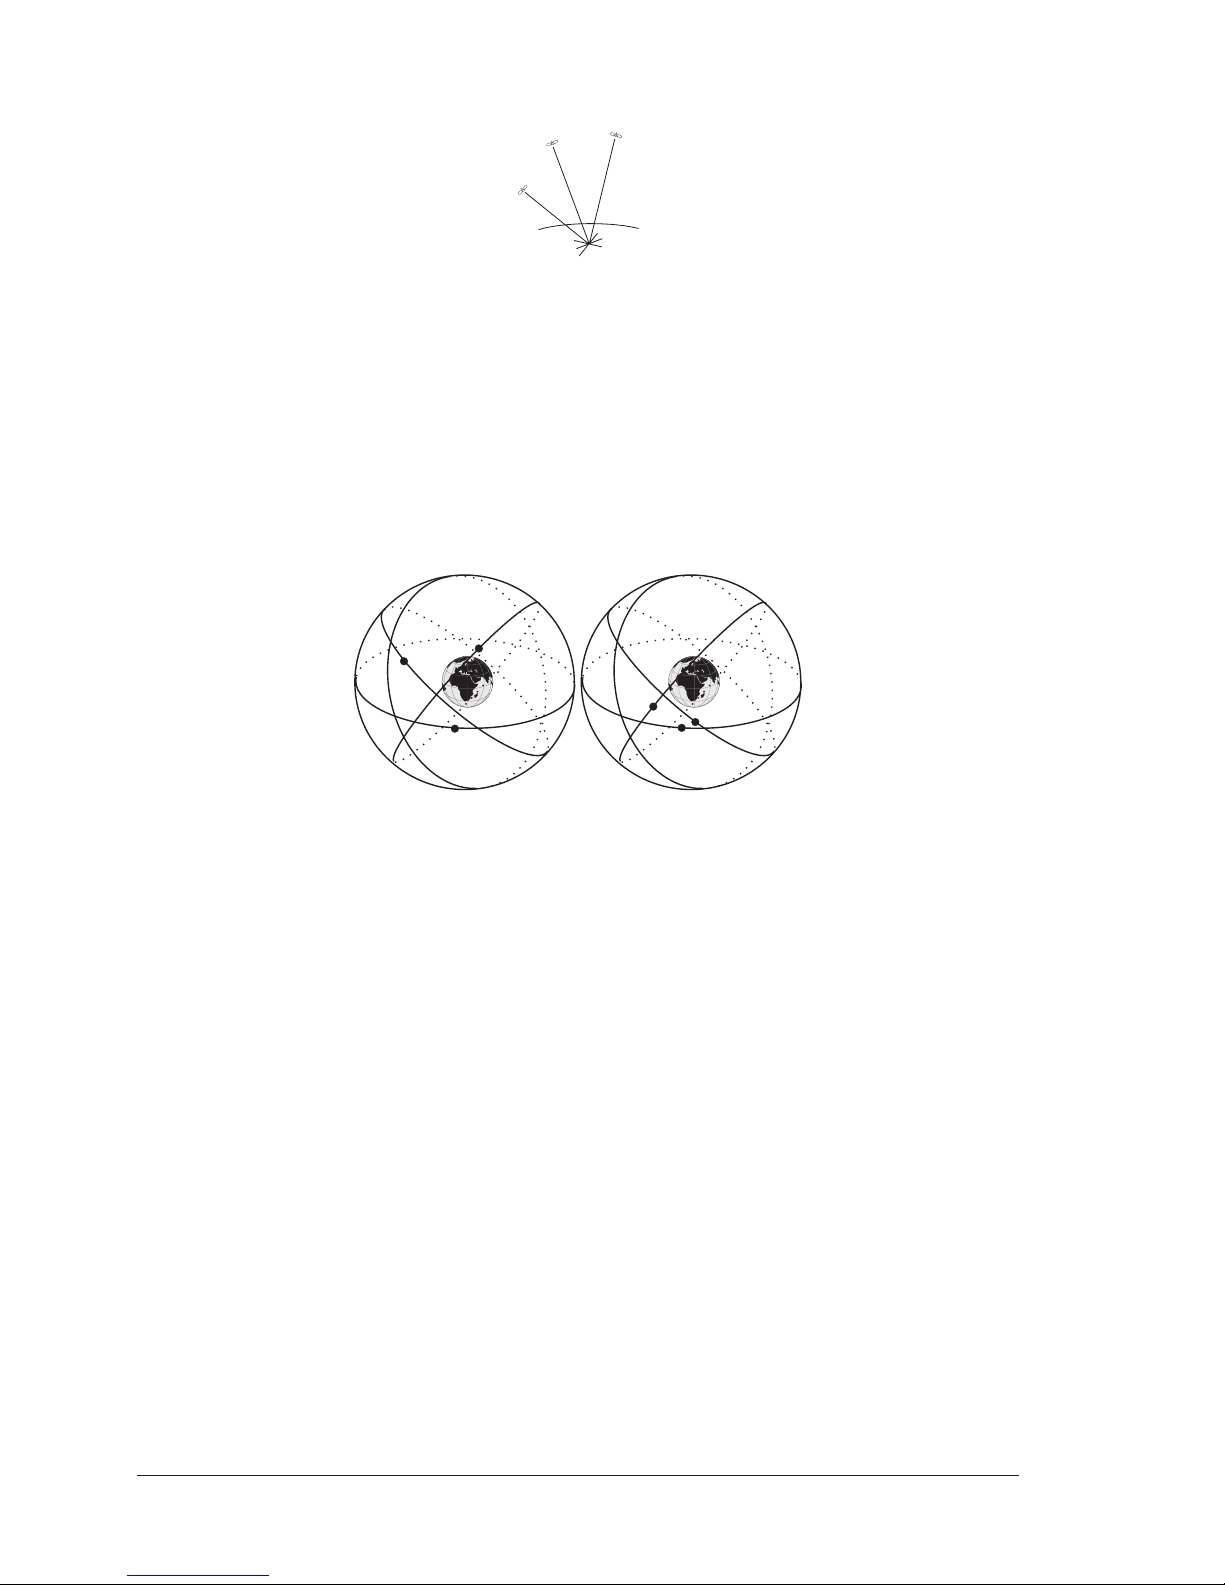
receiver fixes its own position by triangulation:
d1
d2
d3
Fig. 1.3a - The GPS position calculation
As illustrated in the previous figure, the position is calculated as the meeting point
of three spheres which are drawn around the three satellites with diameters d1,
d2 and d3.
Position Fixing Accuracy: HDOP
The GPS fix accuracy is due to the locations of 3 satellites in the sky. High accuracy
is obtainable when the satellites are widely scattered in the sky; on the contrary,
accuracy is reduced when the satellites have gathered in a narrow space.
In the following figure, in both cases it is possible to obtain the GPS fix, but in the
left case the accuracy will be higher than the right:
Fig. 1.3b - HDOP
The index for position-fixing accuracy is called HDOP ("Horizontal Dilution Of
Precision"). The smaller the HDOP value, the more accurately the position can be
fixed.
Page 18
19
User Manual
2. Getting Started
This chapter provides basic information to get you started using the chart plotter;
it will help you in becoming familiar with the chart display and the functions of the
controls before you start using the chart plotter.
2.1 SWITCHING ON/OFF
Before powering On the chart plotter, check for the correct voltage (10-35 volt
dc) and the correct connections with the positioning instrument.
Switching On
[POWER] for 1 second
The chart plotter shows you the logo screen, Caution Notice and then the chart
screen in sequence. The chart plotter will then perform a short self test procedure
that checks all internal memory and the C-CARD (if installed), and then displays
any failure detected on the screen.
Switching Off
[POWER] for 3 seconds
A countdown timer appears on the screen, if you release the key before the
countdown timer reaches zero, the chart plotter will remain On.
2.2 CHANGING BACKLIGHT AND CONTRAST
You can change the level of backlight and contrast for the screen.
[LIGHT] for 1 second: backlight increases. At the next pressing and holding
down, it will decreases
[CONTR] First pressure of the key increases the value till you keep it pressed,
next pressure of the key decreases the value till you keep it pressed
MAP 11csE Plus GPS:
[POWER] + use cursor to adjust backlight levels and/or contrast levels of
the screen and to adjust illuminations of the Easy Link instruments
Now you return to the chart screen with the new backlight and contrast levels
retained.
2.3 SELECTING THE USER INTERFACE LANGUAGE
It is possible to set the language to display menus, data pages, warning/alarm
messages, full/quick info, list of objects found by find/nearest function, and on
charts (such as place’s names, buoy’s names and so on).
To select the language you want:
[MENU] + [MENU] + "CONFIGURATIONS" + [ENTER] + "LANGUAGE" +
[ENTER] + select the language you want + [ENTER]
NOTE If the selected language is not available on cartographic data, English
language is used instead.
WARNING
If you have accidentaly selected an incomprehensible language, and you
Page 19
20
User Manual
don’t be able to reselect your language (the above procedure is not of help
to you), follow this procedure: press [MENU] two times, move the cursor to
highlight the first item (starting from the top) which corresponds to the
Configurations menu and press [ENTER]. Then a window appears with
“Language” message, press [ENTER]; now select your language and press
[ENTER] again. Anyway if you in trouble, see Chapter 6 "Maintenance" for
a RAM Clear operation: the chart plotter will also return all selections, in
particular language, to original default values.
2.4 SELECTING THE CHART LANGUAGE
E
[MENU] + [MENU] + "CONFIGURATIONS" + [ENTER] + "CHART LANGUAGE"
+ [ENTER] + select the language you want + [ENTER]
The possible choices are listed in the table below:
Language: Allows setting the language to display chart information. The language is chosen among the list
of languages available on the cartographic data (C-CARD or embedded charts).
Mode: Defines how objects are translated. It is possible to choose between the three following options:
Off Uses the same Language used for LANGUAGE. If the selected language is
not present on the objects information, English is used instead;
English Always uses English;
Local Uses the first Local language present on data. If no Local language is
available, English is used instead.
NOTE a. When User Interface Language is changed, Chart Language settings are set
as follows: MODE is set to Off and Chart Language is set as the User
Interface Language selection if available on the chart data, otherwise is set
to English.
b. If the cartographic data is changed (for example the C-CARD is removed
or replaced), Chart Language settings should be verified and if necessary
changed.
2.5 USING C-MAP BY JEPPESEN DATA C-CARD
The chart plotter has a built-in world map. To use the chart plotter as a navigation
aid, data C-CARD with detailed information for the area you wish to navigate are
required. See the technical details of your chart plotter for inserting/removing data
C-CARD procedure.
NOTE During normal operations the data C-CARD should not be removed since the
chart plotter may lock up.
2.6 SIMULATION MODE
The built-in Simulator function allows you to become proficient in the use of the
chart plotter. It simulates the reception of the navigation data (Lat/Lon, Course,
Speed, Date, Time). The simulated ship's position is placed at the current cursor
position by the time the simulation is activated. To start the Simulator:
Place the cursor at your desired position + [MENU] + [MENU] + "ADVANCED
SETTINGS" + [ENTER] + "SIMULATION" + [ENTER] + "ACTIVATE SIMULATION" + [ENTER] + "ON" + [ENTER]
You might insert the Speed, Heading, Date and Time values:
[MENU] + [MENU] + "ADVANCED SETTINGS" + [ENTER] + "SIMULATION" +
[ENTER] + "SPEED"/"HEADING"/"DATE"/"TIME" + [ENTER] + enter values
+ [ENTER]
Also in Chart page you might use the cursor up/down to adjust the Speed and the
cursor left/right to adjust the Course. To enable this Cursor ControlE function
follow this procedure:
[MENU] + [MENU] + "ADVANCED SETTINGS" + [ENTER] + "SIMULATION"
+ [ENTER] + "CURSOR CONTROL" + [ENTER] + "ON" + [ENTER]
Page 20
21
User Manual
2.7 CONTROLLING THE DISPLAY
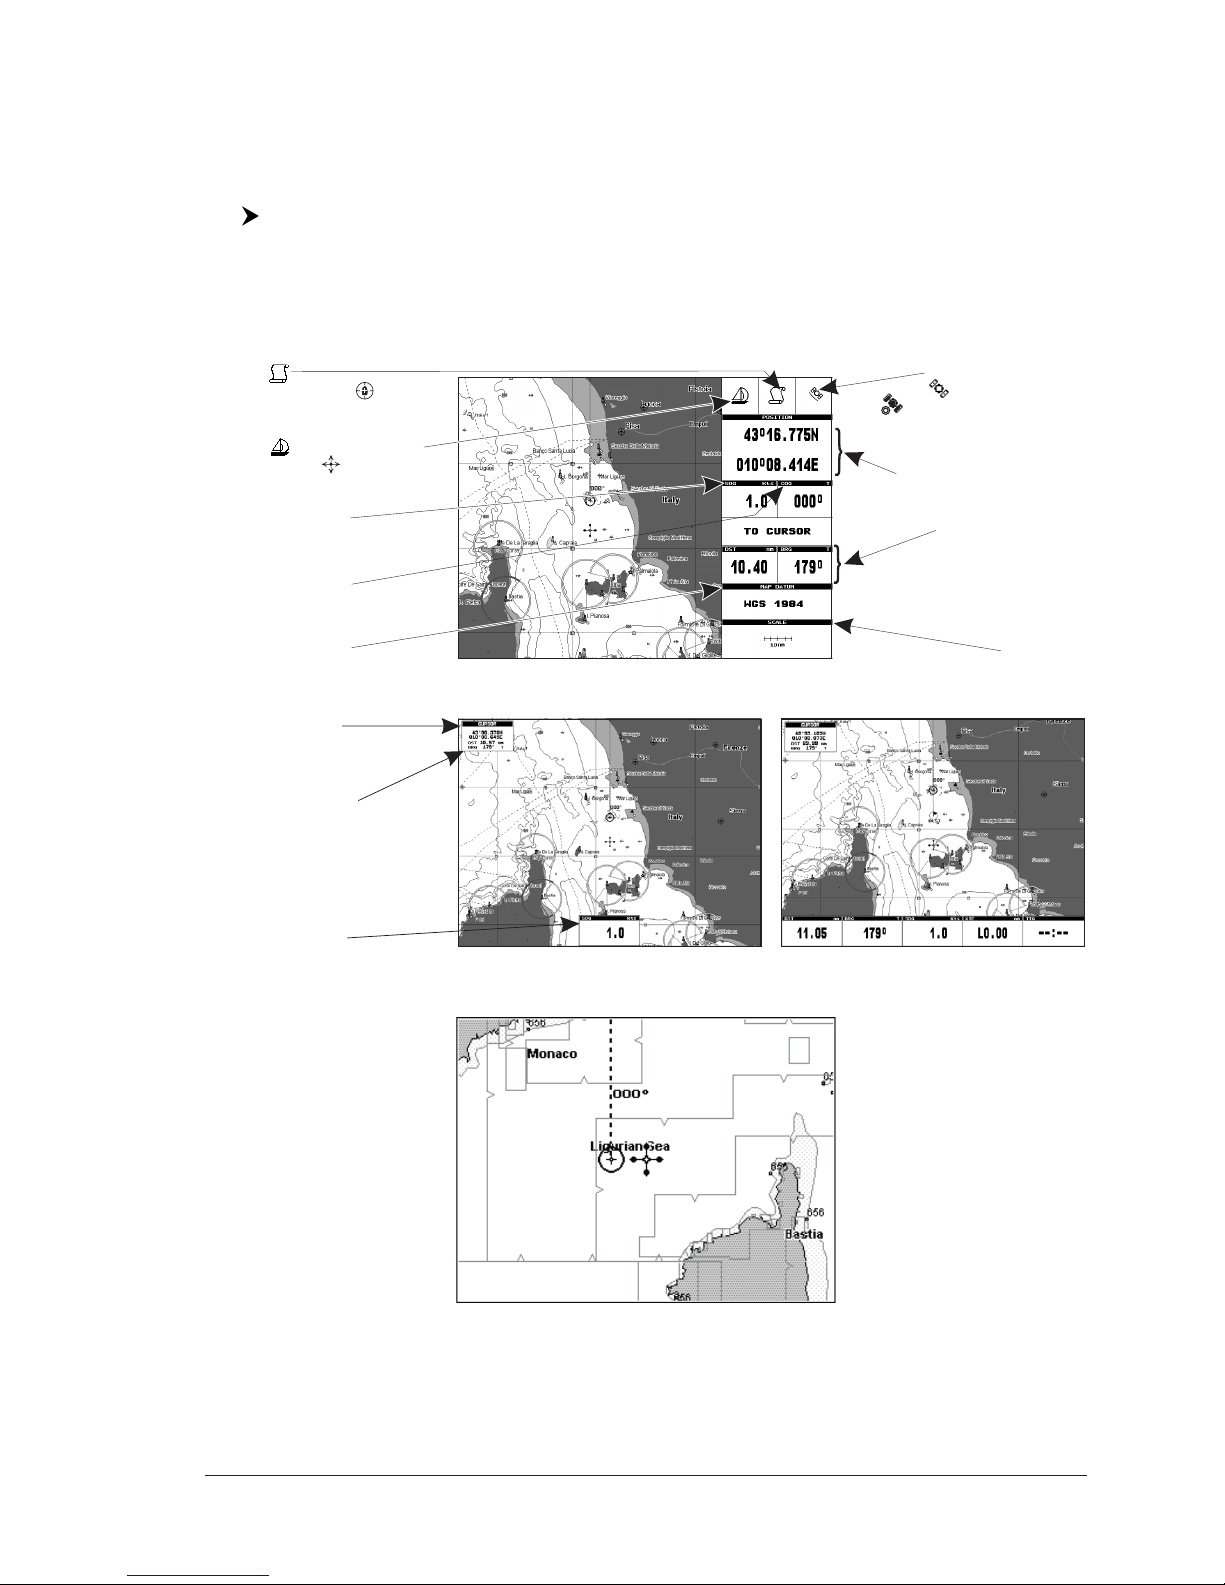
This paragraph describes how to change the Display Mode and how to move
around the chart by changing the chart scale.
Changing Display Mode
[MODE] more times
The selected page appears on the screen. The available pages are listed in the
following pictures.
NOTE If the Fish Finder or Radar is connected, other displaying pages are available
too. See the Fish Finder or Radar User Manual for more information (O
NLY FOR
MAP 7CWI PLUS see the Capther 7 for Fish Finder information).
Cursor or Ship Coordinates
Distance and Bearing
from Ship to Cursor
(from Ship to Target
if Target is set,
from Ship to MOB if MOB is set)
Chart Scale
Speed Over Ground
Course Over Ground
Map Datum selected
Charting
or Navigation (Home)
Ship icon (if in Charting the
displayed icon is )
Fix received Indication
- if fix is not received
- if a Differential GPS signal
is received
Fig. 2.7 - Example of charts and Text Area on right side
Cursor Coordinates
Speed Over Ground
Distance and Bearing
from Ship To Cursor
(from Ship to Target if Target
is set, from Ship to MOB if
MOB is set)
Fig. 2.7a - Example of charts and bottom Text Area pages
Fig. 2.7b - Example of Full Charts
Page 21
22
User Manual
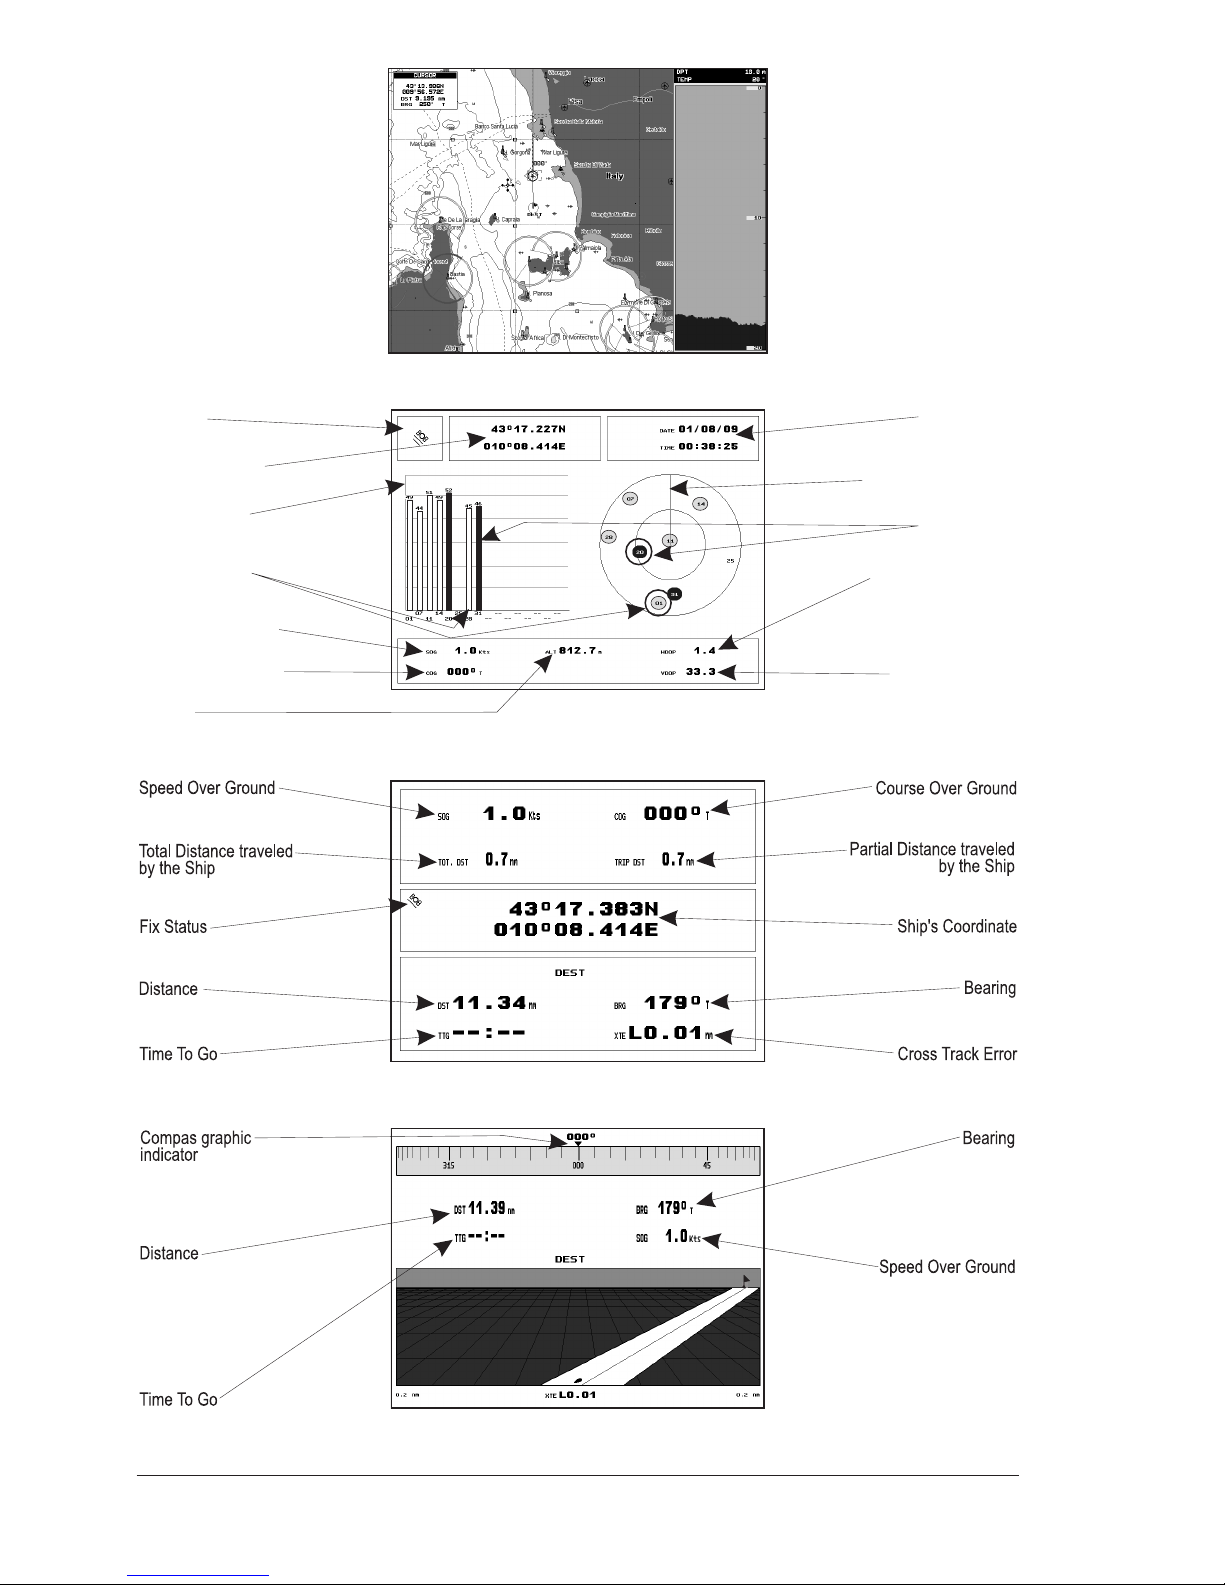
Fig. 2.7c - Example of charts with Depth graph
Ship's coordinates
Speed Over Ground
Course Over Ground
Used Satellite
COG
(Course Over Ground)
Fix Status
Altitude
Date and time
Tracked, but not
used, Satellite
Bars to indicate
S/N Ratio
(Horizontal dilution of
precision)
Index for position-fixing
accuracy
(Vertical dilution of
precision) Index for
position-fixing accuracy
Fig. 2.6d - Example of GPS page
Fig. 2.7e - Example of Navigation Data
Fig. 2.7f - Example of 3D Navigation Data, if Target is set
Page 22
23
User Manual
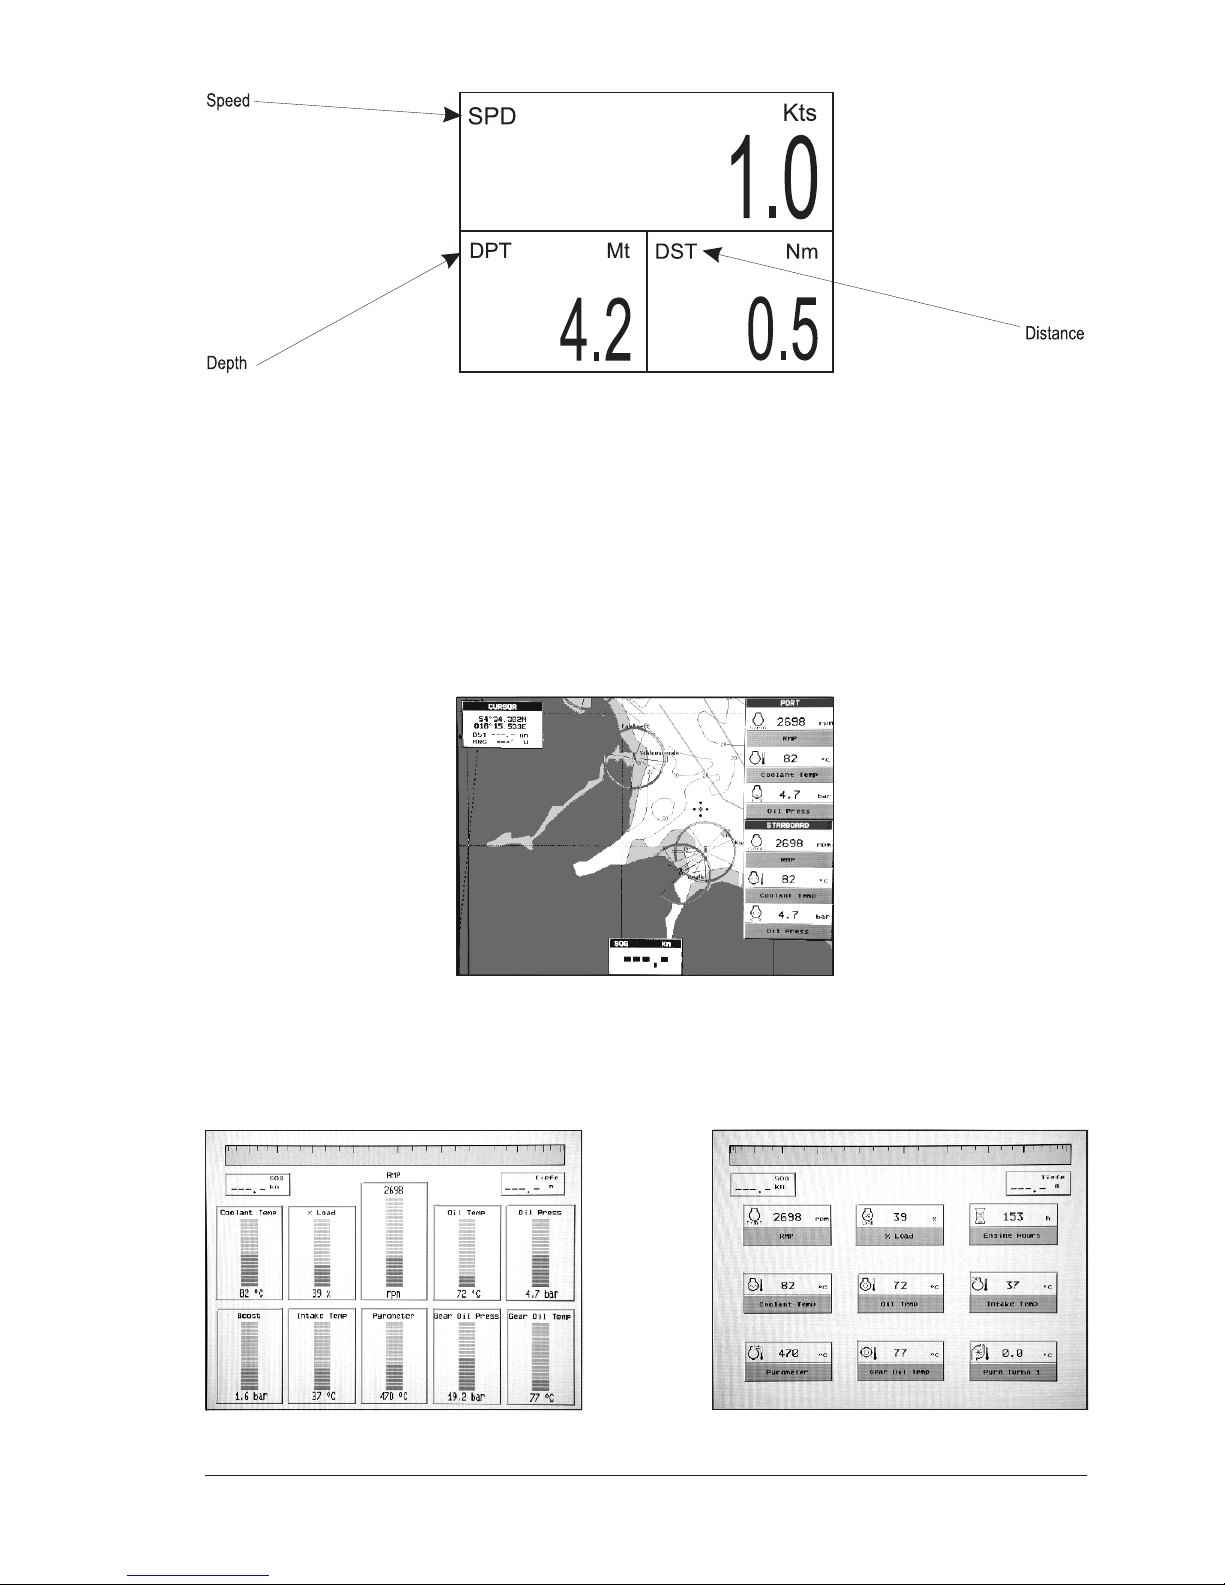
Fig. 2.7g - Example of External NMEA Data, if Speed, Depth and Distance data are set On
(see par. 4.7 INPUT/OUTPUT - External NMEA)
If you have selected a Video Input (see Par. 4.7), in the Chart page a window with
the picture captured from the video signal source is shown.
MAP 11csE Plus GPS:
Other pages are available, Chart with Engine Data and Engine Data pages, shown
in the following pictures.
Chart with Engine Data
The engine data are shown on the right beside the chart:
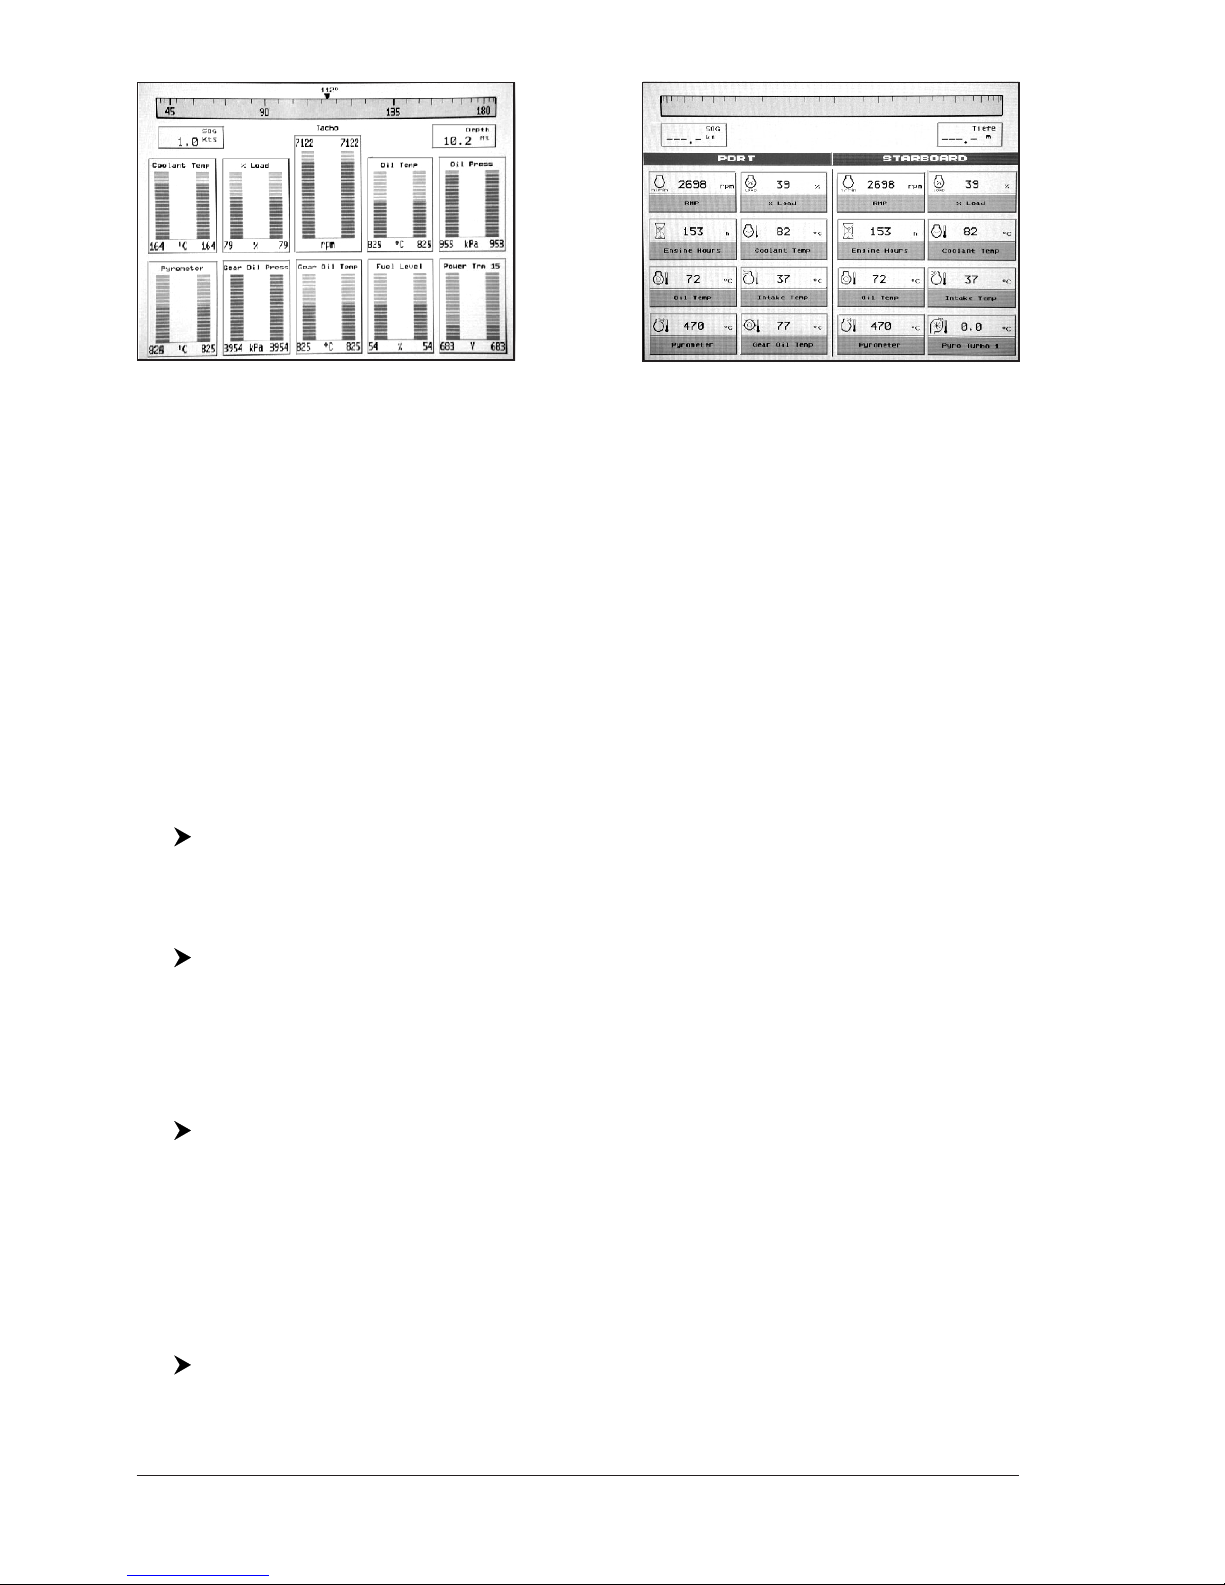
Fig. 2.7h - Example of Chart with Twin Engine Data
Engine Data page
Engine Data will be displayed according to the setting of the chart plotter, i.e.:
Fig. 2.7i - Example of Single Engine in Graph mode (left) and Digital mode (right)
Page 23
24
User Manual
Fig. 2.7l - Example of Twin Engine in Graph mode (left) and Digital mode (right)
Moving around the Chart and Changing Chart Scale
Use the cursor key to move around the chart. Also use [ZOOM IN] and [ZOOM
OUT] to change the chart scale so that a smaller or larger area is shown on the chart.
Finding Your Boat Position
The most common use of the chart plotter is to show your ship's current location.
You can home the cursor to the ship using [CLEAR]. The Home function locks the
cursor to the ship and updates the display as the ship moves.
To release the cursor from the Home Mode, use the cursor key to move the cursor
away from the ship's current position.
Selecting Screen Amplifier
E
In Home mode the Screen AmplifierE function sets up the charts on the navigation
direction (course) in order to display more map details in front of the vessel’s
position.
[MENU] + [MENU] + "CONFIGURATIONS" + [ENTER] + "SCREEN AMPLIFIER" + [ENTER] + "ON" + [ENTER]
Selecting Map Orientation
E
To select the orientation of your chart according to:
[MENU] + "MAP ORIENTATION" + [ENTER]
The Map OrientationE function selects the orientation of your chart according to:
North (the map is shown with North upwards), Head (the map is shown with the
ship's current heading upwards), Course (the map is shown with the currently
selected course leg upwards).
If Course or Head has been selected, is possible to insert the Map Orientation
ResolutionE angle.
[MENU] + [MENU] + "ADVANCED SETTINGS" + [ENTER] + "NAVIGATE" +
[ENTER] + "MAP ORIENTATION RES" + [ENTER] + use cursor to insert values + [ENTER]
The Resolution angle, which may be selected in the range [5 – 60] degrees,
defines the maximum variation of the reference angle after which the map changes
its orientation.
2.8 NAVIGATION TO A SINGLE DESTINATION
To place the destination at cursor coordinates and activates navigation to it:
Place the cursor on location to navigate to + [ENTER] + "GOTO" + [ENTER]
You are now navigating to the destination drawn as a Mark with a circle around it,
Page 24

25
User Manual
labelled "DEST". A straight line is shown on the screen connecting the destination
with the ship's position. All navigation data is referred to this destination.
2.9 EBL/VRM FUNCTION
Selects the EBL (Electronic Bearing Line) and VRM (Variable Range Marker) function: the EBL is a line with its origin on the cursor or ship's position, while the VRM
is a circle with its radius is determined by the user.
Inserting EBL/VRM
Place cursor on the preferred point + [ENTER] + "EBL/VRM" +
[ENTER] + move the cursor + [ENTER]
A line with its origin on the cursor position (or ship) and a circle appears. Press
[ENTER] to confirm. A window with the EBL and VRM values appears.
Deleting EBL/VRM
Place on the cross between EBL and VRM + [ENTER] + "DELETE" + [ENTER]
The line and the circle disappears from the screen.
Editing EBL/VRM
Place on the cross between EBL and VRM + [ENTER] + "EDIT" +
[ENTER] + moving the cursor to modify the line direction and the circle
radius + [ENTER]
2.10 MAN OVERBOARD (MOB)
If a person or object is lost overboard and you need to return to the location, use
the MOB (Man OverBoard) function.
To activate the MOB function, a valid GPS fix must be available.
Inserting MOB
[ENTER] + "MOB" + [ENTER]
the message "MOB Activate" is shown for a few second, then disappears pressing
[ENTER] or [CLEAR]. Data displayed in Text Area are related to MOB.
Once inserted, the system performs the following operations:
1. places the MOB icon at ship's position
2. stops navigation to an existing destination (if present)
3. sets the MOB as destination
Deleting MOB
Place cursor on existing MOB + [ENTER] + "DELETE" + [ENTER]
Page 25

26
User Manual
Page 26
27
User Manual
3. Operations
3.1 USER POINTS: MARKS AND WAYPOINTS
A User Point is an object that you can place on the charts to mark a specific point.
The chart plotter features two types of User Points: Marks and Waypoints. A
Waypoint is created entering a Route, while a Mark can be created at anytime at
your cursor position.
Creating Waypoint
See Creating a Route.
Creating Mark
[ENTER] + "MARK" + [ENTER]
The new Mark appears on your cursor position. Note that if in Home Mode, the
Mark is created at your vessel position.
Selecting the User Points List page
To give information and allow the editing of all stored User Points:
[MENU] + [MENU] + "USER POINTS LIST" + [ENTER]
NOTE It is not possible to edit/remove/move a Waypoint if it belongs to the active Route.
Editing User Point
To allow to modify symbol, name, color and position* of the User Point.
In Chart page, place the cursor on the desired User Point + [ENTER] + "EDIT"
+ [ENTER] + use the cursor key to modify Symbol/Name/Color/Lat-Lon +
[CLEAR]
The User Point appears on the selected position with the new symbol and color.
NOTE To select the User Point presentation:
[MENU] + [MENU] + "CONFIGURATIONS" + [ENTER] + "USER POINTS" +
[ENTER]
There are three possible choices: by selecting "OFF" the User Point is not
shown on the screen, otherwise by selecting "ON" it is shown on the Chart
page shown with symbol and name; by selecting "ICON" only the User Point
symbol is shown.
Deleting User Point
In Chart page, place the cursor on the desired User Point + [ENTER] +
"DELETE" + [ENTER]
Enter the User Points List page + use the cursor to select the row with the
desired User Point + "CLR-ONE" + [ENTER] + "YES" + [ENTER]
The User Point is deleted.
It is also possible to delete all stored User Points:
Enter the User Points List page + "CLR-ALL" + [ENTER] + "YES" + [ENTER]
NOTE It is also possible to delete all User Points with a same symbol (CLR-SYM) and
all User Points of a same type (CLR-TYP).
Moving User Point
Place the cursor on the desired User Point + [ENTER] + "MOVE" + [ENTER]
+ move the cursor to the desired position + [ENTER]
The User Point is placed on the screen at the new position.
Page 27
28
User Manual
Locating User Point on Map
Enter the User Points List page + use the cursor to select the row with the
desired User Point + "FIND" + [ENTER]
The User Points List is closed and the map is centered on the selected User Point.
Sending/Receiving User Points
To send all stored User Points to an external device capable of listening to NMEA
WPL sentence.
Enter the User Points List page + "SEND" + [ENTER]
To receive User Points from an external device capable of sending NMEA WPL
sentence.
Enter the User Points List page + "RECEIVE" + [ENTER]
3.2 ROUTES
A Route is made by placing a series of Waypoints. Among the available Routes
only one can be the Active Route, that is shown on the screen by straight lines
and arrows to indicate the direction; the first Waypoint of this Route is surrounded
by a circle. The Active Route (sometimes called current) is the working Route: it
can be edited by adding, removing or moving Waypoints.
Selecting Active Route
[MENU] + [MENU] + "ROUTE" + [ENTER] + "CURRENT" + [ENTER] + use the
cursor key to select the Route number + [ENTER]
The Route, shown by straight segments, is centered on the screen, with the cursor on the central Waypoint. This will then allow you to quickly work out which
Route you have selected. When you want to create a new Route, select an open
Route position in the list using the above procedure.
Creating a Route
To create a new Route:
Place the cursor + [ENTER] + "WAYPOINT" + [ENTER]
This places the first Waypoint of the new Route on your cursor position. To place
the next Waypoints of the Route repeat the above procedure.
The following functions work on the Active Route.
Inserting Route name
To insert a name on the selected Route:
[MENU] + [MENU] + "ROUTE" + [ENTER] + "NAME" + [ENTER] + use the
cursor key to insert the name + [ENTER]
Selecting Route Color
To select Route legs color among the available colors:
[MENU] + [MENU] + "ROUTE" + [ENTER] + "COLOR" + use the cursor key to
select color + [ENTER]
The Route is drawn on the screen in the selected color. It is possible to select a
different color for any Route.
Deleting Route
[MENU] + [MENU] + "ROUTE" + [ENTER] + "CLEAR" + [ENTER] + "YES" +
[ENTER]
The Route legs and Waypoints are deleted. If the destination is placed on the
Route, that Route cannot be deleted.
Page 28
29
User Manual
It is also possible to delete all stored Routes and Waypoints:
[MENU] + [MENU] + "ROUTE" + [ENTER] + "CLEAR ALL" + [ENTER] + "YES"
+ [ENTER]
Following a Route (Activate the Navigation)
With the Route shown on the Chart page, move the cursor to the Waypoint in the
Route and press [ENTER], select "GOTO" and press [ENTER] again. The
destination is placed on the Waypoint of the selected Route and you are now
navigating to it.
Inserting Waypoint
To insert a new Waypoint between two existing ones, if a destination is not placed
on the Route:
Place the cursor on the desired Route leg + [ENTER] + "INSERT" + [ENTER]
+ move the cursor to the new position + [ENTER]
The new Waypoint is placed.
To add a new Waypoint to the last Waypoint of the Route:
Place the cursor + [ENTER] + "WAYPOINT" + [ENTER]
Reversing Route
To allow a return Route to be generated from an existing Route.
[MENU] + [MENU] + "ROUTE" + [ENTER] + "INVERT" + [ENTER]
The Route is then followed in reverse order, with Waypoints renumbered accordingly. If the destination is placed on the Route, that Route cannot be reversed.
Selecting Route Report page
To give information on Waypoints belonging to the selected Route:
[MENU] + [MENU] + "ROUTE" + [ENTER] + "REPORT" + [ENTER]
In this page it is possible to modify the Speed and Fuel consumption values:
[MENU] + [MENU] + "ROUTE" + [ENTER] + "REPORT" + [ENTER] + "SPEED"/
"FUEL" + [ENTER] + use the cursor to insert values + [ENTER]
Sending/Receiving Route
E
To send the active Route to a external device capable of listening to NMEA RTE
and WPL sentences.
[MENU] + [MENU] + "ROUTE" + [ENTER] + "SEND" + [ENTER]
To receive Route from an external device capable of sending NMEA RTE and WPL
sentences. The Route is stored in the location of currently selected Route.
[MENU] + [MENU] + "ROUTE" + [ENTER] + "RECEIVE" + [ENTER]
Safe Route Checking
This function checks the presence of particular cartographic objects (see the list
below) on a range set by the user for all Route legs:
♦ Land Areas
♦ Shallow Water
♦ Intertidial Areas
♦ Rocks
♦ Wrecks
♦ Obstructions
♦ Shoreline Constructions
♦ Fishing Facility
♦ Dredged Areas
♦ Diffusers
♦ Mooring/Warping Facility
Page 29
30
User Manual
♦ Production Installation
♦ Pingos
♦ No Data Available
If any of these alarm conditions is detected, the function returns the list of dangerous objects and the relative dangerous Route leg, that is drawn with a different color.
To activate this function:
[MENU] + [MENU] + "ROUTE" + [ENTER] + "AUTOMATIC CHECK" + [ENTER]
+ "ON" + 'ENTER'
NOTE If Automatic Route Check is enabled, anytime you append or insert a new
Waypoint, delete, move or edit any Waypoint, the Route is checked. Only the
modified Route legs are checked.
To select the width of the detected area aside the Route:
[MENU] + [MENU] + "ROUTE" + [ENTER] + "ROUTE WIDTH" + [ENTER]
NOTE Safe Route width value represents half the total width checked by the
function.
To select the depth of the detected area aside the Route:
[MENU] + [MENU] + "ROUTE" + [ENTER] + "DEPTH LIMIT" + [ENTER]
It also possible to select the accuracy for the Route check, among Minimum, Low,
Medium, High and Maximum:
[MENU] + [MENU] + "ROUTE" + [ENTER] + "ACCURACY" + [ENTER]
The list of the dangerous objects found on the charts crossed by the Route is
shown in the Route check report, follow the procedure:
[MENU] + [MENU] + "ROUTE" + [ENTER] + "ROUTE CHECK REPORT" +
[ENTER]
3.3 GOTO FUNCTION
This functions allows you to place the destination point and immediately start
navigating to it.
Navigation to Waypoint
Place the cursor on the desired Waypoint + [ENTER] + "GOTO" + [ENTER]
A circle surrounds the Waypoint symbol. A dotted line is shown, connecting the
destination with the ship's position. When the destination is placed, all navigation
data are referred to it.
Deleting destination
If the destination has been placed, to stop the navigation to the Waypoint:
Place the cursor on destination icon + [ENTER] + "STOP NAV" + [ENTER]
NOTE If you select "NEXT"/"PREVIOUS" the destination icon is moved on the next/
previous Waypoint in the Route.
Otherwise when the cursor is placed on a generic position on the chart:
[ENTER] + "GOTO" + [ENTER] + "STOP NAV" + [ENTER]
NOTE If you select "START", the destination icon is moved on the new cursor position.
The symbol that identifies the destination disappears from the screen, but the
Waypoint remains.
Page 30
31
User Manual
3.4 USING TRACK
A very useful feature of the chart plotter, is the ability to store and display exactly
where the boat has been. This feature, referred to as Tracking, can provide
invaluable information about the effect of tide and wind influence on the boat's
progress as well as giving an indication of the helmsman's performance.
When this limit has been reached, the oldest points are deleted and overwritten
by the newest ones.
Setting up a Track Step
Before you use the Track function, it is important to specify the Track step unit: if
you select Distance, the Track point is placed when the distance from its last
stored position is greater than the defined distance; if Time, the Track point is
placed after the defined time; if Auto, the software decides when storing a position,
on the basis of the straight or curved track.
[MENU] + [MENU] + "TRACK" + [ENTER] + "STEP UNIT" + [ENTER] + "DIST"/
"TIME"/"AUTO" + [ENTER]
You can select the Track step Time [ 1, 5, 10, 30 sec; 1, 5, 10 min] or distance
[0.01, 0.05, 0.1, 0.5, 1.0, 2.0, 5.0, 10.0] Nm. Setting a short time/distance
interval between Track points is best suited to navigate within a close or complex
environment, a greater time/distance interval is best suited to a long voyage.
To select the interval at which the Track points are placed:
if you have selected Distance:
[MENU] + [MENU] + "TRACK" + [ENTER] + "DISTANCE" + [ENTER] + choice
the desired step + [ENTER]
if you have selected Time:
[MENU] + [MENU] + "TRACK" + [ENTER] + "TIME" + [ENTER] + choice the
desired step + [ENTER]
Selecting Track Color
To select among different line colors that you choose for the Track:
[MENU] + [MENU] + "TRACK" + [ENTER] + "COLOR" + [ENTER]
The same Track can be saved with any color.
Displaying Track
To enable or disable the Track displaying on the map screen:
[MENU] + [MENU] + "TRACK" + [ENTER] + "VISIBLE" + [ENTER] + "ON"/
"OFF" + [ENTER]
Activating/Deactivating Track Recording
To activate or deactivate the Tracking of the vessel while the vessel is moving:
[MENU] + [MENU] + "TRACK" + [ENTER] + "TRACKING" + [ENTER] + "ON"/
"OFF" + [ENTER]
Clearing Track
All the Track or part of it can be cleared from the screen:
[MENU] + [MENU] + "TRACK" + [ENTER] + "DELETE" + [ENTER] + "YES" +
[ENTER]
Selecting Track Number
The chart plotter has the capability to store up to 2 Tracks. To select a Track:
[MENU] + [MENU] + "TRACK" + [ENTER] + "ACTIVE TRK" + [ENTER] + use
the cursor key to select the number + [ENTER]
Page 31
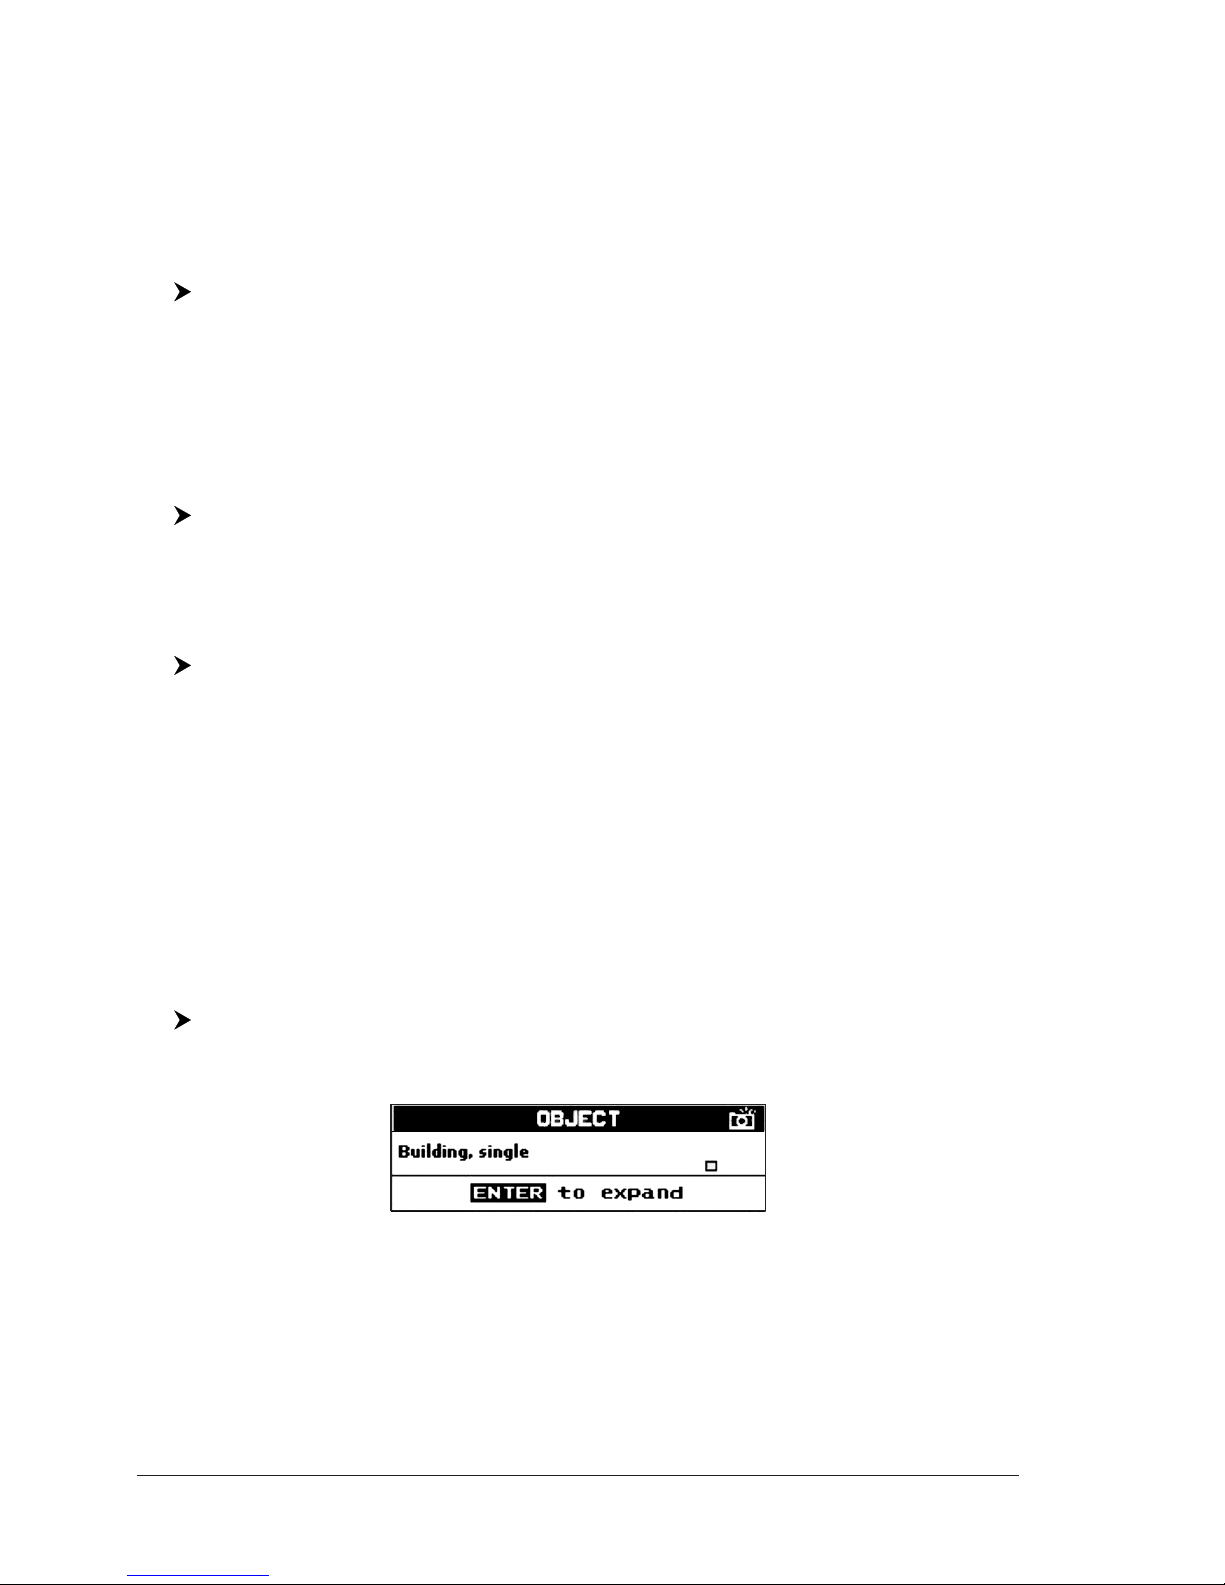
32
User Manual
3.5 INFO
Placing the cursor on cartographic objects the information related to the object
nearby is shown.
Setting Automatic Info
E
Automatic InfoE allows you to get the information on any cartographic object just
by placing the cursor on it.
You can select the type of it:
[MENU] + [MENU] + "ADVANCED SETTINGS" + [ENTER] + "SETUP" + [ENTER]
+ "Auto Info" + [ENTER]
The possible settings are Off (no automatic info shown at all), On Points (only on
points e.g. Rocks, Buoys, Lights, Tide Stations) and On All (on all objects, points,
lines and areas).
NOTE Choosing "On All" the Automatic InfoE will be shown most of the times the
cursor is moved.
Selecting Automatic Info
Move the cursor on the object
The pop-up window with the basic info of the objects is displayed. To get full
details of the object press [ENTER].
Displaying Expanded Info page (Full Info)
To show the Expanded Info page:
Place the cursor on objects + [MENU] + "INFO" + [ENTER]
Info Tree and Expanded Info page
The page combines the Info Tree and the Expanded Info pages; this gives the
advantage of showing the details of the object selected on the Info Tree while the
cursor is moving through the Info Tree’s items. The upper side of the page contains
the Info Tree and the Lower side contains the expanded information. While moving
the cursor through the Info Tree, all the relevant information of the selected object is
shown on the lower part of the page. When the selected object is a Tide Height,
pressing [ENTER] the Tide page is shown. Pressing [CLEAR] the page is closed. If
the information shown exceeds the page size, the user may scroll the page.
Info on objects with Pictures
To get the information on objects with pictures.
Move the cursor on the object
On the Quick Info, there will be the camera icon on the top bar of the window if at
least one of the objects found has one or more pictures associated.
Fig. 3.5 - Example of Quick Info on objects with picture
On the Full Info, there will be the small camera icon on a corner of the square
containing the object icon or a big photo icon centered on the square for the
object without icon.
Page 32
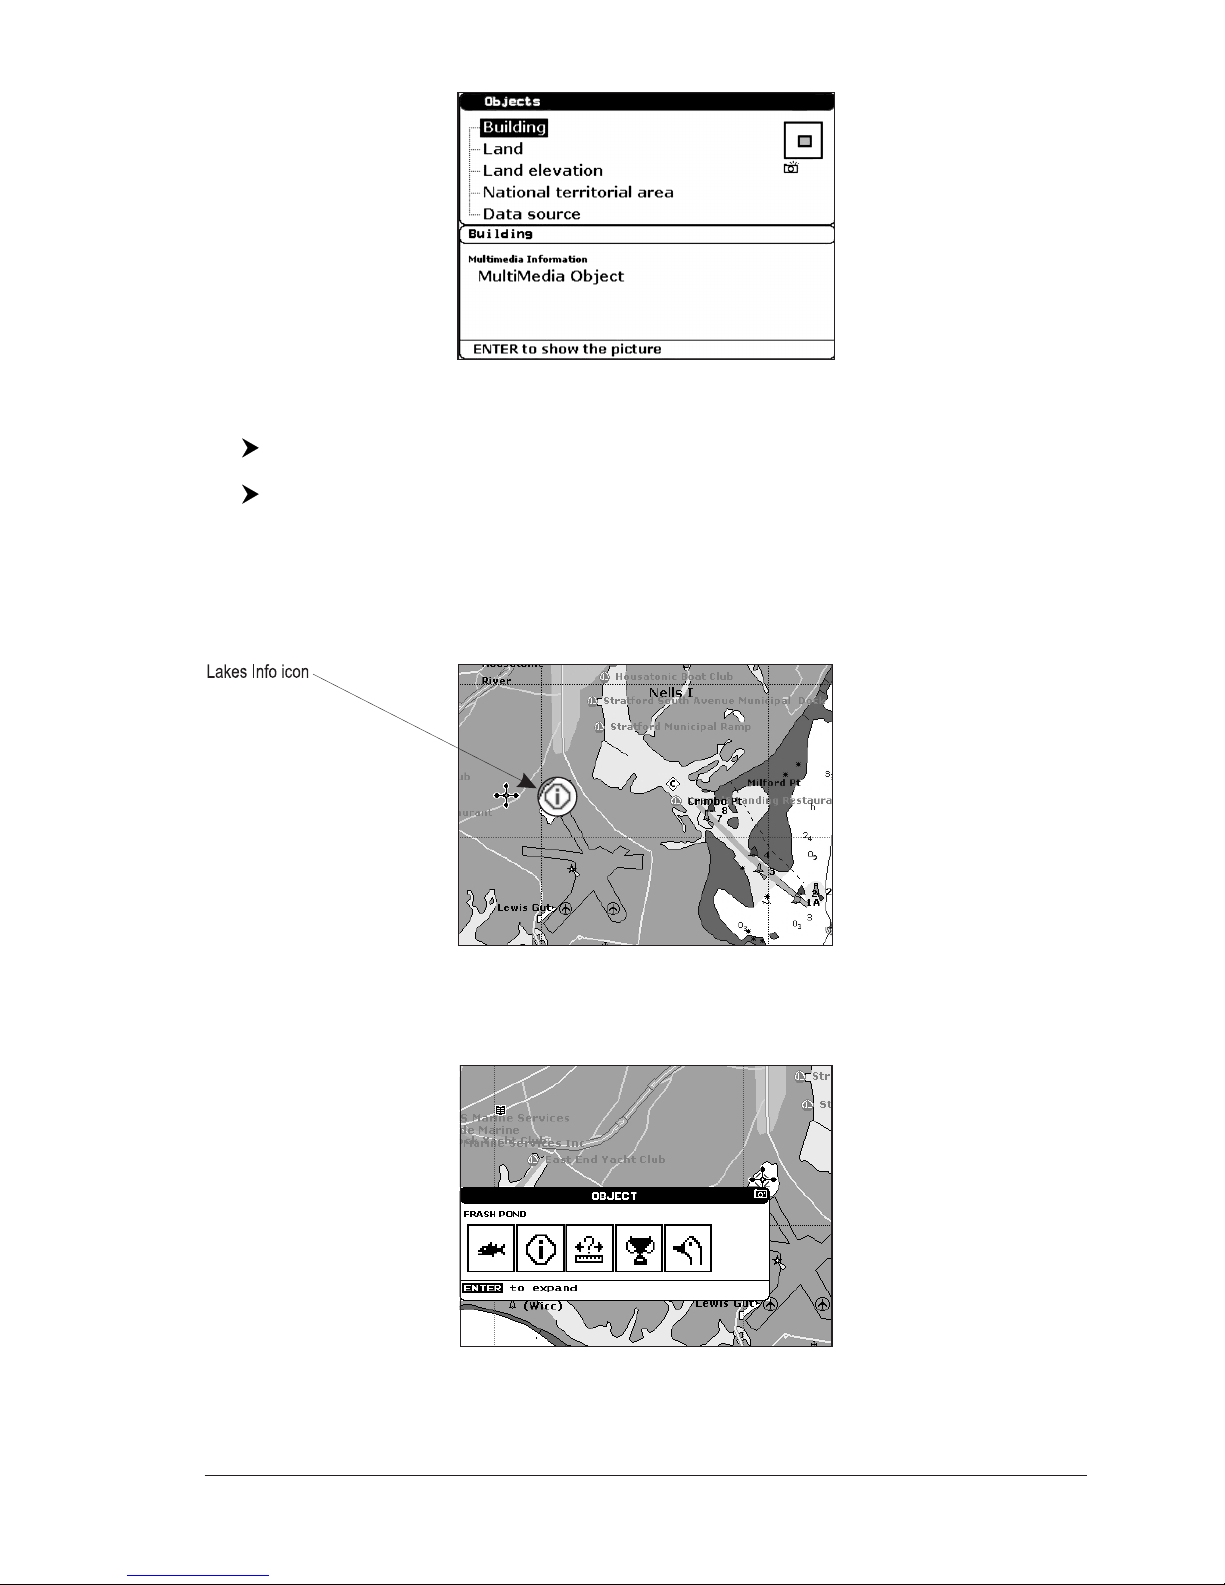
33
User Manual
Fig. 3.5a - Example of Full Info on objects with picture
To see pictures:
Press [MENU] when the object with a picture is highlighted
To change size:
Press [ENTER] when the picture is shown.
Quick Info on Lakes
Upon viewing the chart of a lake, you will click on to query the available information
immediately displayed with many details.
For example, see the following picture:
Fig. 3.5b - Example of Lakes info
When the cursor is placed over the icon, the icons of the available services are
shown:
Fig. 3.5c - Quick Info: available services
If you press [ENTER] all available information about the cartographic point under
Page 33
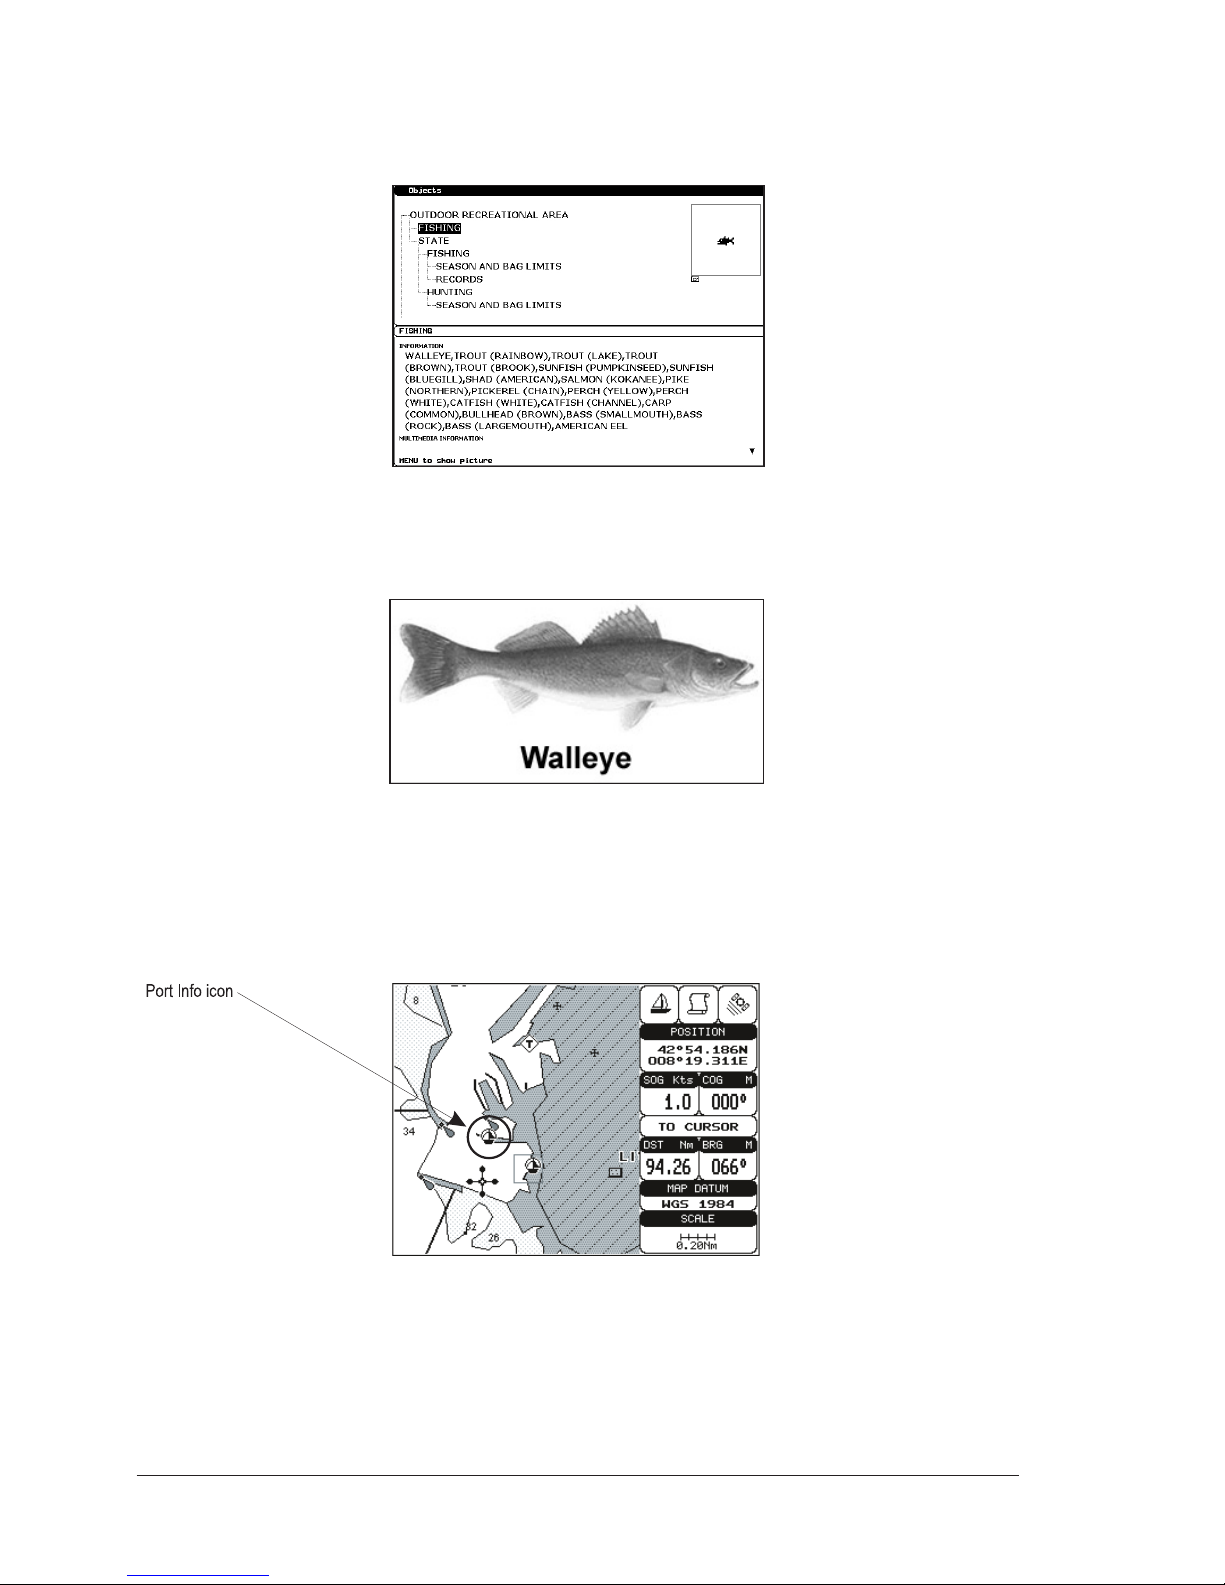
34
User Manual
the cursor will be shown. See the next paragraph.
Full Info on Lakes
The following is an example of Full Info on Lakes:
Fig. 3.5d - Example of Full Info page
To see the "Fishing" object press [MENU] (when the "Fishing" object is highlighted). On the screen appears:
Fig. 3.5e - Example of picture associated to the Fishing object
3.6 PORT & TIDE INFO
Getting Port Info
Fig.3.6 - Port Info icon
The object Port Marina contains the information about the services available on
the selected Port Marina and the area around it. To get info on Port Marinas, move
the cursor on the Port Info icon. The available information is shown in the Automatic
Info window where icons of the available services are shown:
Page 34
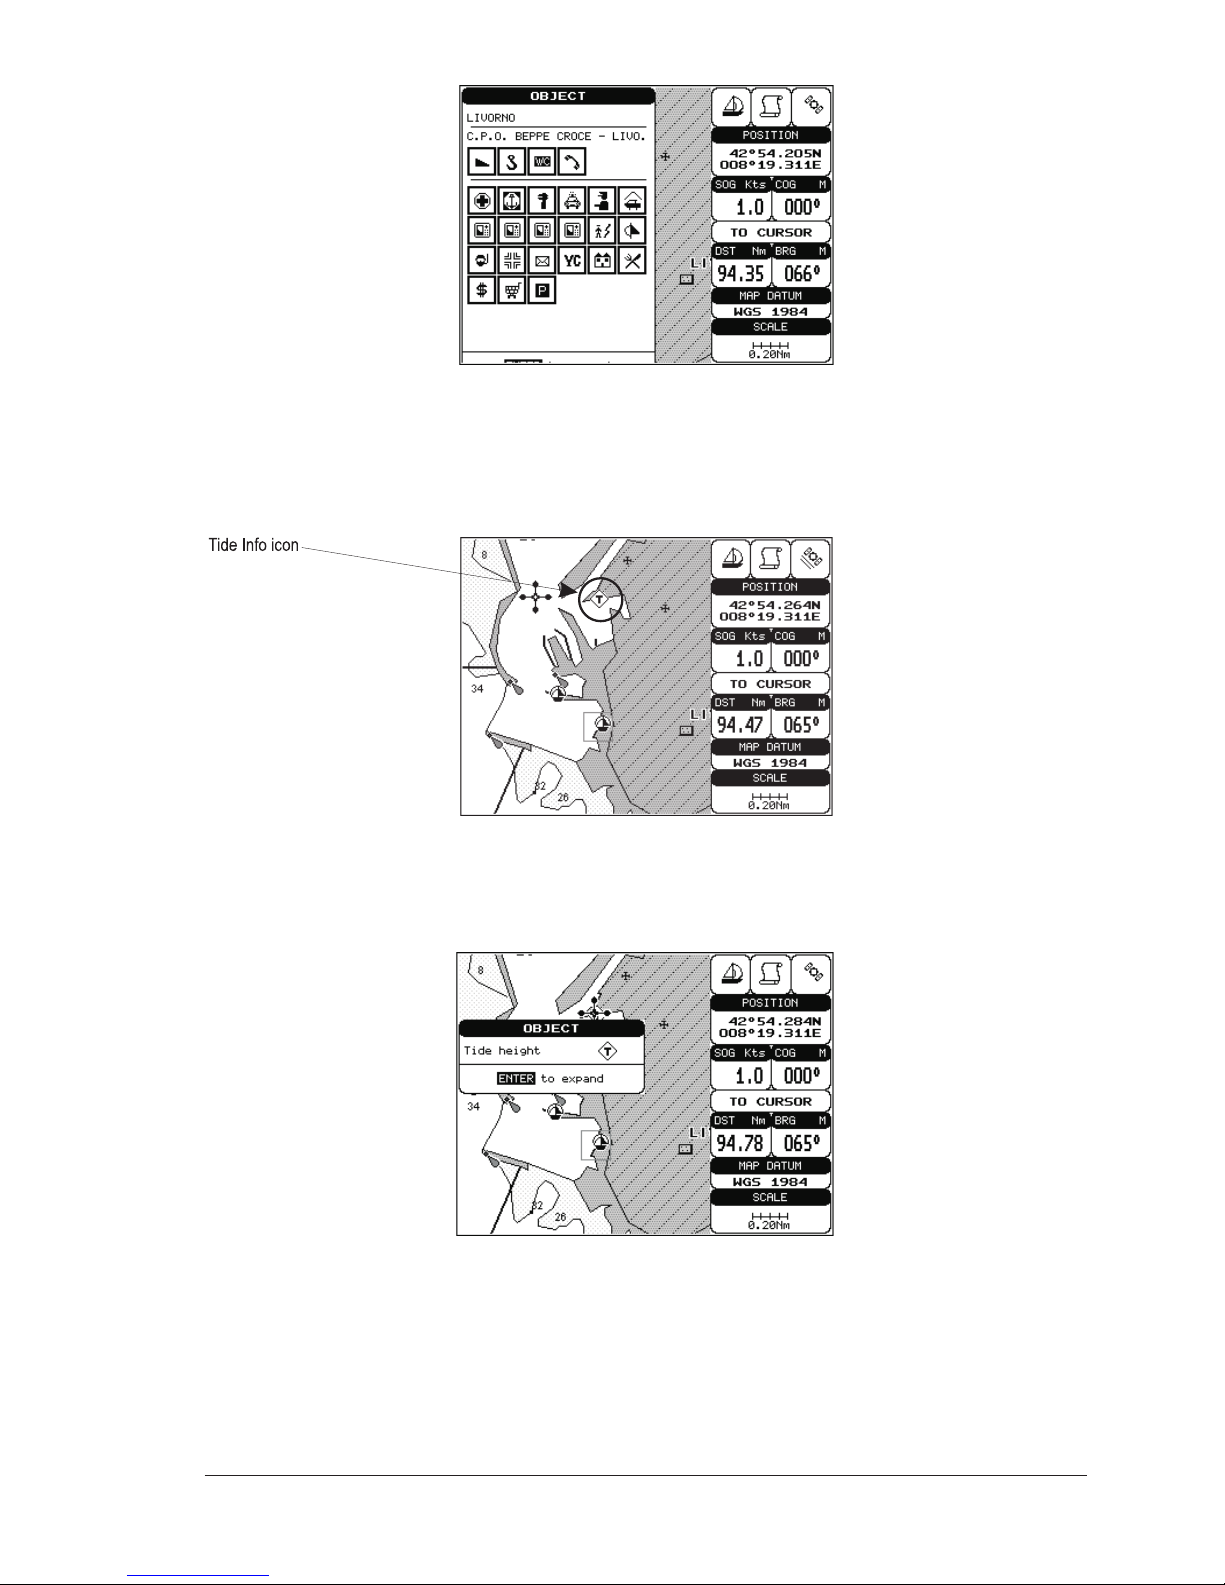
35
User Manual
Fig.3.6a - Automatic Info window on Port
To expand information about that object press [ENTER].
NOTE Port Info icon is visible only if the Ports + Services option is On
Getting Tide Info
Fig. 3.6b - Tide Info icon
By placing the cursor over the Tide Station icon, the chart plotter pops-up the
relative automatic info window (see picture below) and allows displaying a graphical
page with the tides prediction of the selected object.
Fig. 3.6c - Automatic Info window on Tide
Use [ENTER] to display the Tide Graph page. It shows the Tide height variations
during the 24 hours at any given day.
Page 35
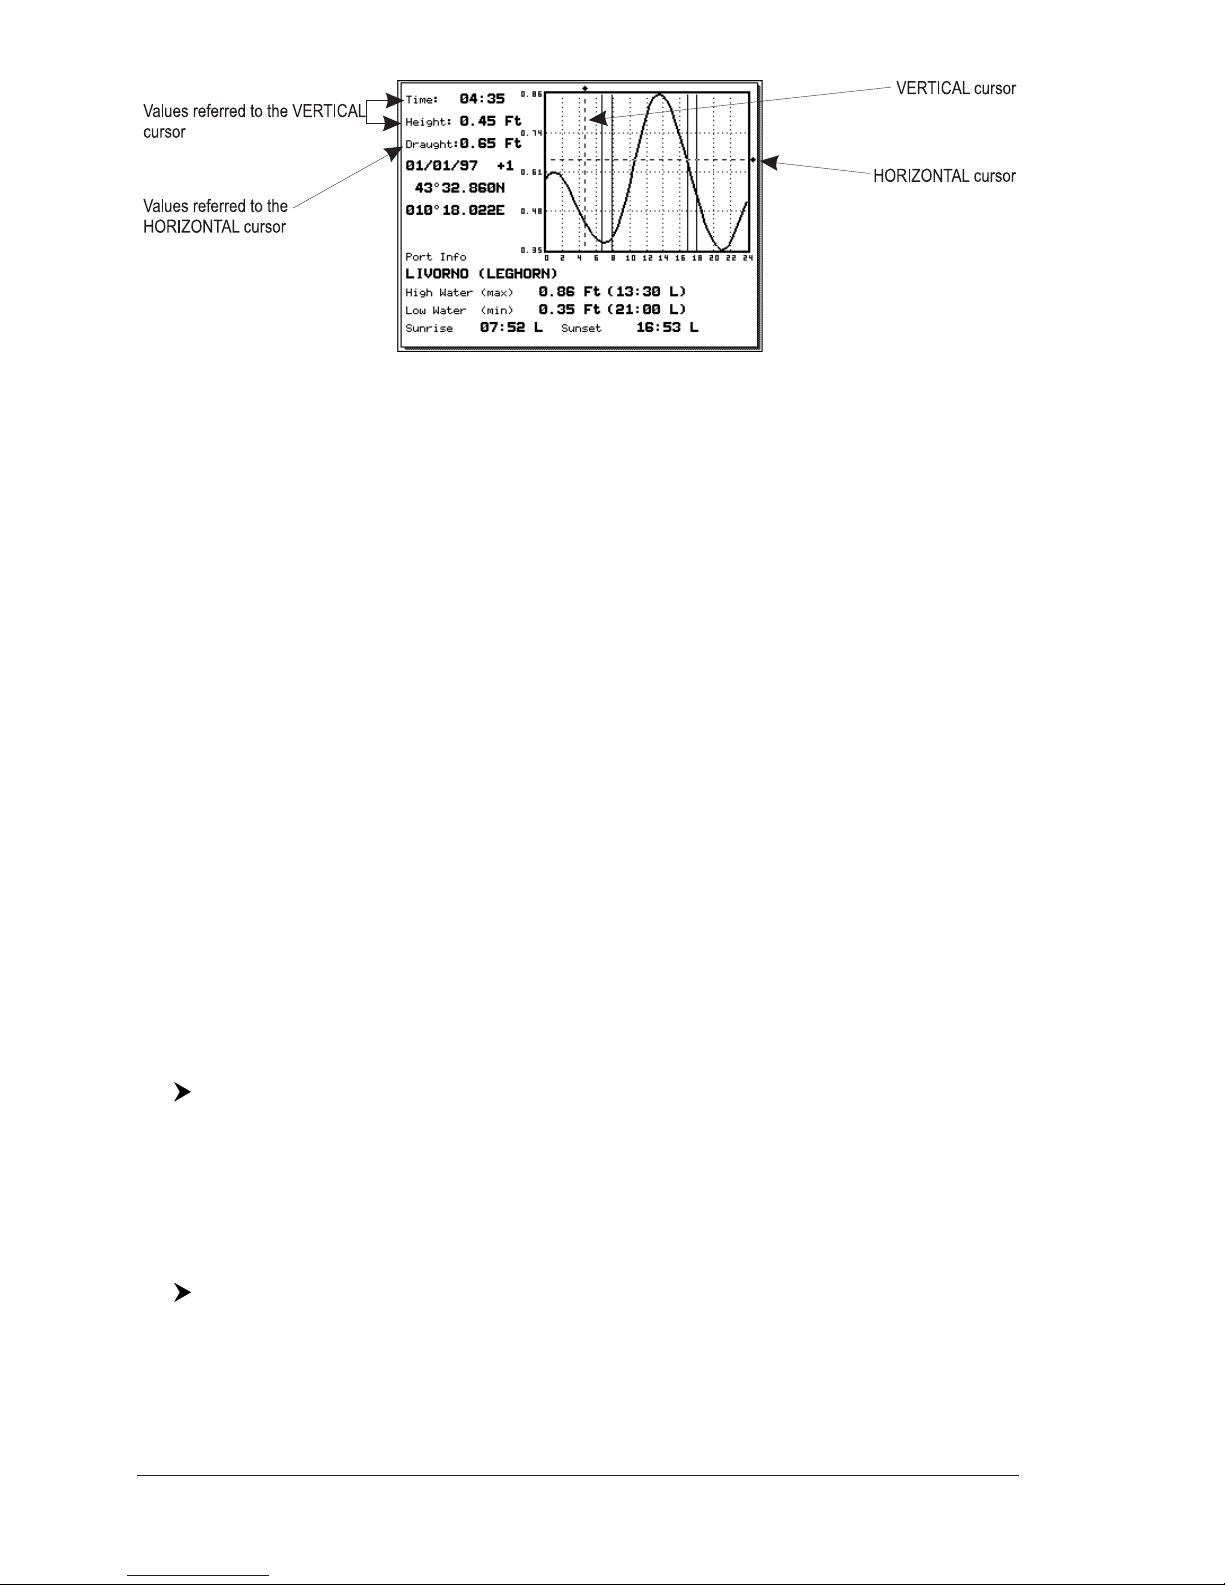
36
User Manual
Fig. 3.db - Tide Graph page
This screen shows that day's Tide Height graph for the area where the Tidal
symbol was located. Using [ZOOM IN] and [ZOOM OUT] it is possible to display
future or past tides. If you wish to quickly display the tide for a specific date,
press [ENTER] and enter the required date using the cursor key followed by
[ENTER] once the date is set. To simplify reading the graph, the chart plotter
displays a moveable Vertical and Horizontal slider which can be moved using the
cursor key. Using the up/down cursor key, move the horizontal slider to correspond
with the draft of your boat. Using the Vertical slider you can then read the times
at which the graph dips below the horizontal line i.e. the times when you will be in
danger of grounding.
NOTE Tide graph is an approximation of the tide and they should be used in conjunction
with traditional tide tables and navigational methods. The Tide height value
represents the variation relative to the "Mean Lower Water" value.
3.7 FIND FUNCTION
The Find function allows searching for the nearest Port, Port Services, Tide Stations,
Wrecks, Obstructions, Points Of Interest and Lakes loaded on the C-CARD. When
the Find function is executed a list of available objects to search is shown. Also
the Find function allows to center the screen over a selected User Point, on the
Cursor position or at desired Coordinates.
NOTE Activating the Find function a Warning message is shown if there is no C-CARD
inserted.
Finding Nearest Services
To show the nearest Port Services of a particular type (i.e. the nearest Hospital,
sailmaker, bank, etc.).
[MENU] + "FIND" + [ENTER] + "NEAREST SERVICES" + [ENTER]
The icons list of the available services is shown. Use the cursor key to select any
facility and press [ENTER]. By selecting one of the facilities the list of the nearest
ports (up to 10) in which this port facility is present, will be shown.
Finding Tide Stations
To show the nearest Tide Stations to the boat position (or to the cursor position if
the position fix is not received).
[MENU] + "FIND" + [ENTER] + "TIDE STATIONS" + [ENTER]
After a few seconds a window appears. Choose the Tide Station you want and
press [ENTER] to display the Tide Graph page. Press [CLEAR] to display the
Tide Station chosen.
Page 36
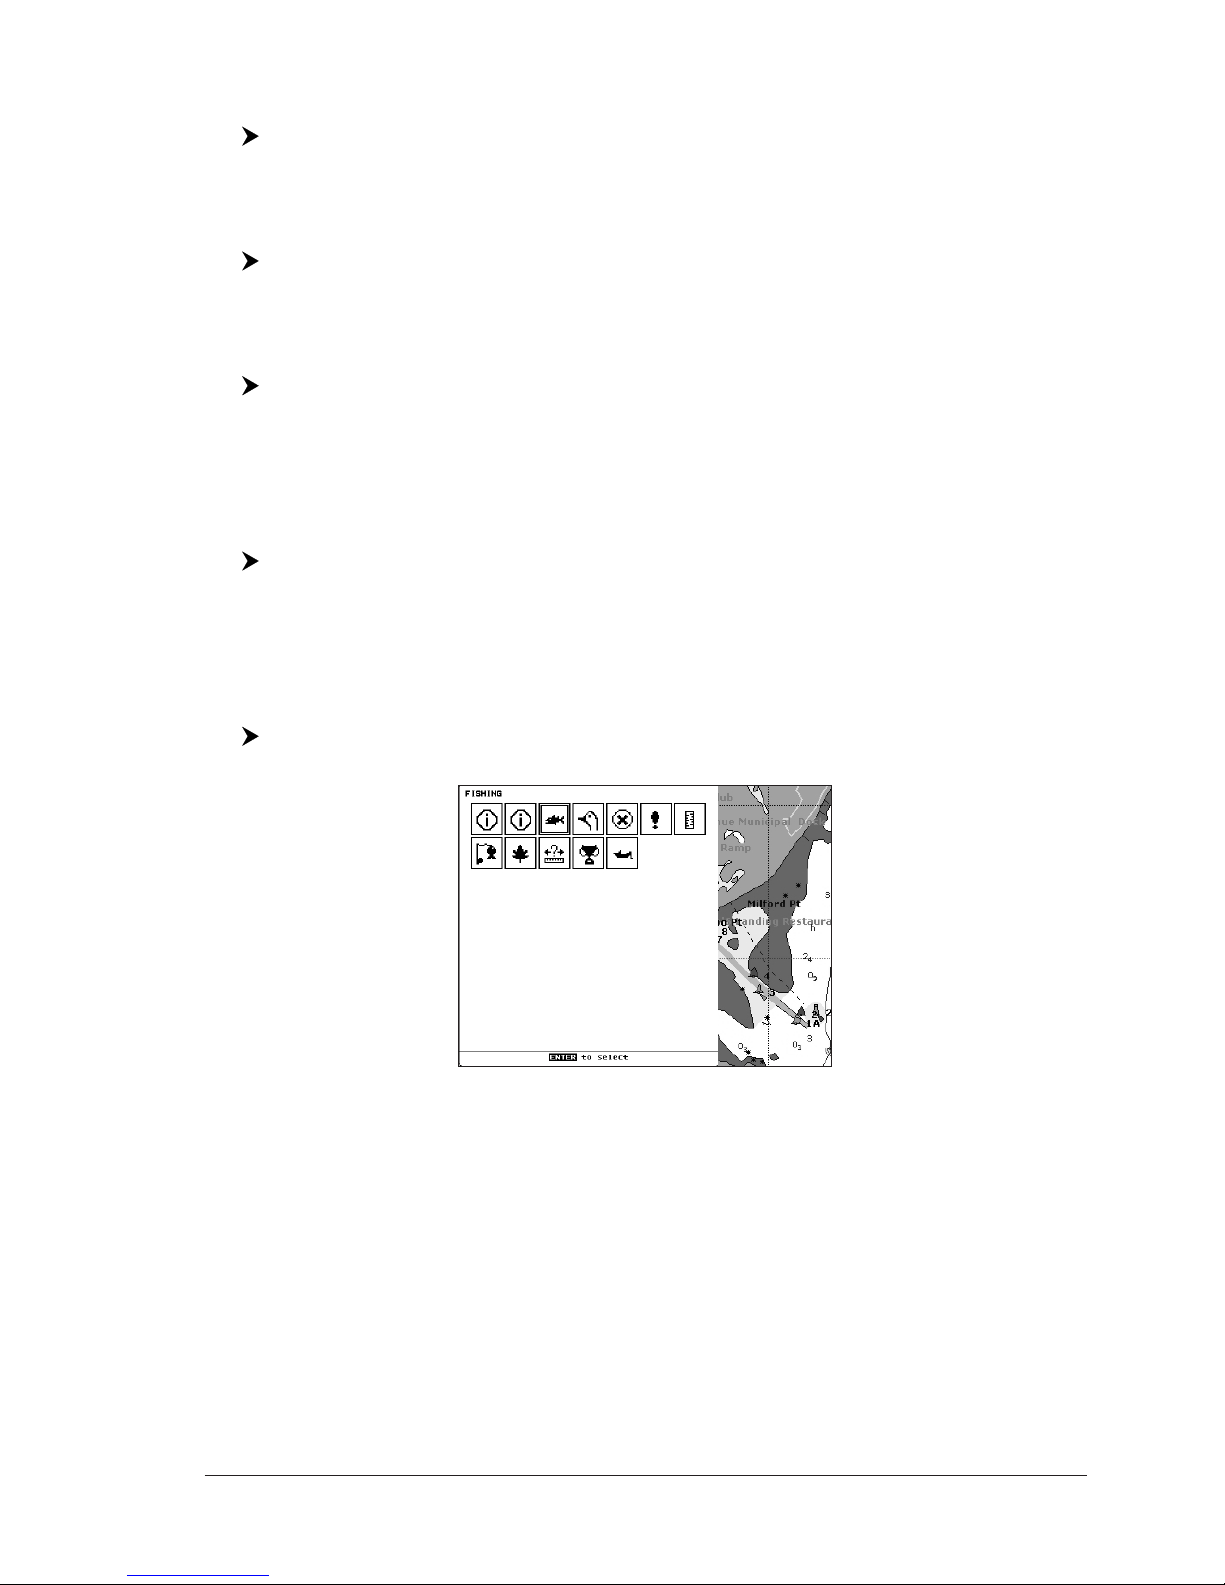
37
User Manual
Finding Wrecks
To show the nearest Wrecks loaded in the C-CARD:
[MENU] + "FIND" + [ENTER] + "WRECKS" + [ENTER]
Press [ENTER] to locate the selected Wreck on the map.
Finding Obstructions
To show the nearest Obstructions loaded in the C-CARD:
[MENU] + "FIND" + [ENTER] + "OBSTRUCTIONS" + [ENTER]
Press [ENTER] to locate the selected Obstruction on the map.
Finding Port By Name
To select the Port By Name function following the procedure:
[MENU] + "FIND" + [ENTER] + "PORT BY NAME" + [ENTER]
Shows the list of all ports stored on the C-CARD in alphabetical order and allows
to search ports by name to locate the ports on the map. Press [ENTER] + [CLEAR]
to locate the selected Port by Name on the map.
Finding Port By Distance
To select the Port By Distance function following the procedure:
[MENU] + "FIND" + [ENTER] + "PORT BY DISTANCE" + [ENTER]
Shows the list of all ports stored on the C-CARD in closest distance order and
allows to locate the ports on the map. Press [ENTER] + [CLEAR] to locate the
selected Port by Distance on the map.
Finding Lakes Information
Searches for nearest Lakes Info:
[MENU] + "FIND" + [ENTER] + "LAKES INFO" + [ENTER]
It founds the Outdoor Recreational Area objects. See the following picture:
Fig. 3.7 - Outdoor Recreational Area objects
Use the cursor key to select any objects and press [ENTER]. The list of the
nearest lakes containing the facility will be shown on the screen.
Page 37
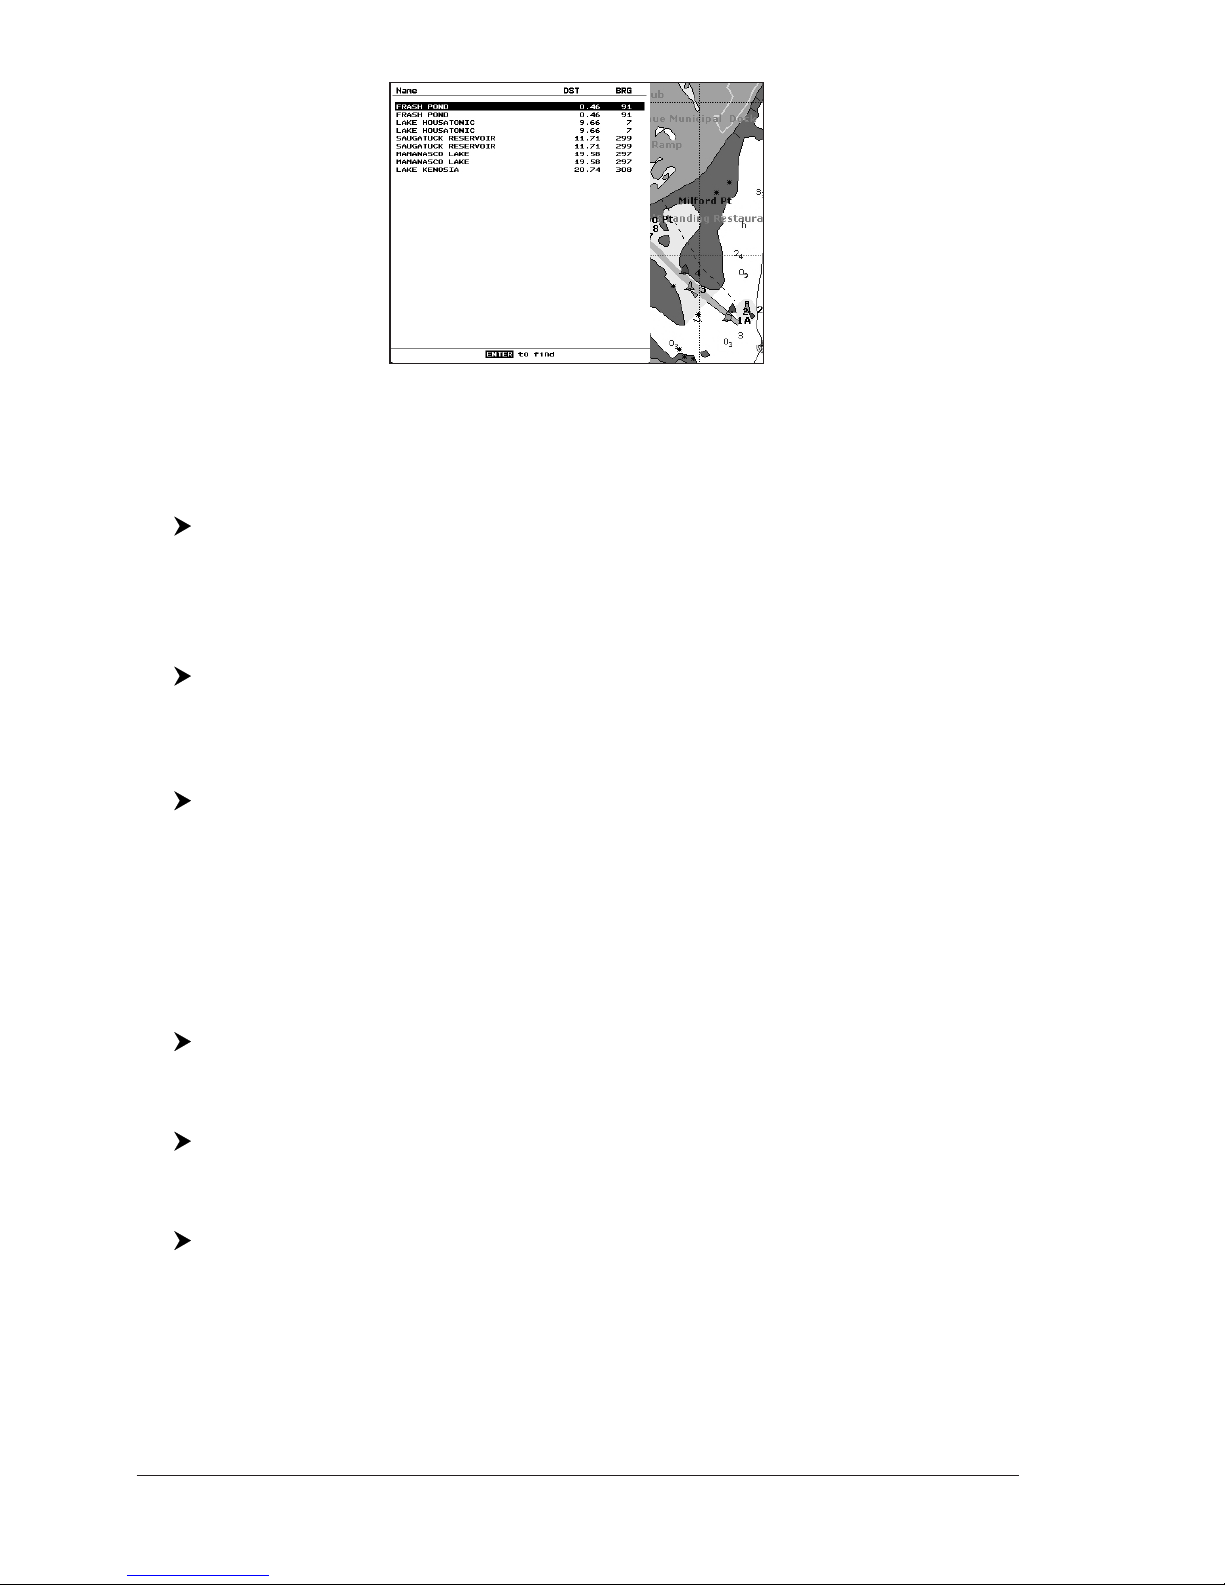
38
User Manual
Fig. 3.7a - Nearest Lakes list
Then choose the lake you want and press [ENTER]: the Full Info page is shown.
Finding Lakes By Name
To select the lakes By Name function following the procedure:
[MENU] + "FIND" + [ENTER] + "LAKES BY NAME" + [ENTER]
Shows the list of all lakes stored on the C-CARD in alphabetic order. Pressing
[MENU] to insert the Lake name.
Finding Points Of Interest
Searches for nearest Points Of Interest (POI):
[MENU] + "FIND" + [ENTER] + "POINTS OF INTEREST" + [ENTER]
A sub-menu is opened to find different categories of Points Of Interest.
Finding Coordinates
To center the map at given coordinates:
[MENU] + "FIND" + [ENTER] +"COORDINATES" + [ENTER] + use the cursor
to insert coordinates + [CLEAR]
3.8 ALARMS
The chart plotter provides alarms for various functions. You can enter the desired
alarm range for each function.
Arrival Alarm
To set an acoustic alarm to sound when the vessel is approaching the destination.
[MENU] + [MENU] + "ALARMS" + [ENTER] + "ARRIVAL ALARM" + [ENTER]
XTE Alarm
To set an acoustic alarm to sound when the vessel is deviating from a defined course.
[MENU] + [MENU] + "ALARMS" + [ENTER] + "XTE ALARM" + [ENTER]
Anchor Alarm
To set an alarm to sound when the ship moves off the current ship's position location.
[MENU] + [MENU] + "ALARMS" + [ENTER] + "ANCHOR ALARM" + [ENTER]
NOTE By the time the Anchor Alarm is set the current ship's position is saved as
origin position. The alarm goes off when the ship moves away from the origin
position more than the entered alarm range.
Depth Alarm
To set an acoustic alarm to sound when the received depth value (from the depth
transducer) is too shallow.
Page 38
39
User Manual
[MENU] + [MENU] + "ALARMS" + [ENTER] + "DEPTH ALARM" + [ENTER]
Audible Alarm
To enable (On) or disable (Off) the Audible Alarm.
[MENU] + [MENU] + "ALARMS" + [ENTER] + "AUDIBLE ALARM" + [ENTER]
Grounding Alarm
To verify potential danger to navigation such shallow water (depth areas), intertidal areas, land, rocks, obstructions and shoreline constructions. The maps are
scanned every 10 seconds.
If any of the above objects are found, the chart plotter notifies the danger on a
dedicated warning message box. The active "Grounding Alarms" are shown in the
Grounding Alarm Report page.
To activate the Grounding Alarm:
[MENU] + [MENU] + "ALARMS" + [ENTER] + "GROUNDING ALARM" +
[ENTER]
The chart plotter scans a sector in front of the boat. The direction is determined
by the current boat heading. You can select the length and its angle is 30 degrees.
The Grounding Alarm is switched Off by default after a Master Reset.
Grounding Alarm Range
To set the length of the sector to be detected among 0.25, 0.5, 1.0 Nm.
[MENU] + [MENU] + "ALARMS" + [ENTER] + "GROUNDING ALARM RANGE"
+ [ENTER]
Grounding Alarm Report
E
To display the report of the dangerous objects currently detected.
[MENU] + [MENU] + "ALARMS" + [ENTER] + "GROUNDING ALARM REPORT"
+ [ENTER]
When any of the searched objects is found in the scanned area, a tick marker is
printed on the relative box to identify which dangerous objects have been currently detected. Once the alarm condition is no longer present, the relative tick
marker is removed.
NOTE The alarm "No data" is shown when no specific cartographic data are found
on the C-CARD or when no C-CARD is inserted.
MAP 11csE Plus GPS/MAP cX Plus GPS:
External Alarm
When any alarm condition occurs the pin is switched from High Impedance to
ground. This signal can be used by an external device (as a hooter or buzzer).
[MENU] + [MENU] + "ALARMS" + [ENTER] + "EXTERNAL ALARM" + [ENTER]
3.9 USER C-CARD
The chart plotter allows to back up Marks, Routes and Tracks to a User C-CARD.
You can also restore the data to internal memory at a later time. This allows
virtually unlimited storage. The User C-CARD data storage is organized as a file
system.
User C-CARD page
To display the content of a User C-CARD inserted into the C-CARD slot of your
chart plotter:
[MENU] + [MENU] + "USER C-CARD" + [ENTER]
Page 39
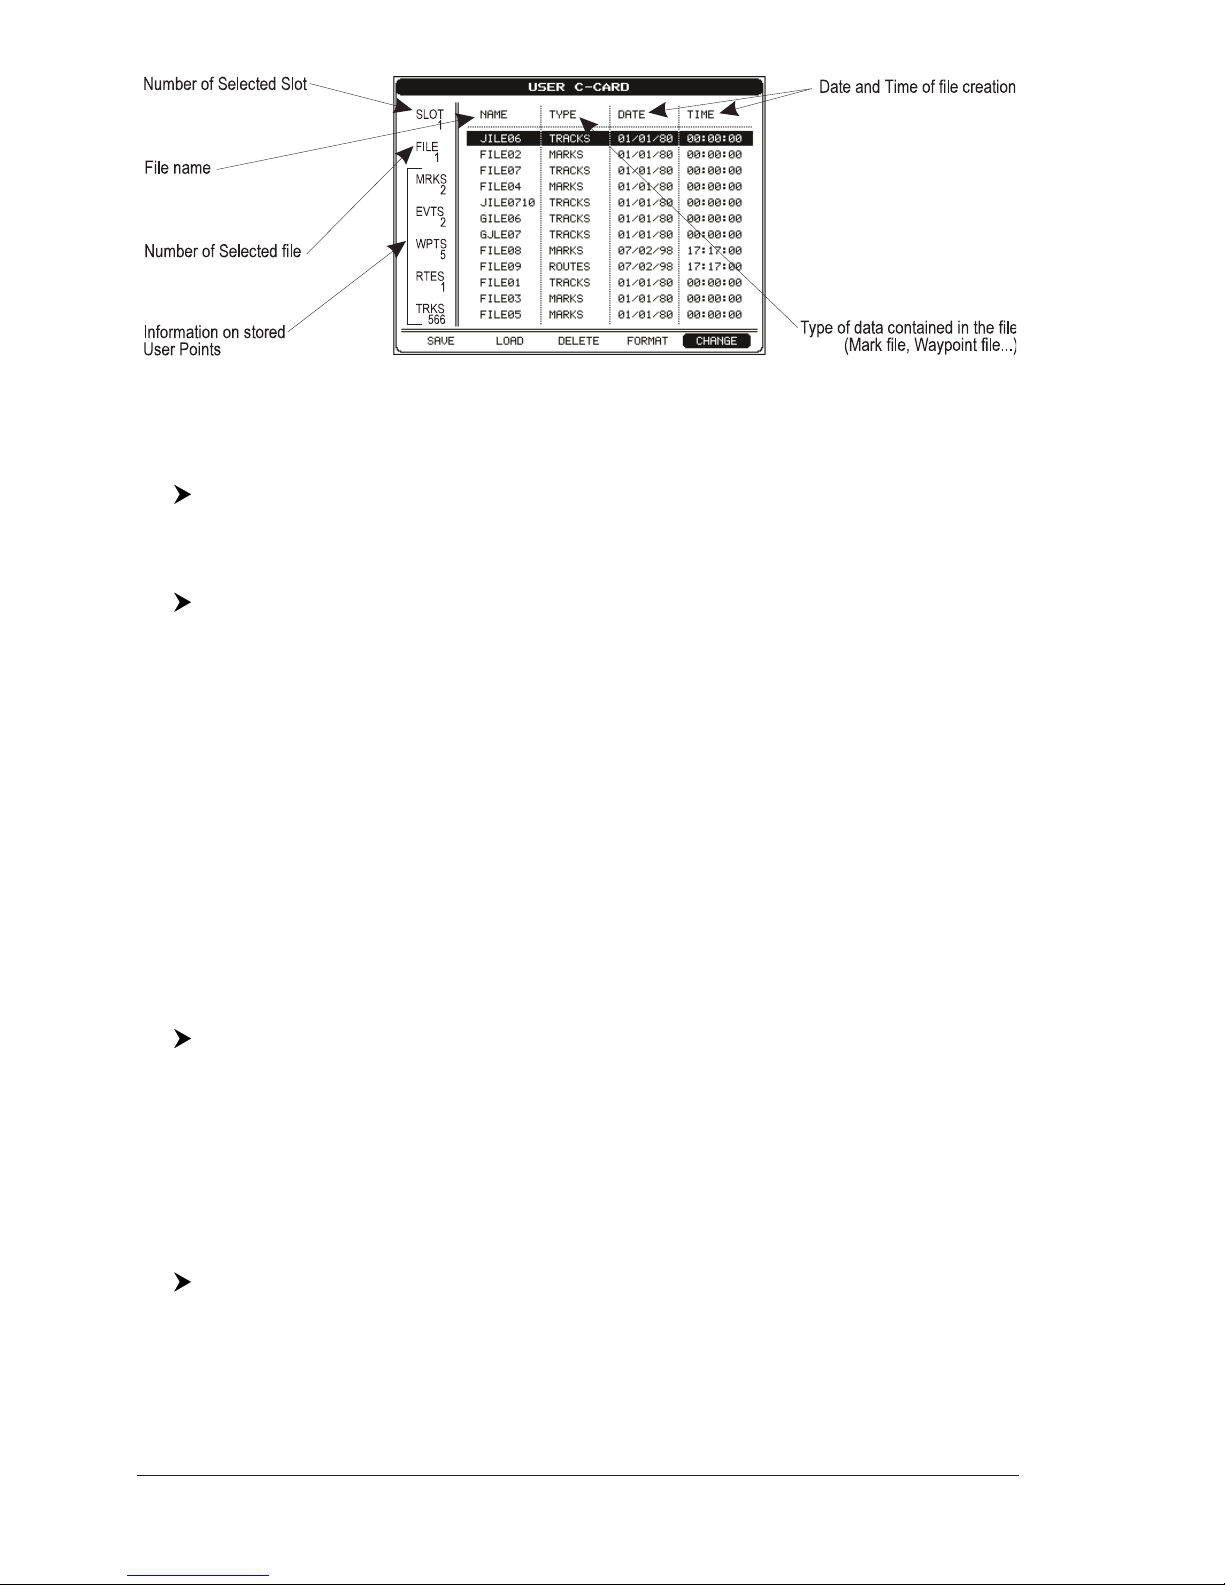
40
User Manual
Fig.3.9 - User C-CARD Menu
Formatting User C-CARD
In order to be able to use a new User C-CARD you must format it first. This
operation prepares the User C-CARD to receive and store information:
[MENU] + [MENU] + "USER C-CARD" + [ENTER] + "FORMAT" + [ENTER]
NOTE When a User C-CARD is formatted, all data saved on it will be deleted.
Saving File on User C-CARD
[MENU] + [MENU] + "USER C-CARD" + [ENTER] + "SAVE" + [ENTER] +
insert the file name and type + [ENTER]
When a certain type of data (Mark, Route, Track) is saved, a new file is created on
a User C-CARD. The file contains all points of the selected type currently stored in
the internal memory.
♦ Save Marks: creates a new file containing all Marks stored in the chart plotter
♦ Save Route : creates a new file containing all Waypoints belonging to the
selected Route (Route number is required)
♦ Save Track : creates a new file containing all Track points belonging to the
selected Track (Track number is required)
NOTE When naming a file, you may have trouble finding a name that uniquely identifies
the file's contents. Dates, for example, are often used in file names; however,
they take up several characters, leaving you with little flexibility. The secret is
to find a compromise, a point where you can combine a date with a word, creating
a unique file name. The maximum length of the file name is 8 characters. The
characters may be numbers (0, ..., 9), letters (A, ..., Z) and spaces (for example
legal identifiers are "ABC", "AA", "12121212", "A B C", "1 A 1", and so on.
Loading File from User C-CARD
Select the file name in the list + [MENU] + [MENU] + "USER C-CARD" +
[ENTER] + "LOAD" + [ENTER]
The Load function copies the content of the selected file from User C-CARD to the
internal memory of the chart plotter. If the selected file contains Marks already
present in the chart plotter memory, they are non duplicated. It is required to
insert the number of the Route/Track on which loading data: if the Route/Track is
not empty, it is overwriten.
Deleting File from User C-CARD
To remove files.
[MENU] + [MENU] + "USER C-CARD" + [ENTER] + "DELETE" + [ENTER] +
"YES" + [ENTER]
NOTE Remember that this option permanently erases the file.
Page 40

41
User Manual
MAP 11csE Plus GPS/MAP cX Plus GPS:
Changing User C-CARD
Allows to select the slot in which the User C-CARD is inserted.
[MENU] + [MENU] + "USER C-CARD" + [ENTER] + "CHANGE" + [ENTER]
Page 41

42
User Manual
Page 42
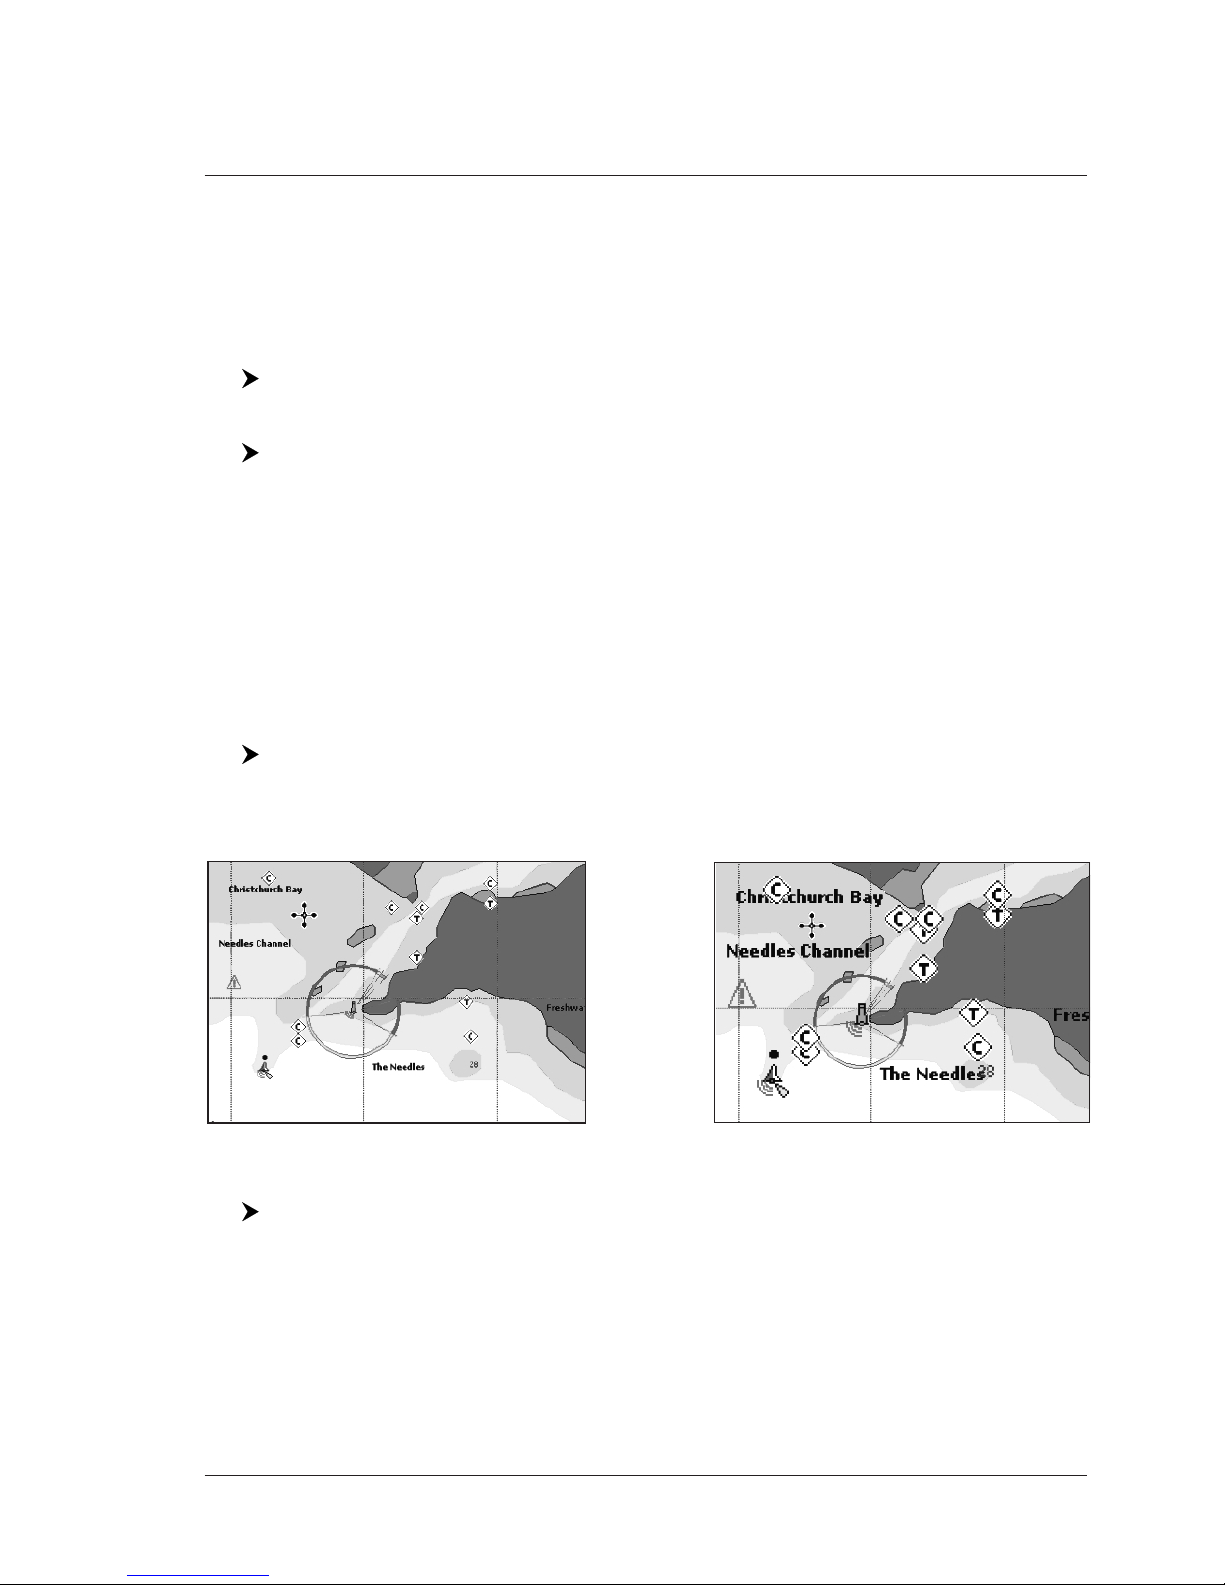
43
User Manual
4. User Setting Up
4.1 MAP MENU
To set up the map layout (available only from the chart page):
[MENU]
Zoom Type
E
[MENU] + "ZOOM TYPE" + [ENTER]
Allows larger expansion or compression of the chart scale while zooming in or out.
Zoom Type has two options; Standard (default) or Flexi-Zoom. When in FlexiZoom mode, a short [ZOOM...] push causes a change of chart, whilst a long
[ZOOM...] push (press and hold) causes a pop-up window to be displayed on a
corner of the screen. The window shows the current Zoom Factor. By pressing
[ZOOM IN]/[ZOOM OUT] the map is expanded or compressed according to the
zoom factor selected. The Window is automatically closed if [ZOOM...] is not
pressed for 2 seconds and the selected zoom factor will be used at the next zoom
in/out.
Fonts & Symbols
E
[MENU] + "FONTS & SYMBOLS" + [ENTER]
It is possible to set the size of all names and symbols drawn on the charts,
selecting between Normal size (the regular characters size) and Large size.
NORMAL size
LARGE size
Fig. 4.1 - Example of Normal size (on the left side) and Large side (on the right side) settings
Perspective View
E
[MENU] + "PERSPECTIVE VIEW" + [ENTER]
Chart data may be projected in perspective mode during navigation. This function
allows setting the panoramic view of the chart. As the upper side of the map is
more compressed than the lower side, a wider map area is visible. The Perspective ViewE allows showing more chart information immediately ahead and around
the cursor.
Page 43
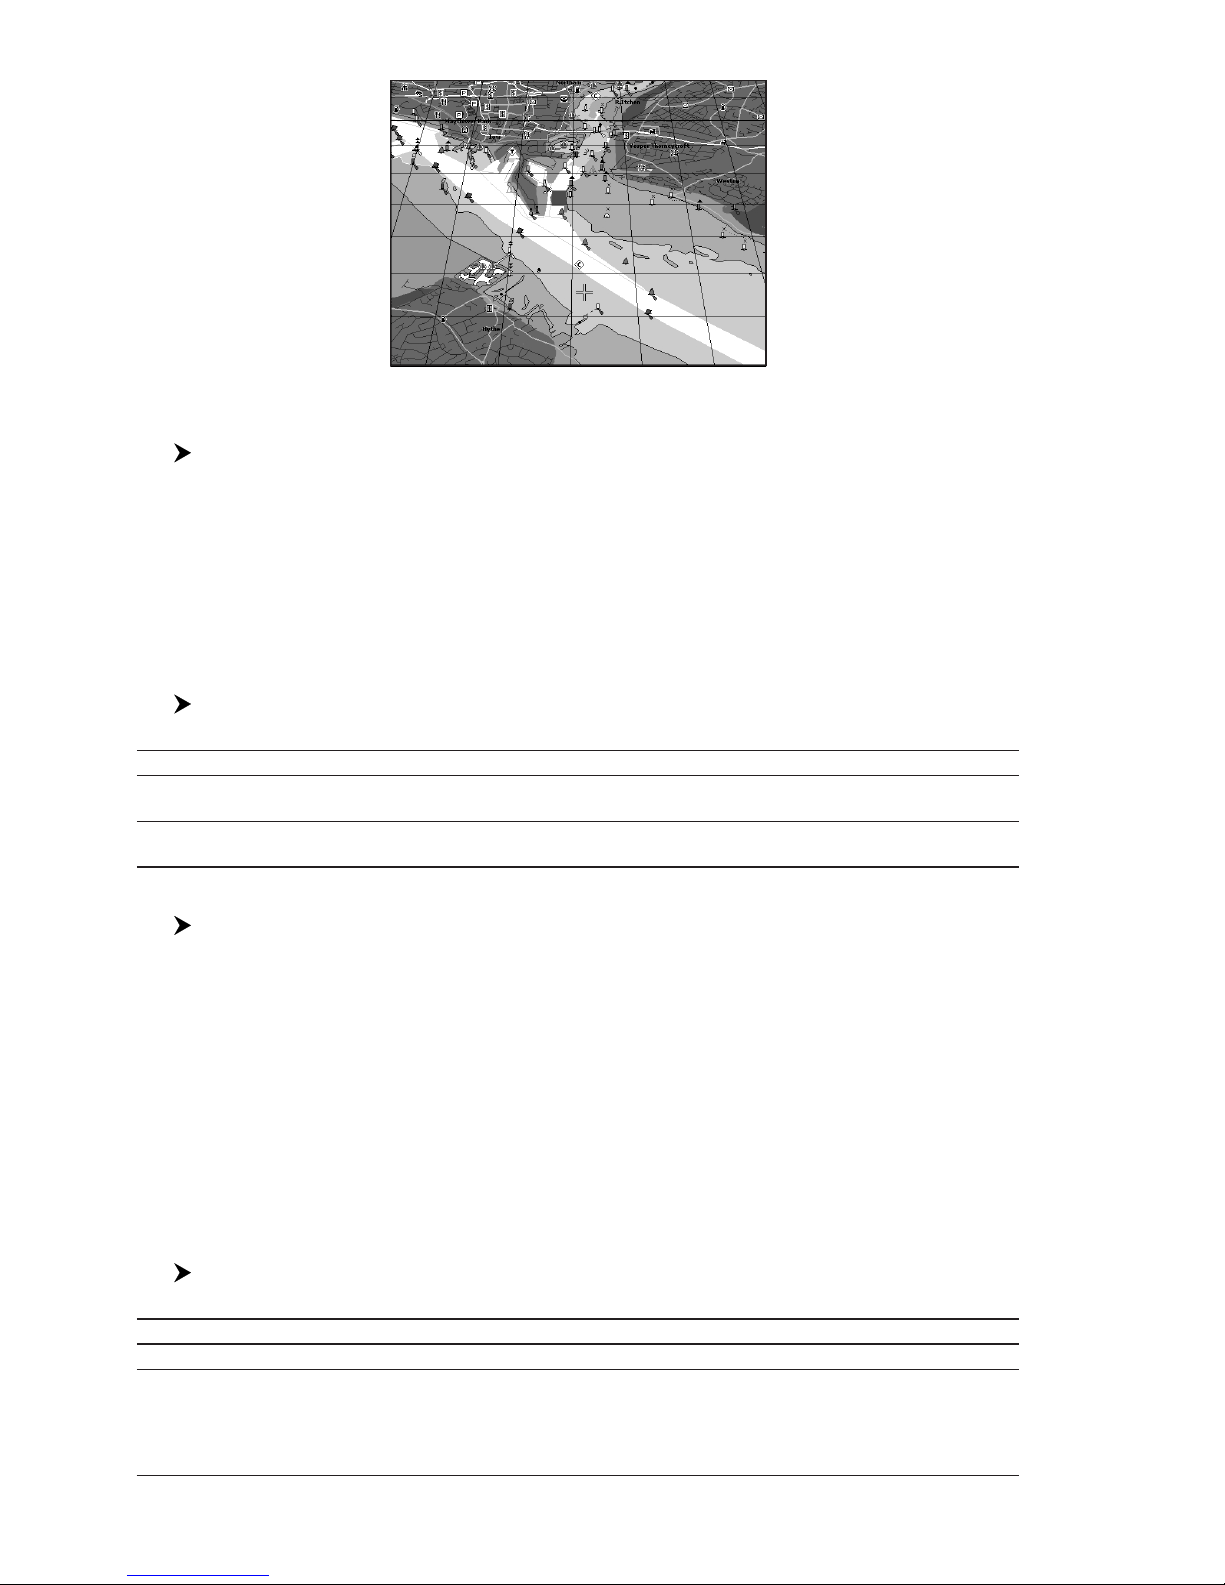
44
User Manual
Fig. 4.1a - Perspective View
Dynamic Nav Aids
[MENU] + "DYNAMIC NAV-AIDS" + [ENTER]
This function allows settings blinking lights on Nav-Aids. The blink period and
color of each Nav-aid is read from the Nav-Aid attributes available on the data
cartridge. When the ship is inside the Nav-Aid nominal range, the light of the NavAid will start blinking.
When Dynamic Nav-Aids option is set to On, when the flashing light is Off, or
when fix position is out of the sector, the light color is displayed by using a faint
light color.
Map Orientation
E
[MENU] + "MAP ORIENTATION" + [ENTER]
The possible choices are listed in the table below:
North : The map is shown with North upwards.
Head : The map is shown with the ship's current heading upwards. If Head is selected, insert the Map
Orientation Resolution angle in the range [5, 60] degrees.
Course : The map is shown with the currently selected course leg upwards. If Course is selected, insert the
Map Orientation Resolution angle in the range [5, 60] degrees.
Mixing Levels
E
[MENU] + "MIXING LEVELS" + [ENTER]
When the map coverage at the current zoom level does not fill the entire screen,
the chart plotter draws the rest of the map expanding the cartographic information
read from, at most, two zoom levels above the current zoom level. For this reason
the map is drawn three times: firstly it draws the two levels before the current
level and then the current level. The area covered by the cartographic data read
from the previous levels is identified by a dotted pattern. When the cursor is
moved on an area not covered by data of the current level the chart plotter
zooms out to the first level covered by cartographic data.
NOTE The Mixing LevelsE function works only with the new C-CARDs. It also affects
the speed of the redraw of the screen. If this function is not used it may be
disabled.
Safety Status BarE (DSI = DATA SAFETY INDICATOR)
[MENU] + "SAFETY STATUS BAR" + [ENTER]
The possible choices are listed in the table below:
On : The Safety Status BarE is shown.
Off : The Safety Status BarE is not shown.
Icon : The Safety Status Bar
E
is not shown, but a Warning alarm Icon is shown on the corner of the map
screen as soon as any item controlled by the DSI (Data Safety Indicator) function returns an alarm
Page 44
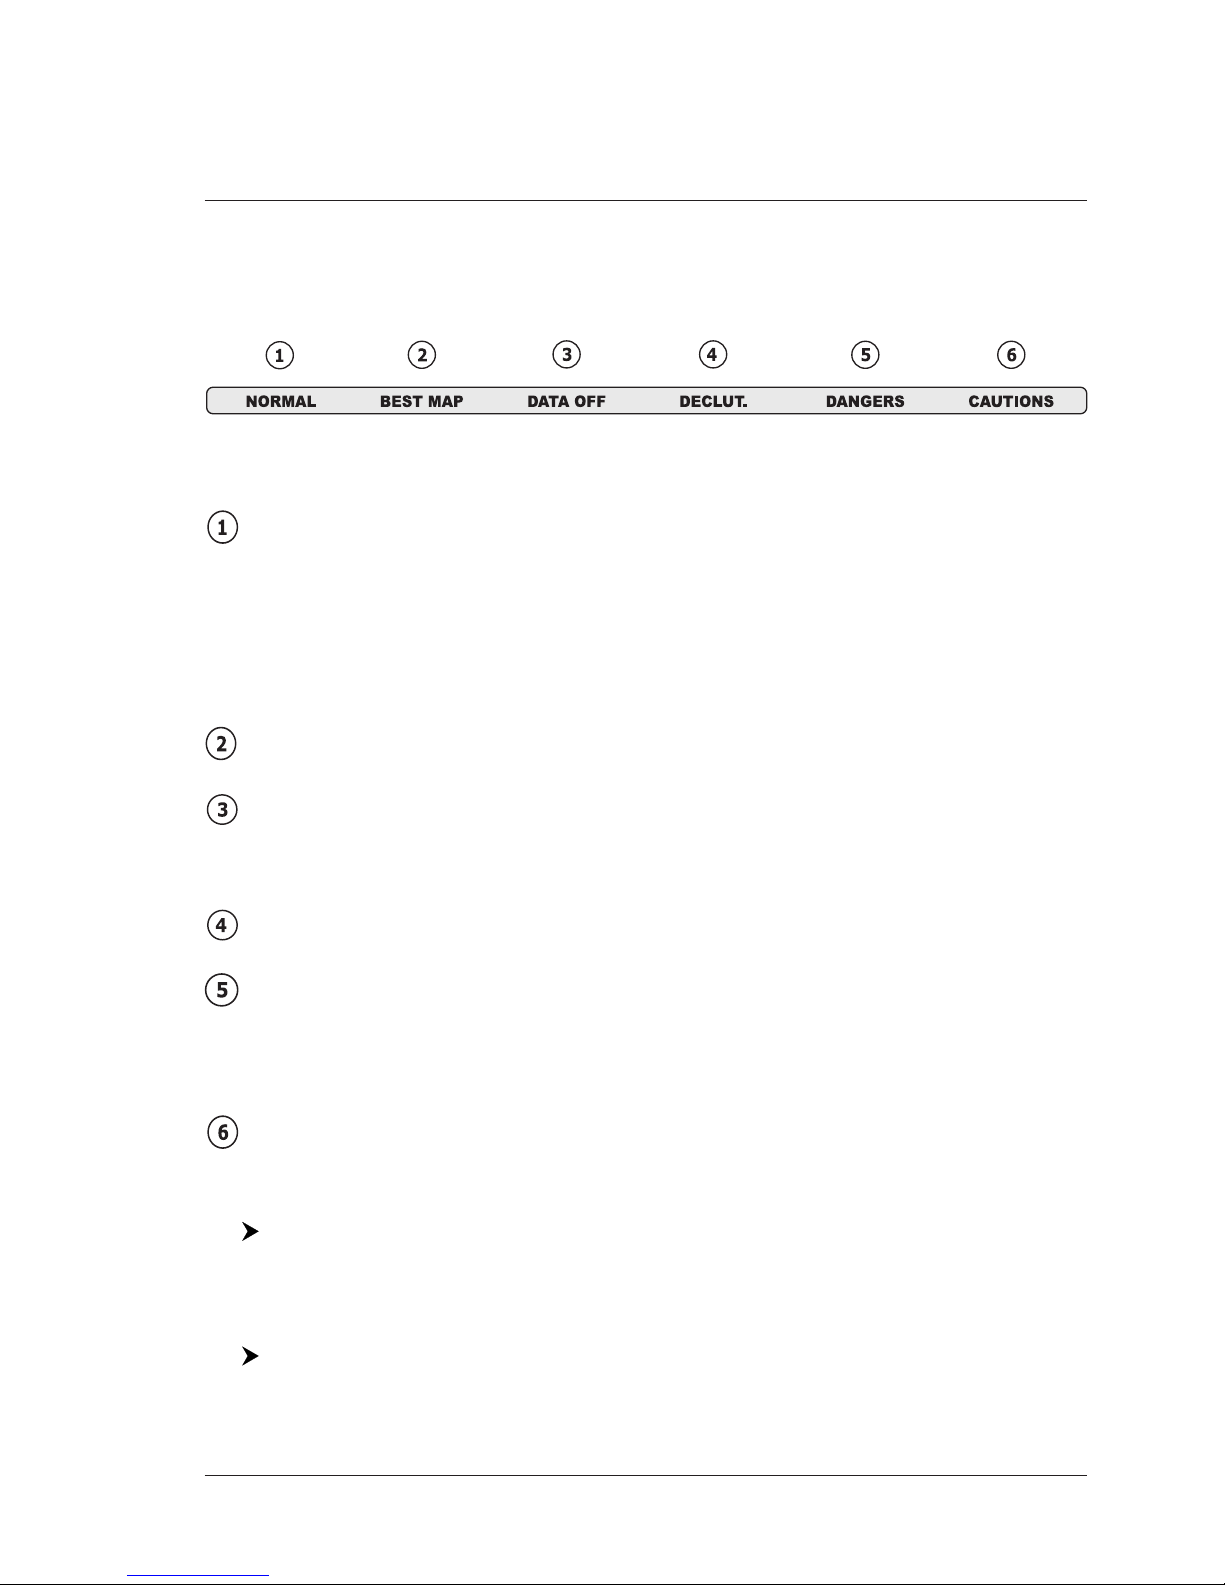
45
User Manual
condition. The Warning Icon remains displayed until the alarm condition persists. Placing the
cursor over this Icon, a quick help message is shown next to the Icon, allowing to show the Safety
Status Bar. In this case - when the Safety Status BarE is opened via Warning alarm Icon - it is
allowed to obtain information about each “active” Safety Status box (the red ones): it is possible
to select them by cursor movement left/right, and a list of active alarms is shown underneath the
selected box. By pressing [CLEAR], the Safety Status BarE is removed from the screen.
When Safety Status BarE is On, a status bar with six boxes showing the status of
certain functions is displayed. Any warning or alarm condition is identified by the
red color to indicate possible risk.
Fig. 4.1b - Safety Status Bar
E
Boxes definition is as follows:
Zoom
♦ Normal: when the chart is displayed at normal scale.
♦ U. Zoom: red when the chart is under-zoomed out more than twice
normal scale, gray otherwise.
♦ O. Zoom: red when the chart is over-zoomed in more than twice nor-
mal scale, gray otherwise.
♦ Chart Lock: red when the chart is zoomed in more than twice normal
scale, gray otherwise.
Best Map
Red when a more detailed chart is available under the cursor position.
Data Off
Red when at least one of the following objects or layers is turned off (by the
user): Depths/soundings; Wrecks/obstructions; Tracks/routes; Attention areas; Nav-Aids.
Declutter
Displays red when clearing overlapping objects.
Dangers
Red when “Guardian Technology” detects one of the following objects: Land,
Intertidal, Depth Area, Rocks, Obstructions, Shoreline Constructions, Fishing
Facility, Wrecks, Dragged area, Diffusion area, Mooring facilities, Pingos and
Production installations.
Caution
Red when “Guardian Technology” detects cautionary or restricted area.
Satellite Imagery
[MENU] + "SATELLITE IMAGERY" + [ENTER]
It is possible to overlay the Satellite image for background map. When it is set
On, the Palette is set to Normal to display the proper colors.
Palette
[MENU] + "PALETTE" + [ENTER]
It is possible to set the palette used to enhance the visibility of the screen depending on the surrounding light condition.
Page 45
46
User Manual
The possible choices are listed in the table below:
Normal : It is recommended when the chart plotter is not exposed to the direct sunlight. When this mode
is set the maps are displayed in order to use colors as similar as possible to the ones used in the
original paper charts.
NOAA : Allows setting NOAA paper chart colors presentation.
Sunlight : It is designed to enhance the visibility of the screen when the chart plotter is exposed to the
sunlight. The maps are much brighter than in the other modes and the depth areas are filled with
white color so different depth areas are not easily distinguishable.
Night : It is recommended when the environment is dark in order to reduce the glare of the display. The
chart plotter displays maps and screen in darker colors.
Currents Prediction
[MENU] + "CURRENTS PREDICTION" + [ENTER]
A window is shown on the chart. It is possible to see the variation of the Tidal
arrows on the selected area at any given time. Press [ENTER] to set the date and
time manually, and dedicated keys to decrease time and to increase time.
4.2 OTHER MAP CONFIGURATIONS
[MENU] + "OTHER MAP CONFIGURATIONS" + [ENTER]
Allows the user to customize the following selections and is divided into the following setting menus: Marine Settings, Depth Settings, Land Settings, Chart Settings and Underwater Objects Settings.
Display Mode
[MENU] + "OTHER MAP CONFIGURATIONS" + [ENTER] + "DISPLAY MODE"
+ [ENTER]
Selects from a pre-defined table what cartographic objects are displayed and
which display options are set. Pre-programmed settings are user selectable from
Full, Medium, Low, Radar, Tides, Custom.
The table below shows the selections for each mode:
Setting Full Medium Low Radar Tides Custom
(Default values)
Names On On On On On On
Name Tags On Off Off Off Off On
Nav Aids & Light Sectors On No Sector No Sector No Sector Off On
Attention Areas On On Off Off Off On
Tides & Currents On Off Off Off On On
Seabed Type On Off Off Off Off On
Ports & Services On On Off On Off On
Tracks & Routes On Off Off Off Off On
Depth Range Min 0 Mt 0 Mt 0 Mt 0 Mt 0 Mt 5 Mt
Depth Range Max 9999 Mt 9999 Mt 9999 Mt 9999 Mt 9999 Mt 20 Mt
Land Elevations On On Off Off Off Off
Land Elevation Values On Off Off Off Off On
Roads On Off Off Off Off Off
Points Of Interest On Off Off Off Off Off
Lat/Lon Grid On Off Off Off Off On
Chart Boundaries On Auto Off Off Off Auto
Value-Added Data On Off Off Off Off On
Chart Lock On On On On On On
Underwater Objects Limit 9999 Mt 10 Mt 10 Mt 10 Mt 10 Mt 3 Mt
Rocks Icon+Depth Icon Icon Icon Icon Icon
Obstructions Icon+Depth Icon Icon Icon Icon Icon
Diffusers Icon+Depth Icon Icon Icon Icon Icon
Wrecks Icon+Depth Icon Icon Icon Icon Icon
Marine Settings
To control the display on the map of the marine features.
Page 46
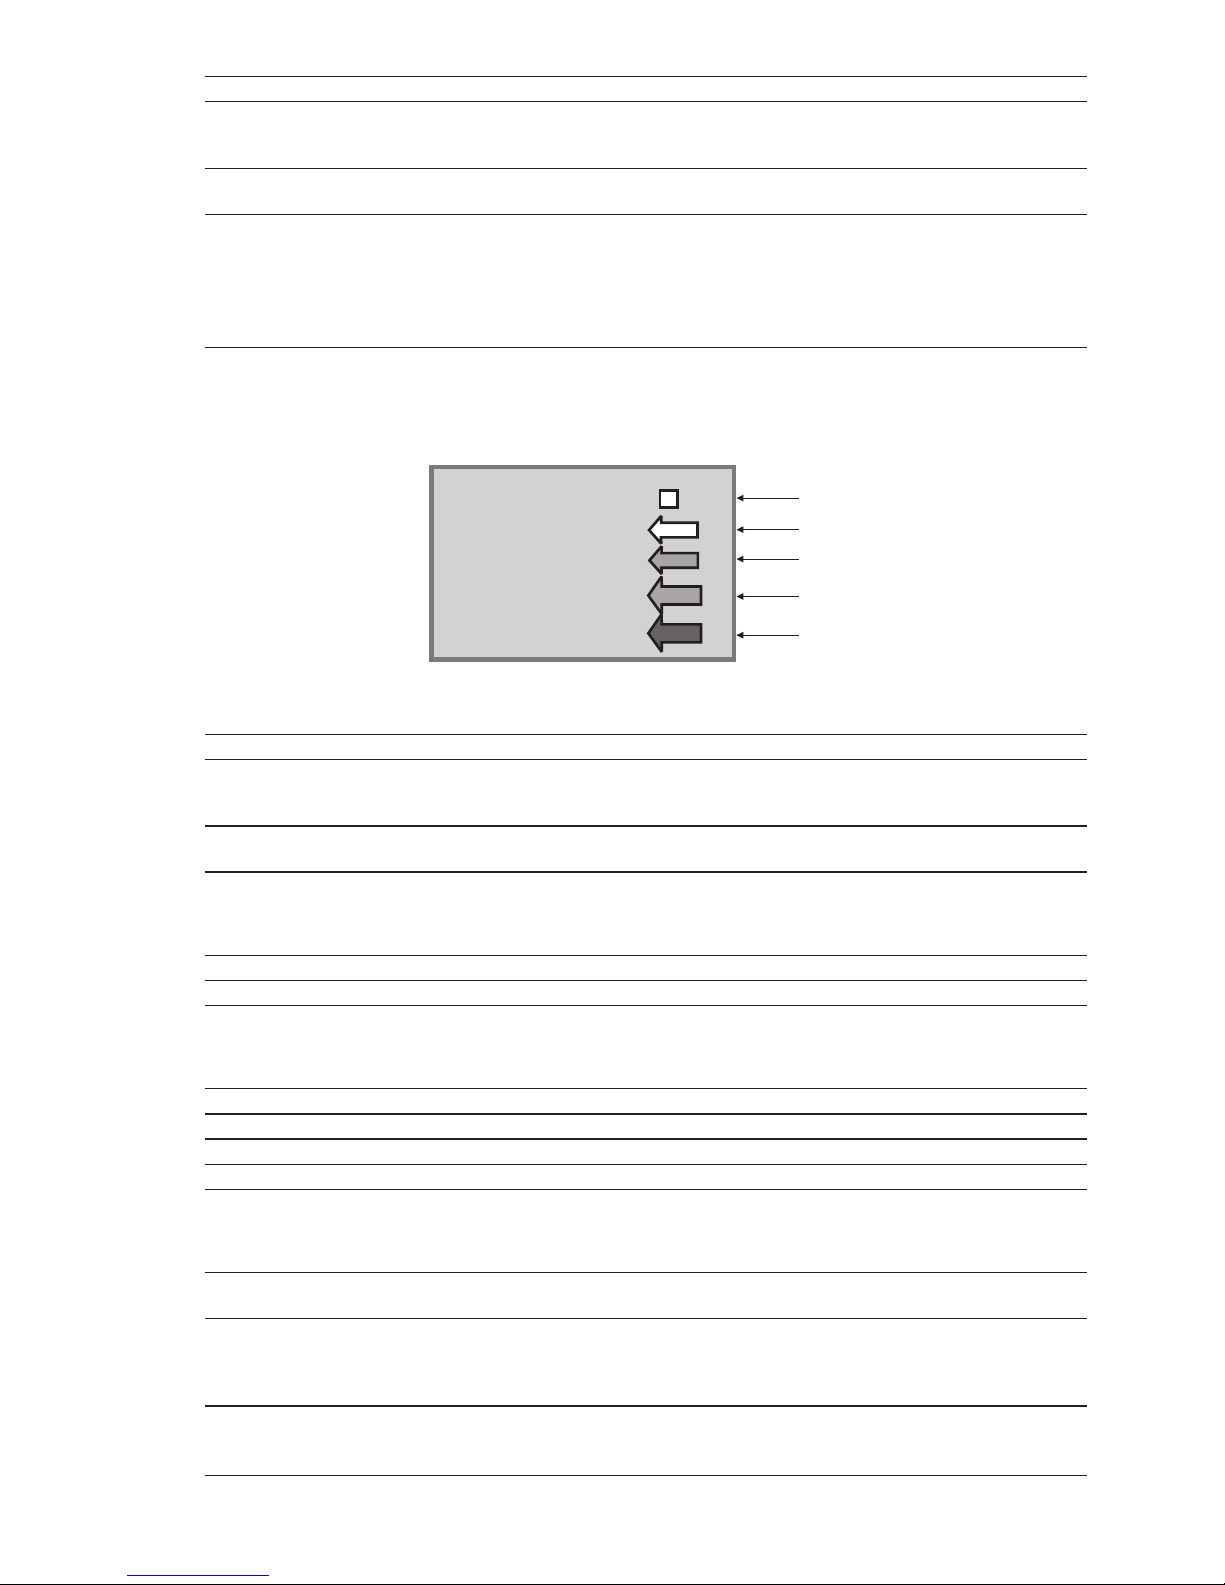
47
User Manual
Names : Sets On/Off the displaying of the Names (local area names).
Name Tags : Sets On/Off the displaying of a tag for particular chart objects that either includes the Name
of the chart object or the Depth of an Underwater chart object. Available for Buoys, Towers,
Beacons and Port Marinas.
Nav-Aids & Light Sectors: Sets On/Off/No Sector the graphical presentation of Lights, Signals, Buoys and Beacons.
If No Sector is selected Nav-Aids are shown, Light Sectors are hidden
Attention Areas : Sets On/Off the displaying of Attention Areas (areas in which special attention by the
mariner is required, because of natural or man-made hazards, or sailing regulations and
restrictions. Moreover a special symbol (!) is placed inside the area selecting On option.
This is valid also for the categories: FISHING FACILITY, MARINE FARM/CULTURE,
MILITARY PRACTICE AREA, RESTRICTED AREA, SEAPLANE LANDING AREA. When
the area is small, it is identified only by the boundary).
Tides & Currents : Sets On/Off the displaying of the Tides and Currents. When data/time is available, Tidal
stream arrows are shown on the charts, indicating the direction and strength of the Tide.
If no data/time is available from the GPS or the chart plotter is not in Simulation mode, the
icon on the map is generic one. The color of the arrow denotes the strength of the current
as follows:
0 to 0.1 kn -
0.2 to 1.0 kn -
1.1 to 2.0 kn -
2.1 to 3.0 kn -
3.1 to 9.9 kn -
Yellow
Yellow
Orange
Orange
Red
When the chart plotter receives a valid position fix, the Tide icons are shown on the charts
on the basis of the current date and time: the screen displays and changes arrows as date/
time changes.
Seabed Type : Sets On/Off the displaying of the Seabed Type.
Ports & Services : Sets On/Off the displaying of the Ports and Services (areas along shore with facilities for
mooring, downloading and uploading of ships, generally sheltered from waves and winds.
Port installations are piers, wharves, pontoons, dry docks, cranes...).
Tracks & Routes : Sets On/Off the displaying of the Tracks and Routes (recommended and established
routes for ships at sea, including traffic separation schemes, deep water routes).
Depth Settings
To control the display on the map of the depth informations.
Depth Range Min : Sets a minimum reference for the Depth Areas.
Depth Range Max : Sets a maximum reference for the Depth Areas.
Land Settings
To control the display on the map of the terrestrial features.
Land Elevations : Sets On/Off the Land Elevation display.
Land Elevation Values : Sets On/Off the displaying of the Land Elevations Values.
Roads : Sets On/Off the displaying of the Roads.
Points Of Interest : Sets On/Off the displaying of Points Of Interest.
Chart Settings
To control the display on the map of the chart features.
Lat/Lon Grid : Sets On/Off the displaying of the grid of parallels (of Latitude) and meridians (of Longitude)
drawn on the map.
Chart Boundaries : Sets On/Off the displaying of the Chart Boundaries, which represents the boundaries of the
charts available on the chart plotter. Selecting Auto instead, if we are in background charts
only the first chart levels contained in the C-CARD are displayed, if we are in a charts level
contained in the C-CARD the next four charts level are displayed.
Page 47
48
User Manual
Value Added Data : Sets On/Off the displaying of the Value Added Data. The Value Added Data (VAD) is a
collection of additional cartographic objects which are not present on the original paper
chart (from which the electronic chart derives). These objects have been obtained from
other sources (that C-MAP believes to be reliable) and then merged to the electronic charts
in order to provide more information useful for the navigation. VAD object can be any
cartographic objects and it can be distinguished from the official-chart-objects from the
Quick Info. A dedicated icon is shown on the Quick Info window to indicate that the object
queried is a VAD. The same icon is also shown on the Full Info page and in addition the
extended text Value Added Data is shown on the details of the VAD object.
Chart Lock (*) : Sets On/Off the Chart Lock option. When Chart Lock is On, the available zoom scales are
only the ones containing cartographic data. Instead when Chart Lock is Off, it is possible
to zoom down into zoom scales not covered by cartographic data after the last available
zoom scale covered by cartographic data. The DSI window, if present, will show “NO
CHART”, when an empty level is entered in the location of map expansion mode.
NOTE* When an empty level is entered, the message “No cartographic coverage” is
shown on a window in a corner of the map display. The warning message is
always displayed as long as the current zoom has no data coverage.
Underwater Objects Settings
To control the display on the Underwater Objects.
Underwater Objects Limit : Selects the max depth value to display Underwater Objects. If value is set to 0 Mt, the
Underwater Objects are not shown on the charts. Menu options are grayed out. If value is
more than 0 Mt (i.e. 10 Mt), in the Range from 0 Mt to the selected value the Underwater
Objects are displayed according to their setting below.
Rocks : Sets Off/Icon/Icon+Depth* the displaying of the Rocks.
Obstructions : Sets Off/Icon/Icon+Depth* the displaying of the Obstructions.
Diffusers : Sets Off/Icon/Icon+Depth* the displaying of Diffusers.
Wrecks : Sets Off/Icon/Icon+Depth* the displaying of Wrecks.
NOTE* Choose the options: "OFF" (the object is not visible independently of the
selected “Underwater Object Depth Value”); "ICON" (the object icon is visible
without tags, in the range selected from “Underwater Object Depth Value”
option); "ICON+DEPTH" (the object icon and tag is visible, in the range
selected from “Underwater Object Depth Value” option).
4.3 CONFIGURATIONS
To set the general settings:
[MENU] + [MENU] + "CONFIGURATIONS" + [ENTER]
Language : Selects the language for screen labels, menus and options; the map information remain
on the language as in the official paper charts.
Chart Language : Selects a sub-menu with two items: Language to set the language to display chart
information and Mode to define how objects are translated.
Speed : Selects the unit for Speed among Kts, Mph, Kph.
Distance
E
: Selects the unit for Distance among nm, Sm, Km.
Depth : Selects the unit for Depth among Ft, FM and M.
Altitude
E
: Selects the unit for Altitude of GPS Antenna on the medium sea level. The available
choices are Ft, FL and m.
Wind Speed : Selects the unit for Wind. The available choices are Kts, m/s, Kph, Bft, Mph.
Temperature : Selects the unit for Temperature. The available choices are °C and °F.
Nav-Aids Presentation
E
: Allows to set the Nav Aids presentation as US (Draw Nav-Aids using NOAA symbology)
or INTERNATIONAL (Draws Nav-Aids using international symbology). When selected it
affects Lights, Signals, Buoys & Beacons display.
User Points : Sets On (icon + label), Off or Icon (only icon) the displaying of User Point.
Course Vector
E
: Selects the value among Off/2/10/30 Min/1/2 hours/Infinite. The Course Line is a graphical
indication of the direction in which the Vessel is heading. The Course Line origin is the
vessel’s position so the time line movement is synchronized with the vessels Icon. Course
Line "course" is given by the value of COG (Course Over Ground) and its length is
proportional to the SOG (Speed Over Ground).
Page 48

49
User Manual
Screen Amplifier
E
: Allows, when it is On and Home mode is set, to place map on the screen related to the fix
position and direction, so the map shown is that before the ship.
Depth Window
E
: Turns On/Off the displaying of the Depth Window on the screen. When the Depth Window
is set On and depth value is received from an echosounder, the depth value and unit are
shown on the screen.
NOTE If the Expert Function DistanceE has not been activated, the Distance Unit will
change according to the selected Speed Unit, see the following table:
Speed Unit Distance Unit
kts nm
Mph Sm
Kph Km
Also if the Expert Function Altitude
E
has not been activated, the Altitude Unit
will change according to the selected Depth Unit, see the following table:
Depth Unit Altitude Unit
mm
Ft Ft
FM FM
4.4 ADVANCED SETTINGS
The Advanced options are arranged in sub-menus. See Par. 2.5 on Simulation
menu.
[MENU] + [MENU] + "ADVANCED SETTINGS" + [ENTER]
Setup menu
To allow you to change how the chart plotter displays information.
[MENU] + [MENU] + "ADVANCED SETTINGS" + [ENTER] + "SETUP" +
[ENTER]
Time Reference : Allows switching between UTC or local time, by entering the Local Time offset.
Time Format
E
: Selects the format for the time between 12 and 24 hours.
Date Format
E
: Selects the Date Format between MM-DD-YY (month-day-year) and DD-MM-YY (day-
month-year).
Beeper : Enables or disables the single audio beeps emitted any time the chart plotter keypad is
pressed. If the incorrect key is pressed or the function required cannot be executed, the
chart plotter emits three beeps.
Back Light Timeout
E
: Sets the time value among 1, 3, 5, 10 Min: after this time when no key is pressed, the screen
and keyboard backlight is turned Off.
Auto Info
E
: Allows displaying information on cartographic object when the cursor is placed on it. The
Automatic Info On Points shows information when the cursor is placed on points (as Port
Services, Tides, lights, wrecks, rocks, buoys, beacons, obstructions, land markers, etc.).
The Automatic Info On All shows information when the cursor is placed on points, on lines
(as Depth contours, Traffic Separation, Territorial Sea, Cartographic Lines etc.) on areas
(Depth, Built-up, Sea, Attention, Restricted etc.) and on names (on the beginning of the text
-hot spot- or on any of the characters of the name -name message box-). The details on
Land, Source of Data, Cartographic Area and Spot Soundings are not shown.
Keel Offset
E
: Adjusts the Depth Sensor Offset to display Depth under Keel. Selectable in the Range of
0.0 to 9.9m.
LOG Calibration
E
: Adjusts the Log Sensor to display Speed through the Water. Selectable in the Range of
0.1 to 9.9 %.
Navigate Menu
To handle the functions related to navigation.
[MENU] + [MENU] + "ADVANCED SETTINGS" + [ENTER] + "NAVIGATE" +
[ENTER]
Coordinates System : The possible choices are ddd mm ss (degrees, minutes and seconds), ddd mm.mm
(degrees, minutes and hundred of minutes), ddd mm.mmm (degrees, minutes and
thousands of minutes).
Fix Datum
E
: Sets the datum reference used by the GPS receiver connected to (or integrated in) the chart
plotter so that the chart plotter converts the position received from the GPS to the Map
Page 49
50
User Manual
Datum currently selected in the menu in order to match the position from the GPS with the
position on the charts. You must know what datum reference is used by the GPS and set
it in the Fix Datum option.
Map Datum
E
: Allows selecting any Geodetic Datum reference from the over 100 available on the chart
plotter. Map Datum selection switches to the selected reference datum applying the datum
offsets stored with the charts.
Map Orientation Res.E: Sets the resolution angle for the Map OrientationE.
Roll. Road Scale
E
: 3D (Three-dimensional) representation of the ship's movement related to a Target, with
display Cross Track Error. Set your preferred Rolling Road ScaleE among 0.2, 0.5, 1.0, 2.0,
4.0, 10.0.
Reset Total GPS Distance : Resets the total distance travelled by the ship from the first activation of the chart plotter
or starting from the values reset.
Reset Trip GPS Distance : Resets the partial distance travelled by the ship from the first activation of the chart plotter
or starting from the values reset.
Fix Correction
E
: Turns On/Off the Correction from the positioning system. If the new Correction is
calculated, but the Correction is not enabled, the ship's position is not changed.
Compute Correction
E
: Corrects fixes from the positioning instrument. By placing the cursor on the ship's real
position and selecting this option, the error is calculated and internally memorized for
appropriate correction, but not applied.
Correction Offset
E
: Manual correction of fix position.
CompassE menu
To set the reference heading information such as bearing angles (True or Magnetic), the Magnetic Variation source and to enter Compass Calibration values.
[MENU] + [MENU] + "ADVANCED SETTINGS" + [ENTER] + "COMPASS" + [ENTER]
Bearings
E
: Selects either degrees magnetic or degrees true. If magnetic readings are selected the
variation is computed automatically for every zone as soon as the chart is displayed.
Variation
E
: It is possible to calculate the Magnetic Variation in an Automatic or manual mode, by
inserting the step for calculation of Magnetic Variation.
Calibration
E
: The variation table is used to match magnetic value readout on the chart plotter
comparable with the value given by the compass of the boat. In other words, since the
compass of the boat must be compensated (due to the iron masses, ...), we use the same
values given by the chart plotter. This means that, for example, if the BRG to the next
Waypoint readout in the chart plotter display is "X" Mag degree, if you steer the boat
reading "X" Mag degree from the compass, you are driving well toward the next Waypoint.
MAP 11csE Plus GPS:
External EngineE menu
You can make all relevant engine settings in this menu. The functions are described in the following table.
[MENU] + [MENU] + "EXTERNAL ENGINE" + [ENTER]
Engine Units
E
: As the unit of measurement for the engine data you can choose between Metric (°C and
Bar) and Imperial (°F and psi).
Engine Display
E
: You can choose whether you wish the engine data to be displayed in Digital form or as
a Bar-graph.
Twin Engine
E
: You can choose whether you wish the engine data to be displayed for one or for two
machines. If you select “Twin – On”, data will be displayed from two machines.
Digital Engine Page
E
: Engine data can be presented with the chart on one screen. When you select “Digital
Engine Page – On”, the engine data are presented on the chart. Three values are shown
per machine. These are: speed, cooling water temperature and engine oil pressure.
Engine Page Layout
E
: Here is where you select which engine data are to be displayed on the Digital or Bar-graph
pages. You can select a maximum of 9 values in Digital mode and 10 values in Bar-graph
mode per machine. In the Twin Engine Mode different data can be selected for each
machine in the digital mode. In the bar graph mode the data shown for both machines are
the same. The following engine data are available for selection: Engine Speed; Percent
Load; Total Engine Hours; Engine Coolant Temperature; Fuel Temperature; Engine Oil
Temperature; Fuel Delivery Pressure; Fuel Rate; Boost Pressure; Intake Manifold Temperature; Exhaust Gas Temperature; Transmission Oil Pressure; Transmission Oil Tem-
Page 50

51
User Manual
perature; Fuel Level; Turbocharger 1 Turbine Inlet Temperature; Turbocharger 2 Turbine
Inlet Temperature; Electrical Potential (Voltage); Battery Potential (Voltage), Switched;
Battery 2 Potential (Voltage).
Engine Alarms
E
: Alarms can be defined for the most important engine data. A warning is given if the set
alarm value for speed, any of the measured temperatures or fuel reserve is exceeded. A
warning is also triggered if a pressure measurement falls short of the set value. On-board
voltage overshooting and also undershooting will trigger an alarm. The alarm is visual in
the form of a pop up window and audible as an internal buzzer.
Save Engine Settings : The following settings can be saved on a user chart: Engine Units; Engine Display; Twin
Engine; Digital Engine Page; Engine Page Layout; Engine Alarms; Easy Link Illumination.
Load Engine Settings : All settings relevant to the engine can be loaded from one user chart.
4.5 AIS
AIS is an Automatic Identification System. It has been introduced to improve the
safety of navigation by assisting in the efficient operation of ship-to ship, ship
reporting and VTS applications. The system should enable operators to obtain
information from the ship automatically, requiring a minimum of involvement of
ship’s personnel, and should have a high level of availability. AIS transponders
installed on IMO vessels use VHF frequencies to:
♦ Transmit details of their own vessel
♦ Receive details from other vessels or navigation aids within VHF range.
Information being transmitted from vessels over 300 tons that, due to recent
worldwide legislation, are required to fit Class “A” AIS transponders.
Connecting to the chart plotter an AIS receiver (please contact your local dealer),
vessels with AIS transponder within VHF range are displayed on screen giving the
skipper or navigator a visual interpretation of the data of nearby vessels. This
improves safety, and specifically for collision avoidance reasons.
AIS SYSTEM DEFINITIONS
♦ Target
It is a vessel equipped with AIS. Information about the targets is being
received by AIS Receiver and displayed on the screen.
♦ CPA
Closest Point of Approach is the closest distance that will be achieved between your vessel and the tracked target, based on your vessel’s speed
and direction and the target’s speed and direction.
♦ CPA Limit
This is the distance from your vessel that a target may reach before a
target is deemed a threat.
♦ CPA Alarm
Occurs if CPA is less or equal to CPA Limit. This test is done for active
targets only.
♦ TCPA
Time to closest Point of Approach is the time remaining until the CPA will
occur.
♦ TCPA Limit
This is the time remaining before the CPA is reached.
♦ TCPA Alarm
Occurs if TCPA is less or equal to TCPA Limit. This test is done for active
targets only and if CPA value is less or equal to CPA Limit.
♦ Radio Call Sign
International call sign assigned to vessel, often used on voice radio.
Page 51
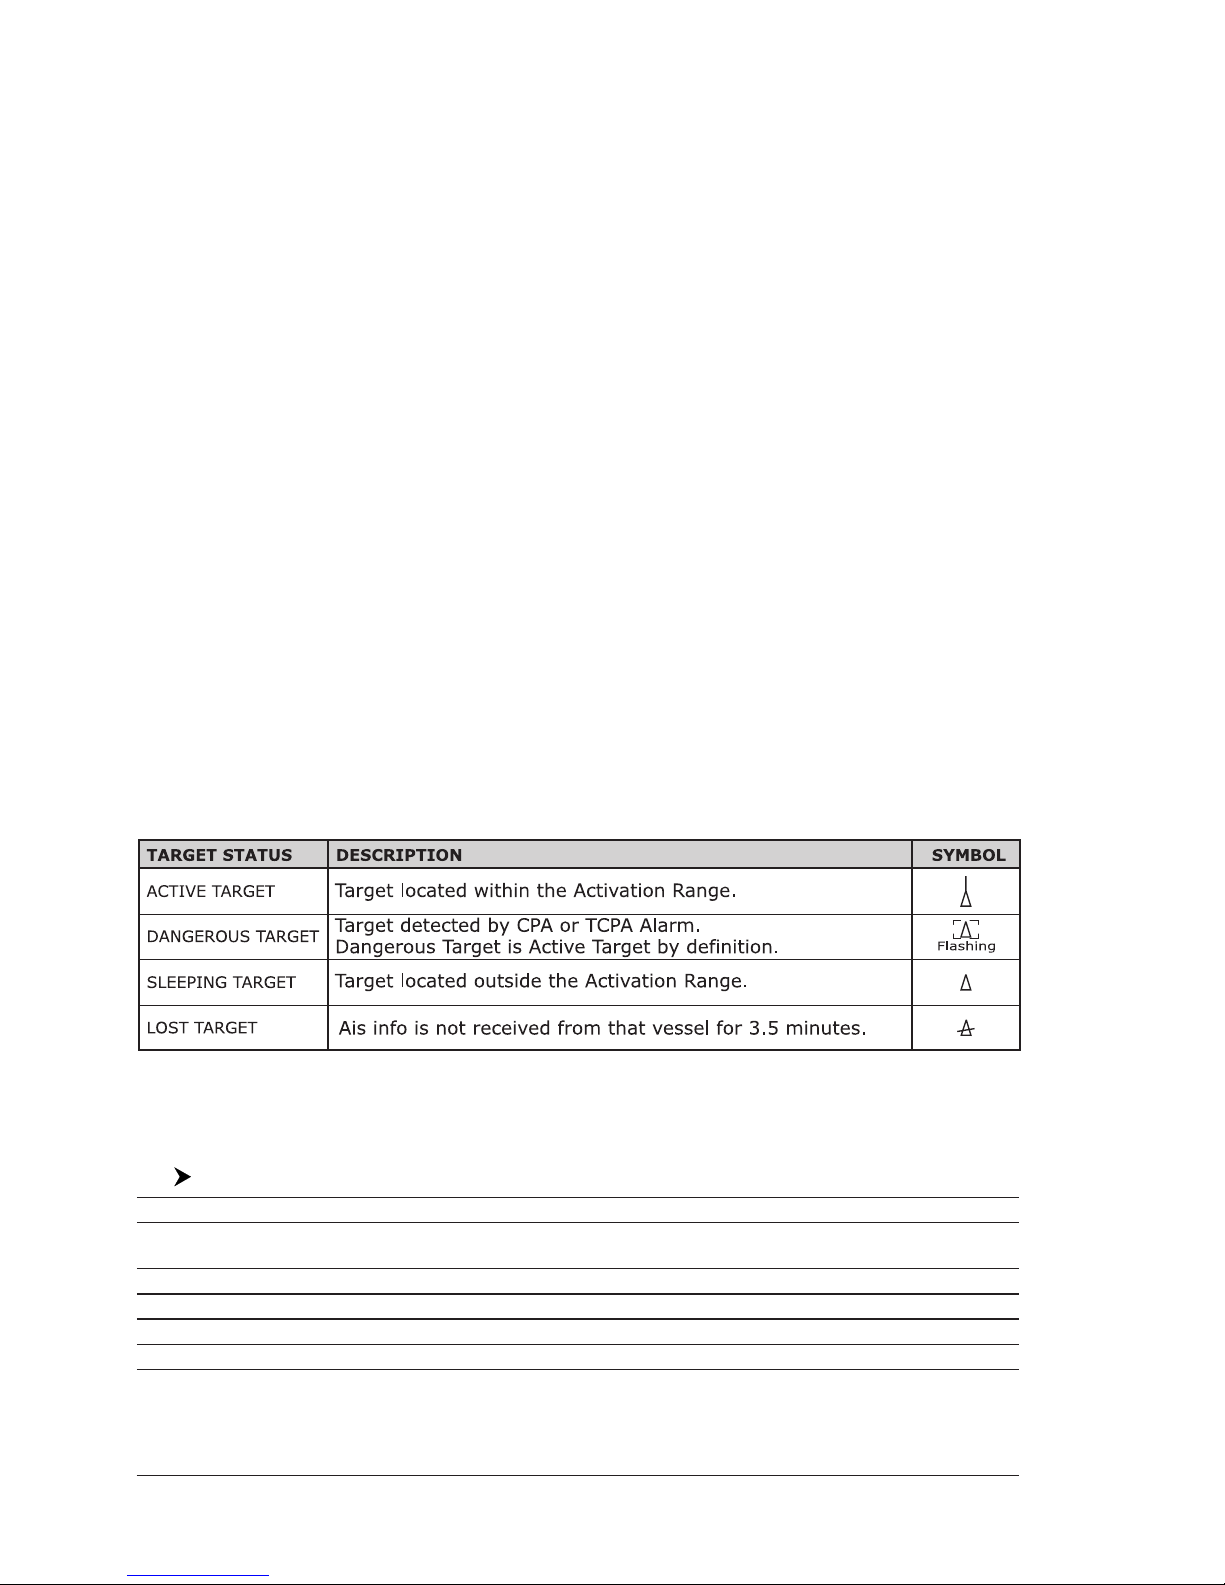
52
User Manual
♦ Name
Name of ship, 20 characters.
♦ MMSI
Maritime Mobile Service Identity.
♦ MMSI number
A unique 9 digit number that is assigned to a DSC radio station. It primarily registers the boat information in the U.S. Coast Guard’s national distress database for use in emergency situations.
♦ Active Target
Target located within the Activation Range. Active target is represented by
oriented triangle with COG and Heading vectors. Rate of turn may also be
displayed.
♦ Dangerous Target
Target detected by CPA or TCPA Alarm. Dangerous target is Active Target
by definition. For better visibility Dangerous Target symbol is flashing.
♦ Sleeping Target
Target located outside the Activation Range. Sleeping target is represented
by a small oriented triangle.
♦ Lost Target
When the AIS info is not received from that vessel for 3.5 minutes. The
presentation will be a flashing black triangle with a cross through.
♦ Activation Range
Range around your boat where targets become active. AIS target become
active within this range. Activation Range should be greater than CPA Limit
by definition.
NOTE A Target is removed from the screen if data is not received for 10 minutes.
The maximum number of tracked Targets is 100.
Depending on the scale the presentation of the Targets change to remove
clutter on the screen.
This information is updated every 3 seconds to 6 minutes depending on speed
and rate of turn, enabling the track of the vessels in range to be plotted.
Fig. 4.5 - AIS Symbols
AIS Menu
To configure the chart plotter to receive AIS data, follow the procedure:
[MENU] + [MENU] + "AIS SETUP" + [ENTER]
Display : Turns ON or OFF the display of AIS targets overlay on the cartography.
Activation Range : Defines the range from the fix within which the AIS Target becomes active. The values
allowed are from 0.1 to 20 Nm.
CPA Alarm : Turns ON or OFF the alarm.
CPA Limit : The values allowed are from 0.1 to 10 Nm.
TCPA Alarm : Turns ON or OFF the alarm.
TCPA Limit : The values allowed are from 1 to 30 min.
Page 52

53
User Manual
To set the chart plotter for receiving AIS
Make sure that the AIS receiver is properly connected to the chart plotter.
The chart plotter reads the AIS NMEA message VMD, type 1, 2, 3 and 5.
Select the used serial port and transmission speed by following the procedure:
[MENU] + [MENU] + "INPUT/OUTPUT" + [ENTER] + "Port n Input" + [ENTER]
+ "m" + [ENTER]
Where:
n = 1/2/3 for MAP 11csE Plus GPS
n = 1/4/5 for MAP 7cwi Plus GPS
n = 1/2/4/5 for MAP 7wi Plus GPS
n = 1/2/3/4/5 for MAP 7w Plus GPS/MAP CX Plus
m = NMEA-0183 4800-N81-N; AIS 38400
according to the transmission speed of your AIS receiver.
Quick Info on AIS Target
By placing the cursor over a AIS target icon, the following information is displayed:
♦ Vessel Name
♦ MMSI number
♦ Radio Call Sign
♦ SOG
♦ COG
♦ CPA and TCPA values
NOTE The selected AIS target icon is surrounded by a square frame when user
places the cursor over the icon.
4.6 SYSTEM INFORMATION
To see details about the software and cartography data installed.
[MENU] + [MENU] + "About..." + [ENTER]
Opens the System Information page.
World Background Charts
The internal background charts can be updated to include the MAX A and B level
charts which provide improved marine data, rivers, lakes, terrestrial data (major
streets , highways , railways, etc...), Nav-Aids, depth areas, territorial water areas,
etc... by reading them from a special data C-CARDs (contact your local dealer).
All units must have the WorldWide Background upload function that is activated
from the system.
Worldwide Background Update
The System Update menu is entered from the About page. To select this menu
follow the procedure:
Plug the special data C-CARD + [MENU] + [MENU] + "About..." + [ENTER] +
[MENU] + "Update Worldwide Cartography" + [ENTER]
Expert Functions
It is possible to expand the functions set available on the chart plotter. There are
functions which are rarely used, the Expert Functions. These are need to be activated before their use. If you want to enable some Expert Functions, follow this
procedure.
[MENU] + [MENU] + "About..." + [ENTER] + [MODE] for 1 second
(see also Chapter "About this User Manual" for more information on this menu).
The items shown in gray color are the basic functions, they are always active and
visible in the chart plotter menus. The others are the Expert Functions; you could
Page 53
54
User Manual
turn from "Off" to "On" for making visible these functions in the chart plotter
menus, and then for using in the chart plotter handling.
4.7 INPUT/OUTPUT
WARNING
After a software upgrade the RAM is cleared and then the chart plotter starts
with the default settings. Then you have to go into the Input/Output menu and
set again the proper input format.
MAP 7wi Plus GPS/MAP 7cwi Plus GPS:
Internal GPS Setup Menu
[MENU] + [MENU] + "INPUT/OUTPUT" + [ENTER] + "INTERNAL GPS SETUP"
+ [ENTER]
Internal GPS : Enables (On) or disables (Off) the Internal GPS.
Restart GPS
E
: Restarts all GPS processes. Once executed, the message "Done" is shown.
Diff Correction Source : Sets what kind of Differential Correction will be used by the GPS between WAAS/EGNOS
and RTCM-104 (beacon correction).
Navigation Speed
E
: Sets the Navigation Speed among 0.1 Kts (low speed, for marine/pedestrian application),
0.9 Kts (medium speed, for marine application) and 3.0 Kts (high speed, for car
application).
MAP 7cwi Plus GPS:
Fish Finder Transmission
The Fish Finder embedded is connected directly to the Port 2. To switch the internal Fish Finder transmission On/Off follow the procedure:
[MENU] + [MENU] + "INPUT/OUTPUT" + [ENTER] + "FISH FINDER ON/
STANDBY" + [ENTER]
Autopilot Connection
E
Connect the Autopilot to the serial Port n:
[MENU] + [MENU] + "INPUT/OUTPUT" + [ENTER] + "PORT n OUTPUT" +
[ENTER]. Then choose your preferred setting among the NMEA available
settings NMEA 0183 4800-N81-N, NMEA 0180, NMEA 0180/CDX) and press
[ENTER] to confirm.
Where:
n = 1/2/3 for MAP 11csE Plus GPS
n = 1/4/5 for MAP 7cwi Plus GPS
n = 1/2/4/5 for MAP 7wi Plus GPS
n = 1/2/3/4/5 for MAP 7w Plus GPS/MAP CX Plus
External NMEA Connection
E
Connect the External NMEA to the serial Port n:
[MENU] + [MENU] + "INPUT/OUTPUT" + [ENTER] + "PORT n INPUT"
+ [ENTER]. Then choose your preferred setting and press [ENTER] to confirm.
Where:
n = 1/2/3 for MAP 11csE Plus GPS
n = 1/4/5 for MAP 7cwi Plus GPS
n = 1/2/4/5 for MAP 7wi Plus GPS
n = 1/2/3/4/5 for MAP 7w Plus GPS/MAP CX Plus
C-COM GSM PLUS Connection
E
To connect the modem C-COM to the chart plotter follow the procedure:
Page 54
55
User Manual
[MENU] + [MENU] + "INPUT/OUTPUT" + [ENTER] + "PORT 1 INPUT"
+ [ENTER] + "C-COM" + [ENTER]
The modem C-COM can be connected also to the Port 2 (except for MAP 7cwi
Plus GPS), Port 3 (except for MAP 7wi Plus GPS/MAP 7cwi Plus GPS) and
Port 4/5 (except for MAP 11csE Plus GPS/MAP CX Plus), in this case select the
format on the used port.
NOTE The connection is valid for the C-COM IR and C-COM RS232 too.
NMEA Output
The chart plotter allows customizing the NMEA-0183 sentence transmitted on
each port. Each port can transmit a different set of sentences among: GLL, VTG,
BOD, XTE, BWC, RMA, RMB, RMC, APB, WCV, GGA, HSC, HDG:
[MENU] + [MENU] + "INPUT/OUTPUT" + [ENTER] + "PORT n OUTPUT SENTENCES" + [ENTER].
Where:
n = 1/2/3 for MAP 11csE Plus GPS
n = 1/4/5 for MAP 7cwi Plus GPS
n = 1/2/4/5 for MAP 7wi Plus GPS
n = 1/2/3/4/5 for MAP 7w Plus GPS/MAP CX Plus
Send/Receive Routes & Marks
E
Sets the desired port used for transferring User Points and Routes functions:
[MENU] + [MENU] + "INPUT/OUTPUT" + [ENTER] + "SEND/REC ROUTES &
MARKS" + [ENTER] + "Port n" + [ENTER]
Where:
n = 1/2/3 for MAP 11csE Plus GPS
n = 1/4/5 for MAP 7cwi Plus GPS
n = 1/2/4/5 for MAP 7wi Plus GPS
n = 1/2/3/4/5 for MAP 7w Plus GPS/MAP CX Plus
C-Link
E
Sets the Primary or Secondary Station (see dedicated Chapter):
[MENU] + [MENU] + "INPUT/OUTPUT" + [ENTER] + "C-LINK" +
[ENTER] + "Secondary Station/Primary station" + [ENTER]
External NMEA
E
Sets the displaying or not of the following items (max four items) in the Logic
Data Display Page: Speed, Heading (HDG), Depth, Drift, Set, Wind Speed True,
Wind Direction True, Wind Speed App, Wind Direction App, Speed Over Ground
(SOG), Course Over Ground (COG), Distance, Bearing (BRG), Time To Go (TTG),
Cross Track Error (XTE), Velocity Made Good. When any item is receiving or calculated a small black square appears before On/Off indication.
[MENU] + [MENU] + "INPUT/OUTPUT" + [ENTER] + "EXTERNAL NMEA" +
[ENTER]
External Signal
Sets the External Output:
[MENU] + [MENU] + "INPUT/OUTPUT" + [ENTER] + "EXTERNAL SIGNAL"
+ [ENTER]
Then choose your preferred setting among External Alarm (when activated, this
pin goes to GND level. It is used to command an external buzzer), External Power
(it is command switch for the Radar. It must be used in conjunction with the Radar
Junction box device) and Off.
Page 55
56
User Manual
AUX IN I/O Cable Wiring page
Shows a window containing the AUX IN I/O cable wiring.
[MENU] + [MENU] + "INPUT/OUTPUT" + [ENTER] + "AUX IN I/O CABLE
WIRING" + [ENTER]
MAP 7w Plus GPS/MAP 7wi Plus GPS/MAP 7cwi Plus GPS:
Quick Disconnect Cable Wiring page
Shows a window containing the cable wiring of the quick disconnect bracket.
[MENU] + [MENU] + "INPUT/OUTPUT" + [ENTER] + "QUICK DISCONNECT
CABLE WIRING" + [ENTER]
MAP 11csE Plus GPS/MAP cX Plus GPS:
Power I/O Cable Wiring page
Shows a window containing the Power I/O cable wiring.
[MENU] + [MENU] + "INPUT/OUTPUT" + [ENTER] + "POWER I/O CABLE
WIRING" + [ENTER]
MAP cX Plus GPS:
GPS Cable Wiring page
Shows a window containing the GPS cable wiring.
[MENU] + [MENU] + "INPUT/OUTPUT" + [ENTER] + "GPS CABLE WIRING"
+ [ENTER]
MAP 11csE Plus GPS:
Engine Cable Wiring page
E
Shows a window containing the engine interface cable wiring.
[MENU] + [MENU] + "INPUT/OUTPUT" + [ENTER] + "ENGINE CABLE WIRING" + [ENTER]
MAP 7w Plus GPS/MAP 7wi Plus GPS/MAP 7cwi Plus GPS:
Video Input
E
By accessing this menu it is possible to see images on the chart plotter display
captured from an external video signal source, if connected to the chart plotter.
Allows the "picture-in-picture" functionality, so a Video Input image can be shown
on a image at full screen.
[MENU] + [MENU] + "INPUT/OUTPUT" + [ENTER] + "VIDEO INPUT" +
[ENTER]
Select Video InputE: Available options are the following: Full Video: Shows the image from the video camera at
full screen. PiP (Picture In Picture) Video: Shows the cartographic image at full screen, with
the image from the video camera on a window which can be moved up/down and/or right/
left using the cursor key. None.
Activate Video Input
E
: Activates Video Input from menu. At the activation of the Video Mode the following messages
are shown on a dedicated window: "Connnected Video Input Signal is XXXX. The Video
Mode will be activated". XXXX can be PAL or NTSC: the software automatically detects the
type of Video Input source connected. Once the Video Mode is active use the [LIGHT] and
[CONTRAST] keys to adjust video settings. Pressing any other key exits from Video Mode.
Restore Defaults
E
: Restores default values of Contrast, Brightness, Backlight, color saturation and Hue phase
MAP 11csE PLUS GPS:
Video Input
E
By accessing this menu it is possible to see images on the chart plotter display
captured from an external video signal source, if connected to the chart plotter.
Allows the "picture-in-picture" functionality, so a Video Input image can be shown
on a window and placed over the other Video Input or cartography image at full
screen.
Page 56
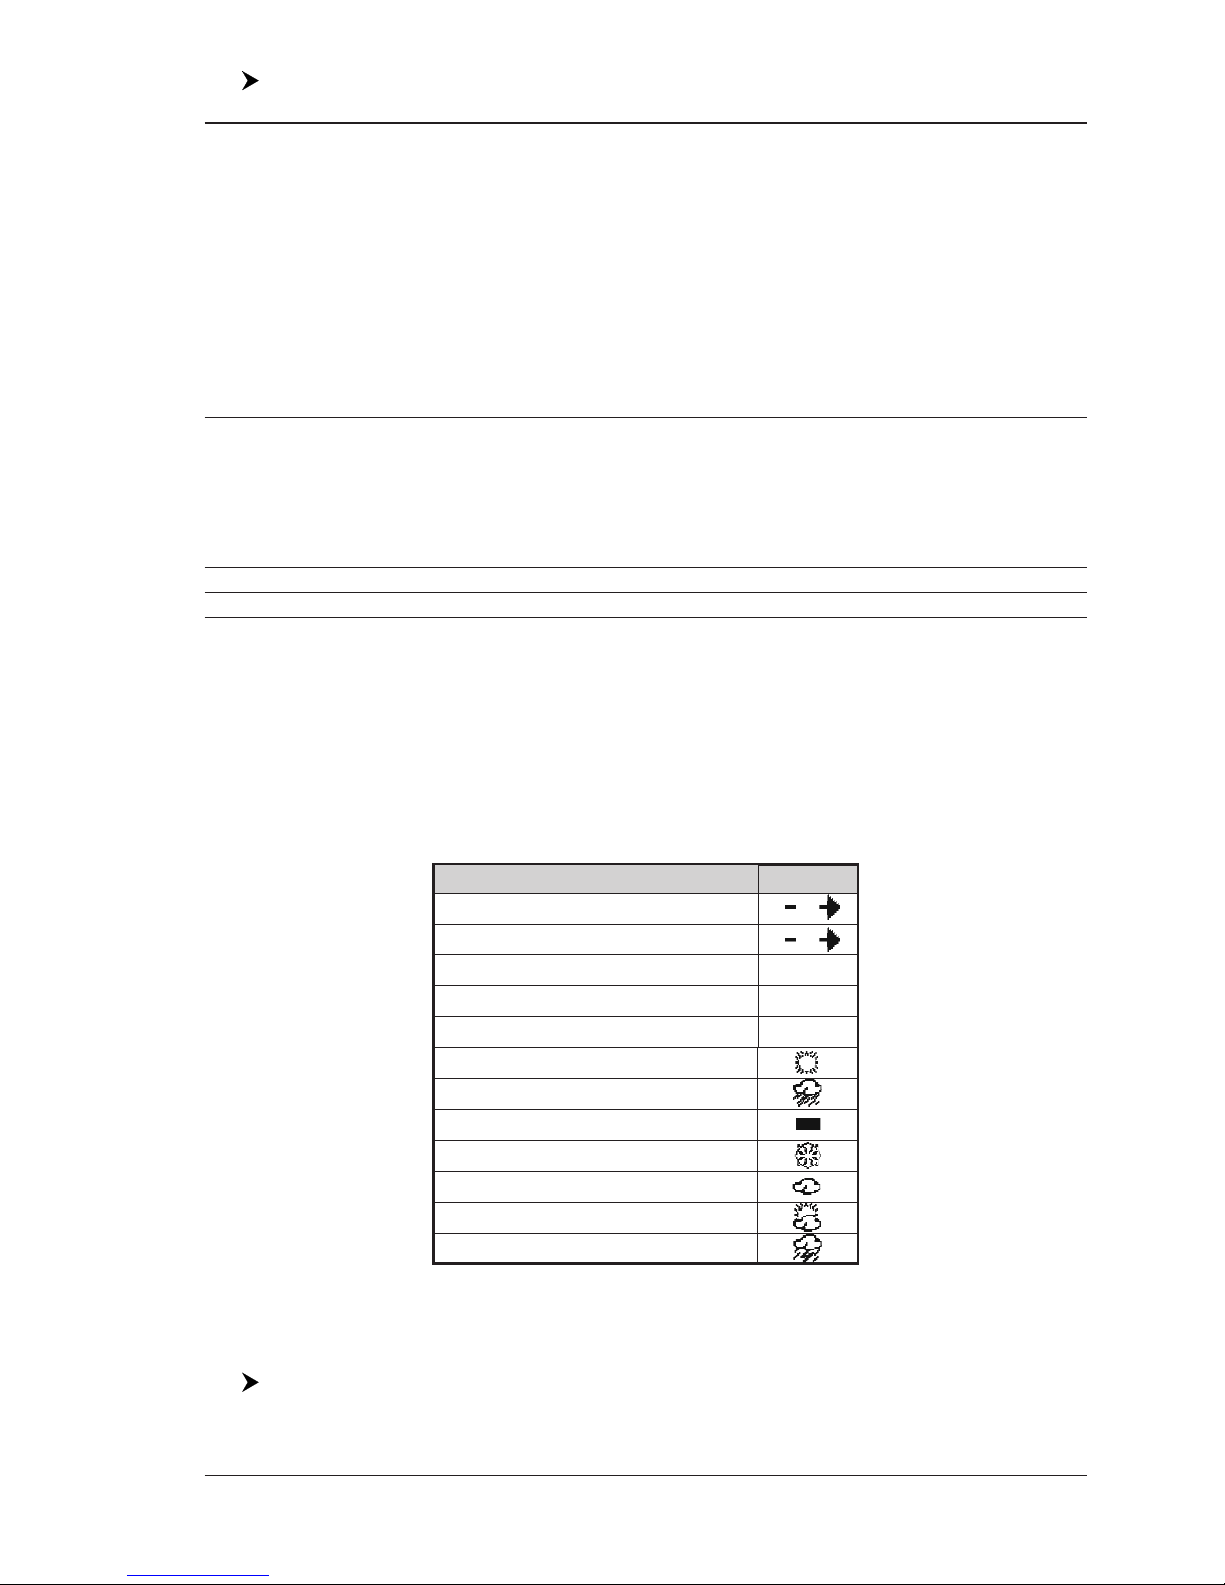
57
User Manual
[MENU] + [MENU] + "INPUT/OUTPUT" + [ENTER] + "VIDEO INPUT" +
[ENTER]
Select Video InputE: Available options are the following: Full Video 1: Shows the image from the video camera
1 at full screen. Full Video 1 + Video 2 Small: Shows the image from the video camera 1
at full screen, with the image from the video camera 2 on a window which can be moved up/
down and/or right/left using the cursor key. Full Video 2: Shows the image from the video
camera 2 at full screen. Full Video 2 + Video 1 Small: Shows the image from the video
camera 2 at full screen, with the image from the video camera 1 on a window which can be
moved up/down and/or right/left using the cursor key. PiP (Picture In Picture) Video 1:
Shows the cartographic image at full screen, with the image from the video camera 1 on a
window which can be moved up/down and/or right/left using the cursor key. PiP (Picture In
Picture) Video 2: Shows the cartographic image at full screen, with the image from the video
camera 2 on a window which can be moved up/down and/or right/left using the cursor key.
Auto Switch Video 1 / Video 2: Shows the image from the video camera 1 and from the video
camera 2 at full screen alternately, after time selected in the "Switching Timeout" item (see
below). None.
Activate Video Input
E
: Activates Video Input from menu. At the activation of the Video Mode the following messages
are shown on a dedicated window: "Connnected Video Input Signal is XXXX. The Video
Mode will be activated". XXXX can be PAL or NTSC: the software automatically detects the
type of Video Input source connected. Once the Video Mode is active use the following keys
to adjust video settings: press [POWER] and move the cursor to adjust the contrast and
backlight, press [ZOOM IN]/[ZOMM OUT] to adjust hue phase. Pressing any other key exits
from Video Mode.
Switching TimeoutE: Select the timeout for the Auto Switch option among 5, 10, 30 seconds, 1, 5, 10 minutes.
Restore Defaults
E
: Restores default values of Contrast, Brightness, Backlight, color saturation and Hue phase
4.8 C-WEATHER SERVICE
E
C-Weather ServiceE is an innovative meteorological forecasting system with the
ability to visualize the weather forecast, overlaying it on cartography. The weather
data is held on Jeppesen Marine’s weather server, which can be accessed via a
C-COM modem connected to the chart plotter or by using the PC Planner (or the
DPS - Dealer Programming System) saving the weather data on a User C-CARD.
The weather format data available are:
WIND (Speed & Dir) 0
WAVE (Height & Dir) 1
TEMPERATURE (C°) 18°
HUMIDITY (%) 30
VISIBILITY (m) 20
WEATHER TYPE: Sun
WEATHER TYPE: Rain
WEATHER TYPE: Fog
WEATHER TYPE: Snow
WEATHER TYPE: Clouds
WEATHER TYPE: Partly Cloudy
WEATHER TYPE: Thunderstorm
Data Type Display
Fig. 4.8 - Weather data package
Weather ServiceE Menu
To select the menu:
[MENU] + [MENU] + "WEATHER SERVICE" + [ENTER]
It opens a sub-menu with the following options.
Page 57
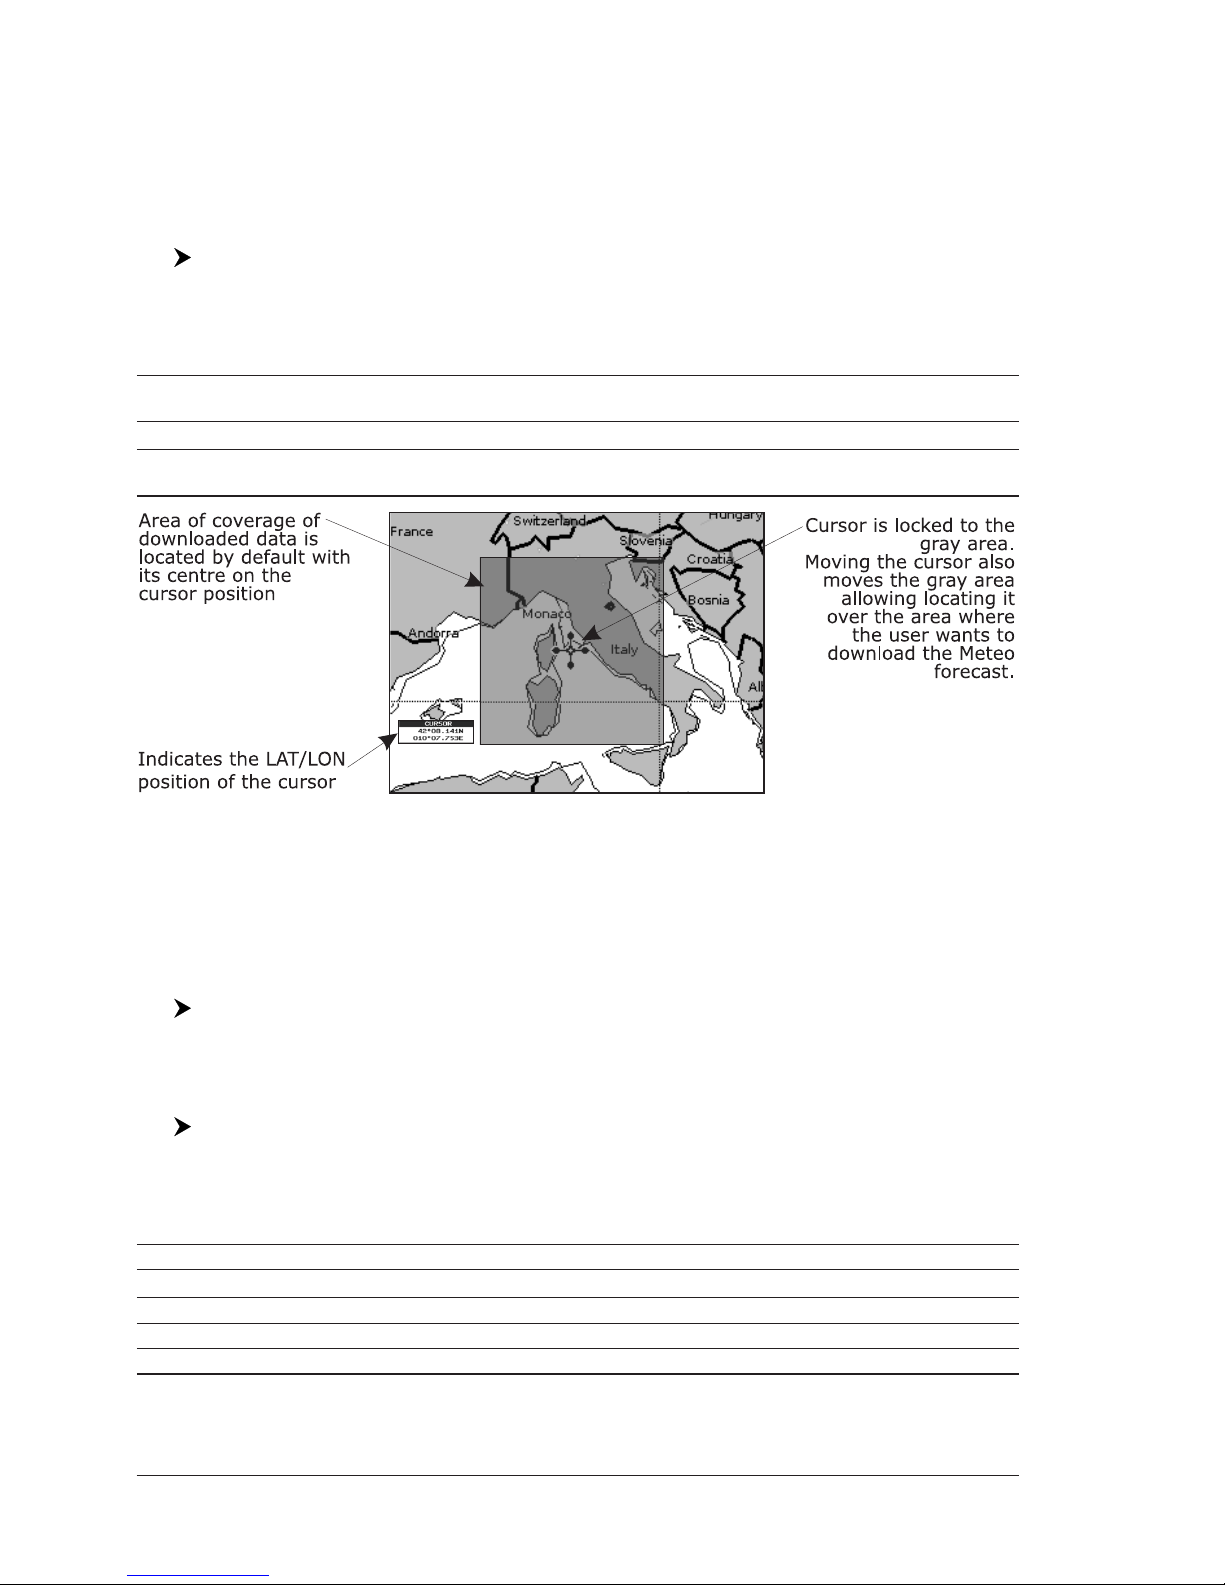
58
User Manual
♦ Download
E
♦ Copy From CARD
E
♦ Forecast
E
♦ Real Time View
E
♦ Type of Data
E
Download
E
[MENU] + [MENU] + "WEATHER SERVICE" + [ENTER] + "DOWNLOAD" +
[ENTER]
Allows to connect the software to the Jeppesen Marine weather server and to
download Jeppesen Marine weather data directly via C-COM. It activates the following sub-menu:
Select Country to Call : Allows the selection of the country to call. The whole telephone number set is automatically
updated after every download.
SIM Pin : Allows inserting of the PIN of the SIM.
Download Area : Allows the weather download: a squared grey area, where the weather data will be
downloaded, is centered on cursor position. See the following picture.
Fig. 4.8a - Download Area
Press [ENTER] to activate the Weather Download: the whole data package
(see the previous "Weather data package" table) are downloaded. [CLEAR] allows
to interrupt the data download.
At the end of the operation press [CLEAR] to close the window.
Copy from CARD
E
[MENU] + [MENU] + "C-WEATHER SERVICE" + [ENTER] + "COPY FROM CARD"
+ [ENTER]
Allows the whole data package Weather loading from C-CARD.
Forecast
E
[MENU] + [MENU] + "C-WEATHER SERVICE" + [ENTER] + "FORECAST" +
[ENTER]
Allows selecting the Layer of specific weather data to be displayed on the screen
and to change date and time of the forecast preview.
The following functions are available:
Panning : default usage of the cursor key is the normal panning function.
Zoom in/out : zoom in/out functions are allowed as usual by using [ZOOM IN]/[ZOOM OUT].
Set of date and time : [ENTER] to modify date and time values.
Layer selection : [MODE] to cycle of the weather layers.
Exit : [CLEAR] to close the weather prediction page.
Page 58
59
User Manual
Real Time View
E
[MENU] + [MENU] + "C-WEATHER SERVICE" + [ENTER] + "REAL TIME VIEW"
+ [ENTER]
The following selections are available:
Real Time View On : the data is shown (the area of the download) at the current date and time (received from
the GPS).
Real Time View On : the Weather data is not displayed.
The layer displayed is the one selected into the previous menu item.
Type of Data
E
[MENU] + [MENU] + "C-MAP WEATHER SERVICE" + [ENTER] + "TYPE OF
DATA" + [ENTER]
Allows selecting the type of data, see the previous Fig. 4.8.
4.9 FISH FINDER
E
The chart plotter combined with the sonar performance of the Fish Finder is one
of the most advanced marine navigation system available.
To select the Fish Finder menu, first select one of the pages related to the Fish
Finder (note that the Fish Finder display page is available only if the Fish Finder is
connected and powered On*):
[MODE] more times to select the desired page
Once the Fish Finder page is selected, access the Fish Finder menu by pressing:
[MENU]
For more information see the specific User Manual*.
NOTE* ONLY FOR Map 7cwi Plus GPS: The Fish Finder is embedded into the chart
plotter. See also Cap. 7.
4.10 RADAR
E
The Radar consists of a scanner unit which illuminates targets with microwave
energy and then collects the echoes from those targets. The scanner unit includes
the Radar antenna, transmitter, receiver and necessary electronics. The scanner
unit is connected to a chart plotter equipped with software capable of displaying
the Radar functions.
To select the Radar menu, first select one of the pages related to the Radar:
[MODE] more times to select the desired page
Once the Radar page is selected, access the Radar menu by pressing:
[MENU]
For more information see the specific User Manual.
NOTE The Radar display page is available only if the Radar is connected and powered
On.
Page 59

60
User Manual
Page 60

61
User Manual
5. C-LINK
E
5.1 C-LINK
E
C-LinkE system is a feature which allows to sharing the same cartographic data
between two Chart Plotter units linked via serial I/O port.
In order to activate C-LinkE function, a “MAX data C-CARD” (called REGULAR CCARD) must be inserted into one of the two chart plotters and a special MAX data
C-CARD (called MIRROR C-CARD) must be inserted on the other chart plotter.
The two MAX data C-CARDs must have the same code and revision. So, the
MIRROR C-CARD can be utilized only on a chart plotter linked to another chart
plotter provided with the equivalent REGULAR C-CARD.
It is important to point out that the two chart plotters must have the update
software versions that allow C-LinkE function.
How C-LinkE system works
When the chart plotter is powered up, it switches into the “Stand-Alone Mode”. In
this work mode, the chart plotter unit periodically scans all the available C-CARD
slots searching for MIRROR C-CARDs. When one or more MIRROR C-CARD is
found (in one or both chart plotters) a special connection is established between
the chart plotters to enable the MIRROR C-CARDs. If a regular C-CARD which has
previously activated a MIRROR C-CARD is removed, even the MIRRORs C-CARD
will be not read anymore on the other unit.
C-LinkE serial connection
The two chart plotters should be connected via serial ports. Any of the available
ports can be used, the software will recognize automatically the serial ports used.
A typical connection is as follows:
Chart Plotter 1 Chart Plotter 2
TX —————> RX
RX <————— TX
GND <————> GND
5.2 C-LINKE NAVIGATION DATA TRANSFER
This function allows transferring C-LinkE Navigation Data (Route Name, Destination ID & Position, Next Waypoint ID & Position, Total Route length, Fuel Consumption Rate, ETA, TTG etc.) between two chart plotters linked through the
C-LinkE system.
The chart plotters can be set to operate in two modes:
♦ MASTER mode (Primary Chart Plotter)
♦ SLAVE mode (Secondary Chart Plotter)
When the navigation is activated on the Master chart plotter, the C-LinkE navigation data will be continuously sent to the Slave until the navigation is active.
If the Master is navigating to a Single Destination, the Slave will show the Destination position and activate the navigation to it.
If the Master is navigating to a Route, the Slave will show the Route Leg composed by the Destination and the Waypoint after the Destination (Next Waypoint)
Page 61

62
User Manual
and activate the navigation to it.
Any variation to the current C-LinkE Navigation Data will be transferred from the
Master to the Slave.
The Slave will be provided with a few dedicated pages to show the C-LinkE Navigation Data received from the Master.
Operations
Introductive elements
It is important remark, once more, that this function does not transfer the whole
route but just the information relative to the navigation. Such information will be
removed from the Slave chart plotter as soon as the navigation is terminated.
C-LinkE navigation data is exchanged by using two NMEA-0183 C-MAP proprietary
sentences: $PCMPN,1 and $PCMPN,2.
When the navigation is activated on the Master, it starts output the C-Link Navigation Data. If the Slave is connected, all C-LinkE Navigation Data received are
stored in its memory and the navigation is started.
The information sent by the Master consists of the following values:
♦ Navigation mode (To Single Destination/to a Route)
♦ Route Name*
♦ Destination ID
♦ Destination Position
♦ Next Waypoint ID*
♦ Range from Destination to next Waypoint*
♦ Bearing from Destination to next Waypoint*
♦ Route Length*
♦ Distance from Destination to Last Route Waypoint*
♦ Remaining Route Legs*
♦ Planned Cruising Speed
♦ Average Fuel Consumption
♦ Initial Fuel Load
C-LinkE Navigation Data can refer to:
♦ Single Destination navigation
♦ Route Following navigation
Values identified by * are sent only for Route Following navigation.
The Destination Icon, Navigation leg (Fix Position to Destination), the Next Waypoint
Icon and all other relevant C-LinkE Navigation Data will be shown on the Slave
chart plotter. Any variation of the C-LinkE Navigation Data on the Master will be
communicated to the Slave so to keep data aligned on both devices.
Master Chart Plotter
Operating mode
To select the Master mode follow the procedure:
[MENU] + [MENU] + "Input/Output" + [ENTER] + "C-Link" +
[ENTER] + "Primary Station" + [ENTER]
Master mode is the default factory setting. All regular chart plotters functions are
allowed. As soon as the Destination is placed, the Master chart plotter will start
transmitting all C-LinkE Navigation Data.
In Master mode the C-LinkE Navigation Data received from the NMEA port is ignored. So, if the two chart plotters are both operating in Master mode, the C-Link
E
Navigation Data sent by the other chart plotter never processed.
Page 62

63
User Manual
Under such condition if the navigation is activated on one of the two chart plotters, a warning message will be shown to notify that the C-LinkE navigation data
will be ignored by the other Chart Plotter.
Slave Chart Plotter
Operating mode
To select the Slave mode follow the procedure:
[MENU] + [MENU] + "Input/Output" + [ENTER] + "C-Link" +
[ENTER] + "Secondary Station" + [ENTER]
When Slave mode is set, the chart plotter cannot manipulate the C-LinkE Navigation Data anymore.
Stop current navigation
If the navigation was already active, it will be disabled as soon as Slave mode is
set. An appropriate warning message will be shown to notify that the Navigation
is already active and to confirm whether Slave mode can be set.
Inhibit Navigation operation
As soon as Slave mode is set, the Destination cannot be placed anymore either
the C-LinkE Navigation Data is received from the Master or not. Also, when the
C-LinkE Navigation Data is received from the Master, it will not be allowed to
deactivate the Navigation.
Inhibit Route following
While navigating to the route received from the Master the Destination is reached
(either applying distance or perpendicular criteria), the Destination will not be
moved to the next Waypoint on the Route.
MOB handling
If the Navigation to the external Destination is active and [ENTER] + "MOB" +
[ENTER] (on MAP 7v GPS [MOB]) is pressed on the Slave chart plotter, the MOB
is placed but the navigation to the MOB is not activated.
Notes
While navigating to the external Destination the operating mode is switched to
Master mode, the navigation to the external Destination will be terminated. An
appropriate warning message will be shown to notify that the Navigation to the
external Destination is active and to confirm whether Slave mode can be set.
Setting Slave mode, the C-LinkE Navigation Data will be deleted.
The C-LinkE Navigation Data are deleted at Power Off.
C-LinkE Navigation Data: Acquisition and Display
As soon as the C-LinkE Navigation Data is received, the Slave parses the information
received and executes the relative actions depending on its current working status.
Note When the Navigation to the external Destination is activated, the Slave Chart
Plotter will show all relevant C-Link
E
Navigation Data exactly like when the
Destination is not the external one (Destination Name, DST and BRG to
Destination, calculate XTE, calculate TTG etc). These values will be displayed all
places where required and they will be used to format NMEA-0183 output data.
Page 63
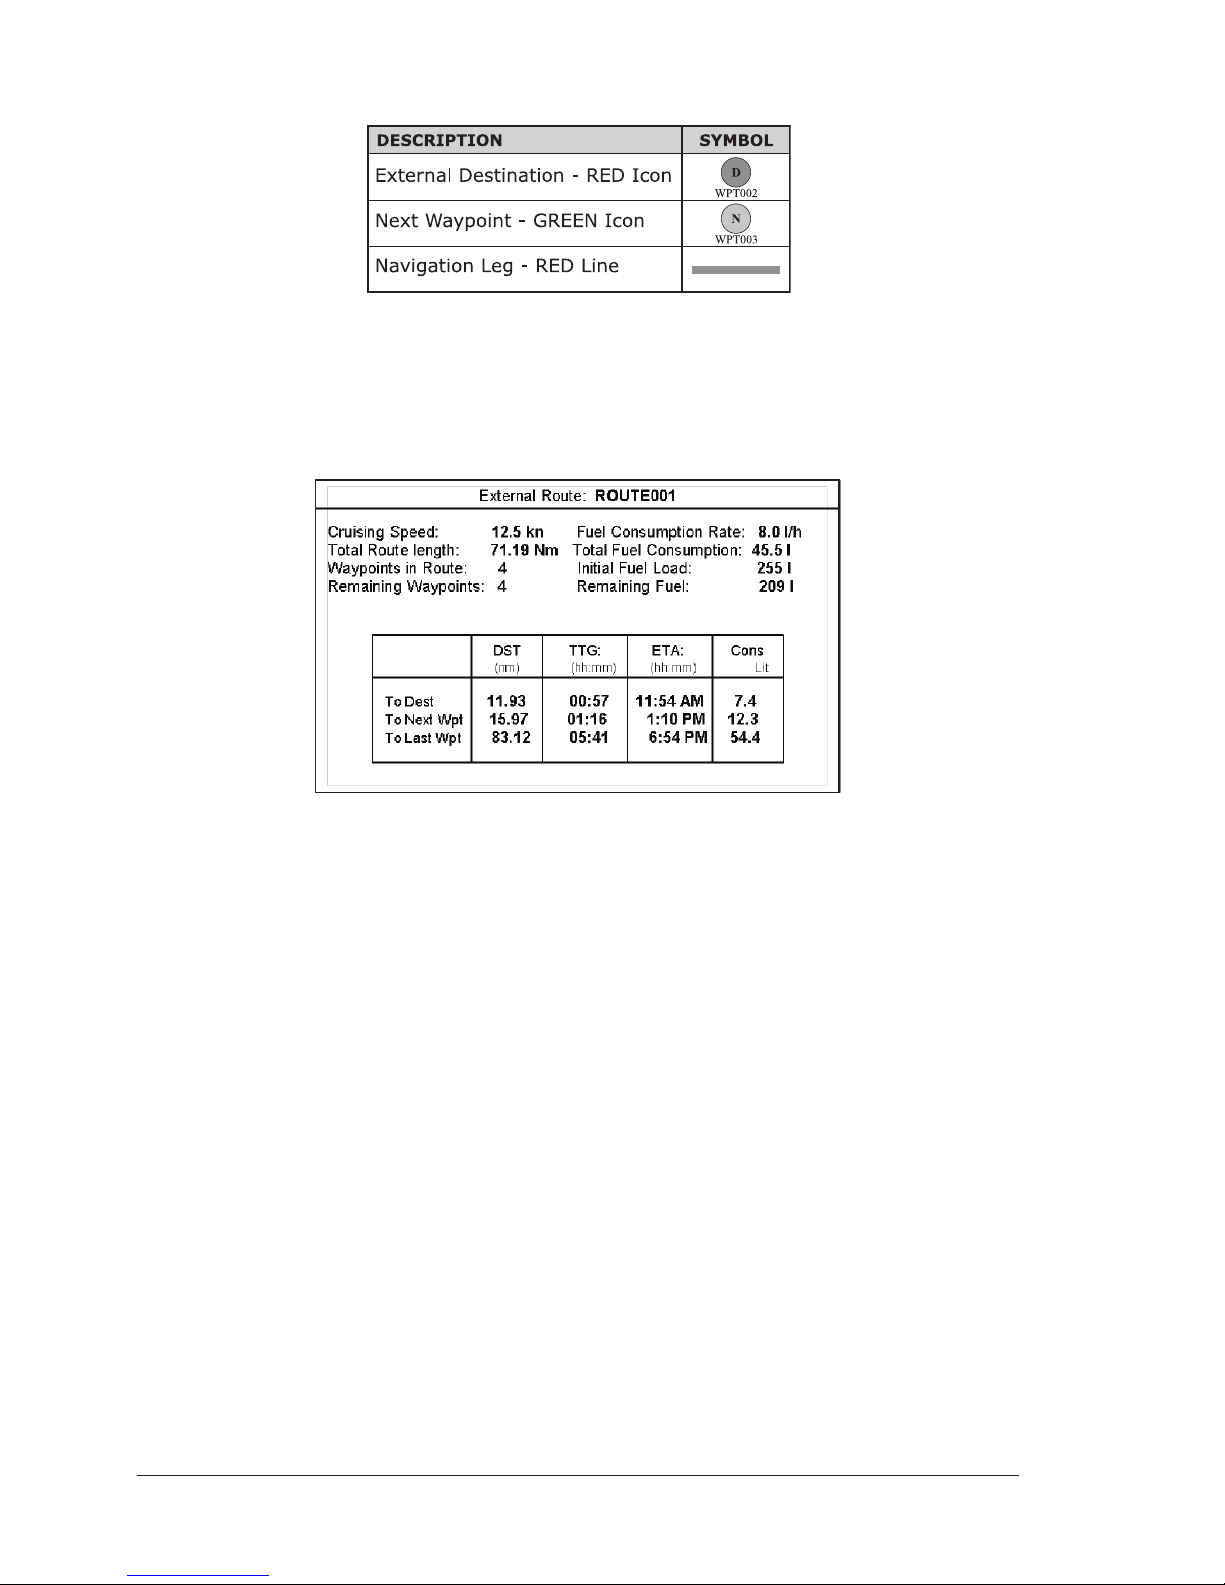
64
User Manual
Graphical representation on Map Display
Fig. 5.2 - Graphical Displaying
Route Data Report
When the Navigation to the External Route is received, it will be possible to display the information related to the External Route by entering the Route Data
Report.
Fig. 5.2a - External route on Route Data Report
♦ External Route : Name of the External Route (from
$PCMPN,0)
♦ Cruising Speed : Planned Cruising Speed (from $PCMPN,1)
♦ Total Route length : Length from First to Last Wpt (from
$PCMPN,1)
♦ Waypoints in Route : No. of Wpts in the Route (from $PCMPN,1)
♦ Remaining Waypoints : No. of Wpts from Dest to Last Wpt (from
$PCMPN,1)
♦ Fuel Consumption Rate : Planned Fuel Consumption Rate (from
$PCMPN,1)
♦ Total Fuel Consumption : Calculated Fuel consumption to navigate
the whole Route
♦ Initial Fuel Load : Volume of Fuel available before the navi-
gation was started (Liters)
♦ Remaining Fuel : Volume of Fuel available (Liters)
♦ Distance to Destination : Distance from Ship to Destination (calcu-
lated)
♦ Distance to Next Wpt : Distance to travel from ship to the Wpt
after the Destination (calculated: Distance
to Dest + Next Route Leg length)
♦ Distance to Last Wpt : Distance to travel from ship to the End of
the Route (calculated: Distance to Dest
Page 64
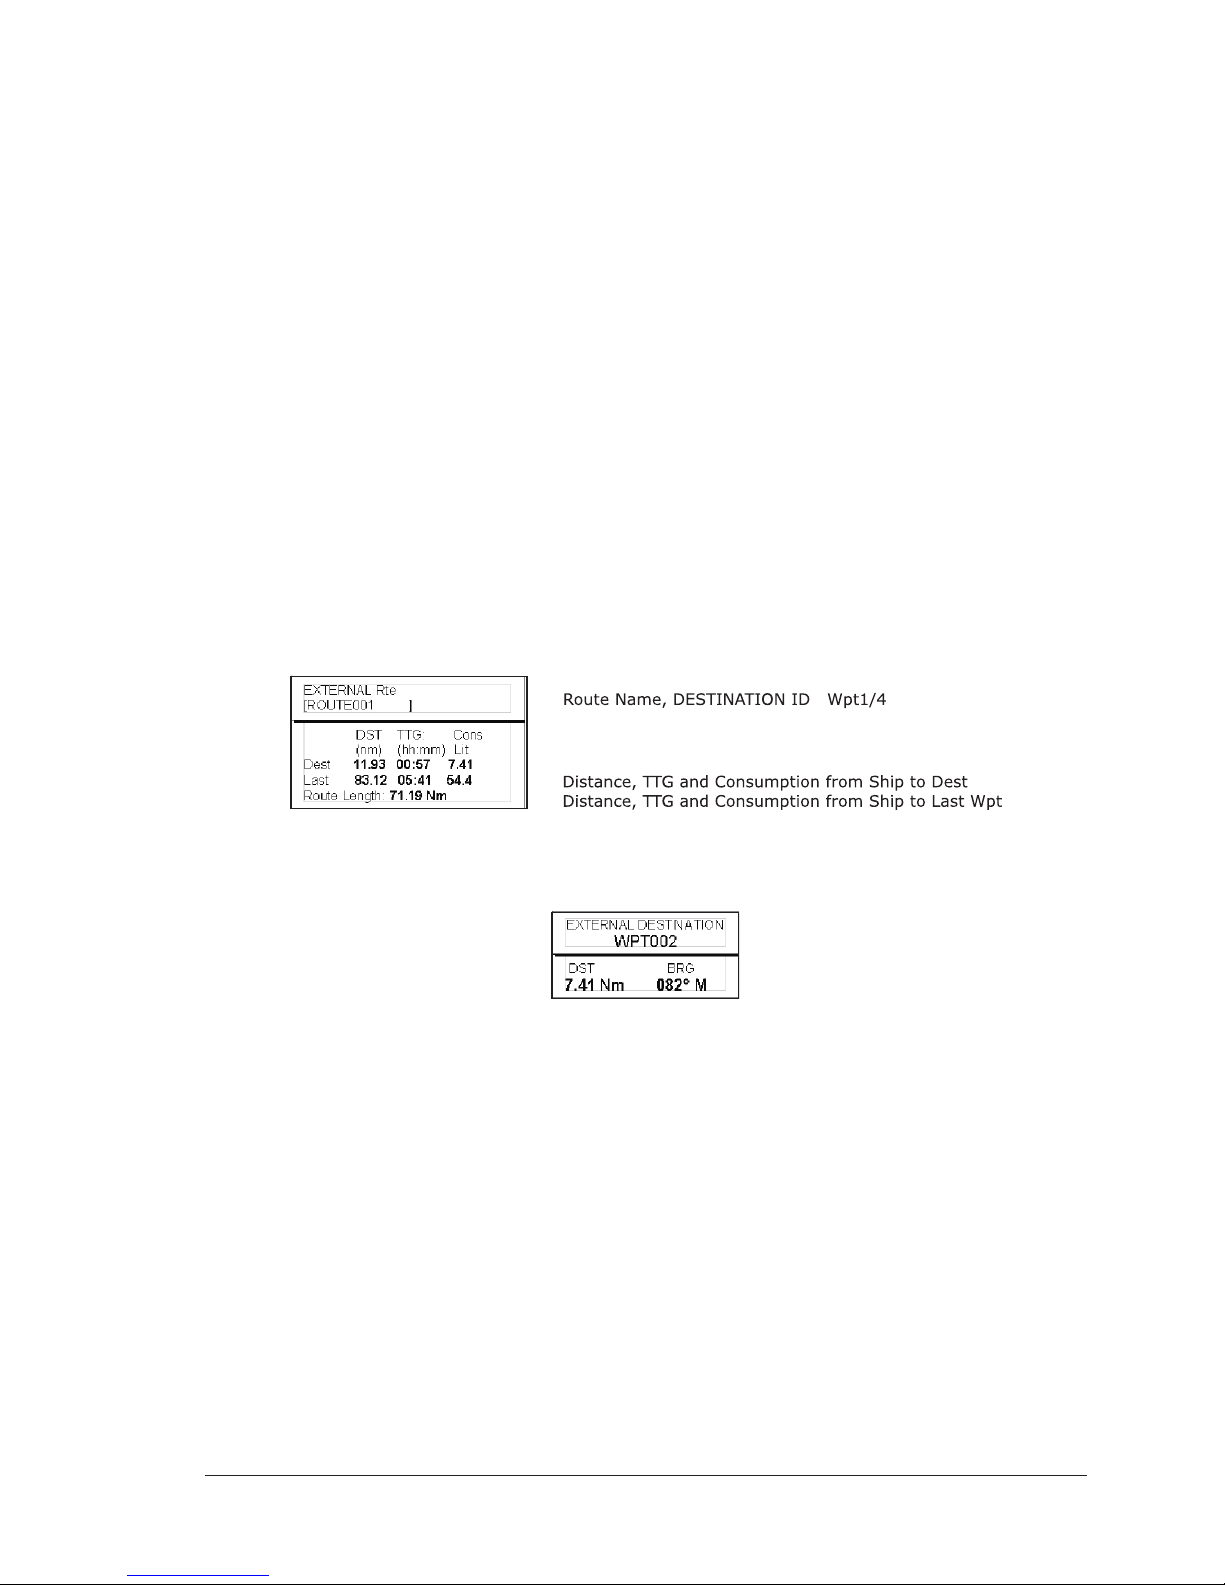
65
User Manual
+Distance From Dest to last Wpt received
from $PCMPN,1)
♦ TTG To Destination : Estimated Time to travel the “Distance to
Last Wpt” (calculated using Cruising
Speed)
♦ TTG To Next Wpt : Estimated Time to travel the “Distance to
Next Waypoint” (calculated using Cruis-
ing Speed)
♦ TTG to Last Wpt : Estimated Time to travel the “Distance to
Last Wpt” (calculated using Cruising
Speed)
♦ ETA to Destination : Estimate Time of Arrival to the Destina-
tion Point (calculated: Current Time +
“TTG To Destination”)
♦ ETA to Next Waypoint : Estimate Time of Arrival to the Waypoint
after the Destination (calculated: Current
Time + “TTG To Next Waypoint”)
♦ ETA to Last Wpt : Estimate Time of Arrival to the End of the
Route (calculated: Current Time + “TTG
To Last Wpt”)
Quick Info
Route Navigation: Quick Info on the Destination
Fig. 5.2b - Quick Info on Destination
Quick info on Single Destination
Fig. 5.2c - Quick Info on Single Destination
Page 65

66
User Manual
Page 66
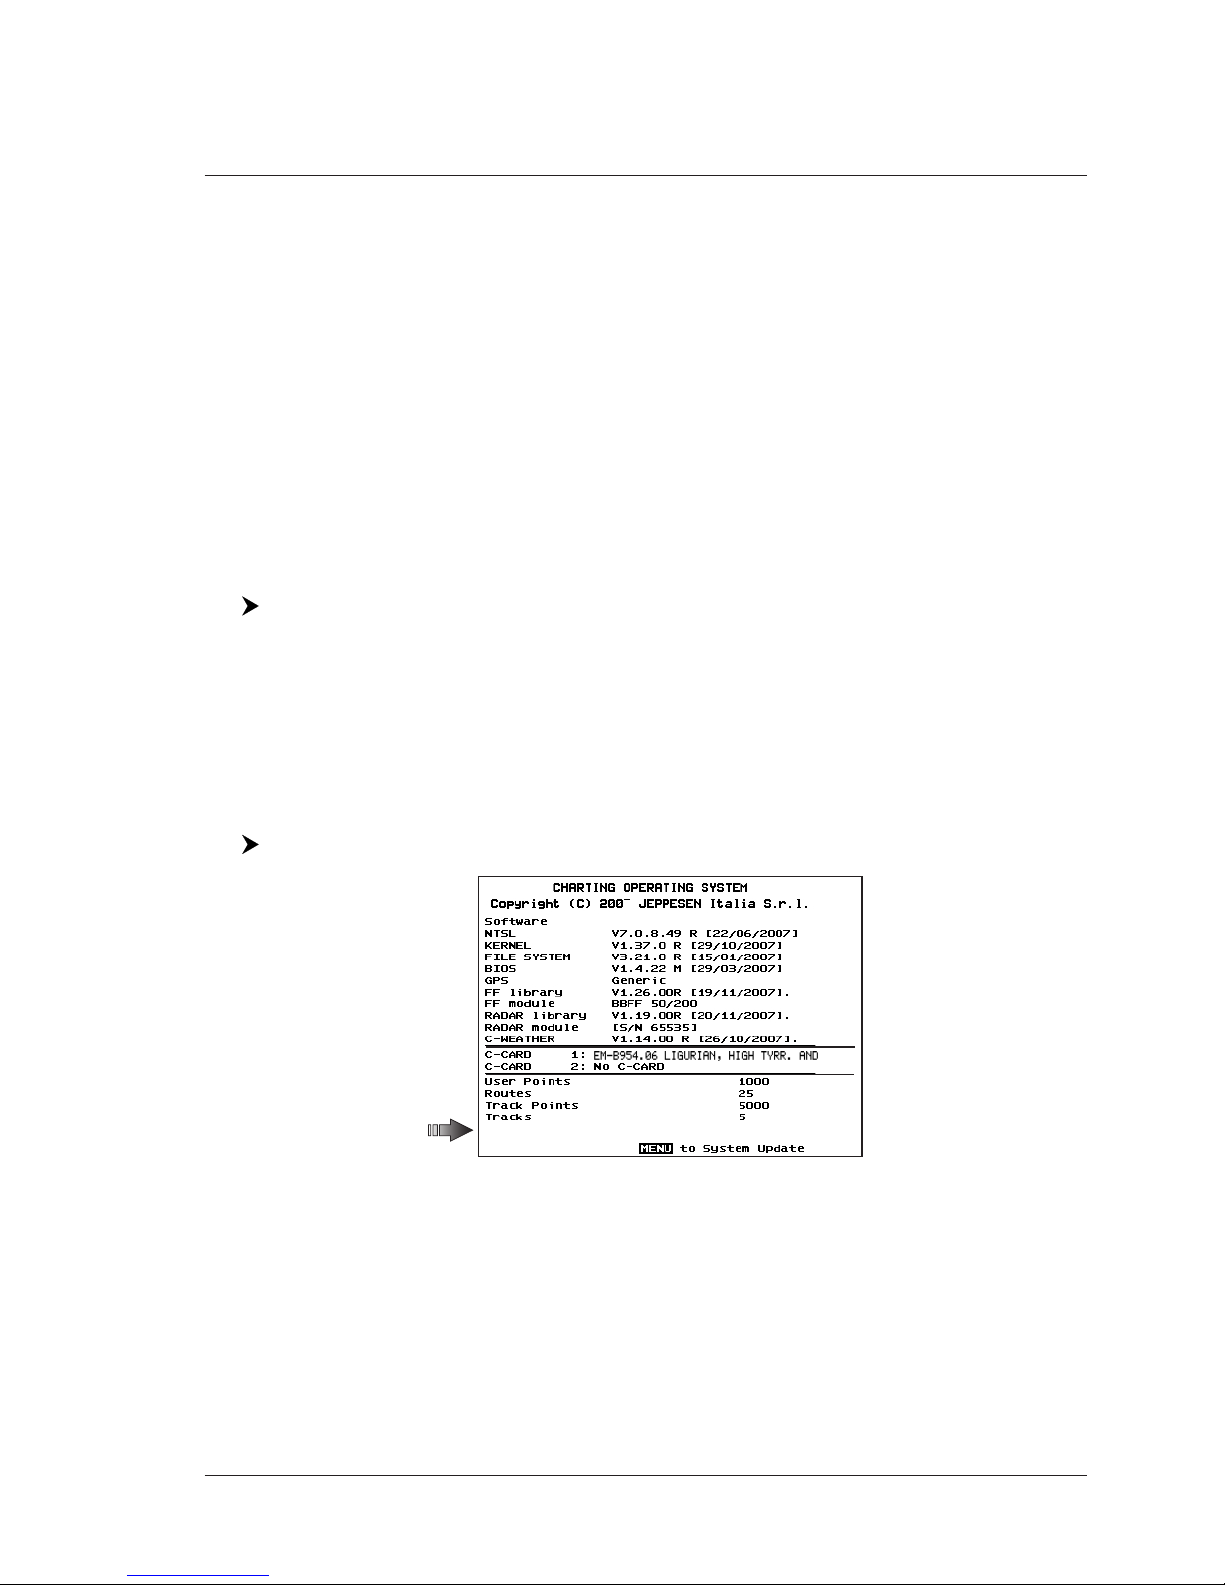
67
User Manual
6. MOBILARM System
The MOBILARM is an automated crew monitoring system dedicated to monitoring
onboard crew by maintaining a constant link between the crew member and the
boat. The instant a man over-board event happens, an automatic alarm is sounded,
and the vessels position is logged.
Connect the MOBILARM System to a serial port of the chart plotter.
6.1 SOFTWARE SETUP
After connections have been made, the chart plotter has to be setup to be able to
receive NMEA information from the MOBILARM.
When a MOBILARM is connected to the chart plotter, any input port of the NMEA
in/out Communication setup menu must be changed to MOBILARM as shown below
for communications.
[MENU] + [MENU] + "INPUT/OUTPUT" + [ENTER] + select any input port
you want + [ENTER] + "MOBILARM" + [ENTER]
The chart plotter continuously verifies the communication status with MOBILARM
instruments. If there is no communication for more than one minute, an alarm
window appears.
6.2 MOBILARM STATUS
If you want to know information about the MOBILARM connected, follow the
procedure:
[MENU] + [MENU] + "About..." + [ENTER]
XXXX V. X.yy R [GG/MM/YYYY]
8
MOBILARM Connected
Fig. 6.2 - Example of About page
In the About page a new item appears, related to MOBILARM status, where status
can be:
♦ Function not Activated : MOBILARM input format has not been set
from the I/O menu;
♦ Not detected : the device has never been detected since
the chart plotter was turned On and input
format was set to MOBILARM;
♦ Connected : the communication with MOBILARM device
Page 67
68
User Manual
is Ok;
♦ Signal Lost : the device has been detected but now the
signal is no longer received;
♦ No valid GPS position : the communication with MOBILARM device
is Ok but the GPS position fix is not received.
6.3 MOBILARM PTX
PTX is the personal transponder device that is worn by the crew. If a PTX is
disconnected from the system a man over-board alarm is raised. So a MOB Waypoint
appears on the chart plotter display. In the following for brevity this MOB Waypoint
position is called PTX.
WARNING
Activating navigation to PTX pay attention and don't get too near the manoverboard (don't knock the man down!).
6.3.1 PTX is received
When a PTX has beeen received, the PTX data are saved on the chart plotter
memory and the PTX icon appears on the map:
Fig. 6.3.1 - PTX icon
All menus and/or pages are closed and the chart is centered on the PTX received
position. The Audible Alarm starts beeping and a pop-up warning window appears
to notify that a PTX has been received:
MOBILARM
33°27.090N
220°34.020W
Id Time
000001A0
10:16:29 PM
Fig. 6.3.1a - Example of PTX warning window
It is possible to navigate to the received PTX (see Par. 6.4.2) and open the
MOBILARM PTX List page (see Par. 6.4.3). Both Goto and List functions also mute
the Audible Alarm.
NOTE The List function is active if more than one PTX is store.
6.3.2 PTX is received again
When PTX has beeen received again, it is already present on the chart plotter
memory.
Page 68
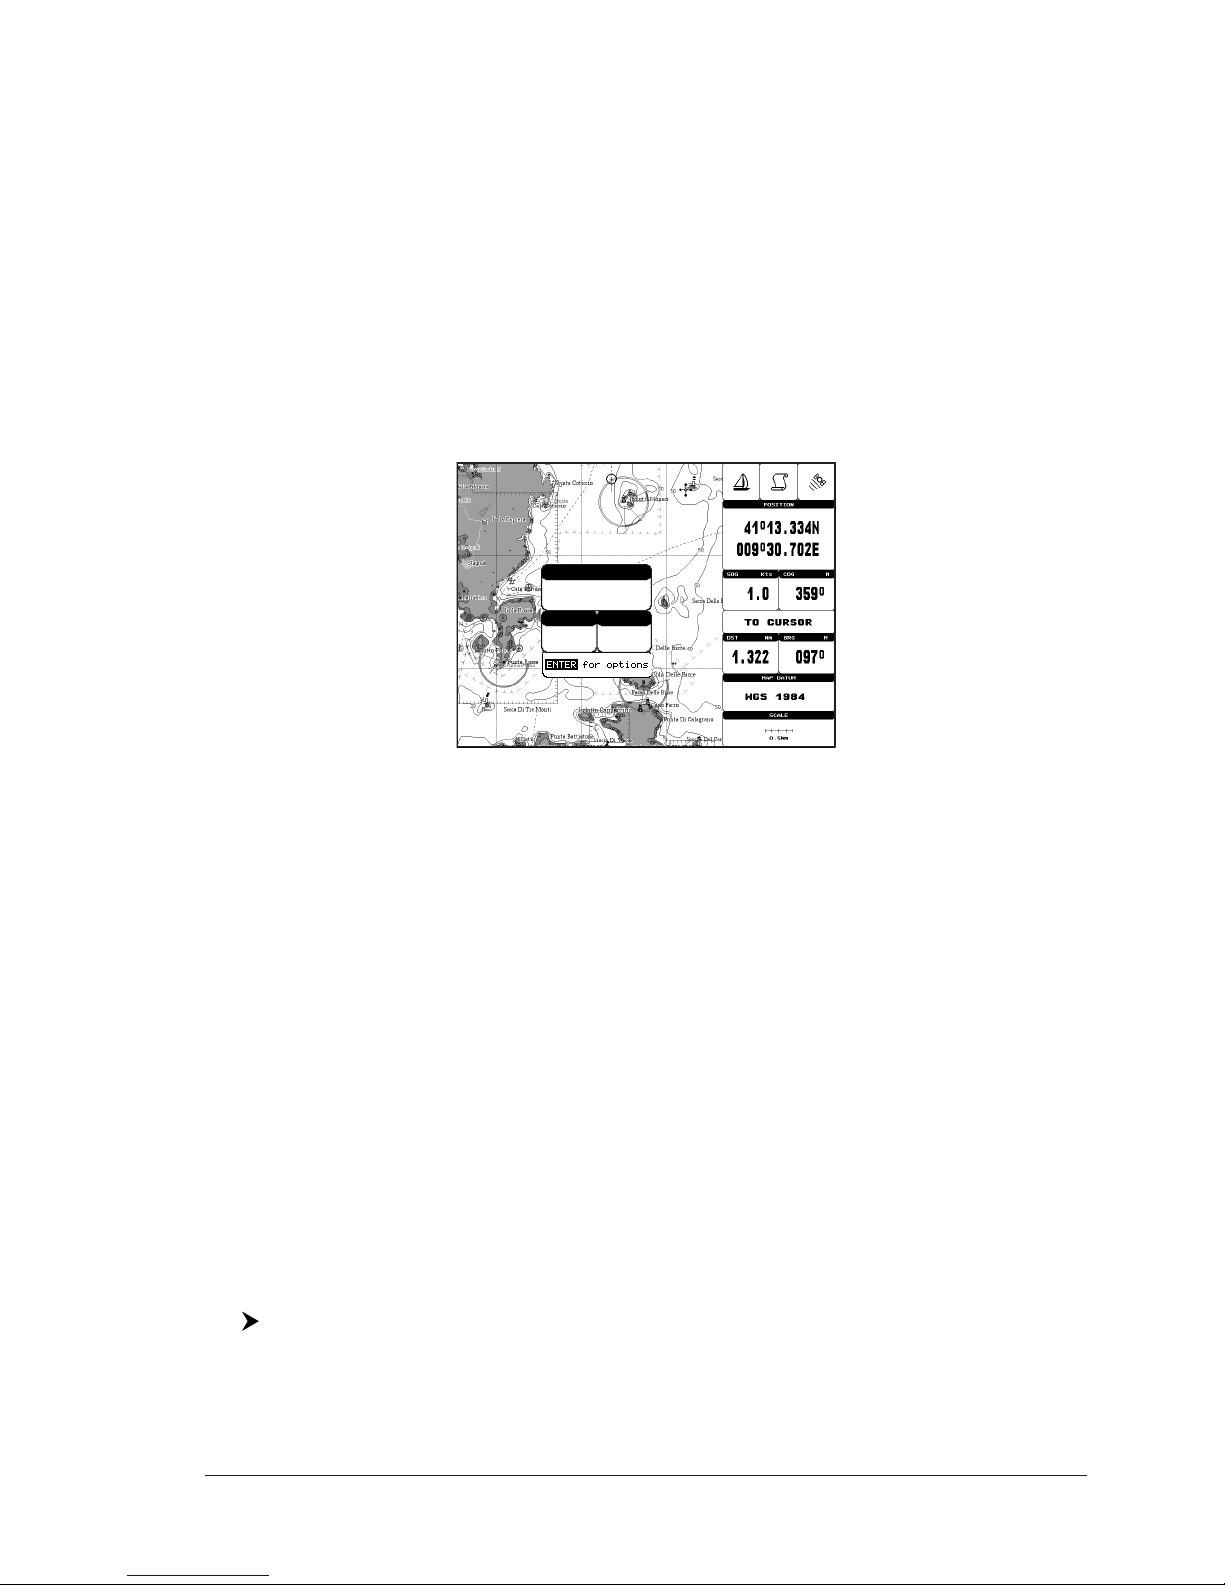
69
User Manual
If the received PTX is NOT the active one, the user must confirmed to navigate to it.
Otherwise if the received PTX is the active one (the PTX on which we are navigating
to), navigation data are updated in memory, the new PTX coordinates becames
the Destination position and the current Fix position becames the starting position.
The map is not automatically centered on it.
The PTX icon appears at the new position and a pop-up warning window appears.
It is possible to close all menus/data pages (if open) and center the chart on the
received PTX (see Par. 6.4.4). Otherwise you could close the alarm window and
stay on the active screen.
6.4 PLACING CURSOR ON THE PTX ICON
Placing the cursor on the PTX icon shown on the screen, an information window
containing the PTX Identifier, position and status (Overboard or Recovered) appears:
MOBILARM - PTX
OVERBOARD
41°13.334N
009°30.702E
Id Time
000001A0
10:16:79 PM
Fig. 6.4 - Example of PTX information window
6.4.1 Delete PTX
The Delete PTX function permamently removes the selected PTX from the chart
plotter memory and from the chart display.
Move the cursor over the PTX to delete. Press [ENTER], using the cursor select
"DELETE" and press [ENTER]. A warning pop-up window will be shown. Select
"YES" and press [ENTER].
6.4.2 Goto PTX
The Goto PTX function activates the navigation to the selected PTX.
Press [ENTER], using the cursor select "GOTO" and press [ENTER].
If the navigation is set to the selected PTX, to terminate the navigation press
[ENTER], using the cursor select "STOP GOTO" and press [ENTER].
6.4.3 MOBILARM PTX List Page
The MOBILARM Alarm Status List shows the list of all PTX that returned an alarm
event. To obtain the page press [ENTER], using the cursor select "LIST" and
press [ENTER].
Another mode to select the MOBILARM Alarm status List is the following:
[MENU] + [MENU] + "MOBILARM" + [ENTER]
Page 69
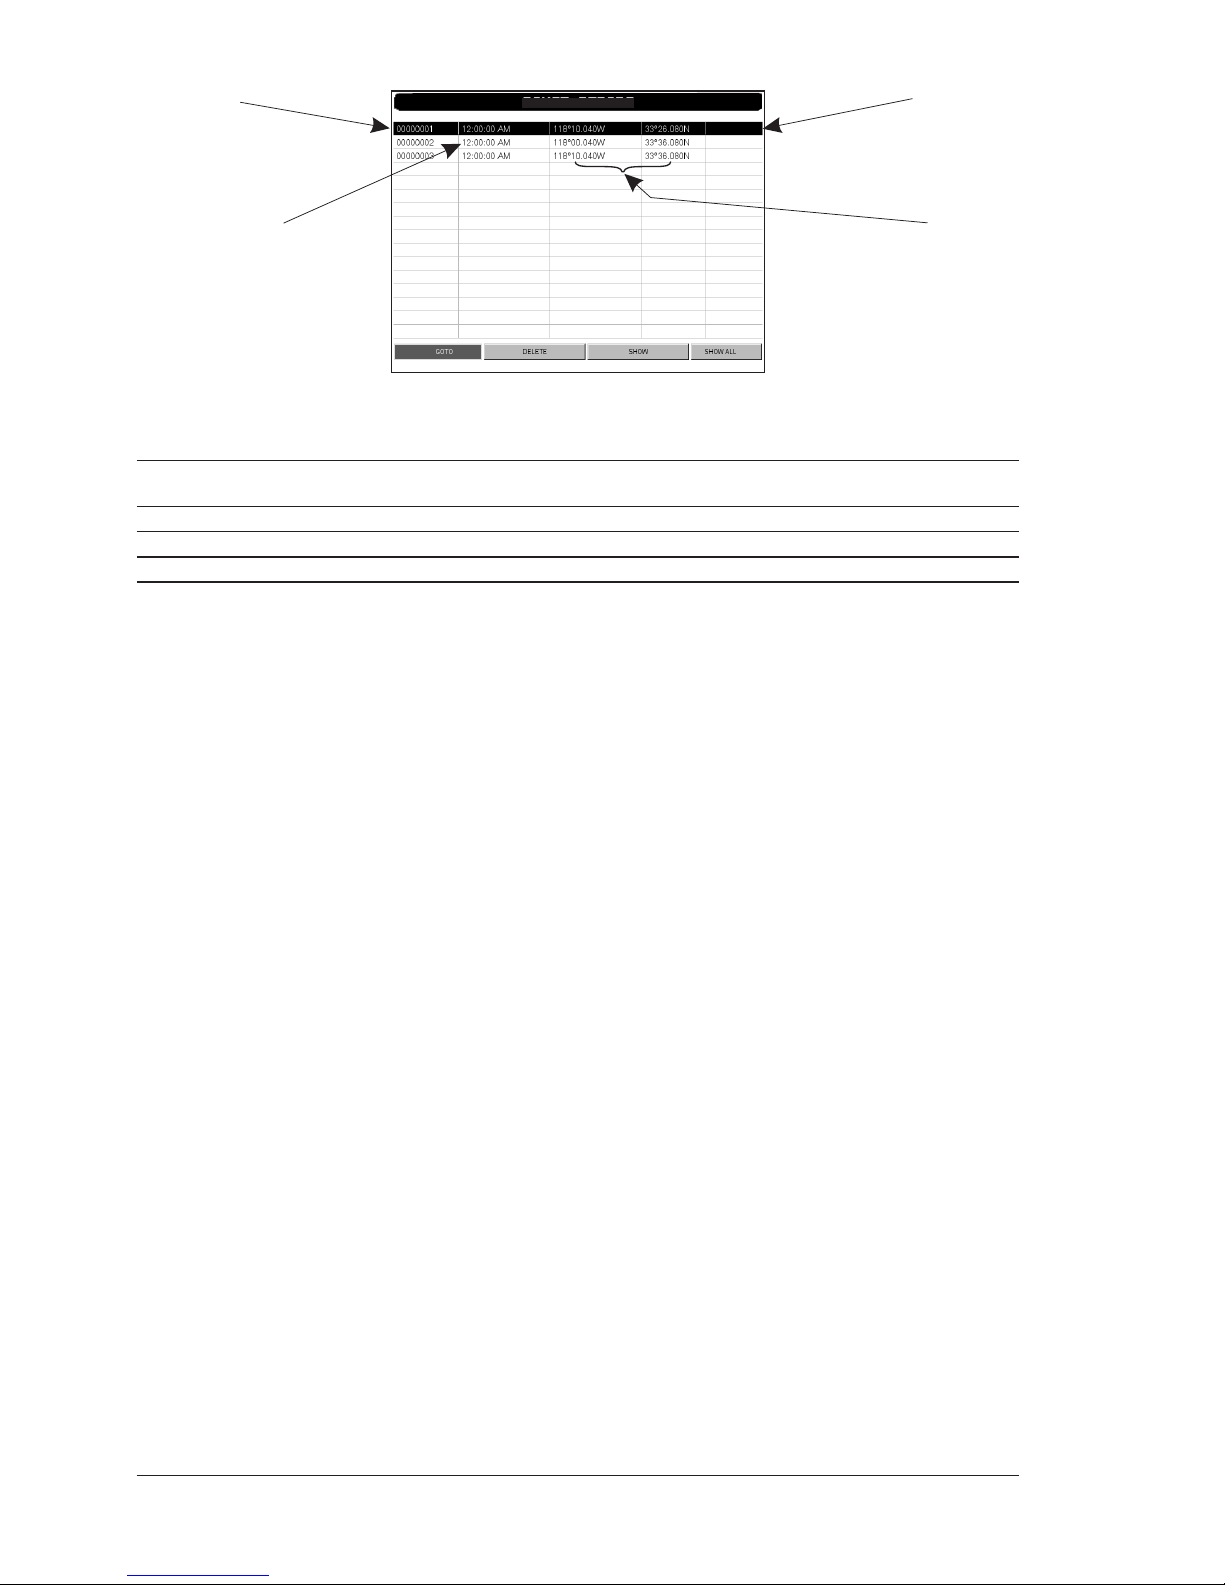
70
User Manual
03:45:14 PM
10:31:24 PM
213°22.120W
305°04.015W
20°01.022N
79°56.320N
RECOVERED
Recovered
Recovered
PTX indentifier
Time of PTX creation
PTX position
PTX status
MOBILARM-Alarm Status List
Fig. 6.4.3 - Example of MOBILARM PTX List page
This page allows you to:
GOTO : Activates navigation to the selected PTX. Once the navigation has been activated, close all
menus/data pages (if open) and center the chart selected PTX.
DELETE : Deletes the selected PTX.
SHOW : Centers the chart on the selected PTX.
SHOW ALL : Selects the best chart scale to see al PTX icons on the map at the same time.
6.4.4 Show PTX
The Show function is available when PTX has beeen received again, it is already
present on the chart plotter memory and it is the active one.
Press [ENTER], using the cursor select "SHOW" and press [ENTER] to close all
menus/data pages (if open) and center the chart on the received PTX.
Page 70
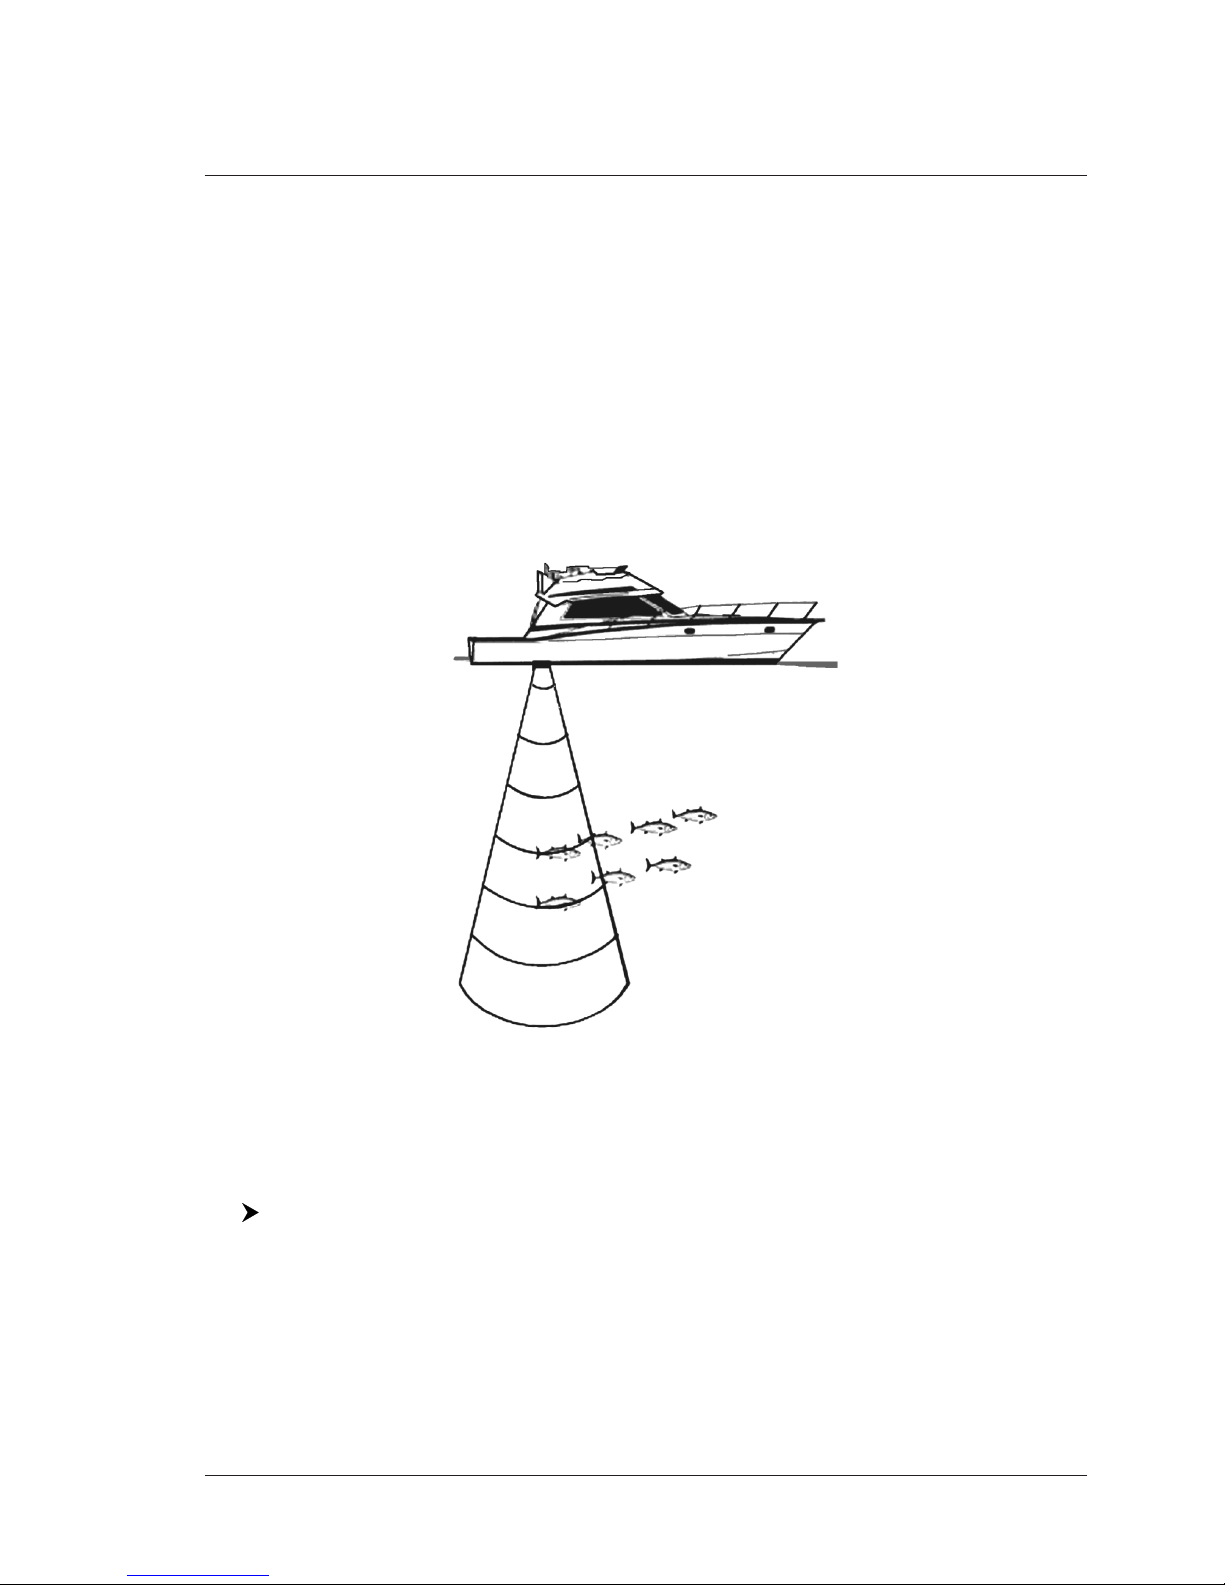
71
User Manual
7. Fish Finder ONLY FOR MAP 7 CWI PLUS GPS
The Fish Finder consists of a high power transmitter, sensitive receiver and a
transducer. The Fish Finder sends an electrical pulse to the transducer which
contains an element that converts the pulse into acoustic (sound) wave which is
sent through the water. As this wave travels from the transducer to the bottom, it
may strike fish, structures, thermoclines (temperature changes in the water).
When the wave strikes an object(s) a certain amount of the wave is reflected back
to the transducer depending on the composition and shape of the object. When
the reflected wave is returned to the transducer it is converted into a voltage and
is amplified by the receiver, processed and sent to the display. The speed of sound
in water is roughly 4800 ft./sec, so the time lapse between the transmitted signal
and the received echo can be measured and the distance to the object determined.
Fig. 7 - Fish Finder working principle
7.1 SETTING THE INTERNAL FISH FINDER ON
The Fish Finder driver is embedded on the chart plotter: it is connected directly to
the dedicated serial Port2.
To switch the internal Fish Finder transmission On follow the procedure:
[MENU] + [MENU] + "INPUT/OUTPUT" + [ENTER] + "FISH FINDER ON" +
[ENTER]
NOTE It is not possible to connect any external Fish Finder unit to the chart plotter.
7.2 UNDERSTANDING THE FISH FINDER PAGE
The display on chart plotters shows a history of time of the echoes received by
the transducer. The chart plotters have a menu that allows adjustments to receiver sensitivity, depth range and scrolling speed of the Fish Finder display.
Page 71
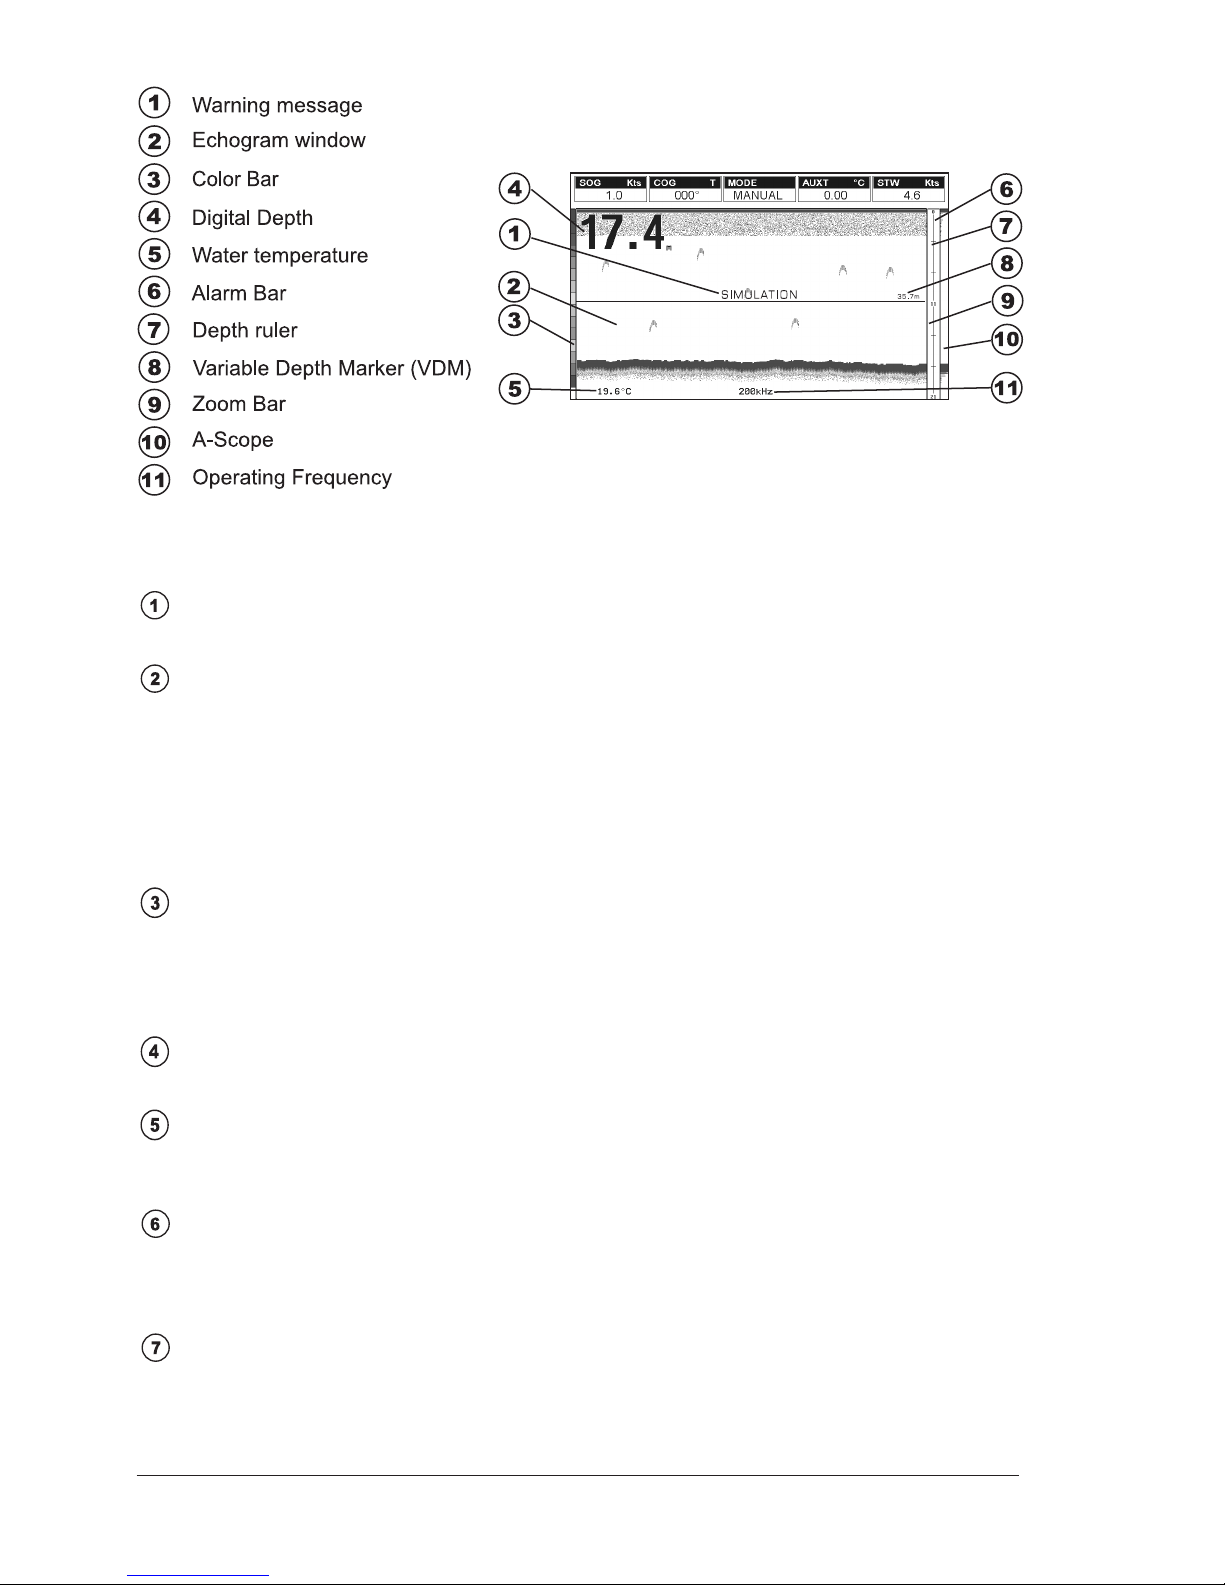
72
User Manual
Fig. 7.2 - The Fish Finder page
The following is a short description of terms listed in the previous Fig. 7.2:
Warning Message
Flashing label "Simulation" when the echo sounder is in Simulation mode.
Echogram window
Graphic presentation of sonar soundings recorded as a continuous profile
scrolling across the screen from right to left. Such recordings represent the
image of the water beneath your boat, items appear as they pass under your
transducer; the items on the right side of the screen are closer to you than
those on the left. The correct interpretation of the Echogram allows retrieving
useful information about what is under the boat. See the following Par. 7.2.2
for more information.
Color Bar
Colored scale located on the left side of the screen that shows the colors used
in the Echogram to represent the echoes strength. The color on the top of the
bar represents the maximum sonar strength, while the color on the bottom of
the bar represents the minimum sonar strength.
Digital Depth
Readout of the current bottom depth.
Water Temperature
Readout of the current water temperature returned by the TEMP 1 sensor
included into specific transducers.
Alarm Bar
Bar located on the right side of the Depth Ruler, showing the shallow water
and deep water alarm values. The alarm is triggered when depth is outside
the range.
Depth Ruler
Vertical graduated bar located along the right side of the screen. It is a scale
which reflects the depth of the area being displayed.
Page 72
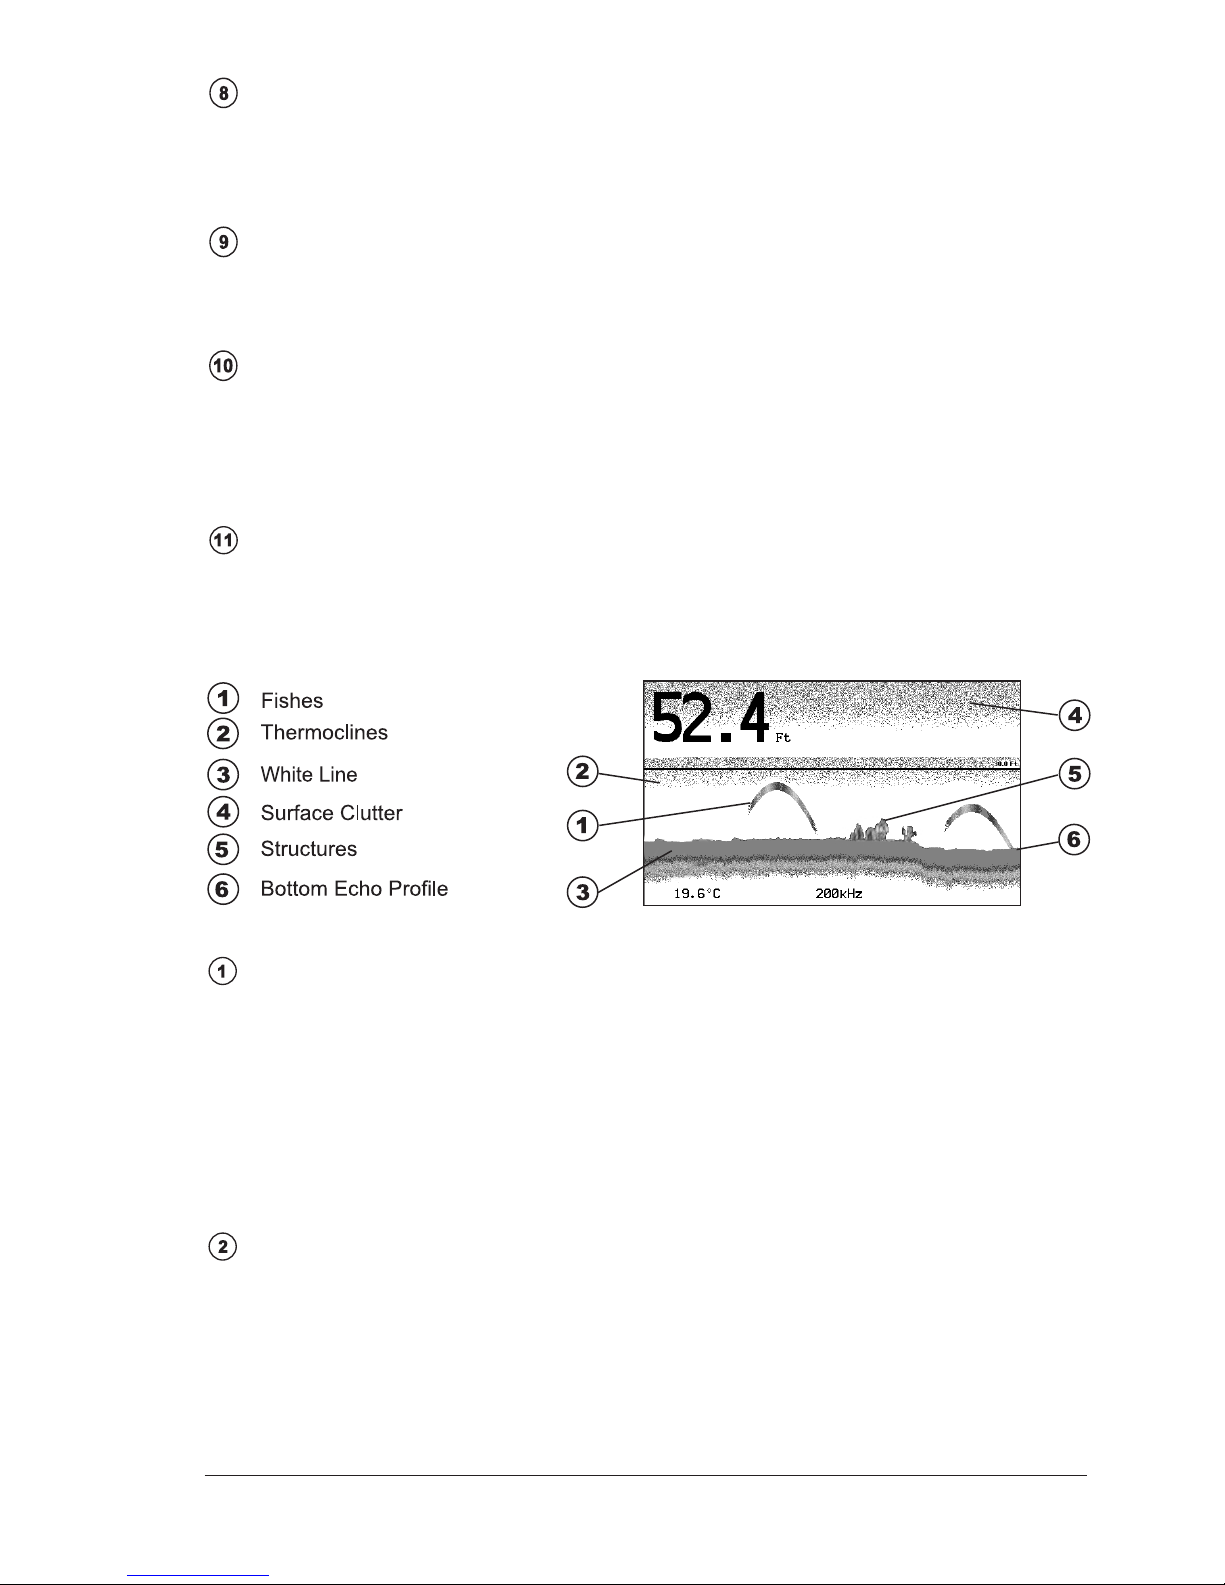
73
User Manual
Variable Depth Marker (VDM)
Horizontal line on to the Echogram window with a depth label. The up/down
cursor keys can move it up and down. The label displays the depth of the
cursor position. It can be moved to any location pinpointing the depth of a
target.
Zoom Bar
Bar located on the left side of the Depth Ruler, showing the portion of the
Echogram currently represented in the zoomed window (on the left part of
the screen). It is turned On selecting the Echo Sounder Split page.
A-Scope
A real time representation of fish and bottom features passing through the
beam of the transducer. It is drawn as horizontal lines whose length and hue
is proportional to the sonar strength returned. When the default palette is
selected, the strongest sonar returns will be shown as the color displayed of
the top of Color Bar while the weakest as the bottom color.
Operating Frequency
Readout of the selected operating frequency.
7.2.1 Understanding the Echogram display
The main elements that can be easily distinguished into an Echogram are:
Fig. 7.2.1 - The Fish Finder Echogram
Fishes
Fishes are represented as arcs because of the cone angle of the transducer.
In fact as the boat passes over the fish the leading edge of the cone strikes
the fish, causing a display pixel to be turned on. As the boat passes over the
fish, the distance to the fish decreases turning each pixel on at a shallower
depth on the display. When the boat is directly over the fish, the first half of
the arch is formed and since the fish is closer to the boat, the signal is stronger
and the arch is thicker. As the boat moves away from the fish, the distance
increases and the pixels appear at progressively deeper depths forming the
remaining half of the arch.
Thermoclines
Are the zones where two layers of different water temperatures meet. The
greater the temperature differential, the thicker the thermocline is shown on
the screen. Thermoclines are represented as horizontal stripes of noise. They
are very important for fishing since often many species of game fish like to
suspend in, just above, or just below the thermoclines.
Page 73
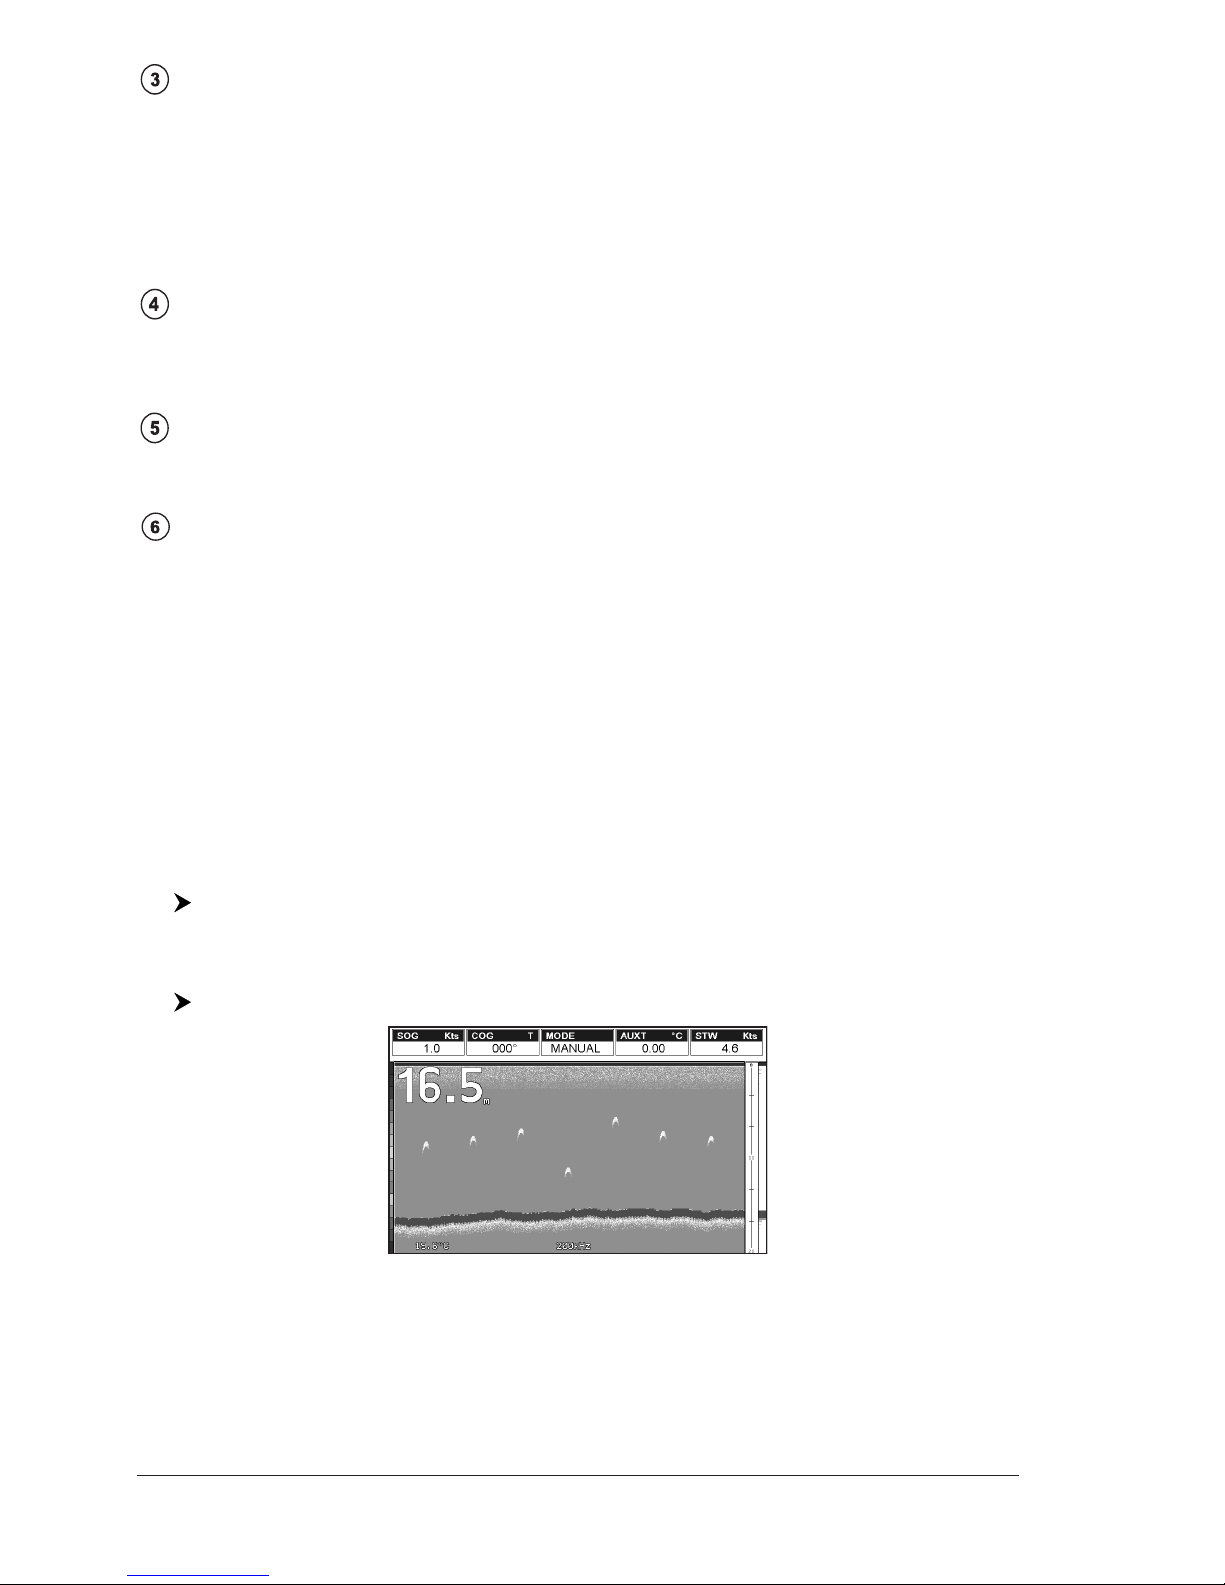
74
User Manual
White Line
The White Line shows the difference between hard, soft bottoms and even
distinguishes between fishes and structures located near the bottom. In this
way it is easier to tell the difference between a hard and soft bottom and even
to distinguish fishes and structures located nearby the bottom. For example,
a soft, muddy or weedy bottom returns a weaker echo that is shown with a
narrow white line while a hard bottom returns a strong echo that causes a
wide white bottom line.
Surface Clutter
Appears like noise at the top of the screen extending many feet below the
surface. It’s caused by many things, including air bubbles, bait fish, plankton
and algae.
Structures
Generally, the term “structure” is used to identify objects like wrecks and
weeds rising from the bottom.
Bottom Echo Profile
Bottom profile recorded by the Fish Finder. When the echo sounder is set in
auto-range mode it is automatically kept in the lower half of the screen.
Other Elements
Large anchoring cables are returned by the echo sounder as very long and narrow
arcs on the screen.
7.3 DISPLAYING THE FISH FINDER PAGE
This section will take you through the frequently used operations and assist you
to customize the look of the chart plotter using the Fish Finder.
7.3.1 How to select the Fish Finder page
To change the Fish Finder page displayed follow the procedure:
[MODE] more times
7.3.2 Fish Finder Full page
To display the Fish Finder Full Page Echogram, follow this procedure:
[MODE] more times until the Fish Finder Full page is displayed
Fig. 7.3.2 - Example of 200kHz Fish Finder Full page
NOTE The frequency displayed depends on the selection done in the Frequency item
(see Par 7.6.7).
The MENU key
Pressing [MENU] activates the Fish Finder Setup menu (see Par. 7.6). Pressing
[MENU] subsequent times toggles between the Fish Finder Setup menu and the
Page 74
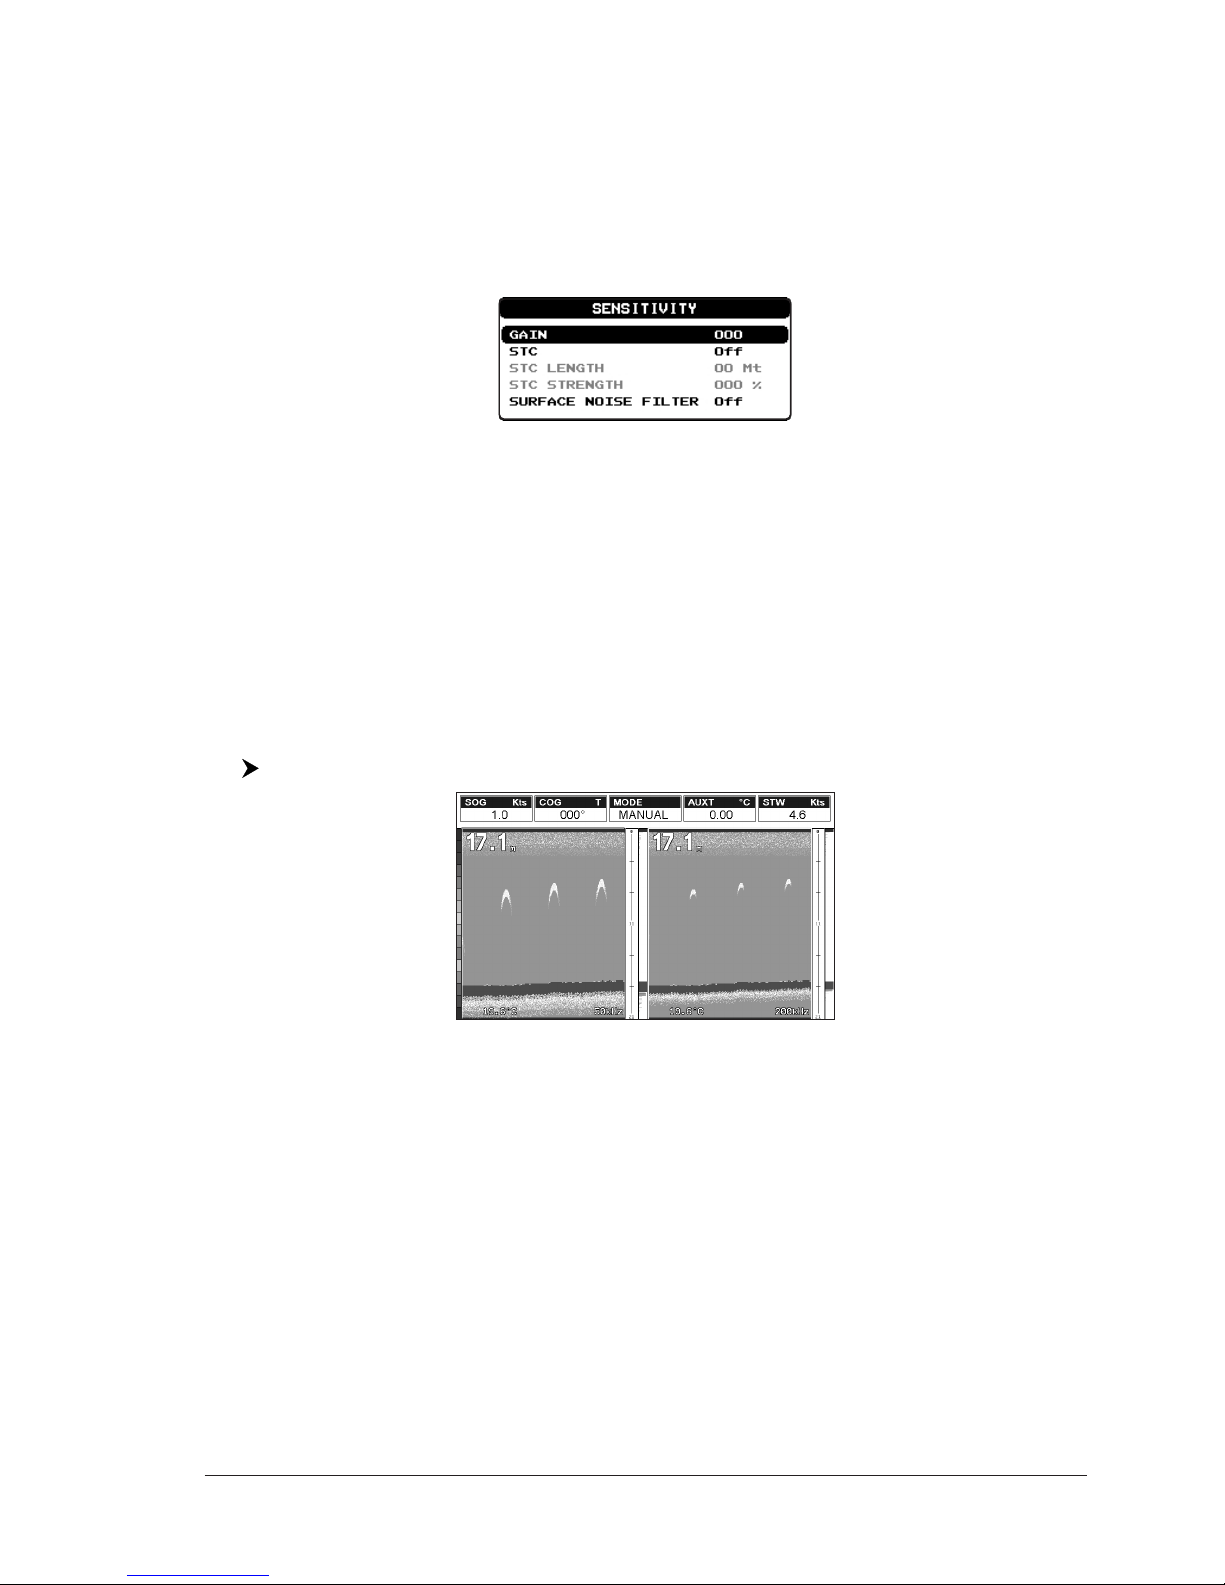
75
User Manual
Functions menu.
The Cursor key
Moving the Cursor key up/down adjusts the Variable Depth Marker (VDM) up or
down on the screen.
The ENTER key
Pressing [ENTER] activates the Sensitivity menu (see Par. 7.6.9) that allows
tuning the Gain, the Surface Noise Filter and the STC.
Fig. 7.3.2a - Sensitivity sub-menu
Pressing [CLEAR] turns off the Sensitivity menu.
The CLEAR key
By pressing [CLEAR] the Variable Depth Marker (VDM) is hidden.
The ZOOM IN and ZOOM OUT keys
From this page pressing [ZOOM IN] once changes to Zoom 2X, pressing
[ZOOM IN] twice changes to Zoom 4X, while pressing [ZOOM OUT] reverts to
Zoom 2X and no zoom.
7.3.3 Dual Frequency page
To display the Fish Finder Dual Echogram, follow this procedure:
[MODE] more times until the Fish Finder Dual Frequency page is displayed
Fig. 7.3.3 - Fish Finder Dual Frequency mode
The Cursor key
Moving the cursor to the right or the left moves the Variable Depth Marker (VDM)
between the 50 and 200kHz displays. Moving the cursor up or down will move the
VDM up and down. Press [CLEAR] to hide the VDM.
The ZOOM IN and ZOOM OUT keys
From this page pressing [ZOOM IN] once changes to Zoom 2X, pressing [ZOOM
IN] twice changes to Zoom 4X, while pressing [ZOOM OUT] reverts to Zoom 2X
and no zoom.
7.3.4 Zoom page
To display the zoomed Fish Finder page on the left half of the screen and the
unzoomed Fish Finder Echogram on the right half of the screen, follow this
procedure:
Page 75
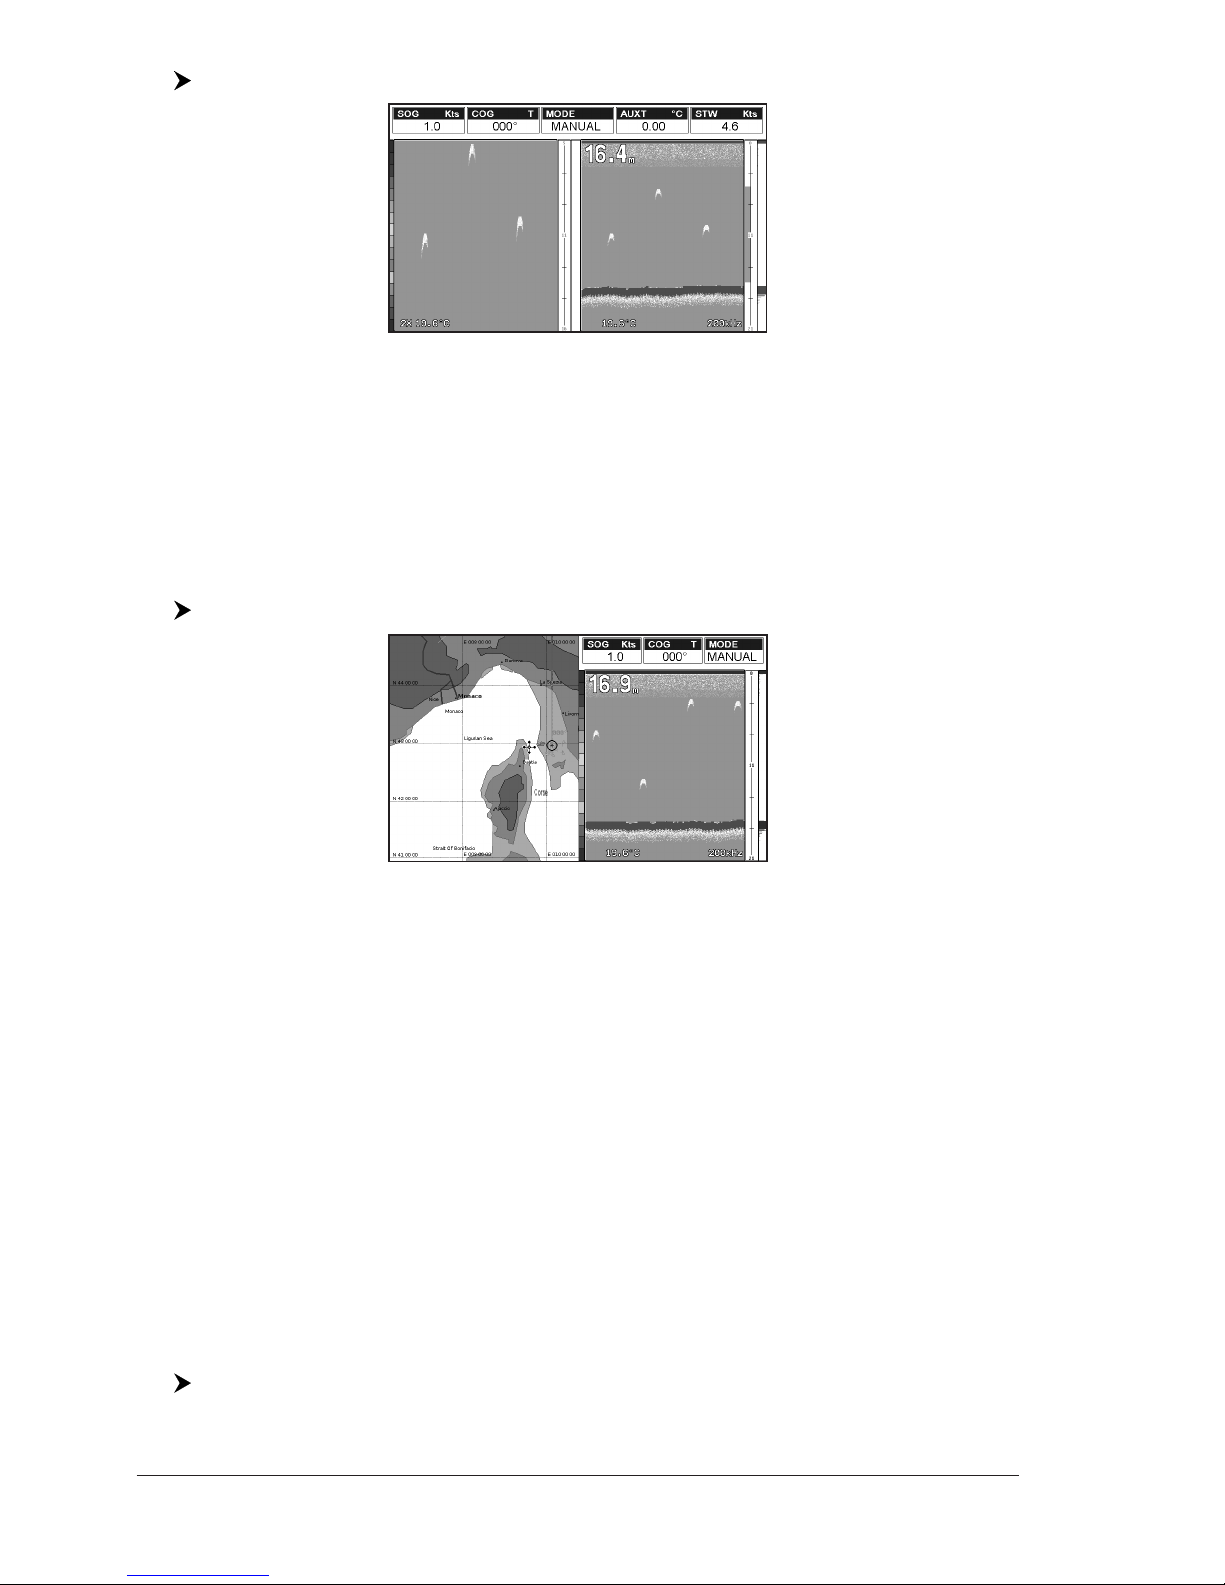
76
User Manual
[MODE] more times until the Fish Finder Zoom page is displayed
Fig. 7.3.4 - Fish Finder Zoom Page
The Depth Cursor is shown only on the unzoomed Fish Finder Echogram.
The ZOOM IN and ZOOM OUT keys
When in this page pressing [ZOOM IN] changes to Zoom 4X, pressing [ZOOM
OUT] changes to Zoom 2X.
7.3.5 Chart/Fish page
To display the Chart page on the left half of the screen and the Fish Finder Echogram on the right half of the screen, follow this procedure:
[MODE] more times until the Fish Finder Chart/Fish page is displayed
Fig. 7.3.5 - Fish Finder Chart/Fish page
The MENU key (to change the active window)
When in Chart/Fish mode pressing [MENU]:
♦ if the focus (the active window) in on the Chart, the Functions menu is
shown. Pressing again [MENU] opens the Fish Finder Setup menu and
moves the focus to the Fish Finder.
♦ if the focus (the active window) in on the Fish Finder, the Fish Finder
Setup menu is shown. Pressing again [MENU] opens the Functions
menu and moves the focus to the Chart.
NOTE When focus is on the Chart page, all keys work in cartography standard mode.
7.3.6 Fish Finder and Radar pages
CAUTION
The following Radar display pages are available only if the Radar is connected
and powered On.
To display the Radar page on the left half of the screen and the Fish Finder
Echogram on the right half of the screen, follow this procedure:
[MODE] more times until the Fish Finder Radar/FF page is displayed
Page 76
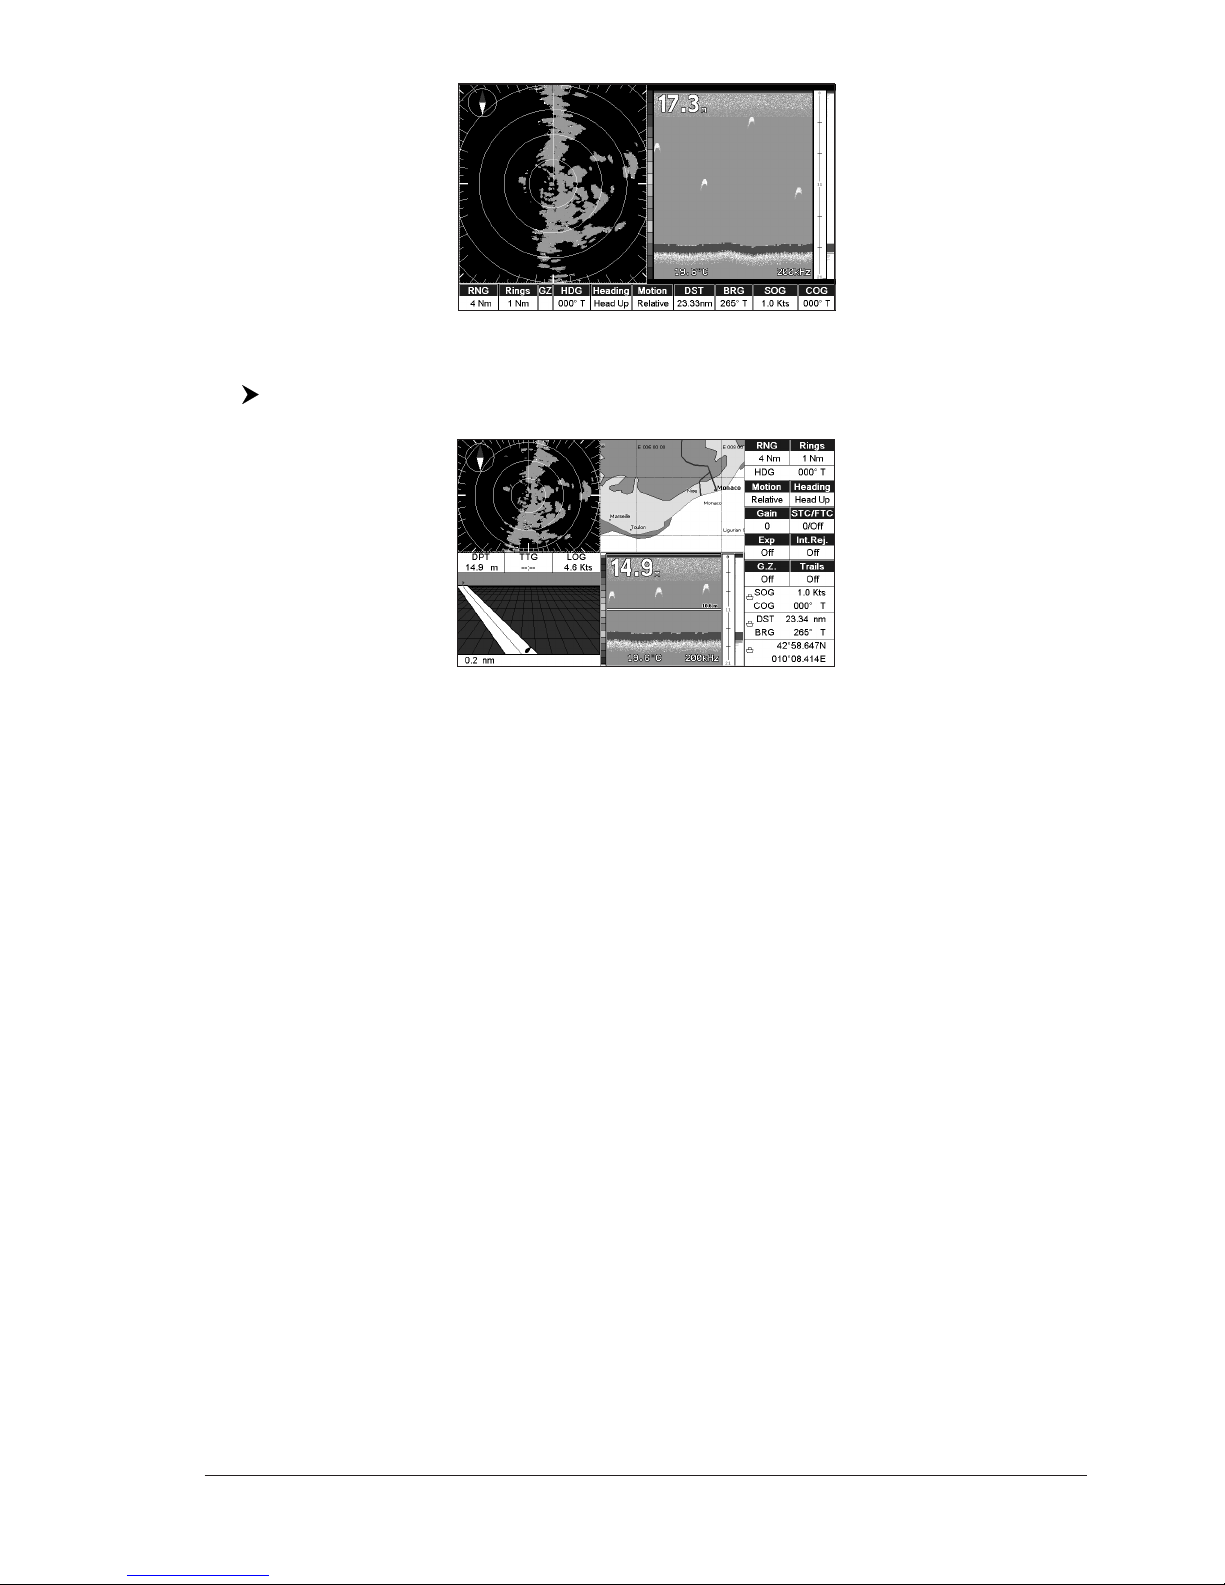
77
User Manual
Fig. 7.3.6 - Radar/FF page
Otherwise to display the Radar and Fish Finder Combo pages, follow this procedure:
[MODE] more times until the Fish Finder Radar/FF/Chart/Nav Data page is
displayed
Fig. 7.3.6a - Radar/FF/Chart/Nav Data page
NOTE The Radar/FF/Chart/Nav Data page is available only if a Target has been set.
When in Split/Combo pages, the active view is highlighted by a focus (Yellow
frame). The keyboard commands are related to that focused view. To move the
focus press [MENU] twice.
7.4 ZOOM MODES
7.4.1 The Bottom Lock Zoom
The Bottom Lock Zoom mode is activated when the Fish Finder is in Auto Range or
Bottom Lock mode (see Par. 7.5.3) and the Variable Depth Marker (VDM) is not
displayed on the screen.
In Bottom Lock Zoom mode the Fish Finder Echogram is automatically moved up/
down as to keep the Bottom Line always visible in the lower half of the screen.
NOTE Moving the Cursor key up/down displays the Variable Depth Marker (VDM)
switching the Fish Finder in Marker Zoom mode.
7.4.2 The Marker Zoom
The Marker Zoom mode is activated either when the Fish Finder is in Manual Range
mode (see Par. 7.5.3) or the Depth Cursor is displayed on the screen.
In Marker Zoom mode the Fish Finder Echogram position is controlled by moving the
Variable Depth Marker (VDM) and pressing and holding [ENTER] for 1 second on the
selected position. Moving the Variable Depth Marker (VDM) over the top or below the
bottom of the screen, automatically moves up/down the current zoomed Echogram
view and re-position the Variable Depth Marker (VDM) at the center of the screen.
NOTE Pressing [CLEAR] hides the Depth Cursor and if the Fish Finder is in Auto
Range or Bottom Lock mode switches into Bottom Lock Zoom mode.
Page 77
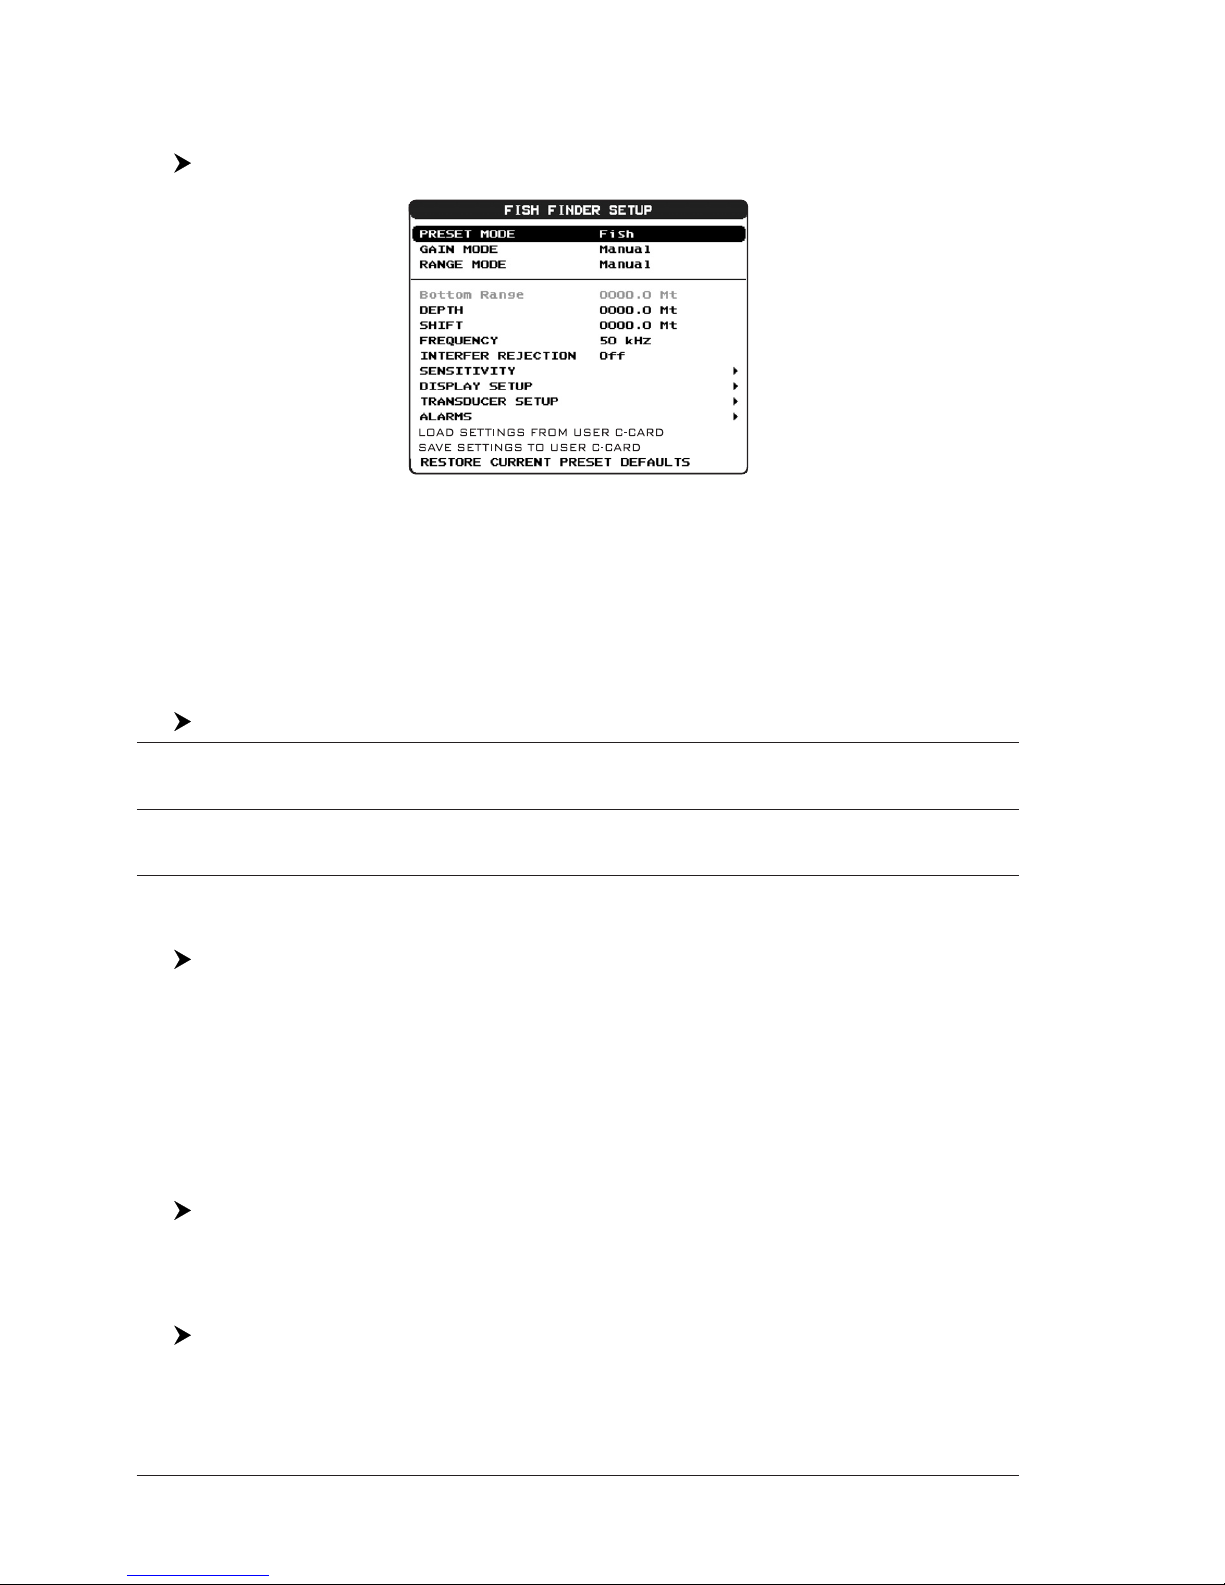
78
User Manual
7.5 FISH FINDER SETUP MENU
The Fish Finder Setup menu provides access to additional functions, setup and
layout/data field options. From the Fish Finder page, access this menu by pressing:
[MENU]
Fig. 7.5 - Fish Finder Setup menu
7.5.1 Preset Mode
Preset modes are pre-defined settings of the Fish Finder operating parameters.
You can use them to quickly set the Fish Finder in the most commonly used
operating modes. These are Cruise (sets the Fish Finder in full auto mode with the
sensitivity settings optimized for displaying at best the bottom) and Fish (sets the
Fish Finder in full auto mode with the sensitivity setting optimized for target
searching). See the following table.
[MENU] + "PRESET MODE" + [ENTER]
Fish : Gain Mode = Auto, Range Mode = Auto, Frequency = do not change, Shift = 0, STC = Short if
Freq=200kHz and Mid if Freq=50kHz, Scrolling Speed = 10, Fish Symbols = Echo, A-Scope = On,
Surface Noise Filter = Off.
Cruise : Gain Mode = Auto, Range Mode = Auto, Frequency = do not change, Shift = 0, STC = Short if
Freq=200kHz and Mid if Freq=50kHz, Scrolling Speed = 10, Fish Symbols = Echo, A-Scope = On,
Surface Noise Filter = 4.
7.5.2 Gain Mode
Selects Auto or Manual.
[MENU] + "GAIN MODE" + [ENTER]
7.5.3 Range Mode
Selects among Manual, Auto Range and Bottom Lock. When in Manual Range
Mode it is possible to set Shift (the offset from the surface) (see Par. 7.5.5) and
Depth (see Par. 7.5.4) on which the Fish Finder shall operate. When in Auto
Range Mode the Fish Finder determines automatically the range as to keep the
bottom visible in the lower left of the screen. In this mode, Shift is always set to
0. In Bottom Lock Mode the Fish Finder automatically tracks the range around
the bottom specified by the Bottom Range value.
[MENU] + "RANGE MODE" + [ENTER]
7.5.4 Depth
This option is available only when Range Mode is Manual and it is disabled in Auto
Range and Bottom Lock Mode.
[MENU] + "DEPTH" + [ENTER]
7.5.5 Shift
This option is available only when Range Mode is Manual and it is disabled in Auto
Page 78
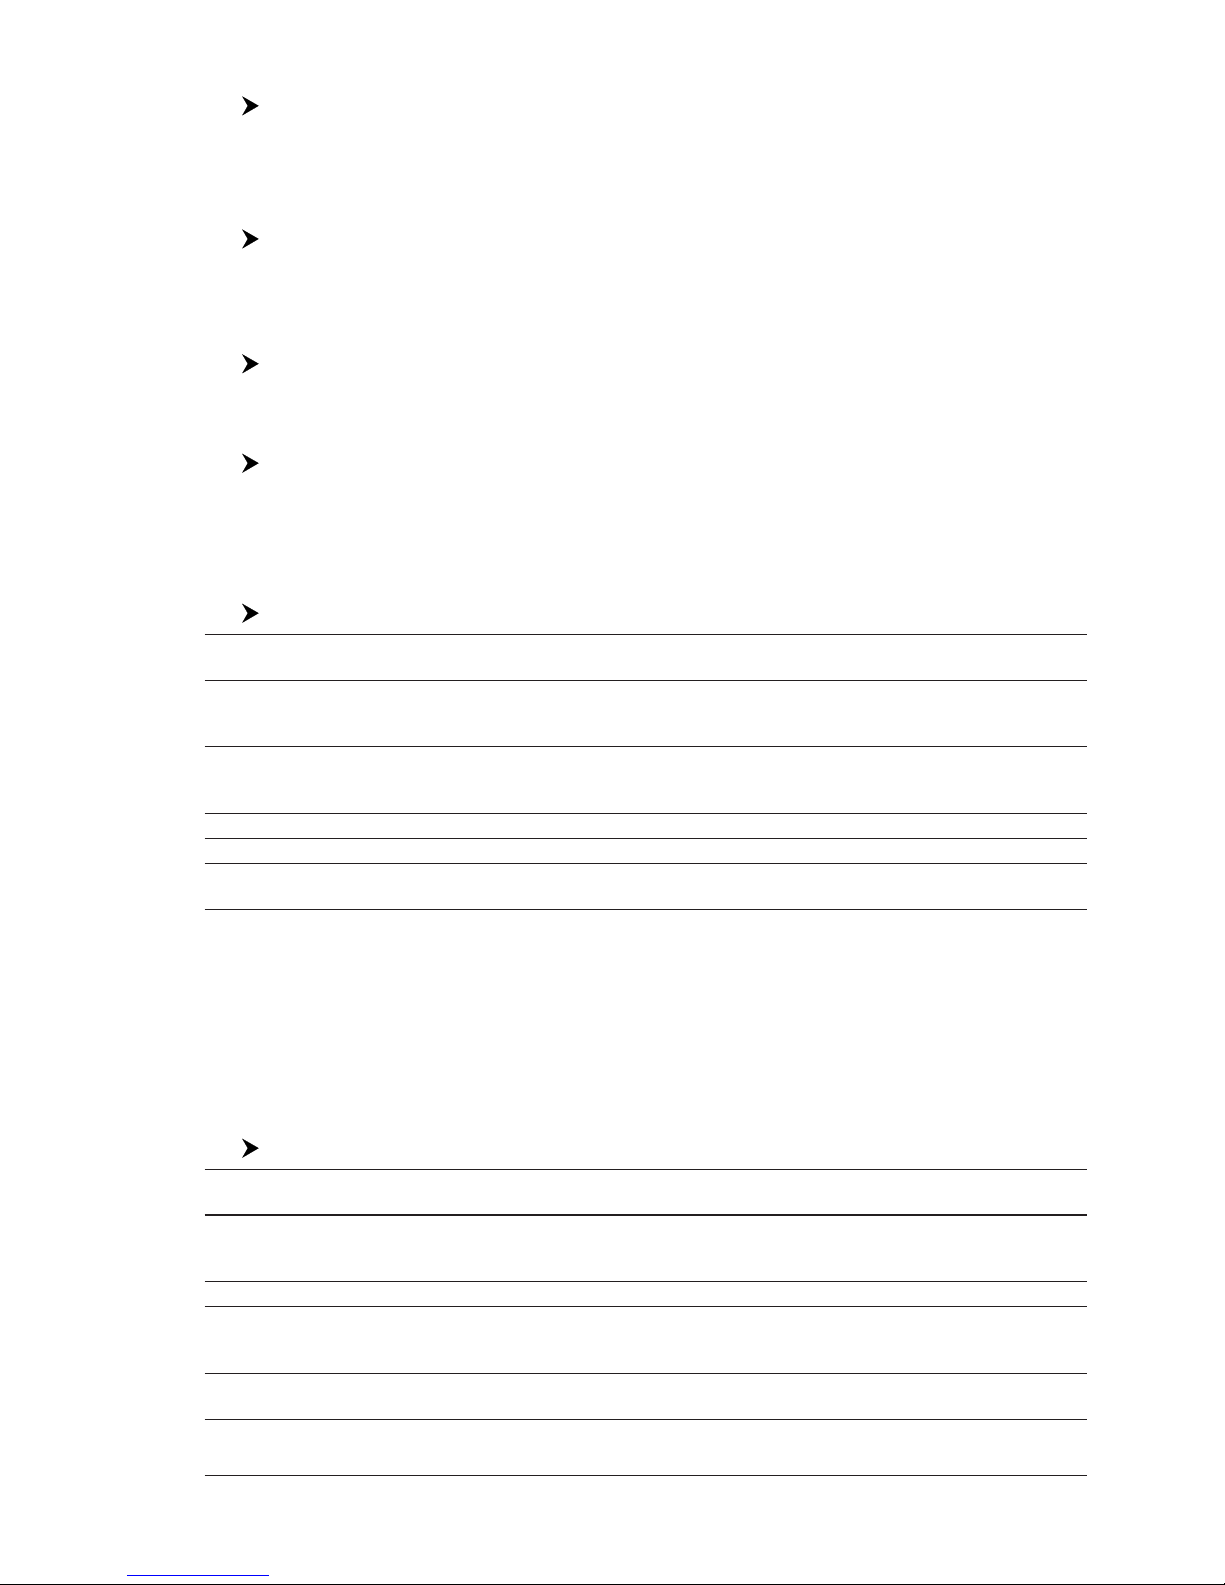
79
User Manual
Range and Bottom Lock Mode.
[MENU] + "SHIFT" + [ENTER]
NOTE The bottom Range, Depth, Shift will apply to the currently selected frequency.
7.5.6 Bottom Range
This option is available when Range Mode is Bottom Lock.
[MENU] + "BOTTOM RANGE" + [ENTER]
7.5.7 Frequency
Allows you to choose the frequency between Auto, 50 kHz or 200 kHz when single
frequency page is selected.
[MENU] + "FREQUENCY" + [ENTER]
7.5.8 Interference Rejection
Selects a filter to remove interference from other Fish Finders.
[MENU] + "INTERFER REJECT" + [ENTER]
7.5.9 Sensitivity Menu
The Sensitivity menu is accessible both from the Fish Finder Setup menu and by
pressing [ENTER] when in Fish Finder pages. All settings in the Sensitivity menu
are related to the Frequency selected.
[MENU] + "SENSITIVITY" + [ENTER]
Frequency
1
: ONLY IN THE DUAL FREQUENCY PAGE Allows you to select the Frequency to which the Sensitivity
parameters are applied.
Gain : Allows you to control the Gain of the unit's receiver. To see more details on the screen, increase
the receiver sensitivity by selecting a higher gain percentage. If there is too much detail or if the
screen is cluttered, lowering the sensitivity may increase the clarity of the display.
STC : Sensitivity Time Constant: it is a time varying gain curve which attenuates the sonar receiver gain
in shallow water, increasing the gain gradually as the depth increases. This is for the purpose of
filtering out surface clutter.
STC Length : If STC is Custom, it is possible to change the Length of the Sensitivity Time Constant.
STC Strenth : If STC is Custom, it is possible to change the Strength of the Sensitivity Time Constant.
Surf Noise Filter
2
: This function implements an advanced time varying filter that allows suppressing the surface
clutter efficiently while leaving fish targets visible.
NOTE1The Frequency value is only displayed: to select the desired frequency see the
previous Par. 7.5.7.
NOTE
2
Thus imposing the capability of the Fish Finder to correctly detect the weakest
echoes coming from a very deep bottom.
7.5.10 Display Setup Menu
The Display Setup Menu allows you to change the color scheme of the Fish Finder
display, adjusts the chart scrolling rate, enables or disables the White Line and
allows determining the graphical representation of fishes.
[MENU] + "DISPLAY SETUP" + [ENTER]
Color Settings : Allows you to change the color scheme of the Fish Finder display. The available colors are Blue
Background, White Background, Black Background, Gray Scale and Reversed Gray Scale.
Scrolling Speed : Adjusts the chart scrolling rate. Note that the scrolling rate is limited by the sound speed and the
depth according with the following relation: the deeper the setting, the slower the scrolling rate.
100% is the maximum possible.
White Line : Controls how the chart plotter displays information about the bottom type (hard or soft).
Fish Symbols : Allows determining the graphical representation of underwater suspended targets: Echo/Echo+Icon/
Echo+Icon+Depth/Echo+Depth/Icon/Icon+Depth. The Fish icons displayed are among four
different shapes depending on the size of the Target (Small, Med, Big, Huge).
Water Temperature: Allows you to choose the Water Temperature label displayed over the echogram between Primary
and External.
Page 79
80
User Manual
7.5.11 Transducer Setup Menu
The Transducer Setup menu contains settings that does not require frequent
changes.
[MENU] + "TRANSDUCER SETUP" + [ENTER]
Keel Offset : It is the transducer depth offset from the surface. This makes it possible to measure
depth from the surface instead of from the transducer's location.
Calibrate Sound Speed : Allows calibrating the value of Sound Speed in the water, depending on the water
temperature and salinity.
Calibrate Water Speed : Allows calibrating the value of Water Speed sensor. The calibration value, in the
range between -10% to +10%, will be applied to the water speed from the transducer.
Calibrate Water Temp : Allows the calibration on the Water Temperature sensor. Using the readings from a
precise temperature measuring device, insert here a positive/negative offset to
display right value on Fish Finder screens.
Calibrate Aux Temp : Allows the calibration of the Aux Temperature sensor. Using the readings from a
precise temperature measuring device, insert here a positive/negative offset to
display right value on FF screens.
Set Defaults Settings : Restores the default values
7.5.12 Alarms Menu
The Alarms menu allows you to define additional sonar alarm settings for Fish
Alarm, Shallow Alarm, Depth Alarm and Temperature Upper/Lower/Rate.
[MENU] + "ALARMS" + [ENTER]
Shallow Alarm : Triggers an alarm when depth becomes shallower than the value set.
Deep Water Alarm : Triggers an alarm when depth becomes deeper than the value set.
Temp Upper : Triggers an alarm when the transducer reports a temperature (from TEMP 1 sensor) above the
value set.
Temp Lower : Triggers an alarm when the transducer reports a temperature (from TEMP 1 sensor) below the
value set.
Temp Rate : Triggers an alarm when the transducer reports a temperature (from TEMP 1 sensor) variation rate
above the value set.
Fish Alarm : The options for Fish Alarm set the size of the fishes that, if detected by the unit, switches an alarm
to sound. These options are: Off, Small, Medium, Big and Huge. The alarm sounds if the set size
(or bigger) is detected.
7.5.13 Load Settings from User C-Card
Load the complete settings from the User CARD and changes the active menu
settings.
[MENU] + "LOAD SETTINGS FROM USER C-CARD" + [ENTER]
7.5.14 Save Settings to User C-Card
This is useful to avoid the user having to retune up Fish Finder after a Clear RAM
operation or a software update.
[MENU] + "SAVE SETTINGS TO USER C-CARD" + [ENTER]
7.5.15 Restore Current Preset Defaults
Restores the default values only for the current presets (see Par. 7.5.1, Preset
Mode) and does not affect the other presets.
[MENU] + "RESTORE CURRENT PRESET DEFAULTS" + [ENTER]
7.6 TRANSDUCERS
The transducer is a device that transmits and receives sound waves into the
water. The active component inside the transducer is commonly referred to as an
element but actually is a piezoelectric ceramic material.
Please refer to your dealer and/or installer to choose your transducer. VDO suggest transducers.
Page 80

81
User Manual
8. Maintenance
This chapter gives information on routine maintenance and problem solving associated with the chart plotter.
8.1 SYSTEM TEST
If you have connected your position-finding device according to the instructions,
and chosen the proper menu selection for your device, and are still having problems with your chart plotter, the extended auto-test should help determine the
problem. Make sure the chart plotter is turned Off. While pressing and holding
any other key, turn the chart plotter On. A new menu will appear on the display.
Use the cursor key to select the desired test: this will display in reverse video. To
choose the test press [ENTER]. To exit from any submenu press [CLEAR]. To
exit from the System Test turn Off the chart plotter.
RAM Menu
RAM Test: Verifies the integrity of the RAM chips. If on the screen the message
"ERROR" appears, the RAM is physically damaged.
RAM Clear: Clears internal memory. If the chart plotter exhibits unusual behaviour, or appears to be malfunctioning, it may be possible to correct the problem
by clearing RAM. This operation will erase all Marks, Routes, stored Track plots
and destinations. It will also return all selections (Input Data Format, Autopilot
selection, etc.) to original default values. Before this step, you have the option of
saving user Marks, Track history and Routes to a User C-CARD (this is an optional
purchase from your dealer). To confirm to clear RAM press [ENTER] again (but if
this time you do not wish to clear RAM press [CLEAR]).
DIM Menu
Contrast: Each time you press the cursor key to right, the screen will decrease
brightness, when you press the left key the brightness will increase.
Backlight: Sets the backlight. It operates in similar mode as Contrast.
Cartridges
Background ROM: Tests the WorldWide Background.
C-CARD Test: Tests the C-CARD. There are four possible situations:
♦ If there is a C-CARD inserted in the slot and there is not a malfunction,
the name of the C-CARD zone and the message "OK" are shown
♦ If there is a C-CARD inserted in the slot, but it is damaged C-CARD, the
name of the C-CARD zone and/or the message "Faulty" are shown
♦ If there is not any C-CARD inserted in the slot, the message "not present"
is shown
♦ If there is a User C-CARD inserted in the slot, the message "USER
C-CARD" is shown
C-CARD Connector: While a C-CARD is inserted in the slot, if the counter increases, there is a malfunction reading it.
Page 81

82
User Manual
Serial Ports
Change parameters: Changes the parameters of the serial interface. This menu
allows to select the Port (Signal Source), the Baud Rate, the Data Bits (Word
Length) between 7 or 8, the Parity between even, odd or none, the Stop Bits
between 1 or 2.
Input Data Display: Allows the chart plotter to act as a computer terminal and
display the incoming data exactly as it is received. If the data displayed on the
screen is unrecognizable, you may have selected the wrong input parameters for
your particular receiver. Check your receiver manual to be sure that you have
selected the proper interface format. If the screen is blank, the connection may
be interrupted, and no data is being received. Use [ZOOM IN] to stop (or continue after pause) data displaying, [ENTER] to show data in hex or ASCII mode
(normal or small) and [CLEAR] to exit.
Modem test
Checks the Modem connections. Press [ENTER] to select the desired Port related
to the connections made, to the Port to which the Modem C-COM is connected.
External Alarm
Checks the External Alarm.
MAP 11csE Plus GPS:
Engine Menu
The transfer of the operating hours is handled differently by different engines.
Some engines transmit the operating hours – and all other engine data too – at
specific intervals of time. Others transmit the operating hours only on request. To
ensure that the plotter sends this request regularly, the ‘Engine Hours Request’
must be switched to ON.
Page 82

83
User Manual
9. Terms
♦ ALT = Altitude
Altitude of GPS Antenna on the medium sea level.
♦ Alter = Alternate Solution (TD Coordinates System)
Parameter selected by the user that is applied in the conversion of TD values
to geographical coordinates Lat/Lon. It defines which of the two possible solutions can be used.
♦ Arrival Time
Estimated time of day you will reach your destination, based on your current
Speed and Track from GPS.
♦ ASF = Additional Secondary phase Factor (TD Coordinates System)
Correction to TD values which can be inserted by the user.
♦ Azimuth
Angular measurement from the horizon to a satellite or another object.
♦ AWD = Apparent Wind Direction
Direction from which the Wind appears to blow relative to a moving point (also
called Relative Wind Direction).
♦ AWS = Apparent Wind Speed
Speed at which the Wind appears to blow relative to a moving point (also
called Relative Wind Speed).
♦ Beacon
A prominent, specially constructed object forming a conspicuous vertical mark
as a fixed aid to navigation.
♦ Boost Pressure
Boost pressure in boosted engine.
♦ Buoy
Floating object moored to the sea bottom in a particular (charted) place, as an
aid to navigation.
♦ Buoys and Beacons
Used to indicate to mariners recommended or established routes, underwater
dangers, restrictions and regulations.
♦ BRG = Bearing
Angle between the North (True or Magnetic) and a destination. The horizontal
direction of one terrestrial point from another referring to the North (True or
Magnetic). It is often used to indicate the direction to follow to reach the
destination.
♦ CAN (Controller Area Network)
Standardized interface for engine data. CAN SAE J1939 is used.
♦ Chain (Loran-C GRI)
Loran chains are groups of transmitting stations that use timed radio pulse
transmissions. In each of these chains there is a master station and two or
more slave or secondary stations. Stations belonging to a same chain transmit
pulses in timing groups: a different time base identifies each chain. The time
base of each chain is the Group Repetition Interval or GRI. This GRI identifies
the chain in unique mode. For example the GRI = 4990 identifies the chain of
Central Pacific zone.
Page 83

84
User Manual
♦ COG = Course Over Ground
Direction of the path over ground actually followed by a vessel.
♦ CTS = Course To Steer
Optimum direction the boat should be steered in order to efficiently make
headway back to the course line while also proceeding toward the destination
Waypoint.
♦ Cultural Features
Any man-made topographic feature as built-up area, buildings, roads.
♦ Datum
Latitude and Longitude lines printed on any map are based on certain models
of the shape of the earth: these models are called Datum or Coordinate Systems. There are many different Datum in use, each one gives different Lat/
Lon positions for an identical point on the surface of the earth.
♦ Dead Reckoning
Procedure to determine the current position of a vessel by applying to the last
known position the way that has been made (since the last known position
was received). This procedure is normally based on the last received GPS
position, Speed and Course or to the last received GPS position, Log Speed
and Heading.
♦ Default
Indicates the original factory setting for any menu selection. The default values are set after a Master Reset (RAM Clear).
♦ Depth Areas
Sea areas included in the user selectable range of minimum and maximum
depth limits. The sea area that is beyond the selected range is filled by an
uniform white color, the sea area that is inside the selected range is filled by
ordinary multicolor shading. The Spot Soundings and Depth Contours are displayed on the range only.
♦ Depth Line
(Also called Bathymetric Line) Imaginary line connecting points of equal water
depth.
♦ Destination
In order to tag on the chart the point, towards which the ship is Heading, you
can use a special mark, called destination. When the destination is placed, all
navigation data referred to this point.
♦ DGPS = Differential GPS
Provides even greater positioning accuracy than standard GPS.
♦ DPT = Depth from Transducer
Water Depth below the Transducer. Distance from the Depth Transducer to the
ground.
♦ DST = Distance
Geographical distance between two points on the map.
♦ Easy Link
VDO-specific interface to actuate slave indicators.
♦ EBL = Electronic Bearing Line
EBL is a dotted line: the origin of the line is the ship's or cursor position.
♦ Engine Speed
Engine’s rotational speed
♦ ETA = Estimated Time of Arrival
Predicted time of reaching a destination or Waypoint.
♦ Exhaust Gas Temperature
Exhaust gas temperature after the turbocharger.
♦ File
Collection of information (of the same type) stored on a User C-CARD. Each
Page 84

85
User Manual
file must have a unique name, ideally one that describes its contents. Filenames
are kept in a directory on each User C-CARD.
♦ Fix
Current position of the vessel provided by the GPS (connected to the chart
plotter or built-in) or other positioning systems.
♦ Fix Status
Indicates the quality of the position fix signal.
♦ Fuel Rate
Engine’s current momentary fuel consumption.
♦ GNSS = Global Navigation Satellite System
Name used to indicate any single or combined navigation system based on
satellites. The current available satellites systems are: GPS, GLONASS and the
combined GPS and GLONASS.
♦ Goto
Defines the destination point and activates the navigation to it. The destination can be placed on any location of the map, an existing Mark point or on a
pre-defined Route.
♦ GPS = Global Positioning System
Satellite based navigation system operated by the US Department of Defence.
It gives the navigator a position 24 hours a day, 365 days a year under any
weather conditions.
♦ HDG = Heading
Horizontal direction in which a ship actually points or heads in any moment
(see also COG).
♦ HDOP = Horizontal Dilution Of Precision
Parameter indicating the precision of the positioning system (GPS). The smaller
HDOP value indicates higher position accurately.
♦ Home mode
All operations refer to the ship's position.
♦ Intake Manifold Temperature
Intake air temperature.
♦ Landmarks
Landmarks are any prominent object such as monument, building, silo, tower,
mast, ..., on land which can be used in determining a location or a direction.
♦ Latitude
Angular distance North or South of the equator measured by lines encircling
the earth parallel to the equator in degrees from 0° to 90°.
♦ LAT/LON
Coordinate system using Latitude and Longitude coordinates to define a position on earth.
♦ Lat/Lon Grid
Grid of parallels (of Latitude) and meridians (of Longitude) drawn on the map.
♦ LOG Speed
Speed of the vessel relative to the water, provided by an instrument with a submerged transducer for measuring the distance/speed travelled by the vessel.
♦ Longitude
Angular distance East or West of the prime meridian (Greenwich meridian) as
measured by lines perpendicular to the parallels and converging at the poles
from 0° to 180°.
♦ Loran
Positioning system which determines the current position of the vessel by
measuring the difference in the times of reception of synchronized radio pulse
signals transmitted by two or more fixed stations.
Page 85
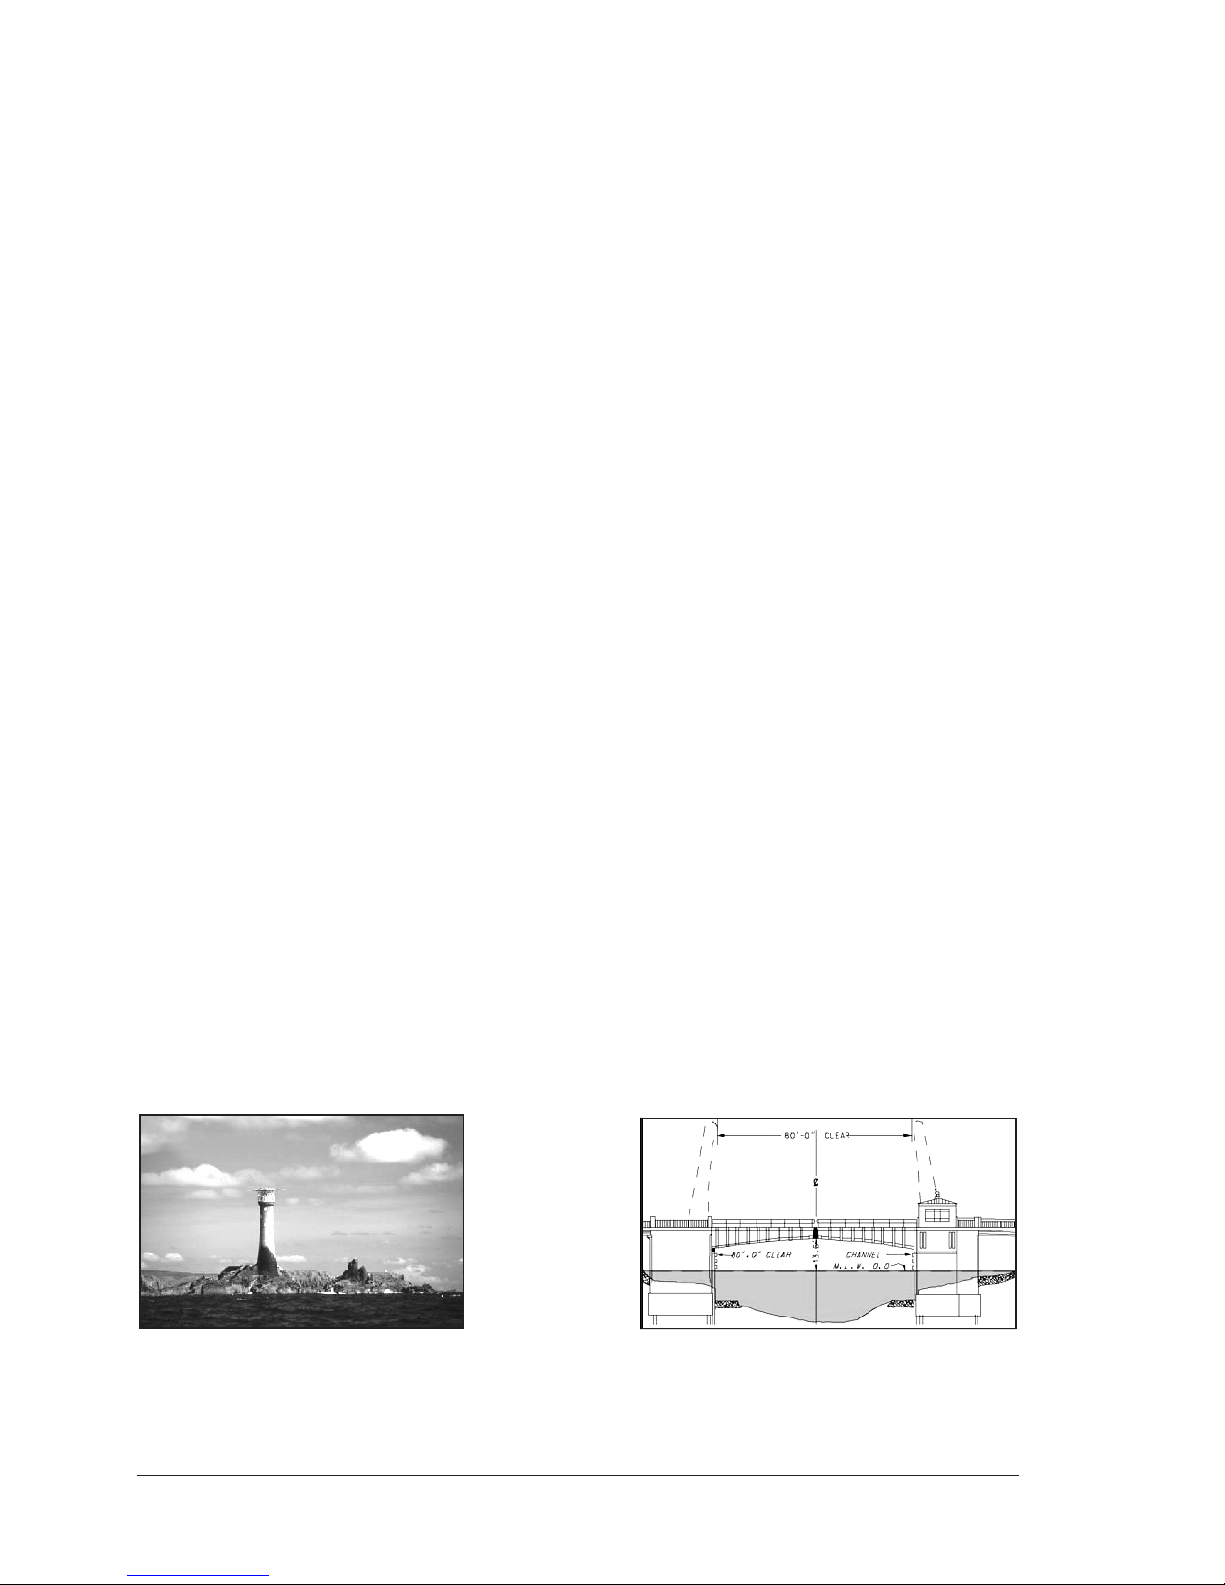
86
User Manual
♦ Magnetic Deviation
Value, expressed in degrees East or West that indicates the direction in which
the north indicator on the compass card is offset from the magnetic north (the
difference expressed in degrees East or West between the compass north and
the magnetic north).
♦ Magnetic Variation
Angle between the magnetic and geographic meridians at any place, expressed
in degrees West or East to indicate the direction of magnetic North from true
North. It changes from point to point, and (at the same point) with time.
♦ Mark
Reference point related to cursor position. Typically it represents by an icon
and label under Mark.
♦ Natural Features
Any topographic feature formed by the action of natural processes: coastlines,
relief, glaciers.
♦ Navigate mode
Operating mode (called also Home mode): all operations refer to the ship's
position. Navigate or Navigation mode is also used to indicate that the destination is placed.
♦ NMEA-0183
The NMEA-0183 Data Interface Standard was developed by the National Marine Electronics Association of America. It is an international standard that
enables equipment from many different manufactures to be connected together and share information.
♦ OSGB = Ordinance Survey of Great Britain
Coordinate system describing only Great Britain charts. Generally used with
GBR36 datum, which also describes only Great Britain charts. This coordinate
system cannot be used in any other part of the world.
♦ Pair
Two selectable secondary stations, of a Loran-C chain, which are used to calculate the TD (Time Difference) position of a point in the map area covered by
the selected Loran-C chain.
♦ Percent Load
Percentage load on the engine at a particular speed.
♦ Pictures & Diagrams
The MAX data format allows assigning one or more image to any cartographic object.
These Pictures are typically used to facilitate the identification of cartographic objects
or places around the map: they can be the landscape layout nearby a harbour, the
shape of a bridge or of a buoy etc. On some objects, such as bridges, the image
associated can represent the Diagram representing the shape of the objects and the
various characteristics (length, height, type of bridge etc.).
Fig. 9 - Pictures and Diagrams
♦ Port Info
Combination of a Port Info database containing all the relevant Safety and
Page 86

87
User Manual
Navigational information normally found in good pilot books and a presentation software which displays special Port Facility Symbols.
♦ Ports & Services
Areas along shore with facilities for mooring, downloading and uploading of
ships, generally sheltered from waves and winds. Port installations are piers,
wharves, pontoons, dry docks, cranes... .
♦ Route
Sequence of Waypoints connected by segments (Route Legs). Among the available Routes, only one is the Active Route, which is shown by a straight line and
arrows to indicate the direction.
♦ RTCM = Radio Technical Commission for Maritime Services
The data format created by the Radio Technical Commission Maritime to transmit Differential GPS corrections.
♦ Scale
Magnitude of the reference scale expressed in the actual unit of measure and
the current Map Datum.
♦ SNR = Signal to Noise Ratio
Ratio between the magnitude of a radio signal and the magnitude of the noise
(that is, the interferences). The SRN is expressed in decibels and it is associated to the GPS satellites signal quality.
♦ SOG = Speed Over Ground
Current velocity at which the vessel is travelling, relative to a ground location.
The SOG is normally provided by the GPS sensor.
♦ SPD = Speed Through Water
Speed of the vessel relative to the water.
♦ Spot Soundings
Depth of the water in a specific and charted position. It is represented on the
map by its own value expressed in the current depth unit.
♦ STR = Steering
Difference between COG and CTS. If COG is 25° and CTS is 30°, then STR is
5° Right.
♦ Total Engine Hours
Total operating hours of the machine. This value is not calculated in the plotter, but read from the machine.
♦ TD = Time Difference
Loran positions are determined by precise timing of the intervals between
reception of pulses transmitted by pairs of stations in the selected chain. Between any two stations a ship must be located somewhere along a line of
possible positions where the measured Time Difference, TD, between arrival
of pulses from those stations would be observed. The TD is measured from
the time of reception of the master station signal to the time of reception of
the slave station signal (see also Pair).
♦ Tide
Periodic rise and fall of the surface of oceans, bays, etc., due principally to the
gravitational interactions between the Moon and Earth.
♦ Tracks & Routes
Recommended and established routes for ships at sea, including traffic separation schemes, deep water routes.
♦ TRN = Turning
The difference between COG and BRG. If COG is 80° and BRG is 75°, TRN is 5°
Left.
♦ TTG = Time To Go
Estimated time needed to reach your destination, based on your current speed
and the distance to destination.
Page 87

88
User Manual
♦ Turbocharger Turbine Inlet Temperature
Exhaust gas temperature before the turbocharger.
♦ TWD = True Wind Direction
Direction of the Wind relative to a fixed point on the earth.
♦ TWS = True Wind Speed
Velocity of the Wind relative to a fixed point on the earth.
♦ Underwater Objects
Objects like obstruction, wreck, cable…
♦ User Point
Object you place on the chart identified by its coordinates and displayed on
the screen with a reference symbol (see Mark, Waypoint).
♦ UTC = Universal Time Coordinated
Time scale based on the rotation of the earth that is used by most broadcast
time services.
♦ UTM = Universal Transverse Mercator
Metric Grid system used on most large and intermediate scale land topographic charts and maps.
♦ Variation
Angle between the magnetic and geographic meridians at any place, expressed
in degrees West or East to indicate the direction of magnetic North from true
North. It changes from point to point, and (at the same point) with time.
♦ VMG= Velocity Made Good
Destination closing Velocity. The VMG is calculated using the current speed of
the vessel (SOG) and the difference between the current vessel course and
the bearing to the destination.
♦ VRM= Variable Range Marker
VRM is a circle and its radius is determined by the user. The circle's center is
the ship's or cursor position.
♦ WAAS = Wide Area Augmentation System
The Federal Aviation Administration (FAA), in cooperation with other DOT organizations and DOD, is augmenting the GPS/SPS with a satellite-based augmentation system, the WAAS. It will provide a signal-in-space to WAAS users to
support en route through precision approach navigation. After achieving initial
operational capability, the WAAS will then be incrementally improved over the
next years to expand the area of coverage, increase the availability of precision
approaches, increase signal redundancy and reduce operational restrictions.
♦ Waypoint
Any point to which one intends to navigate. A sequence of Waypoints makes
up a Route plan.
♦ WGS-84 = World Geodetic System 1984
Coordinates System or Datum developed by the Defence Mapping Agency
(DMA). It is the default geodetic Datum used by the chart plotter and the GPS.
♦ Zoom-In
Shows more detail in a smaller area.
♦ Zoom-Out
Operates similarly to zoom -in, but in the reverse, showing a wider but less
detailed view.
♦ XTE = Cross Track Error
Distance from the ship's present position to the closest point on a line between
the origin and destinations Waypoints of the navigation.
Page 88
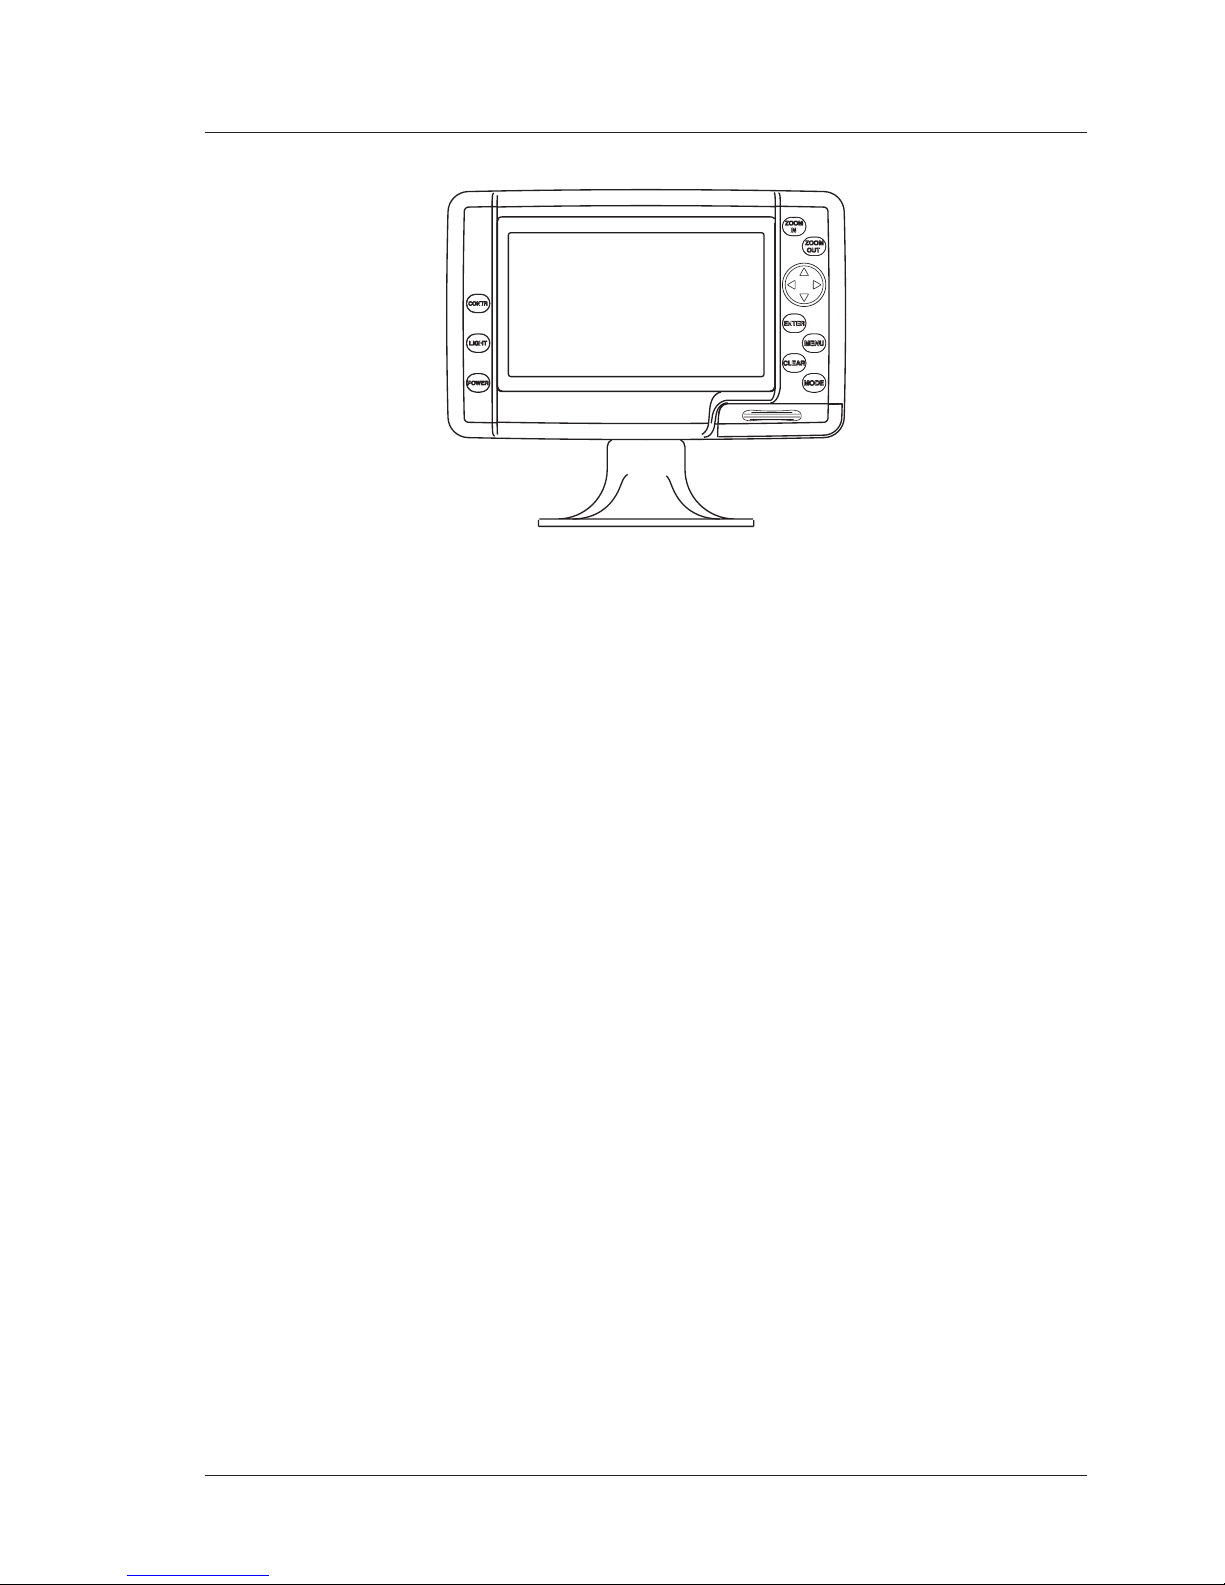
89
User Manual
MAP 7w & MAP 7wi Plus GPS
FEATURES & FUNCTIONS
♦ Direct sunlight viewable color LCD 16/9 display
♦ Worldwide Built-in Cartography showing C-MAP BY JEPPESEN detail up to
2.0 NM
♦ "C-MAP BY JEPPESEN" MAX electronic charts, object-oriented chart sys-
tem with enhanced functionality including:
Guardian alarm, Safety toolbar, Safety route check
Perspective view
Satellite image coverage
Turbo and Smooth Zoom
Multilanguage
Enhanced Port information database
Tides & Currents data
Photos & Diagrams
Automatic information on all chart objects
Search function for ports, tidal information, serrvice facilities
♦ Positional information from GPS
♦ GPS Signal Status page
♦ Navigation Data pages
♦ 1000 Waypoints/Marks and 20 Routes (51 Waypoints max per Route)
♦ Create, Move, Insert, Edit or Erase Waypoint
♦ Create, Move, Edit or Erase Mark
♦ Automatic Info on User Points
♦ Navigation to Destination
♦ Create, Save, Name, Edit or Follow a Route
♦ Route Data Report and User Points (Marks/Waypoints) List pages
♦ Find Ports Services, Port By Name, Port By Distance, Tide Stations, Lakes
By Name, Lakes Information, POIs, Wrecks, Obstructions, Coordinates
♦ Display vessel's position, direction and Track
♦ Alarms Handling
♦ Man OverBoard (MOB) to navigate back to a missing person or object
♦ Simulation Mode with cursor control
♦ Video Input option
Page 89
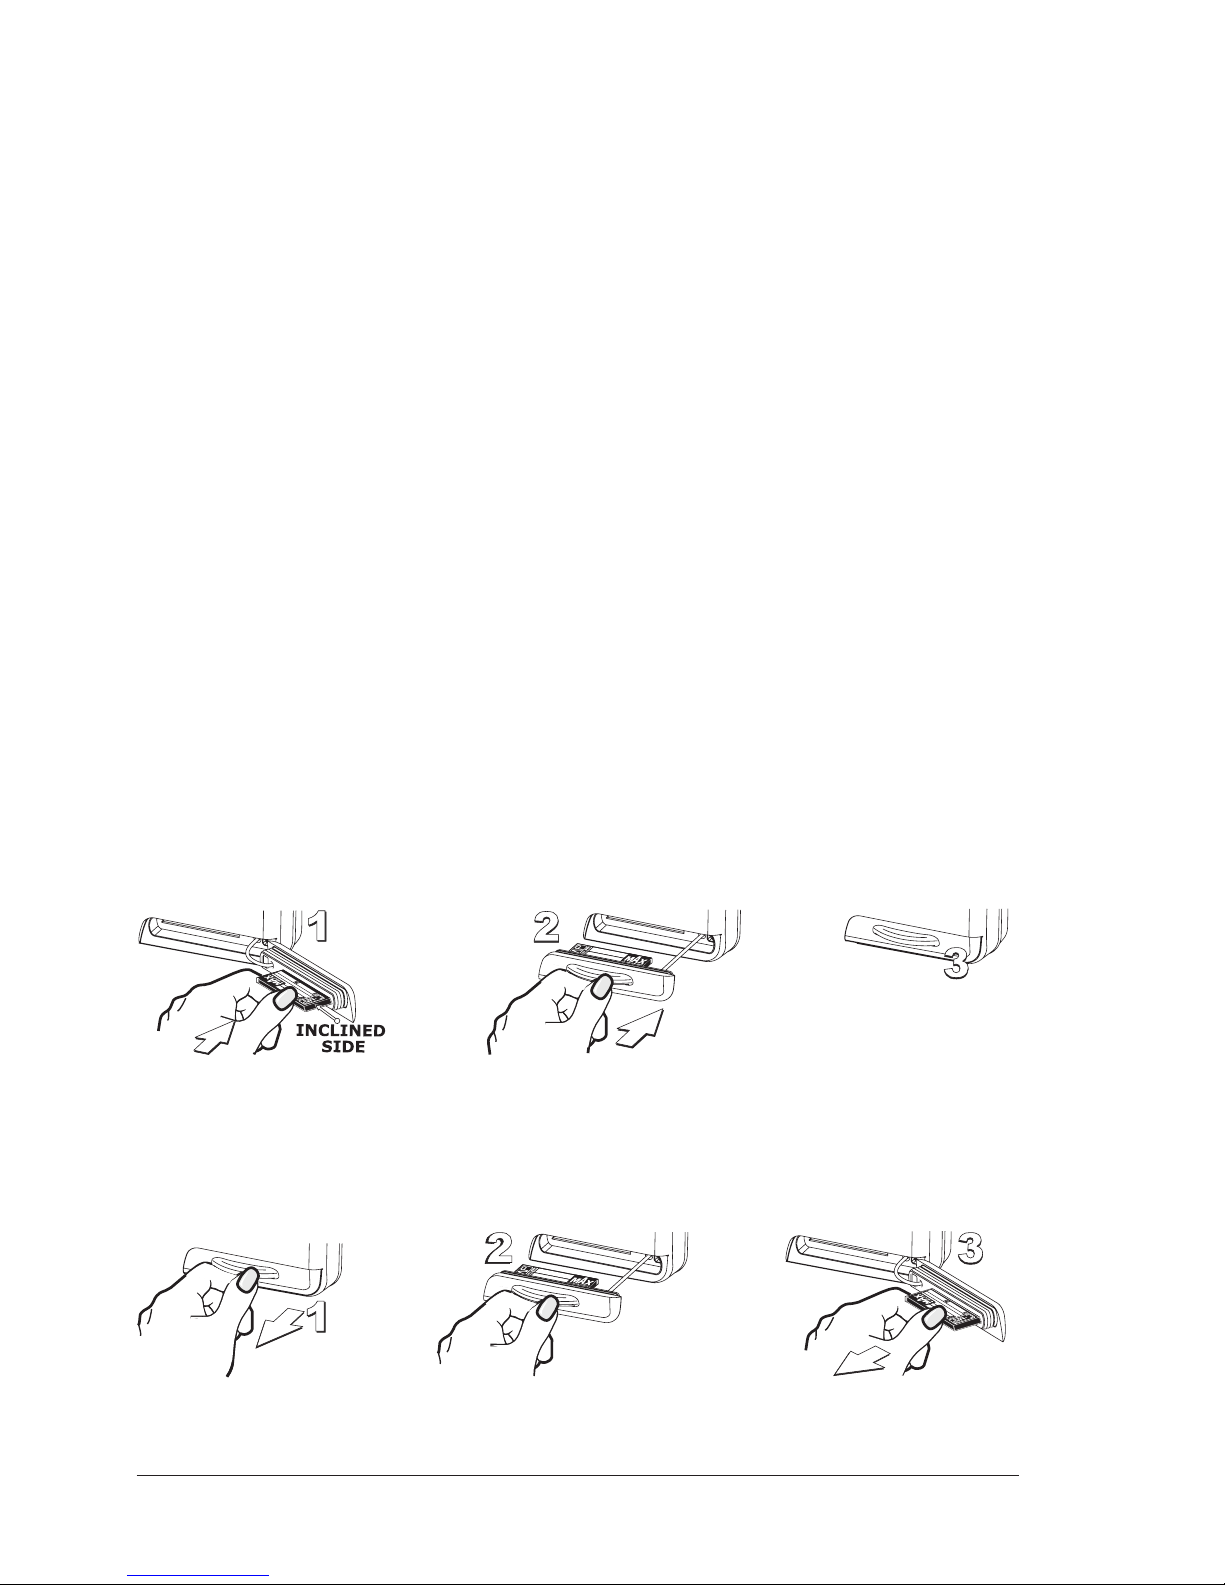
90
User Manual
TECHNICAL SPECIFICATIONS
♦ Operating Voltage : 10 - 35 Volt dc
♦ Power consumption : 11 W max
♦ Interface : NMEA-0183
♦ Autopilot Interface : NMEA-0180, NMEA-0180/CDX, NMEA-0183
♦ Display : Color Sunlight Viewable LCD (active area 7")
♦ Display Resolution : 800 x 480 pixels
♦ Cartography : C-MAP BY JEPPESEN C-CARD
♦ Operating temperature range: 0/+55°C (32/+131°F)
♦ Memory : Non volatile
♦ Keyboard : Silicon rubber, backlight
♦ Weight : 1,1 kg
When the package containing the chart plotter is first opened, please check it for
the following contents (if any parts are missing contact the dealer the chart plotter was purchased from):
♦ "Quick disconnect" bracket and its protective cover
♦ Chart plotter's protective cover
♦ Fuse 2 Amp. + fuseholder
♦ MAP 7w Plus GPS Flush mounting kit
♦ MAP 7w Plus GPS Smart DGPS WAAS Receiver with cable 15 mt/45 feet
♦ User Manual
INSERTING/REMOVING PROCEDURE
Inserting the C-CARD
Open the door, hold the C-CARD by the long side so that you can see the label and
gently push the C-CARD into the door slot (1). Close the door pushing the C-CARD
in as far as it will go to hold fixed into the chart plotter slot (2). When finished the
door must be right closed (3).
Removing the C-CARD
To remove the C-CARD inserted in the chart plotter open the door (1). The C-CARD
will eject out of the chart plotter slot remaining fixed into the door (2). Then
remove the C-CARD from the slot (3).
Page 90
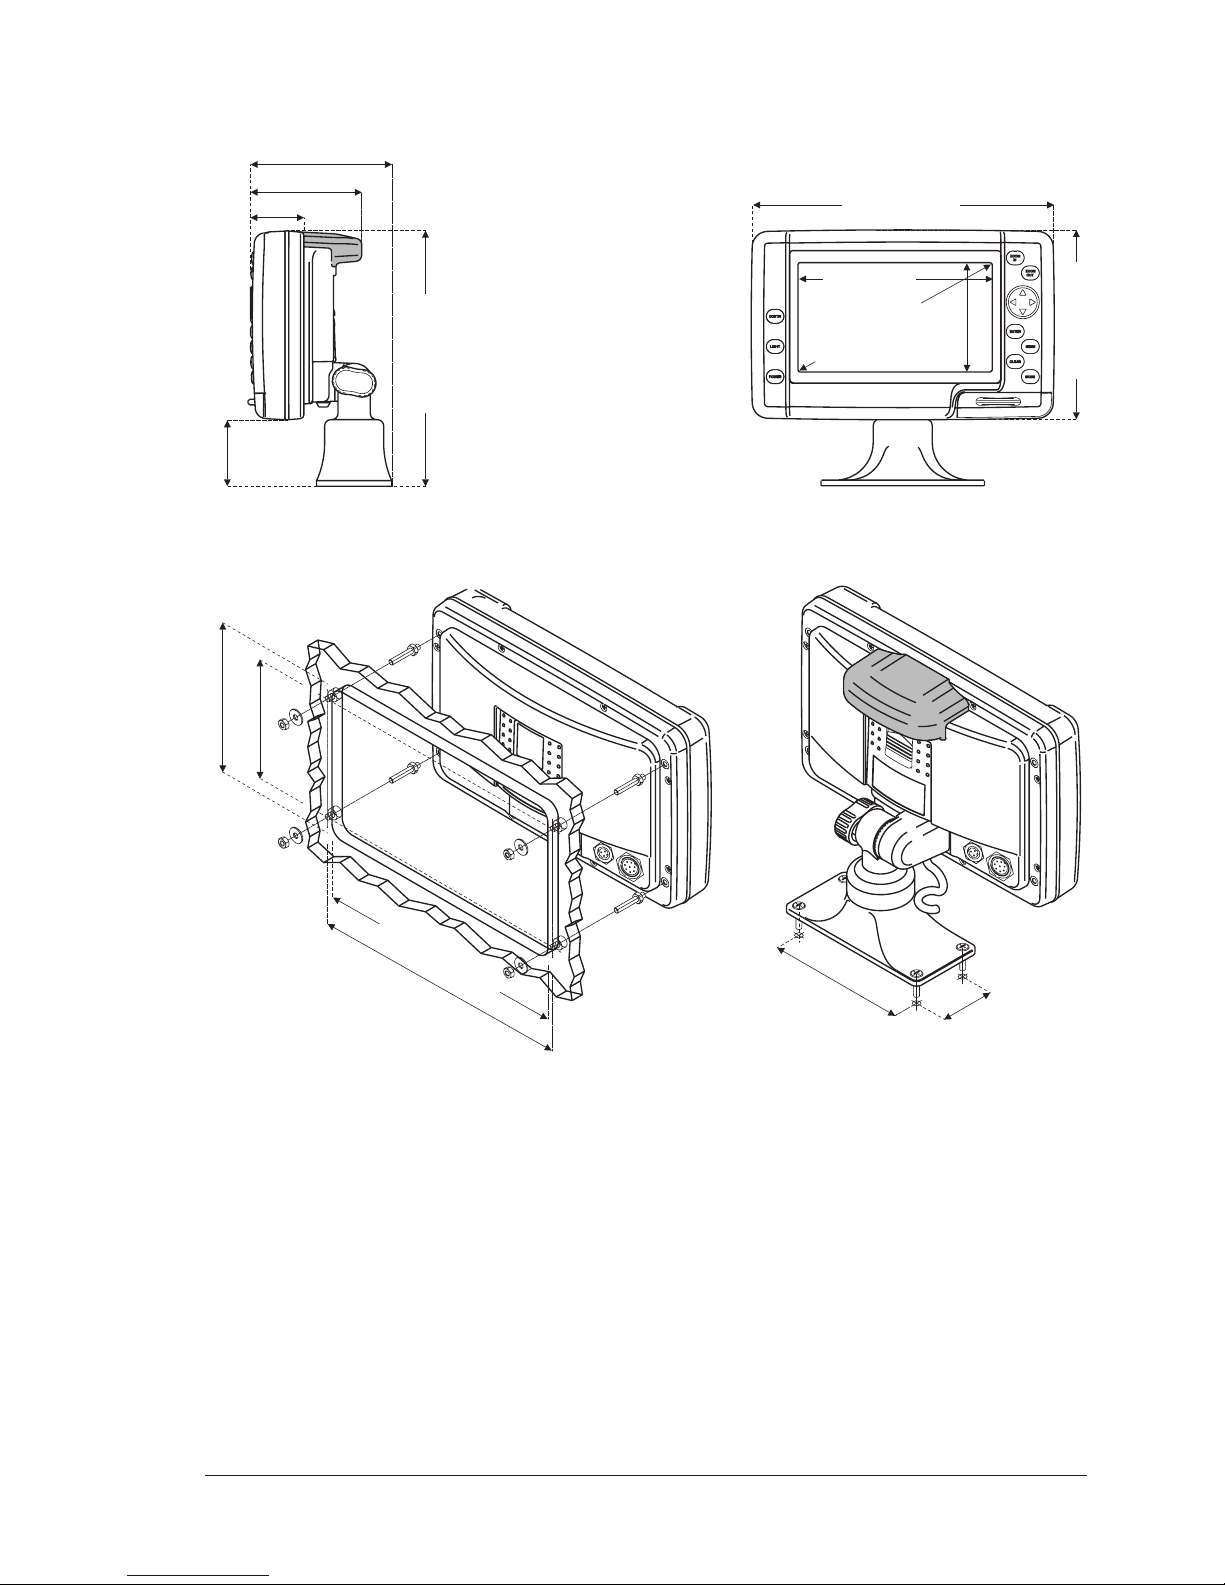
91
User Manual
CHART PLOTTER DIMENSIONS
GRAY parts are present ONLY on chart plotter WITH GPSINTERNAL
52.5mm [2.1”]
42.5mm [1.7”]
88.5mm [3.5”]
112.5mm [4.4”]
203.5mm [8”]
92mm
[3.6”]
151mm [5.9”]
241mm [9.5”]
153mm [6”]
177.8mm [7”]
INSTALLATION AND REMOVING
115mm [4.5”]
45mm[1.8”]
100mm [3.9”]
126mm [5”]
220mm [8.7”]
211mm [8.3”]
GRAY parts are present ONLY on chart plotter WITH GPSINTERNAL
MAP 7w Plus GPS flush installation and MAP 7w Plus GPS/MAP 7wi Plus GPS bracket installation
Page 91
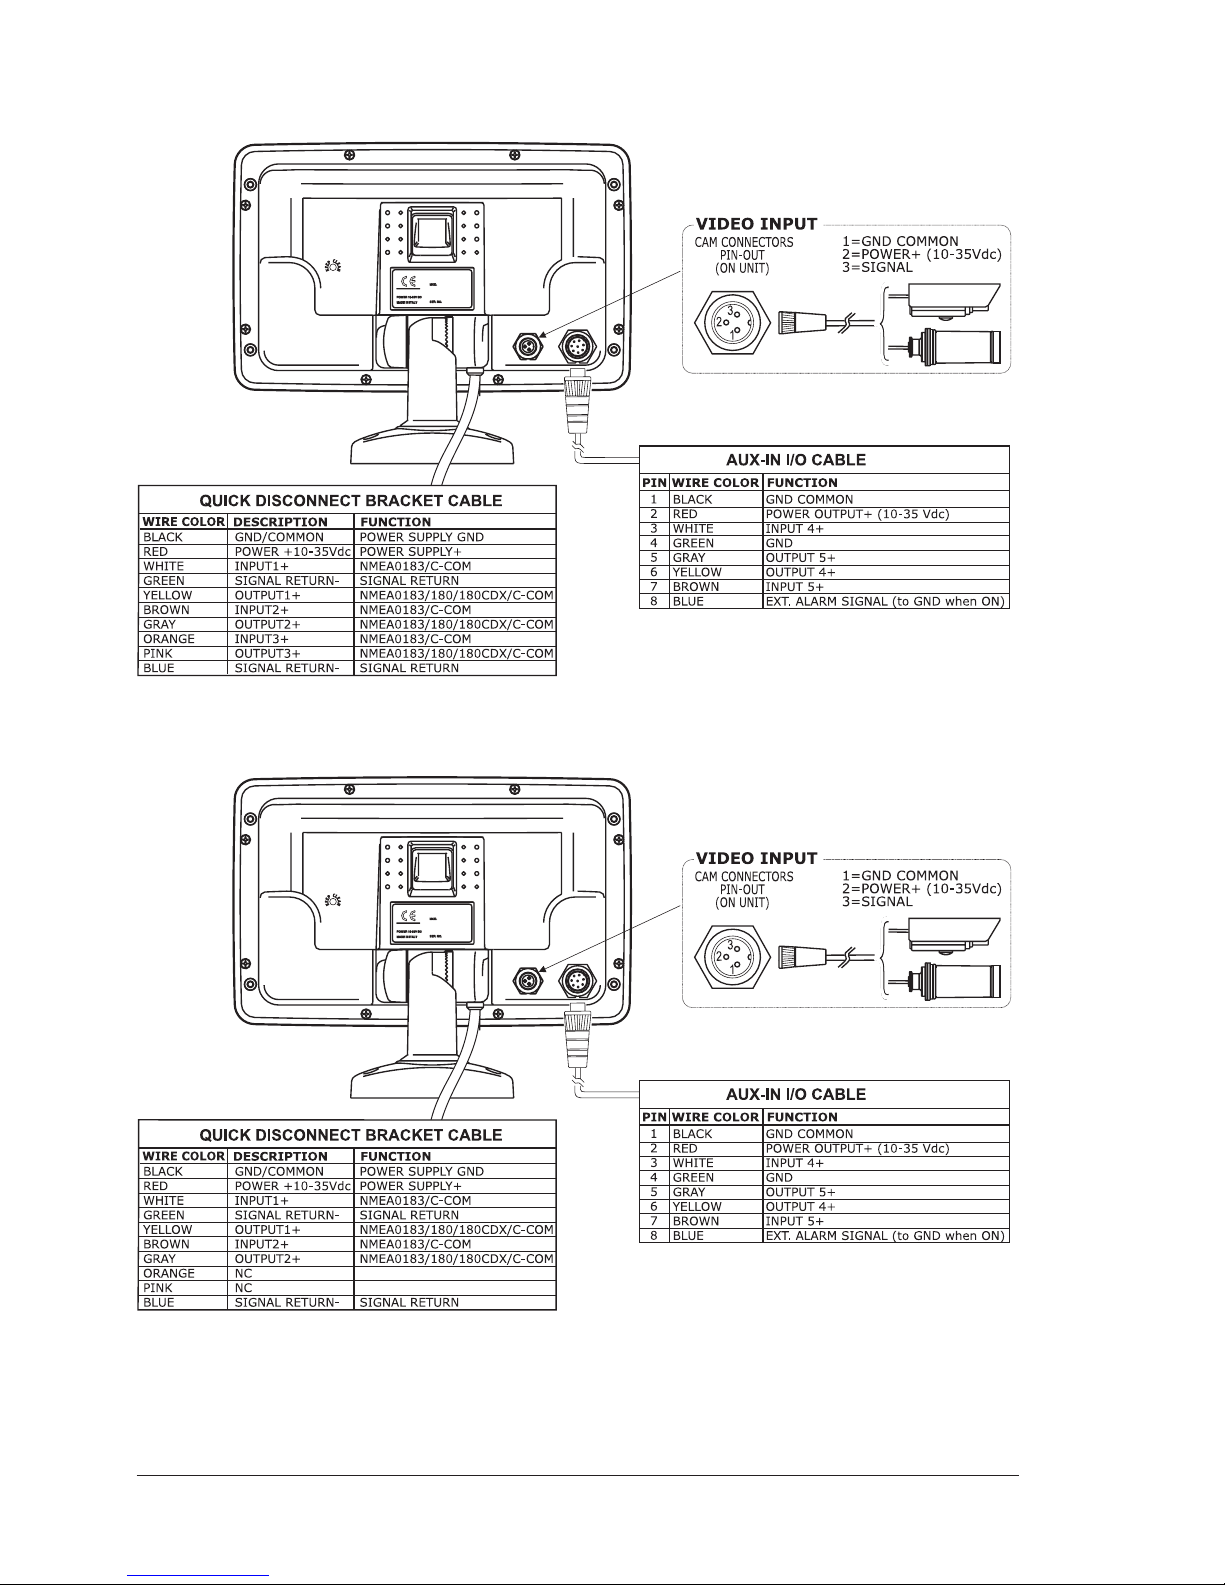
92
User Manual
EXTERNAL WIRING
External Wiring for MAP 7w Plus GPS
External Wiring for MAP 7wi Plus GPS
Page 92
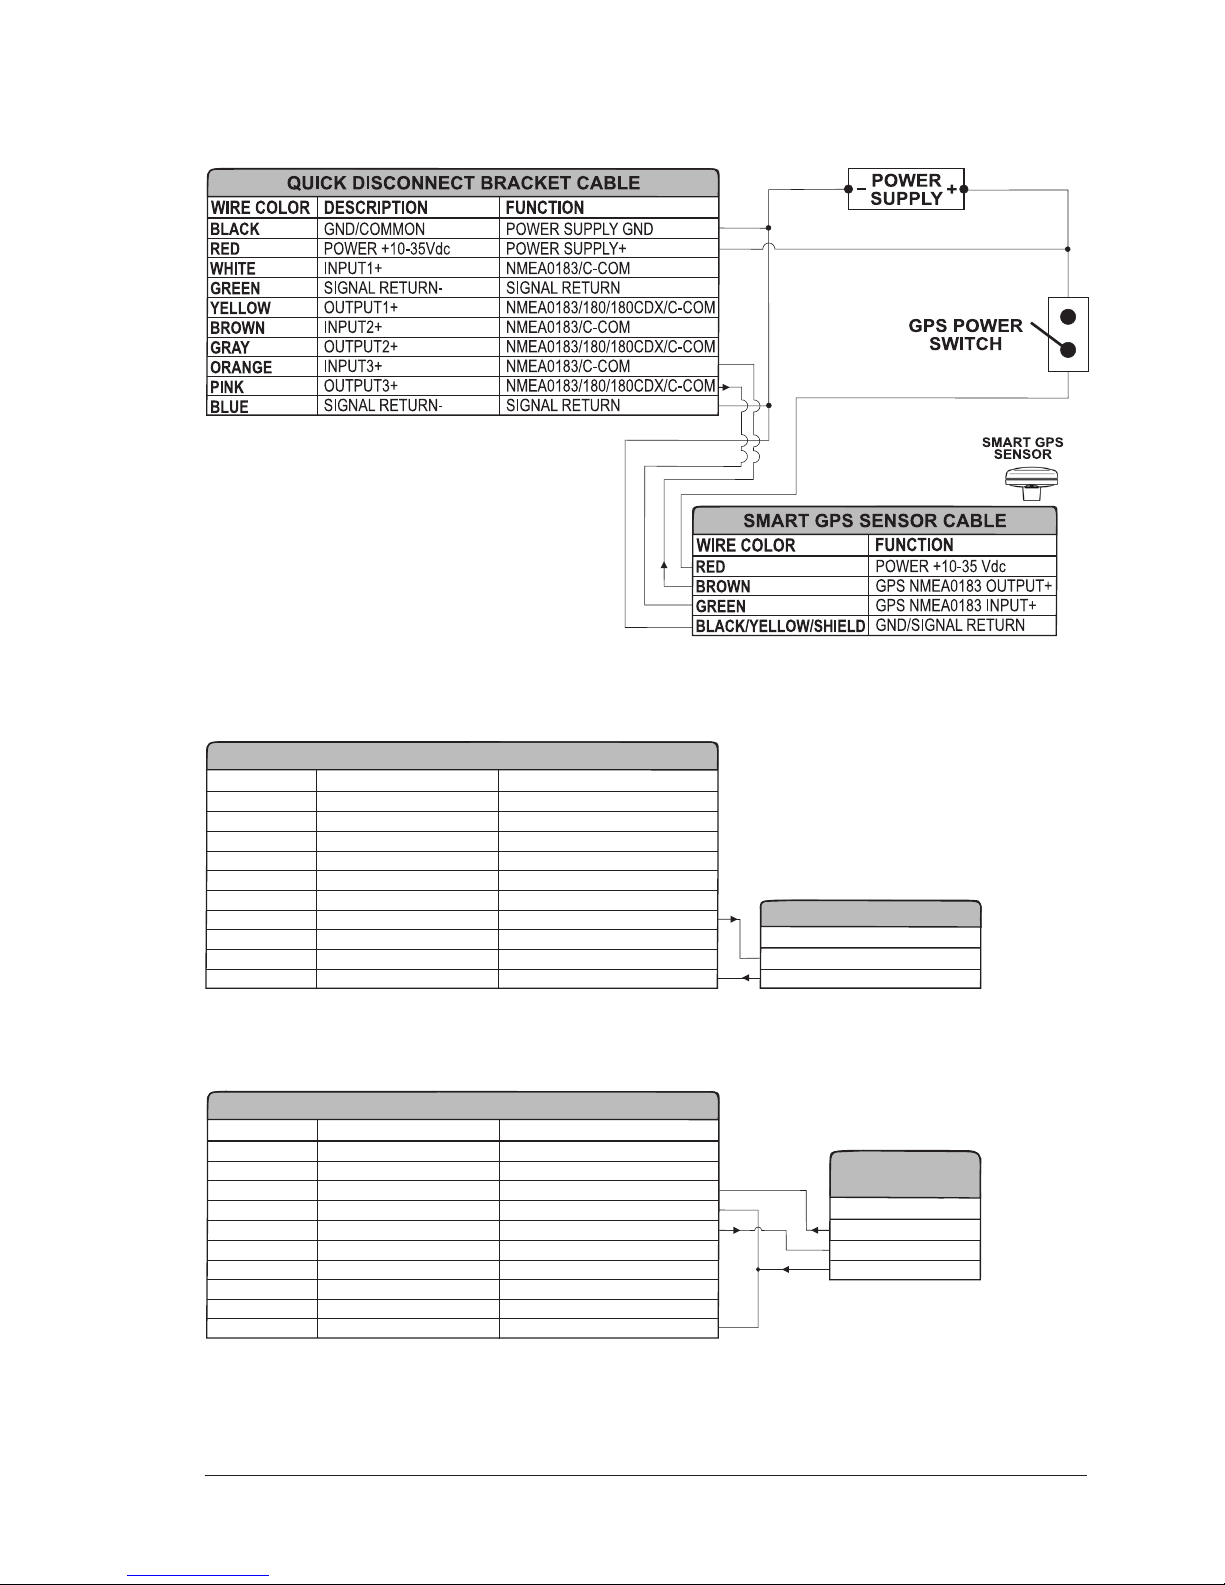
93
User Manual
TYPICAL CONNECTIONS
GPS Connection on Port 3 for MAP 7w Plus GPS
AUTOPILOT DEVICE
NMEA0183/180/180CDX/INPUT+
SIGNAL RETURN
FUNCTION
QUICK DISCONNECT BRACKET CABLE
DESCRIPTIONWIRE COLOR
BLACK
RED
WHITE
GREEN
YELLOW
BROWN
GRAY
ORANGE
PINK
BLUE
POWER SUPPLY GND
POWER SUPPLY+
NMEA0183/C-COM
SIGNAL RETURN
NMEA0183/180/180CDX/C-COM
NMEA0183/C-COM
NMEA0183/180/180CDX/C-COM
NMEA0183/C-COM
NMEA0183/180/180CDX/C-COM
SIGNAL RETURN
POWER GND
POWER +10-35Vdc
INPUT1+
SIGNAL RETURNOUTPUT1+
INPUT2+
OUTPUT2+
INPUT3+
OUTPUT3+
SIGNAL RETURN-
FUNCTION
Autopilot Connection on Port 2
NMEA0183
DEVICE
NMEA0183 OUTPUT+
NMEA0183 INPUT+
SIGNAL RETURN
FUNCTION
QUICK DISCONNECT BRACKET CABLE
DESCRIPTIONWIRE COLOR
BLACK
RED
WHITE
GREEN
YELLOW
BROWN
GRAY
ORANGE
PINK
BLUE
POWER SUPPLY GND
POWER SUPPLY+
NMEA0183/C-COM
SIGNAL RETURN
NMEA0183/180/180CDX/C-COM
NMEA0183/C-COM
NMEA0183/180/180CDX/C-COM
NMEA0183/C-COM
NMEA0183/180/180CDX/C-COM
SIGNAL RETURN
POWER GND
POWER +10-35Vdc
INPUT1+
SIGNAL RETURNOUTPUT1+
INPUT2+
OUTPUT2+
INPUT3+
OUTPUT3+
SIGNAL RETURN-
FUNCTION
External NMEA Connection on Port 1
Page 93
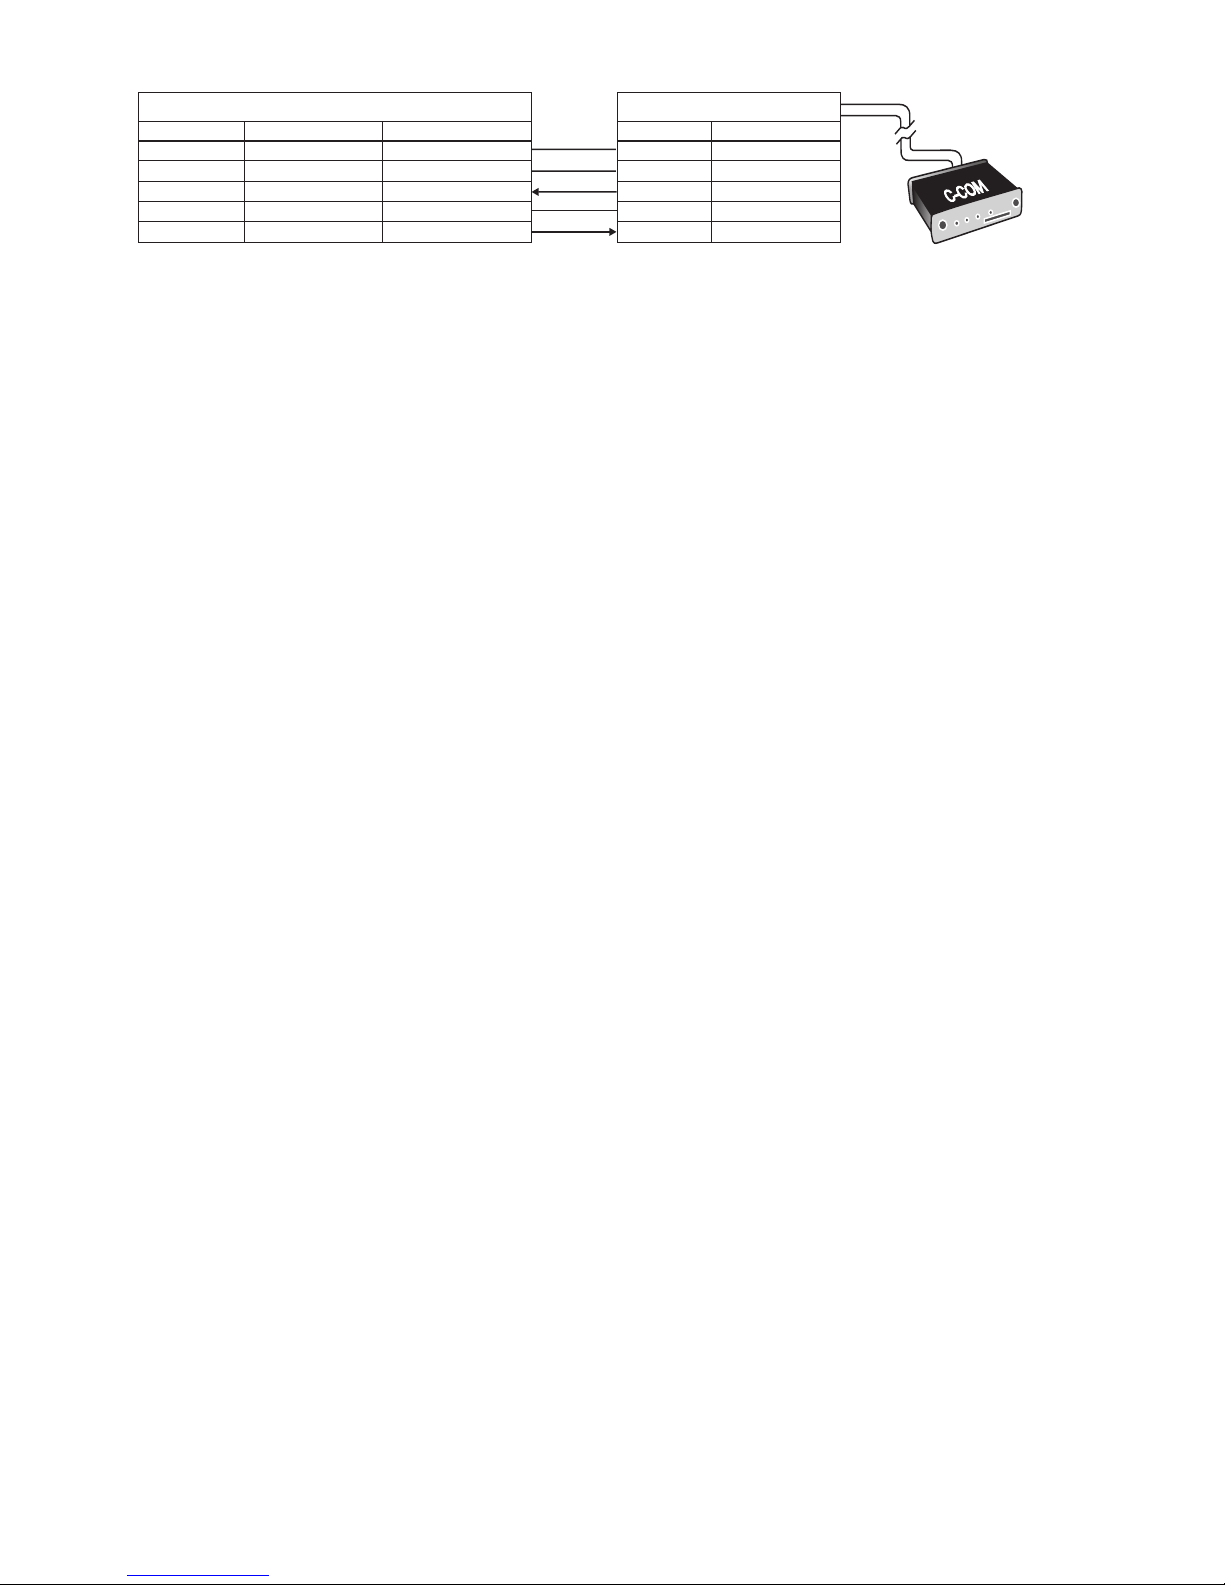
94
User Manual
QUICK DISCONNECT BRACKET CABLE
DESCRIPTION
WIRE COLOR
POWER GND
POWER +10-35Vdc
INPUT 1+
SIGNAL RETURNOUTPUT 1+
BLACK
RED
WHITE
GREEN
YELLOW
POWER SUPPLY GND
POWER SUPPLY+
C-COM
SIGNAL RETURN
C-COM
FUNCTION
C-COM GSM Plus CABLE
WIRE COLOR
FUNCTION
GND
POWER SUPPLY+
C-COM TX+
C-COM TXC-COM RX+
BLACK
RED
WHITE
GREEN
YELLOW
C-COM Connection on Port 1
Page 94
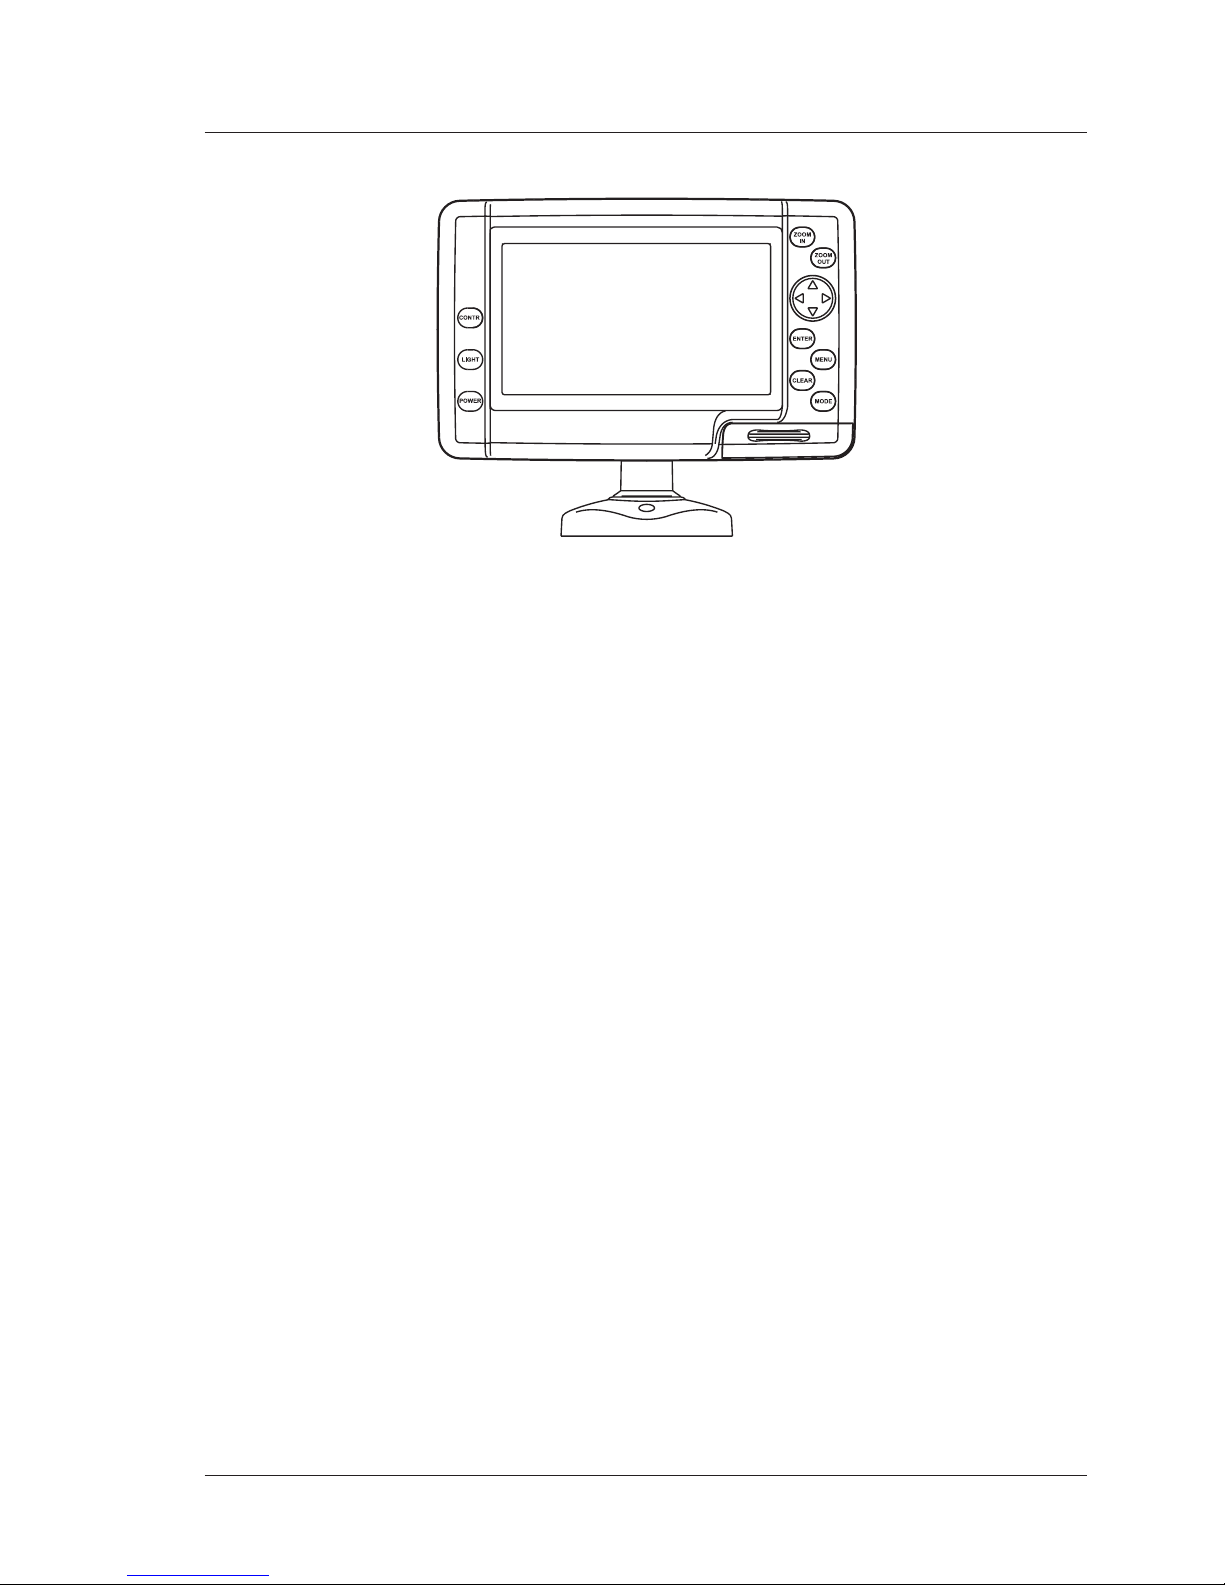
95
User Manual
MAP 7cwi Plus GPS
FEATURES & FUNCTIONS
♦ Direct sunlight viewable color LCD 16/9 display
♦ Worldwide Built-in Cartography showing C-MAP BY JEPPESEN detail up to
2.0 NM
♦ "C-MAP BY JEPPESEN" MAX electronic charts, object-oriented chart sys-
tem with enhanced functionality including:
Guardian alarm, Safety toolbar, Safety route check
Perspective view
Satellite image coverage
Turbo and Smooth Zoom
Multilanguage
Enhanced Port information database
Tides & Currents data
Photos & Diagrams
Automatic information on all chart objects
Search function for ports, tidal information, serrvice facilities
♦ Positional information from GPS
♦ GPS Signal Status page
♦ Navigation Data pages
♦ 1000 Waypoints/Marks and 20 Routes (51 Waypoints max per Route)
♦ Create, Move, Insert, Edit or Erase Waypoint
♦ Create, Move, Edit or Erase Mark
♦ Automatic Info on User Points
♦ Navigation to Destination
♦ Create, Save, Name, Edit or Follow a Route
♦ Route Data Report and User Points (Marks/Waypoints) List pages
♦ Find Ports Services, Port By Name, Port By Distance, Tide Stations, Lakes
By Name, Lakes Information, POIs, Wrecks, Obstructions, Coordinates
♦ Display vessel's position, direction and Track
♦ Alarms Handling
♦ Man OverBoard (MOB) to navigate back to a missing person or object
♦ Simulation Mode with cursor control
♦ Video Input option
♦ Internal Fish Finder
Page 95
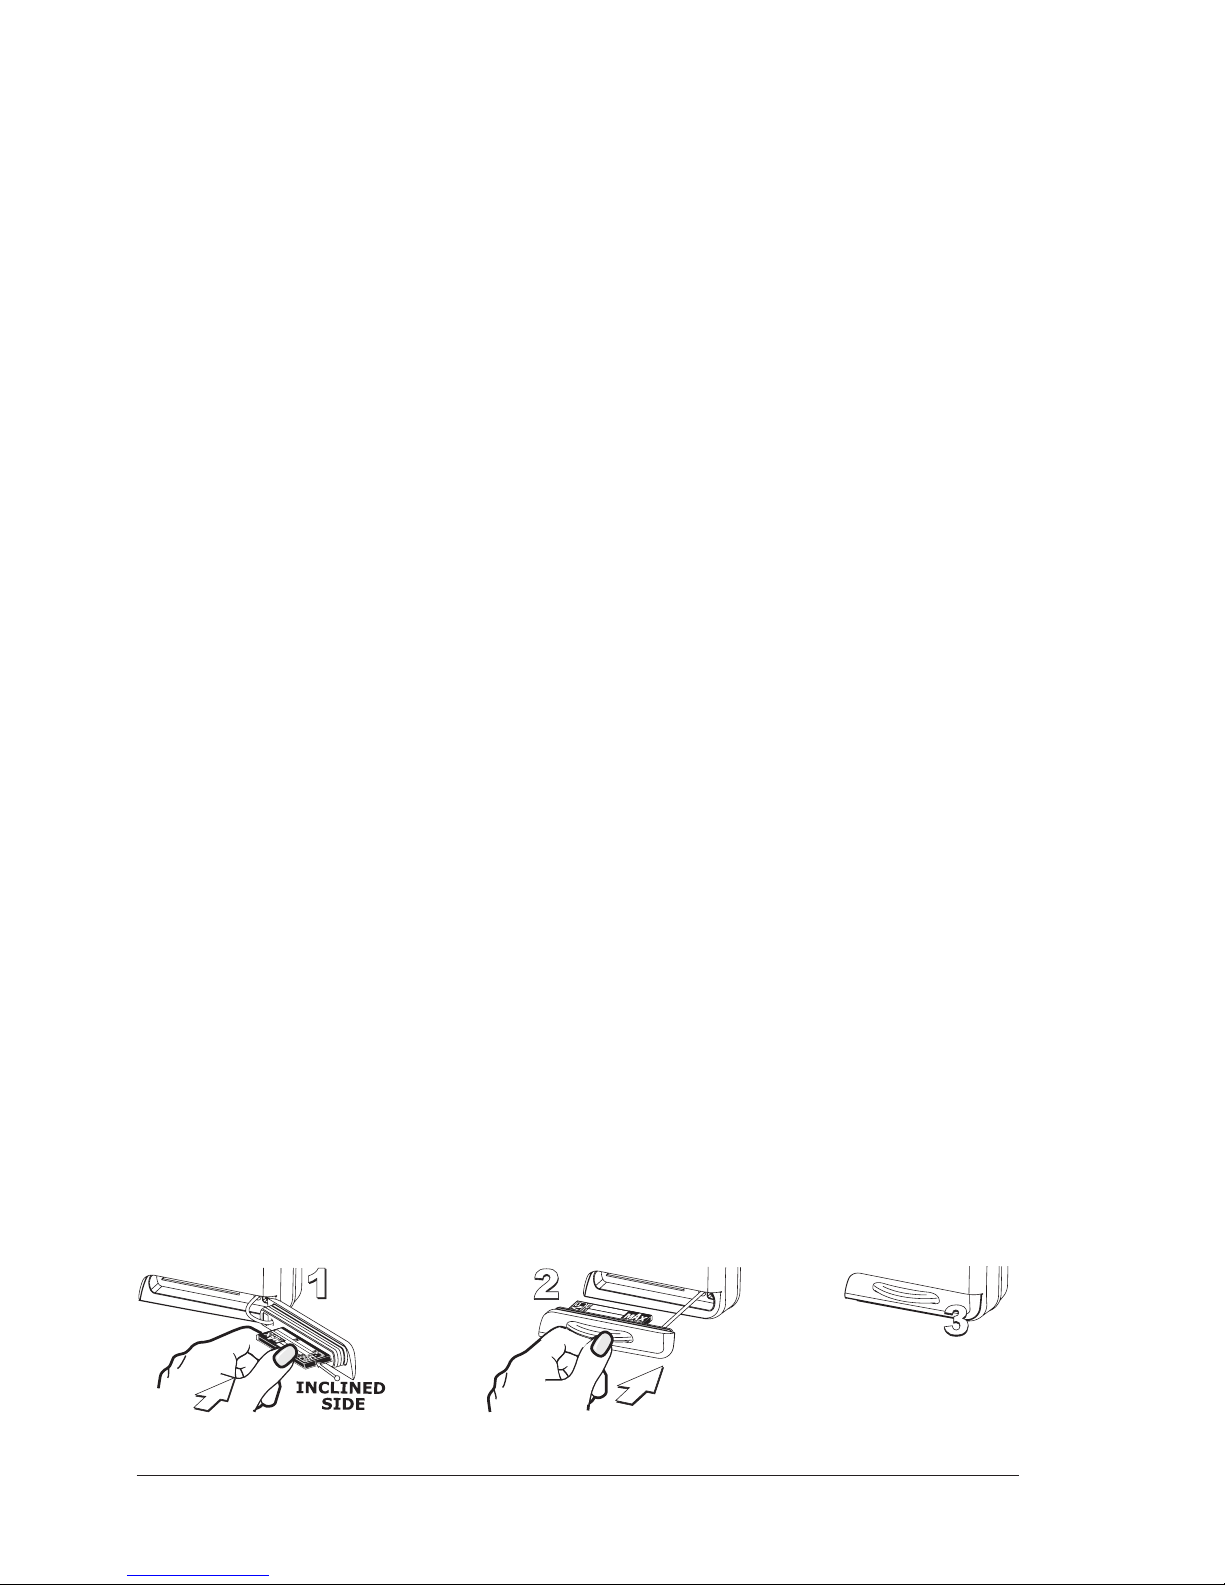
96
User Manual
TECHNICAL SPECIFICATIONS
♦ Operating Voltage : 10 - 35 Volt dc
♦ Power consumption : 12W average; 27W max peak
♦ Interface : NMEA-0183
♦ Autopilot Interface : NMEA-0180, NMEA-0180/CDX, NMEA-0183
♦ Display : Color Sunlight Viewable LCD (active area 7")
♦ Display Resolution : 800 x 480 pixels
♦ Cartography : C-MAP BY JEPPESEN C-CARD
♦ Operating temperature range: 0/+55°C (32/+131°F)
♦ Memory : Non volatile
♦ Keyboard : Silicon rubber, backlight
♦ Weight : 1,3 kg
FF MODULE 600W-50-200KHZ
TECHNICAL SPECIFICATIONS
♦ Power Output : 600W (4800Wpp), 50/200KHz Dual Fre-
quency
♦ Max Depth : 213m (700Ft) at 200kHz, 457m(1500Ft)
at 50kHz
♦ Automatic Recognition of the AIRMAR "X-DUCER ID" transducers for best
performance
♦ Advanced Digital Signal Processing
♦ Speed & Temperature Sensor (if available on transducer)
♦ Alarms (shallow water, depth, Fish, temp)
♦ Trip Log, Fish Symbols
♦ STC, Interference Rejection, Automatic noise reduction
♦ A-scope, White Line, Zoom x2/x4
♦ Auto range/gain/frequency/shift/ping rate
When the package containing the chart plotter is first opened, please check it for
the following contents (if any parts are missing contact the dealer the chart plotter was purchased from):
♦ "Quick disconnect" bracket and its protective cover
♦ Chart plotter's protective cover
♦ Fuse 3.15 Amp. + fuseholder
♦ User Manual
INSERTING/REMOVING PROCEDURE
Inserting the C-CARD
Open the door, hold the C-CARD by the long side so that you can see the label and
gently push the C-CARD into the door slot (1). Close the door pushing the C-CARD
in as far as it will go to hold fixed into the chart plotter slot (2). When finished the
door must be right closed (3).
Page 96
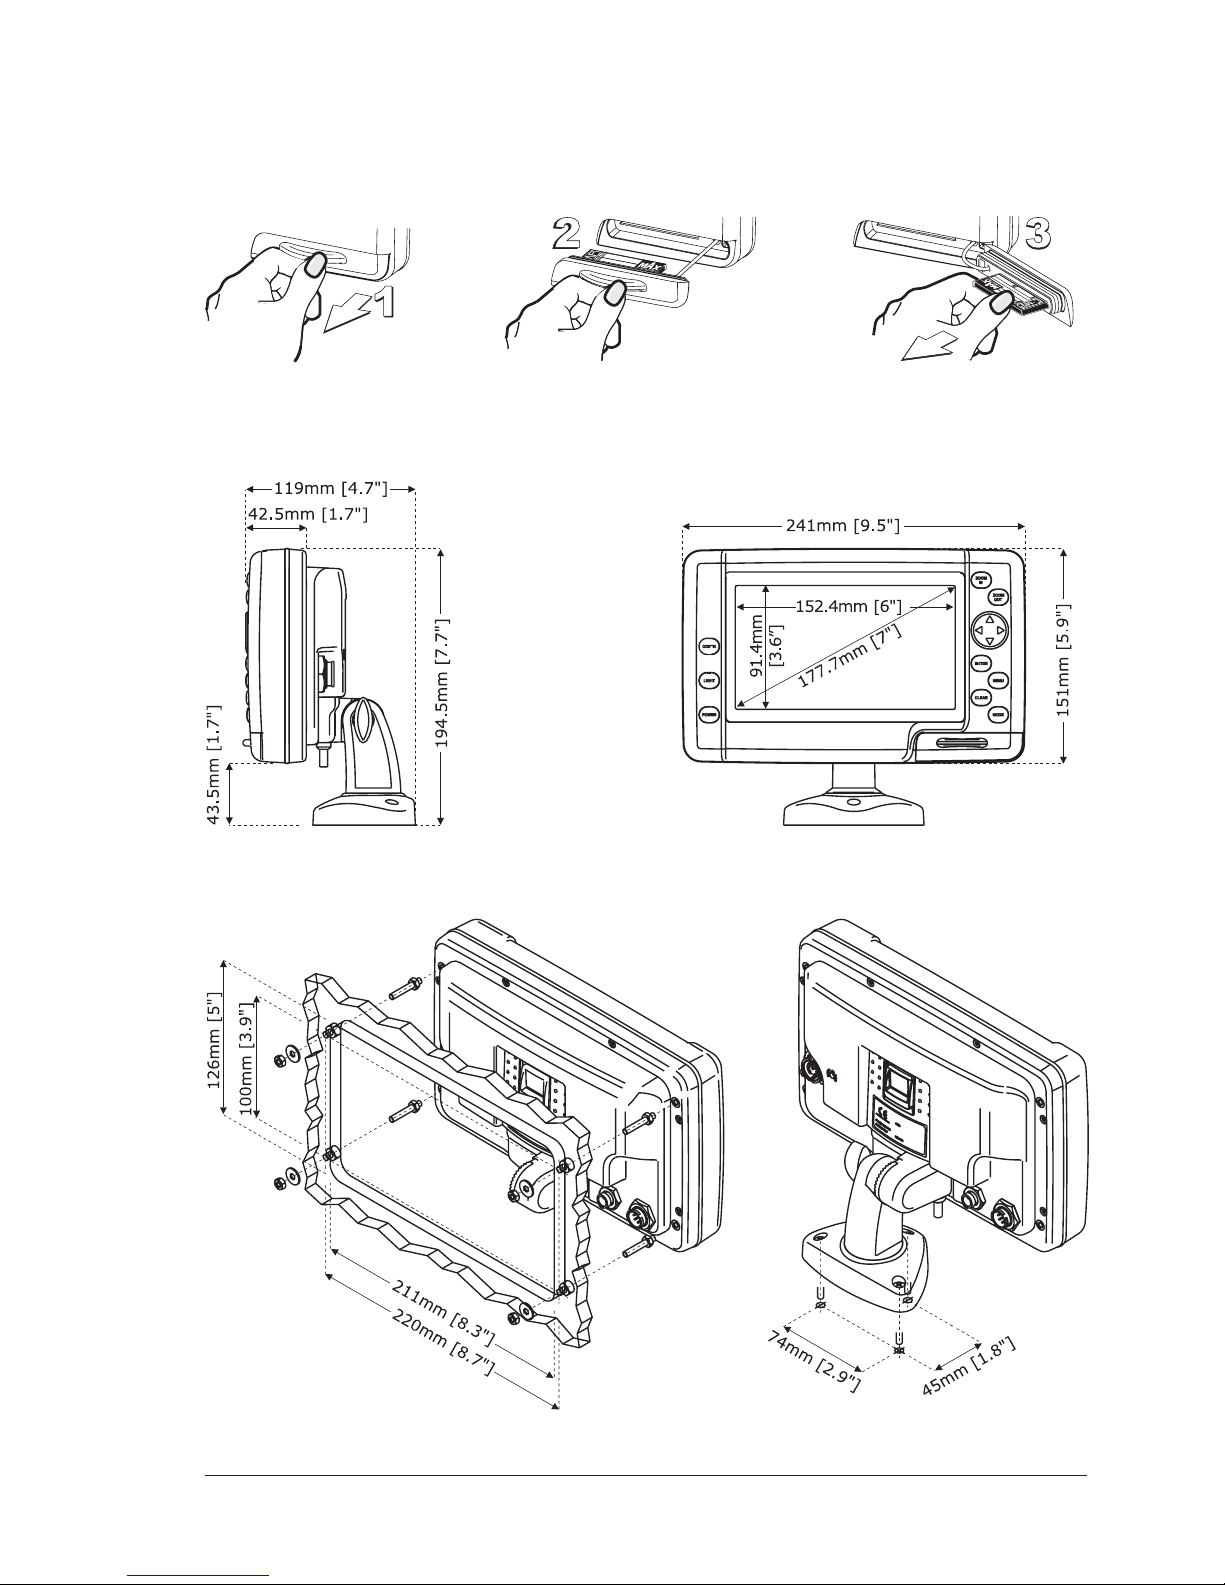
97
User Manual
Removing the C-CARD
To remove the C-CARD inserted in the chart plotter open the door (1). The CCARD will eject out of the chart plotter slot remaining fixed into the door (2). Then
remove the C-CARD from the slot (3).
CHART PLOTTER DIMENSIONS
INSTALLATION AND REMOVING
Page 97
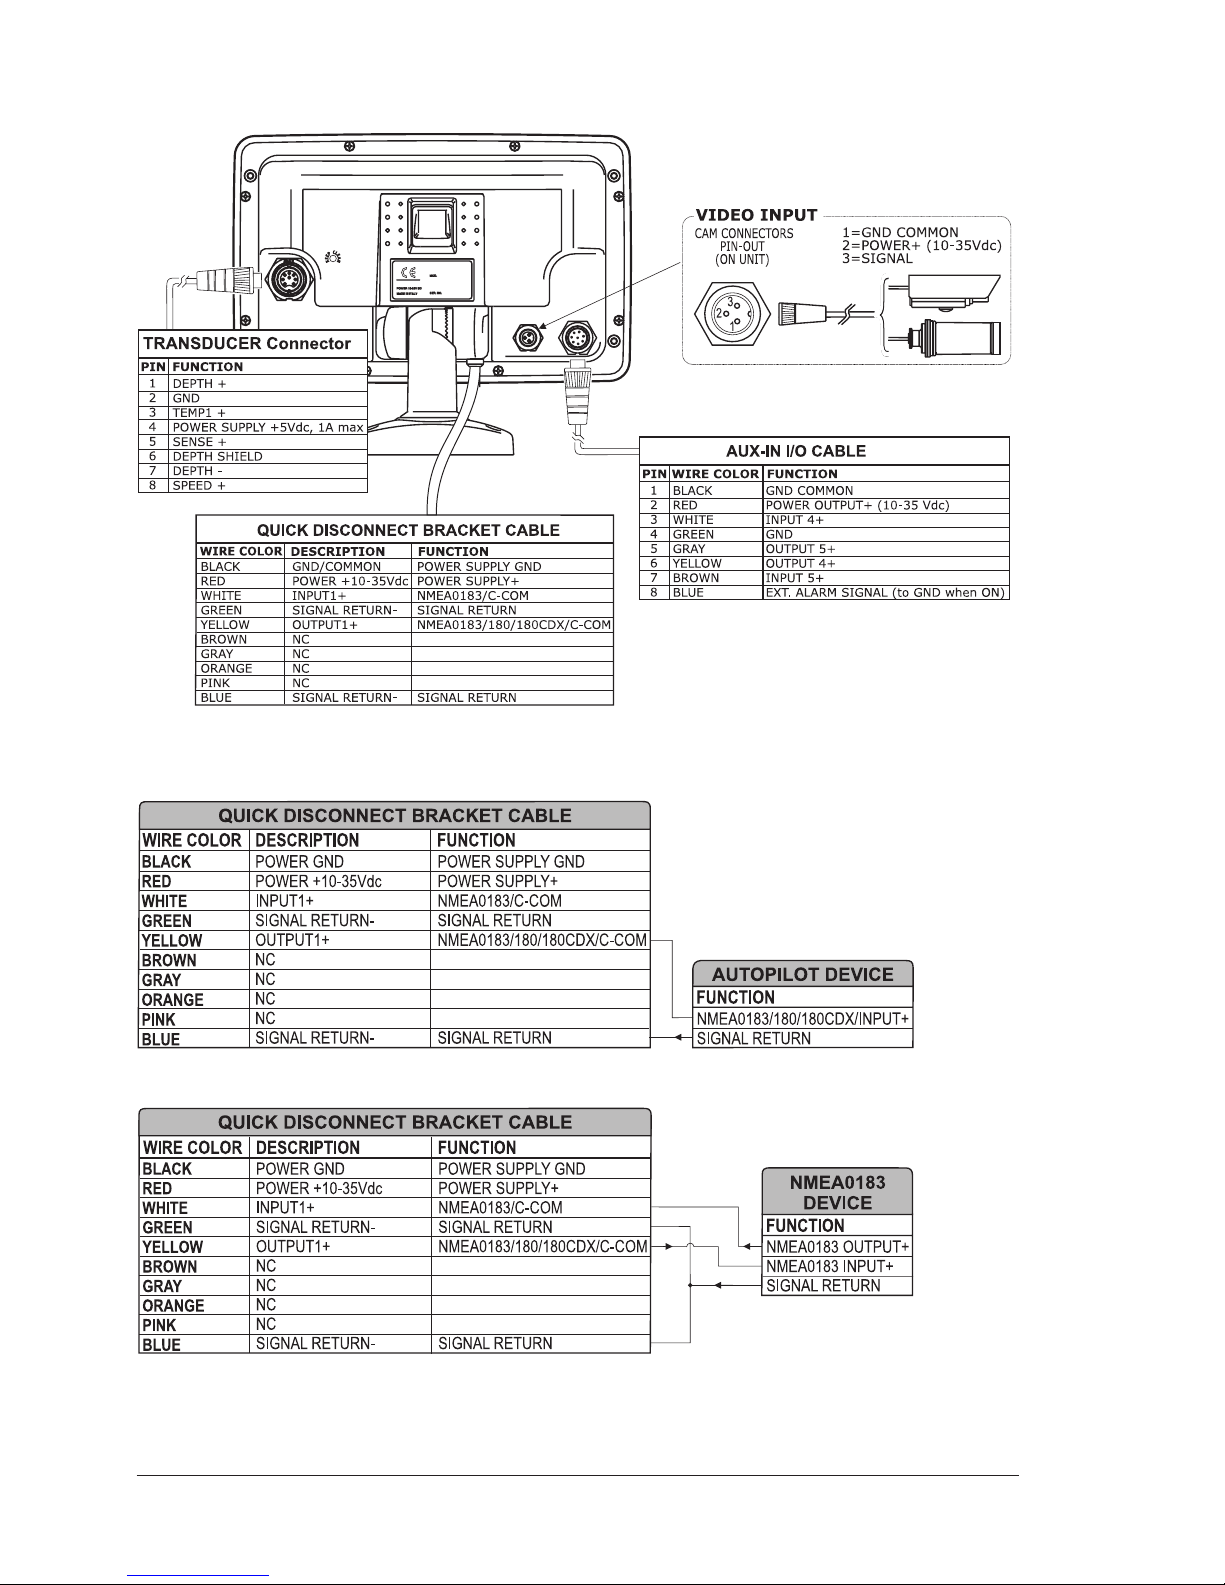
98
User Manual
EXTERNAL WIRING
TYPICAL CONNECTIONS
Autopilot Connection on Port 1
External NMEA Connection on Port 1
Page 98
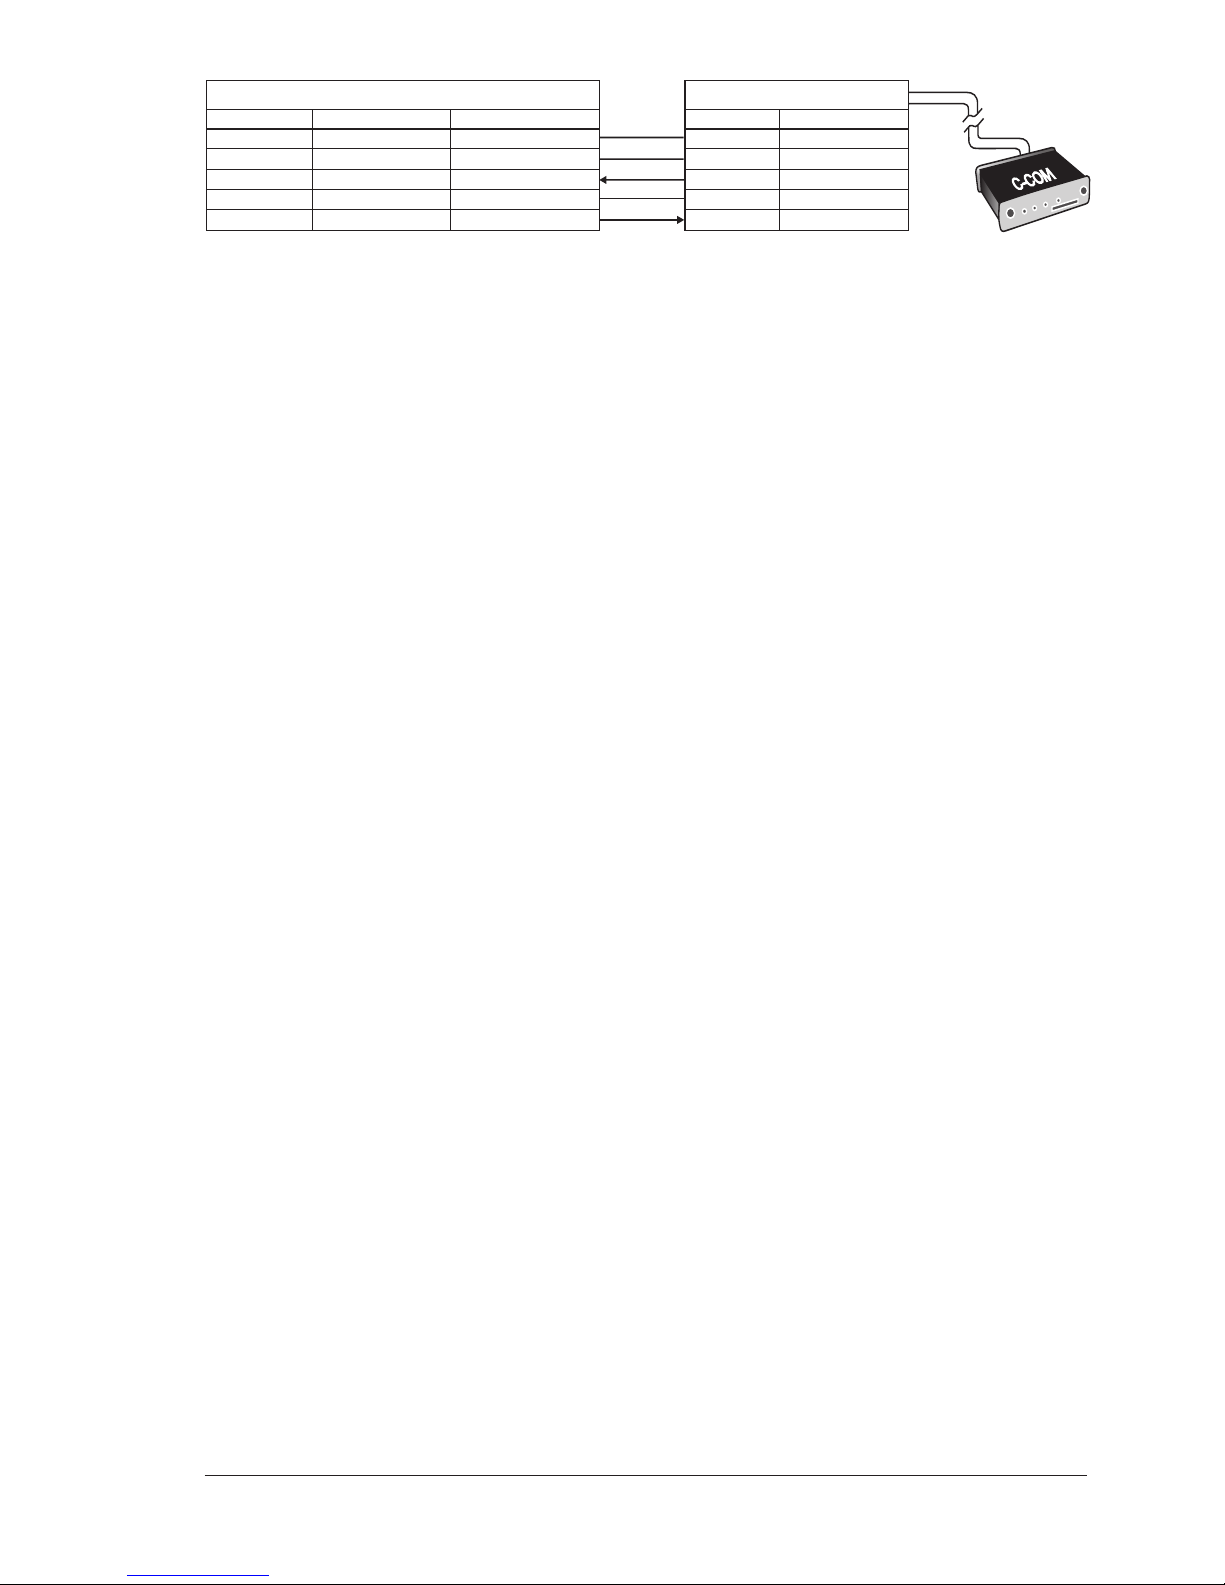
99
User Manual
QUICK DISCONNECT BRACKET CABLE
DESCRIPTION
WIRE COLOR
POWER GND
POWER +10-35Vdc
INPUT 1+
SIGNAL RETURNOUTPUT 1+
BLACK
RED
WHITE
GREEN
YELLOW
POWER SUPPLY GND
POWER SUPPLY+
C-COM
SIGNAL RETURN
C-COM
FUNCTION
C-COM GSM Plus CABLE
WIRE COLOR
FUNCTION
GND
POWER SUPPLY+
C-COM TX+
C-COM TXC-COM RX+
BLACK
RED
WHITE
GREEN
YELLOW
C-COM Connection on Port 1
Page 99

100
User Manual
Page 100
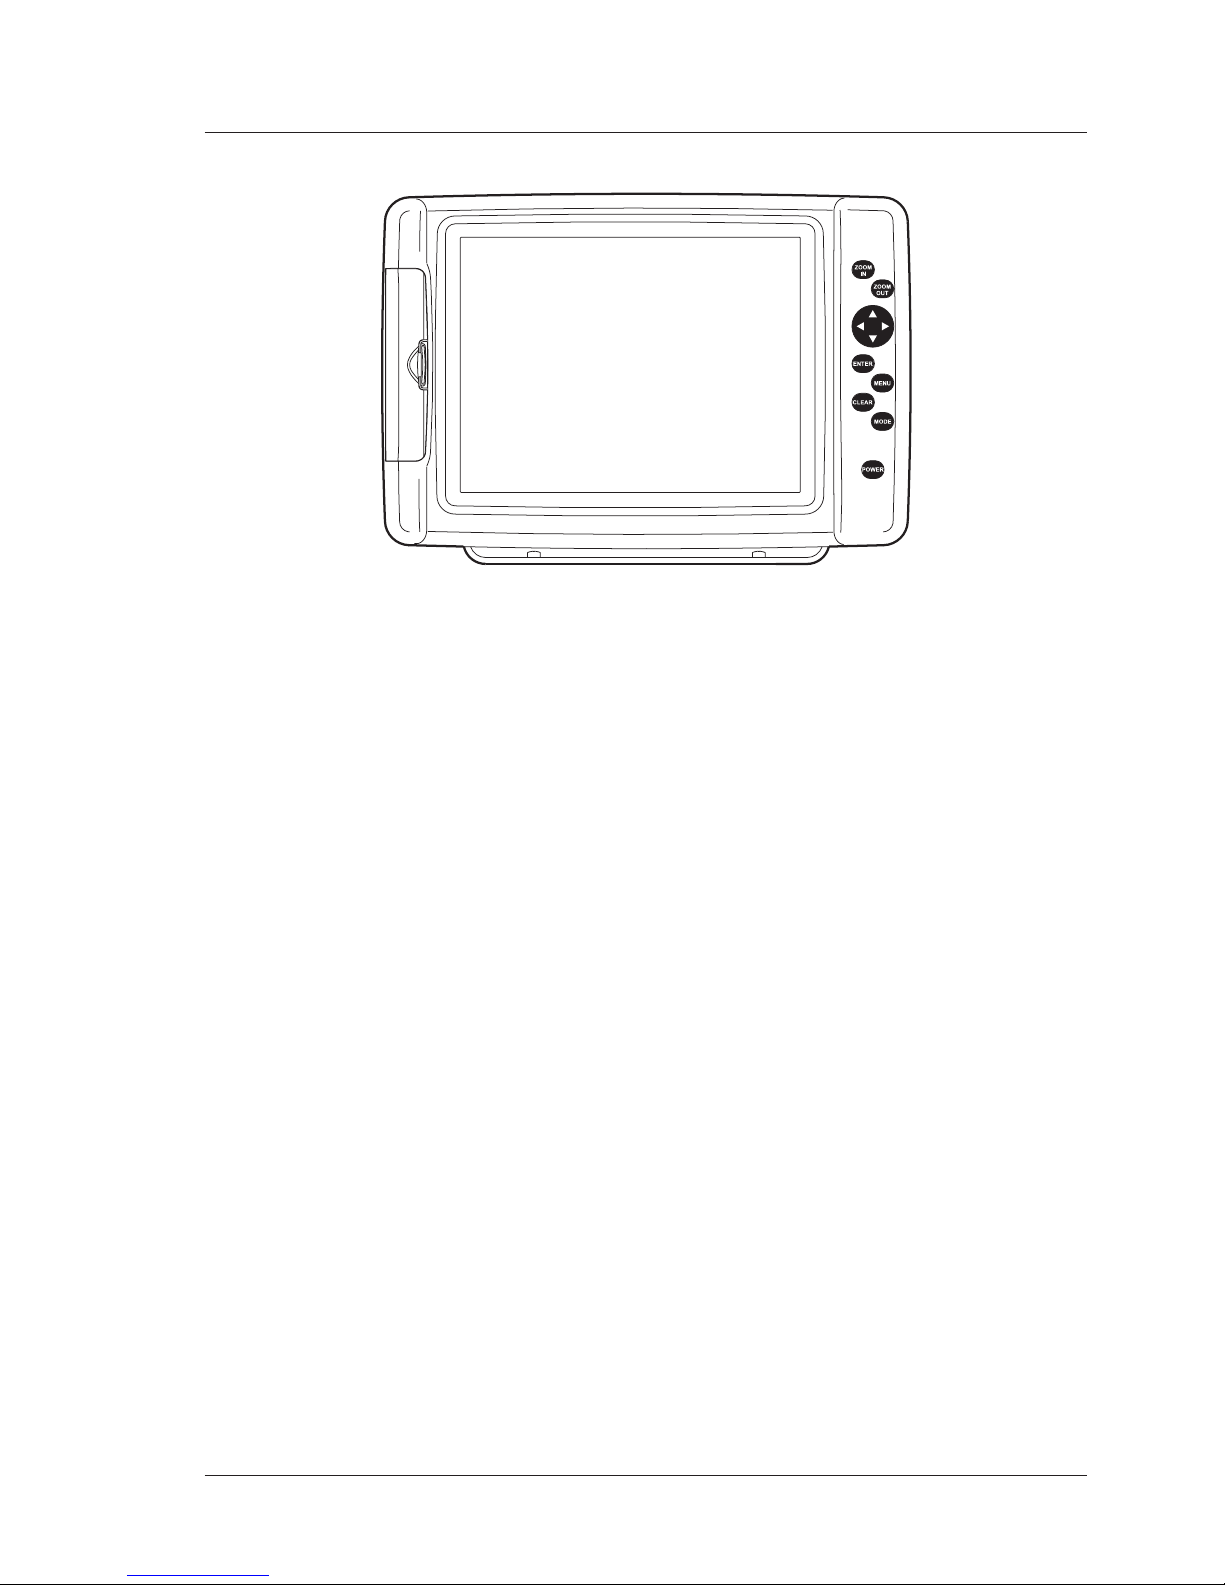
101
User Manual
MAP 11csE Plus GPS
FEATURES & FUNCTIONS
♦ Direct sunlight viewable color 11" LCD display
♦ Worldwide Built-in Cartography showing C-MAP BY JEPPESEN detail up to
2.0 NM
♦ "C-MAP BY JEPPESEN" MAX electronic charts, object-oriented chart sys-
tem with enhanced functionality including:
Guardian alarm, Safety toolbar, Safety route check
Perspective view
Satellite image coverage
Turbo and Smooth Zoom
Multilanguage
Enhanced Port information database
Tides & Currents data
Photos & Diagrams
Automatic information on all chart objects
Search function for ports, tidal information, serrvice facilities
♦ Positional information from GPS
♦ GPS Signal Status page
♦ Navigation Data pages
♦ 1000 Waypoints/Marks and 20 Routes (51 Waypoints max per Route)
♦ Create, Move, Insert, Edit or Erase Waypoint
♦ Create, Move, Edit or Erase Mark
♦ Automatic Info on User Points
♦ Navigation to Destination
♦ Create, Save, Name, Edit or Follow a Route
♦ Route Data Report and User Points (Marks/Waypoints) List pages
♦ Find Ports Services, Port By Name, Port By Distance, Tide Stations, Lakes
By Name, Lakes Information, POIs, Wrecks, Obstructions, Coordinates
♦ Display vessel's position, direction and Track
♦ Alarms Handling
♦ Man OverBoard (MOB) to navigate back to a missing person or object
♦ Simulation Mode with cursor control
 Loading...