

Page 1
www.vaisala.com
Vaisala FALLS® 5.0
Fault Analysis and Lightning Location System
Features/Benefi ts
Easy-to-use interface
▪
GIS (geographic information
▪
systems) functionality
Automatically generated maps
▪
save time
Automated processing of
▪
prioritized and queued
analyses
Execute other tasks while the
▪
analyses run in the background
Easy interpretation of lightning
▪
data, using color, time, polarity
and amplitude codes
Filter out unwanted lightning
▪
data
The user can automate
▪
analyses by setting the start
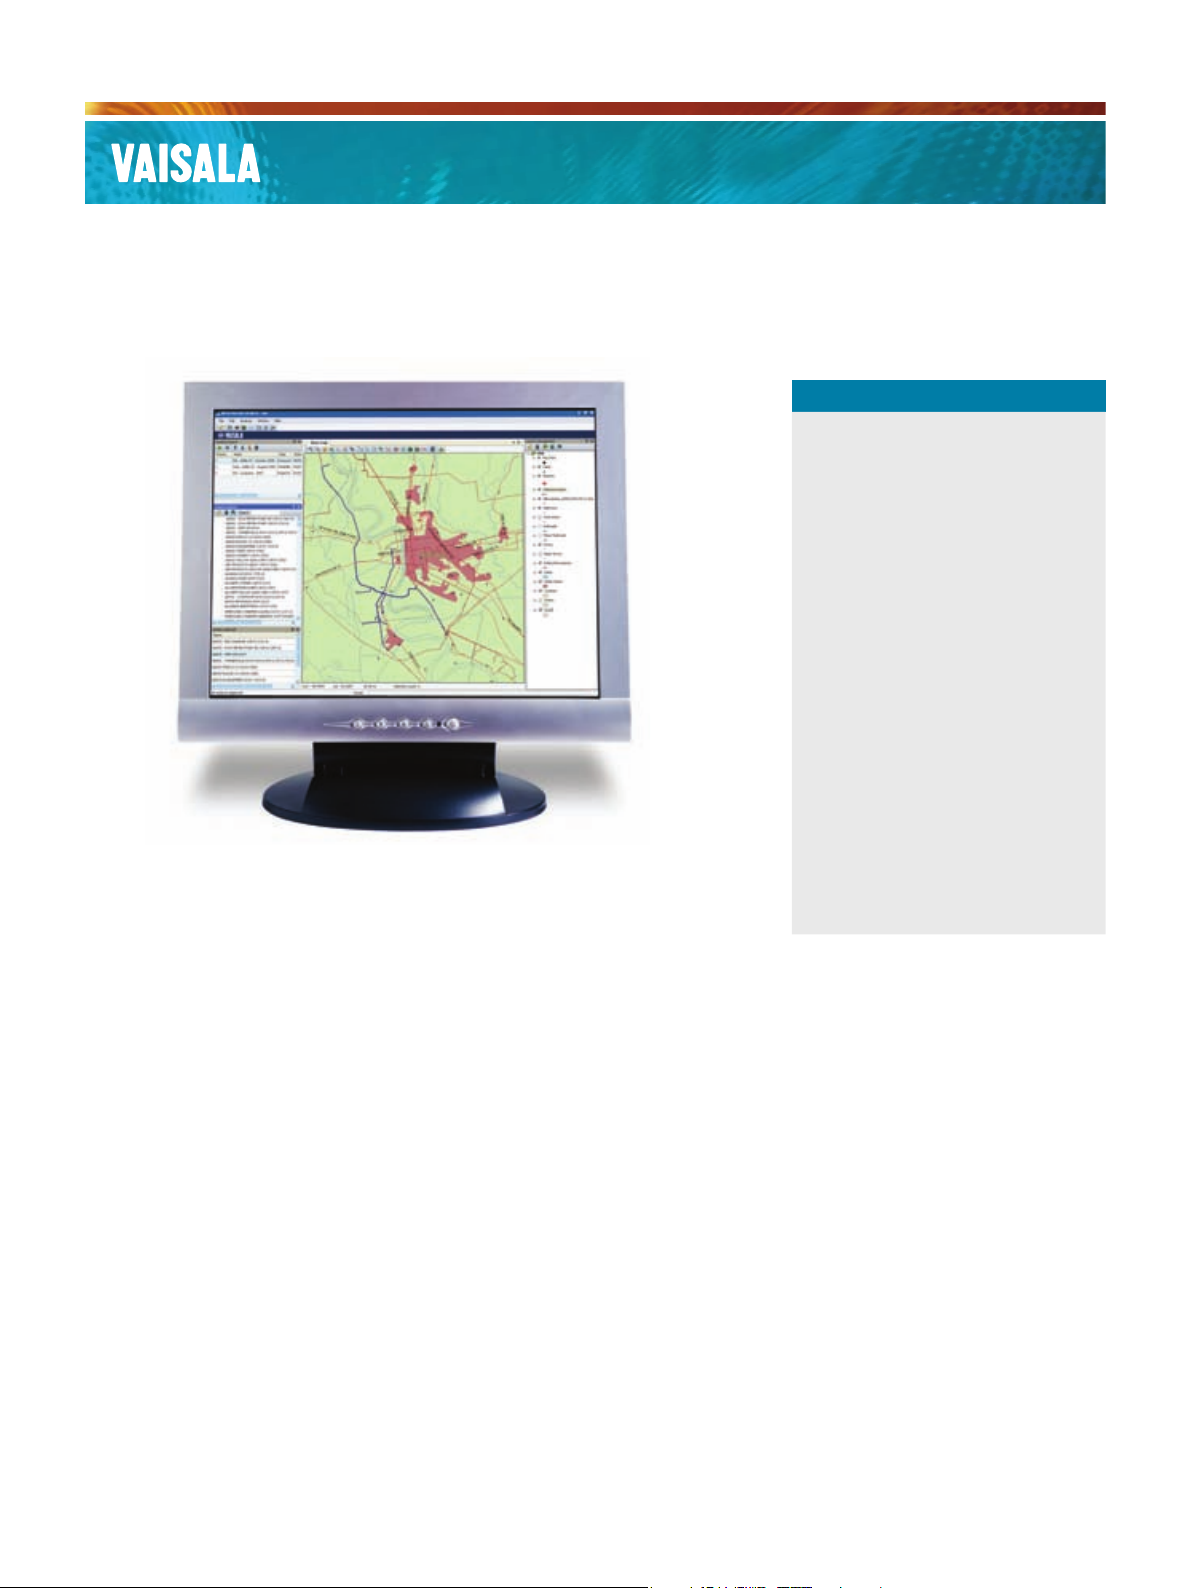
Prioritize your analyses on the fly using the FALLS® 5.0 Analysis queue. The ability to
explore an analysis while others run in the background will improve your productivity.
and end dates, and inserting
other criteria
Vaisala FALLS® 5.0 is an innovative
software used by electricity utilities
to query previously recorded
lightning information in a GIS
(geographic information systems)
environment.
The Vaisala FALLS® 5.0 software
generates lightning information into
maps, graphs, and statistical tables,
and is used to analyze the impact
of lightning on assets and systems.
Whether you are investigating
suspected lightning-caused faults
or are studying the climate of your
service territory, Vaisala FALLS® 5.0
provides an easy-to-use platform to
quantify and prioritize recommended
protection investments.
Electric utility power
package
Vaisala has now made it easier than
ever for U.S. and Canadian customers
to gain access to the FALLS
you depend on to minimize the risk
lightning poses to your operations.
Partner with Vaisala for your historic
and real-time lightning data access,
automated lightning fault correlation,
and continuing education to keep
your organization ahead of the storm.
Vaisala offers customers access to
the following options:
Subscription to Vaisala FALLS®
▪
Lightning Data for your service
territory
▪ FALLS
Software support and upgrades
®
5.0 and FALLS® Server
®
services
Priority access to the FALLS® Users
▪
Group and Vaisala Webinars on
special topics of interest
Preferred discounts for real-time
▪
lightning data access with Vaisala’s
partners
Lightning data source
North American customers have
▪
access to Vaisala’s U.S. National
Lightning Detection Network
the Canadian Lightning Detection
Network, which together create
the most comprehensive historic
lightning database in the world
International customers and private
▪
Vaisala lightning detection network
owners can access data from any
Vaisala central processor or archive
processor
®
and
Page 2
Technical data
Regional analysis
A Regional Analysis generates regional and local lightning
strike occurrences and/or densities for user-speci ed
time periods. It is used to identify hot spots for lightning
activity, compare variations in lightning occurrence,
amplitude, and polarity across days, weeks, months, or
years and statistically verify the expected amounts of
lightning activity in your service territory.
Exposure analysis
An Exposure Analysis offers point-by-point and/or gridded
analysis resolving the amount and type of lightning
activity within user-de ned asset buffer regions. It plots
time trends of lightning over your service territory and/
or assets, ranks assets by the amount and intensity of
lightning exposure and discriminates by polarity and
amplitude around user-de ned asset buffers.
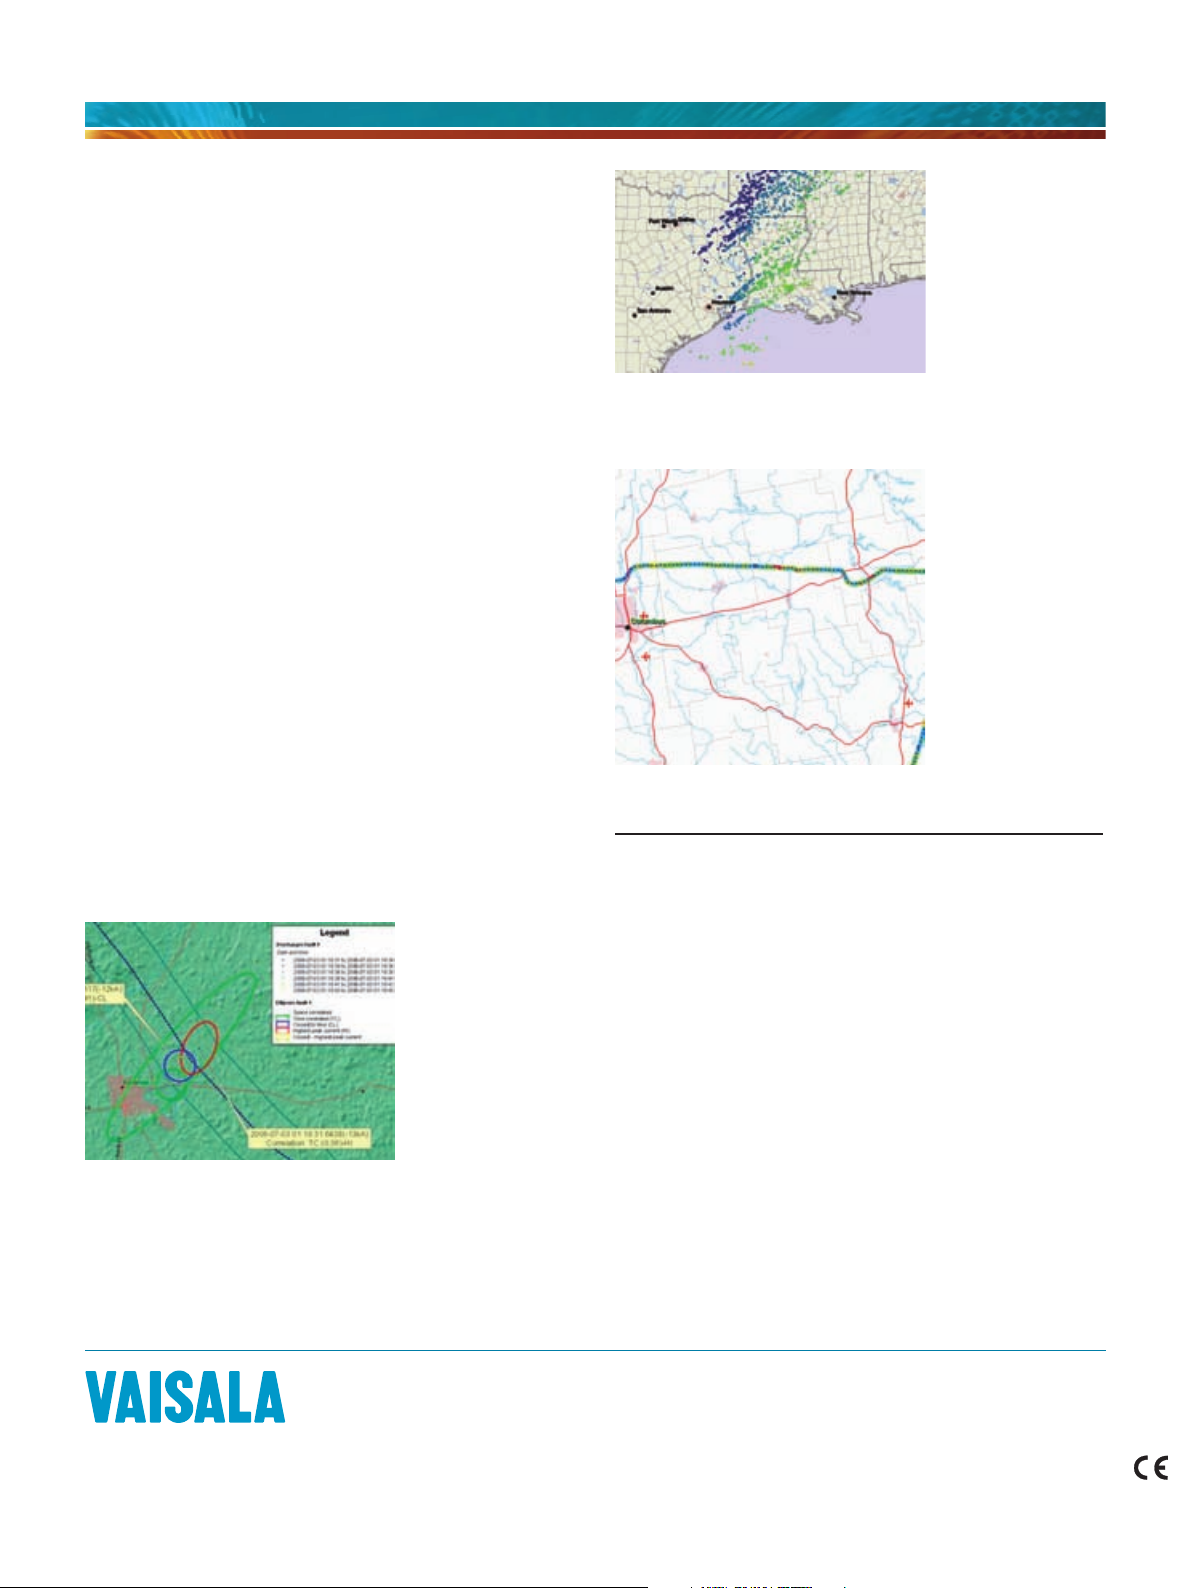
Reliability analysis
A Reliability Analysis maps event-speci c lightning
analysis in near real-time. It locates poorly performing line
segments or system weaknesses, validates your lightning
protection design and correlates your line faults to
lightning activity or a lack of lightning activity.
This FALLS
Reliability Analysis
reveals four cloud-toground lightning discharges which correlated to a suspected
fault. The blue ellipse
represents the stroke
that best matches the
fault recorder timestamp and the red
ellipse shows the
highest peak current
event. Field crews
could be dispatched
to the location to
restore service.
®
5.0
®
FALLS
5.0 allows
the user to display
and discriminate
lightning discharges
by their time of
occurrence. The map
displayed here for
December 3rd and
4th, 2008 shows a
line of thunderstorms
in the U.S. gulf coast
that tracked to the
northeast.
An example of a
®
FALLS
5.0 Exposure
Analysis for a transmission circuit in
eastern Ohio. Areas
of higher lightning
activity are revealed.
This information can
help an electric utility
to prioritize protection or maintenance.
Computer requirements
Processor Minimum: 1.6 GHz Intel Pentium 4, Intel Xeon, Intel
Core Duo, or AMD Athlon equivalent
Operating System: Windows XP SP2
RAM: Recommended - 2 GB or higher, Minimum
- 1 GB
Hard Disk: 850 MB for install, up to 50 MB of disk space
may be needed in the Windows System
directory (typically C:\\Windows\System32),
3 GB of available space to be allocated for
swap, temporary fi les, and saved analyses
Display Card 24-bit capable graphics accelerator card
Screen Resolution
Recommended 1280 x 1024, 32-bit color,
Minimum 1024 x 768, 32-bit color
Browser
Recommended Microsoft Internet Explorer 6.0 or 7.0
Other
Recommended
Minimum DVD-ROM drive
Vaisala Inc. Tucson Operations, 2705 E. Medina Road, Tucson, AZ 85756, USA,
Tel: +1 520 806 7300, Fax: +1 520 741 2848
For more information, visit
www.vaisala.com or contact
us at sales@vaisala.com
Ref. B210778EN-A ©Vaisala 2009
This material is subject to copyright protection, with all
copyrights retained by Vaisala and its individual partners. All
rights reserved. Any logos and/or product names are trademarks
of Vaisala or its individual partners. The reproduction, transfer,
distribution or storage of information contained in this brochure
in any form without the prior written consent of Vaisala is strictly
prohibited. All specifi cations — technical included — are subject
to change without notice.
 Loading...