

Page 1

THURLBY THANDAR INSTRUMENTS
HA1600
POWER AND HARMONICS ANALYSER WITH FLICKERMETER
INSTRUCTION MANUAL
Page 2

Table of Contents
Introduction 2
Specification 3
Safety 5
EMC 7
Installation 8
Connections 9
Front Panel Connections 9
Rear Panel Connections 9
Initial Operation 10
Power Meter View 12
Power Meter Set-up 14
Waveform Graph View 15
Waveform Graph Set-up 16
Harmonics View 19
Harmonics Set-up 20
Display Format - Histogram 20
Display Format – Tables 23
Test Control View 25
Test Control Set-up (Harmonics) 26
EN61000-3-3 Flicker and Fluctuations 31
Test Control Set-up (Flicker) 33
Meter View (Flicker) 35
Flicker Meter Page 35
Voltage Variation Page 36
Peak Inrush Current Measurement 38
Test Control Set-up (Peak Inrush Current) 40
Report View 41
Report Formats 42
Report Set-up 45
Compliance Measurements with the HA1600 47
Harmonics Measurements 47
Taking Harmonics Measurements 48
Taking Flicker and Fluctuation Measurements 49
HA-PC Link Plus Software 50
Software Installation 50
Operation of the HA-PC Link Plus Software 50
Installation of USB drivers 53
Maintenance & Calibration 54
Software Updates 55
1
Page 3

High performance power analyser
The HA1600 is a high speed, high accuracy AC power analyser for single phase supplies of up to
16 Amps rms.
The supply to be measured is connected via a dedicated input cable independently of the supply
to the instrument. The output to the load is via a front panel mounted 'standard' mains connector.
A wide range of power connectors is available including most European national types.
The HA1600 can measure Watts, VA, Volts rms, Volts peak, Amps rms, Amps peak, Crest factors,
THD, Power factor, Frequency and Inrush current.
The large display can show multiple parameters simultaneously along with graphical
representations of voltage and current waveforms.
Dual 16 bit Analog to Digital converters continuously sample both voltage and current and give a
wide dynamic range. A fast Digital Signal Processor gives the performance needed for continuous
real-time analysis of the data. Advanced algorithms yield accurate results, using extended
precision or floating point arithmetic wherever necessary.
Compliance-quality harmonics analyser
Introduction
The HA1600 has been designed to make harmonics measurements both quick and simple.
It measures harmonics from the 1
It is suitable for pre-compliance measurements using a normal mains supply and is capable of full
compliance measurements to EN61000-3-2 in conjunction with a suitable power source (such as
the AC1000).
Capabilities include continuous monitoring of the supply voltage, continuous comparison to
harmonic limits and timed test sequences with analysis of fluctuating harmonics.
Compliance-quality flicker meter
The HA1600 has the capability to operate as a compliance quality voltage variation and flicker
meter in conformance with EN61000-3-3 and EN61000-4-15.
Flicker severity can be measured in terms of P
analysis of voltage variations, including the calculation of the maximum value d
between steady states d
and the change characteristic d(t).
c
For pre-compliance testing, a current measurement method can be used, rather than voltage
measurement, to eliminate the need for a clean power generator and a reference impedance.
A full range of interfaces
A parallel printer interface is included, for record keeping and archiving, and also a high speed
RS-232 interface is provided for use with either a printer or remote control software running on a
PC. The HA1600A also has a USB port for use with the HA-PC Link Plus software.
st
to the 40th and updates the display in real time.
and P
st
while simultaneously performing full
lt
max
, the difference
The internal software of the instrument is stored in flash memory and can be updated through the
serial port as the requirements of the measurement standards evolve.
HA1600 and HA1600A
The two versions of the instrument are in different cases, with slightly different front panel layouts.
The HA1600A has a USB port. In all other respects the operation and performance of the two
types is identical. Both use the same firmware, and this manual applies to either type if fitted with
firmware version 2.60 or later.
2
Page 4

Specification
MAINS ANALYSER
Measurement Circuit: Single Phase with standard mains connector.
Current Rating: 16A rms continuous, or national connector rating if lower.
Voltage Ranges: 115V (± 200V pk) and 230V (± 400V pk).
Current Ranges: ± 24mA pk to ± 400A pk in fifteen 2:1 ranges.
Frequency Range: 43 – 67 Hz.
Shunt Resistance:
Sampling Rate: 300 points per cycle.
Basic Accuracy: Better than 0.2% ±1mA, up to 16A.
Measured Parameters: Vrms, Vpk, Arms, Apk, Crest factors, THD, W, VA, Power factor, Frequency,
Display Modes: Tabular display of all parameters including latest and highest inrush current.
Waveform Graph display of Voltage and Current with normal, Max hold,
Monitor Outputs: Re-constructed Voltage and Current Signals.
3mΩ.
Peak Inrush current.
accumulate and multiple cycle display modes.
HARMONICS ANALYSER
Measurements: 1st harmonic to 40th harmonic.
Measurement processing to EN61000-3-2. and EN61000–4–7
Continuous calculation, analysis and assessment of unfiltered, filtered,
average, minimum and maximum current harmonic levels and limits.
Continuous measurement and assessment of supply waveform and
harmonics.
Current Rating: 16A rms continuous, or national connector rating if lower.
Voltage Ranges: 115 (± 200V pk) and 230V (± 400V pk).
Current Ranges: ± 24mA pk to ± 400A pk in fifteen 2:1 ranges.
Frequency Range: 43 – 67 Hz.
Shunt Resistance:
Transform Windows: Continuous 4, 10, 12 or 16 cycle Discrete Fourier Transforms.
Basic Accuracy: Better than 5% of limit or 0.2% of selected range (whichever is the greater)
Display Modes: Display of load supply assessment for voltage, harmonics, crest limits and
Histogram or tabular display of supply voltage harmonics.
Histogram display of current harmonics with limits (calculated from EN61000-
Tabular display of current harmonics showing present values, limits, average
3
3mΩ (less than 150mV across shunt up to 50 Amp peak).
±1mA.
frequency against requirements defined in EN61000-3-2.
3-2), with Min. hold, Max. hold and percentage of limit display options.
values, average as percent of limit, maximum values, maximum as percent of
limit and pass or fail assessment for each harmonic.
Page 5

Test Control: Untimed, manually timed or automatically timed tests; user-defined test time.
Declaration of load class. Limits automatically determined from EN61000-3-2
for appropriate class; Class C and Class D limits can be automatically
calculated from power measurements or from ratings declared by the user.
Minimum and maximum power thresholds for limits can be changed by the
user.
Facility for declaring supply voltages other than 230V and deriving
appropriate limits. Facility for insetting test limits.
Report Printing: Direct printer connection for hard-copy report with user-entered narrative,
supply voltage assessment and current harmonic analysis and assessment.
VOLTAGE FLUCTUATIONS & FLICKER METER
Measurements:
Voltage fluctuations d
, d(t) and d
c
and flicker P
max
and P
st
lt
to EN61000-3-3 and EN61000-4-15.
Current Rating: 16A rms continuous, or national connector rating if lower.
Voltage Ranges: 115V (± 200V pk) and 230V (± 400V pk).
Fluctuation Range: 25% max (relative to nominal voltage).
Flickermeter Range: Voltage change up to 20% (sinewave change) or 10% (low repetition rate
rectangular change) relative to AGC level.
Equivalent to 6400 pu on 8.8 Hz sinewave.
Flickermeter AGC: Up to ±5%.
Flickermeter Accuracy: Better than 5% for P
range 0·7 to 10·0.
st
Frequency Range: 50 or 60 Hz (operates over 43 – 67 Hz).
Report Printing:
Tabular listing of voltage variations, P
classifier and P
st
in each Plt interval.
st
GENERAL
Display: 320 x 240 pixel backlit LCD.
Clock:
Interfaces: Parallel Printer, RS-232 (for printer or PC); also USB (for PC) on HA1600A.
Instrument Supply: 220V–240V or 110V–120V ±10%, 48 to 65Hz. Installation Category II.
Real−time clock for time and date−stamping of Report data.
Maximum instrument power 25VA. The instrument can be operated at a
different supply voltage and/or frequency from that used to supply the load.
Operating Range: +5°C to 40°C, 20-80% RH.
Storage Range: –10°C to +60°C.
Environmental: Indoor use at altitudes up to 2000m, Pollution Degree 2.
Safety: Complies with EN61010-1.
EMC: Complies with EN61326.
Dimensions (WxHxD): HA1600A: 357 x 132 x 235mm; HA1600: 305 x 148 x 220mm.
Weight: HA1600A: 4.4kg; HA1600: 4.2kg.
4
Page 6
Safety
This instrument is Safety Class I according to IEC classification and has been designed to meet
the requirements of EN61010-1 (Safety Requirements for Electrical Equipment for Measurement,
Control and Laboratory Use). It is an Installation Category II instrument intended for operation
from a normal single phase supply.
This instrument has been tested in accordance with EN61010-1 and has been supplied in a safe
condition. This instruction manual contains some information and warnings which have to be
followed by the user to ensure safe operation and to retain the instrument in a safe condition.
This instrument has been designed for indoor use in a Pollution Degree 2 environment in the
temperature range 5°C to 40°C, 20% - 80% RH (non-condensing). It may occasionally be
subjected to temperatures between +5° and -10°C without degradation of its safety. Do not
operate while condensation is present.
Use of this instrument in a manner not specified by these instructions may impair the safety
protection provided. Do not operate the instrument outside its rated supply voltages or
environmental range.
WARNING! THIS INSTRUMENT MUST BE EARTHED
Any interruption of the mains earth conductor inside or outside the instrument will make the
instrument dangerous. Intentional interruption is prohibited. The protective action must not be
negated by the use of an extension cord without a protective conductor.
When the instrument is connected to either supply, terminals may be live and opening the covers
or removal of parts (except those to which access can be gained by hand) is likely to expose live
parts. The apparatus shall be disconnected from all voltage sources before it is opened for any
adjustment, replacement, maintenance or repair.
Any adjustment, maintenance and repair of the opened instrument under voltage shall be avoided
as far as possible and, if inevitable, shall be carried out only by a skilled person who is aware of
the hazard involved.
If the instrument is clearly defective, has been subject to mechanical damage, excessive moisture
or chemical corrosion the safety protection may be impaired and the apparatus should be
withdrawn from use and returned for checking and repair.
Make sure that only fuses with the required rated current and of the specified type are used for
replacement. The use of makeshift fuses and the short-circuiting of fuse holders is prohibited.
This instrument uses a Lithium button cell for the real-time clock and non-volatile memory battery
back-up; typical life is 3 years. In the event of replacement becoming necessary, replace only with
a cell of the correct type, i.e. 3V Li/Mn0
disposed of carefully in accordance with local regulations; do not cut open, incinerate, expose to
temperatures above 60°C or attempt to recharge.
Do not wet the instrument when cleaning it and in particular use only a soft dry cloth to clean the
LCD window. The following symbols are used on the instrument and in this manual:-
Caution -refer to the accompanying documentation, incorrect
operation may damage the instrument.
20mm button cell type 2032. Exhausted cells must be
2
Terminal connected to chassis ground.
Alternating current.
5
Page 7

EC Declaration of Conformity
We Thurlby Thandar Instruments Ltd
Glebe Road
Huntingdon
Cambridgeshire PE29 7DR
England
declare that the
HA1600A Power and Harmonics Analyser
meets the intent of the EMC Directive 2004/108/EC and the Low Voltage Directive 2006/95/EC.
Compliance was demonstrated by conformance to the following specifications which have been
listed in the Official Journal of the European Communities.
EMC
Emissions: EN61326 (1998) Radiated, Class B
a) EN61326 (1998) Conducted, Class B
b) EN61326 (1998) Harmonics, referring to EN61000-3-2 (2000)
Immunity: EN61326 (1998) Immunity Table 1, Performance B, referring to:
a) EN61000-4-2 (1995) Electrostatic Discharge
b) EN61000-4-3 (1997) Electromagnetic Field
c) EN61000-4-11 (1994) Voltage Interrupt
d) EN61000-4-4 (1995) Fast Transient
e) EN61000-4-5 (1995) Surge
f) EN61000-4-6 (1996) Conducted RF
Safety
EN61010-1 Installation Category II, Pollution Degree 2.
6
CHRIS WILDING
TECHNICAL DIRECTOR
2 February 2007
Page 8

This instrument has been designed to meet the requirements of the EMC Directive 2004/108/EC.
Compliance was demonstrated by meeting the test limits of the following standards:
Emissions
EN61326 (1998) EMC product standard for Electrical Equipment for Measurement, Control and
Laboratory Use. Test limits used were:
a) Radiated: Class B
b) Conducted: Class B
c) Harmonics: EN61000-3-2 (2000) Class A; the instrument is Class A by product category.
Immunity
EN61326 (1998) EMC product standard for Electrical Equipment for Measurement, Control and
Laboratory Use.
Test methods, limits and performance achieved were:
a) EN61000-4-2 (1995) Electrostatic Discharge, 4kV air, 4kV contact, Performance B.
b) EN61000-4-3 (1997) Electromagnetic Field, 3V/m, 80% AM at 1kHz, Performance B.
EMC
c) EN61000-4-11 (1994) Voltage Interrupt, 1 cycle, 100%, Performance A.
d) EN61000-4-4 (1995) Fast Transient, 1kV peak (AC line), 0.5kV peak (signal lines and
e) EN61000-4-5 (1995) Surge, 0.5kV (line to line), 1kV (line to ground), Performance A.
f) EN61000-4-6 (1996) Conducted RF, 3V, 80% AM at 1kHz (AC line only; signal
According to EN61326 the definitions of performance criteria are:
Performance criterion A: ‘During test normal performance within the specification limits.’
Performance criterion B: ‘During test, temporary degradation, or loss of function or
performance which is self-recovering’.
Performance criterion C: ‘During test, temporary degradation, or loss of function or
performance which requires operator intervention or system reset occurs.’
Cautions
To ensure continued compliance with the EMC directive the following precautions should be
observed:
a) After opening the case for any reason ensure that all signal and ground connections
I/O ports), Performance A.
connections <3m, therefore not tested), Performance A.
are remade correctly before replacing the cover. Always ensure all case screws are
correctly refitted and tightened.
b) In the event of part replacement becoming necessary, only use components of an
identical type, see the Service Manual.
Note that the conducted emissions measured on the LOAD POWER connection of the
HA1600 will be those of the load itself since the HA1600 contains no filtering on this
connection. When making measurements on non-compliant loads, therefore, care must be
taken to ensure that its emissions do not interfere with other equipment.
7
Page 9

Mains Operating Voltage – Instrument Power
Before making connections to the AC line source ensure that the operating voltage of the
instrument is correctly set. The operating voltage is indicated by the orientation of the fuseholder.
When the 230V marking is upwards, the unit is set for operation over the range 198V to 264V.
When the 115V marking is upwards, the unit is set for operation over the range 99V to 132V. To
change the operating voltage range, remove the AC line plug, pull out the fuse holder, replace the
fuse with one of the appropriate rating (see below) and rotate the fuse holder before pushing it
firmly back into place.
Safety Note: To fully disconnect the Instrument Power from the AC supply, unplug the mains
cord from the INSTRUMENT POWER inlet or from the AC supply outlet.
Mains Operating Voltage – Load Power
The fixed LOAD POWER mains lead is an independent connection, which provides power to the
appliance connector on the front panel; it can be at a different voltage and frequency from the
instrument power. The maximum permitted load power voltage is 264Vrms and the frequency
range is 43 - 67Hz.
For full compliance measurements to EN61000-3-2 the load power lead should be connected to
an AC supply that meets the voltage, frequency and harmonics requirements defined in the
standard; the AC1000 low distortion power source can be used for this purpose.
Installation
Safety Note: To fully disconnect the Load Power from the AC supply unplug the mains cord
from the AC supply outlet.
Fuse – Instrument Power
The correct time-lag fuse must be fitted for the selected operating voltage.
For 230V operation use 250mA (T) 250V time-lag HBC
For 115V operation use 500mA (T) 250V time-lag HBC
Make sure that only fuses with the required rated current and of the specified type are used for
replacement. The use of makeshift fuses and the short-circuiting of fuse holders are prohibited.
Fuse – Load Power
A high voltage, high breaking current, fuse is fitted internally in the load power circuit. The correct
fuse type is: 20A 500V HBC Type aM or gL.
Make sure that only fuses with the required rated current and of the specified type are used for
replacement. The use of makeshift fuses and the short-circuiting of fuse holders are prohibited.
Mains Lead
When a three core mains lead with bare ends is provided this should be connected as follows:
BROWN - MAINS LIVE
BLUE - MAINS NEUTRAL
GREEN/YELLOW - EARTH
8
WARNING ! - THIS INSTRUMENT MUST BE EARTHED
Any interruption of the protective conductor inside or outside the instrument will make the instrument
dangerous. Intentional interruption is prohibited
.
Page 10

Front Panel Connections
Appliance Connector
The load under test should be plugged into the front panel appliance connector. Power to the
connector is supplied from the fixed
which is controlled by the
instrument power (e.g. the
from the appliance socket.
A wide choice of national appliance connectors is available but the connector is factory fitted and
cannot be changed by the user. The maximum load current that can be supplied is the rating of
the connector, or 16Arms, whichever is lower.
Voltage and Current Monitor
The Voltage Monitor and Current Monitor BNC sockets output reconstructed, scaled versions of
the load power voltage and current waveforms referenced to instrument ground, permitting direct
connection to other instruments such as an oscilloscope. The output voltage is approximately
2.5V pk-pk for a full-scale signal on any current or voltage range.
LOAD switch. If the LOAD switch is in the OFF position, or if there is no
POWER switch is OFF) then the load power supply is disconnected
Connections
LOAD POWER cable via an internal 20A fuse and a relay
Rear Panel Connections
Instrument Power and Load Power
The IEC inlet supplies power for the instrument only; the fixed lead supplies the load power to the
front panel appliance connector. Refer to the Installation section.
USB
The USB interface is intended for communication with a PC running the HA-PC Link Plus
software. See software installation section for information about device driver requirements.
RS232
The RS232 interface should be connected to a standard PC port using a fully wired 1-1 malefemale cable without any crossover connections. It may also be used with a serial printer.
The 9-pin female D-connector has the following pin-out:
Pin Name Direction Description
1 DCD O
2 TXD O Transmitted data to computer
3 RXD I Received data from computer
4 DTR I Computer can receive
5 GND Signal ground
6 DSR O
7 RTS ( I ) Assumed asserted
8 CTS O Computer may send
9 RI No connection
Passively asserted (+10V through 10kΩ)
Passively asserted (+10V through 10kΩ)
The signal ground is connected to instrument ground. The Baud rate is fixed at 115,200.
Printer
25-way female D-connector configured as a standard parallel (Centronics) printer port. Connect
directly to a suitable printer using a standard shielded cable.
9
Page 11

Initial Operation
This section is a general introduction to the organisation of the instrument and is intended to be
read before using it for the first time. Detailed descriptions of each function are given in later
sections, starting with Power Meter.
In this manual front panel keys and connectors are shown in capitals, e.g.
MONITOR; all soft-key labels, messages and data values displayed on the LCD are shown in a
different type font, e.g. Setup Range, Load Declared Class A.
Switching On
With both the POWER and LOAD switches in the OFF position connect the INSTRUMENT POWER
lead to the standard AC supply and connect the
source as described in the Installation section.
Switch the POWER switch to ON to turn the instrument power on; the display will show the
Initialisation screen for a few seconds followed by the Select screen. A 20 second time-out is
started, with a count down shown on the display. If no key is pressed during this time out, or if the
Resume Operation soft-key (F5) is pressed, the instrument will continue operation using the
Test and Report parameters automatically stored at the last power−down; the parameter settings
stored are given in the table at the end of this chapter. The instrument will start up with the LCD
showing the Waveform Graph display. The display will show the load voltage waveform, which will
appear to be unstable for 4 to 5 seconds or more until the sampling clock synchronises exactly
with the incoming supply; the display will then show a single cycle of the voltage waveform with
the rising zero-crossing point at the left edge.
The second soft-key option on the Select screen is Restore Defaults; this continues
operation with all parameters defaulted to their original factory setting. The stored parameters and
their default settings are listed in the table at the end of this chapter.
METER, VOLTAGE
LOAD POWER lead to a suitable low distortion AC
The final soft-key option is Setup, which gives access to a further screen where the soft-keys
are Restart and Update Software. Restart returns the instrument to the Initialisation
screen. Update Software selects the mode in which the instrument’s software can be
updated from a PC via its RS232 port; see the section of the Maintenance chapter for details.
If the load is now connected and the
will also show in the display; the instrument will auto-range to show the current waveform at the
best resolution achievable. Load power is disconnected, even if the LOAD switch is ON, when
INSTRUMENT POWER is turned off.
Safety Note: Neither the POWER switch, nor the LOAD switch, fully disconnect their respective
AC supplies when switched to the OFF position. To fully disconnect from the AC supply unplug
the mains cords from the AC supply outlets; make sure that the means of disconnection are
readily accessible. Disconnect from the AC supplies when not in use.
Display Contrast
The contrast of the LCD may vary a little with changes of ambient temperature or viewing angle
but can be optimised for a particular environment by using the front panel contrast control. Insert
a small screwdriver or trimmer tool through the adjustment aperture marked LCD and rotate the
control for optimum contrast.
Keyboard
The keys on the front panel can be considered in the following groups:
LOAD switch also turned to ON the load current waveform
10
• The five keys beneath the LCD. When the green VIEW lamp is lit these are used to directly
call each of the five main display views (METER for Power Meter, WAVE for Waveform Graph,
etc.). In addition, when the set-up screen for each of these views is displayed (by pressing the
SET-UP / VIEW key to light the red SET-UP lamp) they become 'soft-keys' which take the
functions shown immediately above them in boxes on the LCD.
Page 12

• The four cursor keys marked and are used to move the edit zone (shown as an
outline box) around the editable fields of a set-up display. For each position of the edit zone
the keys below the display have the functions shown immediately above them in boxes on the
LCD; the functions change as the edit zone is moved which is why they are called 'soft' keys.
The cursor keys auto-repeat when held down.
• Numeric keys permit direct entry of values in certain set-up displays. ENTER confirms a
numeric entry and
CANCEL terminates the entry without changing the parameter to the new
value.
• START TEST and STOP TEST have specific functions determined by the type of test selected
on the Test Control set-up display; full details are given in the Test Control section.
• The
LOCAL key switches the instrument between remote and local (keyboard) control.
Stored Settings and their Factory Defaults
The following parameters have their current setting stored at power−down; these are recalled at
power−up if Resume Operation is selected. If Restore Defaults is selected instead, the
settings are those shown in the Defaults Setting column.
Parameter Default Setting
Nominal Voltage and tolerance 230V ± 2%
Nominal Frequency and tolerance 50Hz ± 0.5%
Test Duration Standard value for each mode.
Assessment inset 1.00
Operating Mode EN61000-3-2:2000 Harmonics (Edition 2)
Load Classification Class A
Class C Limit basis, current and PF Automatic (maximum fundamental current)
Class D Limit basis and power Automatic (maximum power)
Class D minimum power 75W
Class D − A cross−over power (1995)
600W
Flicker sensing method Voltage
Simulated Flicker Reference Impedance
limit
d
max
0.4 + j 0.25 Ω
4 %
d(t) limit * < 500 ms above 3.3%
d
c
limit
* 3.3 %
Steady State Definition * > 1000 ms within ±0.32%
Switching sequence On and Off time 1000 cycles
Switching sequence On and Off phase 0 degrees
Left Margin (of Report) 5 characters
Report No. 1
* These values reflect the 2001 Amendment to EN 61000-3-3.
Note that the Report’s Header, Title and Footer text is not restored to the original form by the
Restore Defaults choice; the text can only be changed by entering new characters.
11
Page 13
Power Meter View
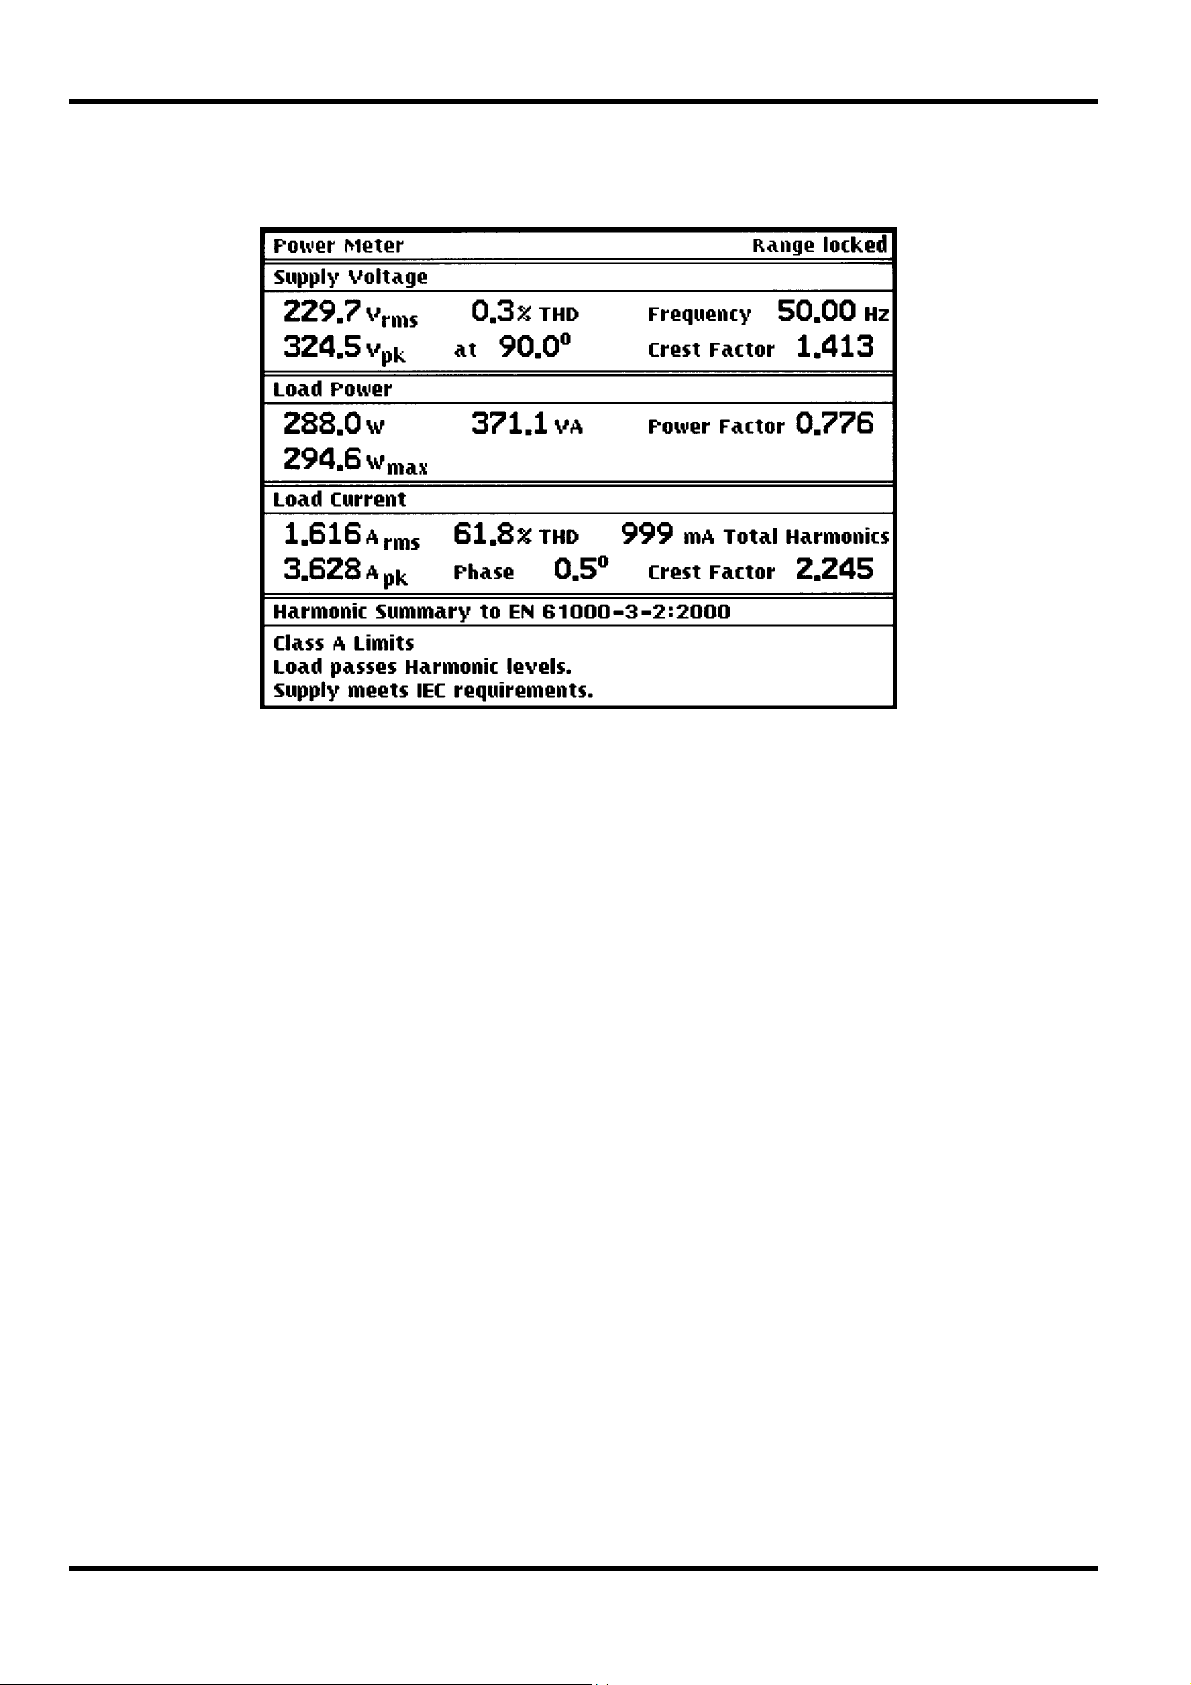
With the green VIEW lamp lit, press the METER key to display the Power Meter view.
The Power Meter view gives a continuously updated display of the major parameters of the
supply voltage and load current, together with an instantaneous summary of whether the supply
and load meet the limits of the harmonics standard.
The Supply Voltage group shows the Vrms and frequency of the load power supply, together
with its total harmonic distortion (THD), peak voltage (Vpk), the phase of the peak with respect to
the zero-crossing point and the calculated crest factor (Vpk/Vrms).
For compliance quality measurements, the load power supply must meet the following
requirements:
Harmonics (max % of fundamental) 0.9% : 3
0.4% : 5
0.3% : 7
0.2% : 9
0.1% : even 2
0.1% : all 11
rd
th
th
th
nd
– 10th
th
– 40th
Voltage 230 Vrms ± 2%
Frequency 50Hz ± 0.5%
Crest Factor (Vpk/Vrms) Between 1.40 and 1.42
Phase of Vpk Between 87° and 93° after zero crossing
All the above parameters are continuously monitored. All supply parameters are compared
against the limits and a pass or fail indication is given in the Harmonic Summary section of the
display.
12
The Load Power group shows the true power (Watts), apparent power (V.A) and power factor
(W/V.A). The maximum value of the true power is also shown.
The Load Current group shows the rms and peak load currents, together with the total
harmonic distortion (THD), the phase of the current peak, the calculated crest factor (Ipk / Irms)
and the total harmonic current (this is the rms sum of all the harmonics between 2 and 40 and
can be used to find a worst case operating condition of the load under test).
Page 14

The Harmonic Summary group gives a simple overview of the supply and load harmonic
status. It states whether the supply passes or fails the specified requirements; compliance quality
measurements can obviously only be made with a supply that meets the harmonics, voltage,
frequency, crest factor and phase requirements described earlier. It also states the load class as
declared by the user and any power related exclusions detected by the analyser; refer to the Test
Control section. Lastly the display states whether the load current passes or fails the harmonics
limits of the Class shown.
When the instrument is operated in Inrush or Flicker mode the region at the bottom of the screen
is used to display a summary of those measurements instead of the Harmonic Summary. In
Flicker mode two further display pages are available: one showing Voltage Variations and the
second Flicker Results. For full details, see the relevant chapters in this manual.
13
Page 15

With the Power Meter view displayed, pressing SET-UP shows the Power Meter set-up screen,
which gives access to the Setup Range soft-key. In Flicker mode, it also gives access to the
Flicker and Voltage Variations result pages. See the Flicker Meter chapter for details.
Set-up Range
Pressing the Setup Range soft-key (on either the Meter or Waveform Graph views) changes
the display to a graphical view of the current waveform with three further soft-keys: Up, Down
and Lock Range. Pressing any of these turns off auto-ranging; the Lock Range key keeps
the present measurement range, while the Up and Down keys change the range in x2 and ÷2
steps respectively. The scaling of the waveform display changes to reflect the peak capability of
the new range and the maximum current is shown in the bottom left-hand corner of the display;
for example, 1500mA peak means that the top of the display represents +1500mA and the
bottom represents –1500mA with respect to the centre zero line.
The range can be set from 24mA peak to 400A peak in 2:1 steps. The waveform display on this
set-up screen is always updated every cycle, regardless of the mode set up for the Waveform
Graph view.
Important Note: To take compliance quality measurements the range must not change during the
Power Meter Set-up
test. The user must select a range that will accommodate the highest waveform
peak that will be encountered during the load’s operating cycle. It is therefore
recommended that a preliminary assessment of the load should be made, with
the instrument in auto-range mode, to determine the highest peak current
operating condition. The instrument should then be locked on this range to
ensure that harmonics measurements are correct and that the derived values
(Average, Max Hold and Min Hold etc.) are meaningful.
If too low a range is chosen, no damage will be done, but all the measurement
results will be invalid and the message Overload will show in the status line at
the top of the Meter View display. It is more important to maintain adequate
‘headroom’ for the measurement, i.e. to avoid overload, than it is to maximise
the vertical resolution on the Waveform Graph view; measurement accuracy is
maintained even when the vertical scaling of the display is well below optimum.
Once the range is locked, the Lock Range soft-key label becomes Auto Range; pressing
this key releases the lock and allows the instrument to auto-range on the present waveform.
Several other soft-keys 'toggle' between alternate choices in this way; it is only necessary to
remember that at any time the soft-key box shows what will happen when the key is pressed.
Having set the range (or selected auto-range), the previous view can be recalled by pressing the
VIEW key.
Auto-ranging is only available in Harmonics operating mode (see the Test Control section). Note
that auto-ranging is disabled while the LOAD switch is OFF to prevent the instrument autoranging to the most sensitive range when there is no load current. At switch-on the default range
is 3A peak if the LOAD switch is OFF; at other times, switching the LOAD to OFF locks the range
at the setting currently in use.
In Flicker mode with voltage sensing, the range can be manually changed, but should be left at a
setting that avoids overload at any time during the test. When current sensing is selected, the
range is fixed to suit the requirements of the calculations and cannot be changed.
On selecting Peak Inrush mode, the highest current range is initially set; it can be manually
changed as required.
14
Page 16
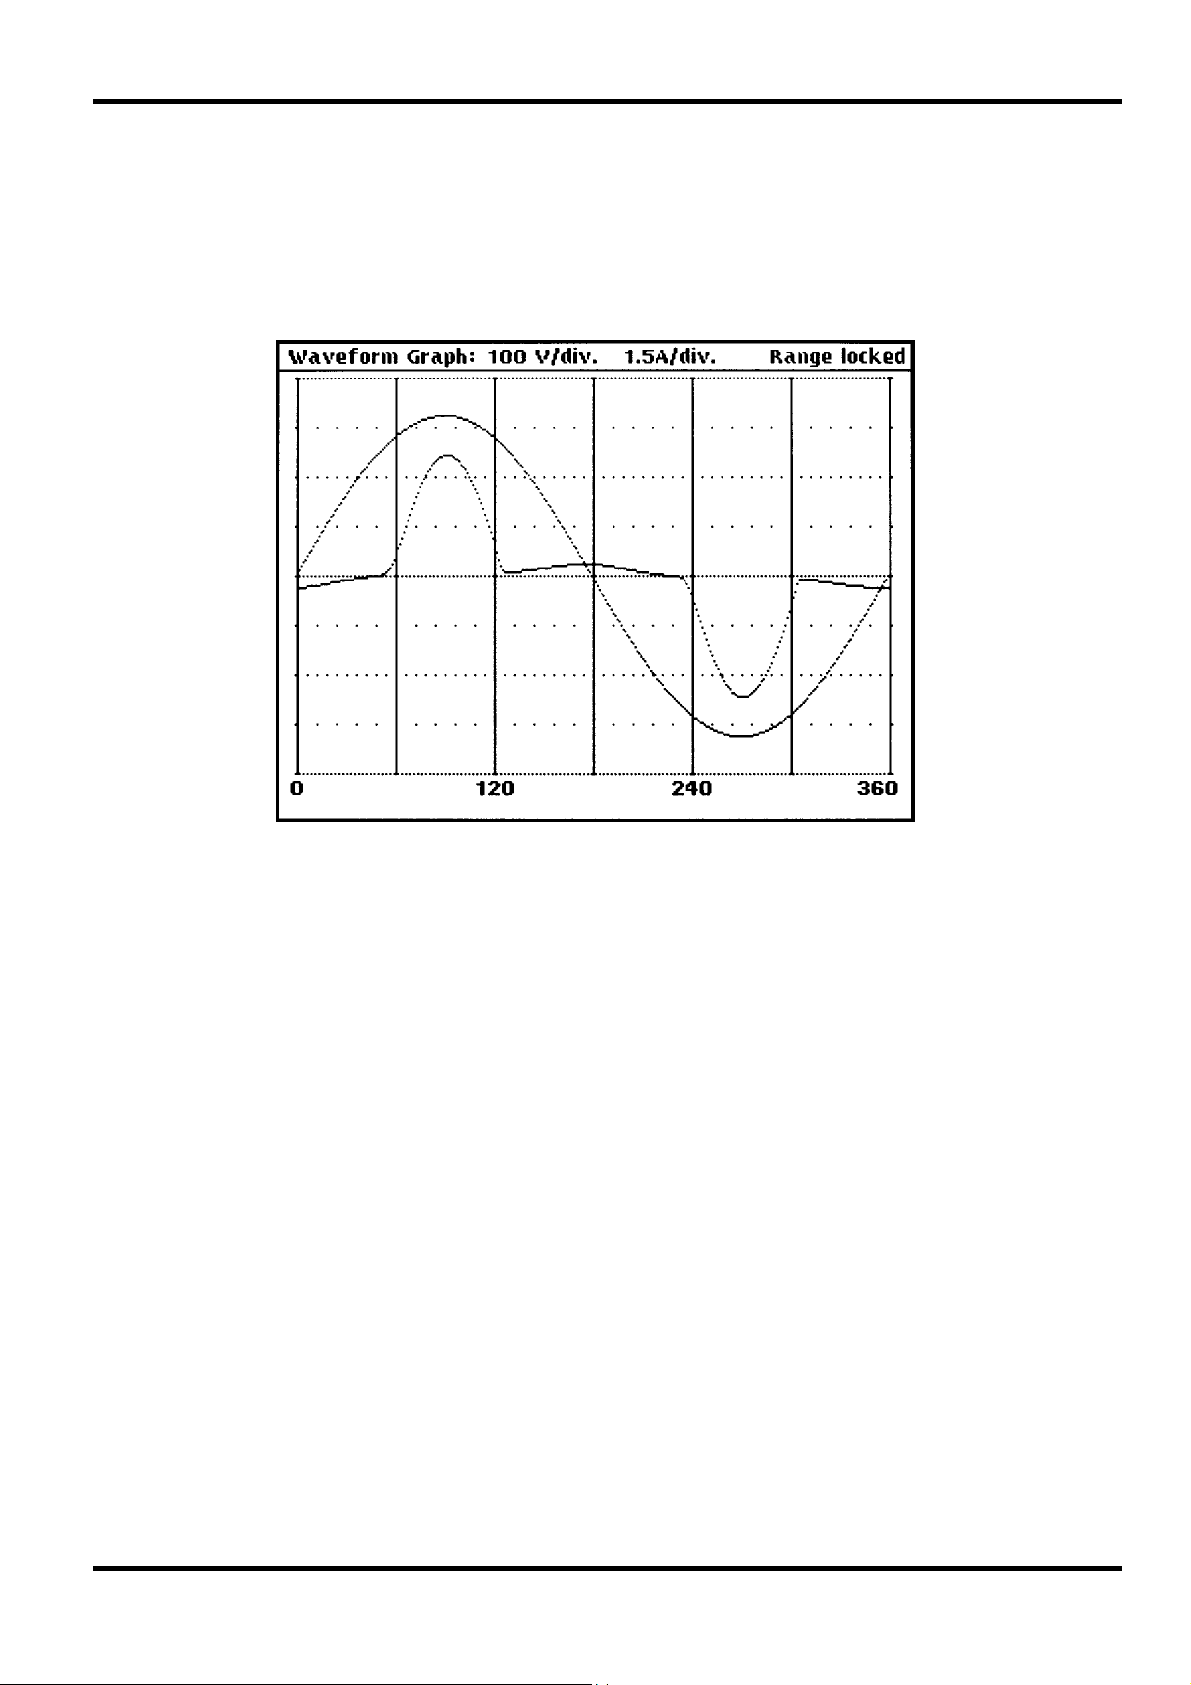
Waveform Graph View
The Waveform Graph display (which is the default display at instrument switch on) can be
selected by pressing the WAVE key whenever the green VIEW lamp is lit. The default format of
the display is a full-screen view of both the voltage and current waveforms. The format of the
display can be changed in various ways as described in the Waveform Graph Set-up section
below.
At the top of the display the scaling for both voltage and current are given. There are 8 divisions
vertically, thus 100mA/div is the scaling shown if the ± 400mA peak range has been selected
on the set-up screen. In auto-range mode (the default condition) the most sensitive range that
gives an in-range display is automatically selected. To avoid excessive range changes when the
measurement is near a range boundary the instrument auto-ranges up at full-scale and autoranges down at about 0.44 times full-scale.
The voltage display has two ranges only: 100V/div, for nominal 230V supplies, and 50V/div for
nominal 115V supplies; the voltage range is set by declaring the nominal voltage on the Test
Control set-up display.
The X-axis of the single cycle display is divided into 6 divisions, each representing 60° of phase.
The rising zero-crossing point of the single voltage waveform cycle displayed is positioned at the
left edge of the display for the default selection of voltage as the Trigger Source; this will change if
alternative Trigger Sources are selected, see Trigger Source section.
The X-axis is marked every 180º of the 2 cycle display and every cycle of the 4 and 10 cycle
displays.
15
Page 17
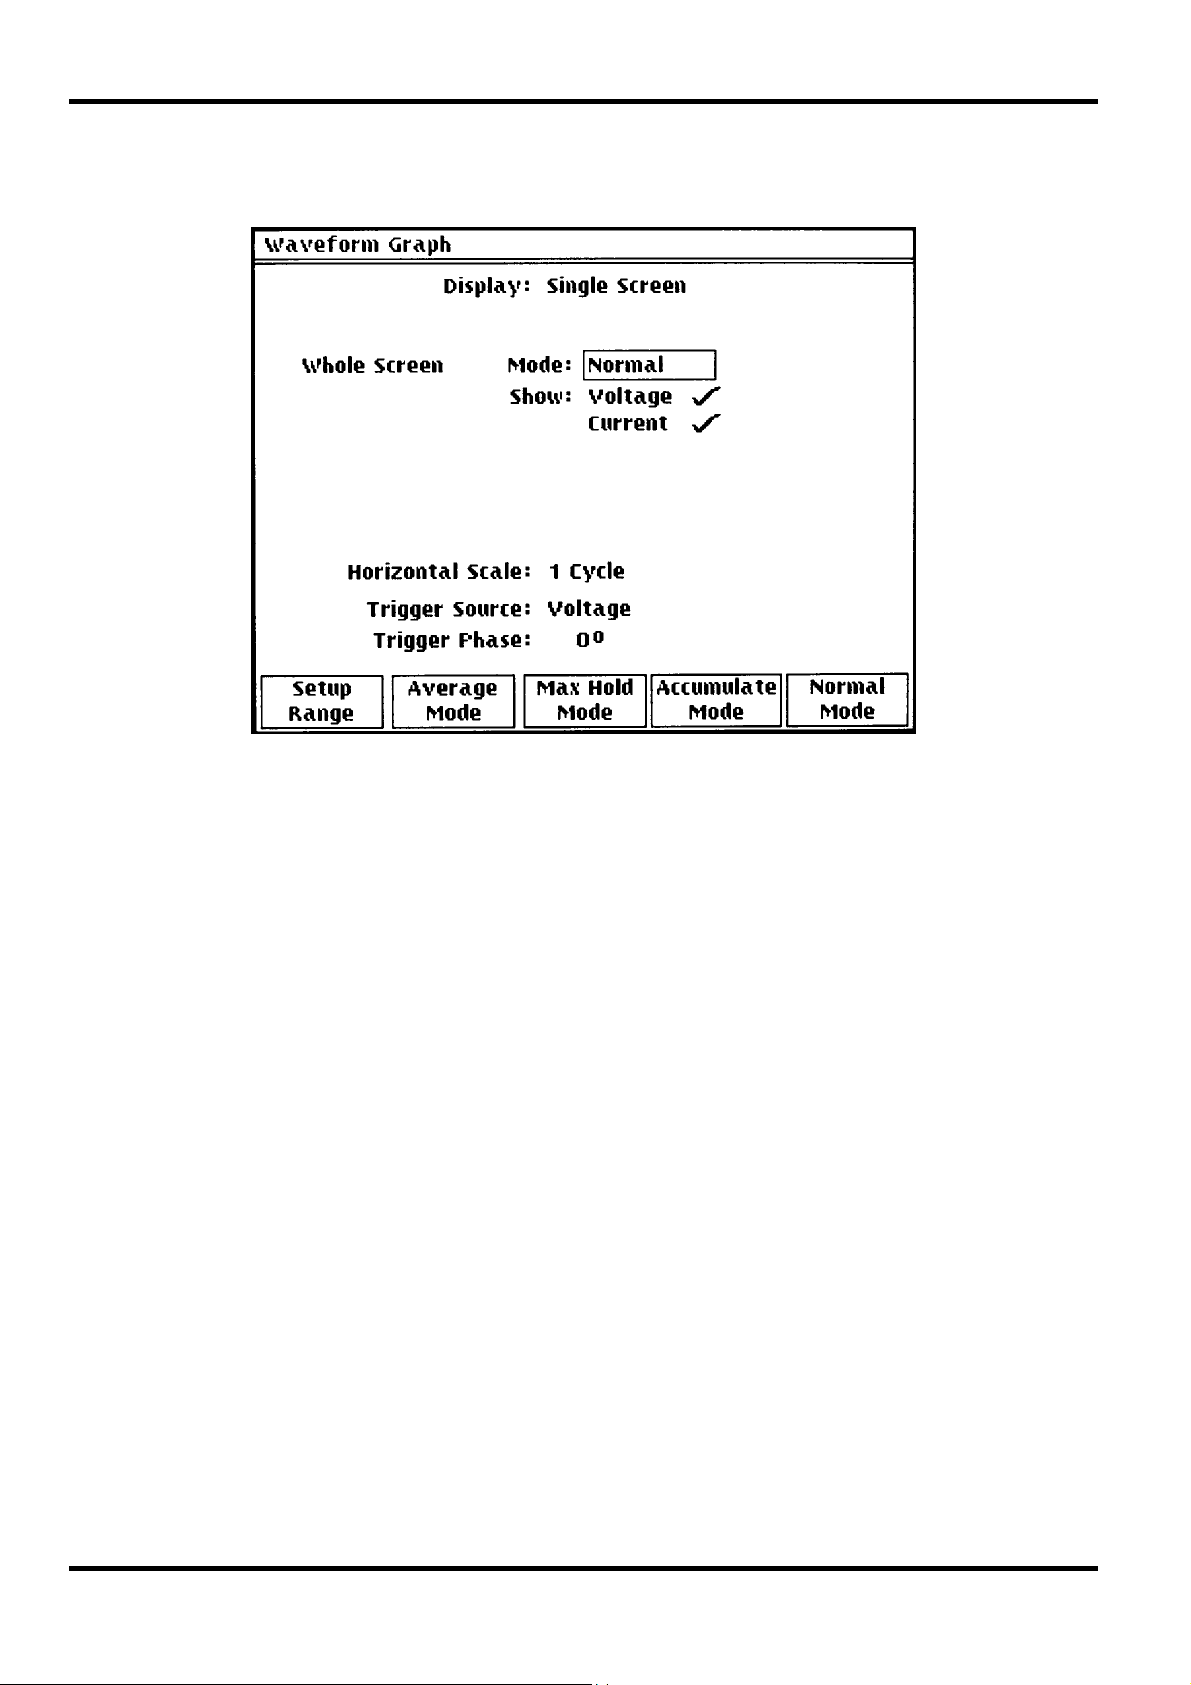
Waveform Graph Set-up
With the Waveform Graph view displayed, pressing SET-UP shows the Waveform Graph set-up
screen.
With the exception of the Setup Range key, the functions of the soft-keys change as the edit
zone is moved through the editable fields of the display using the
described below. Pressing the VIEW key returns the display to the Waveform Graph view.
Set-up Range
Pressing the Setup Range soft-key (on either the Meter or Waveform Graph views) changes
the display to a graphical view of the current waveform with three further soft-keys: Up, Down
and Lock Range. Pressing any of these turns off auto-ranging; the Lock Range key keeps
the present measurement range, while the Up and Down keys change the range in x2 and ÷2
steps respectively. The scaling of the waveform display changes to reflect the peak capability of
the new range and the maximum current is shown in the bottom left-hand corner of the display;
for example, 1500mA peak means that the top of the display represents +1500mA and the
bottom represents –1500mA with respect to the centre zero line. The range can be set from 24mA
peak to 400A peak in 2:1 steps. The waveform display on this set-up screen is always updated
every cycle, regardless of the mode set up for the Waveform Graph view.
Important Note: To take compliance quality measurements the range must not change during the
keys; each field is
test. The user must select a range that will accommodate the highest waveform
peak that will be encountered during the load’s operating cycle. It is therefore
recommended that a preliminary assessment of the load should be made, with
the instrument in auto-range mode, to determine the highest peak current
operating condition. The instrument should then be locked on this range to
ensure that harmonics measurements are correct and that the derived values
(Average, Max Hold and Min Hold etc.) are meaningful.
If too low a range is chosen, no damage will be done but all the measurement
results will be invalid and the message Overload will show in the status line at
the top of the Meter View display. It is more important to maintain adequate
‘headroom’ for the measurement, i.e. to avoid overload, than it is to maximise
the vertical resolution on the Waveform Graph view; measurement accuracy is
maintained even when the vertical scaling of the display is well below optimum.
16
Page 18

Screen
Once the range is locked, the Lock Range soft-key label becomes Auto Range; pressing
this key releases the lock and allows the instrument to auto-range on the present waveform.
Several other soft-keys 'toggle' between alternate choices in this way; it is only necessary to
remember that at any time the soft-key box shows what will happen when the key is pressed.
Auto-ranging is only available in Harmonics operating mode (see the Test Control section). Note
that auto-ranging is disabled while the LOAD switch is OFF to prevent the instrument autoranging to the most sensitive range when there is no load current. At switch-on the default range
is 3A peak if the LOAD switch is OFF; at other times, switching the LOAD to OFF locks the range
at the setting currently in use.
In Flicker mode with voltage sensing, the range can be manually changed, but should be left at a
setting that avoids overload at any time during the test. When current sensing is selected, the
range is fixed to suit the requirements of the calculations and cannot be changed.
On selecting Peak Inrush mode, the highest current range is initially set; it can be manually
changed as required.
Having set the range (or selected auto-range), the Waveform Graph view can be recalled by
pressing the VIEW key.
With the edit zone in the Screen field, the soft-key choices are Single Screen and
Split Screen. The default mode is Single Screen, which uses the whole display with
8 vertical divisions. Split Screen changes the screen into 2 separate displays, each with
4 vertical divisions; this is particularly useful when the current waveform is essentially in phase
with the voltage and displaying both together would cause confusion. At the same time the
Waveform Graph set-up display changes to add extra editable fields (mode and Traces) for the
second display, see below.
Mode
With the edit zone in the mode field the soft-key choices are as follows:
Normal:
Accumulate:
Max Hold:
The display is updated every waveform cycle. This is the default mode.
The display is written to every waveform cycle without erasing the previous
data. A history of the waveform is built on the screen, which means that shortterm aberrations can be captured.
The Accumulated display is lost when the view is changed, and can be
manually cleared at any time by pressing the VIEW key twice. Since it is also
automatically cleared at every range change it may be necessary to lock the
current range, see Set-up Range section above. For clarity, it is recommended
that only one waveform be accumulated, by selecting either Voltage or Current
(see Traces section below).
The display is updated every waveform cycle with the greater of the new and
existing value at every point on the display.
The Max Hold algorithm keeps the largest amplitude (positive or negative) for
each pixel. This often results in an apparent small discontinuity in the
maximum hold waveform at the zero-crossing point.
The Max Hold data can be manually reset at any time by pressing the START
key. It is also automatically reset at every range change, so it may be
necessary to lock the current range, see Set-up Range section above.
Average:
When split screen is selected, the modes for the upper and lower screens can be set
independently. Changing between single screen and split screen will also change the modes to
those last used for that screen set-up. The modes are maintained when the view is changed.
17
The display is updated every waveform cycle with a rolling average of the last
8 cycles. This mode offers a degree of noise reduction.
Page 19

Traces
With the edit zone in the Show Traces field the soft-keys are Voltage and Current.
Alternate presses of each key will turn that trace on and off; confirmation is given by a or X
against the corresponding trace name in the Show Traces edit zone.
The default setting for single screen is both traces selected. If split screen is selected, the default
is Voltage only on the upper screen and Current only on the lower screen. However, any
combination of traces can be set on either screen.
Horizontal Scale
With the edit zone in the Horizontal Scale field, the soft-keys allow the choice of 1, 2, 4 or
10 cycles of the waveform across the width of the screen. When split screen is selected, both
graphs have the same horizontal scale. There are some restrictions on the facilities available in
the multi-cycle displays: the Max Hold and Average modes are only available for a 1 cycle display.
The 10 cycle display can only show Current and is not available in all modes (it is mainly used in
Peak Inrush mode). No action is required from the user; the soft-keys only offer available options
and any conflicting selections are automatically ignored. The set-up display changes to describe
the graphs that will actually be shown.
Trigger Source
With the edit zone in the Trigger Source field the signal source for the display
synchronisation can be selected. Note that this is the trigger source for the display only and does
not affect the measurement synchronisation. The soft-key choices are:
Voltage
Current
Internal
Inrush
When split screen is selected, both graphs have the same trigger point and are exactly
synchronised.
Trigger Phase
This field defines the phase of the waveform (relative to its rising zero crossing) to be set at the
left hand edge of the display. The required value may be entered using the number keys followed
by ENTER. Values between –999 and 999 are accepted and converted into the range 0 to 359
degrees.
The default condition: the rising zero-crossing point of the voltage waveform is
set at the left hand edge of the display.
Sets the rising zero-crossing point of the current waveform at the left hand edge
of the display.
Synchronises the display with the internal data buffers; this can be useful under
some circumstances when asynchronous components in a voltage or current
waveform cause display jitter. The actual synchronisation point is arbitrary; it is
determined at instrument switch-on and will be different if the instrument is
switched off and then on again. The trigger phase setting can be used to move
the waveform if desired.
Provides a single shot display refreshed whenever there is an Inrush event. The
trigger occurs whenever the peak current in a cycle is more than twice the peak
current in the previous cycle.
18
Page 20

Harmonics View
With the green VIEW lamp lit, press the HARMONICS key to display the Harmonics view. The
default display is a current harmonics histogram.
The harmonics histogram can be set to show either absolute harmonic levels or levels as a
percentage of individual limits; it can also be modified to show, for example, odd harmonics only.
The histogram bar for each harmonic is made up of two parts: an inner section, which is normally
used to show the presently measured value, and an outer section which by default shows the EN
specification limit for that harmonic. Other combinations may be selected.
The harmonics can also be listed in a table, with limits. The table has two forms: a compact form
showing all 40 harmonics and a detailed form, separated into two pages, showing full results on
either all the even or all the odd harmonics. Additionally, the harmonics of the supply voltage can
also be displayed in histogram and table form.
All the above view options are set from the Harmonics set-up screen; full descriptions of each are
given in the Harmonics Set-up Section. The measurement parameters and the classification of
the unit under test are made on the Test Set-up screen and are described in that section of this
manual.
19
Page 21

Harmonics Set-up
With the Harmonics view displayed, pressing SET-UP shows the Harmonics set-up screen.
The soft-key functions change as the edit zone is moved through the editable fields of the display
using the
to the Harmonics view. The selections made for each of the display formats are stored until the
instrument is switched off.
keys; each field is described below. Pressing the VIEW key returns the display
Waveform Selection
With the edit zone in the Display Harmonics of field, the soft-key choices are Current
Waveform and Voltage Waveform. Current harmonics are the default choice, for which the
full range of display and measurement mode options described previously are available. When
Voltage harmonics are selected, a restricted choice of display and measurement modes applies
as explained in the appropriate sections.
Display Format - Histogram
With the edit zone in the Display Format field, the soft-key choices are Histogram, Odd
Table, Even Table and Combined Table.
With Histogram selected as the Display Format the further editable fields of Vertical
Scale, Data Selection and Show are available; these can be used to optimise the form of
the histogram for particular measurement. In the power-up default form shown in the Harmonic
View section, for example, the histogram shows all harmonics and limits as absolute values.
All histograms are of the same general form as the default version. The horizontal scale is
marked with the harmonic number, odd harmonics & limits are shown as wide bars and even
harmonics & limits are shown as narrow bars. The fundamental is shown to the left of the second
harmonic as a wide bar and the DC component is shown to the left of the fundamental as a
narrow bar. More information about what combinations of data can be shown in the display is
given in the Data Selection and Show sections below.
20
Page 22

Vertical Scale
With the edit zone in the Vertical Scale field the soft-key choices are Absolute or
Percent Limit. With the default condition of Absolute, the initial scaling is determined by the
instrument’s measurement range. However, the scaling can be changed easily using the
and keys; the key increases the resolution, permitting a ‘zoom’ view of low level
harmonics, and the
view. In this way any harmonic can be observed with optimum display resolution. Changing this
display resolution does not affect the hardware measurement range, which, for correct operation
of the transform processing, must always be chosen so the waveform peak is in-range; see the
Important Note in the Power Meter Set-up section.
Measuring and reporting absolute harmonic levels is necessary during development and type
approval exercises but a quicker pass or fail assessment can be made by viewing harmonics as a
percentage of their individual limits; this is more appropriate in a Q.A. situation, for example. With
the edit cursor in the Vertical Scale field, selecting Percent Limit and returning to the
key reduces resolution, bringing off-screen harmonics and limits into
Harmonics View gives the following display.
The horizontal scale is marked with the harmonic number as before but now the vertical scale is
0 to 200% of limit. The value of each harmonic is shown as a percentage of its individual limit;
where the limit changes with the power level, e.g. Class D products, the harmonic level is shown
as a percentage of its instantaneous limit corresponding to that measurement. The Percent Limit
display thus gives an instant view of harmonic performance, even as absolute levels change,
without having to adjust display scaling.
Note that when Percent Limit is selected as the display mode the Data Selection field (see
next section) is forced to Normal & Max Hold, so the inner (solid) bars represent the
instantaneous harmonic values and the tops of the outer bars mark the maximum value reached
by each harmonic. The Max Hold can be reset at any time by pressing the START key and is
automatically reset when the measurement range is changed or auto-ranges. Only those
harmonics that are subject to a limit are shown.
21
Page 23

When Absolute is selected for the Vertical Scale, moving the edit zone to Data Selection,
changes the soft-key choices to Normal & Limit (the default), Max Hold & Limit,
Normal & Max Hold and Min & Max Hold. These keys determine which parameters the
inner (solid) bars and outer (open) bars of the histogram represent. For example, with the default
selection of Normal & Limit the individual limits are shown by the open outer bars while the
normal (instantaneous) values of the harmonics are shown by the solid inner bars, ‘thermometer’
style. Note that, in this example, the limits might also be changing dynamically (e.g. for a Class D
device whose power is increasing) and that the solid inner bar may extend beyond the open outer
bar if the limit is exceeded.
The full list of display options is described below; only the first of these (Normal & Limit) is
available for Voltage Harmonics Histograms.
Normal & Limit:
Max Hold & Limit:
Normal & Max Hold:
The default selection for Absolute scaling. The solid inner bars
represent the normal (instantaneous) harmonic value (the choice of
filtered or unfiltered is made below) and the open outer bars show the
instantaneous limit for each harmonic.
The histogram is updated with the values from every transform. The
limits are also calculated dynamically where appropriate (e.g. Class D).
The open outer bars show the limits for each harmonic, as above, but
the solid inner bars now mark the maximum harmonic level; the
histogram is updated after every transform with the greater of the new
and existing value for every harmonic. The actual (100%) limits are
shown; it may be permissible for the maximum harmonic level to be up
to 150% of the limit, see the standard.
Note that if the range changes then the previous Max Hold data is lost.
The range should be locked when making measurements of this nature;
use the Set-up screen of either the Power Meter or Waveform Graph
displays. This must be done with care, see the Important Note in those
Set-up sections.
The Max Hold can be manually reset at any time by pressing the
START key.
The solid inner bars represent the instantaneous harmonic values from
every transform and the open outer bars mark the maximum value
reached by each harmonic since Max Hold was last reset by pressing
START or changing range (see notes above).
22
This is the only Data Selection mode available if Vertical Scale is set to
Percent Limit but, since the vertical scale represents the normalised
limits (0 to 200%), limits information is always available.
Min & Max Hold:
The above represent all combinations of data and limits that might be displayed; any of the
parameters may also be completely suppressed using the Show facility, see below.
In this display mode, the open outer bars show the Max Hold value as
described above but the solid inner bars now represent the Min Hold,
i.e. the lesser of the new and existing value after each transform. The
display therefore shows the range of individual harmonics over a period
of time or as operating conditions are varied.
Note that Min Hold and Max Hold are both automatically reset when the
instrument changes range (see above), and can be manually reset at
any time by pressing the START key.
Page 24

Show
With the edit zone in the Show field there are four soft-keys which permit the parameters of the
chosen Data Selection mode to be turned on and off in the display. For example, for the default
condition of Normal & Limit, the four soft-keys are Odd Harmonics, Even Harmonics,
Normal and Limits. For clarity, the list changes to confirm the present usage of the inner and
outer bars of the histogram. Alternate presses of each key will turn that item on and off in the
display; confirmation is given by a or X against the corresponding parameter in the Show edit
zone. Note that when the odd harmonics are turned off the fundamental is also turned off and
when the even harmonics are turned off the DC component is also turned off.
Filter
With the edit zone in the Filter field, the soft-key choices are Unfiltered and Filtered.
The standard requires the transform results to be passed through a 1st order filter with a 1.5s time
constant before assessment. When Filtered is selected these values are displayed; the raw
values from the transforms can be viewed if required by selecting Unfiltered. This Filter
option is also available when tables are displayed.
Display Format – Tables
With the edit zone in the Display Format field, the soft-key choices are Histogram, Odd
Table, Even Table and Combined Table.
The Table displays have two distinct forms – one shows limited data for all 40 harmonics on a
single page; the other shows more columns of data but is separated into Even and Odd harmonic
pages. This second form is available for current harmonics only. The alternatives are reflected in
the Show field of the setup display; the soft-key choices available when the edit zone is in that
field offer another way to choose the table format.
Selecting Combined Table (which sets the show field to All Harmonics) and returning
to the Harmonics view by pressing the VIEW key gives a display of the following form:
This table lists all odd and even harmonics up to the 40
hand group has the fundamental and all the odd harmonics up to the 39
lists the even harmonics 2
nd
to 40th. The format is the same for both groups; for each numbered
th
in two groups on a single page: the left-
th
, the right-hand group
harmonic, the measured harmonic value is shown together with the limit for that harmonic and the
measured value expressed as a percentage of that limit. The harmonic value can be filtered or
unfiltered depending on the selection in the Filter field (as described above); the column heading
changes to indicate the selection made. A '—' is shown in the table when no limit applies, (e.g. for
the fundamental, or for loads below the minimum power limit for their class).
23
Page 25

The assessment of current harmonics against the limits requires the use of the average and
maximum values, which are not shown in this combined table. To display this information, return
to the Harmonics set-up, by pressing SET-UP, and select either Even Table or Odd Table
(alternatively, move the edit zone to the Show field and choose Even Harmonics, or Odd
Harmonics). These tables have additional columns of data, but list only the even or only the odd
harmonics respectively.
These tables show the present measured value (normally the filtered value should be chosen),
the limit, the average of the filtered value since the test started, that average as a percentage of
the limit, the maximum filtered value and that maximum as a percentage of the limit. Finally the
right-hand column gives a pass or fail assessment for that harmonic indicated by a or X
respectively. This assessment includes a comparison of the average value against 100% of the
limit, the maximum value against 150% of the limit and (where relevant) the Partial Odd Harmonic
current against its limit. The bottom line of the Odd Harmonic page is marked P: and shows the
present Partial Odd Harmonic Current and its limit. Note that the percentage of limit figures are
shown for information only, and may be subject to small calculation errors. The Pass or Fail
assessment is made more accurately by a subtractive comparison.
24
Page 26

Test Control View
With the green VIEW lamp lit, press the TEST key to display the Test Control view. This display
sets the operating mode of the instrument to Harmonics, Voltage Variations & Flicker, or Peak
Inrush Current and allows the details of all the measurements to be configured.
The contents of the Test Control view change depending on which mode is selected; the following
paragraphs describe the Test Control facilities available in the Harmonics mode. The other modes
are described in their own chapters.
The Harmonics mode Test Control view has three sections. The top section shows the nominal
voltage and frequency parameters of the test supply. The middle section contains the declaration
of the class of the item being tested, and other parameters of the measurement to be performed.
The lower section summarises the time element of test control (i.e. whether timed or continuous)
and shows the current test status. There are two lines of help text at the bottom of the screen.
The associated selections are made on the Test Control Set-up screen and a full explanation of
the options available is given in the Test Control Set-up section below. Tests are controlled by the
START and STOP keys as prompted on this view.
The measurement requirements for current harmonics are given in EN61000-3-2; there have
been two editions of this standard. The original edition, which was published in 1995, was later
changed by an amendment (known as A14), which introduced changes that were so substantial
that a revised version was published, known as EN61000-3-2 Edition 2 : 2000.
EN61000-3-2:1995 is now obsolete. Older versions of the software for this instrument supported
both sets of requirements, in which case this view will be different, with additional soft-key
selections not described here. Such software should be upgraded, as it does not implement the
current requirements.
EN61000-3-2:2000 in turn refers to EN61000-4-7for measurement methods; there are now two
versions of this standard: 1993 and 2002. The present issue of the instrument software supports
both; the choice is made on the Test Set-up view. The presentation of the results appears the
same, but the internal signal processing requirements differ substantially and may give different
results, especially if the waveform contains non-harmonic components (known as inter-harmonics
in the standard).
25
Page 27

With Test Control view displayed, pressing SET-UP shows the Test Control set-up screen. This is
essentially the same as the view screen but with soft-keys at the bottom of the display that
change as the edit zone is moved through the editable fields of the display with the
Operating Mode
With the edit zone in the Operating Mode field, the soft-keys are used to select the operating
mode. The default is EN61000-3-2:2000 Harmonics; the alternatives are Voltage
Variations & Flicker and Peak Inrush Current. Old versions of the instrument
software also offered IEC61000-3-2:1995 Harmonics; this is no longer used and any
instrument with that software should be upgraded to the current version.
The Inrush Current and Flickermeter facilities are described in separate chapters; the editable
fields of the Harmonics mode are described below.
Nominal Voltage
With the edit zone in the Nominal Voltage field the nominal supply voltage and its voltage
tolerance, against which the load supply will be monitored, can be set using the Set Voltage
and Set tolerance soft-keys. When either key is pressed, an appropriate message is
displayed at the bottom of the display (in place of the soft-keys) with a flashing cursor, e.g.
Test Control Set-up (Harmonics)
keys.
The new value is entered from the keyboard and confirmed with the ENTER key; pressing
CANCEL instead of ENTER returns the voltage (or tolerance) to the previous value.
Important note: The hardware voltage measurement range is automatically set according to the
Nominal Frequency
With the edit zone in the Nominal Frequency field the nominal supply frequency and its
frequency tolerance, against which the load supply will be monitored, can be set using the Set
Frequency and Set tolerance soft-keys. The numeric entry procedure is the same as
described for Nominal Voltage above.
Important note: The transform length and the filter time constants used in the measurements are
Load Class
EN61000–3–2 defines different harmonic current limits for different classes of equipment; users
must refer to the standard to determine the class of the equipment being tested. The class must
be declared to the analyser so that the correct limits are used for the pass or fail assessments.
With the edit zone in the Declare Load Class field, the soft-key options include Class A,
Class B, Class C, and Class D; a Professional Equipment modifier is also offered.
For Class A the limits are absolute values for all harmonics, as given in Table 1 of
EN61000-3-2.
Nominal Voltage: _ Volts.
value entered here, so for optimum accuracy the correct entry must be made.
determined by this value, so for proper operation the correct value of the actual
frequency of the load supply must be entered.
26
For Class B the limits are absolute values for all harmonics and are the class A limits multiplied
by a factor of 1.5.
For Class C the limits depend on the fundamental current and power factor of the load and are
calculated according to the percentage factors in Table 2 of EN61000-3-2. Limits apply to all odd
harmonics and to the second harmonic; there are no limits for the other even harmonics.
For Class D the limits depend on the power consumption of the load and are calculated
according to the milliamps per Watt factors in Table 3 of EN61000-3-2, subject to the maximum
values also listed in that table (which are equal to the class A limits). There are limits for the odd
harmonics only.
Page 28

The additional soft-key option determines whether the equipment under test is considered to be
Professional Equipment or not. No limits are applied to Professional Equipment with rated power
consumption over 1000 Watts. This soft-key acts as a toggle, displaying either Professional
Equipment or Standard Equipment to reverse the setting currently active.
A number of subsidiary configuration lines appear on the Test Control screen depending on the
class declared.
Basis of limits
If either Class C or D is selected then the limits depend on the behaviour of the unit being tested
and an additional line becomes available to control the way the limits are calculated. With the edit
zone in the Basis of Limits field, the soft-key choices are Automatic, Declare Value
and Store Present.
When Automatic is selected, the limits are continuously calculated from the measured
consumption of the equipment under test. For class C the maximum fundamental current and the
simultaneous power factor are used; for class D the maximum power consumption in Watts is
used.
When Store Present is pressed, the actual power consumption (or, for class C, the
fundamental current and power factor) of the load at the moment the key is pressed is stored and
used thereafter as the basis for calculating the limits. The values measured are displayed on the
Basis of Limits line, followed by the word Condition. The limits then remain fixed until the
basis of limits is changed.
This method is used, for example, when testing discharge lamp luminaires with built-in dimming
devices when the standard requires the limits to be calculated from the fundamental current and
power factor measured at the maximum load condition. After setting up the maximum condition
press Store Present to set the basis of limits. As the dimmer setting is varied, the harmonic
currents are assessed against the limits derived from the stored setting.
When Declare Value is pressed the user is prompted to enter the rated consumption of the
equipment being tested using the keyboard.
For a Class D load, pressing the Declare Value soft-key brings up a message at the bottom
of the display (in place of the soft-keys) with a flashing cursor.
Rated Power: _Watts
The rated value is entered from the keyboard and confirmed with the ENTER key; the entered
value is shown in the Basis of Limits field following by the term Rating to indicate that it is a
declared rating. Pressing CANCEL instead of ENTER returns the Basis of Limits to the previous
state.
For a Class C load both Declare Current (for the fundamental current) and Declare PF
(for the power factor) must be entered in a similar manner. If the value given for the current is 16
or less then it will be taken as Amps, otherwise it will be taken as mA. The power factor will
default to 1.0 if not explicitly entered.
In general, the present edition of the standard requires the manufacturer’s declared rating to be
entered as the basis of the limits, rather than using the automatic detection.
Class D-A Crossover Power
Class D is only defined for equipments with power consumption up to 600 Watts; above that
power class A limits apply. If the consumption of a particular equipment varies around the
crossover value, the applicable limits change rapidly, resulting in measurements that are hard to
interpret. If this is the case, the standard now suggests that the declared power (rather than the
crossover point) should be changed slightly to clearly define whether the equipment is in class A
or class D. Therefore the use of this edit field is now unlikely, but it makes it possible to change
the crossover power setting slightly and take one set of measurements in class D and a second
set in class A.
27
Page 29

Note that each individual harmonic limit in class D (when calculated by the appropriate mA/W
formula) is also subject to a maximum value equal to the class A limit for that harmonic. The
power level at which this occurs is around 600 watts, but varies slightly between harmonics
(because of the coefficients of the various equations). Changing the crossover power setting does
not alter these calculations.
With the edit zone in the Class A-D Crossover field, the default class crossover point can
be changed using the Set Power soft-key exactly as described above.
Minimum Power (No limits below)
The standard specifies that no harmonic current limits apply to equipments (other than class C)
below a power consumption of 75 watts. This figure might change in a future edition of the
standard.
Class C lighting equipment with an active input power ≤ 25W must meet the power–related
harmonics limits of Class D (i.e. Table 3 of EN61000-3-2). The analyser can be set up to do this
by declaring Class D and setting the Minimum Power to zero, so that limits are calculated and
displayed for all load power levels. Note that the user must monitor the actual power level (using
the Meter view); if the load exceeds 25W then conventional Class C limits apply and the class
declaration must be changed accordingly.
With the edit zone in the No Limits below field, the default minimum power limit can be
changed using the Set Power soft-key. Pressing this key brings up a message at the bottom of
the display (in place of the soft-keys) with a flashing cursor:
The new value is entered from the keyboard and confirmed with the ENTER key; pressing
CANCEL instead of ENTER returns the limit to its previous value. When the load power is below
this power, no limits are applied.
Maximum Power (No limits above)
If the equipment under test is defined as Professional Equipment then no limits apply above 1000
Watts. This power threshold can be changed if required (perhaps to allow testing with some
margin beyond the exemption level).
With the edit zone in the No limits above field, the default Professional exemption power
can be changed using the Set Power soft-key exactly as described above.
This line only appears if the equipment has been declared Professional in the Declare Load Class
field.
Adjust Limits
The Limits field provides the user with the opportunity to scale the current limits defined in the
standard (which strictly only apply to 230V ±2% operation) to a different operating voltage, e.g.
100V, to give the same harmonic power. Users should check carefully the details of the national
adaptation of the standard to determine the requirements.
With the edit zone in the Limits field the soft-key choice is Standard or Voltage Ratio.
With Standard selected (the default), the limits defined in the EN standard apply; if Voltage
Ratio is selected, the limits are scaled by the ratio between 230V and the nominal voltage set in
the Nominal Voltage field. In Voltage Ratio mode the set-up display reads:
Minimum power _ Watts.
28
Limits: Adjust by 230V/Nominal
This adjustment is reflected both in the limit current values shown in the results and in the
assessments.
Page 30

Measurement Method
With the edit zone in the Measurement Method field, the soft-keys offer the choice of
EN61000–4–7:1993, EN61000–4–7:2002 or 4 Cycle transforms as measurement
methods. This selection affects both the length of the data window for each Discrete Fourier
Transform and the post-transform data processing.
EN61000–4–7:2002 (the present method) requires transform windows nominally 200ms long:
10 cycles at 50Hz, or 12 cycles at 60Hz. This instrument makes the choice depending on whether
the nominal frequency declared is above or below 55Hz. The amplitudes of any signal
components that fall between two harmonic frequencies (called inter-harmonics) are rms summed
into the nearest harmonic value before subsequent processing. This procedure is known as
grouping.
EN61000–4–7:1993 uses 16 cycle transforms, with only the results at harmonic frequencies
used; there is no grouping of inter-harmonic values. At present, it is still permissible to use this
method, provided that this fact is recorded in the report.
This instrument also offers the option of 4 cycle transforms. These give a faster response on
screen and may be useful for development purposes, but they should not be used for compliance
measurements.
All three methods use transforms with contiguous rectangular windows; the data processing is
continuous with no gap or overlap between successive transforms.
Assessment Inset
With the edit zone in the Assessment inset field, the Set Level soft-key allows the actual
limit to be set as a decimal fraction or multiple of the limits automatically defined by the choice of
Operating mode and load Class. Setting the inset to 0.95, for example, gives a 5% 'safety margin'
between the measurement limits used and the limits defined by the standards. Note that this inset
only affects the Pass or Fail assessment on the Harmonics View and in the printed reports; the
numerical data and limit values shown in the tables are not affected.
Pressing the Set Level soft-key the message:
Assessment inset: _ of limit
is shown at the bottom of the display (in place of the soft-keys) with a flashing cursor. The new
value is entered from the keyboard and confirmed with the ENTER key; pressing CANCEL
instead of ENTER leaves the previous multiplier value unchanged.
Test Timing, Measurement Hold and Load Power Control
The lower section of the Test Control set-up has two further editable fields, Test type and
Load Power, for which the soft-key choices are inter-dependent. In addition, the Test status
field (non-editable) immediately above the soft-keys provides the same information about a timed
test as the Test Control view display.
Important note: When making compliance measurements it is essential to set up and execute a
proper timed test after locking the current range. This is especially the case if
the harmonic levels vary during the operating cycle of the equipment being
tested. Requirements for test duration are given in the standard for some types
of equipment and some general guidance has been added to the 2000 edition. If
the equipment being tested has an obvious operating cycle over a period of
some minutes then a test should be taken over a full cycle. If the cycle is
quicker, the test should cover multiple cycles. In any event, the test should last
at least 150 seconds.
With the edit zone in the Test type field, the soft-key choices are as follows; the
corresponding Load Power options are detailed with each test type choice.
29
Page 31

Untimed:
This state is entered at power-up, to allow initial investigation of the equipment
under test. Measurement is continuous; consequently load power is Always On.
The test status is Normal (i.e. continuous measurement) unless STOP is pressed.
When STOP is pressed, the measurement is interrupted and the displayed values
are held; test status changes to Hold. The TEST lamp flashes to show that the
measurement is held; pressing STOP again restarts the measurement and turns the
TEST lamp off. STOP can be used with the instrument set to any view. Thus, it can
be used to “freeze” the values in the Power Meter view or the histogram or tabular
displays of the Harmonics view; however, STOP does not hold the Waveform Graph
view.
Manual:
Timed:
The test is manually controlled using the START and STOP keys. With the edit
zone moved into the Load Power field there is now the option to have the load
power Always On or just on During Test. With Always On selected, when
the test is started with the START key the Test status field changes to show
Running and Elapsed time, the time is taken from the internal real-time clock
and is given in hours, minutes and seconds. The TEST lamp lights while the test is
running. When it is stopped, by pressing the STOP key, the test status changes to
Completed and the TEST lamp flashes. The total time of the test is shown in the
Elapsed time field; pressing STOP again erases the elapsed time and arms the
timer for the next test; test status reverts to Normal. With During Test
selected, the operation is essentially as for Always Running but the Test status
shows Load Power OFF before and after the test period itself.
When Timed is selected a further soft-key, Set Duration, is shown; pressing
this permits the numeric entry of the test duration, in seconds, exactly as described
for Nominal Voltage entry, for example; the default duration is 150 seconds.
Alternatively, with the Set Duration soft-key showing, direct numeric entries
can be made from the keyboard. The maximum duration that can be entered is
65535 seconds. With the edit zone moved into the Load Power field there is
again the option to have the load power Always On or just on During Test,
as described for Manual above. When Timed is selected the Test status
field changes to show Awaiting START. Pressing the START key starts the test;
the TEST lamp lights and the test status changes to show Running and
Elapsed time in hours, minutes and seconds.
At the end of the timed period the test status changes to completed and the
TEST lamp flashes; the report can then be printed. If an overload occurs, or the
STOP key is pressed before the end of the timed test, the test status changes to
aborted and the TEST lamp flashes. Once the TEST lamp is flashing, pressing
STOP again erases the elapsed time and arms the timer for the next test; the test
status returns to Awaiting START.
30
In any mode, whenever the TEST lamp is flashing the measurement is suspended and all
displayed values are held. Pressing the START key at any time in any mode resets the Min Hold
and Max Hold values.
Note that for Manual or Timed measurements where the load power has been selected to be
on only During Test the analyser will capture (as Min Hold and Max Hold values) any
exceptional harmonics that occur when power is first applied. Since EN61000-3-2 allows such
transitory harmonics occurring in the first 10 seconds to be disregarded the user may use the
START key at any time during this period to reset the Min Hold and Max Hold values after the
transients have finished. If the START key is used in this way the Elapsed time: is reset to
zero, i.e. the timed period is restarted.
When the timed test is complete there is a short beep and the STOP light flashes; the report
should then be printed. If an overload occurs, there is a long beep, and the test is aborted.
Page 32

Introduction
EN61000-3-3 defines limits for the low frequency fluctuations in the voltage delivered by a supply
network of non-zero impedance caused by changes in the current consumption of the equipment
under test. The purpose of these requirements is to limit the impact of a varying load on
neighbouring consumers connected to the same supply network. The magnitude of the voltage
fluctuations depends on both the load current variations and the impedance of the supply
network. The standard specifies a particular source impedance, called the reference impedance,
which is to be used for the measurements. It contains both resistance and inductive reactance.
This instrument offers two modes for flicker and fluctuation analysis: voltage sensing or current
sensing.
Voltage sensing mode is the reference method of the standard. The instrument measures the
voltage across the input to the equipment under test on the load side of the reference impedance.
A physical implementation of the reference impedance must be connected between a zero
impedance test supply and the test circuit input terminals of the instrument. Some laboratory
grade AC power sources can simulate the necessary reference impedance using a feedback
mechanism, but it is important to allow for the impedance of the connecting cable between the
source and the instrument. Any error in the value of the actual source impedance directly affects
the results of the measurement.
If a physical reference impedance and a high quality supply are not available, an alternative
measurement can be made using current sensing mode. The instrument measures the current
into the load and calculates the voltage drop that would occur across the reference impedance.
This calculation uses both the magnitude and rate of change of current at 300 sampling points in
the cycle. By subtracting this voltage drop from a simulated nominal-voltage sinewave the
instrument can synthesise the waveform that would be present at the load terminals of the
reference impedance. This waveform is fed to the subsequent processing exactly as if it had been
obtained by voltage sensing.
The voltage variations are subject to two separate analyses, Flicker and Voltage Fluctuations;
each has separate limits.
EN61000-3-3 Flicker and Fluctuations
Flicker Analysis
Flicker is the subjective effect of the variations in the light output of a 230V 60W coiled-coil
filament lamp as a result of fluctuations in its supply voltage. It is measured using an instrument
called a Flickermeter with characteristics defined in EN61000-4-15 (which has replaced
EN60868). These characteristics (in time, amplitude and frequency) are designed to simulate the
response of the lamp, eye and human brain combination.
The standard gives the following definitions of flicker and the flicker indicators P
measured by the HA1600:
Flicker:
Short-term flicker indicator, P
Long-term flicker indicator, P
The first output of the flicker meter is an indication of instantaneous flicker sensation, measured in
p.u. (perception units), where 1 p.u. is the threshold of perception for 50% of the population. This
signal (which can vary widely during the test) is then subject to statistical analysis (based on a
“time at level classification”) to derive the Short and Long term flicker severity indicators, which
are the parameters subject to limits. Full details of the statistical process are given in
EN61000-4-15.
and Plt
st
Impression of unsteadiness of visual sensation induced by a
light stimulus whose luminance or spectral distribution
fluctuates with time.
The flicker severity evaluated over a short period (a few
:
st
minutes); P
The flicker severity evaluated over a long period (a few
:
lt
hours) using successive P
= 1 is the conventional threshold of irritability.
st
values.
st
31
Page 33

This instrument is a digital implementation of the Flickermeter and the statistical analyser. The
standard also allows flicker to be assessed by graphical analysis if the load variation waveform is
simple and regular, but the use of a Flickermeter is the reference method and is always preferred.
In the standard the time specified for P
hours. The limit values specified are P
Voltage Fluctuation Analysis
The input to the voltage fluctuation analysis is a sampled representation of the voltage waveform;
in this instrument, there are 150 data points per half-cycle. This data is rms integrated over each
half-cycle interval to obtain the rms value of the voltage in that half-cycle. These are then
expressed as a percentage of the nominal voltage. This is a signed value - positive when above
nominal and negative when below. It may be helpful to recognise that it will normally be negative any current drawn by the load must cause a voltage drop across the reference impedance.
The standard defines a number of measurements to be made by analysing the sequence of these
half-cycle rms values throughout the duration of the measurement. The instrument must first
decide whether the load is in a “steady state”. This is an interval when the current consumption of
the equipment under test does not vary, so the terminal voltage remains constant for a period of
at least 1 second. The alternative is called a voltage change characteristic.
The instrument requires a numerical definition of how small a variation should be considered
constant when assessing whether an interval constitutes a steady state. An amendment to the
standard now suggest a value of 0.32%; before this guidance was given the figure chosen for this
instrument was 0.15% (which was also used by other manufacturers). The user can change this
value if required. After each new half-cycle the instrument computes the average value over the
preceding second and compares all the individual half-cycle values against this average ± the
tolerance band specified. The load is considered to be in a steady state if all the values are within
this band. The level assigned to the steady state is the average value during the first second. The
steady state persists at that level until a half-cycle value lies outside the tolerance band. A voltage
change characteristic is then presumed to start.
evaluation is 10 minutes and for P
st
≤1.0 and P
st
≤0.65.
lt
is 12 x Pst, i.e. 2
lt
The standard is concerned with the value d
, which is the difference between the levels of two
c
adjacent steady states separated by at least one voltage change characteristic. There is a point
of interpretation here: some may consider that “adjacent” steady states are separated by exactly
one change characteristic. The instrument displays the value for both interpretations of d
.
c
While in a voltage change characteristic there is a limit on the length of time the voltage change
d(t) may exceed 3·3%. The instrument records and reports this from both perspectives: the
longest duration over the 3·3% threshold and the highest variation over a 500ms interval. (Prior to
the 2003 amendment to the standard these figures were 3% and 200ms; this instrument allows
the user to change these values if required.)
The instrument also keeps a record of the highest and lowest half cycle values - the difference
between these is d
(the largest overall change in relative voltage).
max
As with harmonics measurements it is essential that the standard is read and understood before
testing is undertaken. In particular, note that the standard includes the effects of inrush currents
at the moment of switch on.
32
Page 34

Test Control Set-up (Flicker)
Select Test Control view, enter set-up and, with the edit zone in the Operating Mode field,
select Variations & Flicker as the operating mode.
Nominal Voltage and Frequency
Move the edit zone up to nominal voltage and nominal frequency and enter the correct
values to describe the test supply. Note that as all voltage variation processing is relative to this
nominal value, any error will show as a bias in the results.
Sensing Method
With the edit zone moved to the Sensing method field, choose Voltage sensing if a clean
supply and external reference impedance are available (Fig. 1 of EN61000-3-3); otherwise use
the Current sensing capability of the instrument. When using Current sensing the
measurement range is locked at 96A full-scale; the internal arithmetic requires this and the results
are only calibrated on this range. When using Voltage sensing the range is also set to 96A,
but this can be changed (from the Meter or Waveform views) as required, provided there is no
overload during the test.
Reference Impedance
If Current sensing is in use then an additional line allows entry of non-standard values for the
resistive and reactive components of the simulated reference impedance (there is no
requirement in IEC 60000-3-3 for this). The software will not accept values outside the working
range of the algorithm.
Flicker Observation Times
The next two lines of the screen show the observation times for P
minutes. The long-term test P
is twelve P
intervals, but it can be excluded by pressing the Omit soft-key.
st
and P
st
is not needed for some types of equipment: if required its duration
lt
. Pst is fixed at 10
lt
33
Page 35

Voltage Variation Limits
The next three lines set the assessment limits for the voltage variation results d
during a change interval. These are used as the basis for the pass or fail assessments displayed
on the Voltage Variations screen and included in the printed report. The limits are defined in the
standard, although they have been changed by amendment. The default settings apply to most
equipment, but if the variations are caused by manual switching, or occur only at a very low rate,
then relaxed limits apply and can be entered here.
Steady State Definition
Two fields define both the time interval and the tolerance band used to distinguish a steady state
interval from a voltage change. The standard specifies a minimum duration of 1 second, and
suggests 0.32% for the tolerance band. This could be changed if a particular load causes a
large number of short duration steady states with little change in voltage level between them.
Test Control
The test control and timing fields at the bottom of the screen are the same as in Harmonics mode;
see Test Timing and Load Power Control section of the Test Control Set-up Chapter. A timed
test should be selected for Flicker measurements. The Duration field cannot be edited; the
test duration is automatically set to 10 minutes (600 seconds) if the P
hours (7200 seconds) if it is included. Tests of any other length can of course be made in the
Untimed or Manual modes.
, dc and d(t)
max
test is omitted, or to 2
lt
34
Page 36

The Meter View is used for displaying the Flicker and Voltage variation results. When the
operating mode has been set to Variations & Flicker on the Test Control set-up screen, a
Flicker and Voltage Variations summary is shown at the bottom of the Power Meter view.
Two additional full pages of results also become available. To view these press SET-UP on the
Meter View, the soft key options are Voltage Variations, Flicker Meter and Power
Meter. Selecting any of these switches back to view mode showing the requested page - there
is no need to press VIEW.
Power Meter View summary
The first line shows the Instantaneous Flicker Sensation in p.u. (perception units - see above)
and the presently assessed values of the short and long term flicker indicators P
The second line shows the voltage variation over the last second, the highest variation in any
500 millisecond interval and the maximum voltage variation d
These values can be observed in more detail on the dedicated full page Flicker Meter and
Voltage Variations views. With the Power Meter view displayed, press SET-UP and select the
required page on the soft-keys.
Meter View (Flicker)
and Plt.
st
.
max
Flicker Meter Page
The left-hand side of the Flicker Meter view shows the 15 ‘percentiles’ of the cumulative
probability function, which are used by the last stage of the Flickermeter (the classifier) in the
calculation of P
values; as the 10 minute period progresses the P
the 10 minute period, the P
calculation on the right-hand side of the display; the P
an ‘in progress’ value that gets closer to its true final value as the 12 intervals are progressively
completed.
. In effect, this shows how the Pst is being cumulatively calculated from the p.u.
st
gets closer to its true final value. At the end of
st
value is transferred to the appropriate interval field of the P
st
value at the bottom of the column is also
lt
lt
Only at the end of the complete, timed, test are the P
values are presented as information to allow a judgement of how the test is proceeding.
35
and Plt values true; the intermediate
st
Page 37

A peak reading display of the instantaneous flicker sensation in pu is shown. The peak value is
held for half a second, and then decayed towards zero; a text annotation indicates the state. This
value is not used in the assessment of an equipment under test, but the calibration of the early
stages of the flickermeter is specified in EN61000-4-15 in terms of this peak pu reading.
The AGC (Automatic Gain Control) correction factor of the flickermeter is also shown. The AGC
circuit adjusts the input gain of the flickermeter until the average value of the voltage waveform is
equal to a reference value. A very long time constant is used in this AGC circuit; the user should
wait until the value shown has stabilised before starting a timed test. The working range is
between 0·95 and 1·05.
Voltage Variation Page
This view reports the variations in half-cycle rms voltage at the terminals of the load - if Voltage
Sensing is selected the actual voltage is measured, if Current Sensing is selected then the
voltage is calculated. All values are in percent of nominal voltage as declared on the Test Control
set-up. Note that there is no AGC function (unlike the flicker meter) - if the actual supply voltage is
not equal to the nominal, this bias will show in the variation figures.
Present Behaviour
The top line shows the behaviour of the load terminal voltage over the last second (or specified dc
interval if a non-standard requirement has been set on the Test Control screen). The three figures
show the average value and the peak positive and negative excursions above and below that
average. This allows an assessment to be made of the stability of the operation of the load at the
present time.
Below this is shown the categorisation of the present load behaviour as either a steady state or a
continuing voltage change interval, and the length of time since that state began.
Extreme levels and d
The next lines show the extreme voltage levels (highest and lowest) that have occurred since the
start of the test. In general (if the nominal voltage is declared correctly), both extremes will be
negative, as a load that consumes power will always cause a voltage drop. The variation will only
be positive if a load (such as a motor with regenerative braking) returns energy to the supply.
The difference between these extremes is d
to the permitted limit for the type of equipment being tested (as set on the Test Control Screen)
and the assessment displayed as a (pass) or X (fail).
max
. This is an important test result and is compared
max
36
Page 38

Voltage Change Intervals
The next group of four lines presents the analysis of voltage changes. The standard includes a
requirement that “the value of d(t) during a voltage change shall not exceed 3·3% for more than
500 ms”. The instrument displays the voltage change information from both the time and voltage
perspectives: the maximum voltage change that has persisted for more than 500ms, with a
(pass) or X (fail) assessment, the length of time the present voltage change has been above
3·3% (zero if it is not) and the longest duration of any voltage change above 3·3%.
Note that the limits for both time and level can be changed on the Test Control screen if required,
as these figures were different prior to an amendment to the standard.
Steady State Intervals
The bottom group of lines displays the analysis of steady states. The first pair of values are the
levels (relative to nominal voltage) of the highest and lowest steady state intervals that have
occurred since the test started. Next is shown the difference d
states, then the largest difference between any two adjacent steady states and finally the
difference between the highest and lowest steady states whether they were adjacent or not. A
(pass) or X (fail) assessment is made against the limit set on the Test Control screen. Users
must decide their interpretation of the word “adjacent” in the definition of d
between two adjacent steady state voltages separated by at least one voltage change
characteristic”.
between the last two steady
c
: “the difference
c
37
Page 39

Peak Inrush Current Measurement
This Peak Inrush Current mode is intended to measure the instantaneous peak inrush current
characteristics of an equipment under test.
Important Note: There are no standards requiring compliance tests on this value. Limits on
inrush current effects are specified indirectly, in EN61000-3-3, by a requirement
on the voltage variation result d
makes it, in effect, a half-cycle rms measurement). Such measurements should
be conducted with the instrument in the Voltage Variations and Flicker mode
described above. See also the section on taking Flicker and Voltage Variation
Measurements later in this manual.
When Inrush Current mode is selected in the Operating Mode field of the Test Control
Set-up screen, the Power Meter view is changed to show Inrush Current results instead of the
Harmonics Summary at the bottom of the screen:
during manual switching events (which
max
38
Inrush current measurements are made by repeatedly switching the load on and off, and
measuring the peak values (both positive and negative) of the resulting current transient. The
switching may be done manually, using either the load’s own switch or the front panel LOAD
switch, or automatically using the power sequencer facility of the instrument (although different
switch characteristics may affect the results).
Two sets of values are kept: Latest Peak and Highest Peak. In each set, the largest positive and
negative peaks are recorded separately. Every sample of the current waveform is compared to
the stored peak values, which are updated if the new value is larger. The values recorded are
instantaneous peak currents, not half-cycle rms values.
An automatic re-trigger mechanism is used to detect when the load has been switched off and
then on again to cause a new inrush transient. Whenever the peak current in a half cycle is more
than twice the peak current in the cycle before, it is assumed to be the start of a new switching
event. The new peak value is then stored in Latest Peak, even if it is smaller than the previous
Latest Peak. The Highest Peak value is not reset so it records the highest value of Latest Peak in
a sequence of switching events.
Both sets of Peak-hold accumulators can be reset by pressing the START key.
Page 40

The Waveform Graph view can also be used to inspect inrush current transients. A single shot
facility is available: if the Trigger Source is set to Inrush then a new trace will be drawn
for each transient (as detected using the mechanism described above). The horizontal
scale may be set to more than one cycle to show the behaviour of the transient after the initial
cycle. The accumulate mode can be used to overlay multiple transients. For further details of
all these facilities, see the section on Waveform Graph Set-up.
When Inrush Current mode is selected, the instrument switches to the 400A peak range and
disables auto-ranging to ensure that the peak current is always within the measurement range. If,
after a number of tests, it is apparent that the peak currents are much smaller than this, then the
measurement sensitivity can be increased by selecting Setup Range on any of the Power
Meter, Waveform Graph or Test Control Set-up screens and using the Up and Down soft-keys.
It is important to avoid overload; the Waveform Graph view can be used in Accumulate mode to
ensure that valid results have been obtained.
Important Note: Inrush current measurements should ideally be made by manually switching the
unit under test with its own power switch as this gives the most accurate
representation of real use. The measured value can vary significantly depending
on the characteristics of the switch.
There are however occasions when an automatic measurement is useful so this instrument
provides a sequencer using its internal relay to switch the load. There is provision for setting the
on and off durations and for adjusting the phase of the switching points.
Because of the stringent requirements of EN61000-3-2 governing voltage drop across the
measuring device, this instrument uses a relay to switch the load power, not an electronic device,
so the actual switching point is subject to the timing uncertainties of the relay. By viewing the
result on the Waveform Graph display, the phase setting can be adjusted until the required result
is obtained.
Important Note: This facility is only intended for use with relatively low power loads. To avoid
damage to the relay the sequencer should not be used with highly reactive
loads likely to cause arcing at the contacts, or with loads taking peak inrush
currents in excess of 30 Amps.
39
Page 41

Test Control Set-up (Peak Inrush Current)
When the Test Control view is displayed with the Operating Mode field set to Peak Inrush
Current, pressing SET-UP introduces the edit field box and allows the settings to be changed:
Current Range
With the edit zone in the Range field the up and down soft-keys can be used to change the
range as required. The highest available current range (400 Amps peak) is automatically set
when inrush mode is initially selected. Auto-ranging is disabled in Inrush mode.
Load Power
Selecting manual allows the user to control the load power using either the LOAD switch on the
front panel or the switch on the unit being tested. Selecting sequencer uses the relay in the
instrument to repeatedly switch the load on and off for defined times, with the switching points
being approximately synchronised to the load supply waveform.
Switching Sequence on and off times.
These two edit fields specify the duration of the Power On and Power Off parts of the sequence in
terms of the number of cycles of the load supply. The use of the Set Time soft-key is optional:
pressing any of the number keys will set the number entry mode directly. Values between 4 and
65535 cycles can be specified. Pressing ENTER completes the number; CANCEL restores the
previous value. Short durations should not be set simultaneously for both on and off times, as this
will reduce the life expectancy of the relay. Sufficient time should be allowed between power
cycles for the load under test to fully return to its quiescent state; in many cases this can take
several minutes.
Switching Sequence on and off phase.
40
These two edit fields specify the switching points of the Power On and Power Off parts of the
sequence in terms of the phase angle relative to the rising zero crossing of the load supply.
Values between -999 and 999 degrees can be specified. Pressing ENTER completes the number,
which is then reduced to the range 0 to 359 degrees; CANCEL restores the previous value. The
value specified is only an indication of the approximate switching point; use the Waveform Graph
view to check the results obtained and adjust the angle specified as required.
Page 42

Report View
With the green VIEW lamp lit, press the REPORT key to display the Report view.
Printed reports of tests can be produced either by using the HA-PC Link Plus software (described
later) with the instrument under remote control, or by attaching a printer directly to the instrument.
Any printer capable of accepting 7-bit ASCII can be used; it will print in whatever font and page
layout it has been set to.
The reports produced directly by the instrument are designed for printers using A4 paper and a
fixed pitch font (such as Courier) providing 80 characters across the paper. Only 72 character
spaces are actually used, with an adjustable blank left margin allowing space for filing holes. The
full reports are 64 lines long. A single Form Feed is sent at the end of the report (this can be
changed). Most printers will produce the desired results using their default settings, but in some
cases adjustments may be needed to font selection, margin settings or number of lines per page.
Automatic line-feed and automatic form-feed should be turned off.
There is provision for user-entered text to be added to a report: four lines at the top of the report
and one at the bottom. Each allows up to 80 characters of free text to be entered as described in
the Report Set-up section. A partial preview of these lines is shown on screen in the Report View.
Reports include the time and date from the internal clock and a Report Number, which increments
automatically every time a report is printed, or can be set by the user from the set-up screen.
To produce a valid compliance report first set the required Report and Test Control options, select
and lock the current range and then run a full timed test. At the end of the test, the STOP lamp
will be flashing; press REPORT to display the Report View, check the Harmonics Summary
(which reflects the results of the whole test) and press ENTER to initiate the print. The instrument
takes a complete instantaneous snapshot of the test data and creates a print image in its internal
memory. This image is then spooled to the printer at whatever speed it can handle while the
instrument can continue to take measurement data. All the information in a print is mutually
consistent regardless of the physical speed of a particular printer.
The status line will show Spooling while the data is sent to the printer; after a few seconds,
printing will start. If a communication problem occurs, the status line will show stalled; there
are other diagnostic messages such as Paper Empty. If the status signals on the interface
indicate that there is no printer connected (or it is not switched on) the instrument will ignore the
print command.
41
Page 43

Report Formats
The type of report printed (Harmonics or Voltage Variations and Flicker) is determined
automatically by the operating mode of the instrument. At the top of the report are the date and
time the test was taken, the report number and the user entered title lines. These are followed, on
a Harmonics report, by three sections that summarise the test conditions and the behaviour of the
load.
The Supply Voltage section shows the range of supply voltages that occurred during the test (only
one is shown if the variation is negligible), the peak voltage, frequency and other measured
parameters, followed by a text assessment of the supply characteristics against the requirements
of the standard.
The Load Power line shows the lowest and highest powers that occurred during the test, the
highest VA and the Power Factor associated with the highest fundamental current (this is needed
for class C equipment).
The Load Current line shows the lowest and highest rms current that occurred during the test, the
highest peak current and the highest Crest Factor that was measured. Note that this Crest Factor
is not necessarily associated with the highest current.
This is followed by a statement of the limits that were applied and (if relevant) the basis on which
they were derived.
Then follows the data table showing the measurement results for the fundamental and all the
harmonics. For EN61000-3-2:2000, this table has the following columns:
Harmonic Number: The harmonic number in numerical order from 2 to 40.
The last line gives the Partial Odd Harmonic Current (POHC) and
the Partial Odd Harmonic Limit (POHL). These are the rms sum of
the odd harmonics 21 to 39.
Limit Current: The limit value of the harmonic current, in Amps or milliamps (as
indicated in the heading), for the declared Class and rated power.
Average (filtered): The arithmetic average of all the filtered values measured during
the test, from the time the START key was pressed until either a
timed test completed or the STOP key was pressed. For valid
results always set up and run a timed test before printing a report.
%Limit: The percentage of the limit that the average value represents.
Max Value (filtered): The largest individual reading of all the filtered values measured
during the test.
%Limit: The percentage of the limit that the Max Filtered Value represents.
Assessment: A Pass or Fail assessment for each harmonic based on the rules:
Max Value < 150% of limit
and either
Average value < 100 % of limit
or (for odd harmonics 21 - 39)
Partial Odd Harmonic Current < Partial Odd Harmonic Limit.
On a Voltage Variations and Flicker report, the usual user configurable title lines are followed first
by a summary of the voltage, load power and load current measurements; note that these show
filtered values as for a harmonics report. This section is followed by the voltage variation results
and the flicker analysis. The contents of the flicker classifier from which the P
are printed for information. If the long-term flicker test was enabled, the P
value is calculated
st
results from the 12
st
intervals are also listed. This information is the same as that shown on the two meter view pages.
42
A sample of each report type is given below.
Page 44

Sample Harmonics Report
-------------------------------- TTi -------------------------------- Tested on: 04-02-2005 at 09:54:39 for 00:02:30 Report Number: 1
------------------------ HA1600 Development --------------------------
---------------------- Reports for User Manual -----------------------
----------------------- Fluctuating Harmonics ------------------------
Supply Voltage: 229.7 to 229.8 Vrms 324.9 Vpk Frequency: 50.00 Hz
THD: 0.4% Crest Factor: 1.414 peak at: 90.2 deg
Supply meets IEC requirements.
Load Power: 239.5 to 395.6 W 405.5 VA Power Factor: 0.976
Load Current: 1346 to 1765 mArms 2558 mApk Crest Factor: 1.898
Limits: EN 61000-3-2:2000 Class A limits
Harmonic Limit Average % max. value % Assessment
Number Current (filtered) Limit (filtered) Limit
mA mA mA
Fundamental: 1390.4 1703.4
2: 1080.0 0.7 0.1 1.1 0.1 Pass
3: 2300.0 444.0 19.3 672.0 29.2 Pass
4: 430.0 1.2 0.3 4.9 1.2 Pass
5: 1140.0 260.5 22.9 317.3 27.8 Pass
6: 300.0 0.5 0.2 1.3 0.4 Pass
7: 770.0 71.1 9.2 124.6 16.2 Pass
8: 230.0 0.6 0.3 1.7 0.8 Pass
9: 400.0 96.0 24.0 177.5 44.4 Pass
10: 184.0 0.6 0.3 1.1 0.6 Pass
11: 330.0 119.7 36.3 162.2 49.2 Pass
12: 153.3 0.5 0.4 1.2 0.8 Pass
13: 210.0 56.2 26.7 75.3 35.9 Pass
14: 131.4 0.4 0.3 0.5 0.4 Pass
15: 150.0 50.3 33.5 78.8 52.6 Pass
16: 115.0 0.6 0.6 1.6 1.4 Pass
17: 132.3 73.9 55.8 111.2 84.0 Pass
18: 102.2 0.5 0.5 1.0 1.1 Pass
19: 118.4 55.8 47.1 57.1 48.3 Pass
20: 92.0 0.3 0.3 0.4 0.5 Pass
21: 107.1 27.9 26.0 31.0 29.0 Pass
22: 83.6 0.5 0.5 0.9 1.2 Pass
23: 97.8 50.2 51.3 78.6 80.4 Pass
24: 76.7 0.6 0.8 1.2 1.6 Pass
25: 90.0 49.9 55.4 61.3 68.1 Pass
26: 70.8 0.4 0.6 0.7 1.0 Pass
27: 83.3 12.9 15.5 24.4 29.3 Pass
28: 65.7 0.4 0.7 0.8 1.2 Pass
29: 77.6 31.0 40.0 52.2 67.3 Pass
30: 61.3 0.5 0.8 1.1 1.9 Pass
31: 72.6 45.5 62.7 58.7 80.9 Pass
32: 57.5 0.4 0.8 0.9 1.7 Pass
33: 68.2 21.3 31.3 24.5 36.0 Pass
34: 54.1 0.4 0.6 0.6 1.2 Pass
35: 64.3 16.8 26.1 30.1 46.9 Pass
36: 51.1 0.5 1.1 1.0 2.1 Pass
37: 60.8 37.1 61.1 51.1 84.1 Pass
38: 48.4 0.5 1.0 1.1 2.4 Pass
39: 57.7 27.3 47.3 30.9 53.6 Pass
40: 46.0 0.3 0.7 0.5 1.2 Pass
21 - 39: 251.4 110.8 44.1 147.9 58.9 Pass
Taken by: MGR HA1600 # 112443
43
Page 45

Sample Flicker Report
-------------------------------- TTi -------------------------------- Tested on: 04-02-2005 at 10:43:59 for 00:10:00 Report Number: 6
------------------------ HA1600 Development --------------------------
---------------------- Reports for User Manual -----------------------
-------------------- 120 changes per minute Flicker --------------------
Supply Voltage: 229.1 to 229.5 Vrms 324.6 Vpk Frequency: 50.00 Hz
THD: 0.2% Crest Factor: 1.415 peak at: 89.9 deg
Load Power: 104.6 to 331.5 W 336.3 VA Power Factor: 0.986
Load Current: 506 to 1468 mArms 2114 mApk Crest Factor: 1.432
Voltage Variations
Highest Half-cycle level: -0.13%
Lowest Half-cycle level: -0.47%
d(max): 0.34% Pass
Number of Change Intervals: 1
Highest d(t) for 500 ms: 0.00% Pass
Longest d(t) over 3.30%: 0.00 seconds
`Steady State' definition: >1000 ms below 0.32%
Highest Steady State level: -0.31%
Lowest Steady State level: -0.31%
max d(c) between adjacent: 0.00% Pass
max d(c) between any: 0.00%
Flicker
Long-term Flicker indicator Plt : 0.17
Short-term Flicker indicator Pst :
Plt Interval Pst
1: 0.41
2: 0.00
3: 0.00
4: 0.00
5: 0.00
6: 0.00
7: 0.00
8: 0.00
9: 0.00
10: 0.00
11: 0.00
12: 0.00
Pst classifier: Duration Flicker
0.1% 0.40
0.7% 0.39
1.0% 0.39
1.5% 0.39
2.2% 0.38
3% 0.38
4% 0.38
6% 0.37
8% 0.36
10% 0.35
13% 0.34
17% 0.32
30% 0.27
50% 0.19
80% 0.13
Taken by: MGR HA1600 # 112443
44
Page 46

Report Set-up
With the Report view displayed, pressing SET-UP shows the report set-up screen.
The functions of the soft-keys change as the edit zone is moved through the editable fields of the
display using the
display to the Report view and allows reports to be printed.
Function
With the edit zone in this area, both the function and port can be chosen. If the Function is
Printer there is a choice of Parallel (Centronics) or Serial (RS232) port. If the
Function is Remote, the port may be Serial (RS232) or USB (if fitted).
Once a Remote Control function is selected, press the LOCAL key to enter remote operation. The
LOCAL key can be used again to return to local control. The remote control facilities are intended
for use only with the HA-PC Link Plus software supplied by the manufacturer, see that section in
this manual.
Time and Date Set−up
With the edit zone moved to the top line of the display the Set Clock soft−key is shown.
Pressing the key changes the display to show the Present setting with an editable
New setting below it.
The
andcursor keys are used to select each field in turn (hours, minutes, day, month, year)
and the
set the Save Setting soft−key (or the ENTER key) can be used to apply the new values.
keys are used to change the setting. When the correct time and date have been
keys; each field is described below. Pressing the VIEW key returns the
Pressing the Leave Unchanged soft−key exits the edit mode without change.
Reset Spooler
With the edit zone moved to the top (clock) line of the display a further soft-key Reset Spooler
is shown. If a problem has occurred communicating with the printer (perhaps by attempting to
print while the printer was not switched on), there is the possibility of a 'lock-up' between the
instrument and the printer; pressing Reset Spooler resets the communication.
45
Page 47

Report Type
The report type is automatically determined by the operating mode of the instrument.
Report Number
With the edit zone in the Report Number field a report number can be entered directly from
the keyboard and confirmed by pressing ENTER. The number is automatically incremented after
each report is printed.
Header, Title 1 to 3 and Footer
The four lines of the text that appear at the top of the report are pre-entered with the parameters
'Test Location', 'Customer Name', 'Equipment Name' and 'Test Conditions'
respectively; the report can be printed with these titles by default or the text can be changed
using the edit facility. Any or all of the lines can also be omitted completely.
To edit a line press the Edit String soft-key to show the Edit display. The middle of the
display shows all the characters (upper and lower case) and symbols that can be used. A
character is chosen by moving a selection box around with the cursor keys. Above this block the
selected line of the text (Header, Title 1 etc.) is shown, with a flashing underline at the edit
point, which can be moved with the Next Position and Previous Position soft-keys.
As the underline is moved the selection box in the character field moves to the corresponding
character; moving this box with the cursor keys changes the underlined character in the text to
the new one. Two further soft-keys, Insert Character and Delete Character, aid the
editing process. Numbers can also be entered directly from the keyboard. Up to 80 characters
can be entered on each line. The new text is confirmed by pressing ENTER; pressing CANCEL,
or exiting the edit mode by pressing VIEW, will return the title to its original form.
To delete the header, title or footer altogether move the edit zone to that field and press the Omit
soft-key; the title will be deleted from the display and a X will be shown against the parameter. To
reinstate the title press the Include soft-key that has now replaced Omit on the display. The
overall report is shortened by a line for each header or title removed; this can be useful in cases
where a particular printer cannot print the 64 lines of a full report on a single sheet. The titles are
held in non-volatile memory; once created for a particular company and product only small
changes will be needed from test to test.
Page Terminator
This field determines the character sent at the end of each report. The default is form feed, but
any other control character can be configured, by pressing Set Terminator and entering the
decimal character value (31 or less) on the keypad.
If a printer is emitting extra pages, it may help to set the terminator to 0.
This facility may also be used when sending individual reports through the serial port to a
communications capture program running on a PC. The page terminator can be set to the End of
File character used by the operating system, usually either ^D (decimal 4) or ^Z (decimal 26).
Left Margin
The report text generated by the analyser uses only 72 of the 80 characters per line of the report
format, i.e. there are 8 ‘spaces’ that can be used to position the report text within the paper. The
text position is set by defining the number of spaces in the left margin. To enter, move the edit
zone to the Left Margin field, press the Set Margin soft-key and enter a number from
the keyboard followed by ENTER. Pressing CANCEL before ENTER returns the margin to the
previous value; the value is stored in non-volatile memory.
46
The margin positioning capability is primarily for formatting the hard-copy report appropriately for
filing, but is also useful in compensating for the special requirements of some printers and/or
paper sizes which might otherwise lose a character at the end of a line, for example.
Page 48

Compliance Measurements with the HA1600
Harmonics Measurements
The standard defining the limits for harmonic current emissions, for equipment with input current
≤ 16A per phase, is EN61000–3–2. This standard is an essential document that should be read
before any compliance quality measurements are attempted. There have been two versions of it,
published in 1995 and 2000, which differed substantially in their requirements; the 1995 version is
now obsolete. This standard (which defines the required characteristics of the equipment being
tested) refers for measurement methods to EN61000–4–7. There have also been two versions of
this, published in 1993 and 2002. It is, at present, still permissible to use the 1993 methods
(provided this fact is recorded), but the latest methods are preferred. All these documents should
be available for purchase from National Standards Organisations worldwide (BSI in the UK).
The firmware of the HA1600 is stored in FLASH memory and can be updated from a PC. This
capability enables the manufacturer to implement all the changes to the standards as software
updates, which can be installed by users without the need to open the instrument or return it to
the factory. See the Software Updates section for details of the upgrade process.
Aspects of the measurements
The following points are a quick guide to some aspects of the measurement requirements,
particularly where confusion might arise from the changes made to the standards. As always,
users should read the full standards for exact details.
Interharmonics
EN61000–4–7 uses the term interharmonics for spectral components of the current waveform
that fall between two harmonic frequencies. The 2002 version requires the amplitude of
interharmonics to be rms summed into the magnitude of the nearest harmonic (a process known
as grouping), before comparing that value with the limit. The 1993 requirements exclude
interharmonics.
Equipment classification
All classification is now by equipment type; class D does not depend on a special waveform test.
Basis of limits
For classes A and B the limits are absolute; for classes C and D the limits are now based on a
rated consumption declared by the manufacturer. This figure must be within ±10% of the value
obtained during the test. It is also possible to base the limits on the maximum consumption that
occurs during the test. Dynamic limits that vary continuously during the test, as the consumption
of the load changes, are no longer used.
Basis of measurement
The comparisons of measured harmonic currents against the limits are now made using the
arithmetic average of all the results of the 1.5 second filtered results of every transform in the
measurement interval.
Fluctuating harmonics
The assessment of fluctuating harmonics has completely changed. A “10% of 2½ minutes” rule,
which was applied for a limited set of harmonics, is no longer used. Any harmonic is now allowed
to fluctuate up to a maximum of 150% of its limit, provided that its average value is below 100%
of the limit. In addition, some trade-off between harmonics is allowed for odd harmonics of order
21 to 39 based on a value called the Partial Odd Harmonic Current; this is the rms sum of all the
odd harmonics between 21 and 39. This rms sum is compared to the Partial Odd Harmonic Limit,
which is the rms sum of the limits for the same set of harmonics. If the actual POHC sum is less
than the POHL sum, then the average value of any individual harmonic in this group may exceed
100% of its limit, again provided that no individual measurement exceeds 150% of limit
throughout the test. Obviously one or more of the other harmonics must be correspondingly less
than 100% of its limit, otherwise the POHC will not be less than 100% of the POHL.
47
Page 49

Equipment without limits
No limits are now applied to equipment with power below 75 watts in classes A, B and D (this
used to be just class D). No limits are applied to Professional Equipment above 1 kW.
Note that the clauses defining control methods that are not permitted apply to all equipments
within the scope of the standard, even if no harmonic current limits apply.
Taking Harmonics Measurements
The HA1600 has a set of default conditions that permit the untrained user to quickly make useful
measurements. However, compliance quality measurements require considerably more planning
and care if they are to be fully valid for self-certification. The following is a summary list of do’s
and don’ts.
• Read and understand EN61000-3-2. This document is the prime source of information on how
to test a particular piece of equipment and what limits apply. For most types of equipment the
requirements are clearly stated in the standard and their implementation in the HA1600
straightforward. However, if there are doubts as to how the equipment under test should be
treated, or how the standard should be interpreted, it may be advisable to consult a specialist
EMC testing laboratory, or other Competent Body.
• Fully read this manual before use to understand what measurement options are available and
which modes are appropriate to the tests to be carried out.
• Always use an AC source that meets the supply quality requirements, even for precompliance measurements. Without such a source, results can be seriously misleading.
• Enter the correct nominal voltage and nominal frequency for the test supply.
• Follow the flow chart in the EN61000–3–2 to determine the equipment classification and
therefore which limits apply, or follow the advice of a specialist EMC test house. Select the
equipment load class. Specify Professional Equipment if applicable.
• Set the correct basis of limits for class C or D equipment; if class C, enter the nominal
fundamental current and power factor; if class D, enter the rated power. When testing lighting
equipment below 25 Watts, select class D and set the Minimum Power to 0.
• Check whether Annex C of the standard gives specific operating conditions for the equipment
being tested, as is the case for many common types of domestic appliance.
• For non-European markets, determine the relationship between National standards and the
EN or IEC standards. The European Standard specifies limits only for equipment with a rated
supply voltage of 220V or more. Select standard limits where this applies. Some
National Authorities in regions with 100 or 110V supply systems have specified that the
standard limits should be multiplied by the ratio of 230V to the nominal supply voltage; the
adjust limits for voltage selection performs this calculation.
• Find the maximum peak current condition of the equipment under test and (on Waveform
View set-up) lock that range. If in doubt select a higher range - it is essential that there is
no overload; the resolution of the instrument is sufficient to get accurate results even if a
higher than optimum range is selected.
• Use the ‘real-time’ capability of the HA1600 to observe dynamically the performance of the
equipment under test as operating conditions are varied or as the operating cycle proceeds.
For equipment not covered by Annex C, identify the operating conditions that give a
representative maximum set of harmonic levels, using reasonable engineering judgement.
The value of total harmonic current shown on the Meter view may be helpful.
48
• On the Test View, set up a timed measurement. Set the test duration to cover at
least one full cycle of operation of the equipment being tested - for many types detailed
instructions are given in Annex C of the standard. However if there is no specific clause the
main guidance given is that the measurement time must be “sufficient to meet the
requirements for repeatability”. How long this needs to be is not always clear, but in any event
a minimum of 2½ minutes is required.
Page 50

• Switch on the equipment under test and, after the first 10 seconds, press the START key on
the instrument to clear the averaging accumulators and the max hold values etc. and start the
test timer. Now that measurements are based on the average of all the readings over the test
interval, it is important not to have the instrument accumulating data while the unit under test
is switched off, as this will result in a reading below the proper one. The progress of the
measurements can be monitored on the Harmonics view.
• At the end of the test select the Report view and print the results and assessment. Keep an
archive copy of this and record the details of the measurement conditions; a photograph is
often useful. It should be possible to exactly repeat the measurement at a later date.
The above is necessarily a simplification of the overall procedure. The most important point is
that although the instrument is very easy to use ‘automatically’ for instant results, for compliance
quality measurements the user must take responsibility for specifying the proper test conditions
and setting up the instrument options correctly. If in doubt, seek help from a test house with
suitable experience.
Taking Flicker and Fluctuation Measurements
• For compliance measurements use a laboratory grade AC power source. If the source
provides the reference impedance by feedback, connect its external sense terminals at the
point of connection to the load at the front panel of the instrument. If using a physical
reference impedance, allowance must be made for the resistance of the connecting leads
between the source, the impedance and the instrument. Any error in source impedance
translates directly into an error in the result.
• For pre-compliance measurements it is possible to use any reasonable AC supply in
conjunction with the Current Sensing option of the instrument. In practice, this is usually
sufficiently accurate for compliance measurements, unless the different source impedance
significantly affects the behaviour of the load.
• Read and understand EN61000-3-3. Establish the test conditions and limits (especially for
d
) which apply to the particular equipment under test. Refer to the Test Control (Flicker)
max
section of this manual and configure the instrument as required.
• After setting the required options on the Test Control screen switch on the AC source, with the
load switched off. Allow at least 30 seconds for the filters in the instrument to settle, then
press START to clear the measurement history. Now cycle the equipment under test through
its normal operating sequence. Note that the moment of initial switch-on is included in these
tests, unlike Harmonic testing when the first 10 seconds of operation are excluded. Detailed
requirements for some types of equipment are given in Annex A of the standard.
• The progress of the test can be seen by selecting Meter view, entering set-up, and choosing
either the Flicker Meter or the Voltage Variations display page. Refer to the
earlier section of this manual for a detailed explanation of the information presented.
• When the timed test has completed, print a report of the results of flicker and voltage
fluctuation analysis by selecting Report view and pressing ENTER. The report format
automatically follows the selected operating mode.
• Annex B to the amended standard details the procedure for measuring voltage changes
caused by manual switching events. These requirements amount to a limit on half-cycle rms
inrush current, and apply to all equipment with manually operated power switches. The tests
must be performed manually, using the switch on the equipment under test, and each d
max
result recorded. The highest and lowest results are discarded before taking the average. The
HA-PC Link Plus software provides support for this sequence of measurements and the
required calculation. there is no provision in the instrument for the software to perform this
calculation.
49
Page 51

This software is intended to assist users in taking routine compliance measurements and
archiving the results. It can communicate with the instrument through either an RS232 or (on the
HA1600A) a USB connection.
The PC is used for configuration, display and data archiving only; all real time data handling and
measurement processing continues to be performed by the Digital Signal Processor in the
instrument. The performance of the PC does not affect the accuracy of the measurement results,
and so there is no need for the either the PC or its software to be covered by a calibration
certificate.
Software Installation
The software is intended to run under Windows 2000 or later if using a USB connection, or
Windows 98 or later if using RS232.
Insert the supplied CD into a drive; if Autorun is enabled, the setup program will be launched
automatically, otherwise manually run setup.exe. This will suggest a directory for the program
files, which can be changed if required. There are no other installation options.
The program can be used to save both report files and configuration files; the default location
offered is the program directory. Depending on how many different types of equipment are to be
tested, users may wish to set up a directory structure for storing these files.
HA-PC Link Plus Software
RS232 connection
The instrument must be connected to the PC using a fully wired 9-way cable (without any crossover connections). A suitable cable is provided with the instrument. Full hardware handshaking is
used in both directions, so the use of a proper cable is essential.
After the program is launched and configured for the correct COM port, the program will configure
all the necessary communications options.
USB connection
The USB port in the instrument is a full speed (12 Mbits/s) USB 1.1 port. It will function with any
modern host port (USB 1.1 or USB 2). Read the section below on USB driver installation before
connecting the instrument for the first time.
Operation of the HA-PC Link Plus Software
After connecting the instrument to the PC (with either USB or a fully wired 9-way RS232 cable),
switch the instrument on, and start it in the usual way.
Select the Report View and press SETUP. If necessary, move the selection box to the "Function"
area and select "Remote Serial" or “Remote USB” as required. Press the LOCAL key: the
Remote lamp should light. The instrument will be returned to local control when the PC software
is closed; alternatively press LOCAL again.
After placing the instrument in Remote mode, start the HA-PC Link Plus software from the
desktop shortcut.
50
The first time the software is used, a message will appear reporting that there is no initialisation
file; the software will then create a default one. If communication is not established, a dialog box
will appear allowing selection of the correct COM port. Enter the number of the RS232 port
(normally 1 or 2), or of the virtual COM port established by the USB drivers (between 4 and 255).
Once this is done, the software will set the required communication parameters (which over-ride
the Windows default properties) and the screen should start to show live data reported from the
instrument.
The operating screen follows a workflow sequence, with setting-up on the left and results on the
right. It is recommended that users work in the sequence outlined below.
Page 52

Identify the test
1. Three free-entry text boxes are provided for the user to identify the equipment being tested.
2. Set the nominal voltage and frequency.
3. Select the measurement required (Harmonics or Flicker & Voltage Variations).
Harmonics Measurements
1. Choose the measurement method. Use the 2002 method unless there is specific reason to
use the old one (this is still permitted, provided that the fact is documented in the report).
2. Declare the equipment class, and any basis of measurements required. Refer to the standard
to make these decisions. See also the guidance given earlier in this manual.
3. Choose and lock the current range required to handle the highest peak current consumed by
the equipment under test during its operating cycle.
4. Preview the results: waveform, histogram or table displays may be selected by using the radio
buttons below the display area on the right hand side.
5. Choose a Test Duration; the standard gives some guidance on this.
6. In the Test Status area at the bottom of the left hand side are four buttons:
Reset Meter resets the Max. hold and average calculations.
Hold is a toggle which alternately freezes and releases the measurement.
Free Run can be used at the end of a timed test.
Start Timed Test initiates the test: it changes to Abort test while the test is in progress.
7. Run the test by pressing Start Timed Test. When the set duration expires, the results will be
held.
8. Review and save the results.
• The report can be previewed on screen.
• It can be printed (with a simple format) directly to a printer.
• That version can be saved as a text file. A standard dialog box prompts for filename and
directory. A configuration file (with a .HAC extension) is simultaneously saved.
• The results can be saved as a .CSV file (comma separated variable). This file can then be
imported into a word processor or spreadsheet, formatted as required and incorporated
into larger reports.
Flicker and Voltage Variation Measurements
In general, it is necessary to conduct two sets of tests:
1. Voltage Variations and Flicker during continuous operation of the equipment.
2. A set of 24 manual switching tests according to annex B of EN61000–3–3.
Continuous Test
1. Refer to the standard to identify the test requirements for the particular type of equipment
being tested.
2. Set the d
3. If a flicker test is required, tick the checkbox. If a full 2 hour long term flicker test is required,
tick the second checkbox.
4. The test duration is automatically set to 10 minutes (600 sec) or 2 hours (7200 sec). If flicker
tests are being conducted, these should NOT be changed; if only voltage fluctuation tests are
required, the duration can be adjusted as needed.
5. Run the test and save the report (as for harmonics above).
51
and d(c) limits for the voltage fluctuation test.
max
Page 53

Manual Switching Test (refer to Annex B of EN61000-3-3).
1. Set the required d
2. The default duration of each test is 60 seconds.
3. With the equipment under test switched OFF, press Start Test 1.
4. Then (within a few seconds) switch the equipment on using its own switch (this is a
requirement of the standard).
5. A few seconds before the end of the 60 seconds, switch the equipment off (a dialog box
appears as a reminder).
6. Allow sufficient time for the equipment to cool fully (particularly if it contains inrush limiting
circuits) and for any energy storage components to full discharge.
7. Press Start Step 2 and repeat the procedure.
8. After 24 tests, the software discards the highest and the lowest result and computes the
average of the rest. This is the required result.
9. The New Test button allows the whole procedure to be started again.
10. Save the report.
Exporting Reports
In addition to printing the report in the fixed format of the software, it is possible to save the
results as a Comma Separated Variable (.CSV) file. This can be imported into a word processor
or spreadsheet, and incorporated into a more extensive report format designed by the user.
Consult the documentation for that software for guidance on the use of macros to automate this
process.
limit and the number of tests.
max
52
Page 54

Installation of USB drivers
The USB port is implemented using a USB-to-serial converter integrated circuit and requires
Virtual COM port drivers (provided by the device manufacturer, FTDI) to be installed on the PC.
The drivers are provided on the CD in the “USB Drivers” subdirectory, and are installed using the
Windows “Found new Hardware” wizard. As there may be a later version than is described here
(version 2145), look for a Read-Me file in that directory for current instructions.
So far as is known, the version provided functions satisfactorily, but users might wish to check the
instrument manufacturer’s web site for updated versions of the driver. Any revision to the
installation procedure should be documented with the drivers. Note that installation requires the
correct INF file, to relate the HA1600 to the general drivers, so users cannot simply download the
version on the device manufacturers web site.
1. The instrument does not enable its USB port until it is put into remote USB mode. First
connect the instrument to the PC with a USB cable, then switch the instrument on, and select
Restore Defaults on the start-up screen.
2. Select the Report View and press SETUP. With the selection box in the "Function" area select
“Remote USB”. Press the LOCAL key: the Remote lamp should light. The USB port will
enumerate to the PC.
3. The “New Hardware Found” wizard should open. Click “Next” to continue.
4. Select “Search for a suitable driver for my device (recommended)” and click “Next”.
5. Check the checkbox “Specify a location” and uncheck all the others; click “Next”.
6. Specify the location containing the drivers: “D:\USB drivers” (where D: is the CD drive).
Alternatively use “browse” to find the location. Click “Next”.
7. Windows should select “FTDIBUS.INF”; click “Next”. Then click “Finish” to install this driver.
8. Once Windows has installed this driver, the Wizard will proceed to install the COM port
emulation driver. The procedure is the same, except the file required is FTDIPORT.INF.
If these drivers have been installed before on a PC (perhaps to support another device using the
same integrated circuit), it is common for a warning message to appear asking for permission to
overwrite a file with an older version; in general it is best to keep a consistent set of files, so it is
recommended that users should permit this.
After the drivers are installed, Windows will allocate a COM port number to the particular
HA1600A. Whenever this particular instrument is connected to the same PC, it will always be
given this same port number. HA-PC Link Plus needs to be configured to use this COM port
number; unfortunately the wizard does not tell the user which number has been allocated.
9. To discover the COM port number, the instrument must be connected and in Remote USB
mode (see 1 & 2 above).
10. Select “Start… Settings… Control Panel. Open the “System” object, select the “Hardware” tab
and click “Device Manager…”. Select “Devices by type” from the “View” menu and expand the
Ports (COM and LPT) category. There should be an entry for a HA1600 Harmonics Analyser
(COM n). Note the port number n.
11. Start HA-PC Link Plus and configure it to this port number.
53
Page 55

Routine hardware maintenance is limited to re-calibration and cleaning. The only repair
maintenance that can be carried out by the user is fuse replacement.
From time to time software enhancements may be available which can be uploaded from a PC to
the instrument’s Flash memory.
Calibration
Calibration is guaranteed as in the specification. The manufacturers provide a re-calibration
service, as do most of their agents overseas. Where owners wish to carry out re-calibration
themselves, this should only be done by skilled personnel with access to precision equipment
working in conjunction with the service manual, which may be purchased directly from the
manufacturers or their agents overseas.
Fuse – Instrument Power
The instrument power fuse is located in the fuse holder which forms part of the inlet socket on the
rear panel. Refer to the Installation section for the fuse-rating appropriate to the operating supply
voltage.
Fuse – Load Power
Maintenance & Calibration
A high voltage, high breaking current, fuse is fitted internally in the load power circuit; the correct
fuse type is 10 x 38mm 20A 500V HBC Type aM or gL.
To gain access to the fuse, disconnect the instrument from all voltage sources and remove the six
screws retaining the top cover. Lift off the cover; the fuse is on the load power printed circuit
board mounted on the side of the chassis behind the front panel appliance connector. Make sure
that only fuses of the specified type are used for replacement.
Cleaning
If the instrument requires cleaning, use a cloth that is only lightly dampened with water or a mild
detergent. Polish the display gently with a soft dry cloth only.
WARNING! TO AVOID ELECTRIC SHOCK, OR DAMAGE TO THE INSTRUMENT, NEVER
ALLOW WATER TO GET INSIDE THE CASE. TO AVOID DAMAGE TO THE CASE OR
DISPLAY NEVER CLEAN WITH SOLVENTS.
54
Page 56

Software Updates
The HA1600 software is held in Flash memory and can be upgraded in the field via its RS232
interface. From time to time software updates will be available on the TTi website (tti–test.com).
The file is named 1600Fvvv.S, where vvv is the version number; it is a text file in S-record format.
A software utility called HA1600Updater, to run on a PC under Windows 95 or later, is also
available for download.
Connect the HA1600’s serial port to COM1 on the PC using a fully wired nine core 1-to-1 cable
(with no cross-over connections) such as the one provided with the HA-PC Link software. The PC
must have a serial port capable of operation at 115 kBaud.
For computers running operating systems with full support for hardware handshaking on the
serial port, use the system configuration utility to set the chosen port to 115200 baud, 8 bits, no
parity, with hardware output handshaking using CTS. Under Windows 2000 (or later) open a
32-bit command prompt (Start... Run... cmd OK...), change to the directory containing the
1600Fvvv.S file and enter the following configuration command (note that the parameters are
separated by spaces, not commas):
mode com1: baud=115200 data=8 parity=n octs=on dtr=hs
For computers running versions of Windows without full serial port support, first install the
HA1600Updater utility: switch to the directory containing the downloaded files, run Setup.exe and
the software will automatically install HA1600Updater into a directory called HA1600; it will also
install some ActiveX controls (© National Instruments Corporation) into the Windows System
directory.
Now switch on the HA1600 and, whilst the Initialisation screen is being displayed, press the
Setup soft-key. Then, on the Setup Options screen, press the Update Software softkey to go to the Software Update screen which should display the message Ready for
data from PC.
Under most operating systems, simply use the normal system command to copy the S-record file
to the serial port (e.g. copy 1600Fxxx.S com1:). Progress can be seen on the screen of the
instrument.
Otherwise, if necessary, run the PC software update utility by double-clicking on
HA1600Updater.exe in the HA1600 folder; the HA1600Updater window will open. Click on File,
then Open; the other file(s) on the disk are shown in the Open window. Double-click on the
required S-record file to select it for uploading, and then click on Upload in the HA1600Updater
toolbar, followed by Start. The progress bar will indicate the status of the upload; after a few
seconds, the message ‘File uploaded’ should show in the HA1600Updater window.
When the upload is complete, turn the instrument off then on again. Check for the new installed
version number on the Initialisation screen. Then press the Restore Defaults soft-key to
resume operation of the instrument.
Important Note: Always select Restore Defaults on the initialisation screen the first time
the instrument is switched on after an upgrade has been installed.
55
Page 57

Thurlby Thandar Instruments Ltd
Glebe Road, Huntingdon, Cambridgeshire PE29 7DR, England
Telephone: +44 (0)1480 412451 Fax: +44 (0)1480 450409
e mail: sales@tti-test.com
International website: www.tti-test.com UK website: www.tti.co.uk
Book Part No. 48511-0400 Issue 8
 Loading...