

Page 1

xx
TDS3000C Series
ZZZ
Digital Phosphor Oscilloscopes
User Manual
*P071230803*
071-2308-03
Page 2

Page 3

xx
TDS3000C Series
ZZZ
Digital Phosphor Oscilloscopes
User Manual
Issued: September 2009
REPRODUCTION AND DISTRIBUTION OF THIS
TECHNICAL MANUAL IS AUTHORIZED FOR UNITED
STATES OF AMERICA GOVERNMENT PURPOSES.
www.tektronix.com
071-2308-03
Page 4

Copyright © Tektronix. All rights reserved. Licensed software products are owned by Tektronix or its subsidiaries
or suppliers, and are protected by national copyright laws and international treaty provisions.
Tektronix products are covered by U.S. and foreign patents, issued and pending. Information in this publication
supersedes that in all previously published material. Specifications and price change privileges reserved.
TEKTRONIX and TEK are registered trademarks of Tektronix, Inc.
TEKPROBE, and TekSecure are registered trademarks of Tektronix, Inc.
DPX, WaveAlert, e*Scope, and OpenChoice are trademarks of Tektronix, Inc.
Contacting Tektronix
Tektronix, Inc.
14200 SW Karl Braun Drive
P.O. Bo x 5 00
Beaverton, OR 97077
USA
For product information, sales, service, and technical support:
In North America, call 1-800-833-9200.
World w ide, vi s it www.tektronix.com to find contacts in your area.
Page 5

Warranty
Tektronix warrants that the product will be free from defects in materials and workmanship for a period of three (3)
years from the date of original purchase from an authorized Tektronix distributor. If the product proves defective
during this warranty period, Tektronix, at its option, either will repair the defective product without charge for
parts and labor, or will provide a replacement in exchange for the defective product. Batteries are excluded from
this warran
reconditioned to like new performance. All replaced parts, modules and products become the property of Tektronix.
ty. Parts, modules and replacement products used by Tektronix for warranty work m ay be new or
In order to o
of the warranty period and make suitable arrangements for the performance of service. Customer shall be
responsible for packaging and shipping the defective product to the service center designated by Tektronix,
shipping charges prepaid, and with a copy of customer proof of purchase. Tektronix shall pay for the return of the
product to Customer if the shipment is to a location within the country in which the Tektronix service center is
located. Customer shall be responsible for paying all shipping charges, duties, taxes, and any other charges for
product
This warranty shall not apply to any defect, failure or damage caused by improper use or improper or inadequate
mainte
resulting from attempts by personnel other than Tektronix representatives to install, repair or service the product;
b) to repair damage resulting from improper use or connection to incompatible equipment; c) to repair any damage
or malfunction caused by the use of non-Tektronix supplies; or d) to service a product that has been modified or
integrated with other products when the effect of such modification or integration increases the time or difficulty
of servicing the product.
THIS WARRANTY IS GIVEN BY TEKTRONIX WITH RESPECT TO THE PRODUCT IN LIEU OF ANY
OTHER WARRANTIES, EXPRESS OR IMPLIED. TEKTRONIX AND ITS VENDORS DISCLAIM ANY
LIED WARRANTIES OF MERCHANTABILITY OR FITNESS FOR A PARTICULAR PURPOSE.
IMP
TEKTRONIX’ RESPONSIBILITY TO REPAIR OR REPLACE DEFECTIVE PRODUCTS IS THE SOLE
AND EXCLUSIVE REMEDY PROVIDED TO THE CUSTOMER FOR BREACH OF THIS WARRANTY.
TEKTRONIX AND ITS VENDORS WILL NOT BE LIABLE FOR ANY INDIRECT, SPECIAL, INCIDENTAL,
OR CONSEQUENTIAL DAMAGES IRRESPECTIVE OF WHETHER TEKTRONIX OR THE VENDOR HAS
ADVANCE NOTICE OF THE POSSIBILITY OF SUCH DAMAGES.
btain service under this warranty, Customer must notify Tektronix of the defect before the expiration
s returned to any other locations.
nance and care. Tektronix shall not be obligated to furnish service under this warranty a) to repair damage
[W16 – 15AUG04]
Page 6

Page 7

Table of Contents
General Safety Summary ......................................................................................... iii
Compliance Information........................................................................................... v
EMC Compliance............................... .................................. ............................. v
Safety Compliance........................................................................................... vii
Environmental Considerations ...................... ................................ ........................ ix
Preface .............................................................................................................. xi
Getting Started . ... . ... ... . ... ... . ... . .. . ... . ... ... . ... ... . ... .... ... . ... ... . ... ... . ... . .. . ... . ... ... . ... ... . ... ... . . 1
Initial Setup... ... . ... ... . ... ... . ... ... . .. . ... ... . ... ... . ... ... . ... ... . ... ... . .. . ... . .. . ... . .. . ... ... . ... ... . ... . 1
Product and Feature Description ............................................................................. 5
Operating Positions............................................................................................ 8
Connecting Power .............. ................................ .................................. ............. 9
Installing an Application Module ... ... . ... ... . ... ... . ... . .. . ... . ... ... . ... ... . ... .... ... . ... ... . ... ... . ... . 13
Installing the Communication Module . ... . ... ... . ... .... ... . ... ... . ... ... . ... . .. . ... . ... ... . ... ... . ... ... . 13
Front-Panel Menus and Controls............................................................................ 15
Front-Panel Connectors .................... .................................. ................................ 23
Rear-Panel Connectors....................................................................................... 24
Communication Module Connectors ..................... ................................ .................. 24
plication Examples................................... .................................. ........................ 27
Ap
Taking Simple Measurements ............................................................................... 27
Analyzing Signal Detail...................................................................................... 33
Taking FFT Measurements .. ................................ ................................ ................ 39
Triggering on a Video Signal.................. .................................. ............................ 41
Capturing a Single-Shot Signal ..... ................................ .................................. ...... 43
Saving Data to a USB Flash Drive.......................................................................... 46
Reference................. ................................ ................................ .......................... 51
Acquisition Controls.. ... . ... ... . ... ... . ... . .. . ... . ... ... . ... ... . ... ... . ... ... . ... ... . ... . .. . ... . ... ... . ... ... 51
Cursor .... .................................. ................................ ................................ .... 59
Display..................... ................................ .................................. .................. 63
Hard Copy ..................................................................................................... 65
Horizontal Controls........................................................................................... 67
Math and FFT ................................................................................................. 72
Measure........................................................................................................ 79
QuickMenu .................................................................................................... 84
Save/Recall .................................................................................................... 84
Trigger Controls............................................................................................... 90
Utility .... ... . .. . ... . .. . ... . .. . ... ... . ... ... . ... ... . ... ... . ... ... . ... ... . ... ... . .. . ... . ... ... . .. . ... ... . ... ... 109
Vertical Controls .............................. .................................. ............................ 114
e*Scope Web-Based Remote Control ........................ .................................. .......... 118
TDS3000C Series Oscilloscope User Manual i
Page 8

Table of Contents
Appendix A: Spe
Appendix B: Factory Setup..................................................................................... 131
Appendix C: Accessories ......... .................................. ................................ ............ 135
Appendix D: Probe Basics.......................... ................................ ............................ 139
Probe Descriptions.............................. .................................. .......................... 139
Probe Compensation........................................................................................ 139
TekProbe In
Probe Guard ................................................................................................. 140
Ground Leads ............................................................................................... 140
P3010 High-Frequency Compensation..................... .................................. ............ 142
P3010 Replaceable Parts and Accessories ............................................................... 143
P6139A Replaceable Parts and Accessories ..................... ................................ ........ 144
Using Ot
Supported Active Probes and Adapters ...... .................................. .......................... 145
Unsupported Probes ........................................................................................ 146
Appendix E: General Care and Cleaning ..................................................................... 147
Appendix F: Ethernet Setup .................................................................................... 149
Your Ethernet Network Information ...................................................................... 149
ring the Ethernet Network Settings.......................................... ........................ 150
Ente
Entering the Network Printer Settings................ ................................ .................... 151
Testing Your Ethernet Connection ........................................................................ 151
Troubleshooting Your Ethernet Connection ............. ................................ ................ 152
The Instrument Setup Screen............ ................................ .................................. 153
The Printer Configuration Screen ............................. ................................ ............ 154
e Add Printer Screen ............ .................................. ................................ ...... 155
Th
Ethernet Error Messages ............................... ................................ .................... 156
Ethernet Settings Form .. . .. . ... ... . ... ... . ... ... . .. . ... ... . .. . ... ... . ... ... . ... ... . .. . ... ... . .. . ... ... . ... . 157
Index
cifications .......... ................................ .................................. ........ 121
terface........................ .................................. ................................ 140
her Probes. .................................. ................................ ...................... 145
ii TDS3000C Series Oscilloscope User Manual
Page 9

General Safety Summary
Review the following safety precautions to avoid injury and prevent damage to
this product or any products connected to it.
To avoid potential hazards, use this product only as specified.
Only qualified personnel should perform service procedures.
To Avoid Fire or Personal
Injury
Use Proper Power Cord. Use only the power cord specified for this product and
certified f
Connect and Disconnect Properly. Connect the probe output to the measurement
instrume
probe reference lead to the circuit under test before connecting the probe input.
Disconnect the probe input and the probe reference lead from the circuit under test
before disconnecting the probe from the measurement instrument.
Ground the Product. This product is grounded through the grounding conductor
of the power cord. To avoid electric shock, the grounding conductor must be
connected to earth ground. Before making connections to the input or output
terminals of the product, ensure that the product is properly grounded.
Observe All Terminal Ratings. To a v o id fire or shock hazard, observe all ratings
and markings on the product. Consult the product manual for further ratings
info
Connect the probe reference lead to earth ground only.
Do Not Operate Without Covers. Do not operate this product with covers or panels
removed.
Do Not Operate With Suspected Failures. If you suspect that there is damage to this
product, have it inspected by qualified service personnel.
or the country of use.
nt before connecting the probe to the circuit under test. Connect the
rmation before making connections to the product.
Avoid Exposed Circuitry. Do not touch exposed connections and components
when power is present.
Replace Batteries Properly. Replace batteries only with the specified type and
rating.
Recharge Batteries Properly. Recharge batteries for the recommended charge
cycle only.
Do Not Operate in Wet/Damp Conditions.
Do Not Operate in an Explosive Atmosphere.
Keep Product Surfaces Clean and Dry.
Provide Proper Ventilation. Refer to the manual’s installation instructions for
details on installing the product so it has proper ventilation.
TDS3000C Series Oscilloscope User Manual iii
Page 10
General Safety Summary
TermsinthisManual
Symbols and Terms on the
Product
These terms may
WARNING. Warning statements identify conditions or practices that could result
in injury or loss of life.
CAUTION. Caution statements identify conditions or practices that could result in
damage to this product or other property.
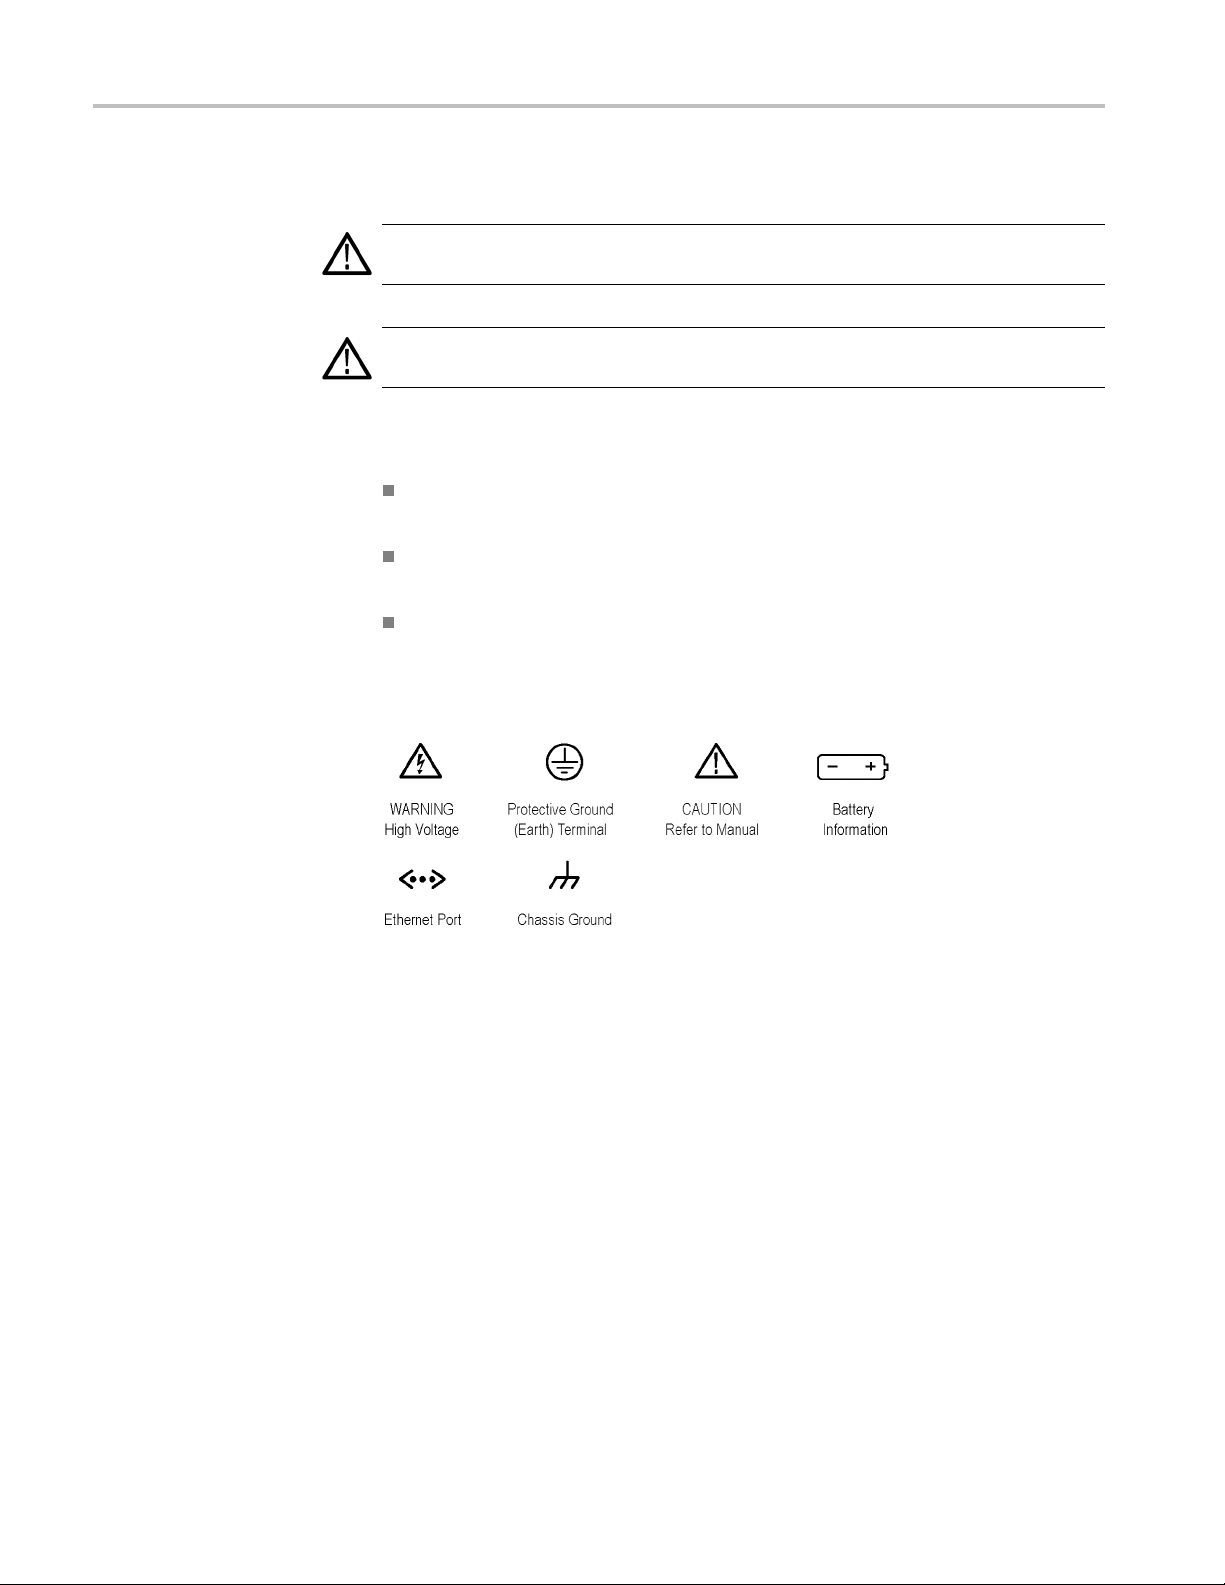
These terms may appear on the product:
DANGER in
the marking.
WAR NI NG
read the marking.
CAUTIO
The following symbol(s) may appear on the product:
appear in this manual:
dicates an injury hazard immediately accessible as you read
indicates an injury ha zard not immediately accessible as you
N indicates a hazard to property including the product.
iv TDS3000C Series Oscilloscope User Manual
Page 11

Compliance Information
This section lists the EMC (electromagnetic compliance), safety, and
environmental standards with which the instrument complies.
EMC Compliance
EC Declaration of
Conformity – EMC
Meets intent of Directive 2004/108/EC for Electromagnetic Compatibility.
Compliance was demonstrated to the following specifications as listed in the
Official Journal of the European Communities:
EN 61326-1:2006, EN 61326-2-1:2006. EMC requirements for electrical equipment
for measurement, control, and laboratory use.
123
CISPR 11:2003. Radiated and conducted emissions, Group 1, Class A
IEC 61000-4-2:2001. Electrostatic discharge immunity
IEC 61000-4-3:2002. RF electromagnetic field immunity
4
IEC 61000-4-4:2004. Electrical fast transient/burst immunity
IEC 61000-4-5:2001. Power line surge immunity
IEC 61000-4-6:2003. Conducted RF immunity
IEC 61000-4-11:2004. Voltage dips and interruptions immunity
5
6
EN 61000-3-2:2006. AC power line harmonic emissions
EN 61000-3-3:1995. Voltage changes, fluctuations, and flicker
European Contact.
Tektronix UK, Ltd.
Western Peninsula
Western Ro ad
Bracknell, RG12 1RF
United Kingdom
1
This product is intended for use in nonresidential areas only. Use in residential areas may cause electromagnetic
interference.
2
Emissions which exceed the levels required by this standard may occur when this equipment is connected to a
test object.
3
To ensure compliance with the EMC standards listed here, high quality shielded interface cables should be used.
4
Theincreaseintracenoisewhilesubjectedtoatestfield(3V/moverthefrequencyrange80MHzto1GHz,
1.4GHzto2.0GHzand1V/mfrom2.0GHzto2.7GHz,with8
exceed 8 major divisions peak-to-peak. Ambient conducted field may induce triggering when the trigger threshold
is offset less than 4 major divisions from ground reference for the IEC 61000-4-3 test.
5
Theincreaseintracenoisewhilesubjectedtoatestfield (3 V/rms over the frequency range 150 kHz to 80 MHz,
with 80% amplitude modulation at 1 kHz) is not to exceed 2 major divisions peak-to-peak. Ambient conducted
0% amplitude modulation at 1 kHz) is not to
TDS3000C Series Oscilloscope User Manual v
Page 12

Compliance Information
Australia / New Zealand
Declaration
of
Conformity – EMC
field may induce
the IEC 61000-4-6 test.
6
Performance C
levels (IEC 61000-4-11).
triggering when the trigger threshold is offset less than 1 major division from ground reference for
riterion C a pplied at the 70%/25 cycle Voltage-Dip and the 0%/250 cycle Voltage-Interruption test
Complies with the EMC provision of the Radiocommunications Act per the
following st
andard, in accordance with ACMA:
CISPR 11:2003. Radiated and Conducted Emissions, Group 1, Class A, in
accordance
with EN 61326-1:2006 and EN 61326-2-1:2006.
vi TDS3000C Series Oscilloscope User Manual
Page 13

Compliance Information
Safety Compli
ance
EC Declaration of
Conformity – Low Voltage
U.S. Natio
nally Recognized
Testing Laboratory Listing
Canadian Certification
Additional Compliances
Compliance was demonstrated to the following specification as listed in the
Official Journal of the European Communities:
Low Voltage Directive 2006/95/EC.
EN 61010-1: 2001. Safety requirements for electrical equipment for
measurement control and laboratory use.
UL61010B-1:2003, First Edition, Safety Requirements for Electrical
Equipment for Measurement, Control, and Laboratory Use.
CAN/CSA C22.2 No. 1010.1-92 - Safety Requirements for Electrical
Equipment for Measurement, Control, and Laboratory Use. CAN/CSA
C22.2 No. 1010.1B 97 - Amendment 2 to CAN/CSA C22.2 No. 1010.1-92
- Safety Requirements for Electrical Equipment for Measurement, Control,
and Lab
IEC 61010-1: 2001. Safety requirements for electrical equipment for
measurement, control, and laboratory use.
oratory Use.
ment Type
Equip
Safety Class
Pollution Degree
ription
Desc
Test and measuring equipment.
Class1–groundedproduct.
A measure of the contaminants that could occur in the environment around
within a product. Typically the internal environment inside a product is
and
considered to be the same as the external. Products should be used only in the
environment for which they are rated.
Pollution Degree 1. No pollution or only dry, nonconductive pollution occurs.
Products in this category are generally encapsulated, hermetically sealed, or
located in clean rooms.
Pollution Degree 2. Normally only dry, nonconductive pollution occurs.
Occasionally a temporary conductivity that is caused by condensation must
be expected. This location is a typical office/home environment. Temporary
condensation occurs only when the product is out of service.
Pollution Degree 3. Conductive pollution, or dry, nonconductive pollution
that becomes conductive due to condensation. These are sheltered locations
TDS3000C Series Oscilloscope User Manual vii
Page 14

Compliance Information
Pollution Degree
Installation (Overvoltage)
Category Descriptions
where neither t
from direct sunshine, rain, or direct wind.
Pollution Deg
conductive dust, rain, or snow. Typical outdoor locations.
Pollution Degree 2 (as defined in IEC 61010-1). Note: Rated for indoor use only.
Term inals o
designations. The installation categories are:
Measureme
low-voltage installation.
Measurem
installation.
Measure
connected to the low-voltage installation.
Measur
directly connected to MAINS.
n this product may have different installation (overvoltage) category
ement Cate gory I. For measurements performed on circuits not
emperature nor humidity is controlled. The area is protected
ree 4. Pollution that generates persistent conductivity through
nt Category IV. For measurements performed at the source of
ent Category III. For measurements performed in the building
ment Category II. For measurements performed on circuits directly
Overvoltage Category
Overvoltage Category II (as d efined in IEC 61010-1).
viii TDS3000C Series Oscilloscope User Manual
Page 15
Compliance Information
Environmenta
Product End-of-Life
l Considerations
This section provides information a bout the environmental impact of the product.
Observe the following guidelines when recycling an instrument or component:
Handling
Equipment Recycling. Production of this equipment required the extraction and
use of natural resources. The equipment may contain substances that could be
harmful to
end of life. In order to avoid release of such substances into the environment and
to reduce the use of natural resources, we encourage you to recycle this product
in an appropriate system that will ensure that most of the ma t erials are reused or
recycled appropriately.
y Recycling. This product might contain an optional lithium ion (Li-ion)
Batter
rechargeable battery, which must be recycled or disposed of properly.
the environment or human health if improperly handled at the product’s
This sym
Union requirements according to Directives 2002/96/EC and 2006/66/EC
on waste electrical and electronic equipment (WEEE) and batteries. For
informa
Tektronix Web site (www.tektronix.com).
bol indicates that this product complies with the applicable European
tion about recycling options, check the Support/Service section of the
Transporting Batteries
um-Ion batteries are subject to disposal and recycling regulations that
Lithi
vary by country and region. Always check and follow your applicable
regulations before disposing of any battery. Contact Rechargeable Battery
Recycling Corporation (www.rbrc.org) for U.S.A. and Canada, or your local
battery recycling organization.
Many countries prohibit the disposal of waste electronic equipment in
standard waste receptacles.
Place only discharged batteries in a battery collection container. Use electrical
tape or other approved covering over the battery connection points to prevent
short circuits.
Mercury Notification. This product uses an LCD backlight lamp that contains
mercury. Disposal may be regulat ed due to environmental considerations. Please
contact your local authorities or, within the United States, refer to the E-cycling
Central Web page (www.eiae.org) for disposal or recycling information.
The capacity of the optional lithium ion rechargeable battery pack in this product
is under 100 Wh. The lithium-equivalent content, as definedbytheUNManual
of Tests and Criteria Part III Section 38.3, is under 8 g per pack and 1.5 g per
individual cell.
TDS3000C Series Oscilloscope User Manual ix
Page 16

Compliance Information
Restriction of Hazardous
Substances
Always check al
before transporting a Lithium-Ion battery.
Transporting
cases, be specifically limited or prohibited.
This product has been classified as Monitoring and Control equipment, and is
outside the
scope of the 2002/95/EC RoHS Directive.
l applicable local, national, and international regulations
an end-of-life, damaged, or recalled battery may, in certain
x TDS3000C Series Oscilloscope User Manual
Page 17

Preface
This manual contains operating information for the TDS3000C Series Digital
Storage Oscilloscopes. The manual consists of the following chapters:
The Getting Started chapter briefly describes features of the oscilloscope
and provides installation instructions.
The Application Examples chapter provides examples on how to solve a
variety of measurement problems.
The Reference chapter describes the selections or available range of values
for each option.
The Appendix A: Specifications chapter includes electrical, environmental,
and physical specifications for the oscilloscope, as well as certifications and
complia
The Appendix B: Factory Setup chapter contains a list of the menus and
contro
the Save/Recall front-panel button, and then the Recall Factory Setup screen
button.
The Appendix C: Accessories chapter briefly describes standard and optional
accessories.
nces.
ls with the default settings that the oscilloscope recalls when you push
The Appendix D: Probe Basics chapter provides basic information o n the
P3010 and the P6139A probes, and on other probes.
The Appendix E: Cleaning chapter describes h ow to take care of the
oscilloscope.
The Appendix F: Ethernet Setup chapter describes how to set up t he
oscilloscope for printing through the network, and remote programming.
TDS3000C Series Oscilloscope User Manual xi
Page 18

Preface
Preventing Ele
ctrostatic
Damage
CAUTION. Electrostatic discharge (ESD) can damage components in the
oscilloscop
when directed to do so.
Use a Ground Strap. Wear a grounded, antistatic wrist strap to discharge the static
voltage from your body while installing or removing sensitive components.
UseaSafeW
static charge in the work area where you install or remove sensitive components.
Avoid handling sensitive components in areas that have a floor or benchtop
surface capable of generating a static charge.
Handle Components Safely. Do not slide sensitive components over any surface.
Do not t
possible.
Transport and Store Carefully. Transport and store sensitive components in a
static-protected bag or container.
e and its accessories. To prevent, ESD, observe these precautions
ork Area. Do not use any devices capable of generating or holding a
ouch exposed connector pins. Handle sensitive components as little as
xii TDS3000C Series Oscilloscope User Manual
Page 19

Preface
Firmware Updates Through
the Internet
If a newer versi
USB flash drive to update your oscilloscope.
To update the fi
1. From your c omputer, access the www.tektronix.com Web site and c heck if a
newer version of oscilloscope firmware is available.
If there is a newer version of firmware, download the firmware file from the
web page. Unzip and copy the tds3000c.img file into the root folder of a
USB flash dr
2. Power off your oscilloscope.
3. Insert the USB flash drive into the flash drive port on the front of the
oscilloscope.
4. Power on your oscilloscope.
5. When prompted, push the OK Load New Firmware menu button to start
the firmware load process.
NOTE. Do not power off the oscilloscope or remove the USB flash drive until the
loscope finishes installing the firmware.
oscil
on of firmware becomes available, you can use the Internet and a
rmware, follow these steps:
ive.
6. Wait for the oscilloscope to reboot itself.
7. When prompted, remove the USB flash drive.
8. Push the Utility front-panel button.
9. Push the Version bottom button. The oscilloscope displays the firmware
version n umber.
10. Confirm that the version number matches that of the new firmware.
TDS3000C Series Oscilloscope User Manual xiii
Page 20

Preface
xiv TDS3000C Series Oscilloscope User Manual
Page 21

Getting Started
Initial Setup
In addition to a product and feature description, this chapter covers the following
topics:
How to perform a quick functional check, install and compensate passive
probes, compensate the signal path, and set the time and date
How to install the power cord, battery pack, and operate the oscilloscope
safely with battery power
How to install application modules and the communication module
How to use the menu system
How to identify the oscilloscope controls and connectors
The following procedures describe how to quickly verify that the oscilloscope is
powering up and functioning correctly, compensate passive probes using the
built-in compensation signal, run the signal path compensation (SPC) routine for
maximum signal accuracy, and set the time and date.
You should perform all initial setup procedures the firsttimeyouusethe
oscilloscope.
You should perform the probe compensation procedure whenever you attach a
passive probe for the first time to any input channel.
You should run the signal path compensation routine whenever the ambient
temperature changes by 10 °C (18 °F) or more.
TDS3000C Series Oscilloscope User Manual 1
Page 22
Getting Started
Functional Check
Perform this qu
ick functional check to verify that your oscilloscope is operating
correctly.
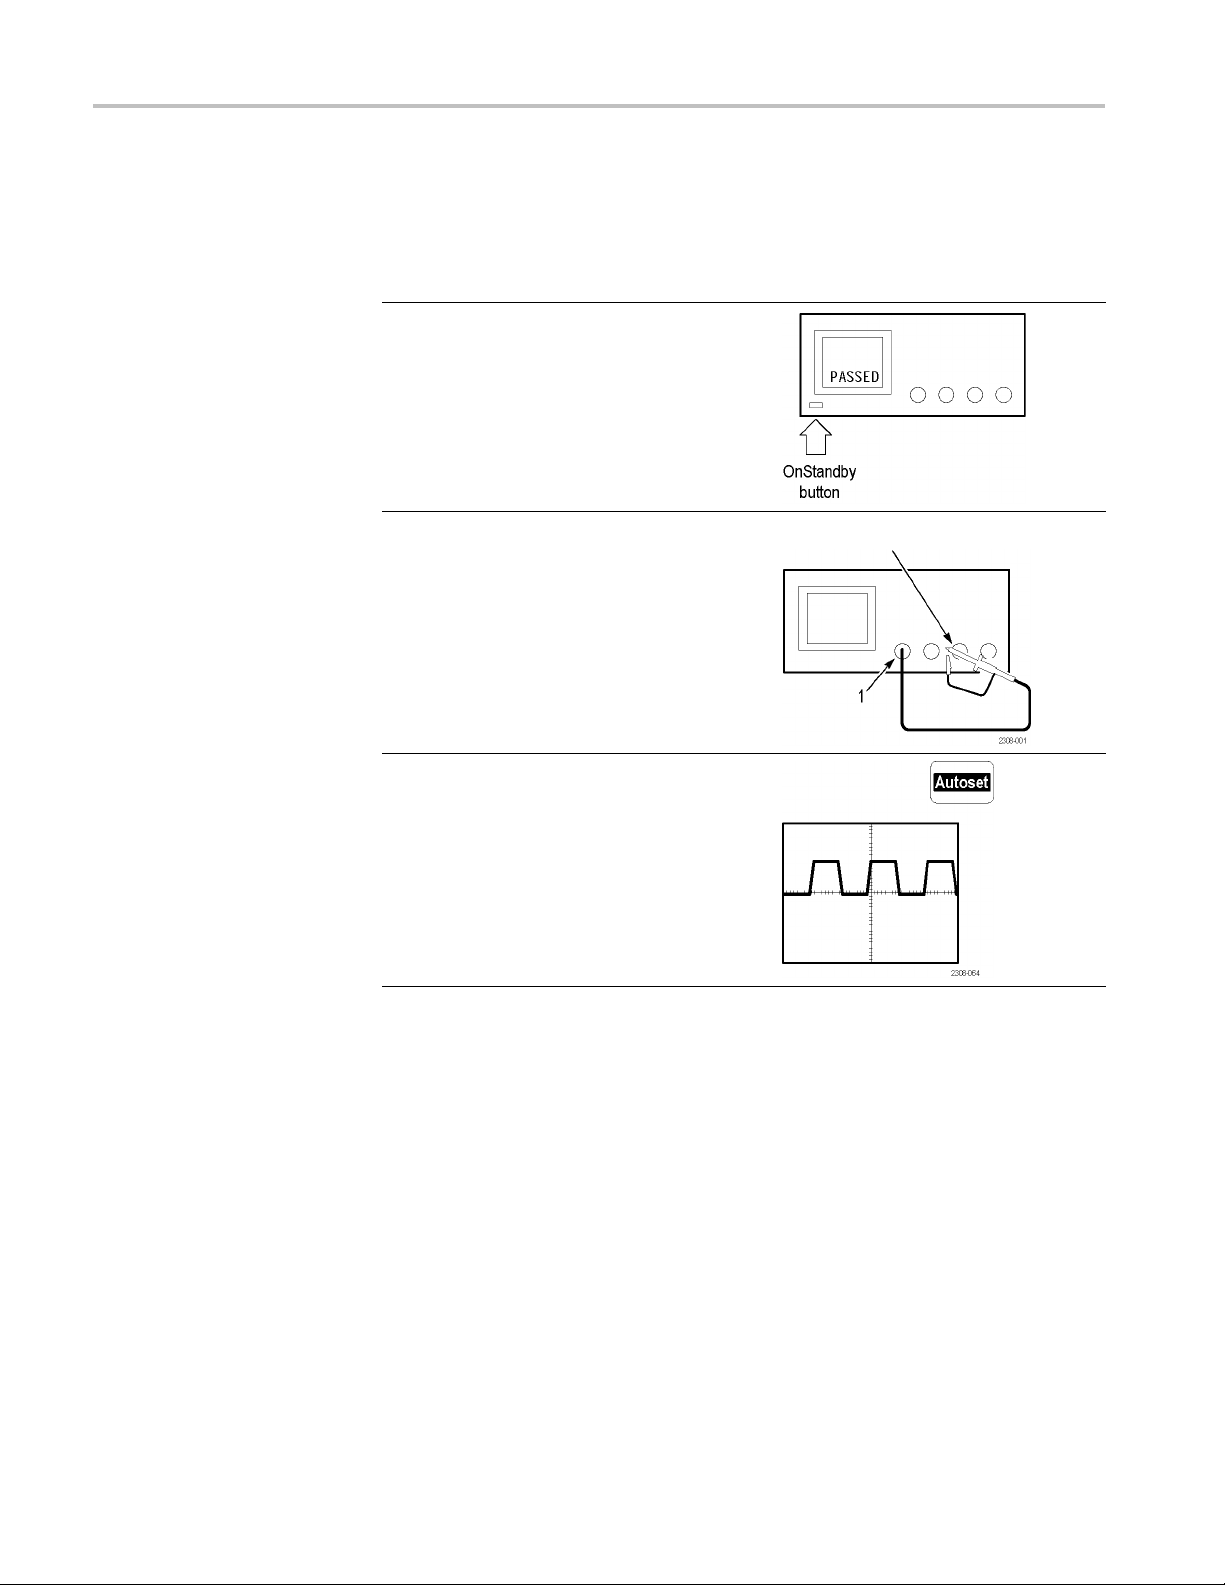
1. Connect the oscilloscope power cable. (See
page 9.)
2. Power on the oscilloscope.
Wait for the confirmation that all self tests
have passed.
3. Connect the oscilloscope probe to channel
1. Attach the probe tip and reference lead to
the Probe Comp connectors.
Probe Comp
4. Push the Autoset button. You should see a
square wave in the display (approximately
5Vat1kHz).
2 TDS3000C Series Oscilloscope User Manual
Page 23

Getting Started
Probe Compensation
Perform this ad
justment to match your probe to the input channel. This should be
done whenever you attach a passive probe for the first time to any input channel.
1. Connect the oscilloscope probe to channel
1. Attach the probe tip and reference lead
to the Probe Comp connectors, then push
Autoset.
If using the probe hook-tip, ensure a proper
connection by firmly twisting the tip onto the
probe.
2. Check the shape of the displayed waveform.
3. If necessary, adjust your probe.
Probe Comp
Over compensated
Under compensated
Compensated correctly
Autoset button
NOTE. See Appendix D: Probe Basics for more information about the probes
provided with your oscilloscope.
TDS3000C Series Oscilloscope User Manual 3
Page 24

Getting Started
Signal Path Compensation
(SPC)
Adjust
ing the Oscilloscope
Time and Date
The SPC routine
measurement accuracy. You can run the routine anytime but you should always
run the routine if the ambient temperature changes by 10 °C (18 °F) or more.
To compensate the signal path, follow these steps:
1. Disconnect
2. Push the Utility button.
3. Push the System screen button to select Cal.
4. Push the Signal Path screen button.
5. Push OK Compensate Signal Path. This procedure takes several minutes
to complete.
NOTE. The signal path compensation does not include calibration to the probe tip.
To set your oscilloscope to the current date and time, follow these steps:
1. Push the Utility button.
2. Push the System bottom button to select Confi g.
optimizes the oscilloscope signal path for maximum
any probes or cables from the channel input connectors.
3. Push t
4. Push
he Set Date & Time bottom button. Use the side menu buttons to
set the date and time values.
the OK Enter Date/Time side button to set the oscilloscope date and
time.
4 TDS3000C Series Oscilloscope User Manual
Page 25

Product and Feature Description
The TDS3000C series oscilloscopes consist of the following models:
Model Channels Bandwidth Maximum
TDS3012C
TDS3014C
TDS3032C
TDS3034C
TDS3052C
TDS3054C
2 100 MHz
4 100 MHz
2 300 MHz
4 300 MHz
2 500 MHz
4 500 MHz
Getting Started
1.25 GS/s
1.25 GS/s
2.5 GS/s
2.5 GS/s
5GS/s
5GS/s
Acquisition Features
WaveAlert Waveform Anomaly Detection. This feature automatically detects
anomalous waveforms by comparing the current waveform to the previous
waveform. WaveAler
t sets how the oscilloscope responds: stop on anomaly, beep
on anomaly, and save anomalous waveform to a USB flash drive. It’s useful for
capturing signal glitches and intermittent waveform errors. (See page 59.)
Separate Digitizers. This feature ensures accurate timing measurements with
separate digitizers for each channel. Each digitizer can sample at up to the
maximum sample rate; the acquisition on all channels is always concurrent to
provide full single-shot bandwidth on each channel.
Normal Acquisition. This feature acquires 10,000 point waveforms to capture
horizontal detail, and then you can use the zoom
function to analyze the
detail. (See page 57.)
Fast Trigger Acquisition. This feature acquires u p to 3,400 waveforms per second
(500 point mode) so you can see rapidly changing signals or intermittent si
gnal
irregularities. (Seepage57.)
Pretrigger. You can capture signals that o ccur before the trigger point. You can
position the trigger point at the beginning of the acquisition, at the end, or at
any location in between. (See page 67.)
Delay. You can also delay the acquisition so that it starts after the trigger point.
Use delay when you want to acquire the signal at a specific time after the trigger
point. (See page 68.)
Peak Detect. This feature allows you to see pulses as narrow as 1 ns even at the
slower time base settings. Peak Detect helps you see noise and glitches in your
signal. (Seepage55.)
Signal Processing
Features
Average. You can apply averaging to your signal to remove uncorrelated noise
and improve measurement accuracy. (See page 56.)
TDS3000C Series Oscilloscope User Manual 5
Page 26

Getting Started
Display Features
Envelope. You c
a signal. (See page 56.)
Waveform Math. You can use waveform math to add, subtract, multiply, or divide
waveforms. For example, you can use math to analyze differential signals or to
calculate a power waveform. (See page 72.)
FFT Analysis. You can use FFT (Fast Fourier Transform) measurements to convert
a time-domain signal into its frequency components for analysis. (See page 73.)
Color LCD Display. You can identify a nd differentiate waveforms easily with
color coding. Waveforms, readouts, and buttons are color matched to increase
productivity and reduce operating errors. (See page 64.)
Digital Phosphor. A Digital Phosphor Oscilloscope can clearly display intensity
modulation in y our signals. The oscilloscope automatically overlays subsequent
acquisitions and then decays them to simulate the writing and decay of the
phosphor in the CRT of an analog oscilloscope. This feature results in an
intensity-graded waveform display that shows the information contained in the
intensity modulation. (See page 53.)
Signal Preview. You can use the preview feature to optimize the control settings
when setting up a single-shot acquisition. As you adjust the controls, the
adjustments modify the current acquisition to show a preview of how the next
acquisition should appear. (See page 54.)
an use envelope to capture and display the maximum variation of
Measurement Features
Trigger Features
Cursors. You can use cursors to take simple voltage, time, and frequency
measurements. (See page 59.)
Automatic Measurements. You can choose from a list of au
measurements. (See page 82.) You can customize the measurements by changing
reference levels or by adding measurement gating. (See page 79.)
XY Waveform Cursors. You can use cursors to take measurements on XY
waveforms. (See page 62.)
Dual Triggers. You can use the main (A) trigger system alone or add the B trigger
to capture more complex events. You can also use the A and B triggers together to
set up a wait-for-time or wait-for-events trigger. (See page 92.)
Logic Triggers. You can trigger on a Boolean condition between two signals. You
can use logic triggers to analyze problems in digital circuits, or synchronous
state machines. (See page 97.)
Pulse Triggers. You can trigger on a signal that meets a timing or threshold
condition. You can use pulse triggers to analyze problems in digital circuits, with
tomatic waveform
6 TDS3000C Series Oscilloscope User Manual
Page 27

Getting Started
Convenience Features
bus contention
(See page 102.)
Video Trigger. You can trigger on video fields or lines to see a stable display of
standard video signals. (See page 107.)
Alternatin
source, from the lowest-numbered active channel to the highest-numbered active
channel. (See page 96.)
Built-In External Trigger. All models have an external trigger input. Four-channel
models have the external trigger connector on the back of the oscilloscope.
Two-chan
e*Scope Web-based Remote Control. You can access your TDS3000C oscilloscope
through the Internet, from across a room to across the world. (See page 118.)
Built-in Ethernet. You can connect your TDS3000C oscilloscope to a network
Internet using the built-in 10BaseT Ethernet port, for e*Scope access or
or the
printing screen images to network printers. (See page 149.)
Autoset. You can use Autoset to quickly set up the vertical, horizontal, and
trigger controls for a usable display. (See page 52.)
, or in bus transceivers, transmission lines, and op-amp circuits.
g Trigger. You can sequentially use each active channel as a trigger
nel models have the external trigger connector on the front panel.
pe QuickMenu. You can use the built-in Scope QuickMenu for simplified
Sco
oscilloscope operation. (See page 21.)
Single Sequence. One button sets the trigger parameters to the correct settings for
a single-shot acquisition (or single-sequence acquisition). (See page 51.)
SB Flash Drive Port. YoucanuseaUSBflash drive to store and recall
U
waveforms and setups, as well as upgrade the oscilloscope firmware and install
new features. (See page 86.)
Probe Support. You can use the standard probes or choose an optional probe for
aspecific application. Appendix D provides information and limitations. (See
page 139.)
Multilingual User Interface. On-screen menus and messages are in 11 languages.
(See page 109.)
TDS3000C Series Oscilloscope User Manual 7
Page 28
Getting Started
Optional Feat
ures
Operating Positions
Application Mo
measurement features. (See page 135.)
Communication Module. You can install the communication module to add
RS-232, GPIB, and VGA ports for remote programmability, or to display the
oscilloscope screen on a monitor. (See page 13.)
Battery Power. You can install a rechargeable Lithium-Ion battery pack
(TDS3BATC) to use the oscilloscope without line power. (See page 9.)
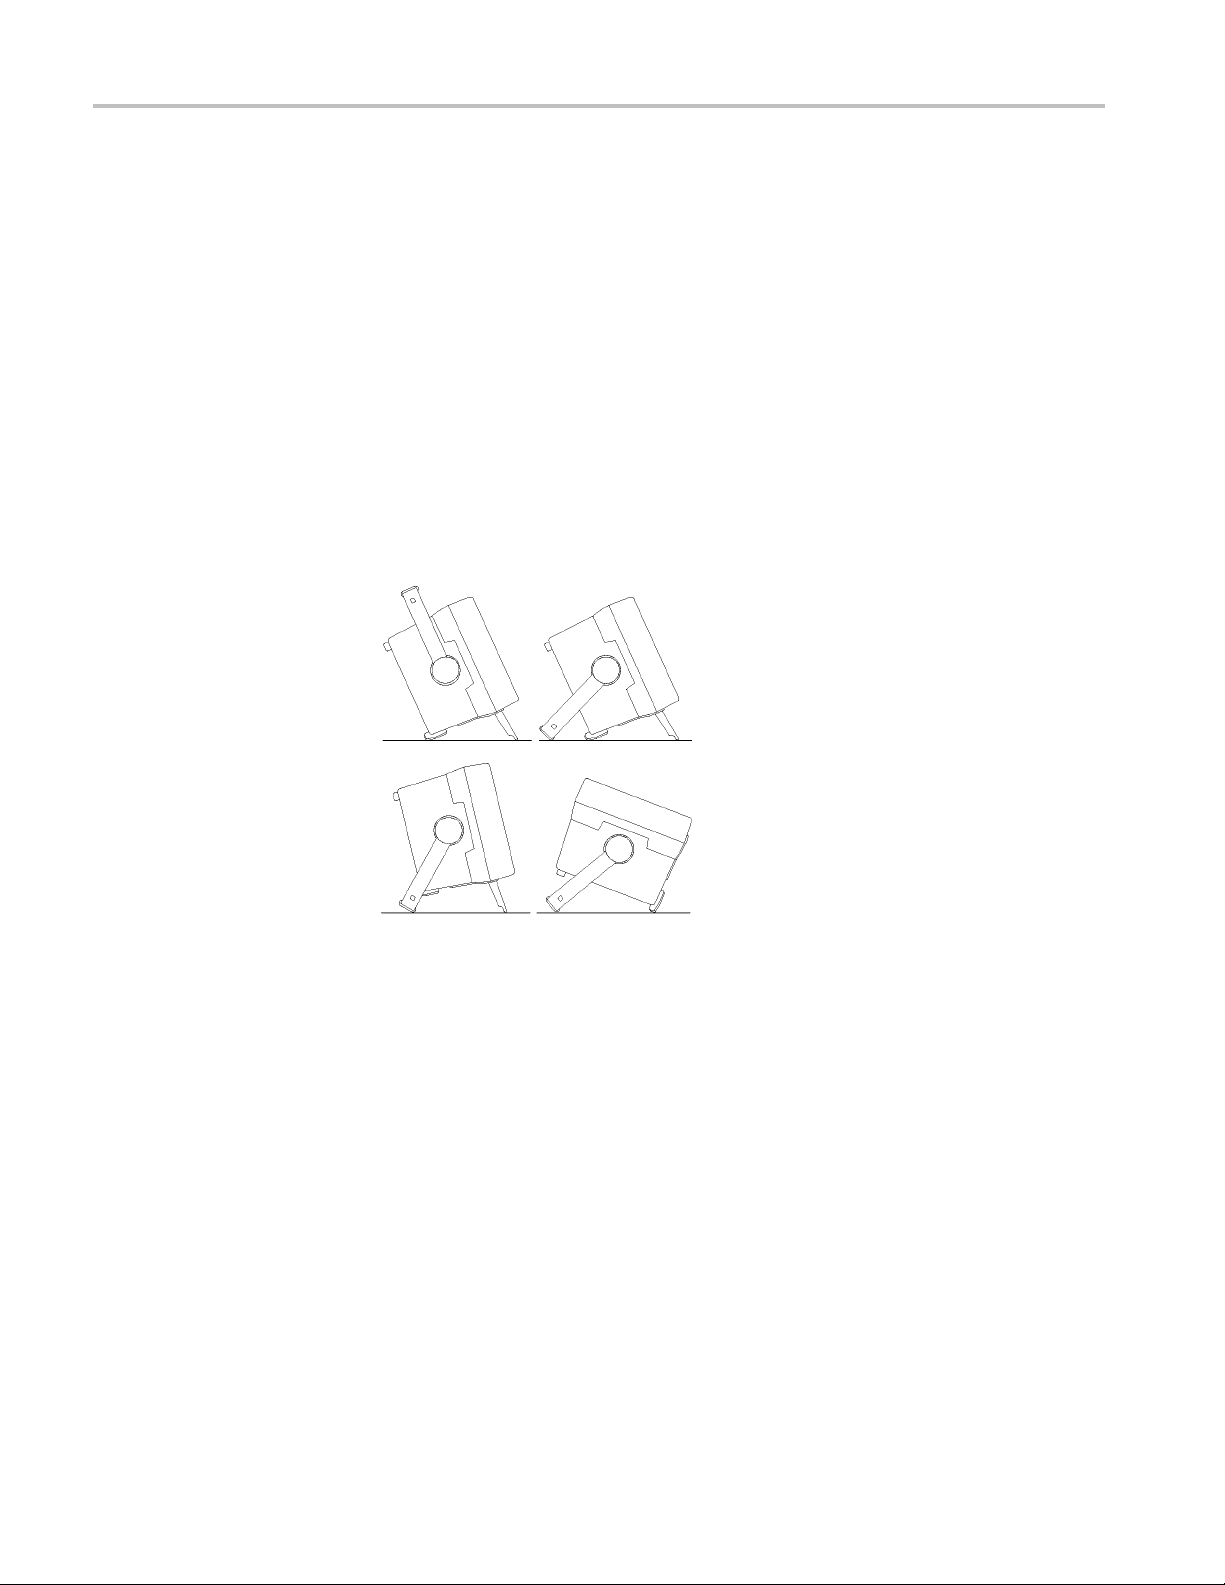
Use the handle and feet to place the oscilloscope in a convenient operating
position.
dules. You can install application modules to add new test and
8 TDS3000C Series Oscilloscope User Manual
Page 29

Getting Started
Connecting Po
Using Battery Power
wer
You can operate the oscilloscope from a mains supply with line voltage between
90 V
is grounded t
and is not operator replaceable.
You can operate the oscilloscope continuously for approximately three hours from
the option
power is connected, and a gauge icon
The oscilloscope turns off automatically when the battery runs low; the screen
may turn white a few minutes before the automatic shutdown.
Refer to the Environmental Considerations for information about proper battery
disposal. (See page ix, Environmental Considerations.)
and 250 VACand frequency between 47 Hz and 440 Hz. The oscilloscope
AC
hrough the power cord grounding connector. The line fuse is internal
al rechargeable TDS3BATC battery pack. A triangle icon in the display
shows when the battery is in use, a power-plug i con shows when line
shows the charge level in the battery.
TDS3000C Series Oscilloscope User Manual 9
Page 30
Getting Started
Operating Safe
Battery Power
ly with
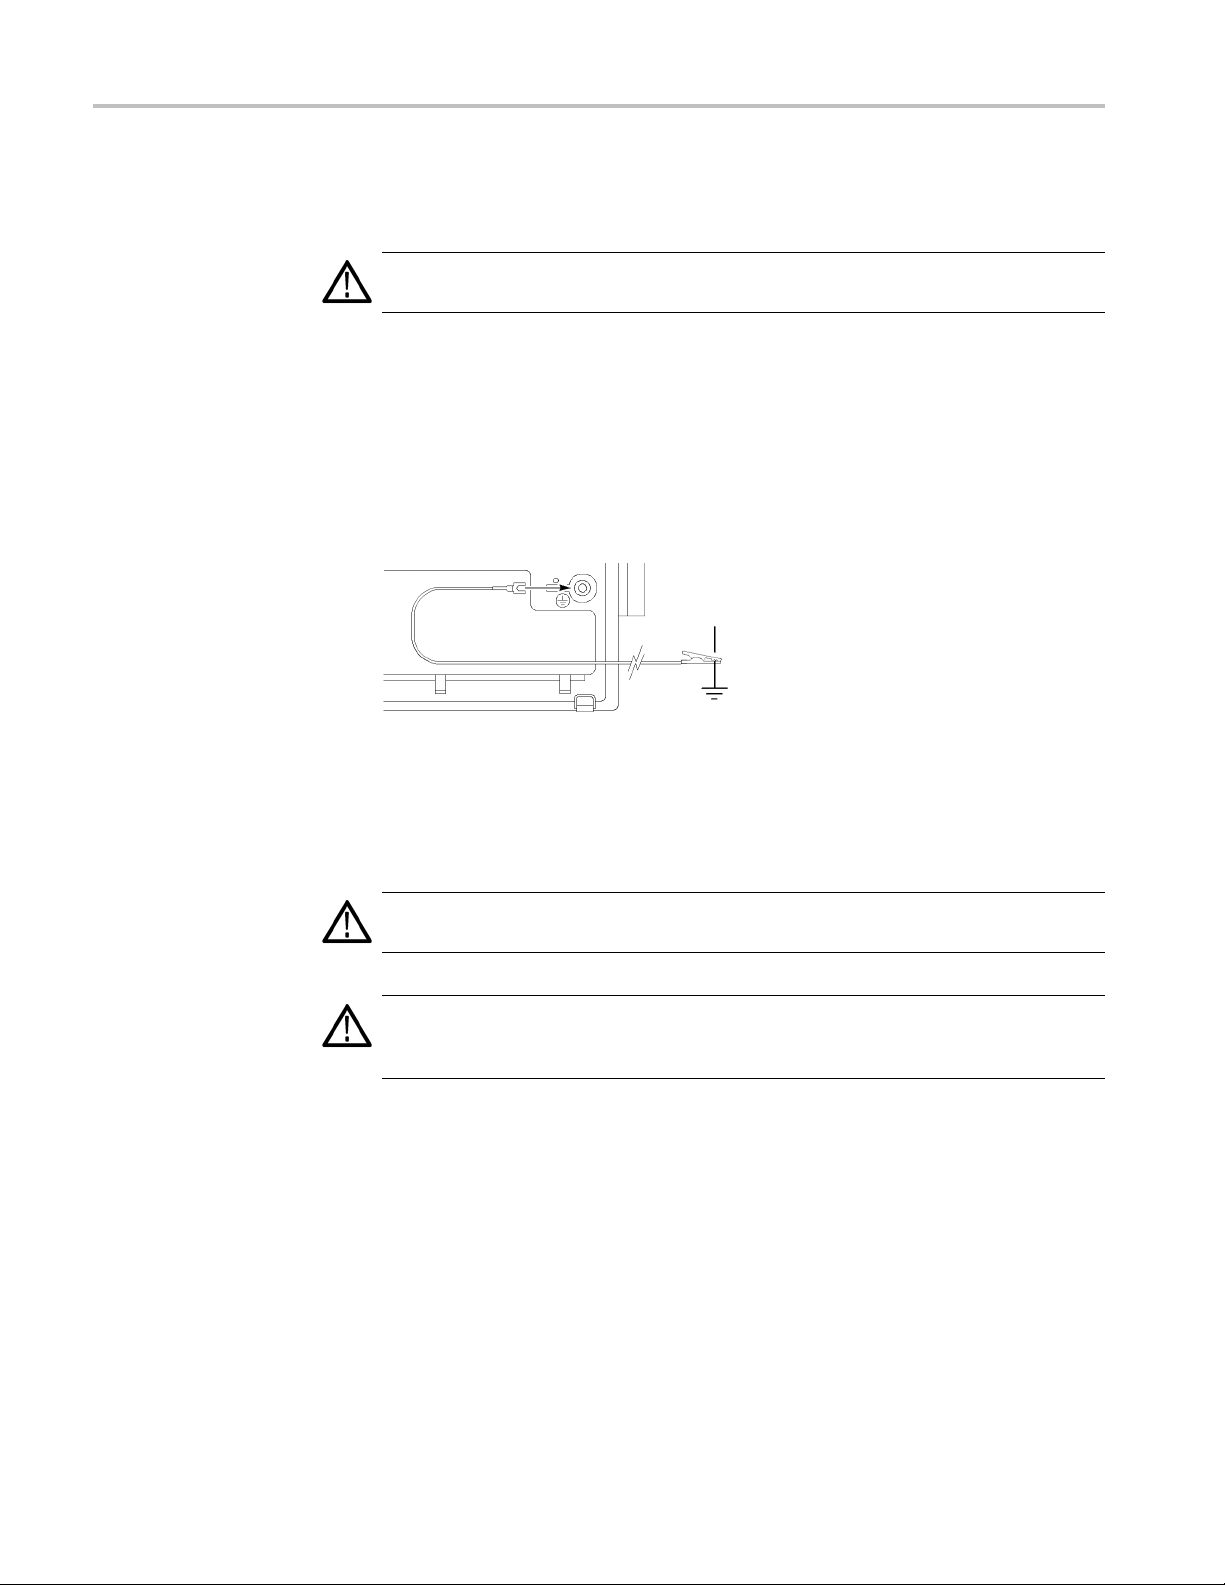
WARNING. To avoid electric shock, connect the rear-panel ground terminal to
earth ground
when operating the oscilloscope from battery power.
For safe operation, the oscilloscope chassis should always remain at earth ground
potential.
Without a connection between the chassis and earth ground, you can
receive a shock from exposed metal on the chassis if you connect an input to
a hazardous voltage (>30 V
,>42Vpk). To protect yourself against possible
RMS
shock, you can attach the Tektronix-supplied grounding wire from the terminal on
the rear panel to earth ground. If you use a different grounding wire, it must be
at least 18 gauge.
If you choose not to attach the grounding wire, you are not protected against
ric shock if you connect the oscilloscope to a hazardous voltage. You can still
elect
use the oscilloscope if you do not connect a signal greater than 30 V
RMS
(42 Vpk)
to the probe tip, the BNC connector center, or the common lead. Ensure that all
probe common leads are connected to the same voltage.
WARNING. Hazardous voltages may exist in unexpected places due to faulty
circuitry in the device under test.
CAUTION. When operating the oscilloscope on battery power do not connect a
grounded device, such as a printer or computer, to the oscilloscope unless the
scilloscope’s grounding wire is connected to the earth ground.
o
10 TDS3000C Series Oscilloscope User Manual
Page 31
Getting Started
Installing the Battery
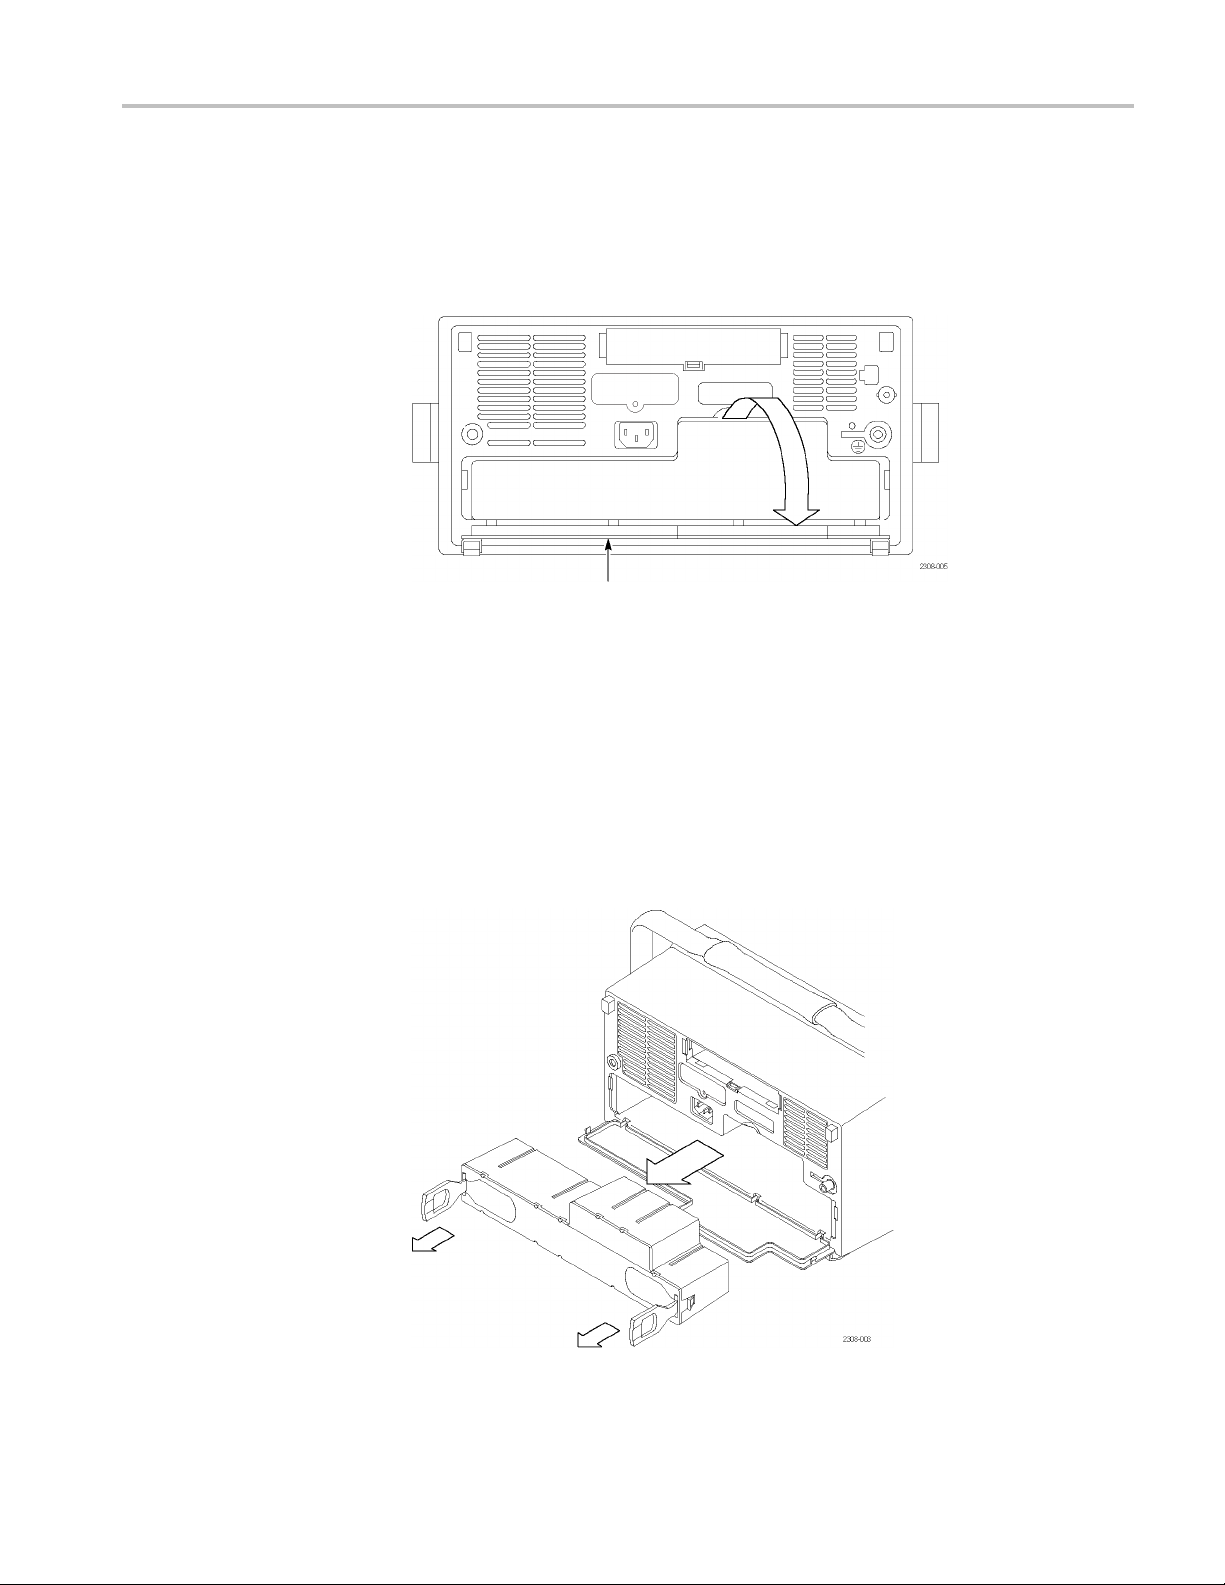
To install the o
ptional battery pack, follow these steps:
1. Open the battery compartment door on the rear panel.
2. Remove the accessory tray.
Battery door (opened)
3. Slide the battery into the compartment and press it in from both sides until
you hear
the latches click.
4. Press on both sides of the battery compartment door to snap it closed.
To remove the battery, follow these steps:
1. Open the battery compartment door.
2. Raise the handles on each side of the battery and use them to pull the battery
out of the oscilloscope.
TDS3000C Series Oscilloscope User Manual 11
Page 32
Getting Started
Maximizing Operating Time
Charging the Battery
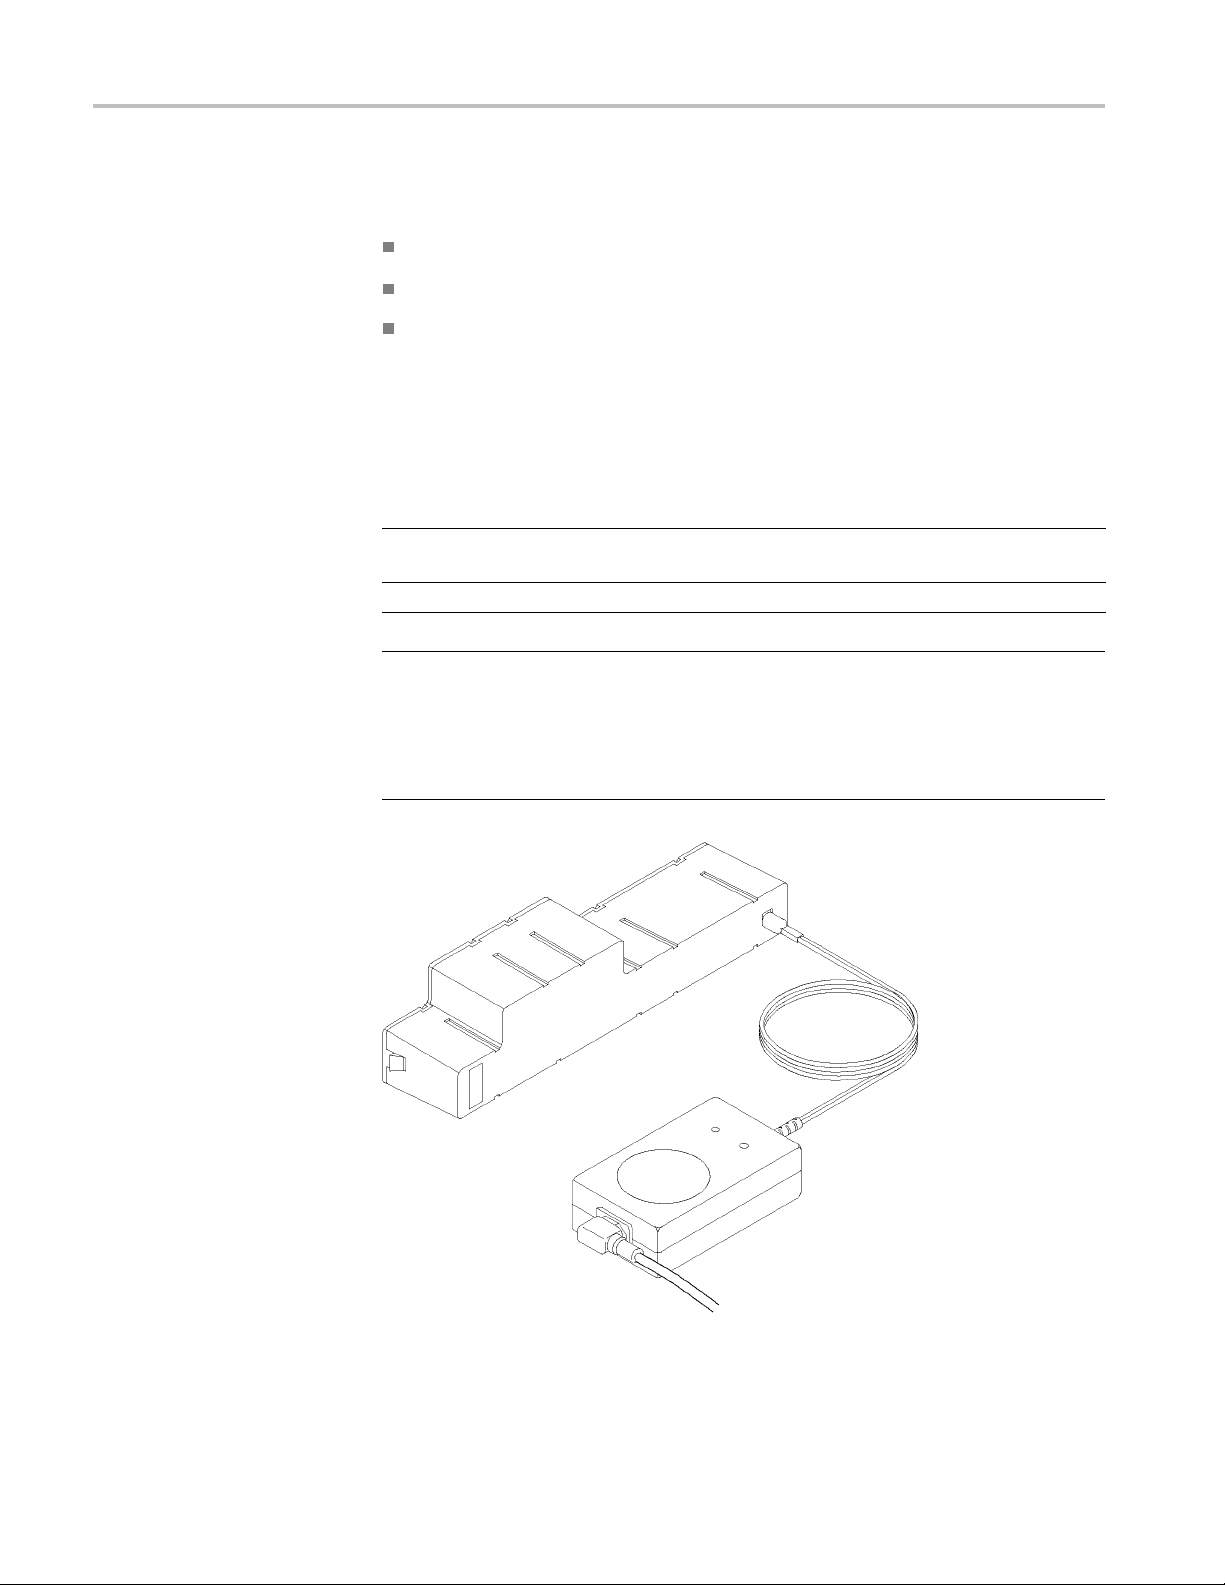
To ma x i m ize the
time that the oscilloscope can operate from a full battery charge,
consider doing these things:
Reduce the dis
play backlight intensity (See page 63.)
Disconnect unused active probes
Only use passive probes
The battery charges automatically when the oscilloscope is connected to line
power. You can also charge the battery with the optional external charger
(TDS3CHG).
Configuration Typical charging time
Battery c
on or off
Battery charging with TDS3CHG external charger
harging in oscilloscope with oscilloscope turned
32 hours
6 hours
NOTE. For optimal performance, charge the battery before using it for the first
time or
after prolonged storage.
Refer to the TDS3BATC Rechargable Battery Pack Instructions (Tektronix part
r 071-0900-04) for information on storage and Battery Maintenance
numbe
Guidelines.
12 TDS3000C Series Oscilloscope User Manual
Page 33
Installing an Application Module
CAUTION. To avoid damage to the oscilloscope or application module, observe
the ESD precau
Optional application modules are available to extend the capability of your
oscillosco
Application modules can go into the two slots with windows in the upper right
corner of the front panel. Two additional slots are directly behind the two you
can see.
Refer to the TDS3000, TDS3000B, and TDS3000C Series Application Module
Installation Manual that came with your application module for instructions on
installing and testing an application module.
NOTE. If you remove an application module, the features provided by the
applic
the features.
pe. You can install up to four application modules at one time.
ation module become unavailable. You can reinstall the module to restore
Getting Started
tions. (See page xii.)
Installing the Communication Module
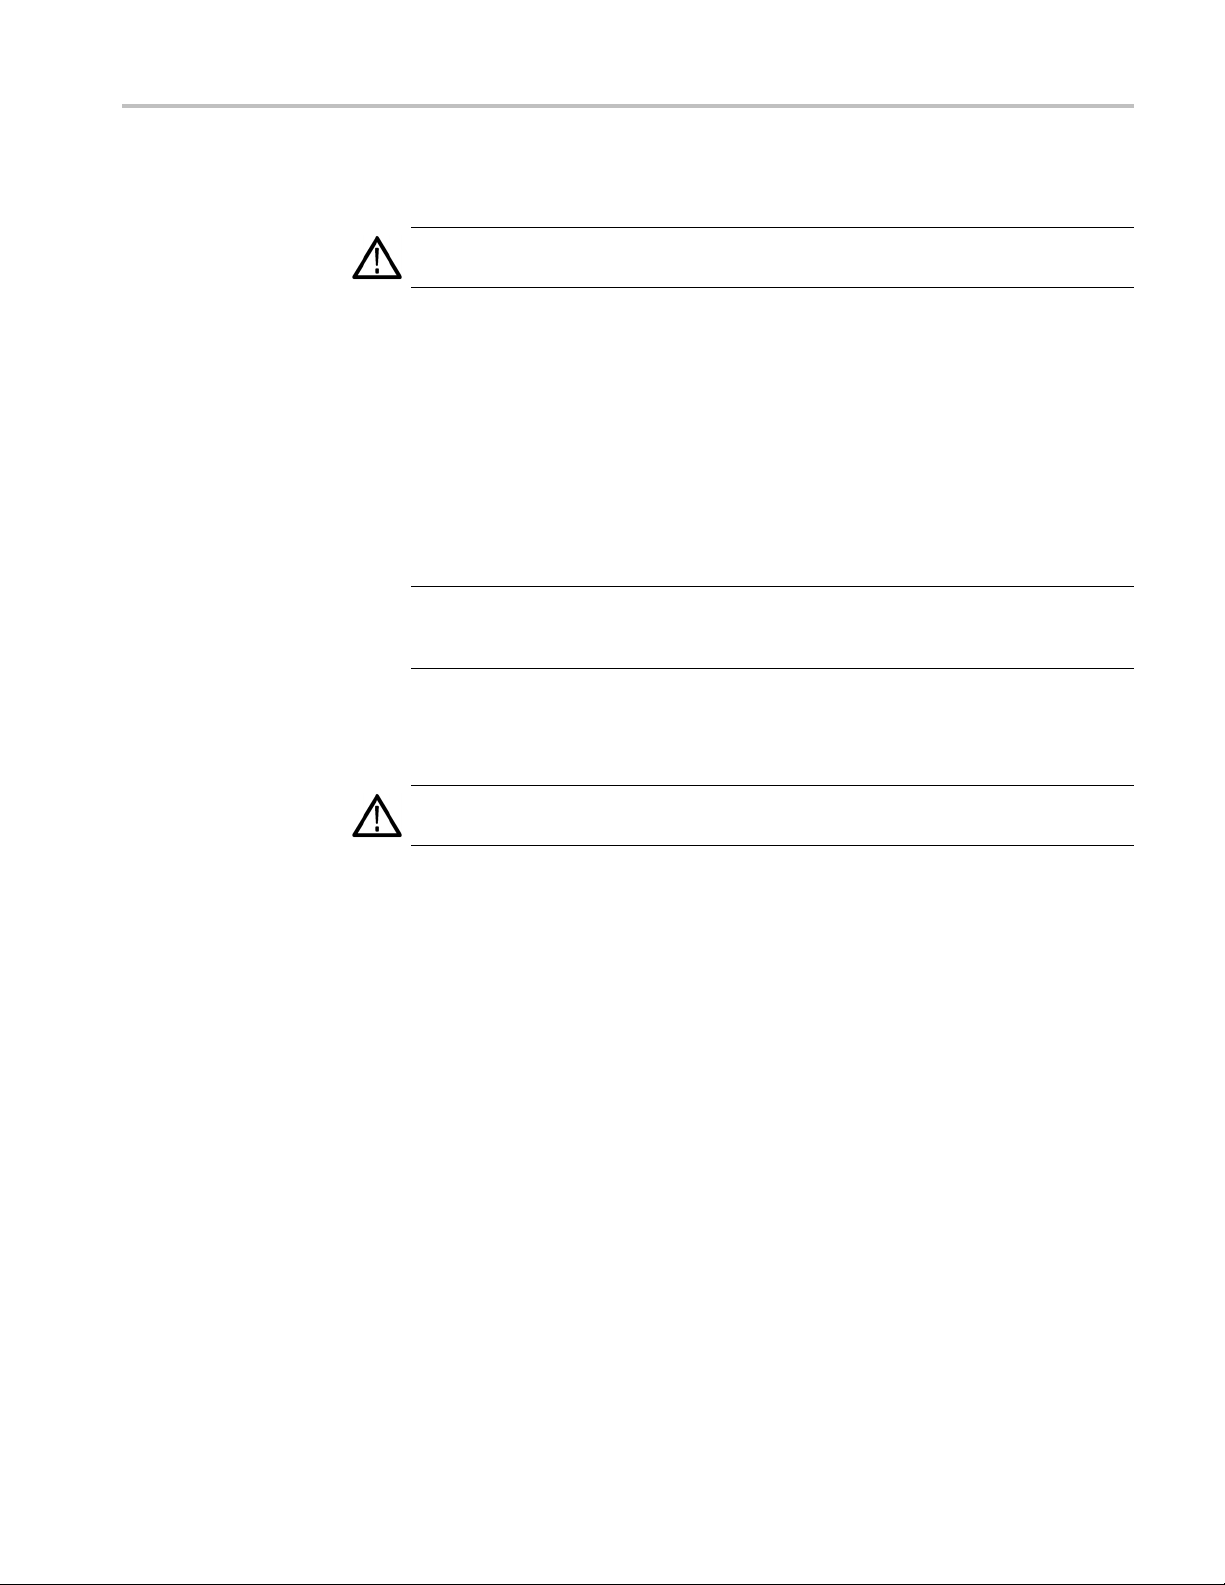
ON. To avoid damage to the oscilloscope or communication module,
CAUTI
observe the ESD precautions. (See page xii.)
nstall the optional communications module, follow these steps:
To i
1. Turn the oscilloscope power off.
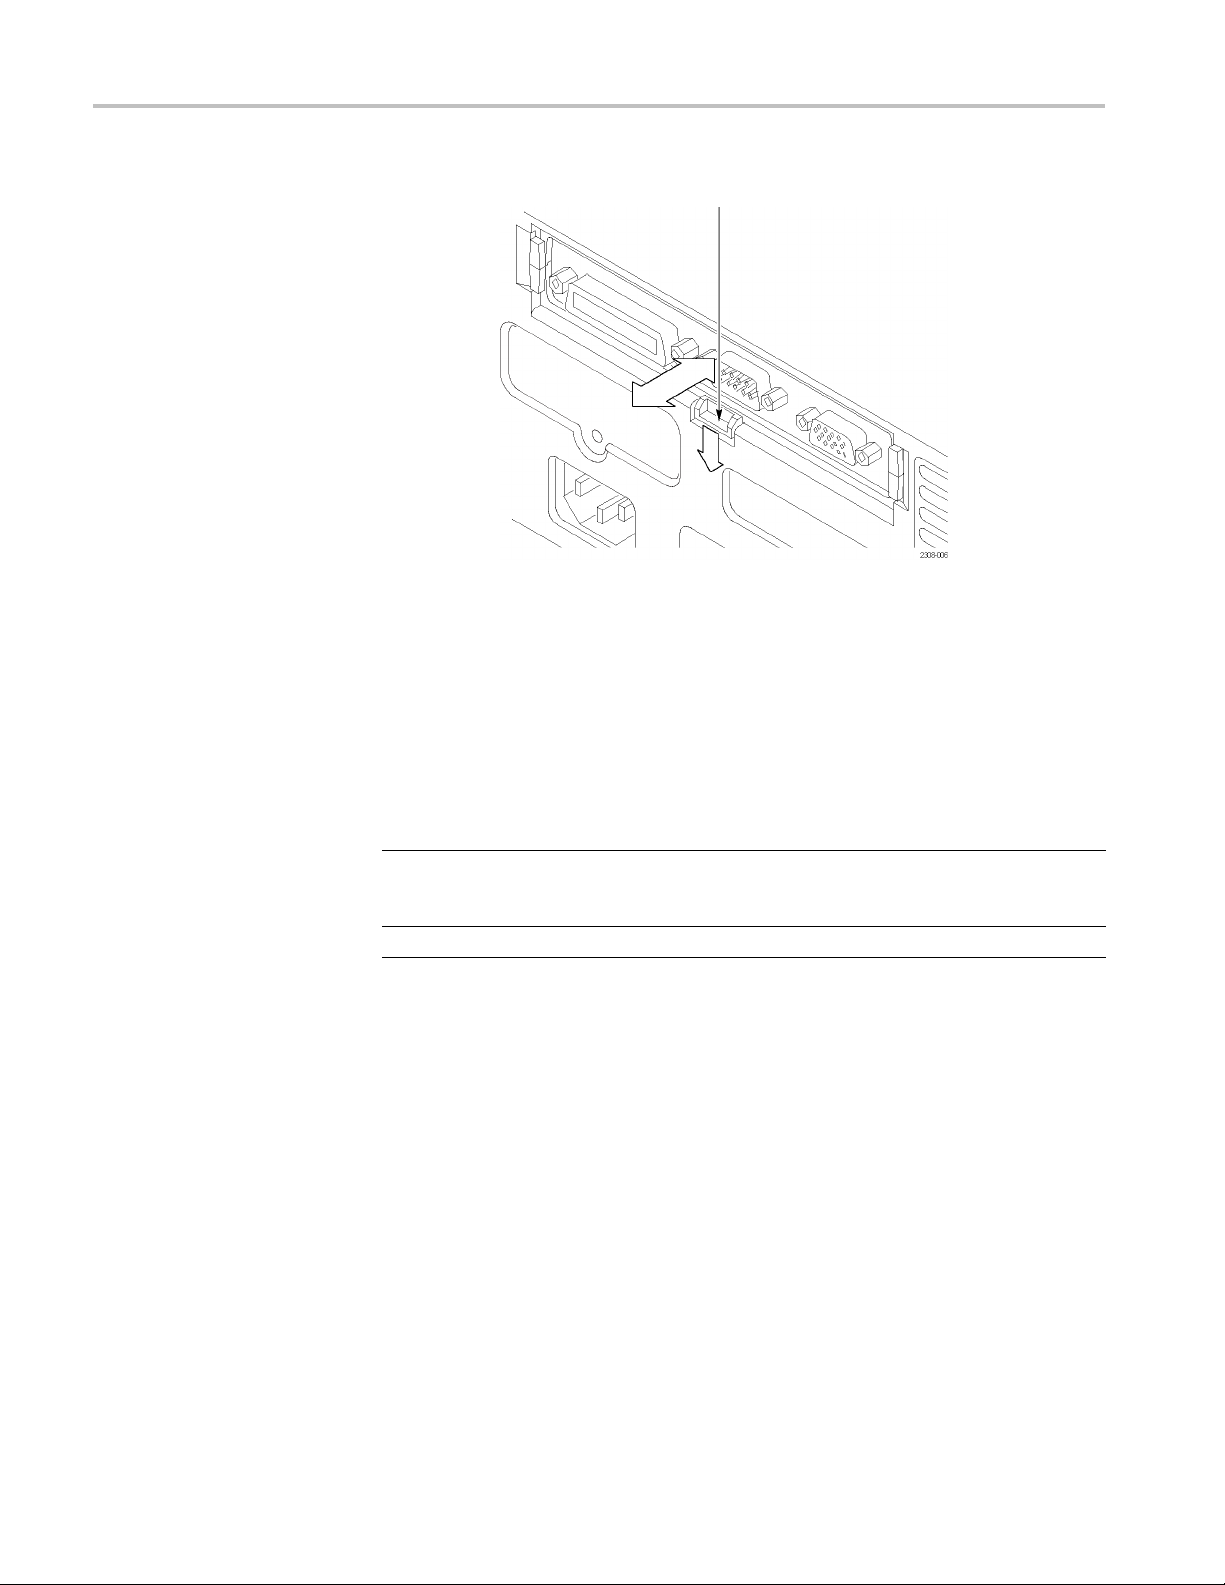
2. Press down on the latching tab to remove the blank cover.
3. Slide the communication module into the compartment until the internal
connectors are seated and the latching tab locks.
4. Turn the power on. The communication module is now ready for your use.
TDS3000C Series Oscilloscope User Manual 13
Page 34
Getting Started
Latching tab
To remove a communication module, follow these steps:
1. Turn the oscilloscope power off.
2. Press down on the latching tab and then use a small screwdriver to alternately
pry out the sides of the communication module.
3. Slide out the communication module and store it in an ESD-shielded bag.
Install the blank cover.
Communication port For more information, see
GPIB
RS-232
VGA Spec
The TDS3000, TDS3000B, and TDS3000C Series Digital
Phosphor Oscilloscopes Programmer Manual, and Hard Copy in
ser manual. (See page 65.)
this u
ifications for the I/O ports in Appendix A in this user manual.
14 TDS3000C Series Oscilloscope User Manual
Page 35
Getting Started
Front-Panel M
Using the Men
enus and Controls
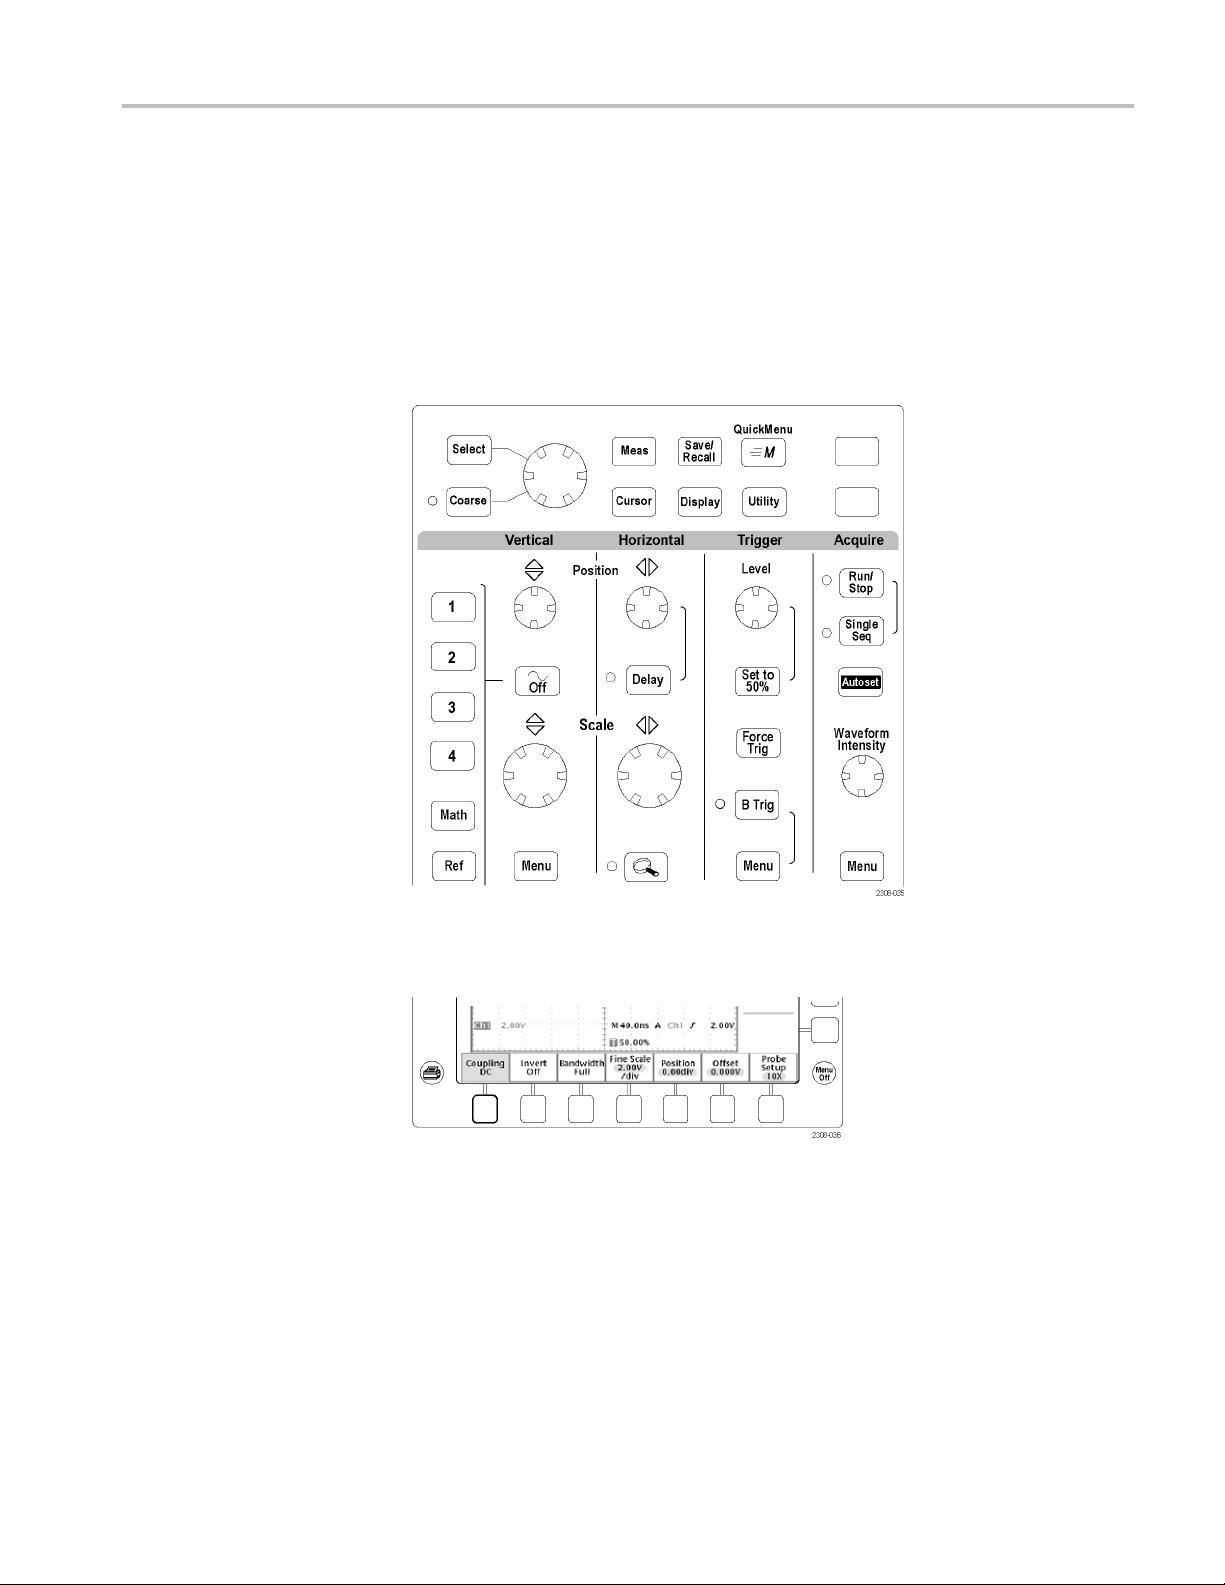
The front panel has buttons and controls for the functions you use most often. The
front panel has menus to access more specialized functions.
uSystem
To use the menu system, follow these steps:
1. Push a front-panel menu button to display the menu you want to use.
2. Push a bottom screen button to select a menu item. If a pop-up menu appears,
continue to push the screen button to select an item from the pop-up menu.
TDS3000C Series Oscilloscope User Manual 15
Page 36
Getting Started
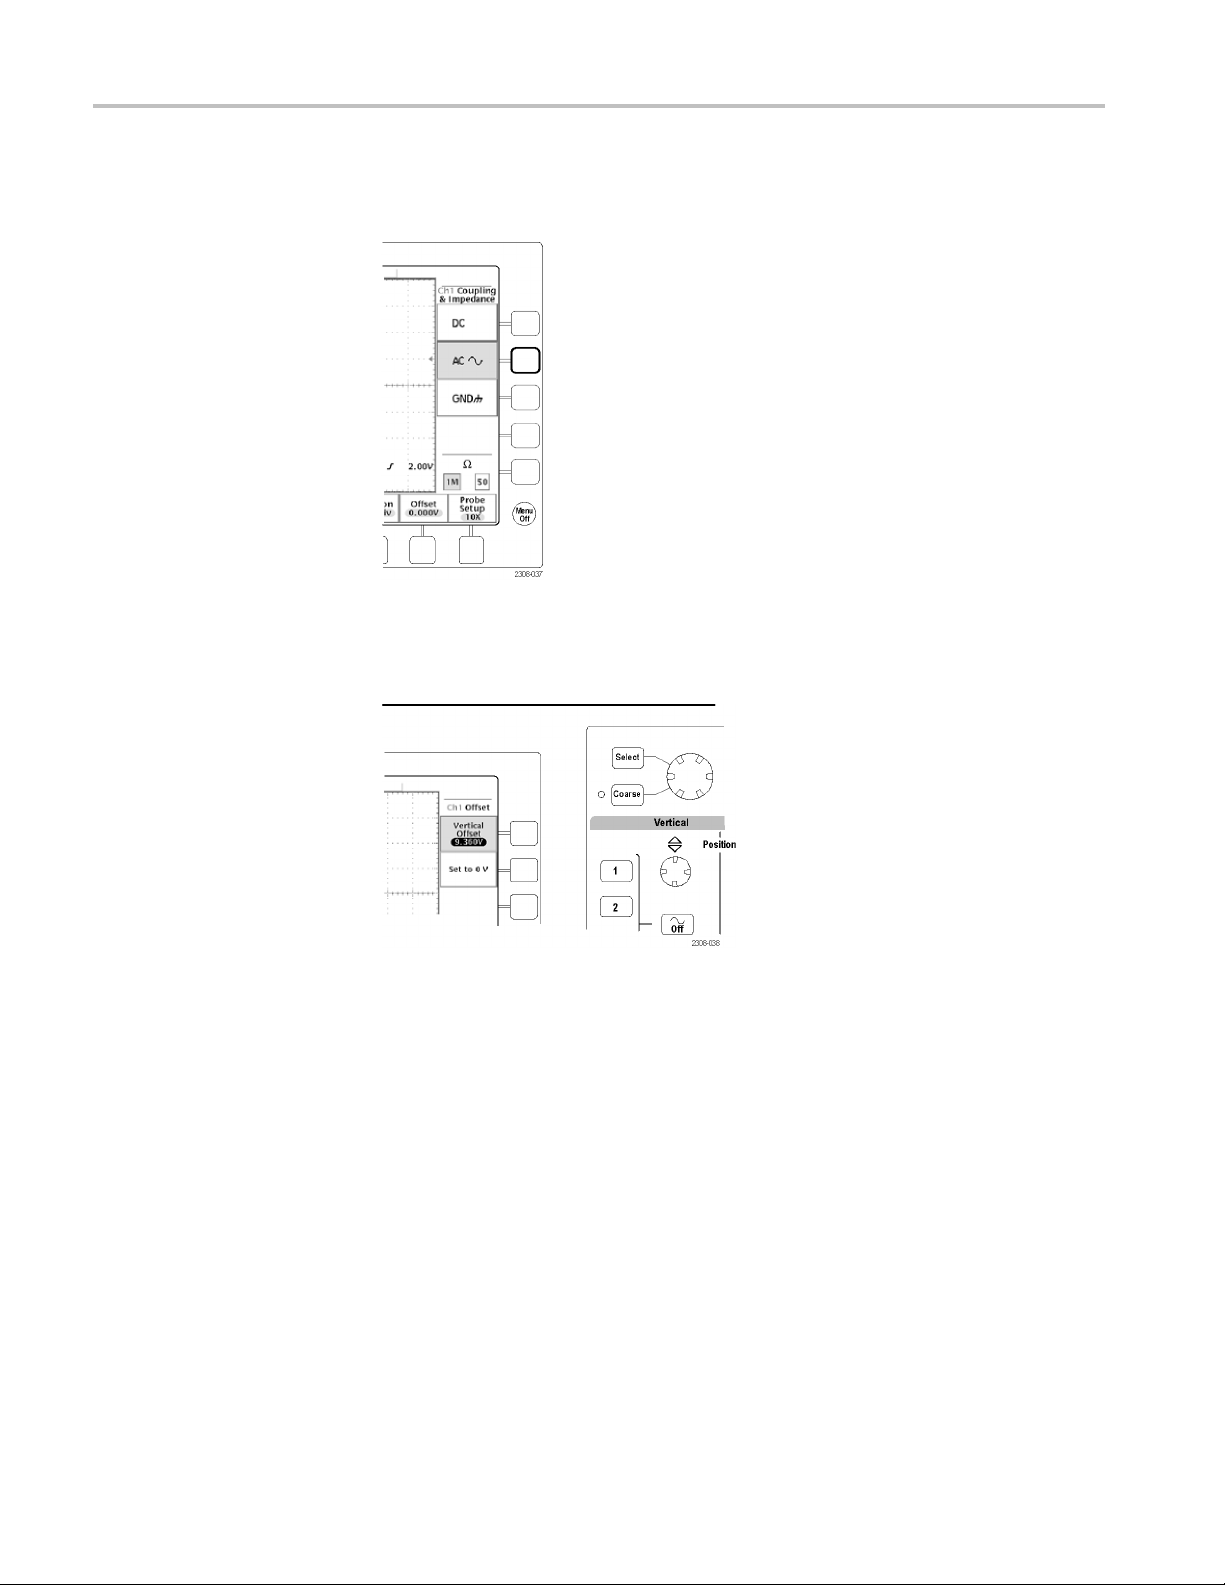
3. Push a side scre
more than one choice, push the side screen button again to make the choice.
4. Certain menu choices require you to s et a numerical value to complete the
setup. Use the general purpose knob to adjust the parameter value. Push the
Coarse button to make larger adjustments.
en button to choose a menu item. If the menu item contains
16 TDS3000C Series Oscilloscope User Manual
Page 37
Getting Started
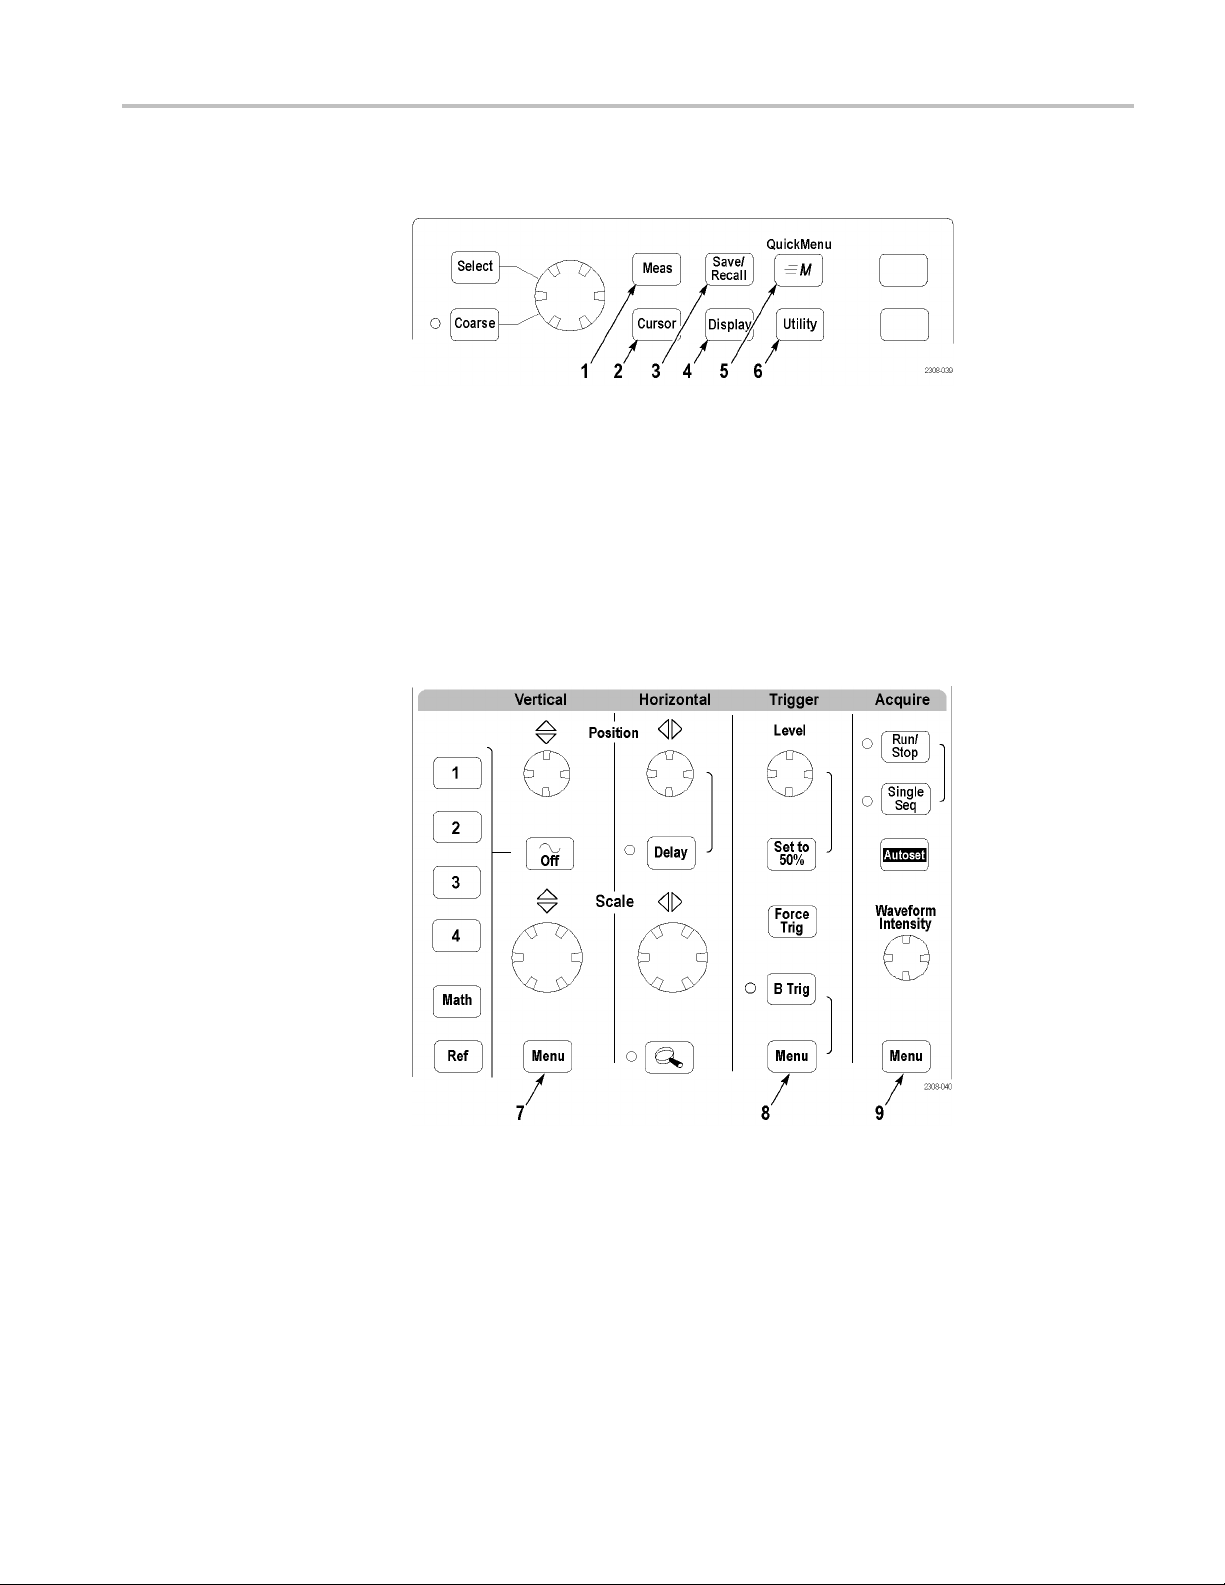
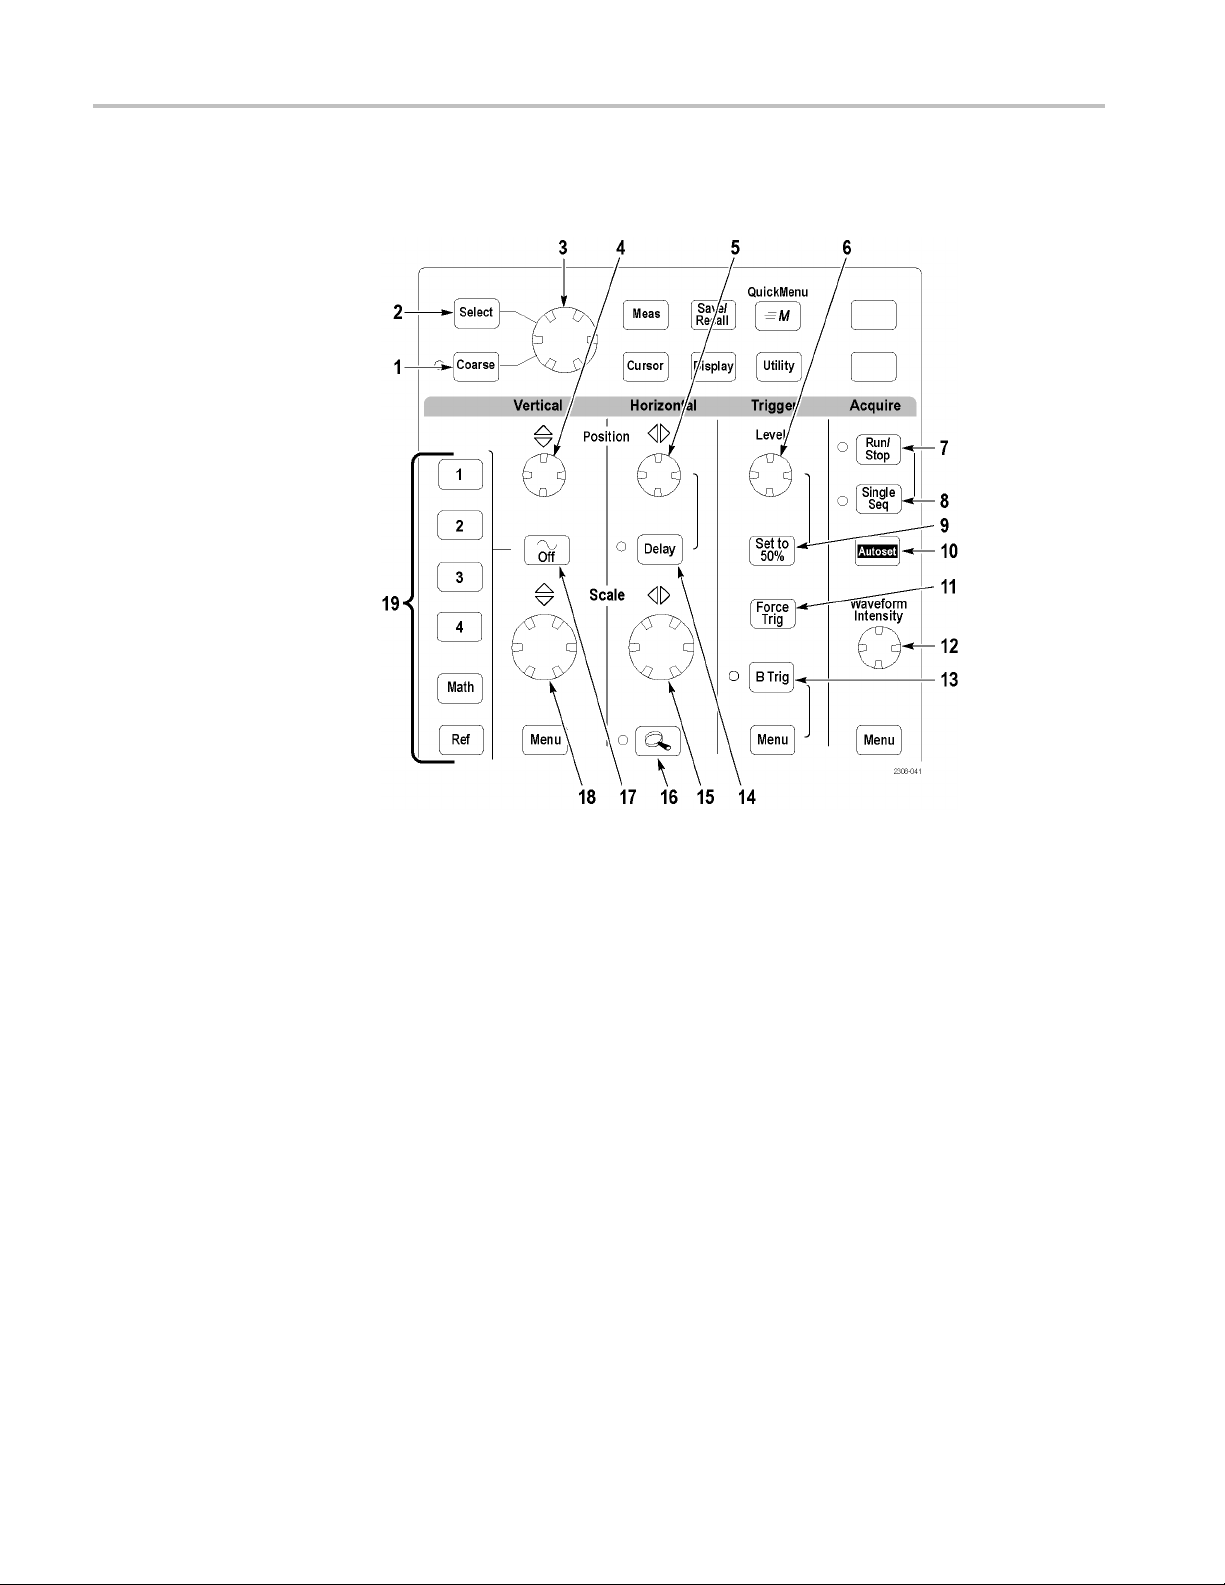
Using the Menu Buttons
You can use the m
1. Meas. P erforms automated measurements of waveforms.
2. Cursor. Activates the cursors.
3. Save/Recall. Saves and recalls setups and waveforms to memory or a USB
flash drive.
4. Display. Changes the appearance of waveforms and the display screen.
5. QuickMenu. Activates QuickMenus such as the built-in Scope QuickMenu.
6. Utility. Activates the system utility functions, such as selecting a language.
enu buttons to perform many functions in the oscilloscope.
rtical Menu. Adjusts the scale, position, and offset of waveforms. Sets
7. Ve
the input parameters.
rigger Menu. Adjusts the trigger functions.
8.T
9. Acquire Menu. Sets the acquisition modes and horizontal resolution, and
esets the delay time.
r
TDS3000C Series Oscilloscope User Manual 17
Page 38
Getting Started
Using the Dedicated
Controls
These dedicate
without the use of menus.
d buttons and controls generally control waveforms and cursors
1. Coarse. Causes the general purpose knob and position knobs to make
adjustments more quickly.
2. Select. Toggles between the two cursors to select the active cursor.
3. General purpose knob. Moves the cursors. Sets numerical parameter values
for some menu items. Push the Coarse button to make adjustments quickly.
4. Vertical Position. Adjusts the vertical position of the selected waveform. Push
the Coarse button to m ake adjustments more quickly.
5. Horizontal Position. Adjusts the trigger point location relative to the acquired
waveforms. Push the Coarse button to make adjustments quickly.
6. Trigger Level. Adjusts the trigger level.
7. Run/Stop. Stops and restarts acquisition.
8. Single Seq. Sets acquisition, display, and trigger parameters for a single-shot
(single-sequence) acquisition.
9. Set To 50%. Sets the trigger level to the midpoint of the waveform.
10. Autoset. Automatically sets the vertical, horizontal, and trigger controls for
a usable display.
18 TDS3000C Series Oscilloscope User Manual
Page 39
Getting Started
11. Force Trig. For
12. Waveform Intensity. Controls waveform intensity.
13. B Trig. Activates the B trigger. Changes the Trigger menu to set the B-trigger
parameters.
14. Delay. Enables delayed acquisition relative to the trigger event. Use
horizontal Position to set the amount of delay.
15. Horizontal Scale. Adjusts the horizontal scale factor.
16. Horizontal Zoom. Splits the screen and magnifies the current acquisition
horizontally.
17. Waveform Off. Removes selected waveform from the display.
18. Vertical Scale. Adjusts selected waveform vertical scale factor.
19. 1, 2, (3, 4,) Math. Displays a waveform and chooses the selected waveform.
Ref shows the reference waveform menu.
ces an immediate trigger event.
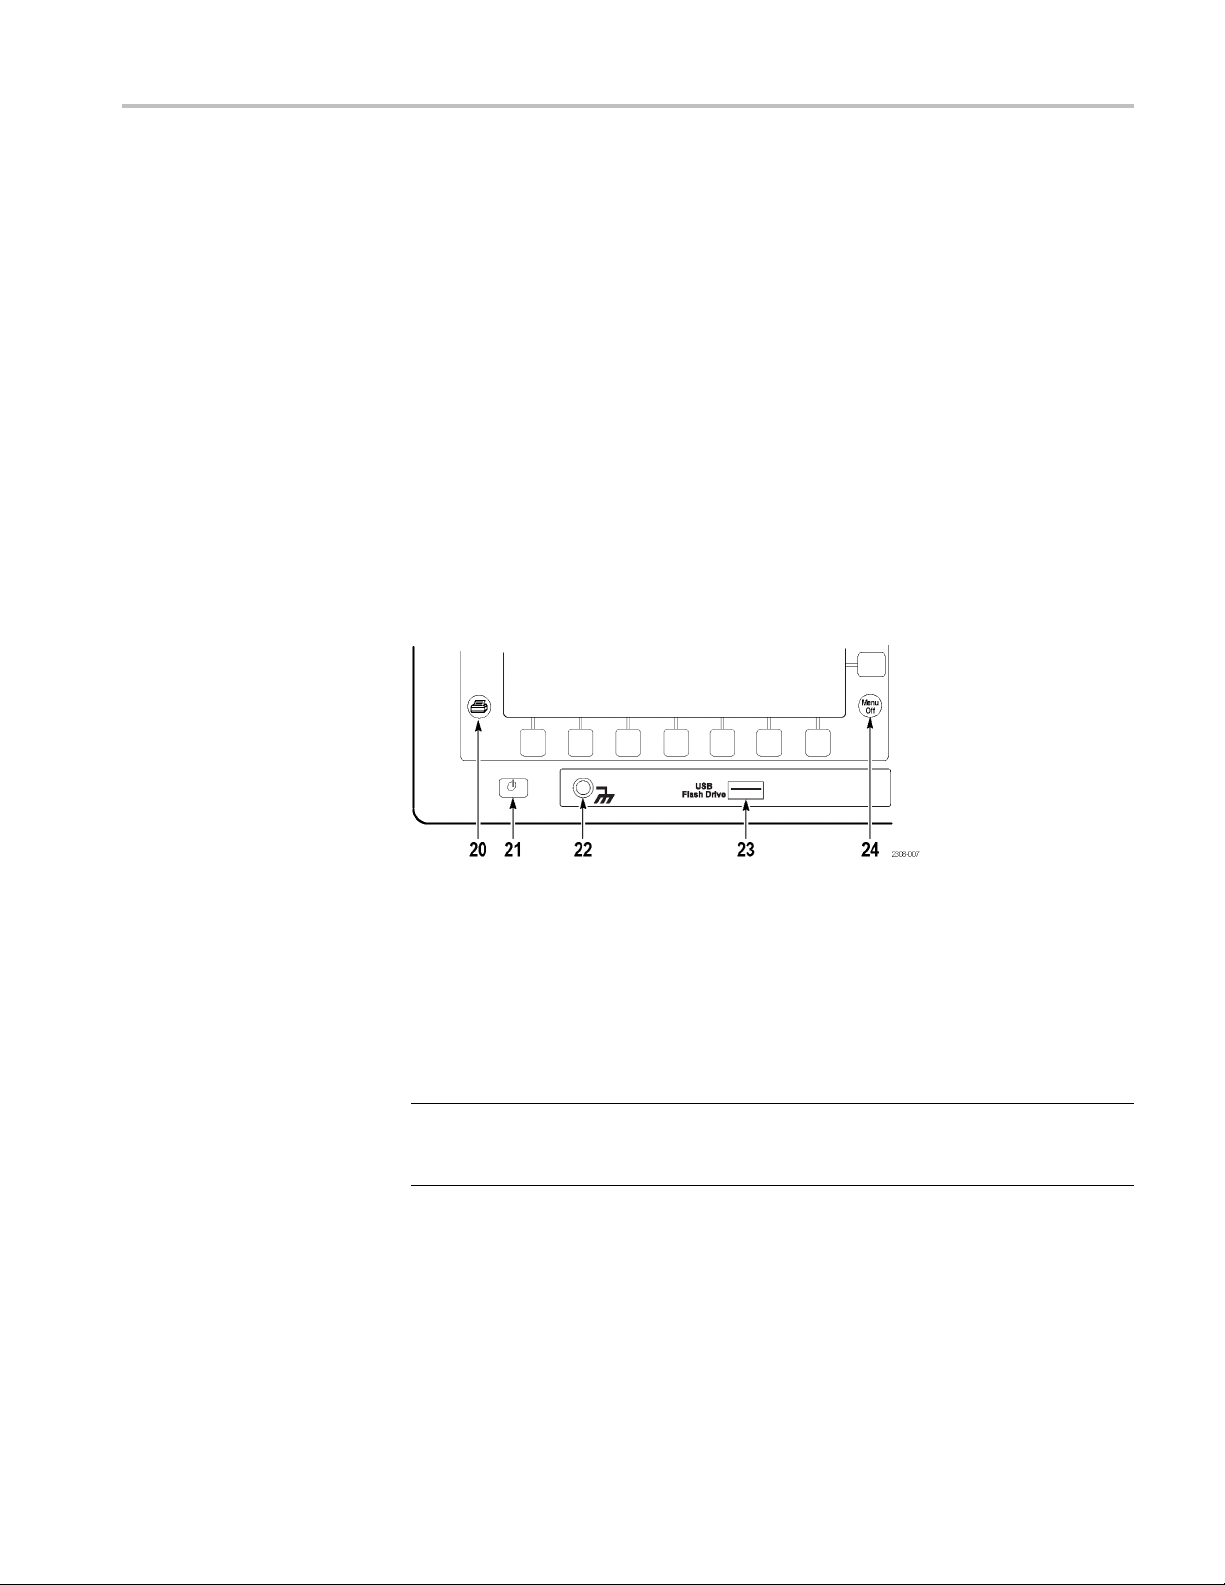
20. Hard copy. Initiates a hard copy using the port selected in the Utility menu.
21. Power switch. Turns power to on or standby. Power-up time varies from
about 15 seconds to 45 seconds, depending on the oscilloscope internal
calibration p rocess.
22. Wrist-strap ground. Connect a wrist strap when working with ESD-sensitive
circuits. This connector is not a safety ground.
OTE. The wrist-strap ground terminal is only a ground when the oscilloscope is
N
connected to earth ground. When operating from a battery, connect the grounding
wire to earth ground to ensure the terminal is at ground.
23. USB Flash Drive port.
24. Menu Off. Clears menu from the display.
TDS3000C Series Oscilloscope User Manual 19
Page 40
Getting Started
Identifying Items in the
Display
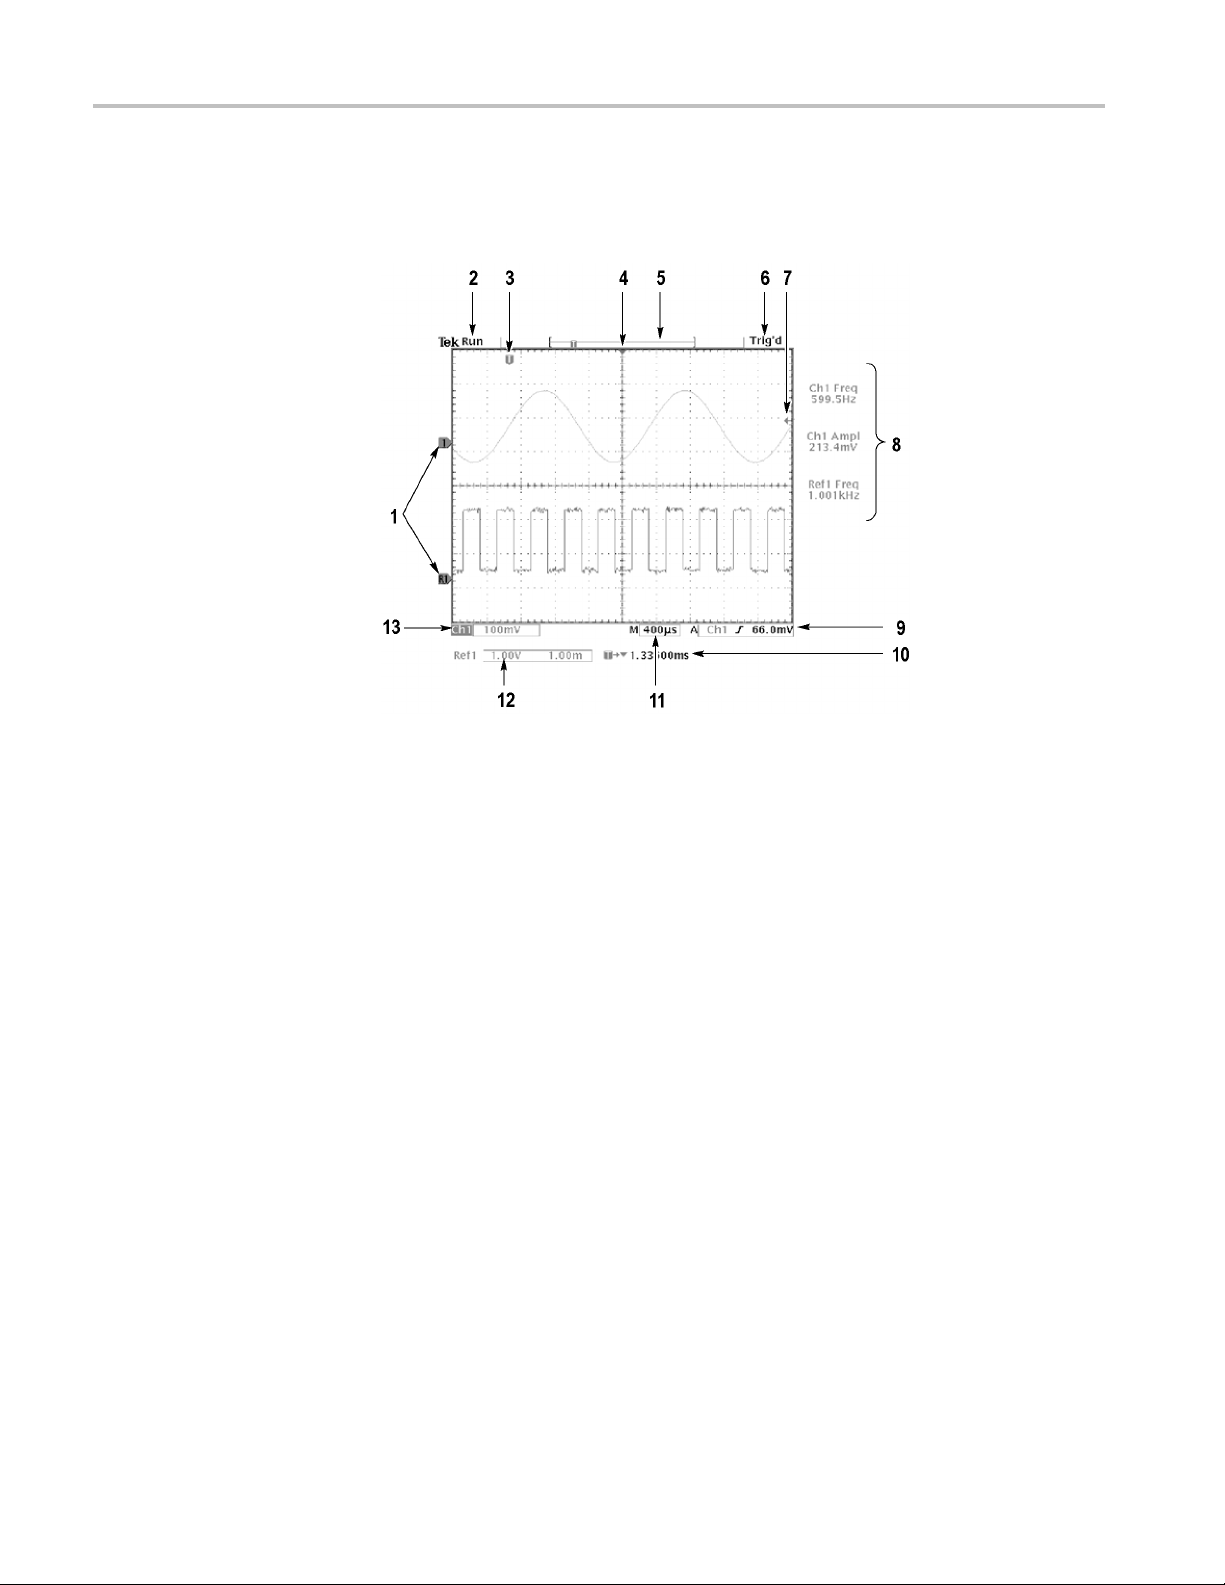
The following i
given time. Some readouts move outside the graticule area when menus are
turned off.
1. Waveform baseline icons show the zero-volt level of the waveforms (ignoring
the effect of offset). The icon colors correspond to the waveform colors.
tems may appear in the display; not all items are visible at any
2. Acquisition readout shows when acquisition is running, stopped, or when
acquisition preview is in effect.
3. Trigger position icon shows the trigger location in the waveforms.
4. Expansion point icon shows the point that the horizontal scale expands and
compresses around.
5. Waveform record icon shows the trigger location relative to the waveform
record. The line color corresponds to the selected waveform color.
6. Trigger status readout show trigger status.
7. Trigger level icon shows the trigger level on the waveform. The icon color
corresponds to the trigger source channel color.
8. Cursor and measurement readouts show results and message s.
rigger readouts show the trigger sources, slopes, and levels, and position.
9.T
10. Readout shows the delay setting or the trigger location within the record.
11. Horizontal readout shows the main or zoom time/division.
20 TDS3000C Series Oscilloscope User Manual
Page 41
Getting Started
Using QuickMenus
12. Auxiliary wave
of the math or reference waveforms.
13. Channel reado
bandwidth limit, and invert status.
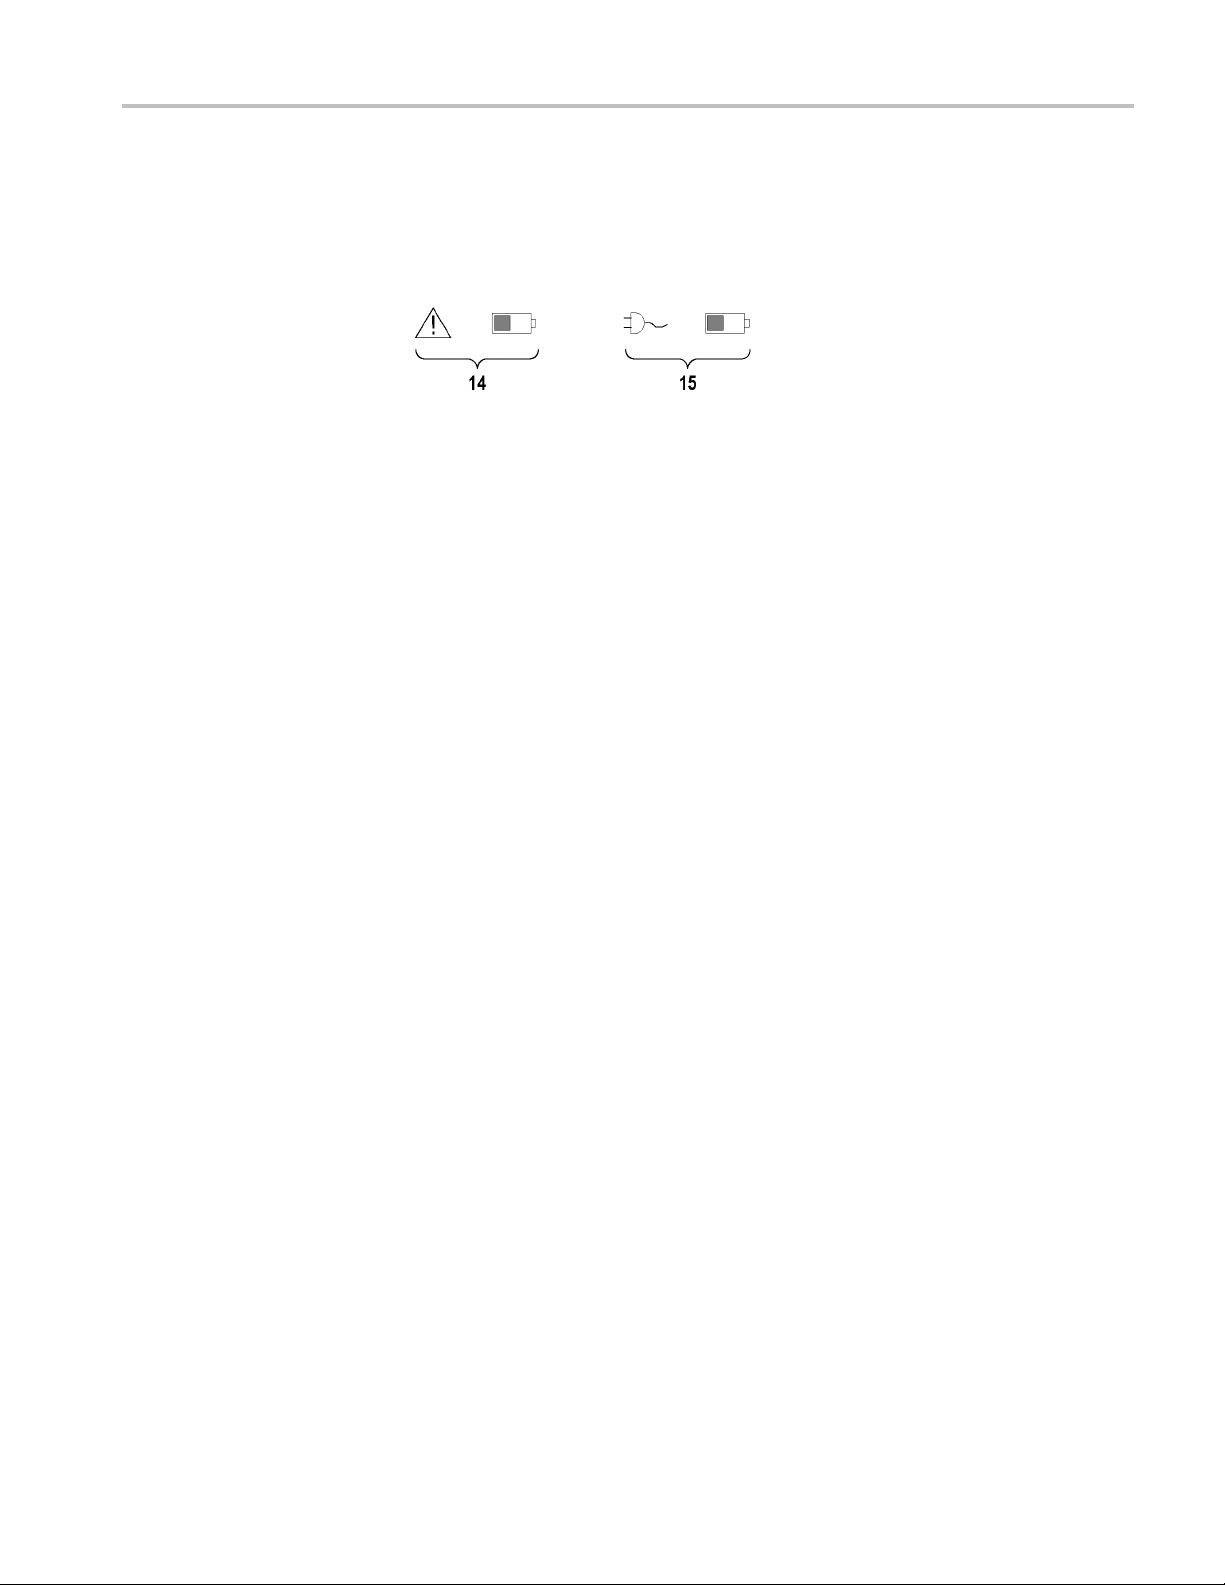
14. Triangle icon with the battery icon indicates a battery is installed and battery
power is in use. The battery icon shows the approximate charge level of the
battery. (See page 10, Operating Safely with Battery Power.)
15. Power-plug icon with the battery icon indicates a battery is installed but
line power is in use. The battery may be charging. The battery icon shows
the approximate charge level.
The QuickMenu feature simplifies the use of the oscilloscope. When you push the
QuickMenu button, a set of frequently used menu functions show on the display.
Then, push the screen buttons around the display to operate the QuickMenu.
The Reference chapter has general instructions on how to operate QuickMenus.
age 84.)
(See p
form readouts show the vertical and horizontal scale factors
uts show the channel scale factor, coupling, input resistance,
Using the Scope QuickMenu. Scope is one type of QuickMenu that you can use
to control the basic oscilloscope functions. You can perform many tasks without
using the regular menu system. If you need to use a function that is not contained
in the Scope QuickMenu, push the button you would normally push to access that
nction. For example, if you want to add an automatic measurement, push the
fu
Meas button to set up the measurement. Then, push the QuickMenu button to
return to the Scope QuickMenu with the measurement also in the display.
TDS3000C Series Oscilloscope User Manual 21
Page 42

Getting Started
1. Edge Trigger controls. Push these screen buttons to set trigger parameters
for edge
trigger.
2. Trigger controls if either B trigger or video trigger is selected. Logic and
Pulse tr
3. Cursor control. Push this screen button to turn on cursors and select the cursor
type. P
active cursor. Use the general purpose knob to move the active cursor.
4. Acqui
5. Channel vertical controls. Push these screen buttons to set vertical controls
for t
buttons to select the channel you want to control.
6. Ve r
selected.
7. Me
than one is available.
NOTE. Items in the Scope QuickMenu not mentioned above are also contained
in the regular display. (See page 20.)
Other QuickMenus. Some optional application packages include a custom
QuickMenu display. Those QuickMenus contain specific features that are
important for the a pplication.
igger controls are not available through the QuickMenu.
ush the Select button to toggle between the two cursors to select the
sition controls. Push these screen buttons to set acquisition parameters.
he selected channel. Use the channel 1, 2, 3, 4, and the Math and Ref
tical controls if either the math waveform or a reference waveform is
nu. Push this screen button to select a specific QuickMenu display if more
22 TDS3000C Series Oscilloscope User Manual
Page 43
Getting Started
Front-Panel C
onnectors
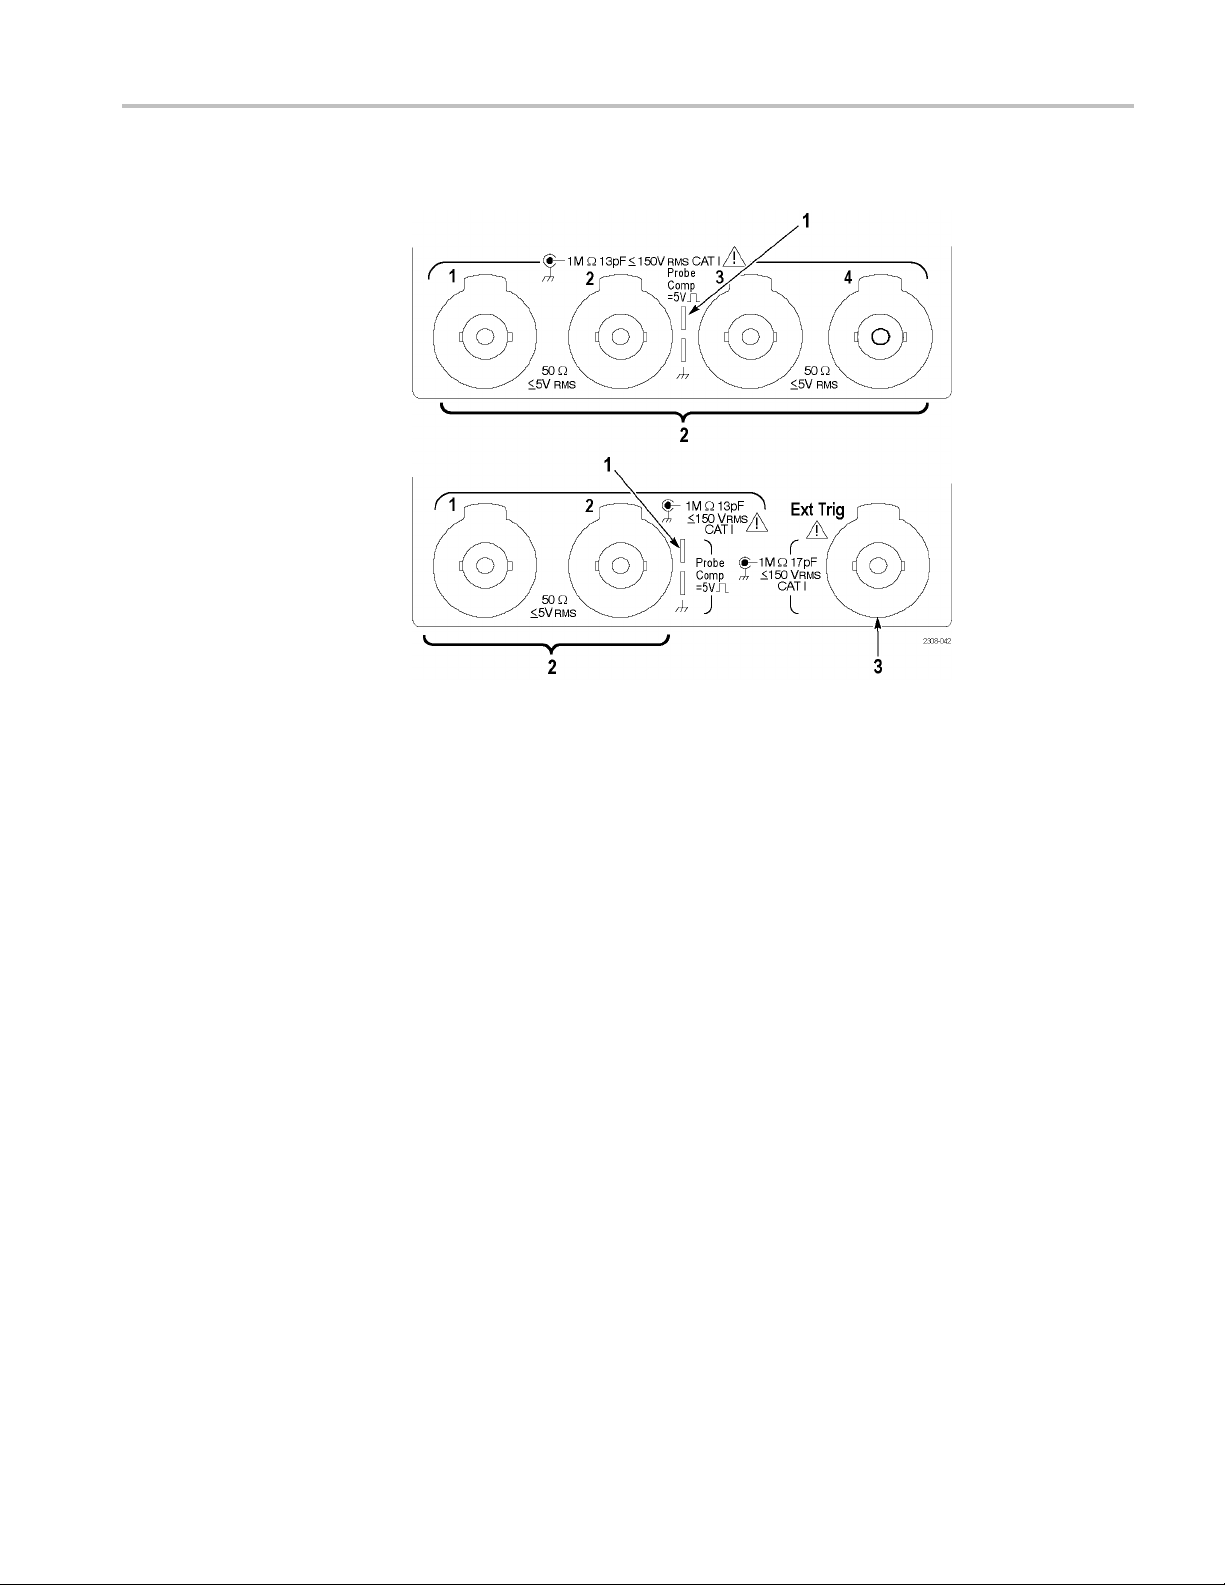
1. Probe Comp. Square wave signal source to compensate probes.
2. 1, 2, (3
, 4). Channel inputs with TekProbe interface.
3. Ext Trig. External trigger input with TekProbe interface (two-channel models
only).
External trigger input specifications are in Appendix A.
TDS3000C Series Oscilloscope User Manual 23
Page 44

Getting Started
Rear-Panel Co
nnectors
1. Power input. Attach to an AC power line with integral safety ground.
2. Communication Module compartment. Install the optional communication
module.
3. Ethernet port. Connects the oscilloscope to a 10BaseT local area network.
4. Ext Trig. External trigger input with TekProbe interface (four-channel models
only). External trigger input specifications are in Appendix A.
5. Ground terminal. Connect to earth ground when using battery power. (See
page 10, Operating Safely with Battery Power.)
6. CAL switch. For use by authorized service personnel only.
Communication Module Connectors
24 TDS3000C Series Oscilloscope User Manual
Page 45

Getting Started
1. GPIB port. Conn
2. RS-232 port. Connect to a controller or terminal for remote programmability
or printing.
3. VGA port. Connect to a VGA monitor to display the screen image.
ect to a controller for remote programmability.
TDS3000C Series Oscilloscope User Manual 25
Page 46

Getting Started
26 TDS3000C Series Oscilloscope User Manual
Page 47

Application Examples
This chapter presents six common oscilloscope applications:
Taking simple measurements
Analyzing si
Taking FFT measurements
Triggering on a video signal
Capturing a single-shot signal
Saving data to a USB flash drive
Each application example highlights different features of the oscilloscope and
gives you ideas about using the oscilloscope to solve test problems.
Taking Simple Measurements
You need to see a s ignal in a circuit, but you do not know the signal amplitude
or frequency. Connect the oscilloscope to quickly display the signal and then
measure its frequency and peak-to-peak amplitude.
gnal detail
ing Autoset
Us
TDS3000C Series Oscilloscope User Manual 27
To quickly display a signal, follow these steps:
1. Connect the channel 1 probe to the signal.
2. Push the Autoset button.
The oscilloscope sets vertical, horizontal, and trigger controls automatically. You
can manually adjust any of these controls if you need to optimize the display
of the waveform.
Page 48
Application Examples
Selecting Automatic
Measurements
When you are usi
controls for each channel and uses the lowest-numbered active channel to set the
horizontal and trigger controls.
The oscillos
measure signal frequency and peak-to-peak amplitude, follow these steps:
1. Push the Mea
2. Push the channel 1 button and then push the Select Measurement for Ch1
screen button.
3. Select the Frequency measurement.
4. Push the more screen button and select the Pk-Pk measurement.
5. Push the
The measurements show on the screen and update as the signal changes.
ng more than one channel, the autoset function sets the vertical
cope can take automatic measurements of most displayed signals. To
s button to see the Select Measurement menu.
Menu Off button.
Measuring Two Signals
28 TDS3000C Series Oscilloscope User Manual
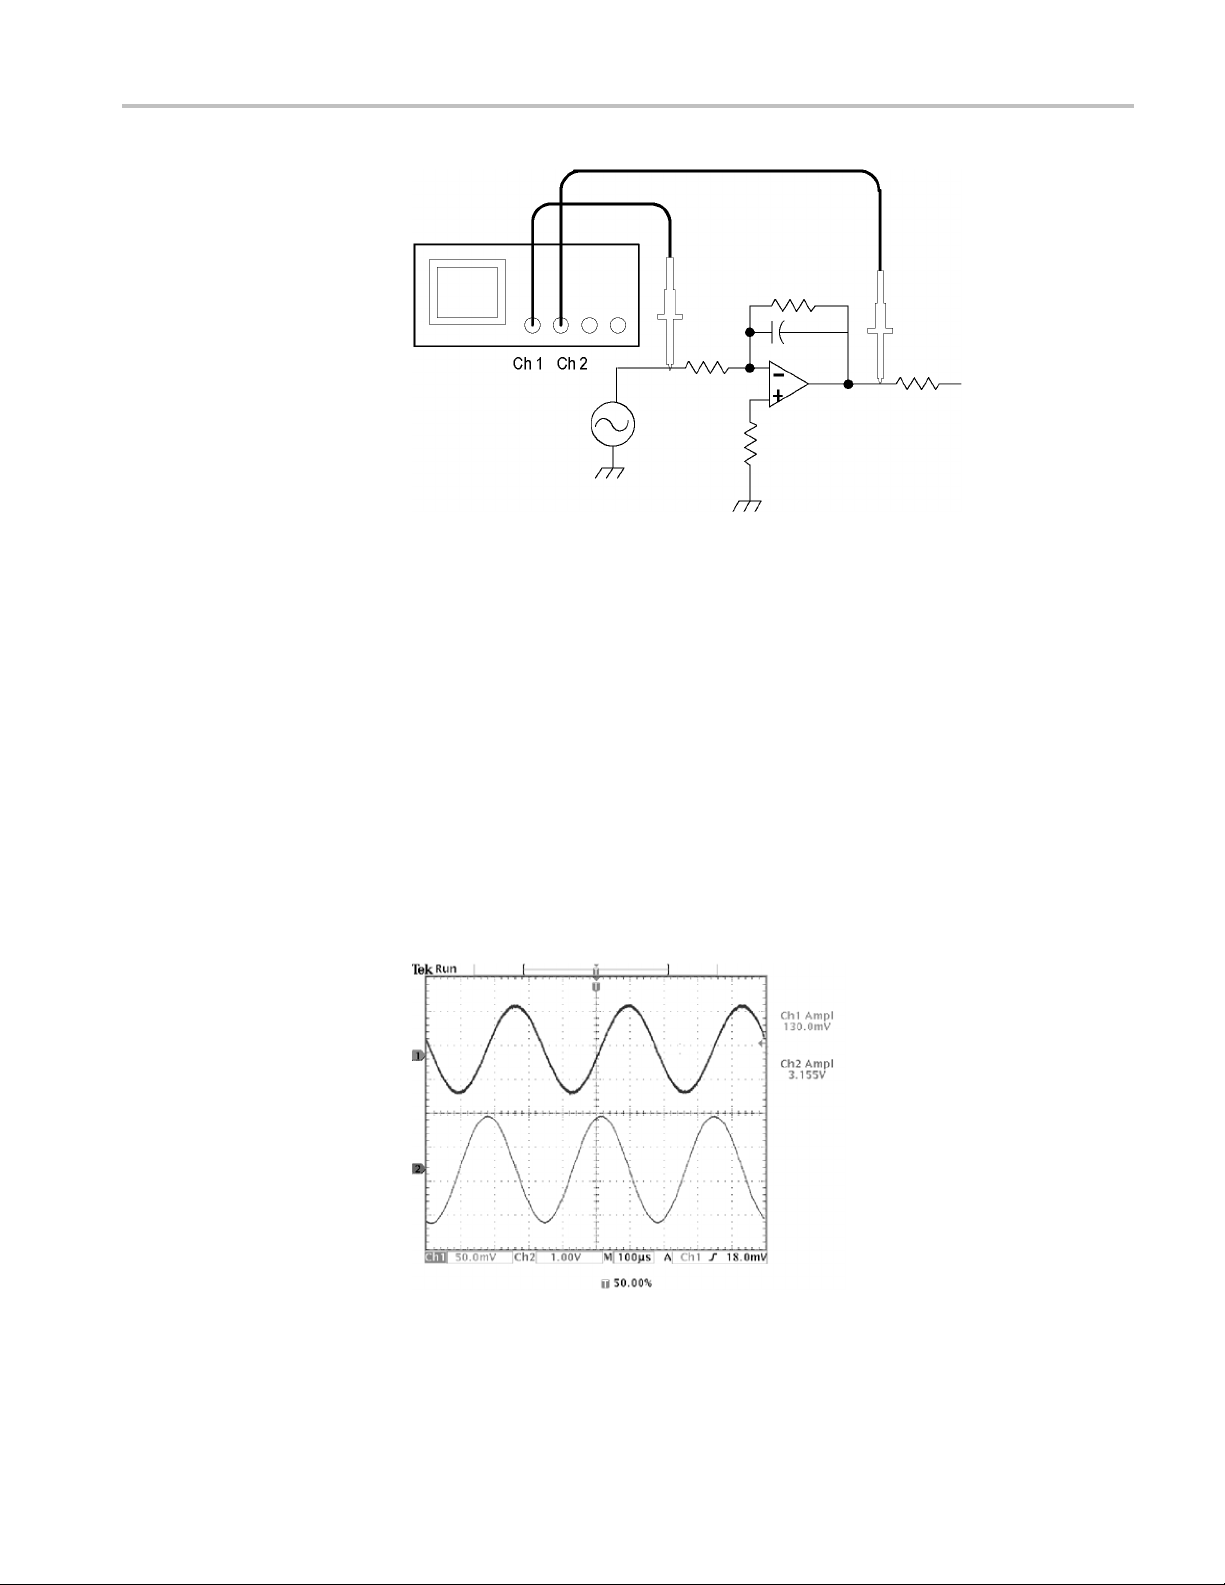
You are testing a piece of equipment and need to measure the gain of its audio
amplifier. You have an audio generator that can inject a test signal at the amplifier
input. Connect two oscilloscope channels to the amplifier input and output as
shown. Measure both signal levels and use these measurements to calculate the
gain.
Page 49
Application Examples
To di s p l ay
1. Push the channel 1 and 2 buttons to activate both channels.
2. Push the Autoset button.
To select measurements for the two channels, follow these steps:
1. Push the Meas button to see the Select Measurement menu.
2. Push the channel 1 button and then push the Select Measurement for Ch1
screen button.
3. Select the Amplitude measurement.
4. Push t
screen button.
5. Sele
the signals connected to channels 1 and 2, follow these steps:
he channel 2 button and then push the Select Measurement for Ch2
ct the Amplitude measurement.
TDS3000C Series Oscilloscope User Manual 29
Page 50
Application Examples
Customizing Your
Measurements
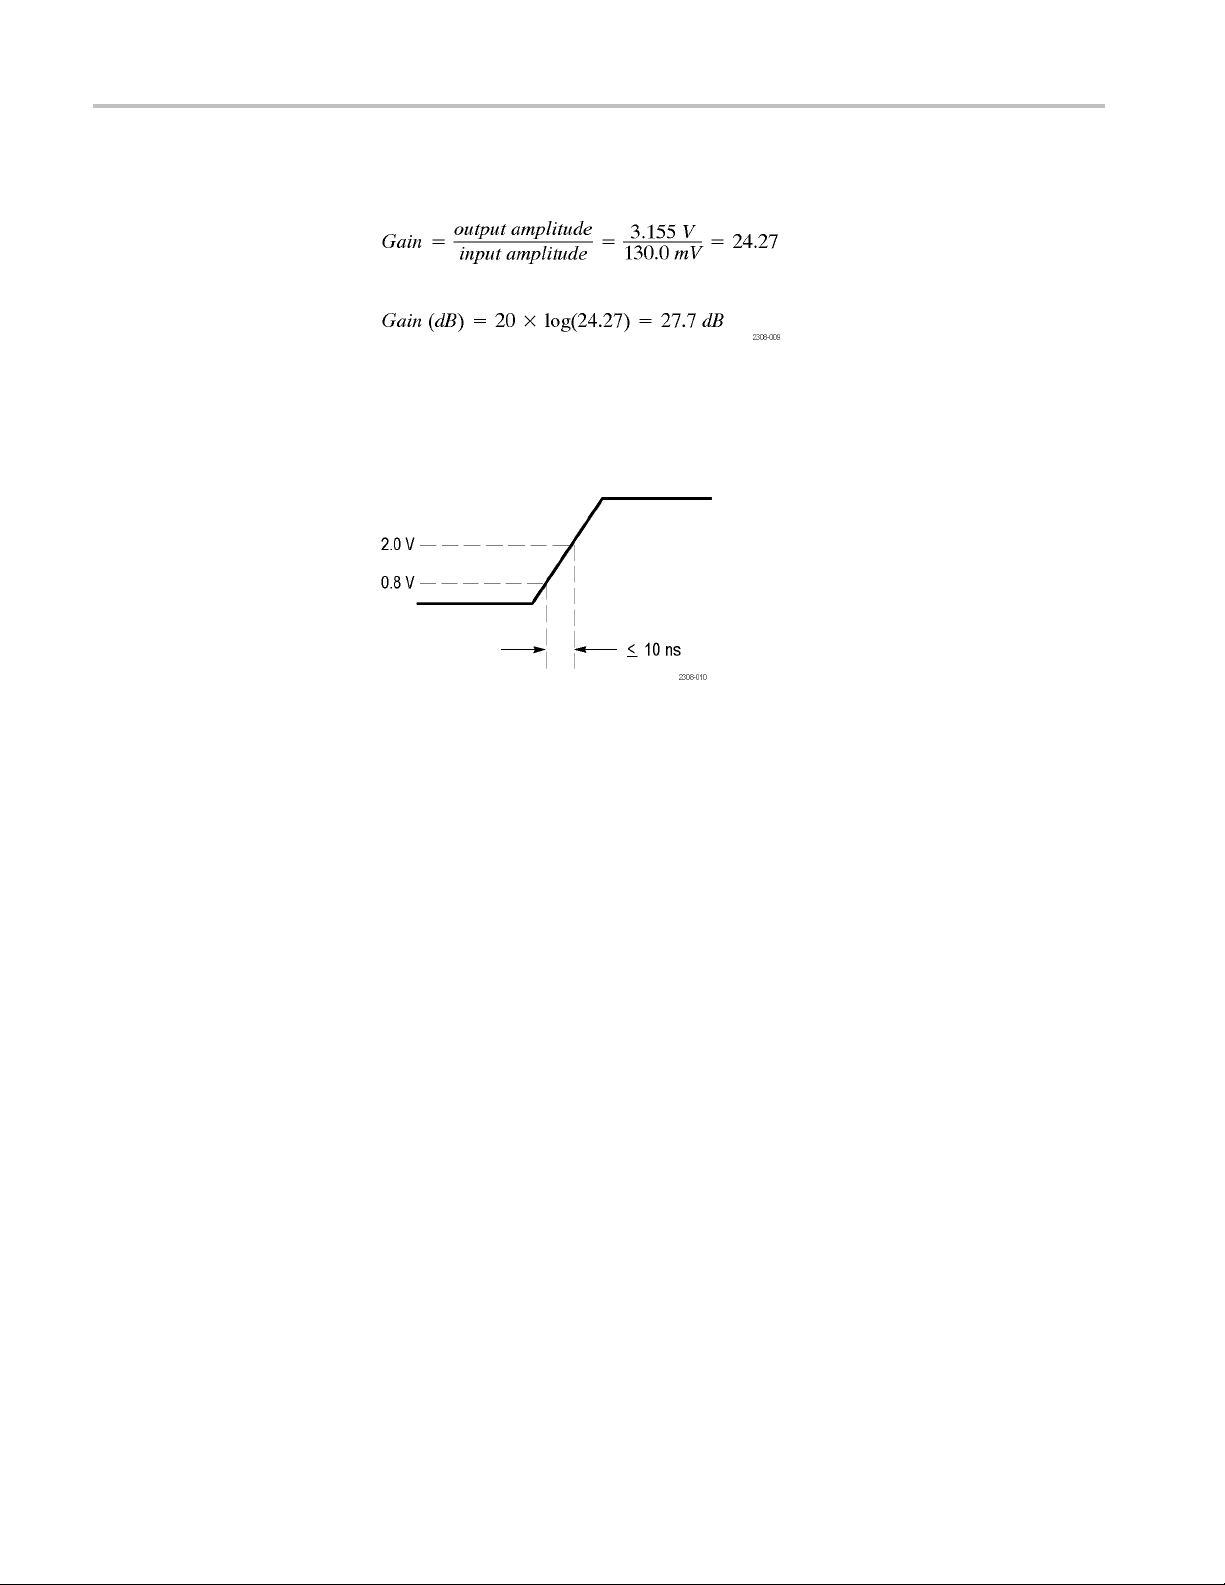
6. Calculate the a
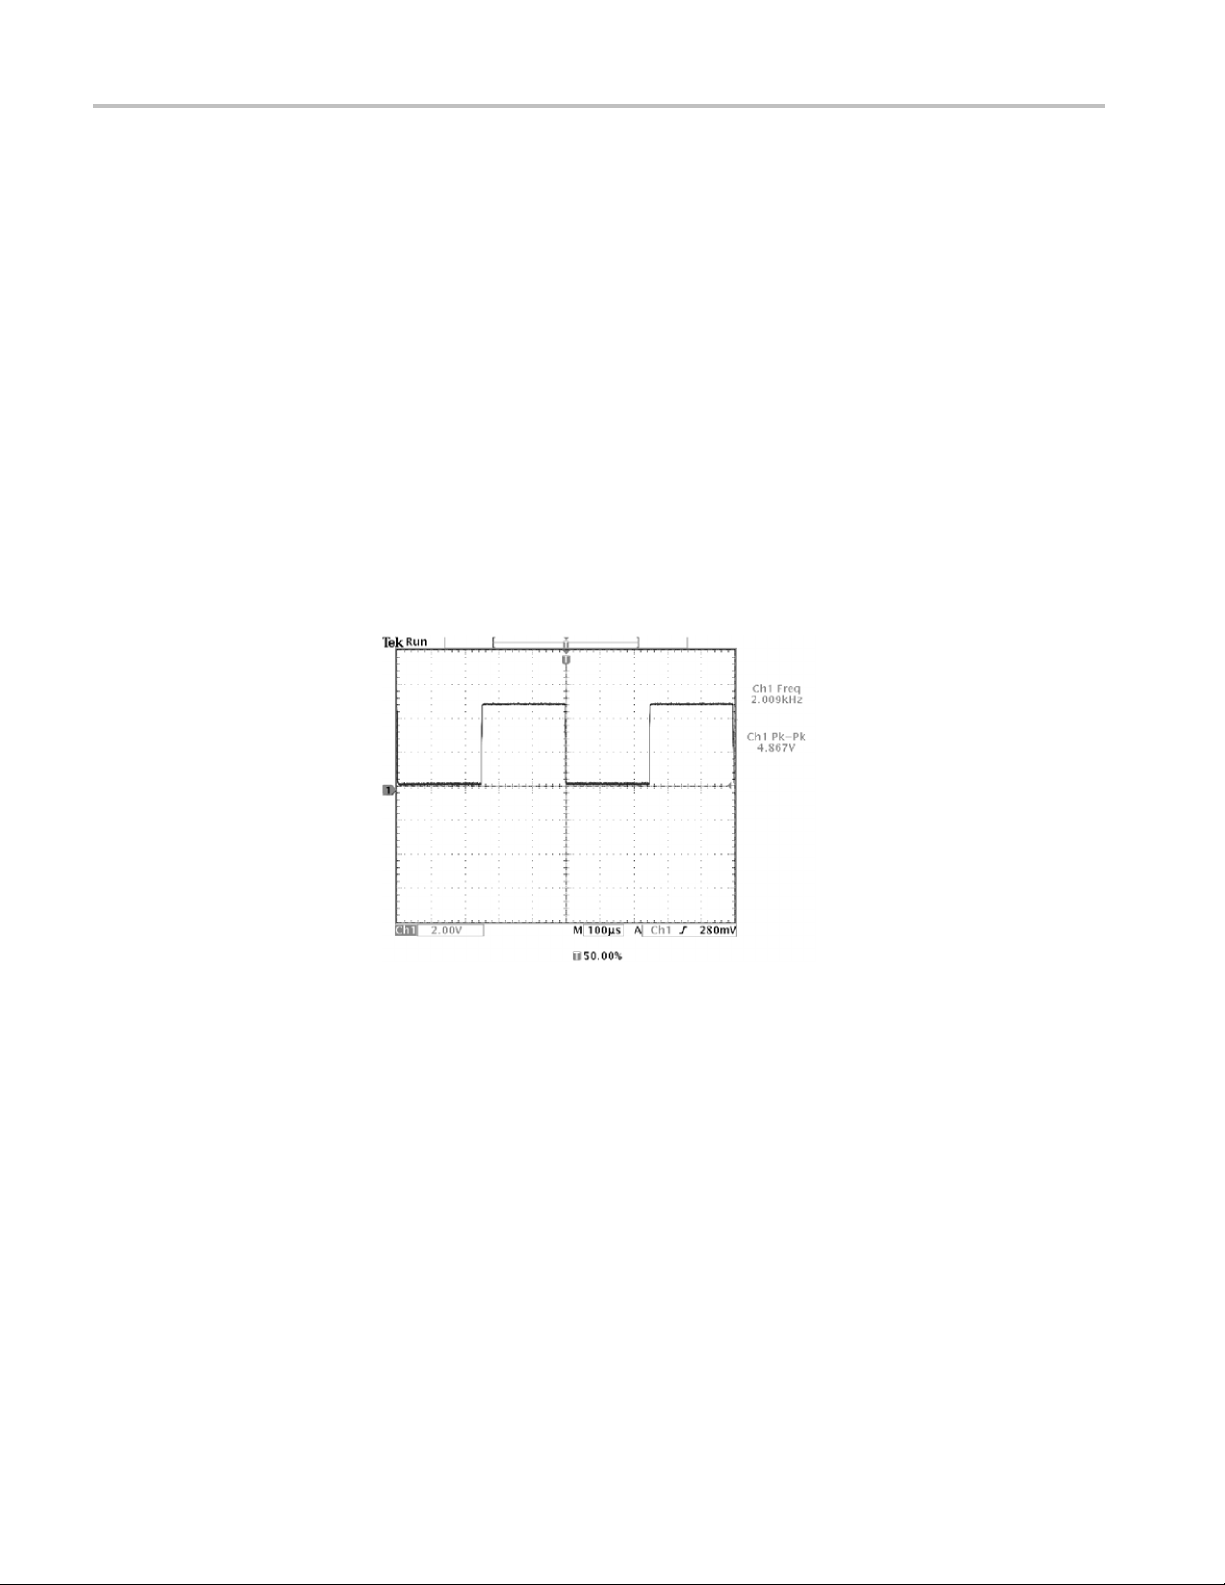
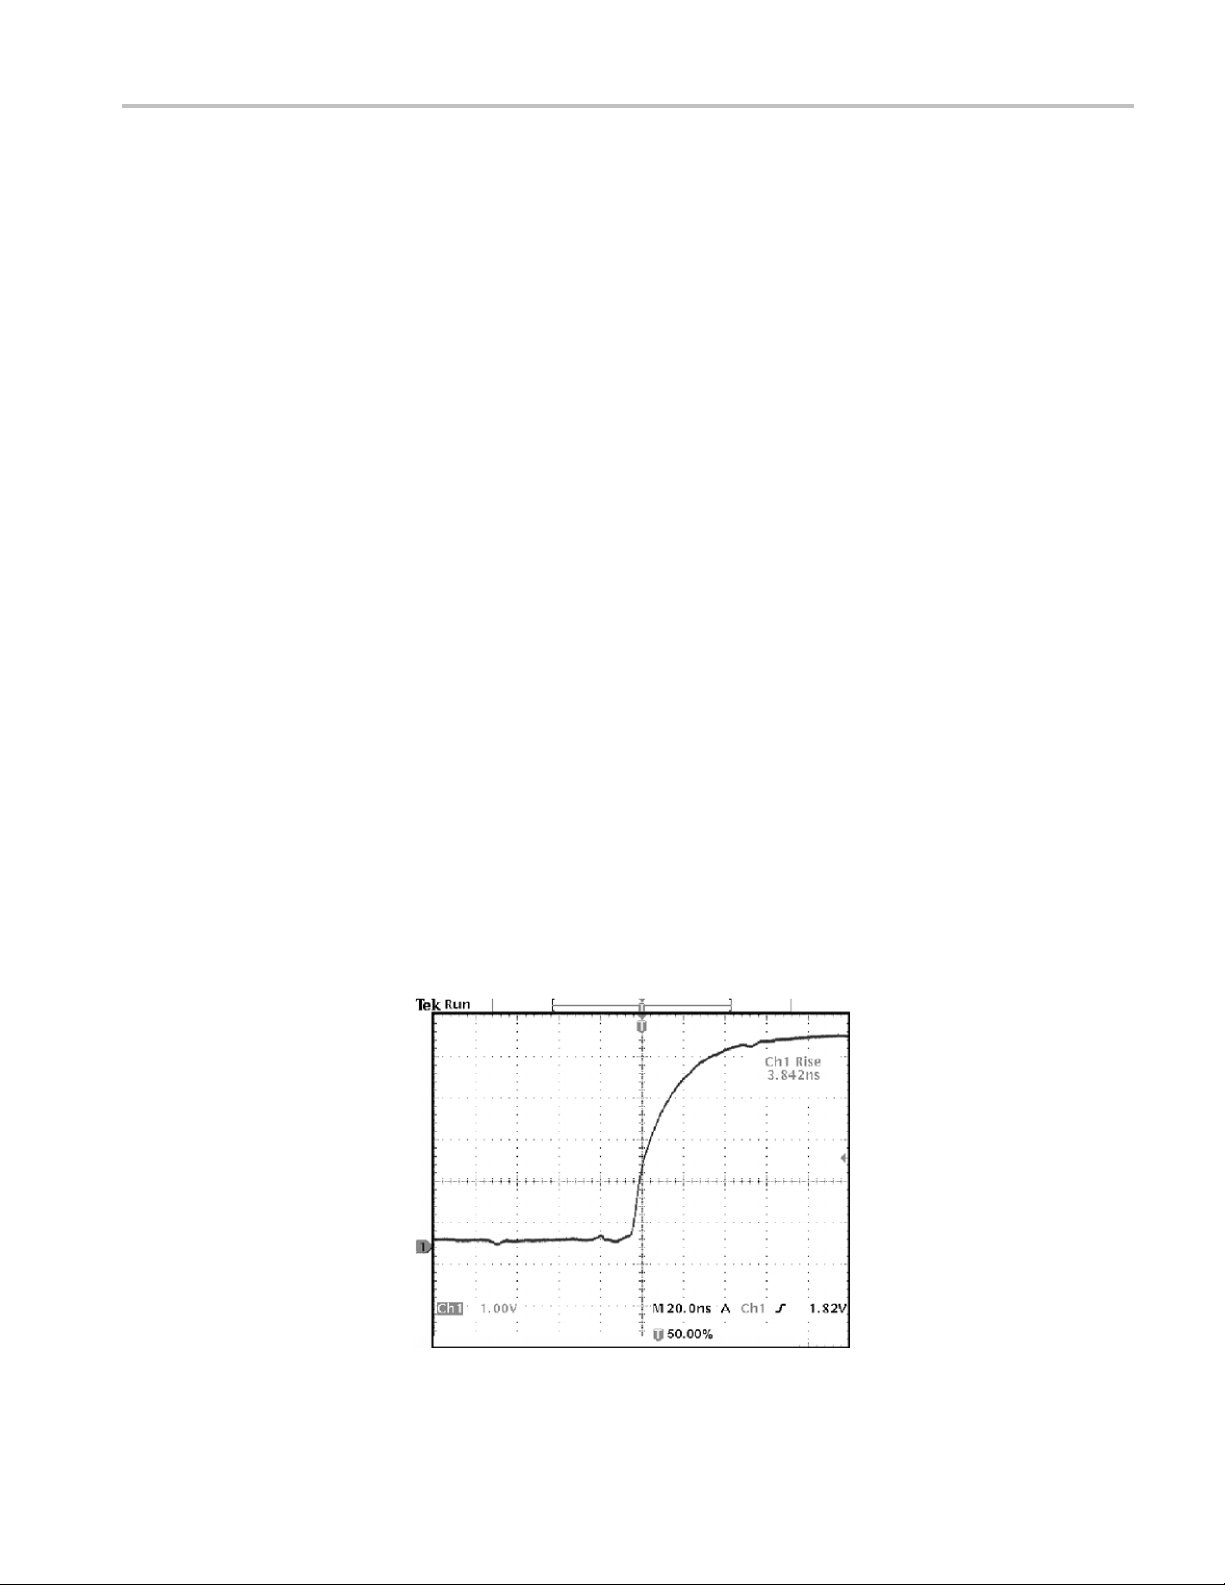
In this example you want to verify that the incoming signal to a piece of digital
equipment meets its specifications. Specifically, the transition time from a low
logic leve
l (0.8 V) to a high logic level (2.0 V) must be 10 ns or less.
mplifier gain using the following equations:
30 TDS3000C Series Oscilloscope User Manual
Page 51
Application Examples
To select the ri
1. Push the Meas button to see the Select Measurement menu.
2. Push the channel 1 button and then the Select Measurement for Ch1 screen
button.
3. Select the Rise Time measurement.
Rise time is typically measured between the 10% and 90% amplitude levels of a
signal; these are the default reference levels the oscilloscope uses for rise time
measurements. However, in this example you need to measure the time the signal
takes to pa
You can customize the rise time measurement to measure the signal transition
time betw
to a specific percent of the signal amplitude or to a specific level in vertical units
(such as volts or amperes).
Setting Reference Levels. To set the reference levels to specific voltages, follow
these steps:
1. Push the Reference Levels screen button.
2. Push the Set Levels in screen button to select units.
se time measurement, follow these steps:
ss between the 0.8 V and 2.0 V levels.
een any two reference levels. You can set each of those reference levels
3. Push the High Ref screen button.
4. Use the general purpose knob to select 2.0 V.
5. Pus
6. Use the general purpose knob to select 800 mV.
The measurement verifies that the transition time (3.842 ns) meets the specification
( ≤ 10 ns).
htheLow Ref screen button.
TDS3000C Series Oscilloscope User Manual 31
Page 52
Application Examples
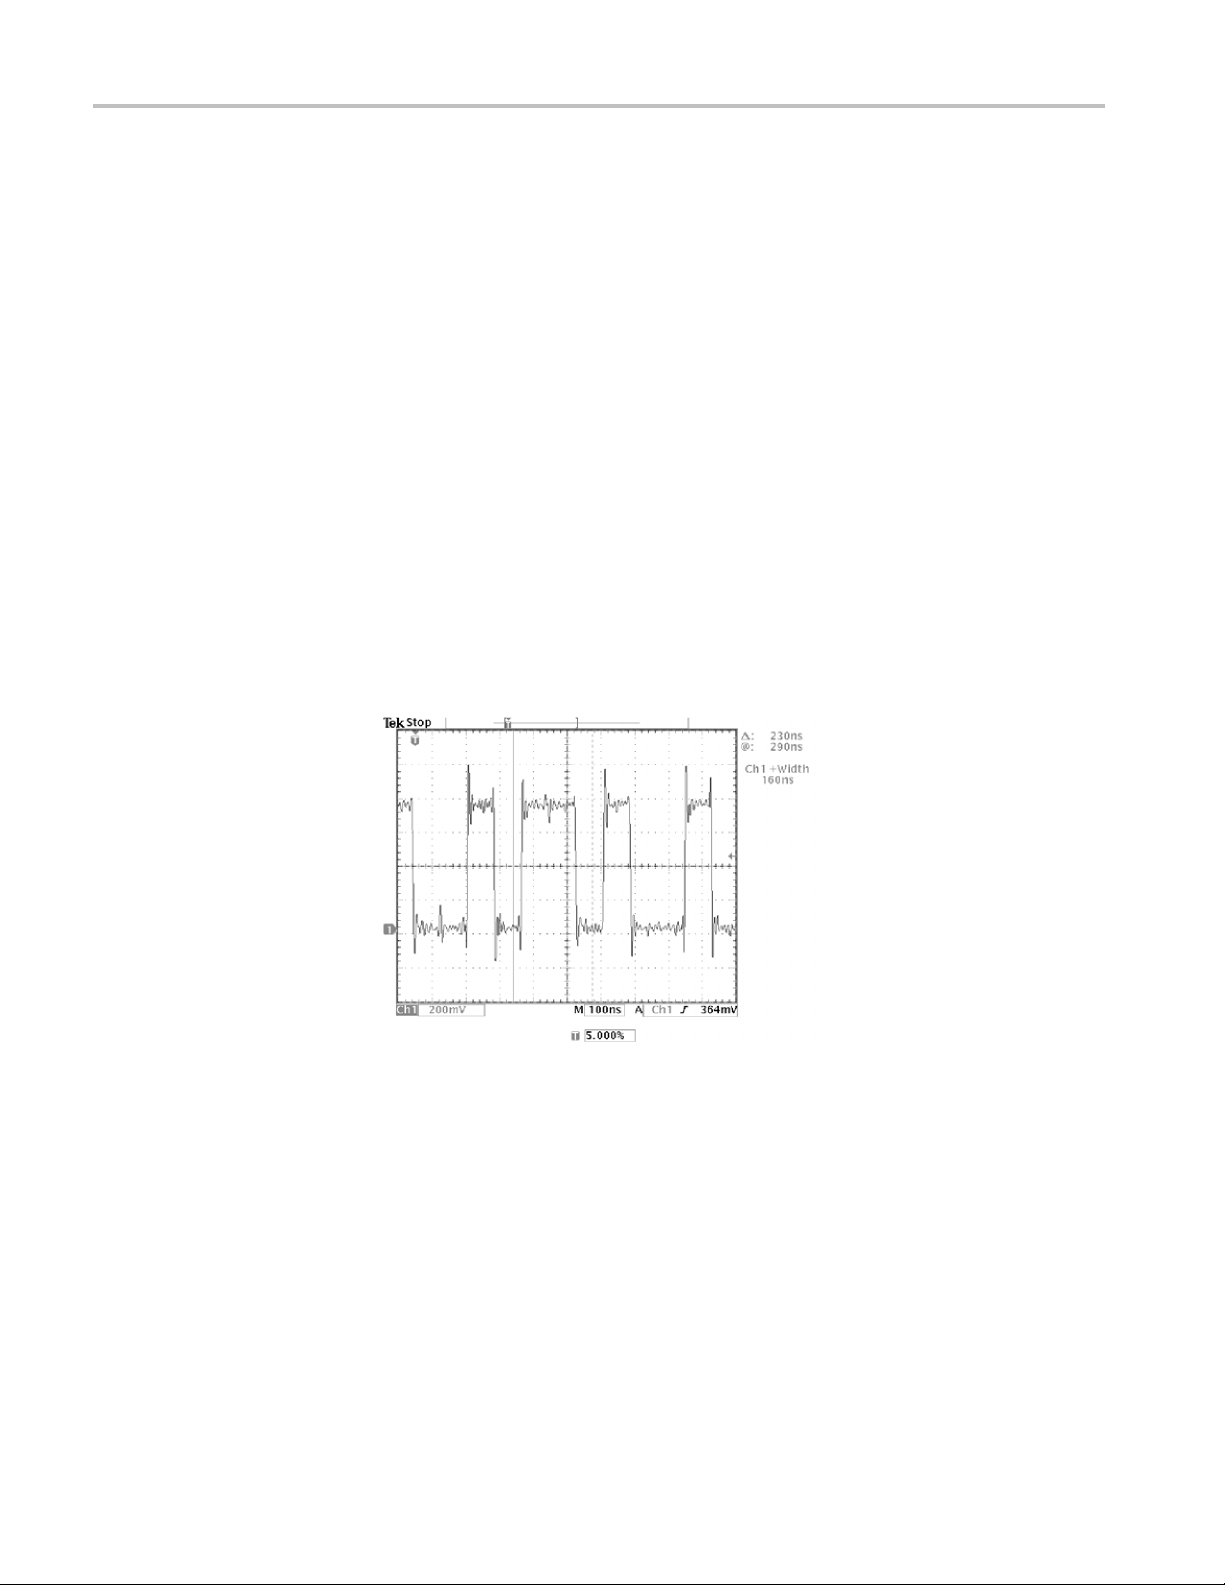
Measuring Spec
digital signal, but the pulse widths vary so it is hard to establish a stable trigger.
To look at a snapshot of the digital signal, follow this step:
1. Push the Single Seq button to capture a single acquisition.
Now you want
measurement gating to select a specific pulse to measure. To measure the second
pulse, for example, follow these steps:
1. Push the Meas button.
2. Push the ch
screen button.
3. Select th
4. Push the Gating screen button.
5. Select Between V Bar Cursors to choose measurement gating using cursors.
6. Place one cursor to the left and one cursor to the right of the second pulse.
The oscilloscope shows the width measurement (160 ns) for the second pulse.
ific Events. Next you want to see the pulses in the incoming
to measure the width of each displayed pulse. You can use
annel 1 button and then push the Select Measurement for Ch1
e Positive Pulse Width measurement.
32 TDS3000C Series Oscilloscope User Manual
Page 53

Application Examples
Analyzing Sig
nal Detail
You have a noisy signal displayed on the oscilloscope and you need to know more
about it. You suspect that the signal contains much more detail than you can
now see in the
display.
TDS3000C Series Oscilloscope User Manual 33
Page 54
Application Examples
Looking at a Noisy Signal
The signal appe
circuit. To better analyze the noise, follow these steps:
1. Push the Acqui
2. Push the Mode bottom button.
3. Select the Peak Detect acquisition mode.
4. Increase the Waveform Intensity control to see the noise more easily.
Peak detect emphasizes noise spikes and glitches in your signal as narrow as 1 ns,
even when the time base is set to a slow setting.
ars noisy and you suspect that noise is causing problems in your
re Menu button.
Separating the Signal from
Nois
The Re
acquisition modes. (See page 55.)
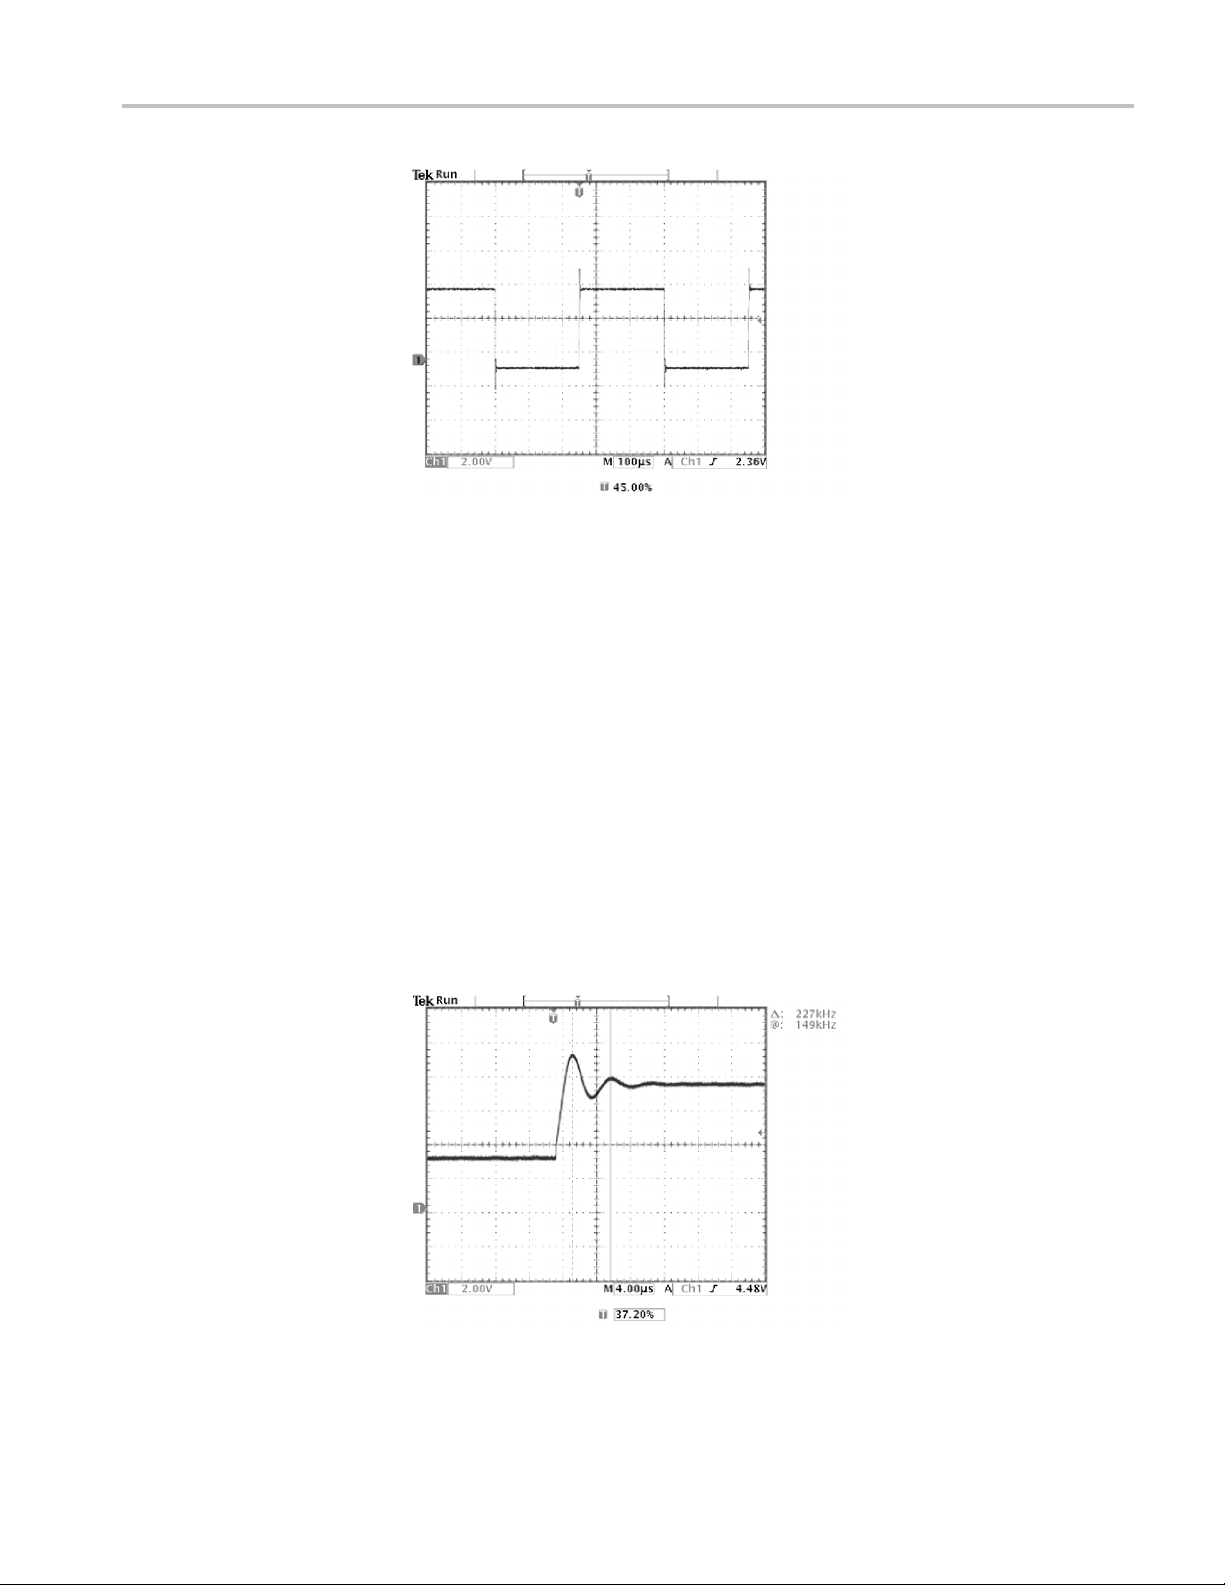
Now you want to analyze the signal shape and ignore the noise. To reduce random
nois
e
1. Push the Acquire Menu button.
2. Push the Mode bottom button.
3. Select the Average acquisition mode.
Averaging reduces random noise and makes it easier to see detail in a signal. In
the next example, a ring shows on the rising and falling edges of the signal when
the noise is removed.
ference chapter has more information about peak-detect and the other
e in the oscilloscope display, follow these steps:
34 TDS3000C Series Oscilloscope User Manual
Page 55
Application Examples
Taking Cursor
Measurements
You can use the cursors to take quick measurements on a waveform. To measure
the ring frequency at the rising edge of the signal, follow these steps:
1. Push the Cursor button.
2. Push the Function screen button.
3. Select VBarscursors.
4. Push the VBarUnitsscreen button.
5. Select 1/seconds (Hz).
6. Place
7. Push the Select button.
8. Place the other cursor on the next peak of the ring.
The cursor Δ readout shows the measured ring frequency is 227 kHz.
one cursor on the first peak of the ring using the general purpose knob.
TDS3000C Series Oscilloscope User Manual 35
Page 56
Application Examples
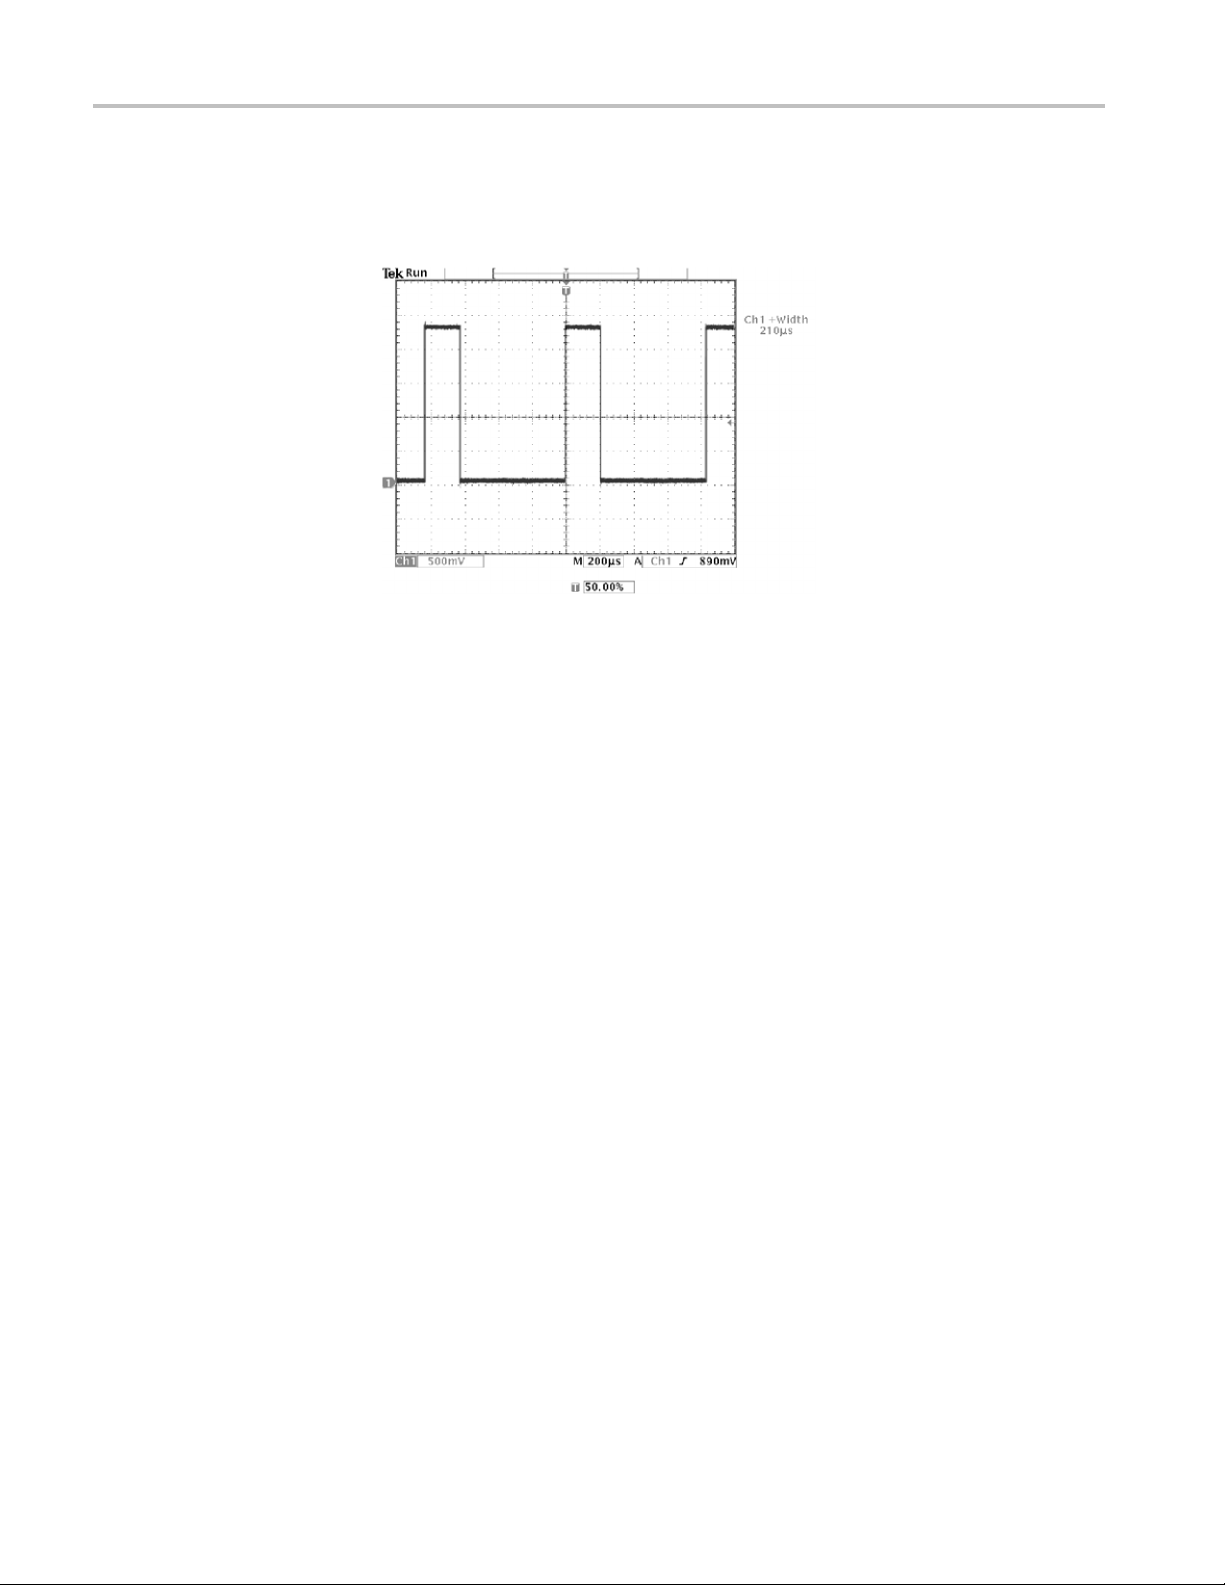
Using Delay
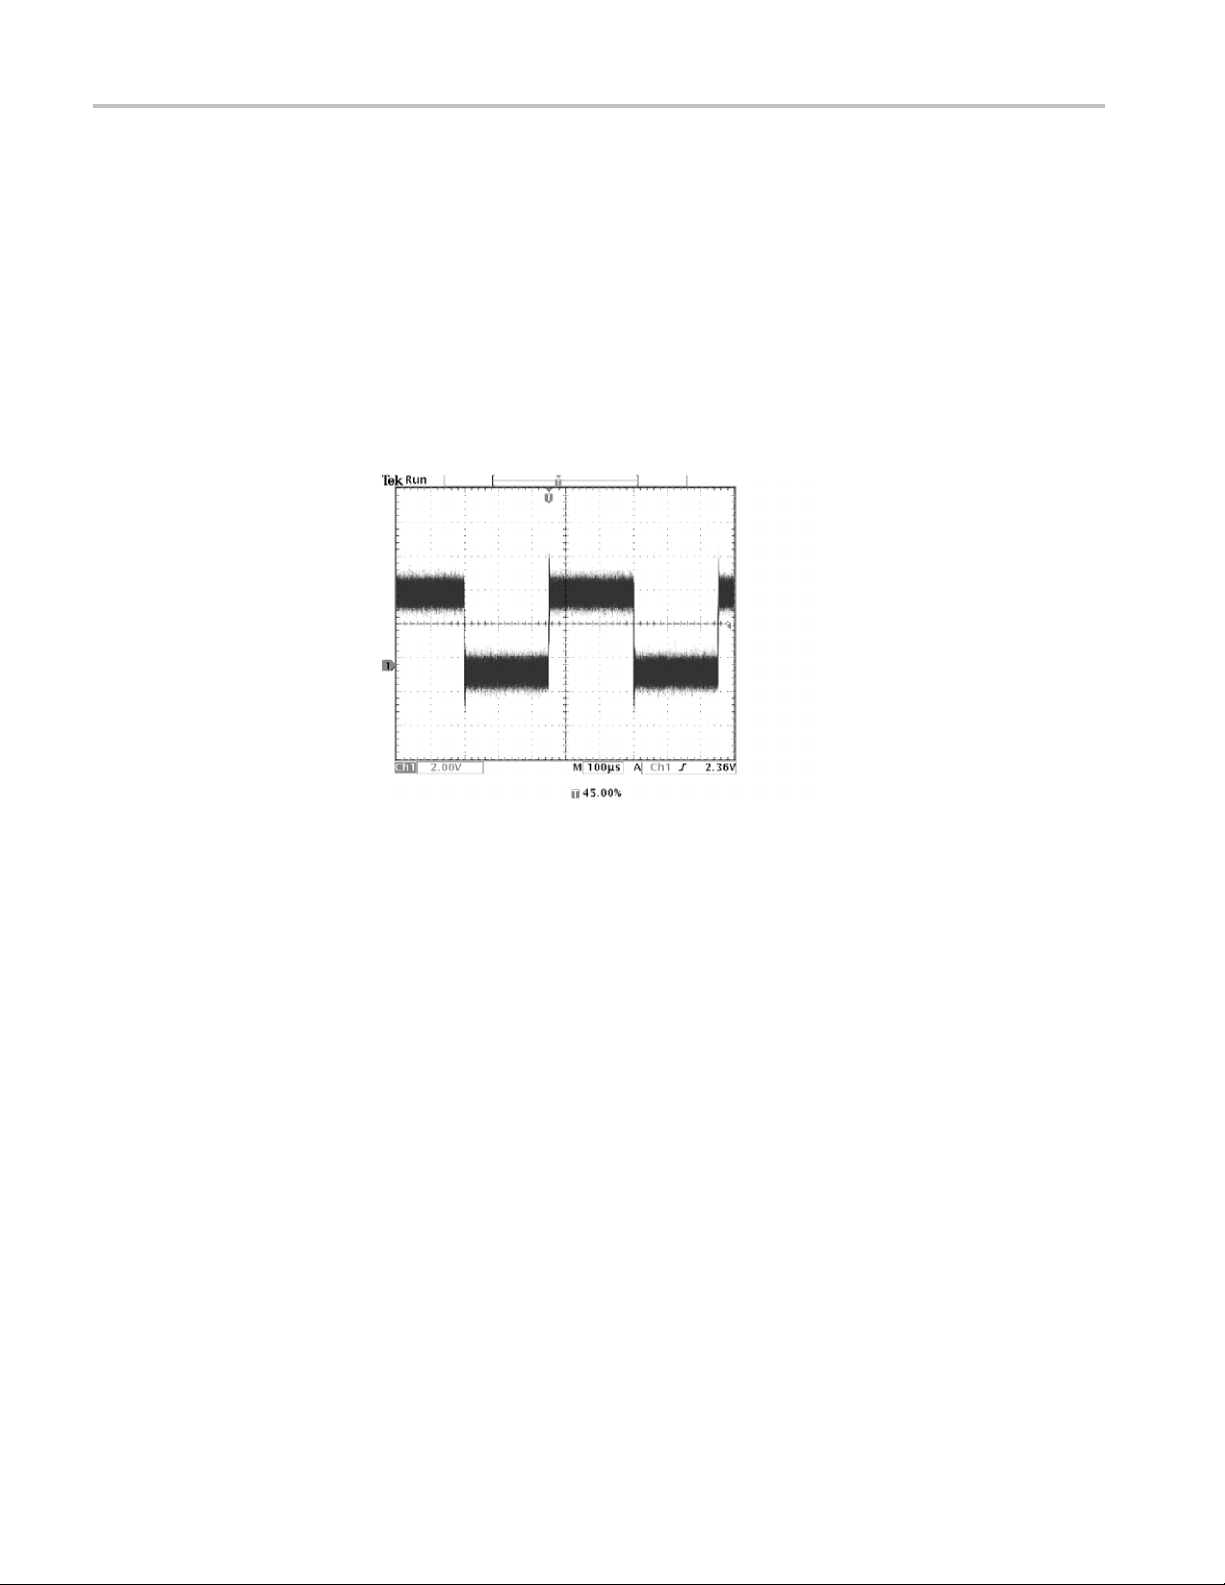
You are analyzi
the waveform pulse width. You notice that the measurement is not stable, which
implies that there is jitter in the pulse width.
ng a pulse waveform and use the + Width measurement to measure
36 TDS3000C Series Oscilloscope User Manual
Page 57
Application Examples
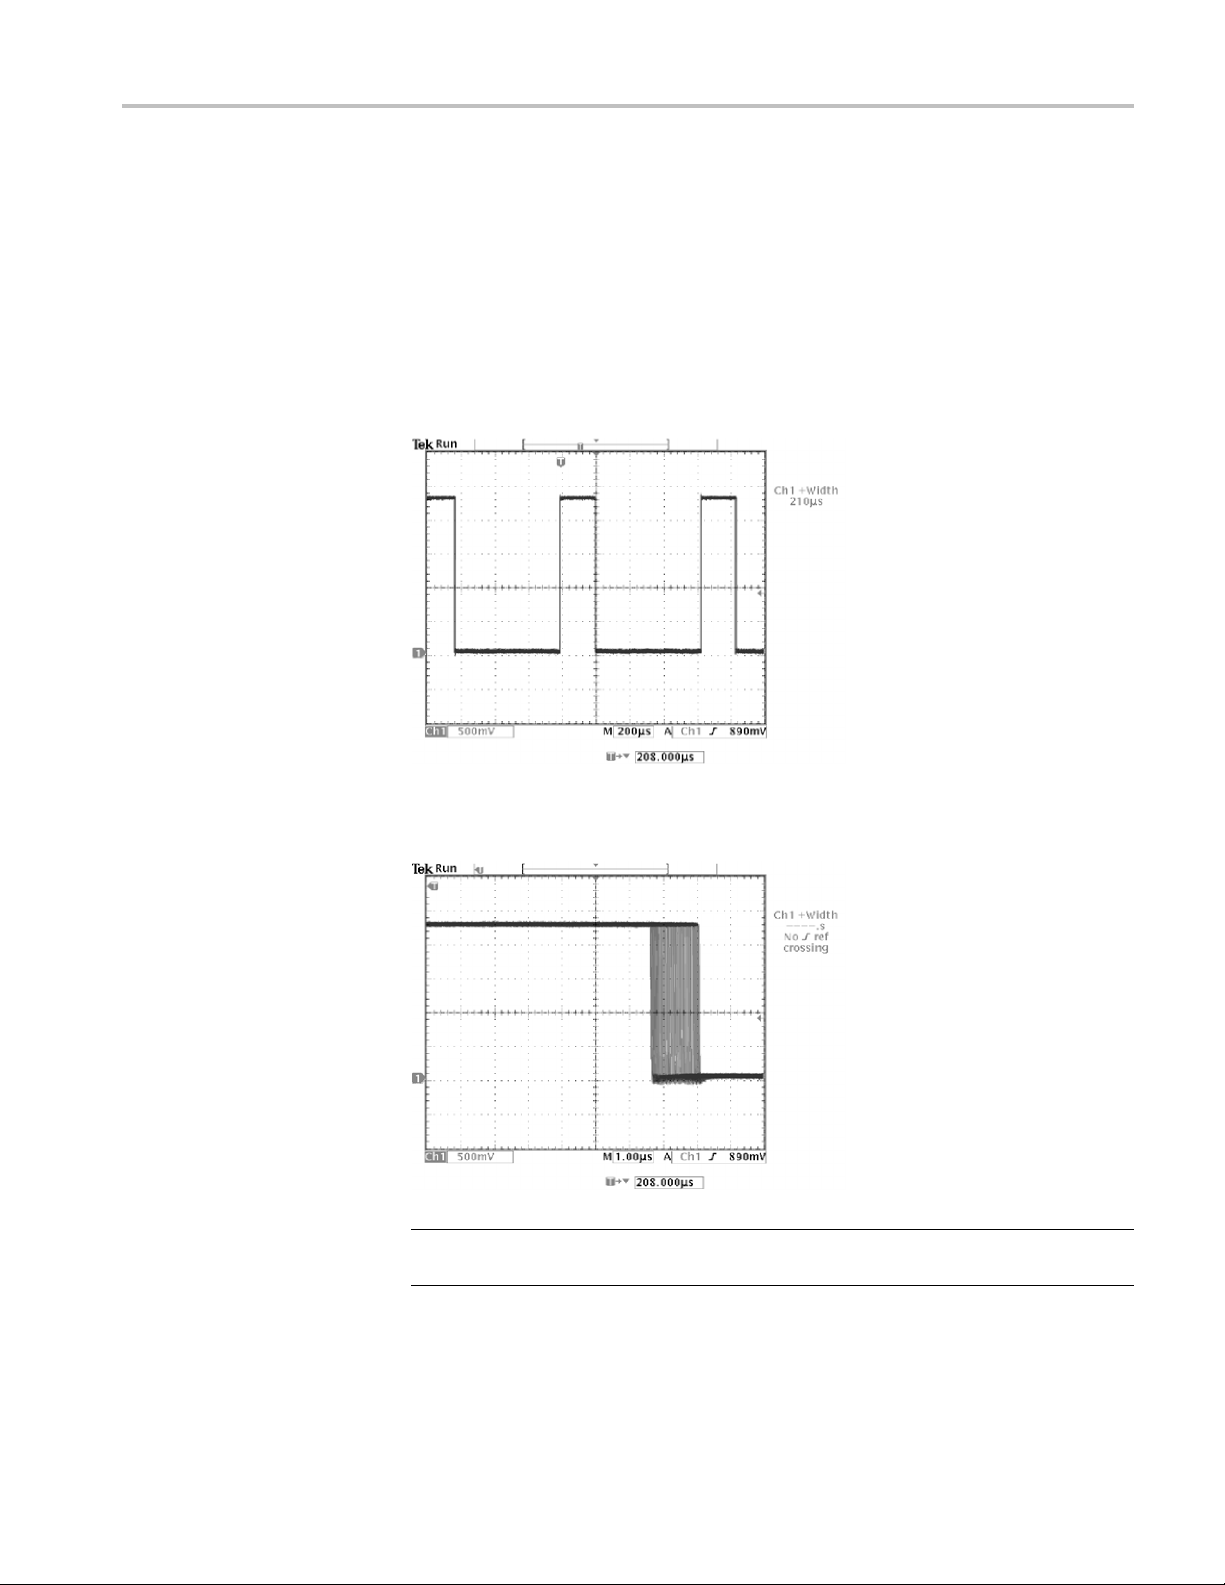
To use delay to s
1. Push the Delay button.
2. Adjust the horizontal Position control to set the delay close to the nominal
pulse width (210 μs). Push the Coarse button to make delay adjustments
more quickl
The falling edge of the pulse is now near the center of the screen. When delay
is on, the ho
remains in the center of the screen.
ee the jitter, follow these steps:
y. Push the Coarse button again to fine tune the delay time.
rizontal expansion point separates from the trigger point and
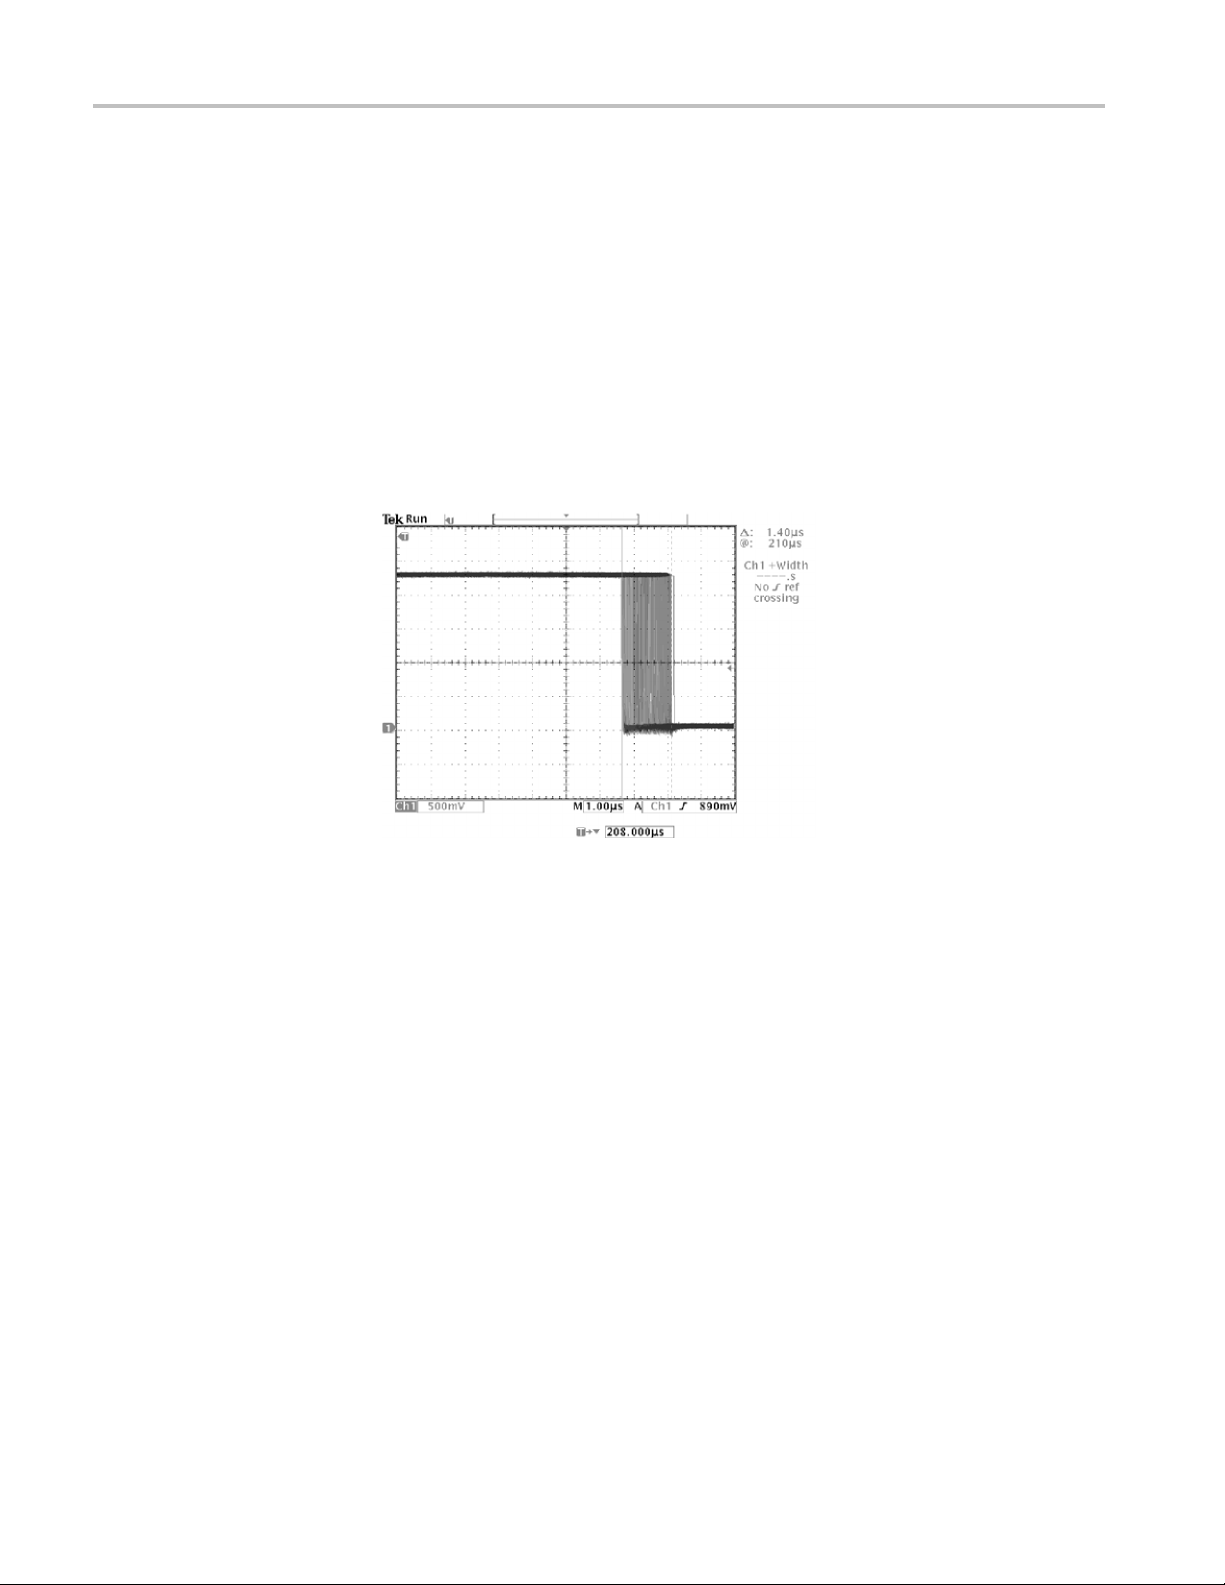
3. Adjust the horizontal Scale to a faster time base setting a nd increase the
Waveform Intensity to see the jitter in the pulse width.
NOTE. You can toggle the delay function on and off to view signal details at two
different areas of interest.
TDS3000C Series Oscilloscope User Manual 37
Page 58
Application Examples
Measuring Jitter
To measure the p
1. Push the Cursor button.
2. Push the Function screen button.
3. Select the VB
4. Push the Bring Both Cursors On Screen screen button to quickly locate
the cursors
5. Place one cursor at the first falling edge and place the other cursor at the
last falli
6. Read the peak-to-peak jitter in the Δ readout (1.40 μs).
eak-to-peak jitter, follow these steps:
ars cursors.
.
ng edge.
You can also measure the minimum and maximum pulse widths. When you select
the first cursor, the @ readout displays the minimum pulse width (210 μs). W hen
you select the second cursor, the @ readout displays the maximum pulse width
(211 μs).
38 TDS3000C Series Oscilloscope User Manual
Page 59
Taking FFT Measurements
You can take FFT measurements to determine if low-level distortion is present, or
to find the source of noise in a mixed circuit.
Application Examples
Detecting Distortion
A pure sine wave can be input into an amplifier to measure distortion; any
amplifier distortion will introduce harmonics in the amplifier output. Viewing the
FFT of the output can determine if low-level distortion is present.
You are using a 20 MHz signal as the amplifier test signal. You would set the
oscilloscope and FFT parameters as listed in the next table.
Control Setting
1 Coupling AC
Acquisition Mode Average 16
Horizontal Resolution
Horizontal Scale
FFT Source Ch1
FFT Vert Scale
FFT Window Blackman-Harris
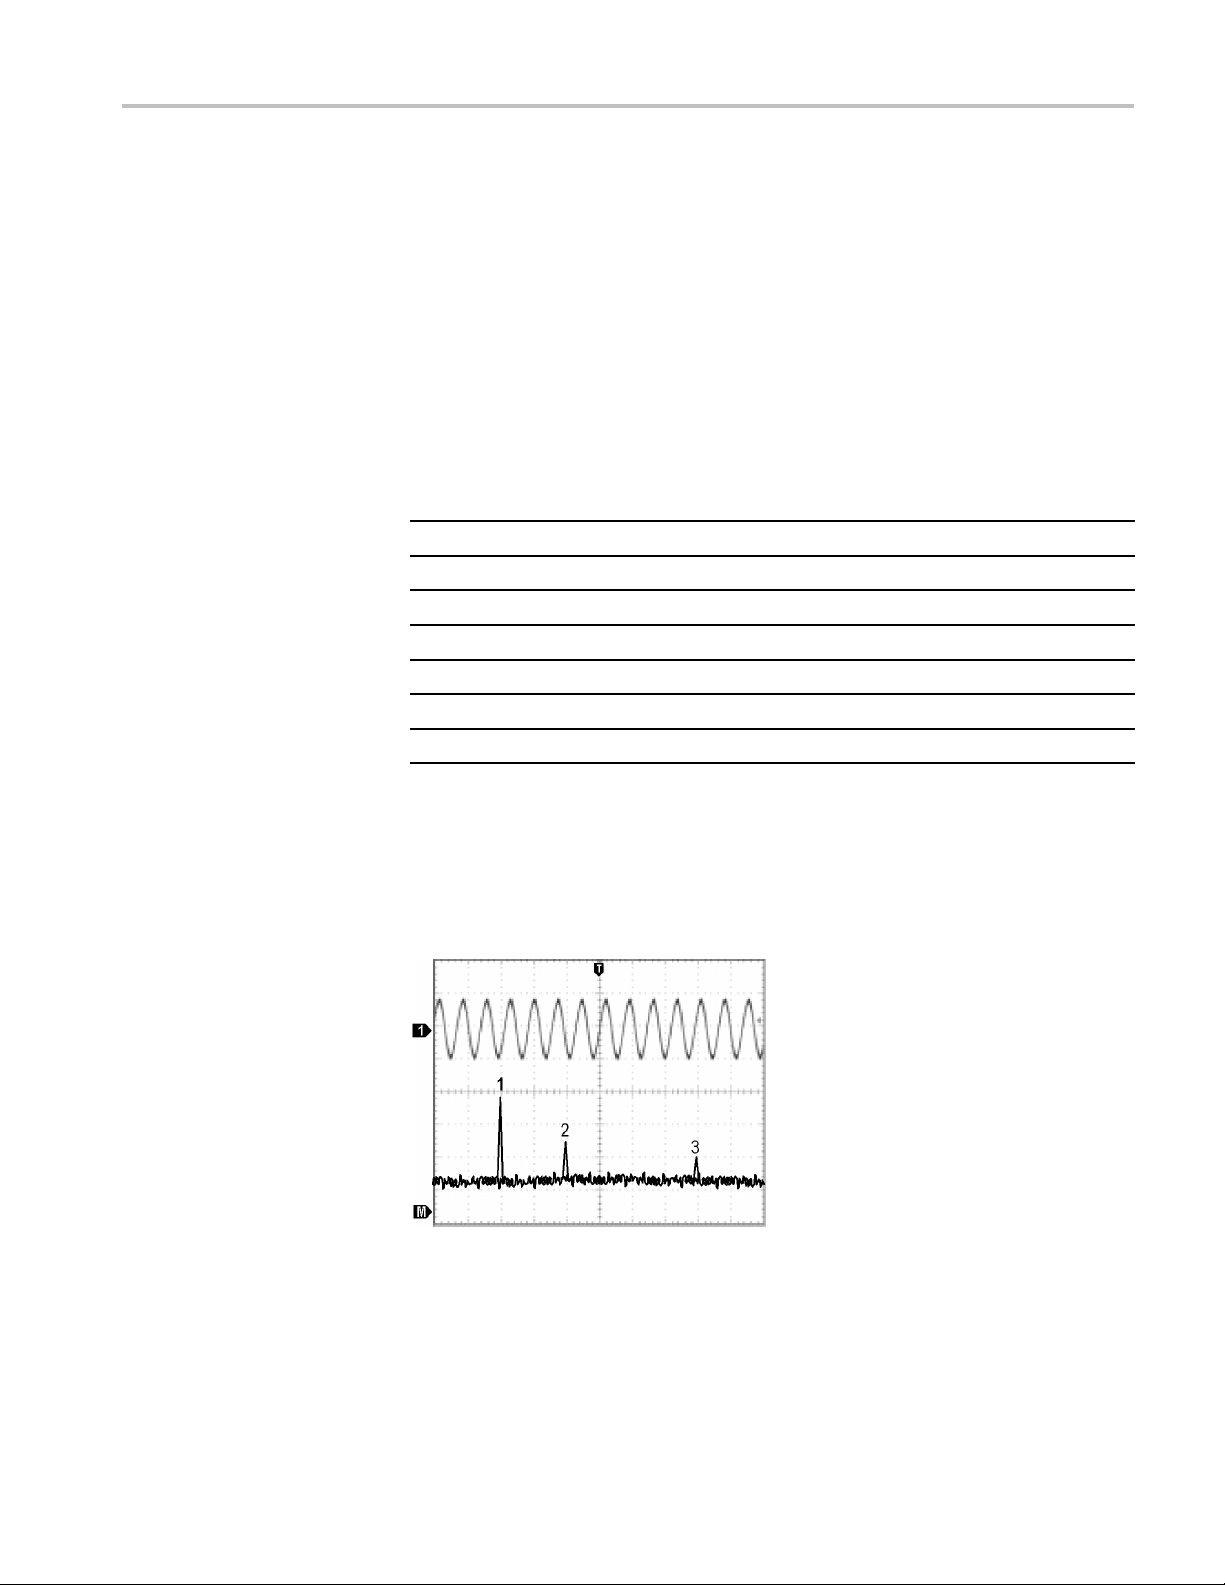
enextfigure, the first component at 20 MHz (figure label 1) is the source
In th
Normal (10k points)
100 ns
dBV
signal fundamental frequency. The FFT waveform also shows a second-order
harmonic at 40 MHz (label 2), and a fourth-order harmonic at 80 MHz (label
3). The presence of components 2 and 3 indicate that the system is distorting
the signal. The even harmonics suggest a possible difference in signal gain on
half of the signal cycle.
TDS3000C Series Oscilloscope User Manual 39
Page 60

Application Examples
Identifying the Source of
Noise
Noise in mixed d
igital/analog circuits can be easily observed with an oscilloscope.
However, identifying the sources of the observed noise can be difficult.
The FFT wavefo
rm displays the frequency content of the noise. You may then
be able to associate those frequencies with known system frequencies, such as
system clocks, oscillators, read/write strobes, display signals, or switching power
supplies.
The highest frequency on the example system is 40 MHz. To analyze the example
signal, you would set the oscilloscope and FFT parameters as listed in the next
table.
Control Setting
1 Coupling AC
Acquisition Mode
Horizontal Resolution
Horizontal Scale
Bandwidth 150 MHz
FFT Source Ch1
FFT Vert Scale
FFT Window Hanning
Sample
Normal (10k points)
4.00 μs
dBV
In the next figure, notice the component at 31 MHz (figure label 1). This coincides
with a 31 MHz memory strobe signal in the example system. There is also a
quency component at 62 MHz (label 2), which is the second harmonic of the
fre
strobe signal.
40 TDS3000C Series Oscilloscope User Manual
Page 61

Application Examples
Triggering on
a Video Signal
You are testing the video circuit in a piece of medical equipment and need to
display the video output signal. The video output is an NTSC standard signal. Use
the video tri
To trigger on the video fields, follow these steps:
1. Push the Trigger Menu button.
2. Push the Type screen button to select Video.
3. Push the Standard screen button to select 525/NTSC.
gger to obtain a stable display.
4. Push the Trigger O n screen button.
5. Selec
6. Adjust the horizontal Scale to see a complete field across the screen.
7. Push the Acquire Menu button.
8. Push the Horizontal Resolution screen button.
9. Select Normal acquisition resolution.
Normal acquisition resolution is the best choice to acquire a video field signal
because the signal contains a great amount of horizontal detail.
t Odd.
TDS3000C Series Oscilloscope User Manual 41
Page 62
Application Examples
If the signal had been noninterlaced, you could choose to trigger on All Fields.
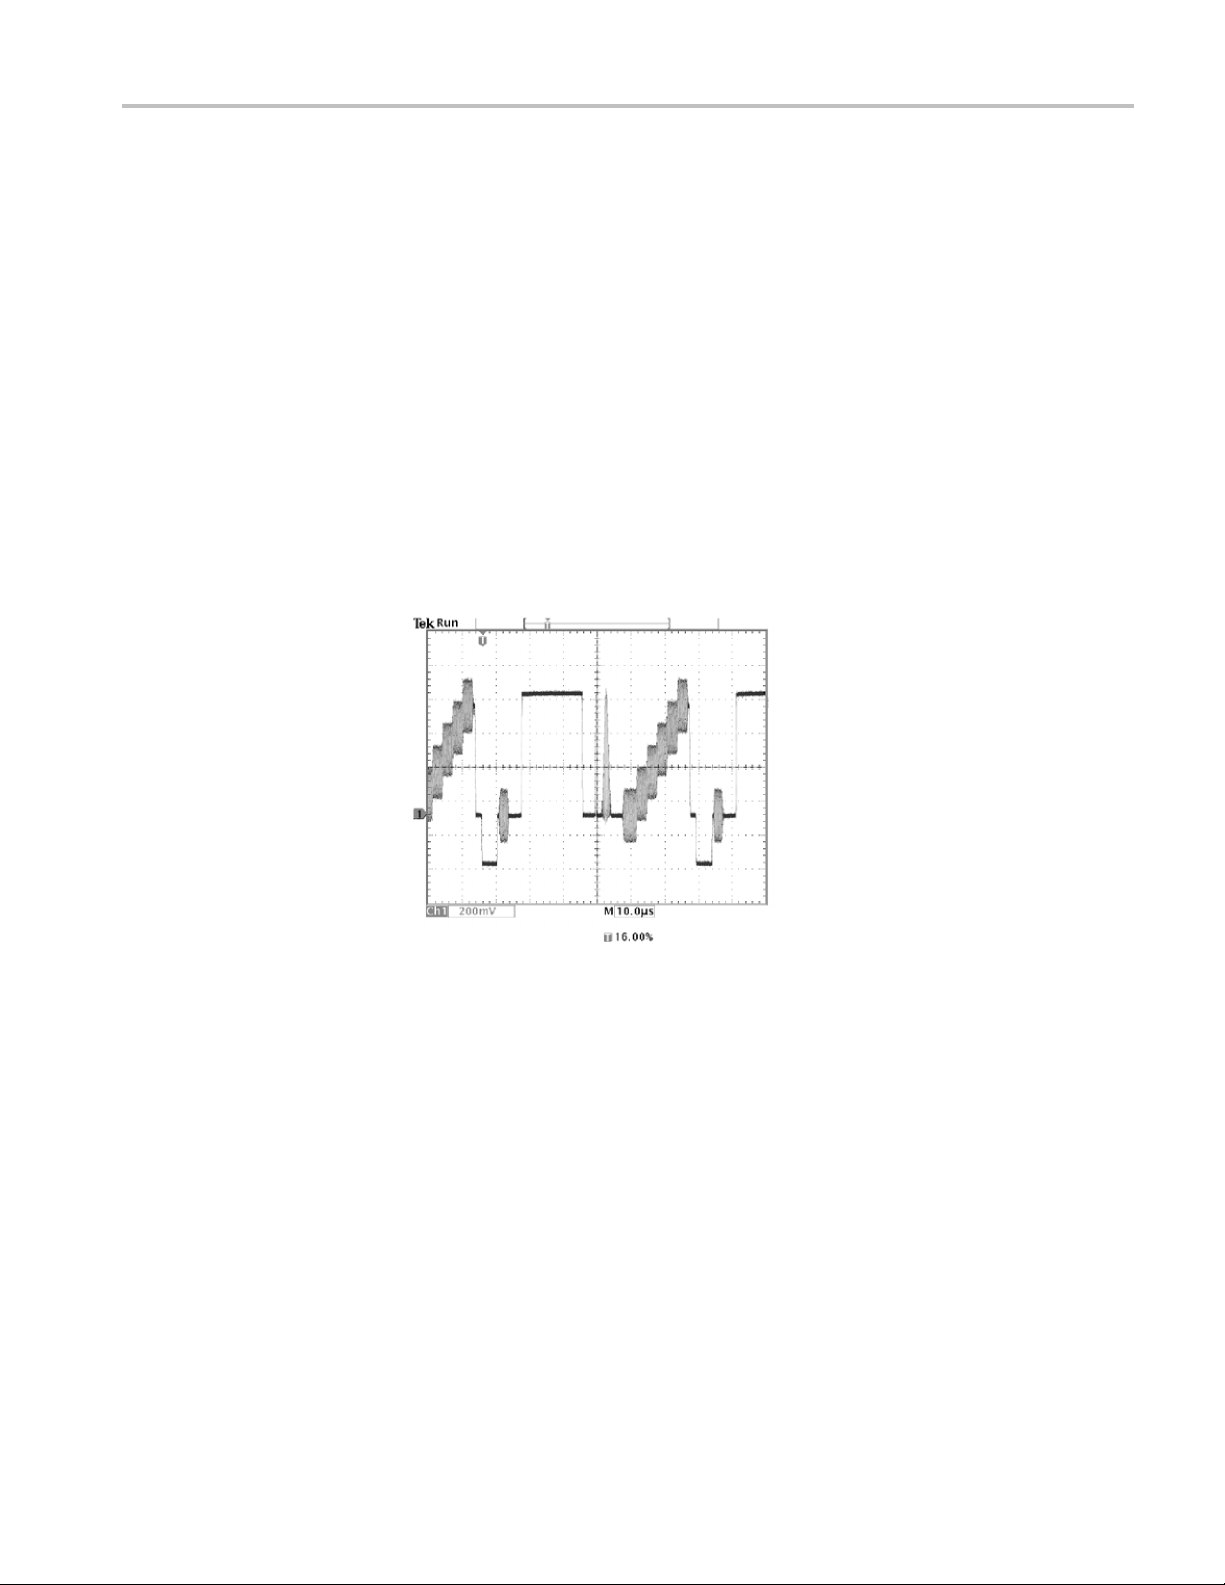
Triggering on Lines. You can also look at the video lines in the field. To trigger on
the lines
1. Push the Trigger O n screen button.
, follow these steps:
2. Select All Lines.
3. Adjust the horizontal Scale to see a complete video line across the screen.
NOTE. The optional TDS3VID and TDS3SDI application modules add new video
functions such as a video QuickMenu, video Autoset, trigger on custom scan rates,
trigger on specific video lines, vectorscope (vectorscope supports component
video only), video picture, trigger on analog HDTV signals, and view 601 digital
ideo signals (TSD3SDI only).
v
42 TDS3000C Series Oscilloscope User Manual
Page 63
Application Examples
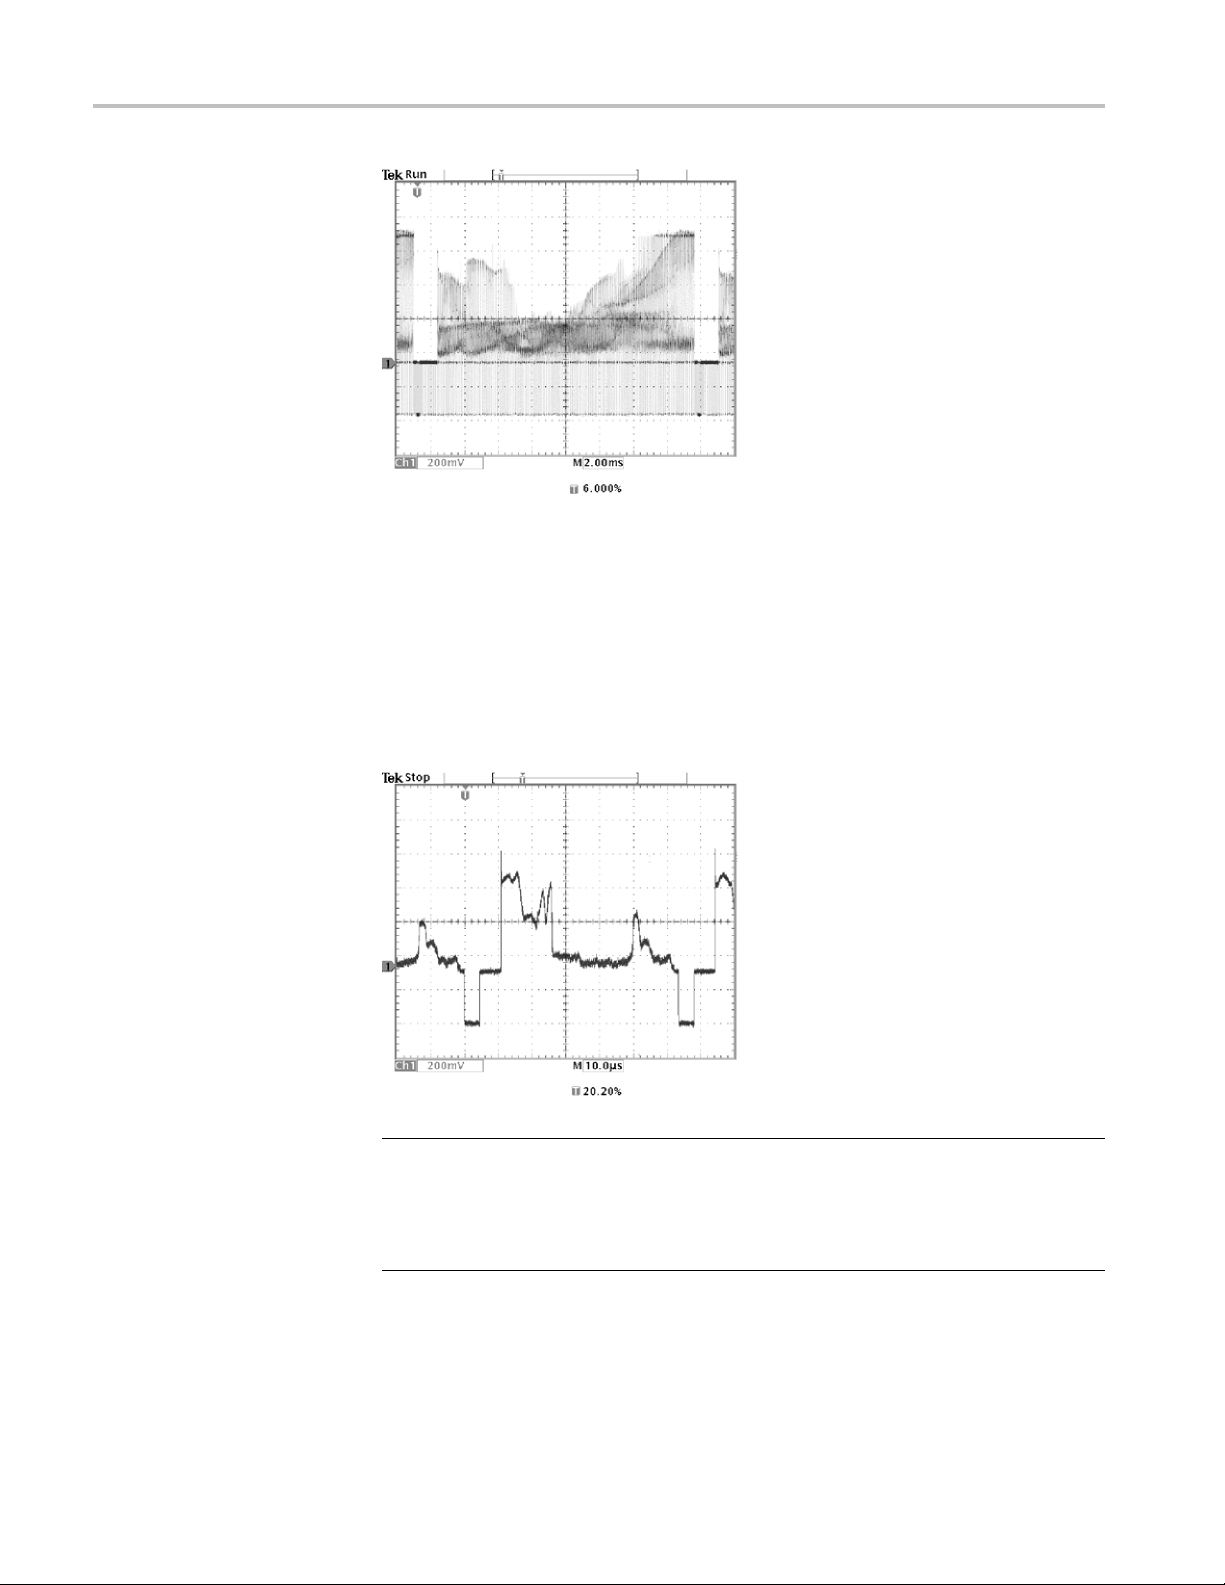
Looking at Modu
the modulation in a video signal. To see a similar modulation display on the
oscilloscope screen, follow these steps:
1. Start with triggered display of the video lines.
2. Push the Acq
3. Push the Horizontal Resolution screen button.
4. Select Fast Trigger acquisition resolution.
5. Adjust the Waveform Intensity control for the amount of modulation you
want to see.
The oscilloscope now shows signal modulation in shades of intensity and appears
similar to the display of a video waveform monitor or an analog oscilloscope. Fast
trigger acquisition resolution is the best choice to acquire a video line signal
with a ra
pidly changing shape.
lation. A dedicated video waveform monitor clearly shows
uire Menu button.
turing a Single-Shot Signal
Cap
The reliability of a reed relay in a piece of equipment has been poor and you need
to investigate the problem. You suspect that the relay contacts arc when the relay
ens. The fastest you can open and close the relay is about once per minute so
op
you need to capture the voltage across the relay as a single-shot acquisition.
o set up for a single-shot acquisition, follow these steps:
T
1. Adjust the vertical Scale and horizontal Scale to appropriate ranges for the
signal you expect to see.
2. Push the Acquire Menu button.
3. Push the Horizontal Resolution screen button.
TDS3000C Series Oscilloscope User Manual 43
Page 64
Application Examples
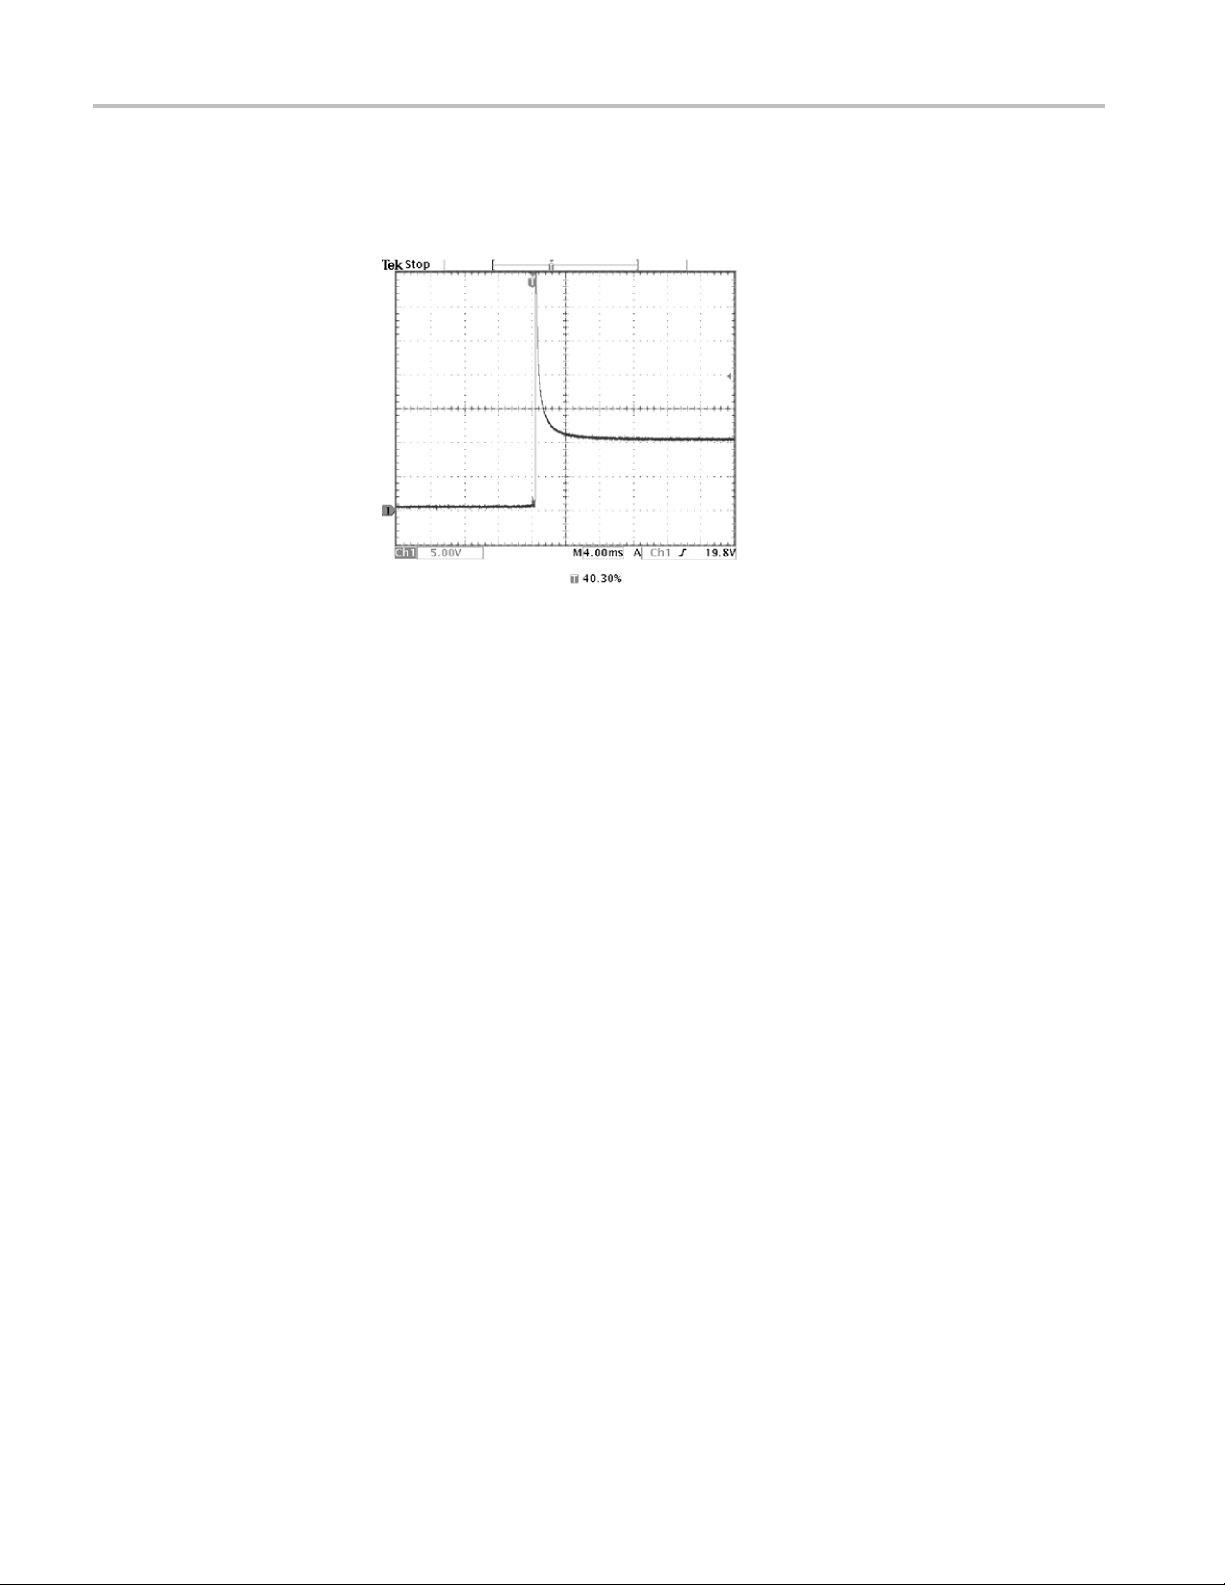
Optimizing the Acquisition
4. Select Normal a
5. Push the Single Seq (single sequence) button.
The Single Seq button sets trigger parameters to the correct settings for a
single-shot a cquisition.
The initial acquisition shows the relay contact beginning to open at the trigger
point. This is followed by a large spikes that indicate contact bounce and
inductance in the circuit. The inductance can cause contact arcing and premature
relay failure.
cquisition resolution.
Before you take the next acquisition, you can adjust the vertical and horizontal
controls to give you a preview of how the n ext acquisition might appear. As
you adjust these controls, the current ac quisition is repositioned, expanded, or
ressed. This preview is useful to optimize the settings before the next
comp
single-shot event is captured.
n t he next acquisition is captured with the new vertical and horizontal
Whe
settings, you can see more detail about the relay contact opening. You can now
see that the contact bounces several times as it opens.
44 TDS3000C Series Oscilloscope User Manual
Page 65

Application Examples
Using the Horizontal Zoom
Function
If you want to take a close look at a particular spot on the acquired waveform, use
the horizontal zoom function. To look closely at the point where the relay contact
first begins to open, follow these steps:
1. Push the zoom button
2. Use the horizontal Position to place the expansion point close to where the
relay contact begins to open.
3. Adjust the horizontal Scale to magnify the waveform around the expansion
point.
The ragged waveform and the inductive load in the circuit suggest that the relay
contact may be arcing as it opens.
.
he zoom function works equally well when acquisition is running or is stopped.
T
Horizontal position and scale changes affect only the display, not the next
acquisition.
TDS3000C Series Oscilloscope User Manual 45
Page 66
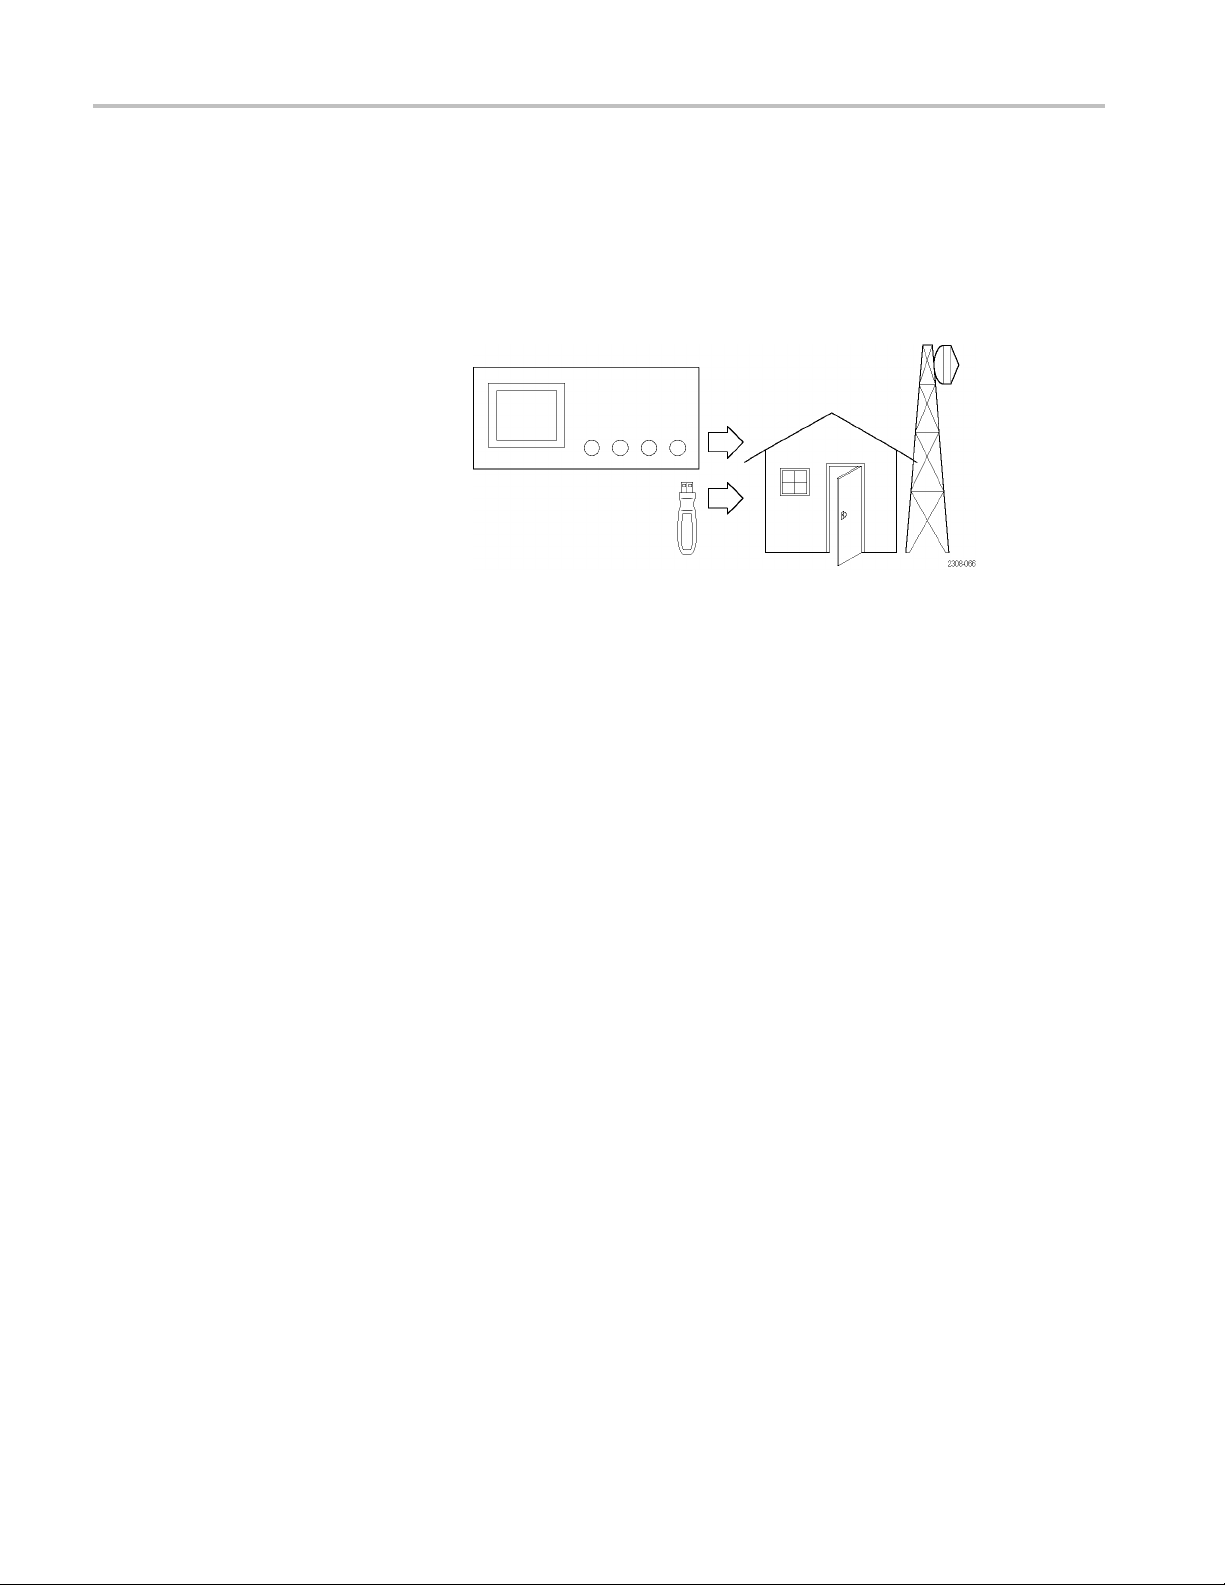
Application Examples
Saving Data to
aUSBFlashDrive
You need to do some work inside a remote site. You expect to use the oscilloscope
to look at signal waveforms, to bring the waveform information back to the office
to complete a
USB flash drive.
When you need to capture screen images, it may be most convenient to first save
them to a USB flash drive. Once on the USB flash drive, you can load the screen
images into a PC, print hard copies with a printer attached to your PC, or import
the screen images into desktop publishing software to produce a report.
Similarly, you can also save waveform data on the USB flash drive. From the flash
drive, you can recall waveforms to the oscilloscope display or you can import the
data into spreadsheet and Mathcad software to perform additional analysis.
report, and to perform additional analysis. To do this, take along a
Remote site
Saving Screen Images
If you have oscilloscope setups that you want to use again, you also can store
them on the USB flash drive. The Reference chapter has more information on this
capability. (See page 84, Save/Recall.) For information about remote control
accessories, see Appendix C: Accessories.
While working at the remote site you dis cover a control signal that you want to
capture periodically to show its long-term variation. You want to include these
waveforms in a report you are preparing back at the office.
Your desktop publishing software can import BMP graphics, so you decide to use
this format for the screen images. To setup this configuration, follow these steps:
1. Insert a USB flash drive into the USB flash drive port.
2. Push the Utility button.
3. Push the System bottom button to select Hard Copy.
4. Push the Format screen button.
5. Select BMP Mono Windows mono image file format (you may need to push
the -more-screen button several times
6. Push the Port screen button.
before you see this choice).
46 TDS3000C Series Oscilloscope User Manual
Page 67
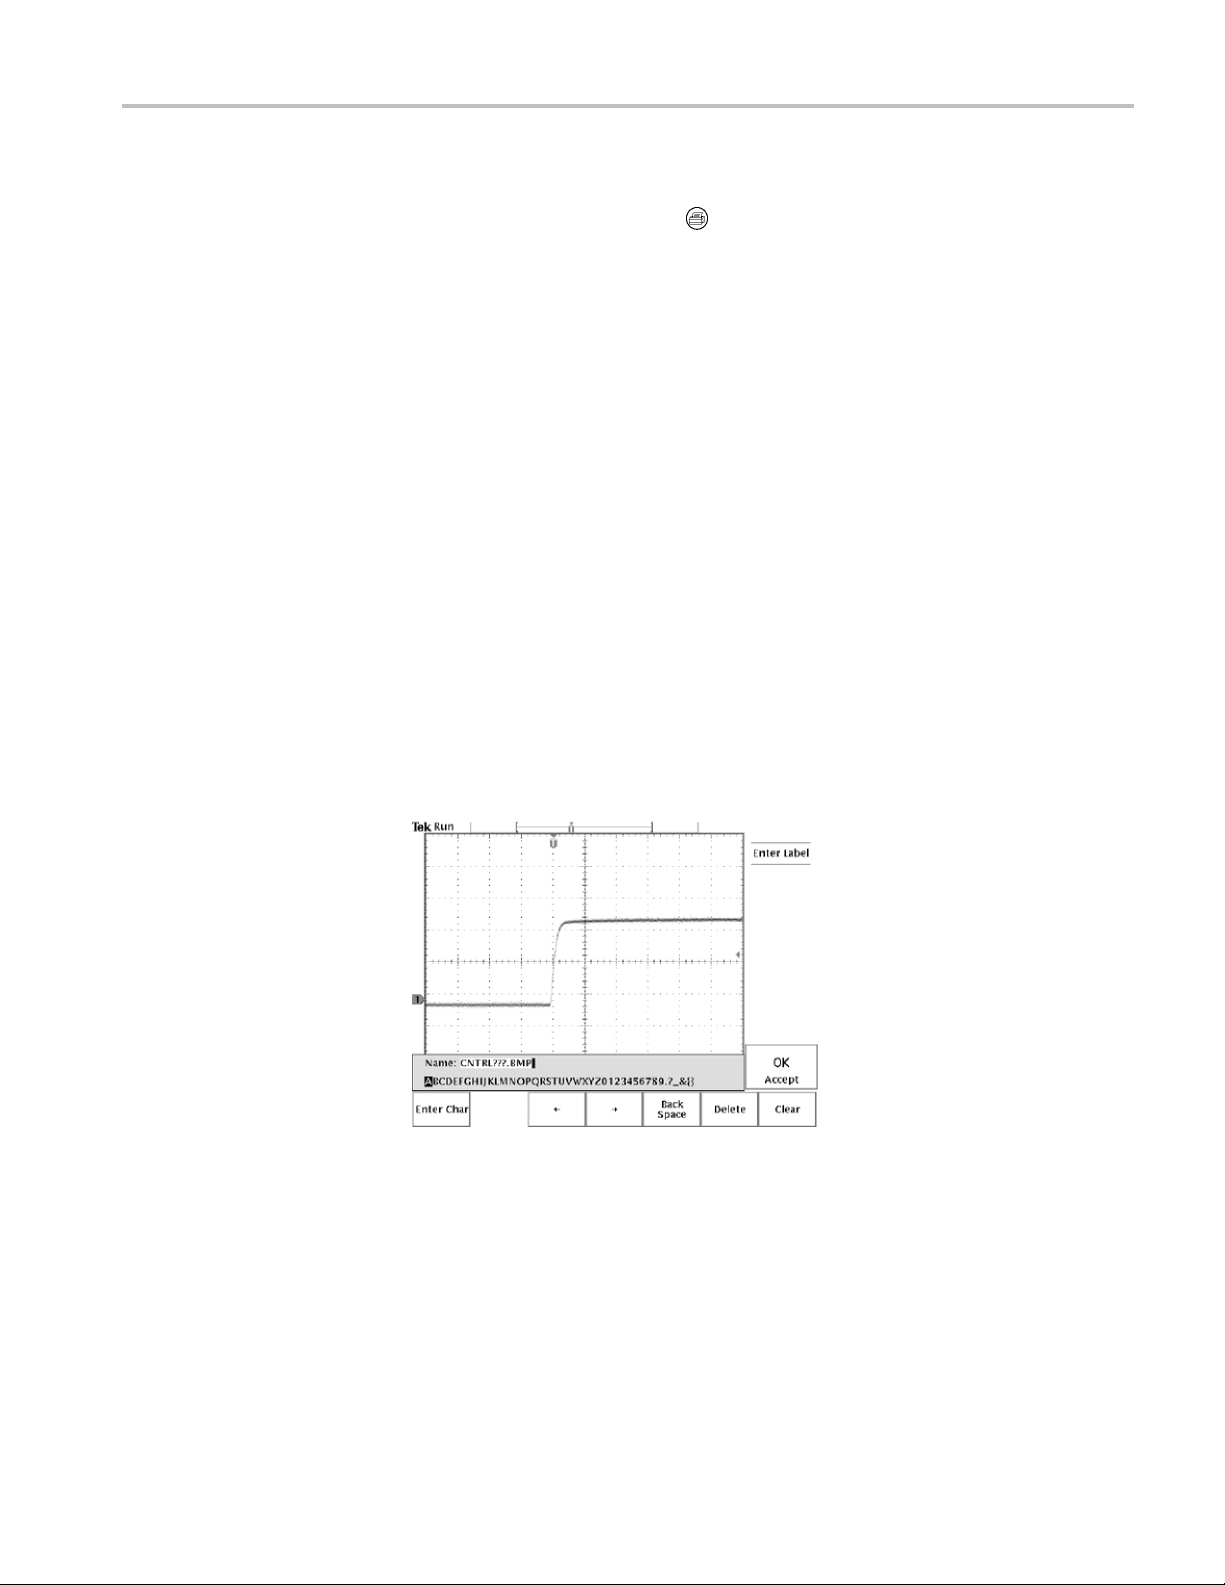
Application Examples
7. Select File to s
8. Push the hard copy button
The oscilloscope reads the flash drive directory and displays its contents.
Naming Files. You should give files descriptive names so you can recognize them
when you get back to the office. You will be saving images of the control signal
so you decid
The oscilloscope can append an automatic sequence number to the target file
name. This
the same control signal every five minutes. To set up the target file name and
automatic sequence, follow these steps:
1. Push the File Utilities bottom button.
2. Use the g
3. Select the Rename screen button.
4. Use the screen buttons to clear the existing file name and enter the new
file name CNTRL???.BMP. The question marks are placeholders for an
autom
5. Push the OK Accept screen button to setup the target base file name.
feature is convenient because you want to capture a screen image of
atic number sequence from 000 to 999.
endhardcopiestoaUSBflash drive.
to save the image.
e if CNTRL is a logical target file name to use.
eneral purpose knob to highlight the file TEK?????.BMP.
6. Push Menu Off to remove the file list from the display.
TDS3000C Series Oscilloscope User Manual 47
Page 68
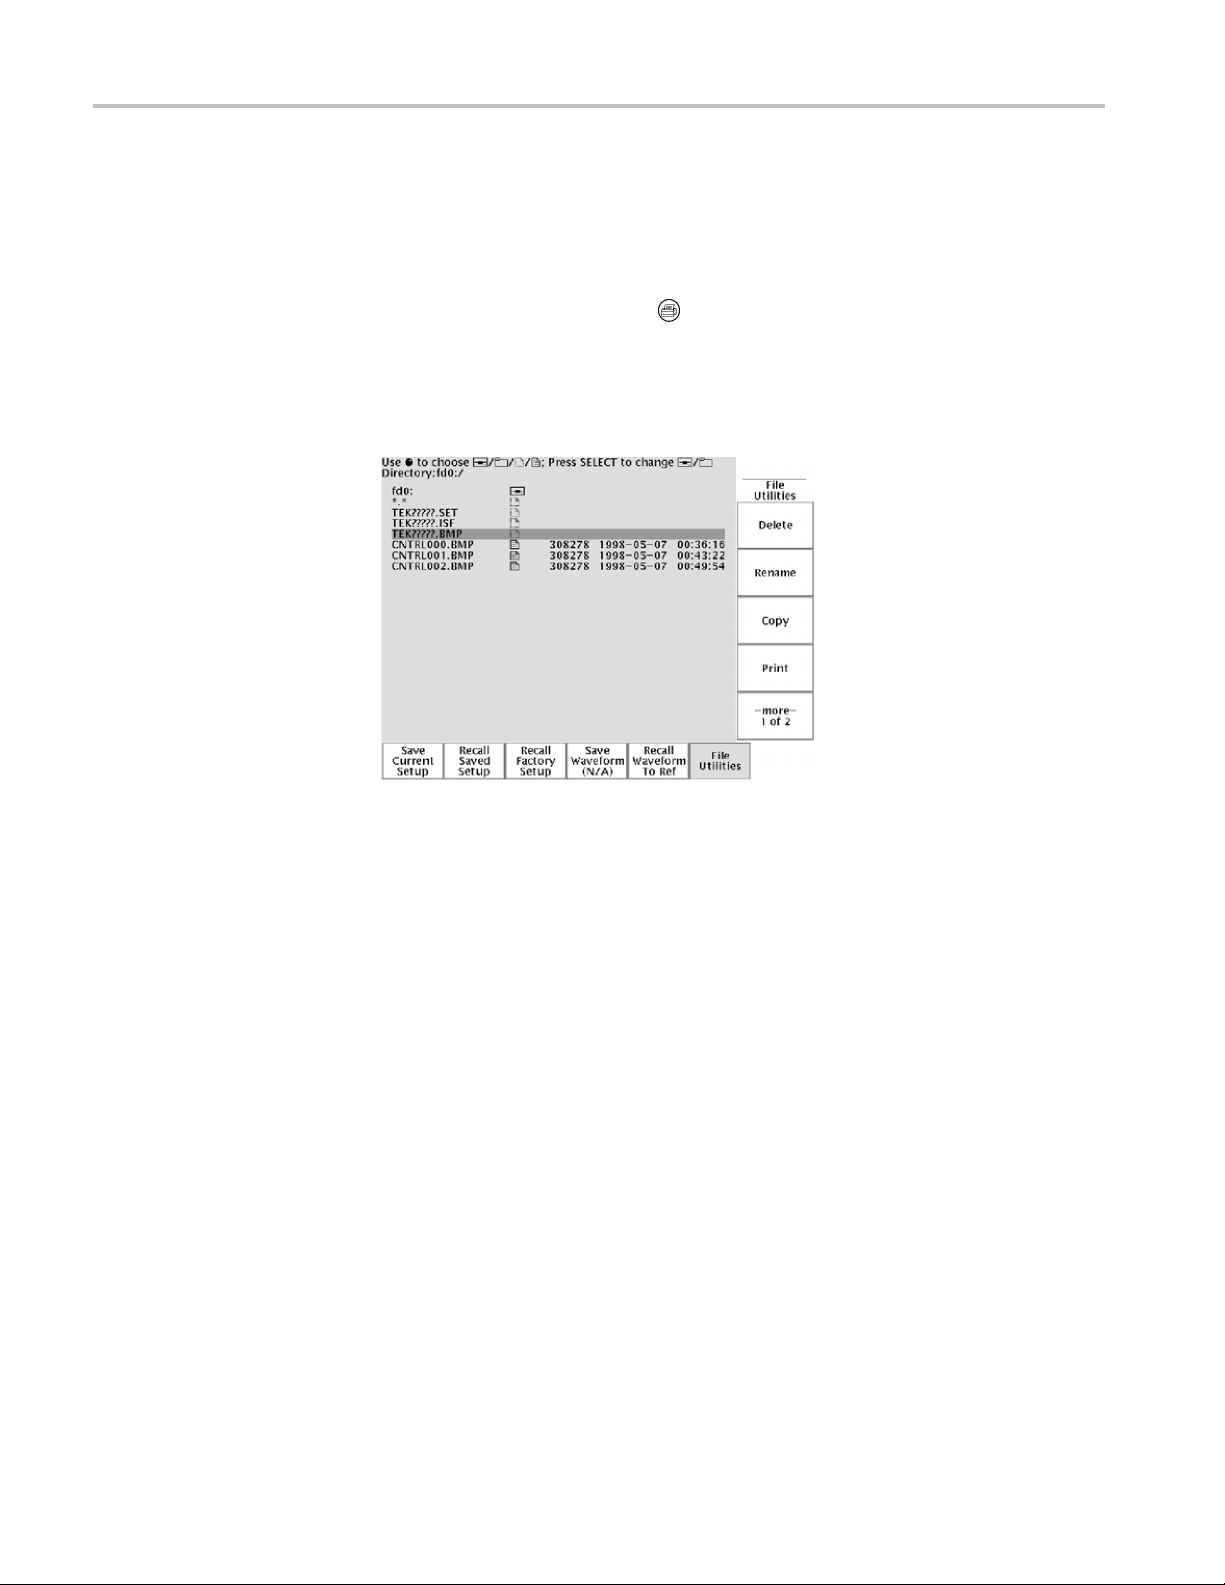
Application Examples
Running the Tes
steps:
1. Display the si
in the screen images.
2. Push the hard c opy button
3. Repeat step 2 every few minutes until you are finished with the test.
4. When you are finished, push Utility to see the list of sequential files that
have been saved.
t. To capture the control signal every few minutes, follow these
gnal, measurements, and m enus as you want them to appear
.
g Waveform Data
Savin
The files are labeled with their sequential names, as well as the time and date
each was created.
You find another signal that you want to analyze with a spreadsheet program back
at the office. To save the waveform data on a USB flash drive, follow these steps:
1. Display the signal on the oscilloscope screen.
2. Push the Save/Recall button.
3. Push the Save Waveform screen button.
lect To File.
4. Se
5. Select Spreadsheet File Format. The default target file, TEK?????.CSV, is
ow automatically highlighted.
n
6. Push the Save To Selected File screen button to save the waveform.
7. Push the File Utilities screen button to see the saved waveform file
TEK00000.CSV in the USB flash drive directory.
48 TDS3000C Series Oscilloscope User Manual
Page 69
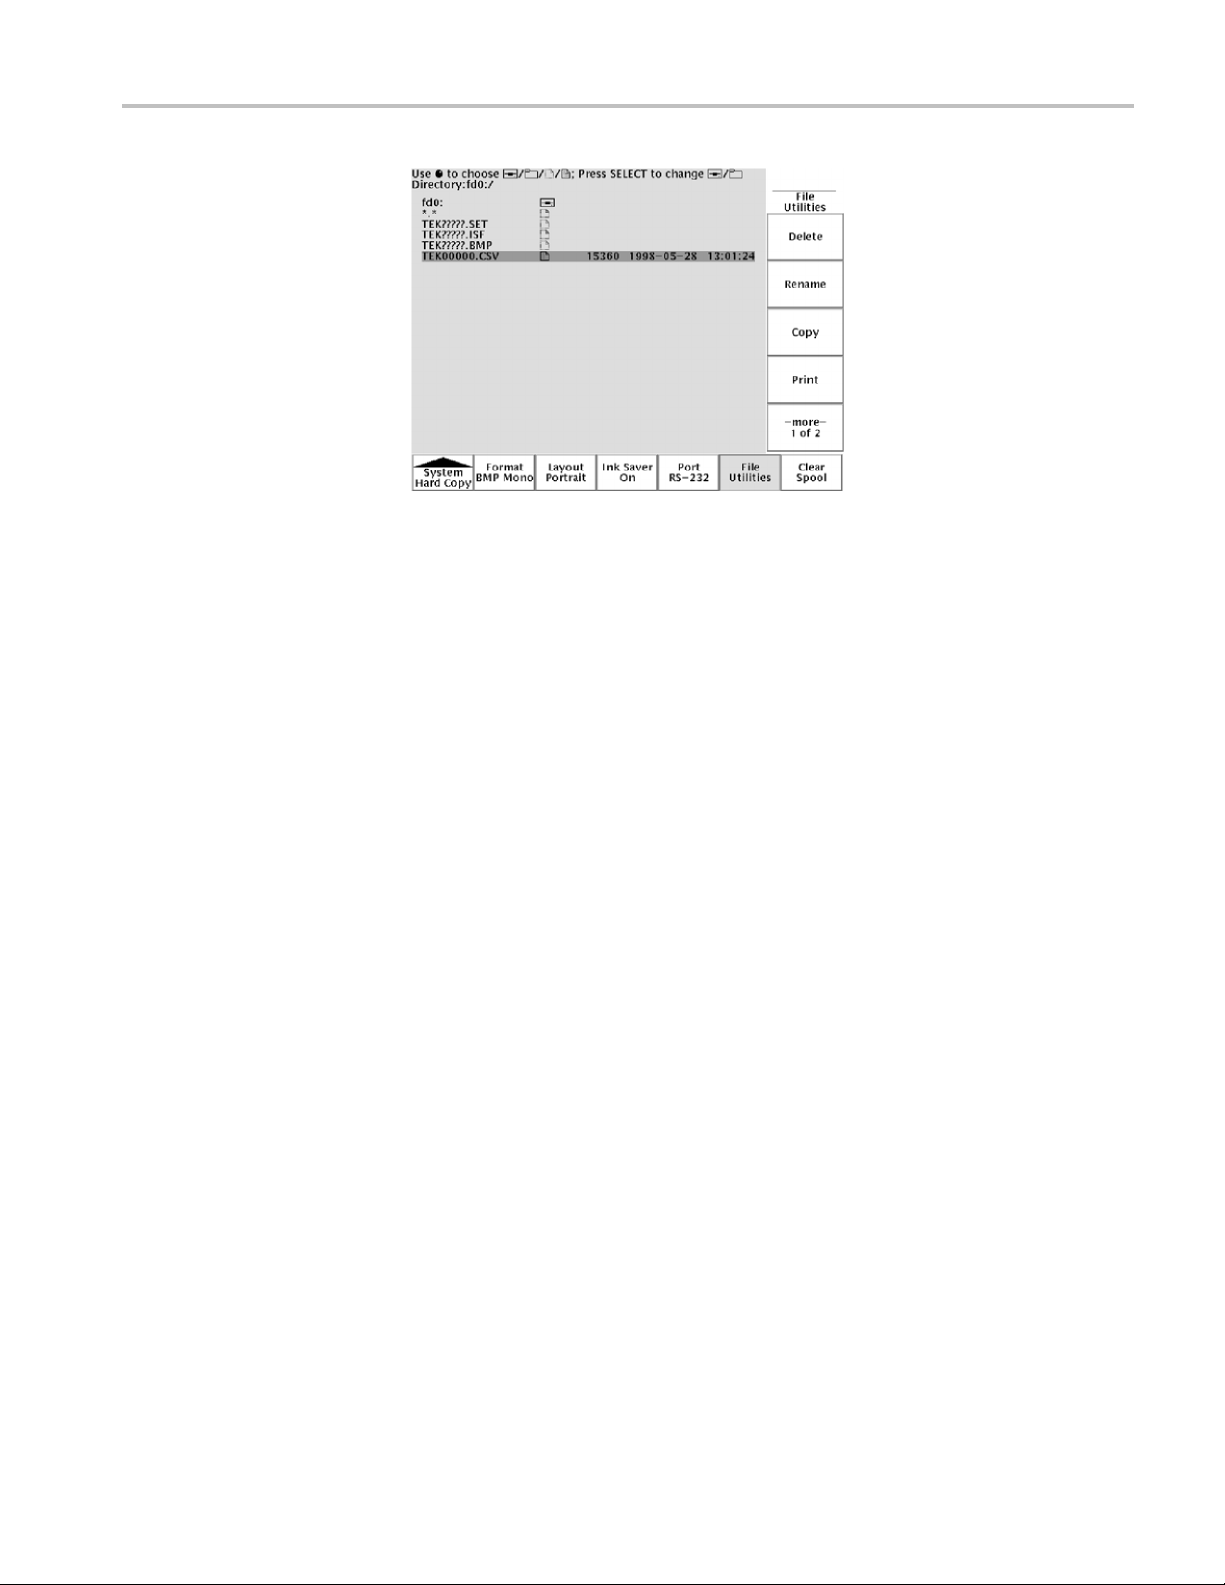
Application Examples
TDS3000C Series Oscilloscope User Manual 49
Page 70

Application Examples
50 TDS3000C Series Oscilloscope User Manual
Page 71
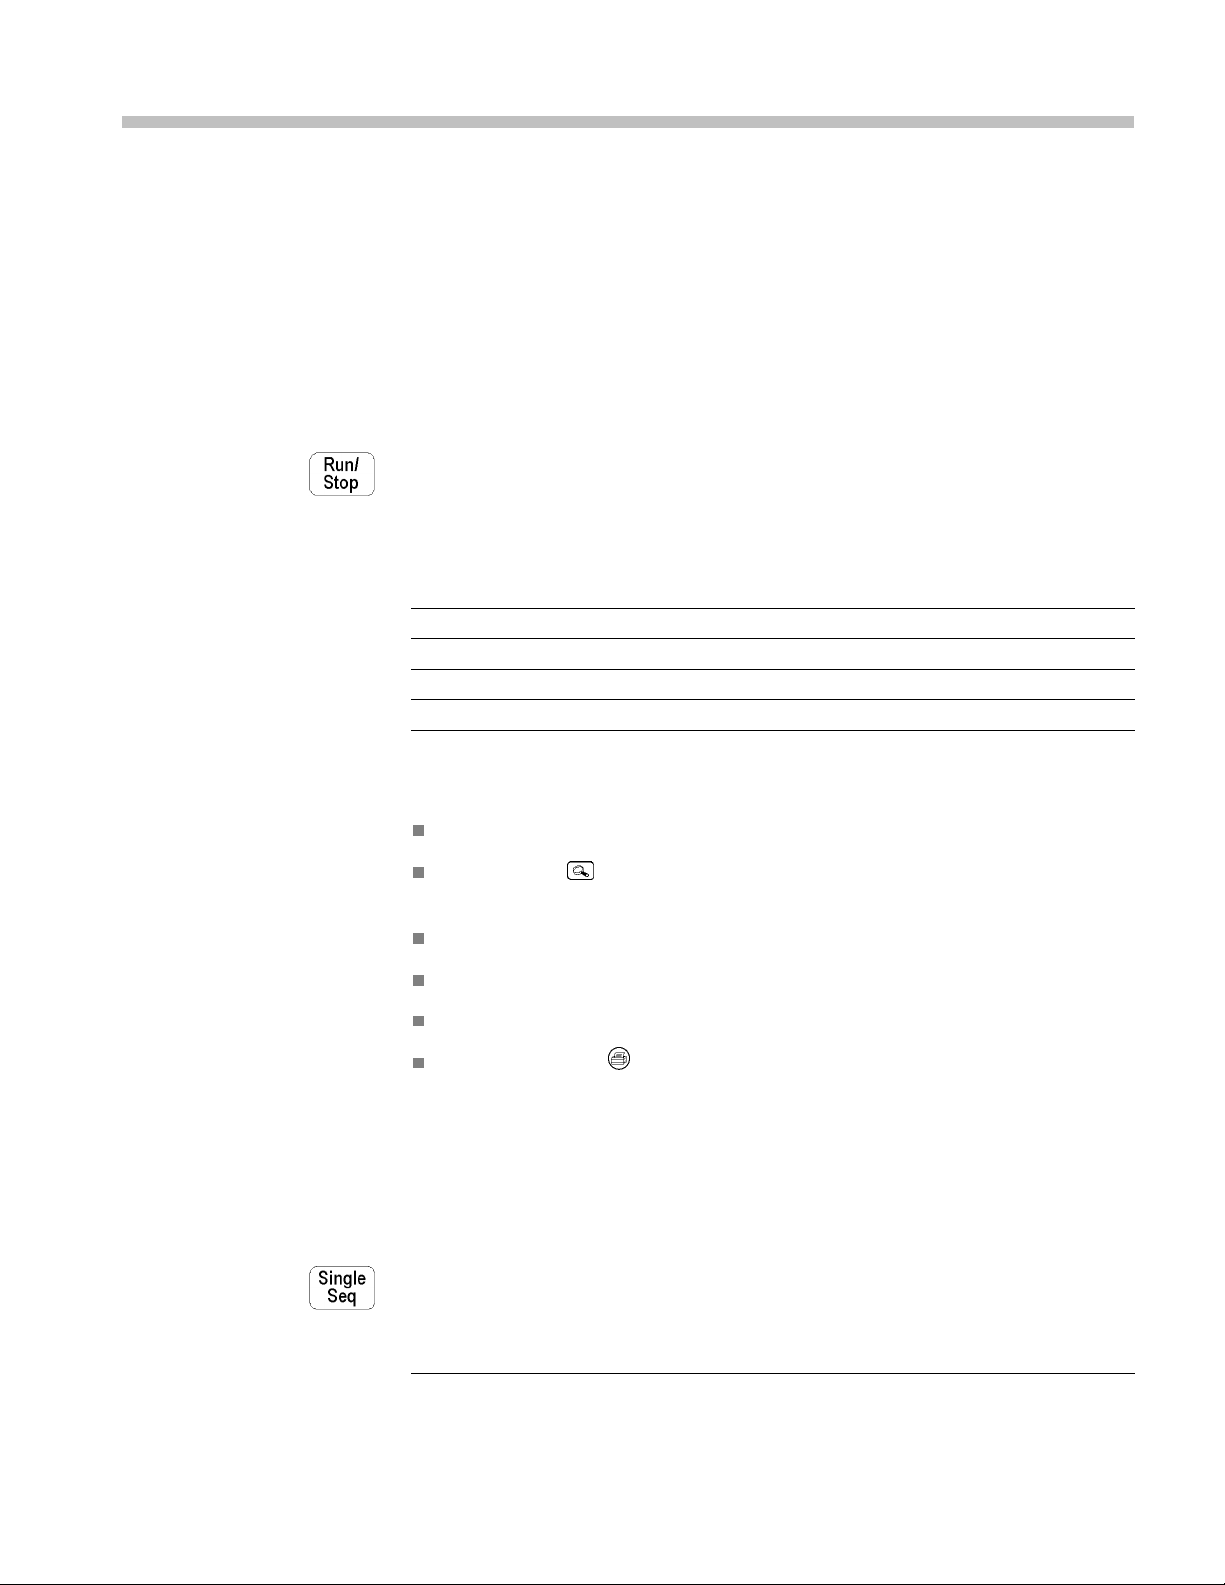
Reference
Acquisition Controls
Run/Stop Button
This chapter contains detailed information about the operation of the oscilloscope.
The topics in this chapter are arranged by front-panel button or control group
name.
Push the Run/Stop button to stop and start waveform acquisition. You can
also push Run/Stop when you want to resume continuous acquisition after a
single-sequence acquisition. A readout in the top left corner of the display shows
the status of the acquisition.
Acquisit
Run: The acquisition is running.
Roll: A roll-mode acquisition is running.
Stop:
PreVu:
While the acquisition is running or stopped, you can use these controls to examine
the waveforms:
While the acquisition is stopped, you can change the vertical and horizontal
controls to use in the next acquisition. (See page 54, Vertical and Horizontal
Preview.)
ion status readout
Channel buttons to select a channel
Zoom button with horizontal Position and Scale to magnify waveforms
(does not affect the actual time base or trigger position settings)
Waveform Intensity to adjust gray-scale level
Cursor button to activate cursors to measure waveforms
as button to select automatic measurements of waveforms
Me
Hard copy button to print a hard copy
Descript
The acq
Previewing; waiting for trigger.
ion
uisition is stopped.
Single Sequence Button
Push the Single Seq button to execute a s ingle-shot acquisition. The function of
the Single Seq button depends on the acquisition mode.
Acquisition mode Single Seq function
TDS3000C Series Oscilloscope User Manual 51
Page 72

Reference
Acquisition mode Single Seq function
Sample or Peak Detect One acquisition of each displayed channel is acquired,
concurrently
Envelope N or Average N
N acquisitions of each displayed channel are acquired
(N is adjusta
ble with the general purpose knob)
When you push the Single Seq button, the oscilloscope does the following things:
Autoset
Button
At sweep spe
eds of 20 ms/div and faster, the trigger mode is set to Normal
The trigger system arms and an LED lights next to the Single Seq button
After the single-sequence acquisition is complete, the acquisition stops and the
light next to the Single Seq button turns off.
Push the Single Seq button again to acquire a new sequence, or push the Run/Stop
button to restart continuous acquisition.
Push the Autoset button to automatically adjust the vertical, horizontal, and trigger
controls for a usable display. You can manually adjust any of these controls if you
o optimize the display.
need t
When you use more than one channel, the autoset function sets the vertical scale
ach channel and positions the channels to prevent overlapping. The autoset
for e
function selects the lowest-numbered channel in use and then uses that channel to
set the horizontal and trigger controls.
The autoset function also changes the following oscilloscope settings:
uisition mode is set to Sample
Acq
Bandwidth limits are set to Full
Zoom is turned off
Trigger is set to Auto mode and minimum holdoff
Trigger is set to Edge type, DC coupling, and rising slope
B trigger is turned off
XY display format is turned off
Channel 1 is turned on and selected if no active channels are in use
If you push the Autoset button by accident, you can undo it with these steps:
1. Push the Acquire Menu button.
2. Push the Autoset screen button and then push the Undo Autoset screen
button.
52 TDS3000C Series Oscilloscope User Manual
Page 73

Reference
Waveform Inten
sity
The Waveform Intensity knob adjusts the intensity of the waveforms in the display.
The term Digital Phosphor represents the way this control simulates the intensity
control of an analog oscilloscope. At maximum intensity, all waveform points are
displayed at full brightness. As you decrease the intensity, you can see intensity
gradingint
he waveforms. The brightest parts of the waveform are the points
most frequently acquired; the dimmer parts represent less frequently acquired
points. All points decay in intensity over time unless the display persistence
is set to infinite.
Use a medium intensity setting to g et an analog-oscilloscope view of time-varying
signals and those containing modulatio n. Use the maximum intensity setting to
view the signals the way most digital oscilloscopes display them.
You can turn on display persistence to slow or prevent the decay of the waveform
points. With persistence on, you can simulate the function of an analog storage
oscilloscope. (See page 63, Display.)
NOTE.
The waveform intensity may change when you change oscilloscope
acquisition modes or horizontal scale settings. Use the INTENSITY knob to
readjust waveform intensity.
Acquire Menu
Push the Acquire Menu button to show the Acquire menu.
tom
Bot
Mode
Horizontal
Resolution
Reset
Horizontal
Delay
e
Sid
mple
Sa
Peak Detect Detects glitches and reduces the
Envelope N
Average N Reduces random or uncorrelated
Fast Trigger (500
points)
Normal (10k points) Acquires 10,000 point waveforms
Set to 0 s
cription
Des
e for normal acquisition.
Us
ssibility of aliasing.
po
aptures variations of a signal
C
over a period of time. (Adjust N
with the general purpose knob.)
noise in the signal display. (Adjust
N with the general purpose knob.)
Acquires 500 point waveforms at a
fast repetition rate.
with more horizontal detail.
Resets the horizontal delay time to
zero.
TDS3000C Series Oscilloscope User Manual 53
Page 74

Reference
Bottom Side Description
Anomaly
ly
t
Executes the autoset function.
(Optional application modules may
add choices to
autoset functions.)
Reverts to the settings before the
last autoset.
Enables or disables the WaveAlert
function. (See page 58, WaveAlert
Waveform An
the general purpose knob to set
ity from 0% (least sensitive)
sensitiv
to 100% (most sensitive).
When On, the oscilloscope beeps
when it detects a waveform
anomaly
When On
waveform acquisition when there
is a waveform anomaly on any
channe
anomalies remain displayed on the
screen.
When On, the oscilloscope sends
an ima
copy device or USB flash drive file
when there is a waveform anomaly
on an
When
the anomalous waveform(s) data
to a file on a USB flash drive.
Highlights the entire anomalous
waveform.
in a waveform.
on any active channel.
, the oscilloscope stops
l. The input waveforms and
ge of the screen to the hard
y channel.
On, the oscilloscope saves
Autoset
WaveAlert
Normal Autose
Undo Autoset
Wfm Anomaly
Detection
On Off
Sensitivity nn.n% Sets the WaveAlert sensitivity. Use
Beep On Anomaly
On Off
Stop On
On Off
Hard Copy On
Anoma
On Off
To Di s k On
Wfms
Anomaly
On Off
Highlight Entire
Wfm
Highlight Anomalies Highlights just the anomalous data
execute specialized
omaly Detection.)
Key Poin ts
Vertical and Horizontal Preview. The vertical and horizontal preview functions let
you change the vertical and horizontal controls while the acquisition is stopped or
hile it is waiting for the next trigger. The oscilloscope rescales and repositions
w
the current acquisition in response to the new control settings, and then uses the
new settings for the next acquisition.
Preview helps you optimize these control settings before the next acquisition; this
makes it easier to work with signals that are single-shot or have a low repetition
rate. (Seepage116,Vertical Preview.) (See page 71, Horizontal Zoom and
Preview.)
54 TDS3000C Series Oscilloscope User Manual
Page 75
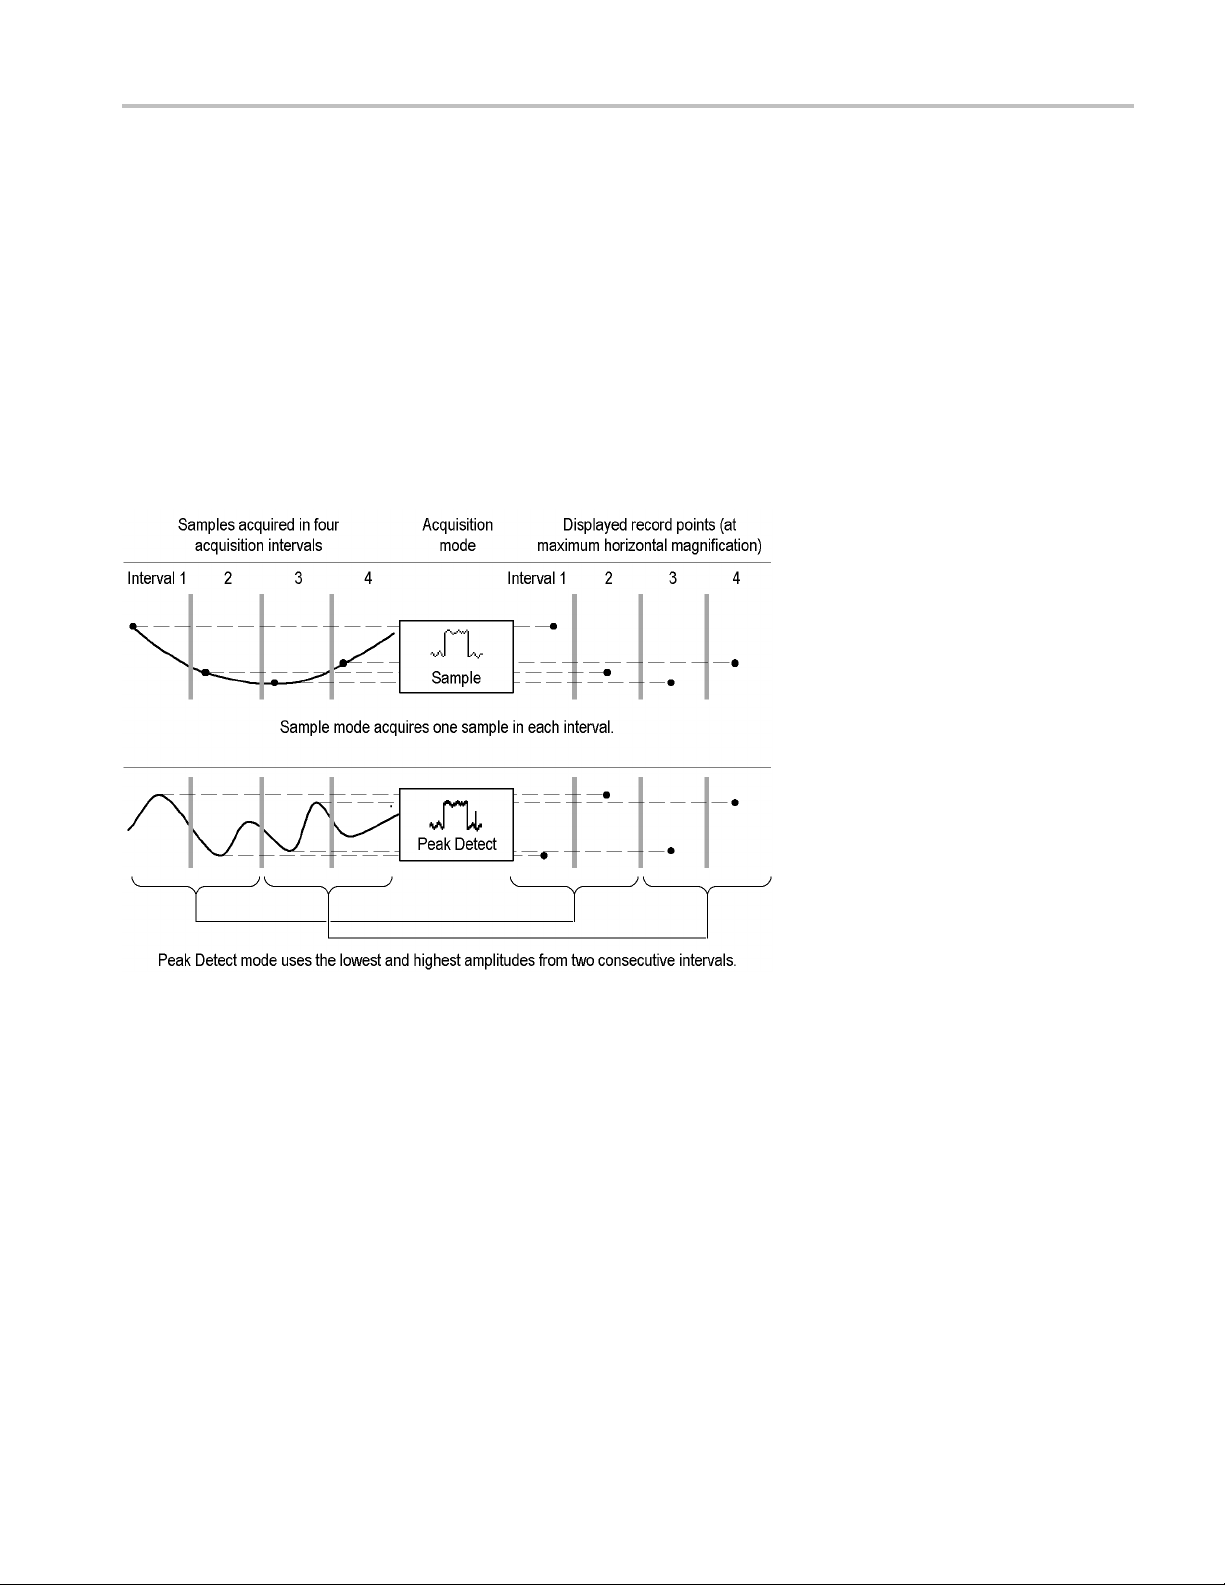
Reference
While the acqui
changes will only take affect with the next acquisition. There is no preview for
control changes other than the vertical and horizontal controls.
The preview functions also do not affect automatic measurements, cursor
measurements, or the Math waveform. This data for these functions is always
based on the current acquisition. If you rescale or reposition a channel waveform
horizontally, it may not appear time-correlated to the automatic measurements,
cursor measurements, or the Math waveform.
Acquisition Modes. You can choose one of four acquisition modes: Sample, Peak
Detect, Envelope, or Average. The next few pages describe these acquisition
modes in detail.
sition is stopped you can make changes to other controls, but those
Sample. Use Sample acquisition mode for the fastest acquisition at any SEC/DIV
ting. Sample mode is the default mode.
set
Peak Detect. Use Peak Detect acquisition mode to limit the possibility of aliasing.
Also, use Peak Detect for glitch detection. You can see glitches as narrow as 1 ns.
Peak Detect is only functional for sample rates up to 125 MS/s. For 250 MS/s and
faster sample rates, the oscilloscope reverts to Sample acquisition mode, where
the narrowest detectable pulse width is 1/(sample rate).
TDS3000C Series Oscilloscope User Manual 55
Page 76

Reference
Envelope. Use Envelope acquisition mode to capture the minimum and maximum
extremes of a signal over a specified number of acquisitions (N). The enveloped
wavefor
m data acquisition clears and then starts over after each N acquisitions. If
you push the Single Seq button, envelope acquisition stops after N acquisitions.
Use the general purpose knob to set the number of acquisitions.
Average. Use Average acquisition mode to reduce random or uncorrelated noise
in the signal you want to display. The averaged waveform is a running average
over a
specified number of acquisitions (N). If you push the Single Seq button,
average acquisition stops after N acquisitions. Use the general purpose knob to
set the number of acquisitions.
If you probe a noisy square wave signal that contains intermittent, narrow glitches,
the waveform displayed will vary depending on the acquisition mode you choose.
Sample
Envelope Average
Peak Detect
56 TDS3000C Series Oscilloscope User Manual
Page 77

Reference
Acquisition Re
solution. You can choose either Normal or Fast Trigger acquisition
resolution. This setting determines the record length that is acquired and affects
the other factors shown in the next table.
Factor Normal Fast trigger
Record length 10,000 points 500 points
Maximum acqu
Maximum hor
isition rate
izontal zoom
700 waveforms/s 3,400 waveforms/s
200X 10X
Choose Normal or Fast Trigger acquisition resolution based on the characteristics
of the signal you want to acquire.
Signal ch
Large amo
Shape is stable or changes relatively slowly
Single shot
High trigger repetition rate
Shape changes rapidly
Contai
aracteristic
unt of horizontal detail
ns modulation
Better ch
Normal
Fast Trigger
oice
TDS3000C Series Oscilloscope User Manual 57
Page 78

Reference
WaveAlert Wave
form Anomaly Detection. WaveAlert provides a way to detect
when a waveform deviates from a steady-state condition. WaveAlert monitors
the current waveform acquisition and compares it to the previous DPO waveform
acquisitions, using a sensitivity value to adjust the comparison tolerance. If the
current acquisition exceeds the comparison tolerance, the oscilloscope considers
the current acquisition as an anomaly.
Anomaly
The osc
illoscope can respond to an anomalous waveform by stopping acquisitions,
emitting a beep, saving the anomalous waveform to a USB flash drive file,
printing the screen image to a hard copy device, or any combination of the above.
You can also select to highlight just the anomalous data in a waveform, or the
entire anomalous waveform.
To use WaveAlert, follow these steps:
1. Display the waveform or waveforms on the screen.
2. Push the Acquire Menu front-panel button.
3. Pus
htheWaveAlert bottom button.
4. Push the Wfm Anomaly Detection side button to select On.
5. Push -more-1of2andthentheHighlight Anomalies side button to select
On.
6. Push -more-2of2andthentheSensitivity side button.
7. Use the general purpose knob to set the comparison sensitivity value. As
signal noise and intensity levels affect the displayed waveform, you will
need to experiment with the sensitivity setting to reduce the number of false
anomalies due to signal noise.
8. Use the Waveform Intensity front-panel button to adjust the persistence
of the anomaly waveform.
58 TDS3000C Series Oscilloscope User Manual
Page 79
Reference
9. Once you have se
push one or more side menu buttons to select the actions to perform when
the oscilloscope detects an anomaly.
10. To restart WaveAlert while in Stop On Anomaly, push the Acquire Run/Stop
front panel button.
WaveAlert Key Points.
You can use WaveAlert to monitor up to four waveforms or DPO Math
waveforms. However, adjacent waveforms can not touch or overlap on the
screen.
To increase your chances of capturing an anomaly by acquiring the maximum
number of waveforms per second, set Acquire > Horizontal Resolution to
Fast Trigger (500 points).
When WaveAlert is on, the front-panel Waveform Intensity knob controls
the persistence of the anomalous waveform instead of waveform intensity.
To capture a very random event (minutes to hours), enable the Wfms To Disk
On Anomaly function to write anomalous w aveform data to a USB flash
file in .isf format. The number of filesyoucansavedependsonthe
drive
waveform record length. You can determine when the anomaly occurred by
checking the file create date and time.
t the sensitivity value to reduce or eliminate false anomalies,
Cursor
YT Cursor Menu
You can use WaveAlert on DPO math waveforms.
nging the vertical or horizontal oscilloscope settings does not affect the
Cha
sensitivity setting. The sensitivity is calculated from the new waveform data
after changing the oscilloscope settings.
Cursors are on-screen markers that you position to take waveform measurements.
There are two cursor types: YT cursors and XY cursors. (See page 62, XY Cursor
Menu.)
The following YT cursor menu items are available while you are in YT display
mode (Display > XY Display > Off (YT)). Push the Cursor button to show the
cursor menu.
Bottom Side Description
TDS3000C Series Oscilloscope User Manual 59
Page 80

Reference
Bottom Side Description
Function
Mode
VBar
Units
H Bar
its
Un
Off Turns cursors off.
H Bars Use to make ver
V Bars Use to make both vertical and horizontal
measurement
Bring Selec
Cursor to
Center Screen
Bring Both
Cursors On
Screen
Independent
Tracking
Sec (s) / 1/sec
(Hz)
Ratio (%) Sets V Bar measurement units to
Phase
Use Cursor
Positions as
%/°
Use 5 divs as
%/°
Base
atio (%)
R
Use Cursor
Positions as
100%
Use 5 divs as
100%
ted
(°)
Moves the active cursor to center
screen.
Moves any off-screen cursor onto the
screen.
Sets curs
Sets curs
cursor 1 is selected.
Sets horizontal units to seconds or
frequency (Hz).
percen
Sets V
degrees.
Sets the V Bar measurement scale so
that 0% or 0° is the current position of
the l
is the current position of the right V Bar
cursor.
Sets the V Bar measurement scale so
tha
360°, where 0% or 0° is -2.5 divisions
and 100% or 360° is +2.5 divisions
fro
Se
as the selected w aveform’s vertical
measurement units (volts, IRE, dB, and
so
S
Sets the H Bar measurement scale so
that 0% is the current position of the
lowest H Bar cursor and 100% is the
current position of the highest H Bar
cursor.
Sets H Bar measurement scale so
that 5 screen major divisions is 100%,
where 0% is -2.5 divisions and 100% is
+2.5 divisions from the center horizontal
graticule.
ors to move independently.
ors to move together when
t.
Bar measurement units to
eft V Bar cursor and 100% or 360°
t 5 screen major divisions is 100% or
m center vertical graticule.
ts the H Bar units to be the same
on).
ets H Bar units to percent.
tical m easurements.
s.
60 TDS3000C Series Oscilloscope User Manual
Page 81
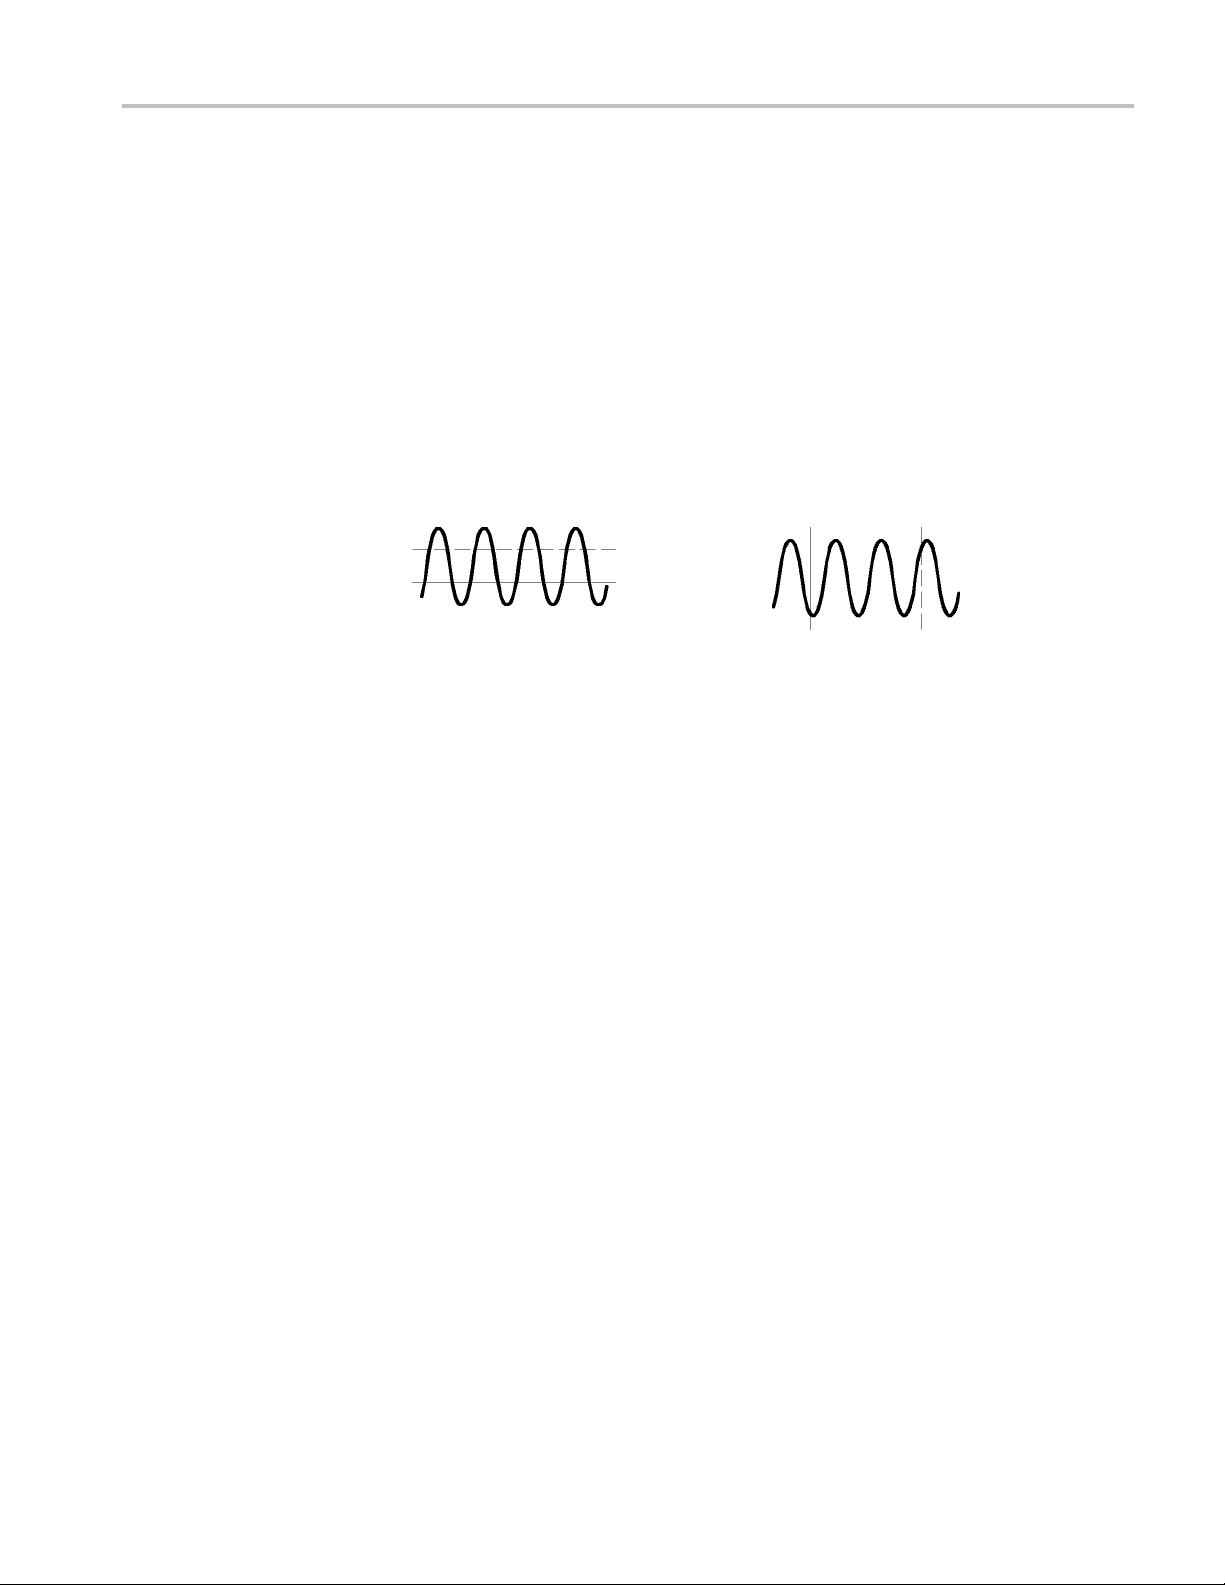
Reference
Key Points
Cursor Movemen
t. Use the general purpose knob to move the active cursor. Push
the Select button to change which cursor is active. The active cursor is the solid
line.
Faster Cursor Movement. Push the Coarse button to set the general purpose knob
to make faster cursor movement.
Finding Cursors. When using zoom, delay, or the fastest time base settings, the
cursors can go off screen. If you w ant to find them, use the Bring Both Cursors
On Screen function to move them onto the screen.
Fine Cursor Movement. When you magnify the waveform with the zoom function,
you can easily set the cursor to any point on the waveform.
Δ4.16V
@-1.78V
Horizontal bar cursors Vertical bar cursors
Δ6.32V
@3.16V
Δ5.86μs
@1.06μs
Δ Readout. The Δ readouts indicate the difference between the cursor positions.
@ Readout. For H Bar or V Bar cursors, the voltage readout after the @ symbol
indicates the location of the active cursor relative to zero volts. For V Bar cursors,
the time readout after the @ s ymbol indicates the location of the active cursor
relative to the trigger point.
Cursor Interaction with Preview. If you change a vertical or horizontal control
setting while acquisition is stopped or it is waiting for trigger, the cursors move
with the waveforms and cursor measurements remain valid.
Taking Gray-Scale Measurements. Using cursors is often the best way to
mple measurements on waveforms that contain significant gray-scale
take si
information. The automatic measurements operate only on the latest acquisition,
not on the previous acquisitions that are displayed in gray scale. However, you
can set the cursors to surround and measure the gray-scale area of the waveform.
CursorsatSamePosition. If both cursors are at the same position, and H Bars or
V Bars are set to Ratio or Phase, both cursors are set to 0% (or 0°). 100%/360° is
set to one pixel width away from the cursor position.
V Bars and FFT. When the selected waveform is an FFT waveform, selecting V
Bars and Phase sets the measurement to percent.
Tracking Mode. In cursor tracking mode, both cursors move together when cursor
1 is selected. Enabling tracking mode automatically selects cursor 1 as the active
cursor. If cursor 2 is selected while in tracking mode, only cursor 2 will move.
TDS3000C Series Oscilloscope User Manual 61
Page 82

Reference
XY Cursor Menu
The following XY cursor menu items are available while you are in XY display
mode (Display > XY Display > Triggered XY). Push the Cursor button to show
the cursor me
Bottom Side Description
Function
Mode
nu.
Off Turns cursors off.
Waveform Turns waveform cursors on and
displays measurements in rectangular
format (X and Y values). Use the
front-panel Select button to select
whichcursortomove(theactive
cursor). Use the general purpose knob
to move the active cursor.
Independent
Tracking
Sets cursors to move independently.
Sets cursors to move together when
the reference cursor is selected.
Key Poin ts
NOTE. The Advanced Analysis application module (TDS3AAM) adds more XY
cursor features, including graticule cursors and polar readouts.
XY Waveform Cursors. To turn off the XY waveform cursor measurement, push
the front panel Cursor button, then push the Cursor Function Off side menu
button.
Measurements. The XY waveform cursor measurements show difference (Δ)and
absolute (@) values for the X axis, the Y axis, and the time of the active cursor.
ΔX: 1.43V
ΔY: 2.14V
Δt: -660ns
@X: -140mV
@Y: 480mV
@t: 1.61ms
There are two waveform cursors; a reference cursor , and a delta cursor .
All difference (Δ) measurements are measured from the reference cursor to
the delta cursor. A negative ΔX measurement means that the delta cursor is
positioned earlier in the waveform record than the reference cursor. A negative
ΔY measurement means that the delta cursor is positioned at a lower Y waveform
signal level than the reference cursor.
All absolute ( @) measurements are referenced to the XY waveform’s 0, 0 origin,
and show the value of the active cursor.
0, 0 Origin. The XY waveform origin is the 0 volt point of each source waveform.
Positioning both source waveform 0 volt points on the vertical center graticule
places the origin in the center of the screen.
62 TDS3000C Series Oscilloscope User Manual
Page 83

Reference
Display
Switching Betw
een XY and YT. You can switch between XY and YT display mode
to see the location of the cursors in the YT waveform. The waveform record
icon at the top of the graticule also shows the relative cursor positions in the
waveform record.
Waveform Sources. You can use XY cursors on active acquisitions, single
sequence ac
quisitions, and reference waveforms. You need to store both XY
source waveforms in order to recreate an XY waveform. The X axis waveform
must be stored in Ref1.
Push the Display button to show the display menu.
Bottom Side Descript
m
Wavefor
Display
Backlight
nsity
Inte
Graticule Full, Grid,
XY
Display
Color
Palette
Dots Onl
Persis
Set to Auto Sets the Waveform Intensity knob to
Clear
Pers
High
Medium
Low Use to extend battery-operation time.
Cr
Frame
Off (YT) Turns off an XY display.
T
G
Ch1 (X) Versus Sets Ch2, Ch3, or Ch4 as the Y channel
Ref1 (X)
Versus
Gated By
Normal
Monochrome
y
tTime
istence
oss Hair,
riggered XY
ated XYZ
Set to on
see dots and vectors.
Sets persist time.
control the persistence time.
Clears any displayed persistence.
Use f
Use
Sets the graticule type.
T
Turns on gated XY display. Displays XY
s
a set level. Only available on 4-channel
instruments.
versus Ch1 as X.
Sets Ref2, Ref3, or Ref4 as the Y
channel versus Ref1 as X.
Sets Ch2, Ch3, or Ch4 as the Z-channel
gate source, and sets the gating
channel threshold level.
Selects the color display.
Sets all waveforms to high-contrast
black and white.
ion
to see dots only. Set to off to
or bright ambient conditions.
for dim ambient conditions.
urns on triggered XY display.
ignals when Z-channel signal is above
TDS3000C Series Oscilloscope User Manual 63
Page 84

Reference
Key Poin ts
Waveform Dots a
samples can be filled; increase the Waveform Intensity control to increase the
amount of vector fill between samples. The vector fill is most visible on fast signal
edges or when the horizontal zoom
Turn Dots Only on if you want to see just the actual samples.
Waveform Persistence. Turn on waveform persistence to slow the decay of
waveform points. You can set the persistence to a specific time or to infinite.
Infinite pe
control setting that erases the display.
Display Colors. The channel buttons, waveforms, icons, and readouts are
color-codedtohelpyouidentifythemeasily. The colors are preset and cannot be
adjusted. However, you can select the Monochrome Color Palette if you prefer to
see all t
XY Waveform Triggering. The XY waveform is triggered so you can synchronize
periodic input signals to the XY waveform. This feature is useful when only
one part of the period contains valid information that you want to see in the XY
format. Set the time b ase and trigger location to acquire just that part of the period.
When you want to see the complete period of the signals regardless of the time
base setting, set the trigger source to an unused channel and the trigger mode
to Au
he waveforms in high-contrast black and white.
to.
nd Vectors. With Dots Only set to off, the vectors between
is turned on.
rsistence keeps all waveform points in the display until you change a
XY Waveform Scale and Position. If you want to display channel 1 in the
horizontal axis versus channel 3 in the vertical axis, for example, use these
controls to scale and position the XY waveform:
Push the channel 1 button and use the vertical Scale and Position controls to
set the horizontal scale and position of the XY waveform.
Push the channel 3 button and use the vertical Scale and Position controls to
set the vertical scale and position of the XY waveform.
XY Waveform Restrictions. The math waveform, zoom, and autoset functions do
not work in the XY display format. All reference waveforms displayed in XY
format must have the same record length, 500 or 10,000 points.
Gated XYZ. Displays XY signals only when the Z (gating) channel is true. Gated
XYZ is similar to analog oscilloscope modulated XYZ mode except that the
displayed XY signal is either on or off; there is no intensity modulation. Gated
XYZ is useful for showing constellation diagrams.
64 TDS3000C Series Oscilloscope User Manual
Page 85

Reference
Hard Copy
Connecting a Printer
SettingUptoPrint
Push the Gated B
general purpose knob sets the Z-channel threshold level. Z-channel signals above
the set threshold are true and open the XY signal gate; Z-channel signals below
the set threshold are false and close the XY signal gate. The gating channel is
always a high-true logic; to emulate a low-true gating logic, use the Vertical menu
to invert the Z-channel signal.
XY and XYZ Cursors. (See page 62, XY Cursor Menu.)
Push the hard copy button at the left of the display to make a hard copy. You
canalsostorehard-copyimagesonaUSBflash drive (in normal or compressed
format) and then transfer them later to a PC for printing or use in a report.
Use the rear-panel RS-232 (available on the optional communication module), or
Ethernet port to connect your oscilloscope to a printer.
To set up the oscilloscope to print a hard copy, follow these steps:
1. Push the Utility menu button.
y Screen button to Select the Z (gate) Source Channel. The
Key Points
2. Push the System bottom button to select Hard Copy.
3. Push the Format screen button and then choose the printer format appropriate
for your application.
4. Push the Options screen button to select the image orientation (portrait or
landscape) as well as turn on or off hard copy file compression.
5. Push the Ink Saver screen button and select On for most applications. If you
want the hard copy colors to be the same as the screen colors, you can select
Off. (Seepage66,Ink Saver and Preview.)
6. Push the Port screen button and select the port that your printer is connected
to, or select File to save the hard copy on a USB flash drive. (See page 86,
Using a USB Flash Drive.)
7. Push the hard copy button
Printer Formats. The oscilloscope supports the following printers and file formats.
Format Description
Thinkjet HP monochrome ink-jet printer
Deskjet mono HP monochrome ink-jet printer
Deskjet color HP color inkjet printer
Laserjet HP monochrome laser printer
.
TDS3000C Series Oscilloscope User Manual 65
Page 86

Reference
Format Description
Epson
TIFF
Interleaf *.img Interleaf image object file format
RLE color
PCX mono PC Paintbrush monochrome image file format
PCX color PC Paintbrush color image file format
BMP mono
BMP color
EPS mono Encapsulated PostScript monochrome image
EPS color Encapsulated PostScript color image
Jet
Bubble
445
DPU-3
PNG color Portable Network Graphics color image
Copy File Compression. When compression is set to On, the oscilloscope
Hard
Epson 9-pin an
printers
*.tif Tag image file format
Windows color image file format
Windows monochrome image file format
Windows color image file format
Canon BJC-50, BJC-80 color printers
Seiko DPU-3445 thermal printer
d 24-pin dot matrix printers, C60 and C80 inkjet
compresses the h ard copy data, using the current printer format, into a gnuzip file
format, with the extension .gz.The.gzfiles can be decompressed using PKZIP
or WinZip programs.
Color and Gray-Scale Printing. You can print a color hard copy that uses the
splay colors. Gray-scale waveform information is printed as shades of color.
di
If you have a Deskjet or Laserjet monochrome printer, gray-scale waveform
information is printed as a dithered image.
Ink Saver and Preview. As an alternative to printing the display colors, turn
on the Ink Saver function to print a hard copy with a white background. This
function saves printer ink while it preserves the color coding of the waveforms
and readouts, except for channel 1. Because yellow ink is hard to see on white
paper, Ink Saver prints channel 1 using a dark blue ink. Ink saver also works
with the monochrome print formats.
Push and hold the Preview screen button to show how the colors will appear
on the paper.
Clear Spool. You can push the Clear Spool screen button to empty the print
spooler to stop a hard copy operation in progress, if the hard copy port connection
is not made due to incompatible settings (such as b aud rate), or if you lose the
hard copy port connection before the hard copy is complete.
66 TDS3000C Series Oscilloscope User Manual
Page 87

Reference
Horizontal Controls
Date and Time St
follow these steps:
1. Push the Utili
2. Push the System bottom button to select Config.
3. Push the Set Date & Time bottom button.
4. Set the Display Date/Time to On to add the current date and time to the
display screen.
5. Push the Menu Off button.
Printer Error Message. To avoid printer errors, always power on the printer and
allow it t
If you see a ’Hard copy device not responding’ error message, power the
oscilloscope off and then back on, and try to print again. If the printer still does
not work, check that the printer is online, you have selected the correct printer
format on the oscilloscope, there are no paper jams, and that the printer cable is
firmly connected to the printer and oscilloscope.
o complete its initialization process before powering on the oscilloscope.
amp. To print the current date and time on your hard copies,
ty button.
Horizontal Position Control
Use the horizontal controls to adjust the time base, adjust the trigger location, and
amine waveform details more closely.
to ex
When delay is off, the horizontal Position control moves the trigger point within
acquired waveforms. You can select full pretrigger, full posttrigger, or any
the
point in between.
e a pretrigger setting (trigger position near 100% of the record) to acquire
Us
waveforms leading up to a trigger event. For example, if you can trigger on an
error condition, the waveforms leading up to the error condition might tell you
why the error occurred.
Use a p osttrigger setting (trigger position near 0% of the record) when you want
to acquire waveforms that follow a trigger event. Use a mid-screen setting when
you are interested in information both before and after the trigger event.
TDS3000C Series Oscilloscope User Manual 67
Page 88
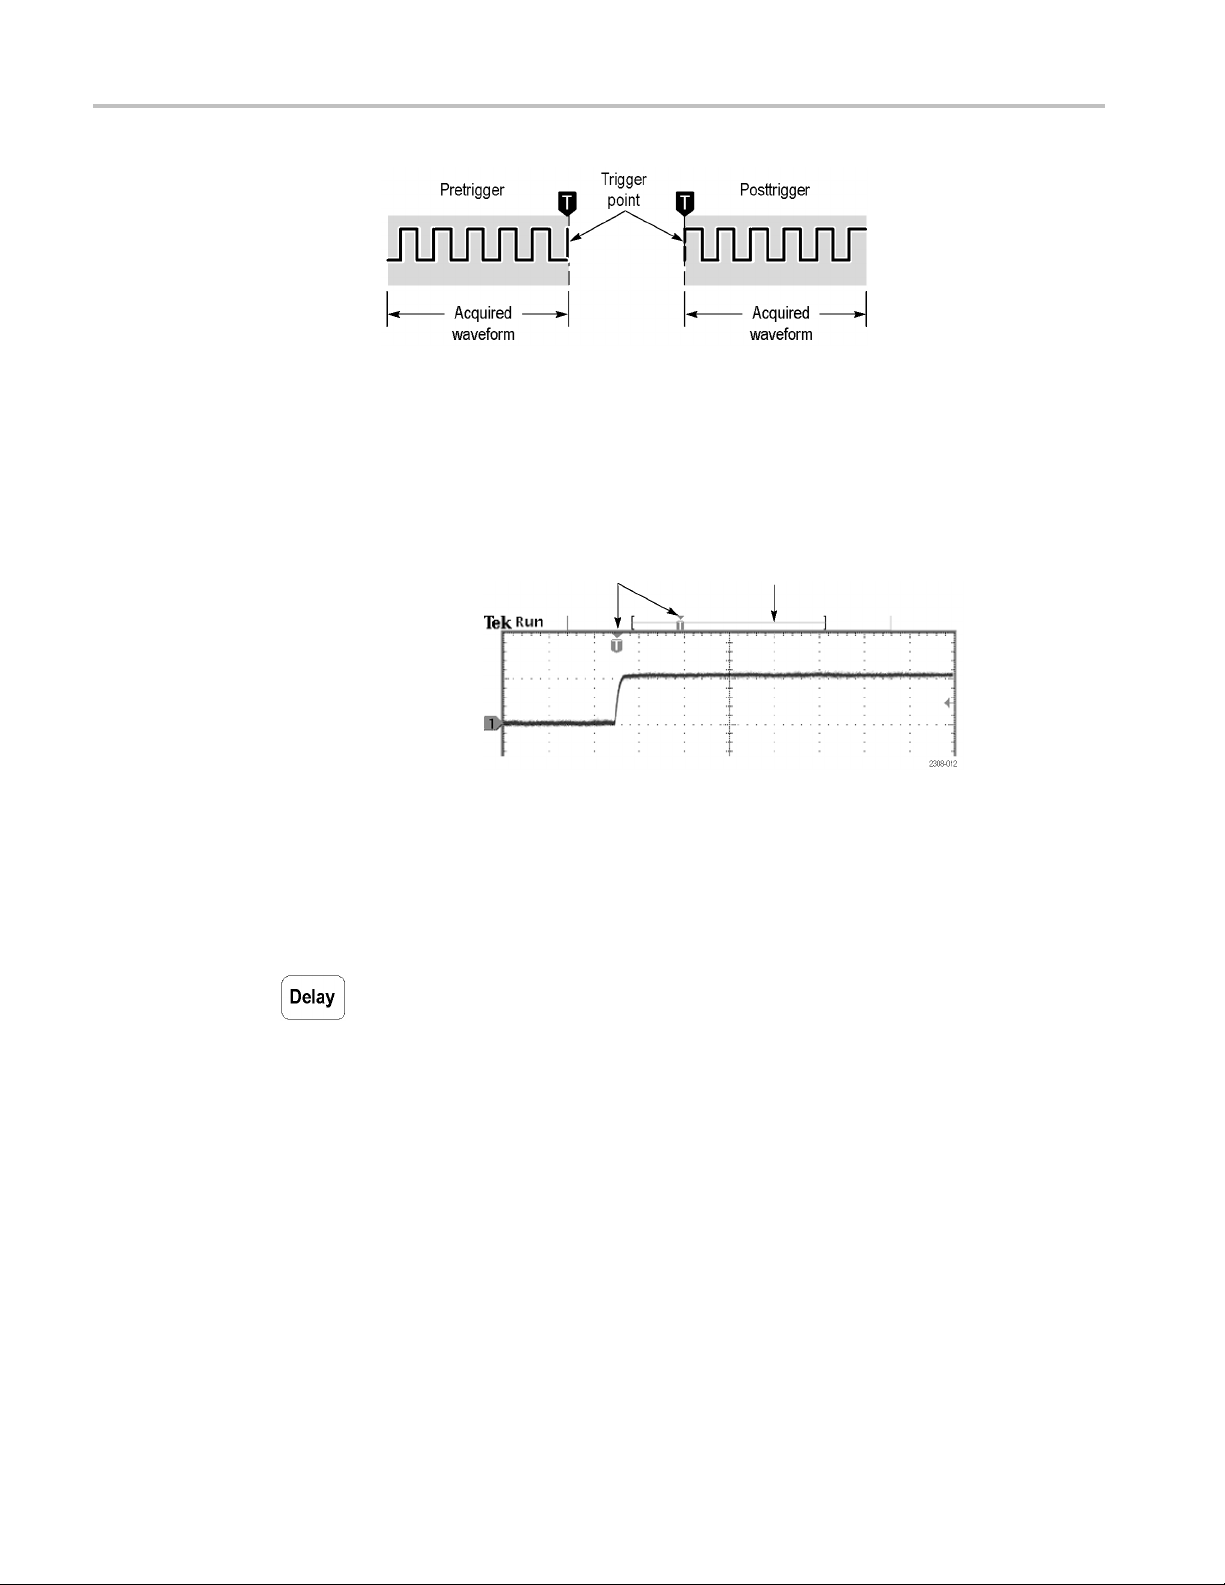
Reference
Refer to the Reference chapter for information about how the horizontal Position
control operates when the Delay and Zoom functions are active. (See page 68,
Delay Button.) (See page 70, Zoom Button.)
The trigger position is marked with the letter T at the top of the graticule and also
in the waveform record icon at the top of the screen.
Delay Button
Trigger marker and horizontal expansion point
Waveform record icon
The small inverted triangle is the horizontal expansion point. When you change
the horizontal Scale setting, the waveforms contract or expand about this point.
When delay is off, the horizontal expansion point is the same as the trigger point.
Push the Delay button when you want to delay the acquisition relative to the
trigger event. Turn the horizontal Position control counterclockwise to increase
the delay; the trigger point moves to the left and ultimately outside of the acquired
waveform. Then, you can adjust the horizontal Scale to acquire more detail
ound the area of interest (center of the screen).
ar
When delay is on, the trigger point separates from the horizontal expansion point.
he horizontal expansion point stays at the center of the screen. The trigger point
T
can move off the screen; when this happens, the trigger marker turns to point in
the direction of the trigger point.
68 TDS3000C Series Oscilloscope User Manual
Page 89
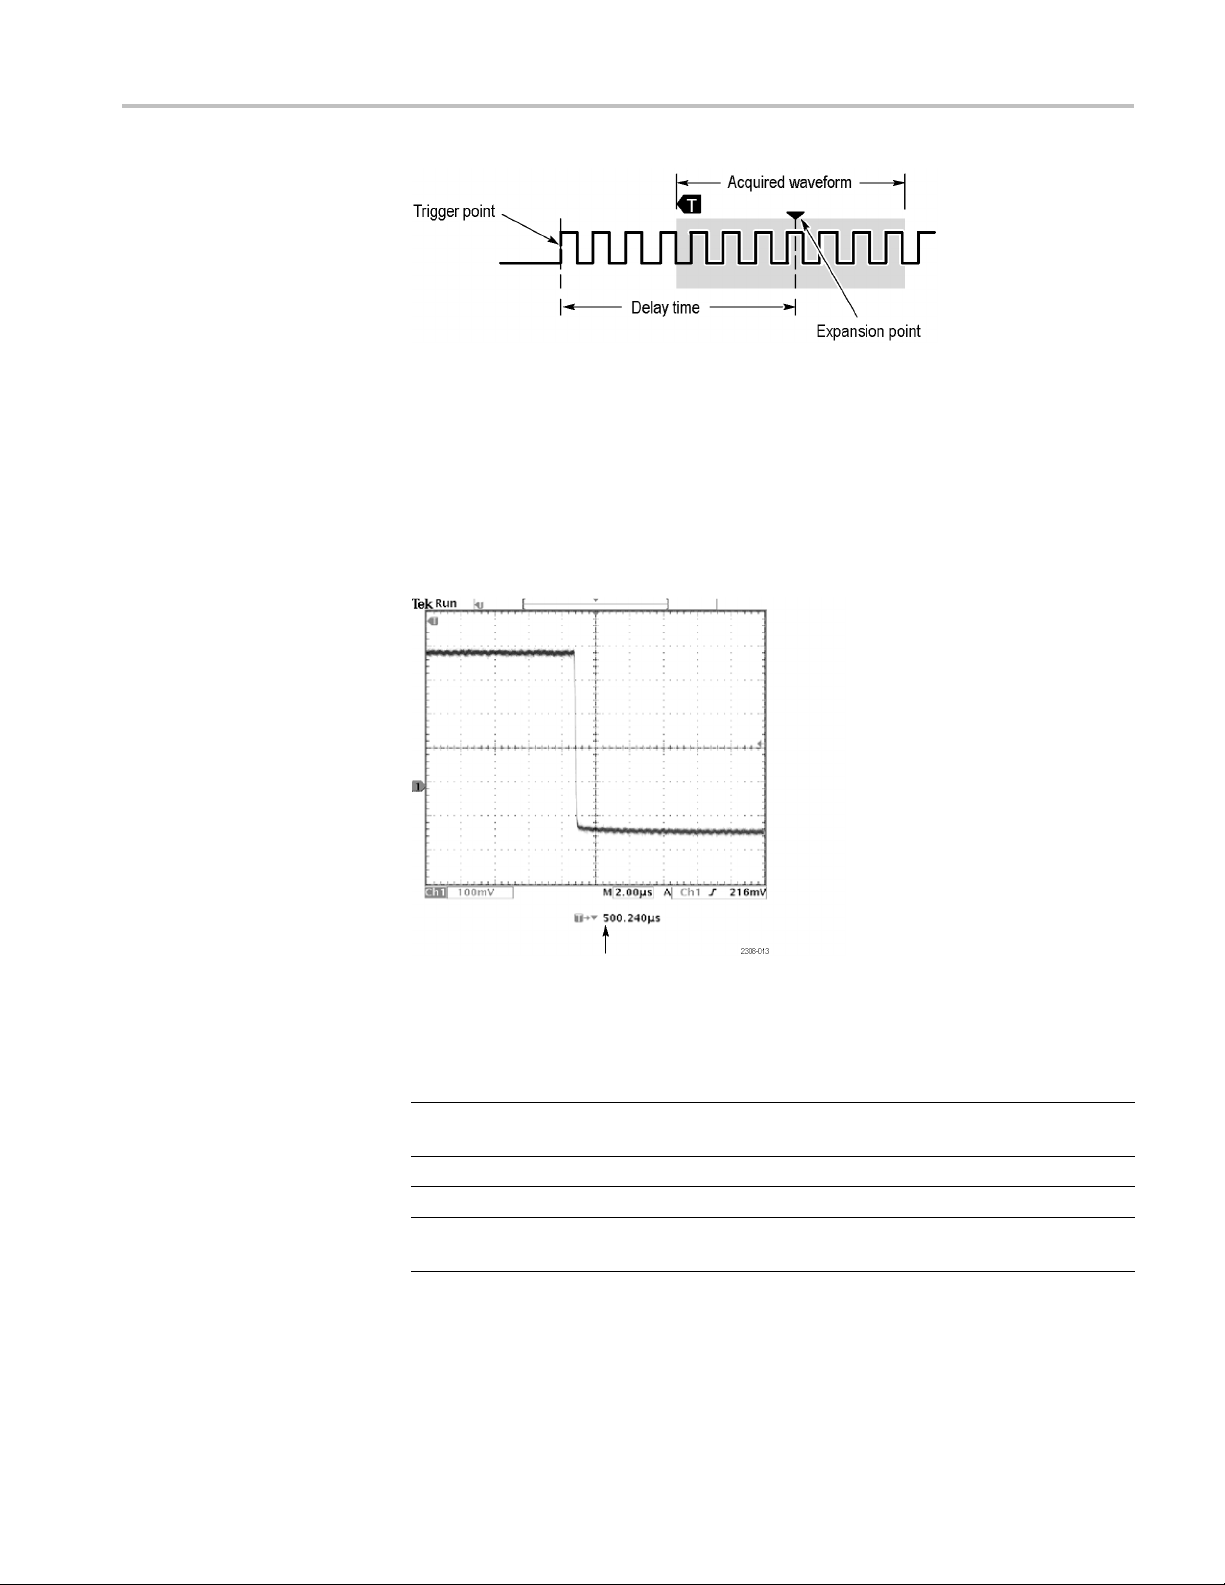
Reference
Usethedelayfeaturewhenyouwanttoacquire waveform detail that is separated
from the trigger event by a significant interval of time. For example, you can
trigger on a sync pulse that occurs once every 10 ms and then look at high-speed
signal characteristics that occur 6 ms after the sync pulse.
In the next screen example, the trigger markers show that the trigger point is
before the acquired waveform. The delay time, shown in the readout, is the time
from the trigger point to the expansion point (center screen).
Delay time readout
The interaction between delay and other functions is summarized in the next table.
Function Delay off Delay on
Trigger point Any point within the acquired
waveform
Expansion point
Horizontal Scale Sets time base Sets time base
Horizontal Position
Same as the trigger point
Sets trigger position in the
acquired waveform
Can occur prior to the
acquired waveform
Always center screen
Sets delay time
TDS3000C Series Oscilloscope User Manual 69
Page 90
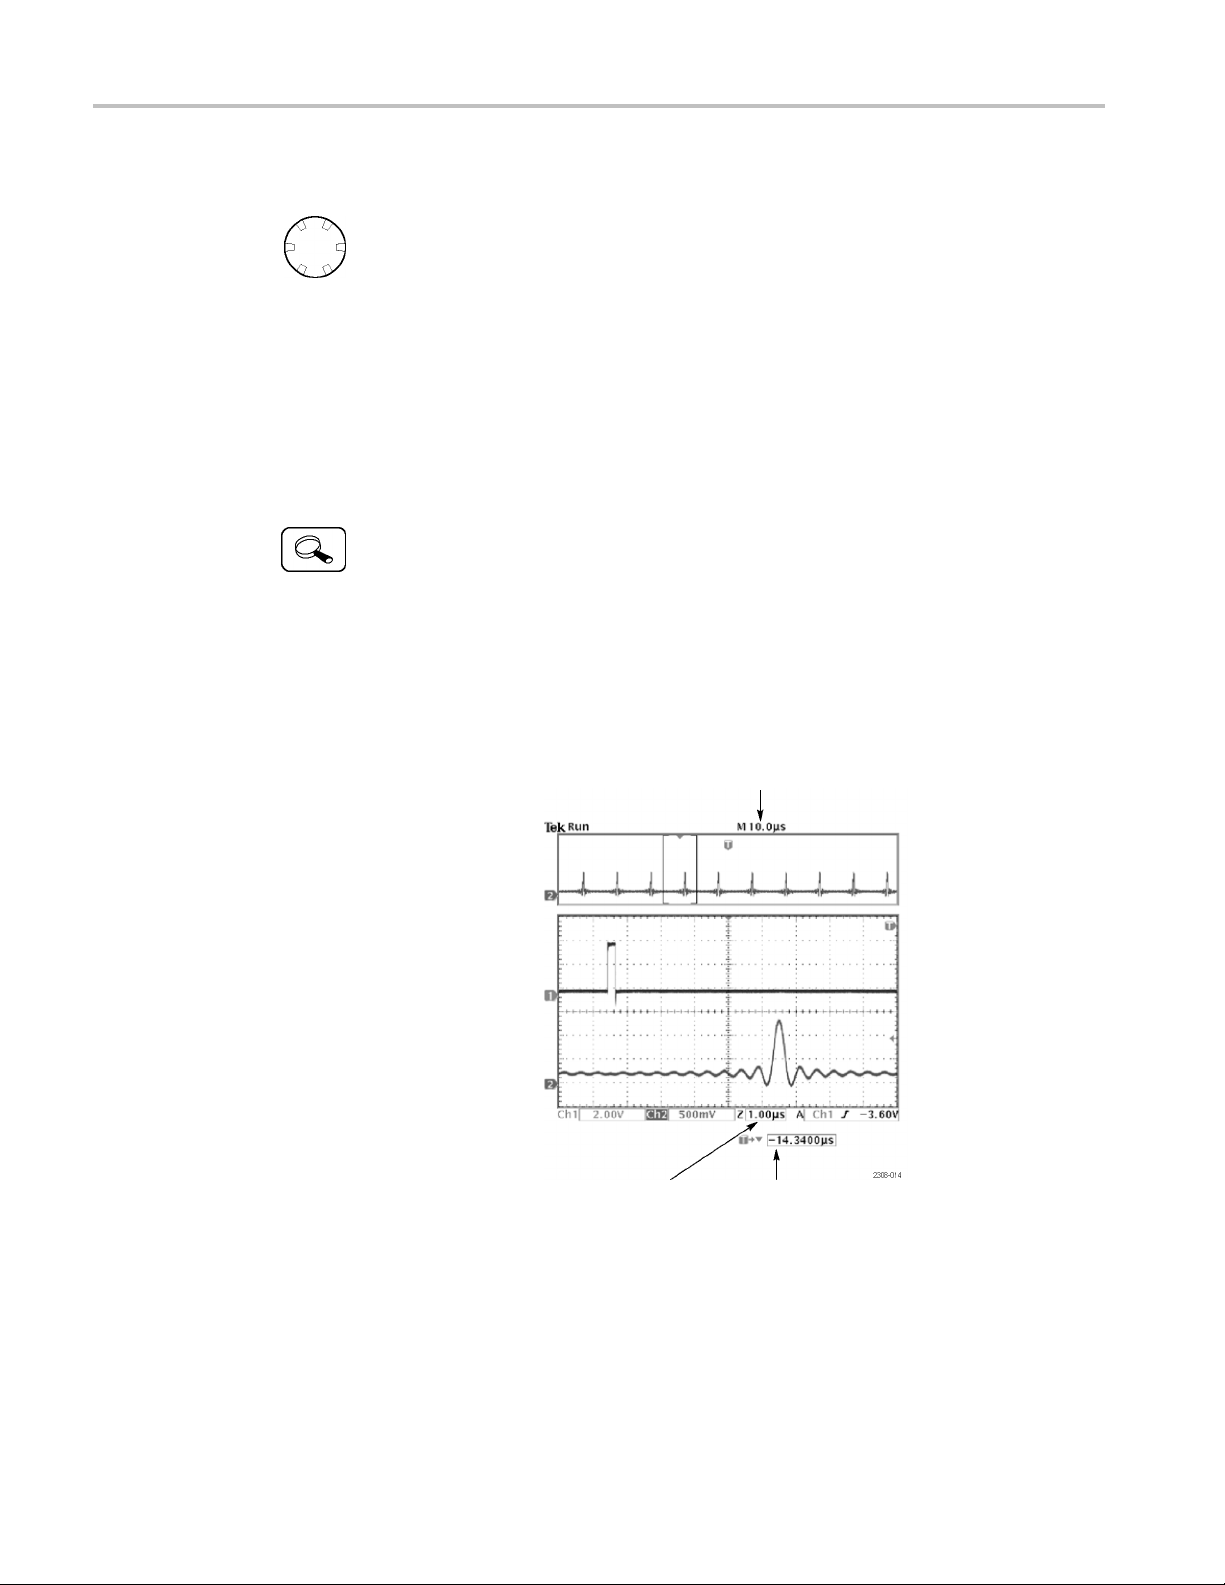
Reference
Horizontal Sca
Zoom Button
le Control
Use the horizontal Scale control to adjust the time base. When delay is off,
the scale expands or contracts around the trigger point. When delay is on, the
scale expand
chapter includes possible exceptions. (See page 71, Delay Interactions.)
When the zoo
the amount of horizontal magnification (the actual time-base setting remains
unchanged). The magnified waveforms always expand or contract around the
center of the screen.
Push the zoom button to magnify the current acquisition along the horizontal axis
so you can see more detail. Use the horizontal Scale control to adjust the amount
of magnification. Use the horizontal Position control to select the portion of the
waveform you want to magnify. When zoom is on, changes you make to these
contro
The split screen shows the entire selected waveform in the upper window to give
you a p
s or contracts around the center of the screen. The Reference
m function is active, use the horizontal Scale control to adjust
ls do not affect the actual time base or trigger position settings.
oint of reference as you examine the details in the lower window.
Key Poin ts
Actual time base
Zoom time base Zoom position
aximum Zoom Magnification Factor. If you are using Normal acquisition
M
resolution, the maximum horizontal magnification factor is 200X; in Fast-trigger
the maximum is 10X.
70 TDS3000C Series Oscilloscope User Manual
Page 91

Reference
Horizontal Zoo
mandPreview. There are two ways you can magnify a stopped
acquisition, horizontal zoom or preview. The differences in how horizontal zoom
and preview interact with other functions are shown in the next table.
Function Horizontal zoom Horizontal preview
Horizontal Scale Sets magnification factor Changes time base for the
next acquisition
Horizontal Position
Delay button
Math waveform Remains valid; m agnifi es
Cursors and automatic
measurements
Gray-scale Gray-scale information may
Selects portion of waveform
to magnify
Turns delay on and off Turns delay on and off
and positions with other
waveforms
Remain functional with valid
readouts
be temporarily reduced
Changes trigger position
or delay time for the next
acquisition
Remains fixed; does not
track changes to channel
waveforms
Remain locked to channel
waveforms
Gray-scale information is
lost
Slow Horizontal Settings. At horizontal Scale settings of 40 ms/div or slower,
the oscilloscope may display waveforms in roll mode. As the rolling waveform
fills the screen, the waveform intensity and vector fill appears to decrease. The
oscilloscope automatically reduces the number of displayed points in order to
maintain a high acquisition rate: this does not represent a loss of acquired data.
When you stop the acquisition, the original waveform intensity and vector fill
returns to the display.
Using Zoom and Delay Together. You can use both zoom and delay at the same
time to magnify a delayed acquisition.
Fast Time-Base Settings. At the fastest time-base settings, only a portion of the
waveform shows in the display. The waveform record icon indicates that portion
with brackets. Push the zoom
button and then use the horizontal Position
control to scroll through the entire waveform to see any portion you want. The
affected time-base settings are shown in the next table.
Acquisition resolution Affected time-base settings
Normal
Fast Trigger
100 ns/div to 1 ns/div
4ns/divto1ns/div
At the fastest time-base settings, the maximum zoom magnification factor is also
reduced.
Delay Interactions. The maximum delay setting is a function of the time-base
setting and acquisition resolution. If you set a large positive or negative delay,
TDS3000C Series Oscilloscope User Manual 71
Page 92

Reference
Math and FFT
that amount of d
elay might be automatically reduced if you make the following
additional control changes:
Change to a faster time-base setting
Change from Fast Trigger to Normal acquisition resolution
If the delay reduction occurs, it may cause the waveform horizontal position
to shift.
Negative Delay. You can select up to ten d ivisions of negative delay. At the fastest
time base settings, you can use negative delay to see more of the waveform that
occurs before the trigger point.
Roll Mode Display. To obtain a rolling display similar to a strip-chart recorder,
turn off zoom and delay, select the Auto trigger mode, and set the horizontal Scale
control to 40 ms/div or slower. Subsequent changes to the horizontal Scale cause
the roll-mode display to erase and restart.
Math and FFT functions are part of the Vertical menu group.
Math Waveform
Key Poin ts
Push the Math button to define the math waveform using the math menu. Also
push the Math button to display or select the math waveform. The bottom menu
will show other menu items when you have a TDS3AAM application module
installed.
Bottom Side Description
Dual Wfm Math
Set 1st Source to Selects the first source waveform.
Set Operator to Selects the math operator: +, -, ×,
or ÷
Set 2nd S ource to Selects the second source
waveform.
Dual-Waveform Math. For the dual-waveform math operations, the two source
waveforms interact with the math operators in the sequence shown next.
Operation Expression of math waveform
+
-
×
÷
Source 1 + Source 2
Source 1 - Source 2
Source 1 × Source 2
Source 1 ÷ Source 2
72 TDS3000C Series Oscilloscope User Manual
Page 93

Reference
FFT Waveform
Scaling and Pos
waveform, select the math waveform and then adjust it with a vertical Position or
Scale control. You can do this whether acquisition is running or is stopped.
Math Interaction with Preview. If you select a channel waveform and then adjust
the vertical Position or Scale control while the acquisition is stopped, the math
waveform re
waveform. The same is true if you adjust the horizontal Position or Scale control
under these conditions.
Gray-Scale Restriction. Math waveforms are always based on the most current
acquisitions and do not contain any gray-scale information.
Source Waveform Screen Position. When displaying dual-waveform math
waveforms, make sure that the source waveforms do not extend beyond the top or
bottom edge of the screen. If part of the source waveform is positioned outside
the screen, the math waveform may not display correctly.
The FFT (Fast Fourier Transform) function mathematically converts the standard
time-domain signal (repetitive or single-shot acquisition) into its frequency
components, providing spectrum analysis capabilities. You can use the FFT
function to look at the frequency components and spectrum shape of a signal:
itioning the Math Waveform. To position or scale a math
mains fixed. It does not track the changes you see to the channel
To test impulse response of filters and systems
To measure harmonic content and distortion in systems
To identify and locate noise and interference sources
To analyze vibration
analyze harmonics in 50 and 60 Hz power lines
To
The FFT function provides the following features:
FFT Windows – Four FFT windows (Rectangular, Hamming, Hanning, and
Blackman-Harris) let you match the optimum window to the signal you are
analyzing. The Rectangular window is best for nonperiodic events such as
transients, pulses, and one-shot acquisitions. The Hamming, Hanning, and
Blackman-Harris windows are better for periodic signals.
Analyze Repetitive, Single-Shot, and Stored Waveforms – You can display
an FFT waveform on any actively-acquired signal (periodic or one-shot), on
the last acquired signal, or on any signal stored in reference memory.
dB or Linear RMS Scales – The FFT vertical graticule can be set to either
dB or Linear RMS. A dB scale is useful when the frequency component
magnitudes cover a wide dynamic range, letting you show both lesser and
greater- magnitude frequency components on the same display. A Linear
TDS3000C Series Oscilloscope User Manual 73
Page 94

Reference
scale is useful
when the frequency component magnitudes are all close in
value, allowing direct comparison of their magnitudes.
Time Signals a
nd FFT Waveforms Displayed Together –Thetimesignals
and FFT waveforms can be shown together on the display. The time signal
highlights the problem; the FFT waveform helps you determine the cause
of the problem.
Displaying an FFT Waveform. To display an FFT waveform, follow these steps:
1. Set the source signal Vertical Scale so that the signal peaks do not go off
screen. Off-screen signal peaks can result in FFT waveform errors.
2. Set the Horizontal Scale control to show five or more cycles of the source
signal. Showing more cycles means the FFT waveform shows more frequency
compone
nts, provides better frequency resolution, and reduces aliasing. If
the signal is a single-shot (transient) signal, make sure that the entire signal
(transient event and ringing or noise) is displayed and centered on the screen.
3. Push the Vertical Math button to show the math menu.
4. Push t
Bottom Side Description
FFT
he FFT screen button to show the FFT side menu.
Set FFT Source to Sets the FFT signal source. Valid input sources
h1 and Ch2 (2-channel instruments),
are C
Ch1 through Ch4 (4-channel instruments), and
Ref1 through Ref4.
Set FFT Vert Scale to Sets the displa y vertical scale units. Available
les are dBV RMS and Linear RMS.
sca
FFT Window to
Set
s which window function (Hanning,
Set
Hamming, Blackman-Harris, or Rectangular)
to apply to the source signal. (See page 75,
T Windows.)
FF
74 TDS3000C Series Oscilloscope User Manual
Page 95
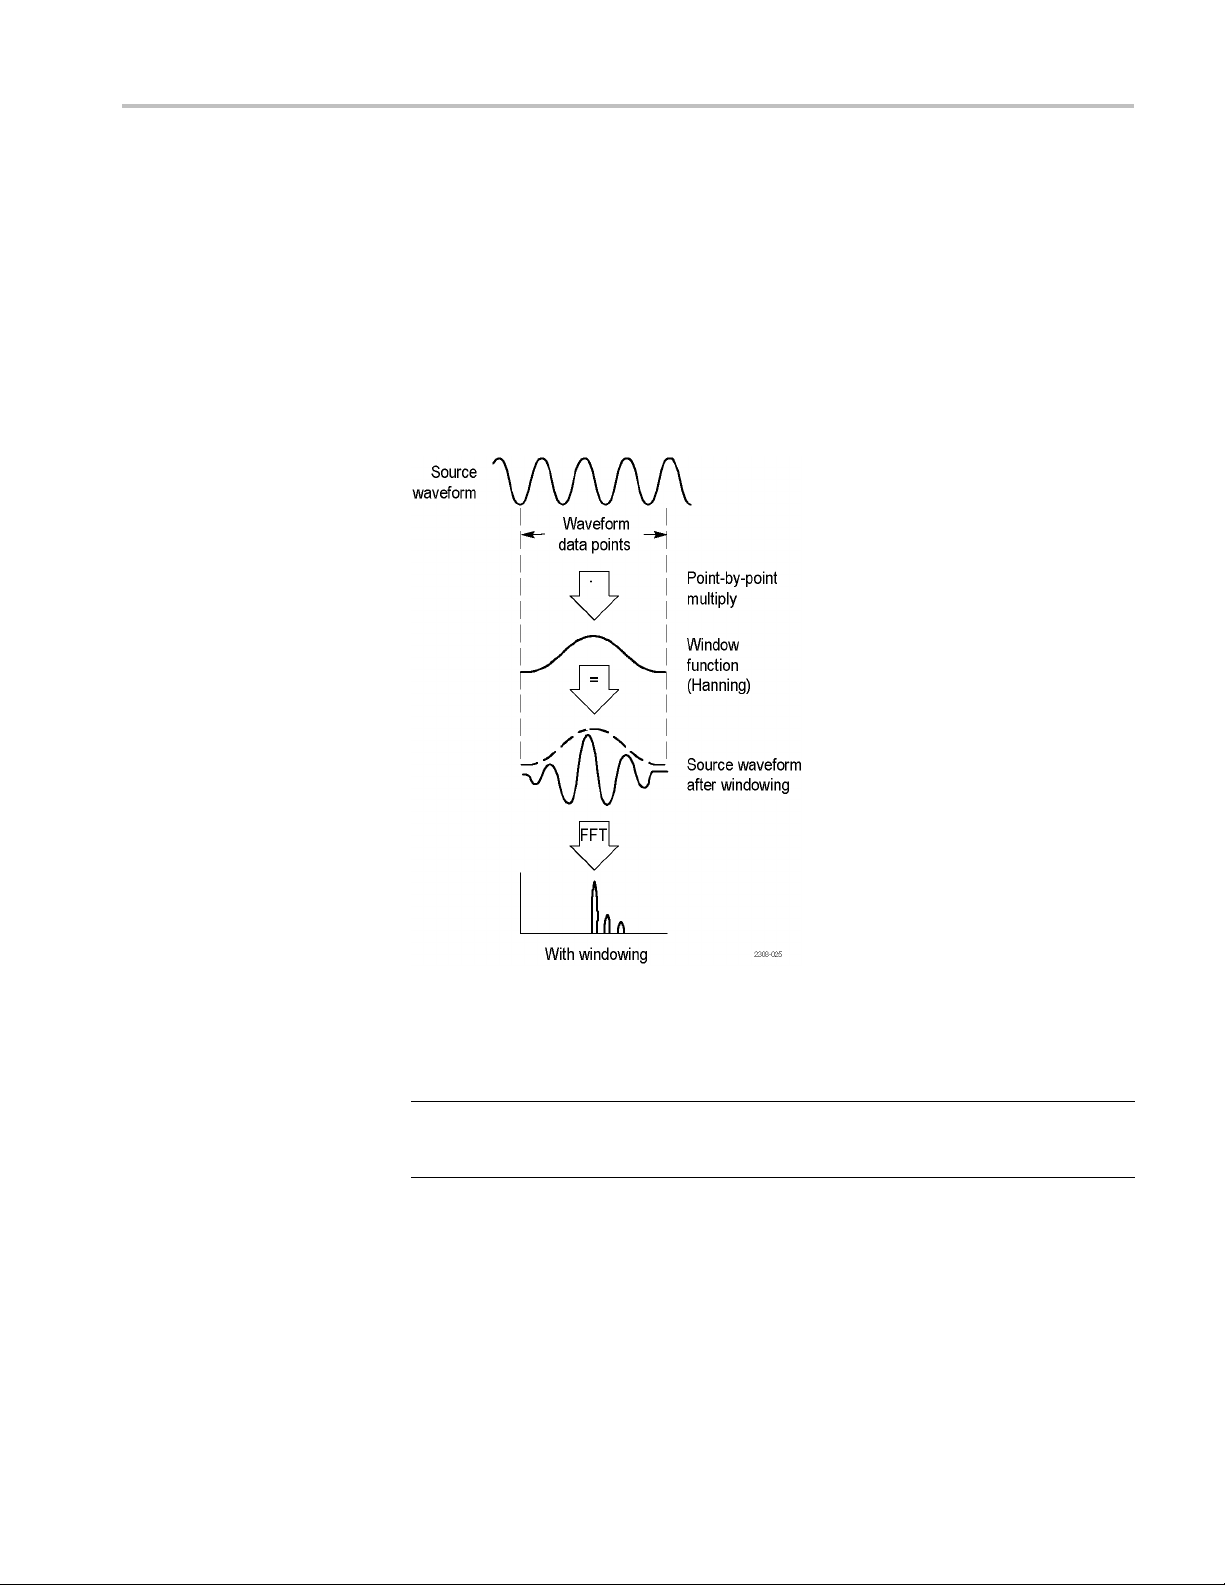
Reference
5. Select a signal
source. You can do an FFT on any channel or any stored
reference waveform.
6. Select the app
ropriate vertical scale and FFT window.
7. Use zoom controls and the cursors to magnify and measure the FFT waveform.
FFT Windows. Applying a window function to the source waveform record
changes the waveform so that the start and stop values are close to each other,
reducing FFT waveform discontinuities. This results in an FFT waveform that
more accurately represents the source signal frequency components.
The shape of the FFT window determines how well the window resolves
frequency or magnitude information.
FFT window Characteristics Best for measuring
Blackman-Harris Best magnitude, worst at
resolving frequencies.
Predominantly single frequency
waveforms to look for higher order
harmonics.
TDS3000C Series Oscilloscope User Manual 75
Page 96
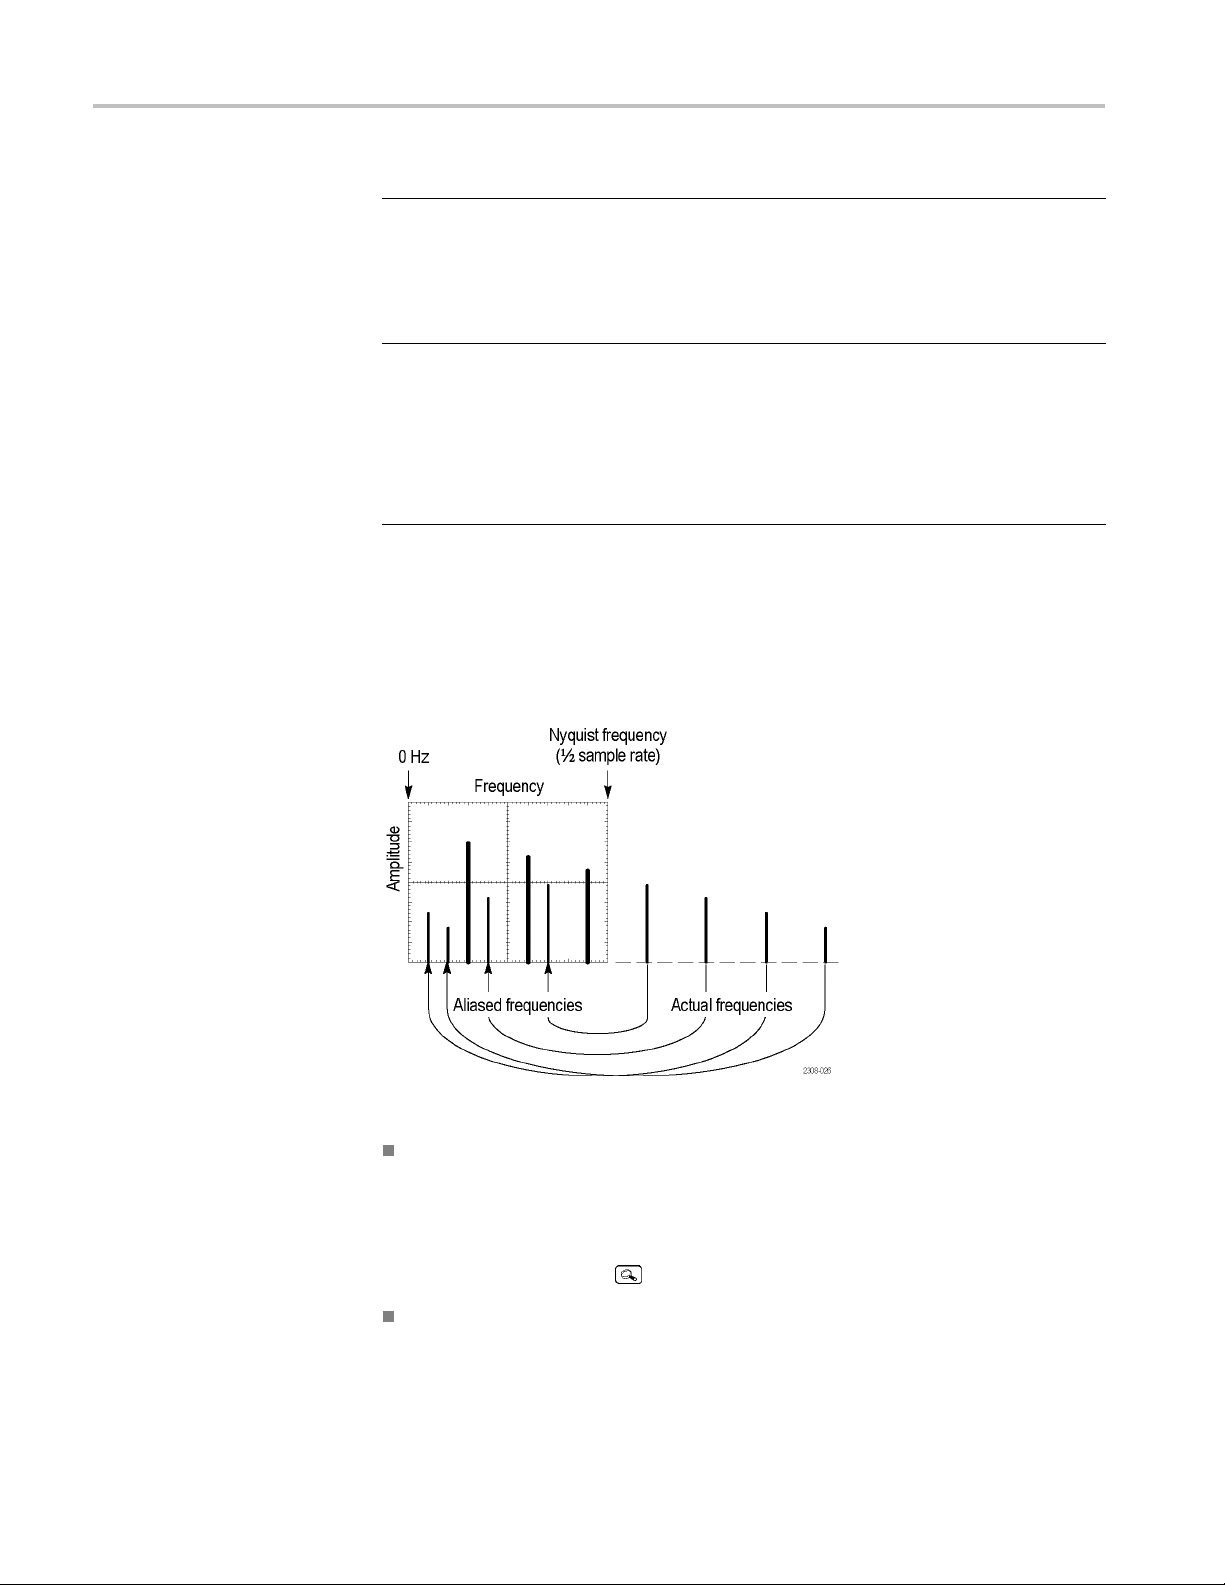
Reference
FFT window Characteristics Best for measuring
Hamming, Hann
Rectangular
ing
Better frequency, poorer
magnitude accuracy than
Rectangular.
has slightly better
frequency resolution
than Hanning
Best freque
magnitude resolution.
This is essentially the
same as no wi
Hamming
.
ncy, worst
ndow.
Sine, periodic, and narrow-band
random noise.
Transients or
levels before and after the event are
significantly different.
Transients or bursts where the signal
levels befo
nearly equal.
Equal-amplitude sine waves with
frequenci
Broad-band random noise with a
relatively slow varying spectrum.
bursts where the signal
re and after the event are
es that are very close.
Aliasing. Problems occur when the oscilloscope acquires a signal containing
frequency components that are greater than the Nyquist frequency (1/2 the sample
rate). The frequency components that are above the Nyquist frequency are
undersampled and appear to "fold back" around the right edge of the graticule,
showing as lower frequency components in the FFT waveform. These incorrect
components are called aliases.
You can use the following methods to eliminate aliases:
Increase the sample rate by adjusting the Horizontal Scale to a faster
frequency setting. Since you increase the Nyquist frequency as you increase
the horizontal frequency, the aliased frequency components should appear at
their proper frequency. If the increased number of frequency components
shown on the screen makes it difficult to measure individual components,
push the zoom button
to magnify the FFT w
aveform.
Use a filter on the source signal to bandwidth limit the signal to frequencies
below that of the Nyquist frequency. If the components you are interested
in are below the built-in bandwidth settings (20 MHz bandwidth for all
76 TDS3000C Series Oscilloscope User Manual
Page 97

Reference
oscilloscopes
set the source signal bandwidth to the appropriate value. Push the Vertical
Menu button to access the source channel bandwidth menu.
, 150 MHz bandwidth for 300 MHz and 500 MHz oscilloscopes),
TDS3000C Series Oscilloscope User Manual 77
Page 98

Reference
Key Poin ts
FFT Source. To s
elect the source, push the side menu button. Available sources
are the channels and reference wave forms.
Using FFT slow
s down the oscilloscope’s response time in Normal acquisition
mode (10k record length).
A waveform a
cquired in Normal acquisition mode has a lower noise floor and
better frequency resolution than a waveform acquired in Fast Trigger mode.
Signals tha
t have a DC component or offset can cause incorrect FFT waveform
component magnitude values. To minimize the DC component, choose AC
Coupling on the source signal.
To reduce random noise and aliased components in repetitive or single-shot
events, set the oscilloscope acquisition mode to average over 16 or more
samples. Average mode attenuates signals not synchronized with the trigger.
Do not use the Average acquisition mode if the source signal contains
frequencies of interest that are not synchronized with the trigger rate.
Do not use Peak Detect a nd Envelope modes with FFT. Peak Detect and
Envelope modes can add significant distortion to the FFT results.
For transient (impulse, one-shot) signals, set the oscilloscope to trigger on the
transient pulse in order to center the pulse information in the waveform record.
FFT Vertical Scale. To select the vertical scale, push the side menu button.
lable scales are dBV RMS and Linear RMS.
Avai
Use the Vertical Position and Scale knobs to vertically move and rescale the
waveform.
FFT
To display FFT waveforms with a large dynamic range, use the dBV RMS
ale. The dBV scale displays component magnitudes using a log scale,
sc
expressed in dB relative to 1 V
,where0dB=1V
RMS
or in source
RMS,
waveform units (such as amps for current measurements).
To display FFT waveforms with a small dynamic range, use the Linear
RMS scale. The Linear RMS scale lets you display and directly compare
components with similar magnitude values.
Nyquist Frequency. To determine the Nyquist frequency, push the Acquire menu
button. This displays the current sample rate on the bottom right area of the
screen. The Nyquist frequency is one-half of the sample rate. For example, if the
sample rate is 25.0 MS/s, then the Nyquist frequency is 12.5 MHz.
Zooming an FFT Display. Use the Zoom button
, along with horizontal Position
and Scale controls, to magnify FFT waveforms. When you change the zoom
factor, the FFT waveform is horizontally magnified about the center vertical
78 TDS3000C Series Oscilloscope User Manual
Page 99
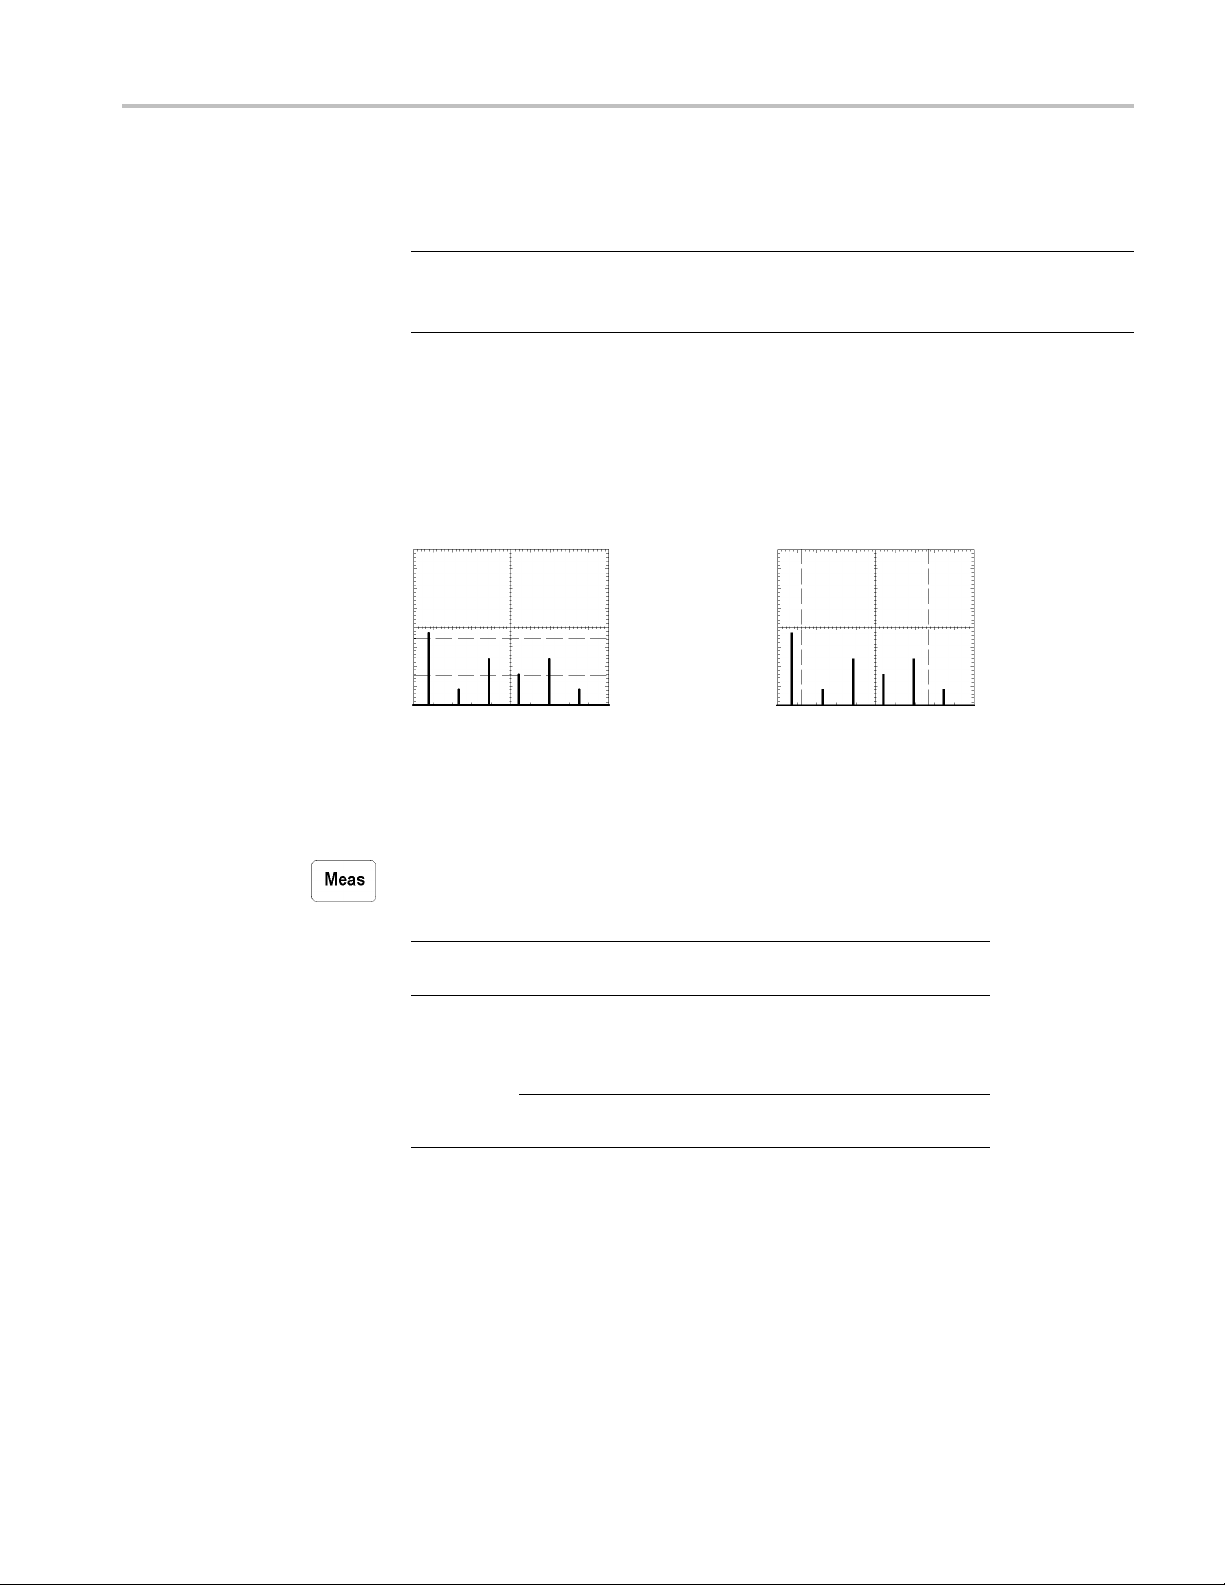
Reference
graticule, and
vertically magnified about the math waveform marker. Zooming
does not affect the actual time base or trigger position settings.
NOTE. FFT waveforms are calculated using the entire source waveform record.
Zooming in on a region of either the source or FFT waveform will not recalculate
the FFT waveform for that region.
Measuring FFT Waveforms Using Cursors. You can use cursors to take two
measurements on FFT waveforms: magnitude (in dB or signal source units) and
frequency (in Hz). dB magnitude is referenced to 0 dB, where 0 dB equals 1 V
Use horiz
ontal cursors (H Bars) to measure magnitude and vertical cursors (V
RMS
Bars) to measure frequency
Magnitude cursors Frequency cursors
.
Measur
e
Push the Meas button to show the measure menu.
Bottom Side Description
Select
Measurement
Remove
Measurement
Measurement 1
Measurement 2
surement 3
Mea
Measurement 4
All
Measurements
See the table on automatic
measurements. (See page 82.)
Removes a specific measurement.
oves all measurements.
Rem
TDS3000C Series Oscilloscope User Manual 79
Page 100

Reference
Bottom Side Description
Gating
High-Low
Setup
Reference
Levels
Indicators
Off Use to take measurements o n the full
waveform record.
Screen
Cursors
Bring Selec
Cursor to Center
Screen
Bring Both
Cursors On
Screen
Auto Sele
Histogr
Min-Max Use to measure other wave shapes.
Set Levels in %
or unit
High Re
Mid Re
Mid 2
Low Reference Sets custom low reference level.
Set to Defaults Sets reference levels to default
Measurement 1-
asurement 4
Me
ff
O
ted
ct
am
s
ference
ference
Ref
Use to take measurements on the
portion of the waveform on screen.
Use to take measurements on the
portion of the waveform between the
V Bar cursor
Moves the active cursor to center
screen.
Moves any off-screen cursor onto the
screen.
Automatically uses the best
measurem
the signal characteristics.
Usetome
Use to choose custom reference
in relative or absolute units.
levels
stom high reference level.
Sets cu
ustom mid reference level.
Sets c
the custom mid reference
Sets
level for the Delay and Phase
measurement second waveform.
ues.
val
lects the measurement for which to
Se
display markers that show the portion
of the waveform used to calculate the
asurement value.
me
urns measurement indicators off.
T
s.
ent method depending on
asure pulses.
Key Poin ts
Choosing Measurements. You can perform up to four automatic measurements
and display them along the right side of the graticule. All four measurements
can apply to a single channel or you can spread the measurements over several
channels. You can also take measurements on math and reference waveforms.
First push a channel, Math, or Ref button to select the waveform you want to
measure and then select a measurement. (See page 82, Automatic Measurements.)
80 TDS3000C Series Oscilloscope User Manual
 Loading...