

Page 1
02244.30
Note!
Insert or remove C-MAP cartridges ONLY through CHART menu or when unit is off.
All electronic navigation equipment is subject to external factors beyond the control of the
manufacturer. Therefore such equipment must be regarded as an aid to navigation. The
prudent navigator will, for that reason, never rely on a single source for position fixing and
navigation.
M A N U A L
SIMRAD CA42/50/52
ChartRadar with Echosounder
183-0500-202 English
Page 2
MOB ‘MAN OVERBOARD’ function
MOB
In case someone falls overboard, press the [MOB] key and hold for two
seconds, or activate an external MOB switch – hold for five seconds.
CLR
Press
[CLR]
to confirm and reset the alarm if activated by mistake.
ENT
Pressing [ENT] will provide all relevant data for an efficient rescue
operation.
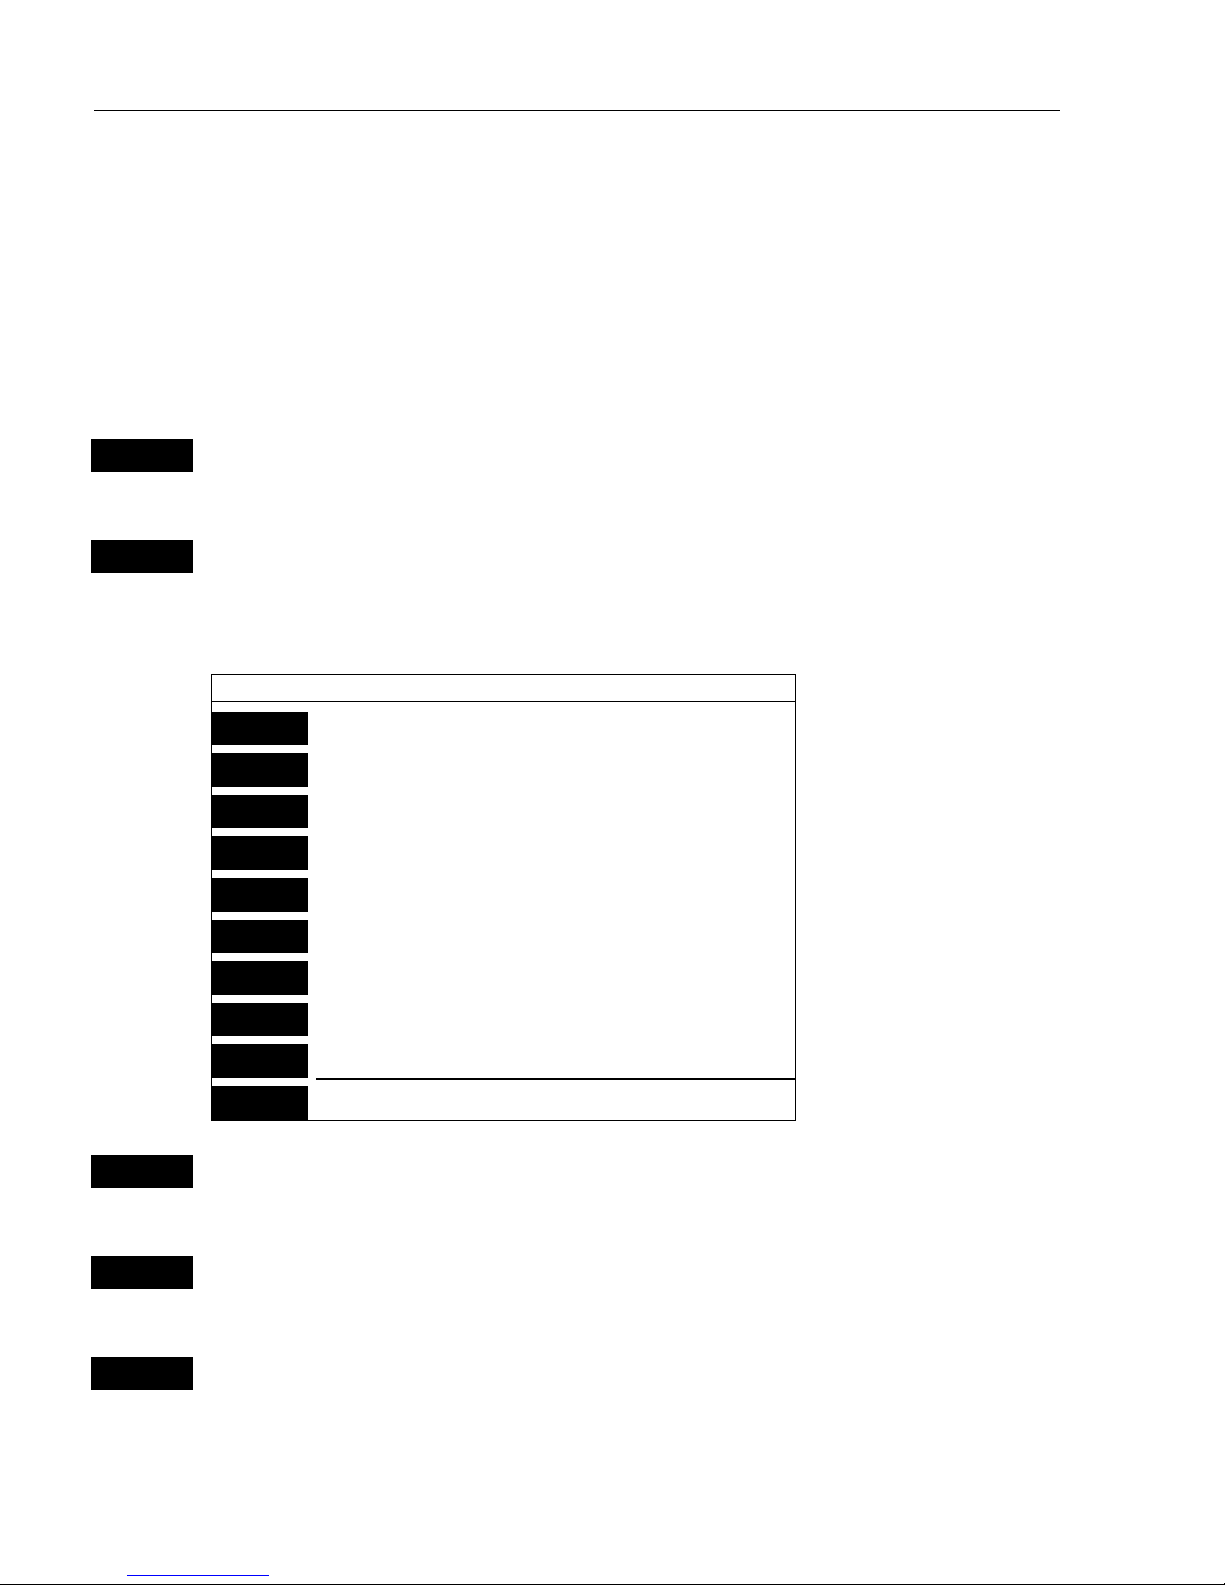
Display 1
Display 3
Display 2
Screen layout default after activating
MOB.
Display 1: The MOB display will provide the position where the man
fell overboard, together with present course (C), bearing (B), and
distance (DIST) to the MOB position.
Elapsed time - first in seconds and then in minutes. If “*” is shown
instead of number of minutes, means that the elapsed time has
exceeded 9999 minutes.
Display 2: Data display will provide information of: Date, time and
position of MOB incident.
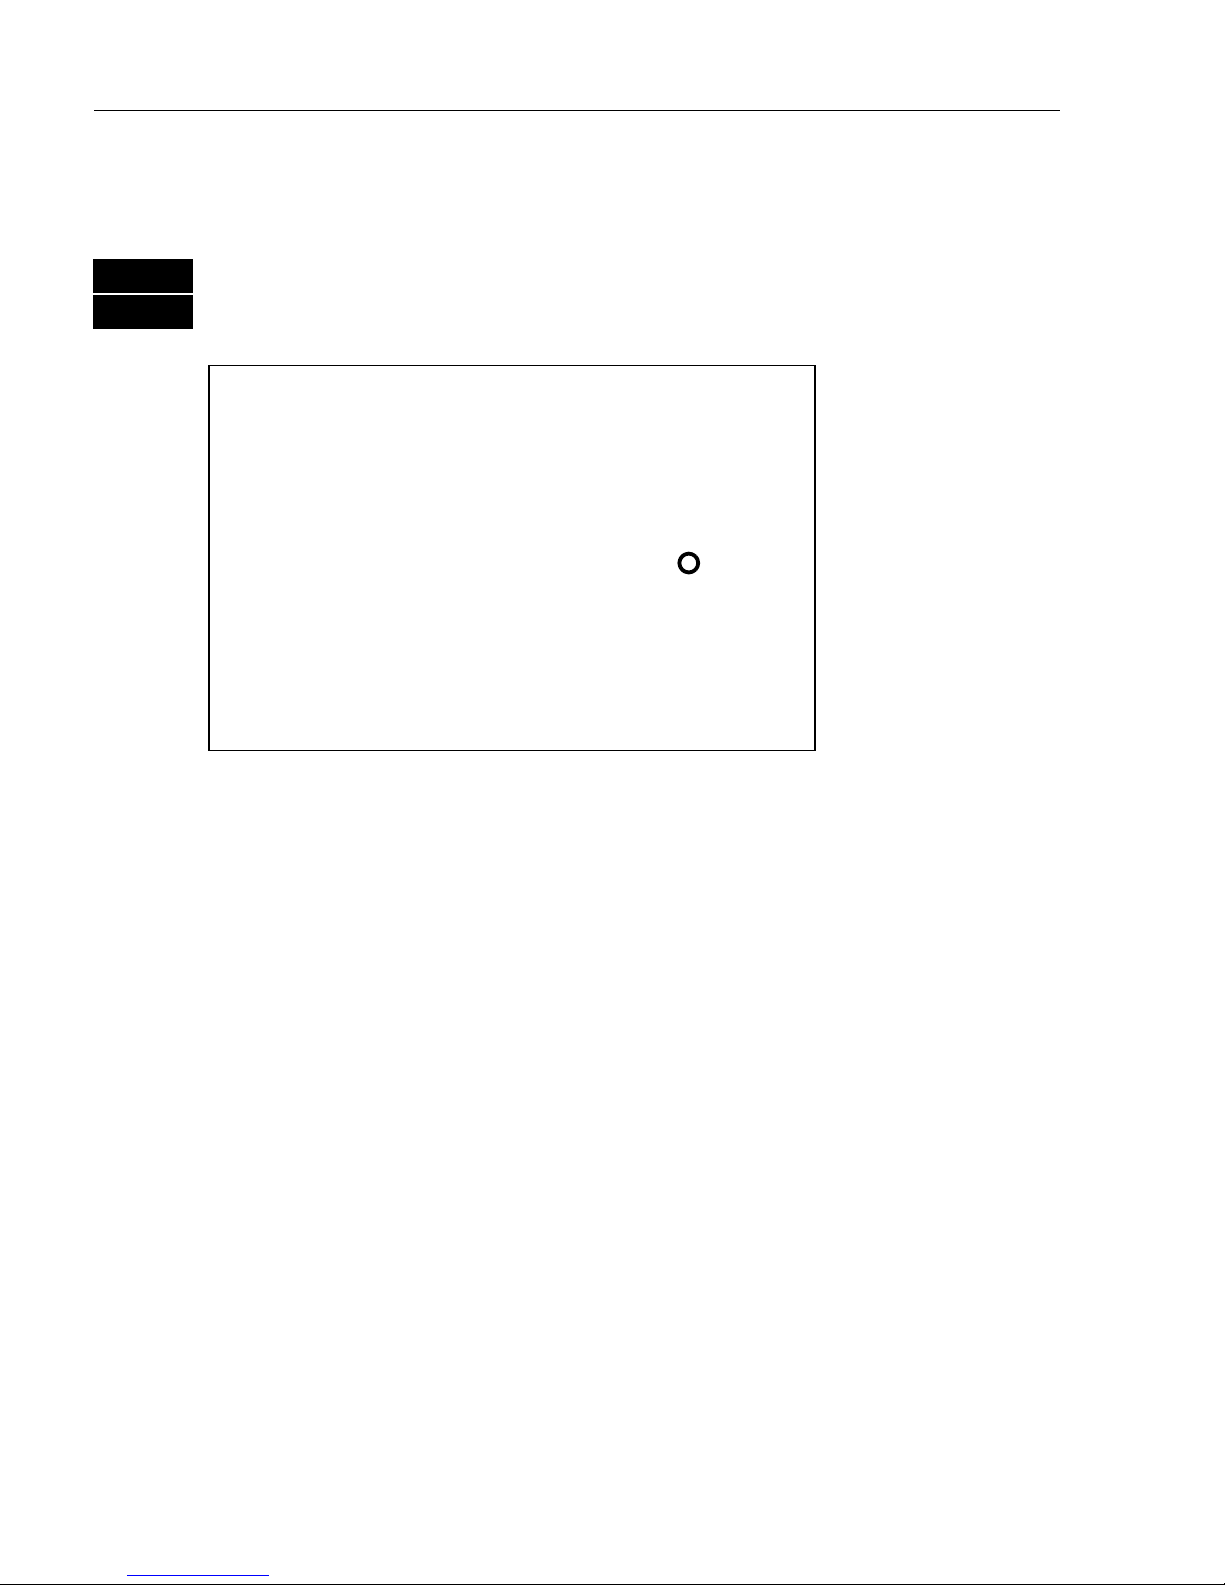
Display 3: The CHART display will provide a graphical impression of
the MOB position – a man waving his arms in relation to the ship.
To turn MOB navigation off (two ways):
Either press [GOTO], [3] or... press [MENU], [4], [2].
To recall last MOB position, see section 9.2.
Page 3

CA42/50/52 DGPS ChartRadar with Echosounder Table of contents
1. Introduction and system
familiarization
1.1 Introduction and system
familiarization, 5
1.2 Safety summary, 6
2. Fundamentals & initial start-up
2.1 Fundamentals of the PAGE and
WINdow system, 7
2.2 Key functions, 10
2.3 Menu bar, 12
2.4 Menu layout, 13
2.5 Choice of symbols, 14
2.6 Naming of routes, points, etc., 15
2.7 Initial start-up, 15
2.8 Turn power off, 16
3. Chart menus and
INFO windows
3.1 Chart menu, 17
3.1.1 Charts, 17
3.2 C-MAP cartridges, 20
3.3 INFO windows, 22
3.3.1 Cursor inactive, 22
3.3.2 Cursor active but not placed
on object or data, 23
3.3.3 Cursor placed on waypoint, 24
3.3.4 Cursor placed on route leg or
line leg, 25
3.3.5 Cursor placed on routepoint or
linepoint, 26
3.3.6 Cursor placed on trackpoint, 27
3.3.7 Cursor placed on target, 28
3.3.8 GOTO function, 29
3.3.9 PLOT function, 30
3.4 Chart setup, 32
4. Position menus
4.1 Position display, 35
4.2 Dual speed display, 39
4.3 Speed, course & depth, 40
4.4 Speed diagram, 41
4.5 Satellite status, 43
4.6 DGPS information, 45
4.7 SDGPS information, 47
4.7.1 Satellites in SDGPS system, 49
5. Waypoint / route menus
5.1 WP list, 51
5.2 Routes stored in the memory, 52
5.2.1 Delete route via menu, 55
5.2.2 Make new route from WP list, 55
5.3 Route calculation, 57
5.4 Lines stored in the memory, 58
5.4.1 Delete lines via menu, 59
5.5 Start / stop track, 60
5.6 Tracks stored in the memory, 61
5.6.1 Delete tracks via menu, 62
5.7 Targets stored in the memory, 63
5.7.1 Delete target via menu, 64
6. Navigation menus
6.1 NAV menu (NAV inactive), 65
6.1.1 - Highway display, 65
6.2 NAV menu – (NAV active), 67
6.2.1 - Highway display, 68
6.2.2 - Navigation setup, 69
6.2.3 - Turn NAV off, 69
6.2.4 - Waypoint advance, 69
6.2.5 - Restart to approaching point, 69
6.2.6 - ETA & AVN, 70
6.2.7 – Trim & highway display, 71
6.2.8 - Set & drift, 72
6.3 Anchor guard, 73
6.4 MOB navigation, 74
6.5 Navigation examples, 74
6.5.1 Chart/cursor navigation, 75
6.5.2 Waypoint navigation, 76
6.5.3 Route navigation, 77
6.5.4 Track navigation, 79
Page 4

CA42/50/52 DGPS ChartRadar with Echosounder Table of contents
7. Echosounder operation, 83
7.1 Echosounder menu, 84
7.2 Echosounder display, 84
7.3 Bottom expansion, 86
7.4 VRM expansion, 87
7.5 A-scope, 88
7.6 Variable range marker, 89
7.7 Depth & temperature diagram, 89
7.8 Echosounder setup, 91
7.9 Presentation setup, 93
7.10 How the echosounder works, 94
7.11 Transducer beamwidth, 95
7.12 Effects of the vessel’s speed, 96
8. RADAR operation
8.1 Radar map, 97
8.1.1 Map orientation, 98
8.1.2 Environmental effects, 98
8.1.3 Effects of ship´s movement, 99
8.1.4 Navigational echoes, 100
8.1.5 Sea return, 100
8.1.6 Storm and rain squall returns, 101
8.1.7 Blind sectors or shadow
effect, 101
8.1.8 Side lobes, 102
8.1.9 Radar interference, 102
8.1.10 False echoes, 102
8.2 Starting operation, 104
8.2.1 Radar menus, 104
8.2.2 Initial radar display setup, 105
8.2.3 Start transmission, 109
8.2.4 Shut down procedure for the
radar function, or back to
standby, 109
8.2.5 Standard radar display, 110
8.2.6 Dual radar display, 114
8.2.7 Split-screen operation, 116
8.2.8 General features for the radar
operation, 118
8.2.9 Demo mode, 121
9. Miscellaneous menu
9.1 Wind display, 123
9.2 MOB position, 125
9.3 DSC alarm, 125
9.4 Data transfer via DataCard
or disc, 126
9.5 Data transfer via PC interface, 129
10. SETUP menu
10.1 Speed alarm, units & language, 133
10.2 Interface setup, NMEA, 135
10.3 Interface setup, alarm/log, 139
10.4 Decca lanes, 140
10.5 Loran C, 141
10.6 Display color, 142
10.7 Factory settings, 143
11. Troubleshooting, Maintenance
and Service
11.1 Troubleshooting, 145
11.2 Preventive maintenance, 146
11.3 Repair and service, 147
11.4 Specifications, 147
Appendix A
Glossary of terms, 151
Appendix B
List of datums, 161
Appendix C
C-MAP attributes, 163
Index, 171
CE Declarations
International warranty, 177
List of Simrad distributors
Page 5

CA42/50/52 Introduction and safety summary Chapter 1
5
1.1 Introduction and system familiarization
Congratulations on your purchase of SIMRAD CA42/50/52 DGPS
ChartRadar with Echosounder - a combination of the latest GPS
receiver technology with built-in differential receiver for accurate
positioning and prepared for SDGPS, plus: detailed cartography and
high performance radar and echosounder technology; all in a unique
slim-line design with a 10” ATFT (CA42), 14” TFT (CA50), or 15”
TFT (CA52) large LCD display in color.
The CA42/50/52 chart system includes a built-in world chart for
rough planning and overview. The choice of chart system best suitable
for the CA42/50/52 was carefully singled out to be the C-MAP NT+
mini cards. The optional C-MAP cards are available world-wide at
your local Simrad dealer.
The echosounder system with selectable frequencies will provide an
impression of Bottom expansion, VRM expansion, A-scope and white
line.
The radar system with dual EBL and VRM markers, direct Quickrange keys, off-center mode, etc. together with Dual radar feature …
two radar displays in one screen, one for short range and one for long
distance observations.
The Global Positioning System is at this time and age the most
common system used for navigation and positioning all over the world.
Not only for maritime use, but also for land-based applications and
aviation. The satellite-based system has been developed and is operated
by the US Department of Defense in order to provide an accurate and
reliable service, which include a 24-hour global coverage. The GPS
system consists of approx. 24 satellites which orbit around the Earth at
an altitude of approx. 20,200 km. The satellites transmit perfectly
synchronized data. However, depending on the position, the signals will
reach the receiver at a slightly different time. By adding the measured
time difference to the known position of the satellites it is possible to
calculate the ship’s position to within a few meters.
Page 6

CA42/50/52 Introduction and safety summary Chapter 1
6
DS42/50/52 Dual Station for the CA42/50/52 is available in 10” ATFT
color, 14” TFT color and 15” TFT color.
How to use this manual? The manual is written for the products:
CA42, CA50 and CA52, which all share the same type of software.
From hereon, these models are referred to as: CAXX.
It is a good idea if you make yourself familiar with the key functions,
menu structure and rotation of pages (screens) described in chapter 2
before you start out, and then proceed with section 2.7 Initial start-up.
For quick location of a certain term, please check the “Glossary of
terms” and the “Index” at the back of the manual.
How to interpret special marked key symbols, etc. in the manual:
+/-
Either the + (plus) or – (minus) key may be applied.
0-9
Alpha-numeric keys for insertion of figures.
A-Z
Alpha-numeric keys for insertion of letters.
)
Emphasizes important points.
1,3
Indicates that you should press the keys
[1]
and
[3]
to obtain what is
written in italic next to the keys.
1.2 Safety summar y
Precaution The operating unit should not be exposed to direct
sunlight, as “boiling” the display may cause too high temperatures
internally and subsequently damage parts of the unit beyond repair.
Power source, fuse and power cable Check that the DC power
supplied to the unit is within the range of 10 to 32 volts. Note that the
appropriate fuse must be employed (F6.3A). Ensure that the power cord
is firmly attached.
Grounding To reduce electrical interference and risk of electrical
shock, properly ground the unit to the ship’s ground using the ground
screw on the back of the unit. Good grounding should also be exercised
for connected equipment, refer to separate Installation manual.
Page 7

CA42/50/52 Fundamentals & initial start-up Chapter 2
7
2.1 Fundamentals of the PAGE and WINdow system
The CAXX DGPS ChartRadar with Echosounder has a multi-function
screen data presentation system. You can choose to have a full screen,
or a screen divided into e.g. a chart display and two data/chart displays,
etc.
The current active display is indicated by a highlighted frame around
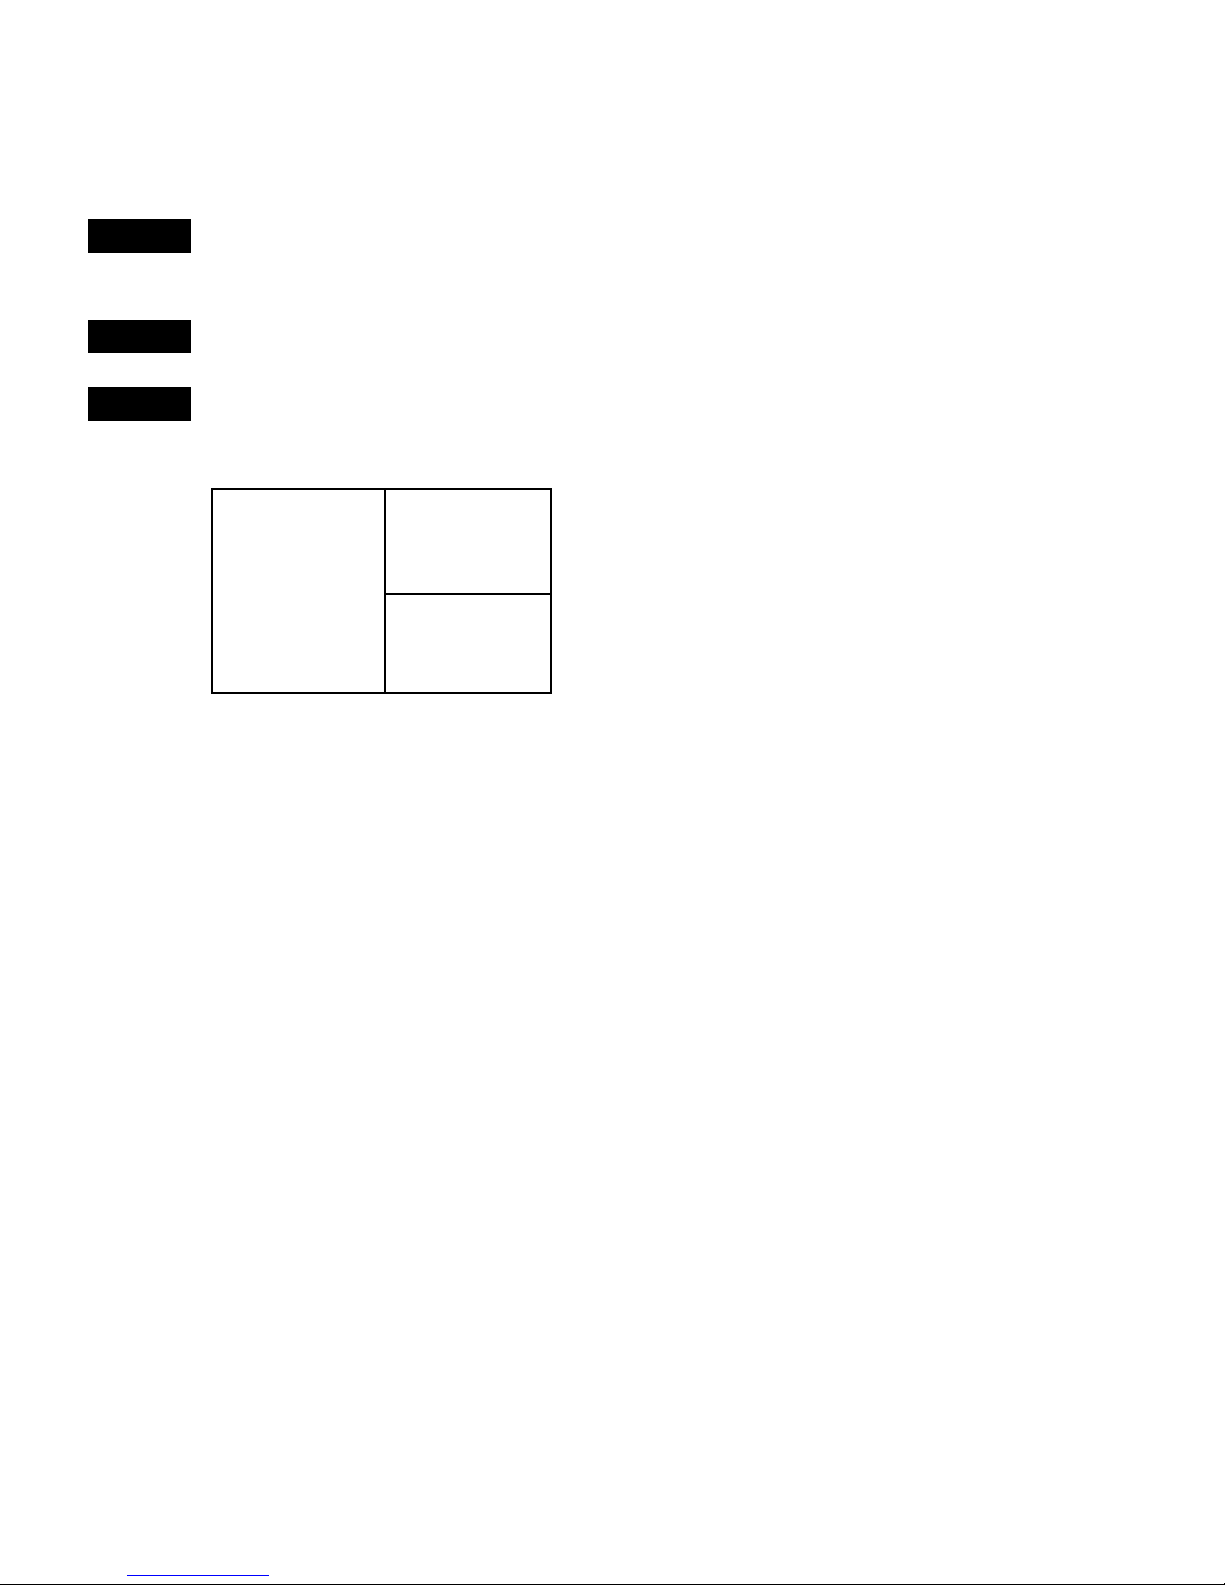
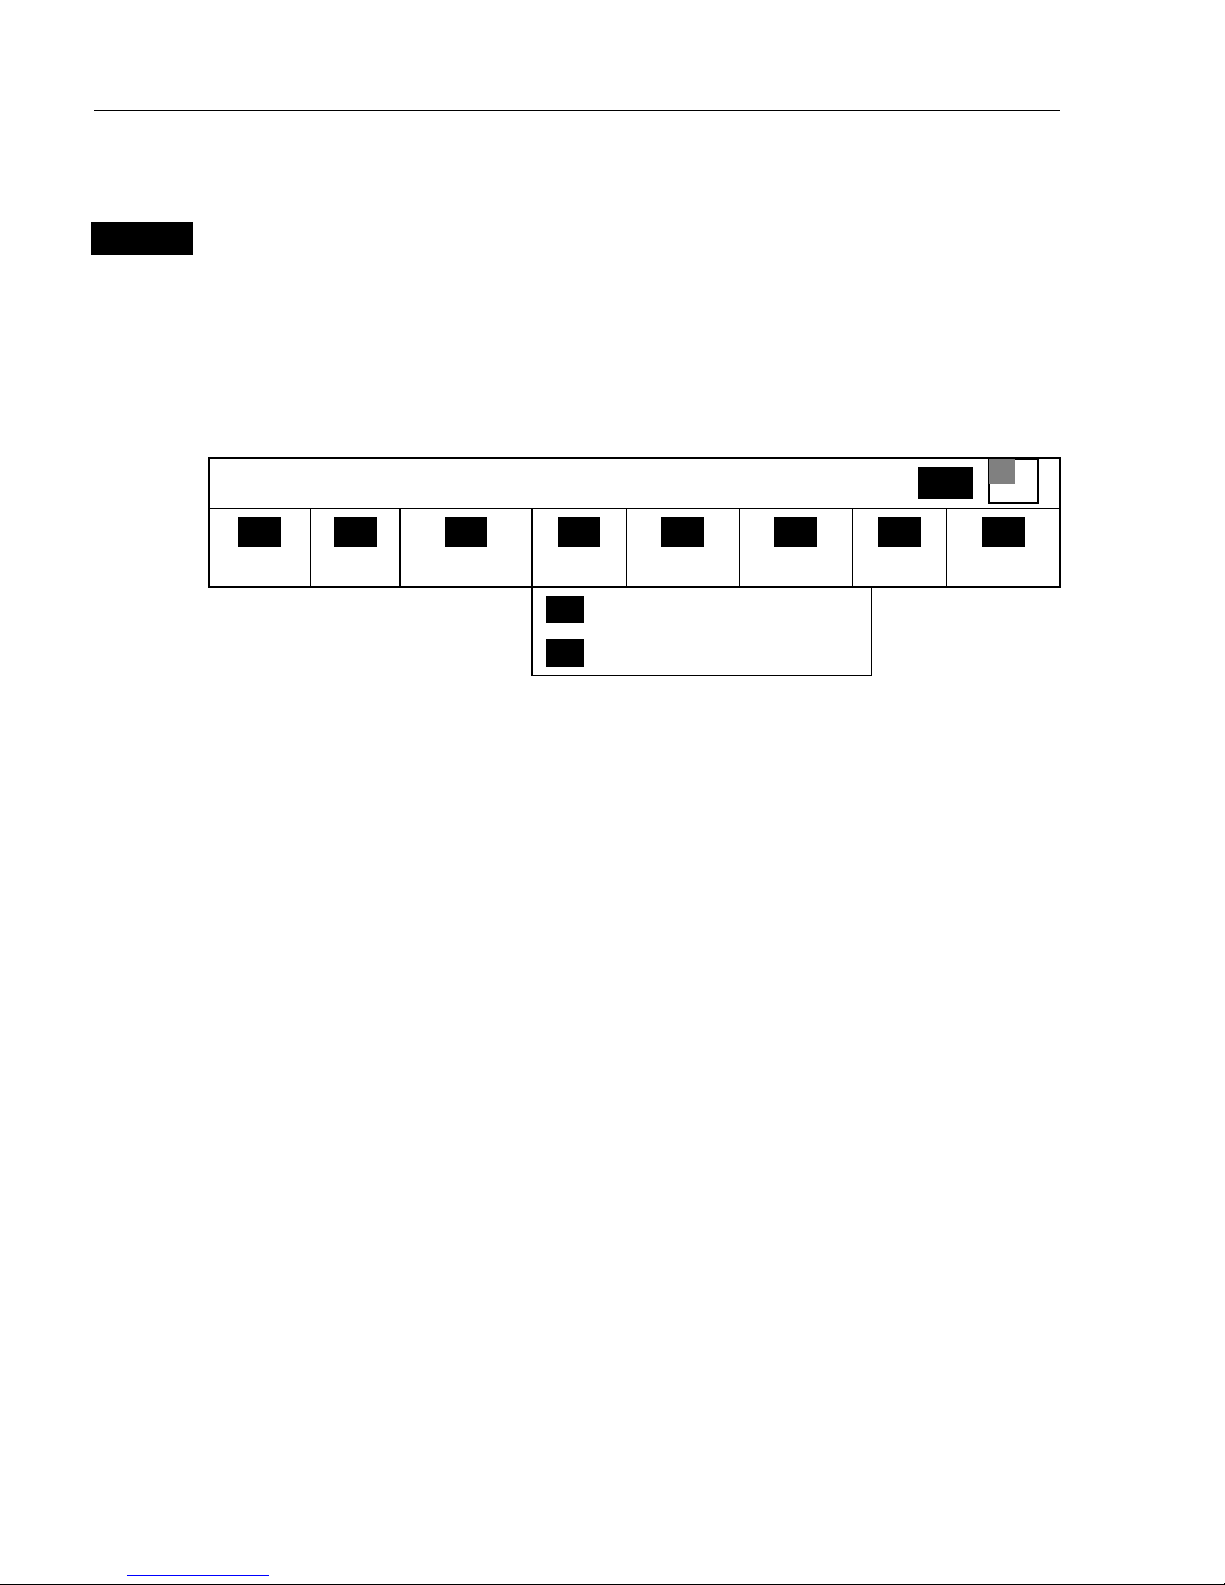
the active window. There are five screen combinations to choose from:
12
WINdow 0
43
56
1. Full (1/1) screen. 2. Four ¼ displays. 3. Two ½ displays.
12
4
65
3
4. & 5. Combination displays of one ½ and two ¼ displays shown
together in the same screen.
) Not all displays are available in any size windows.
Page 8
CA42/50/52 Fundamentals & initial start-up Chapter 2
8
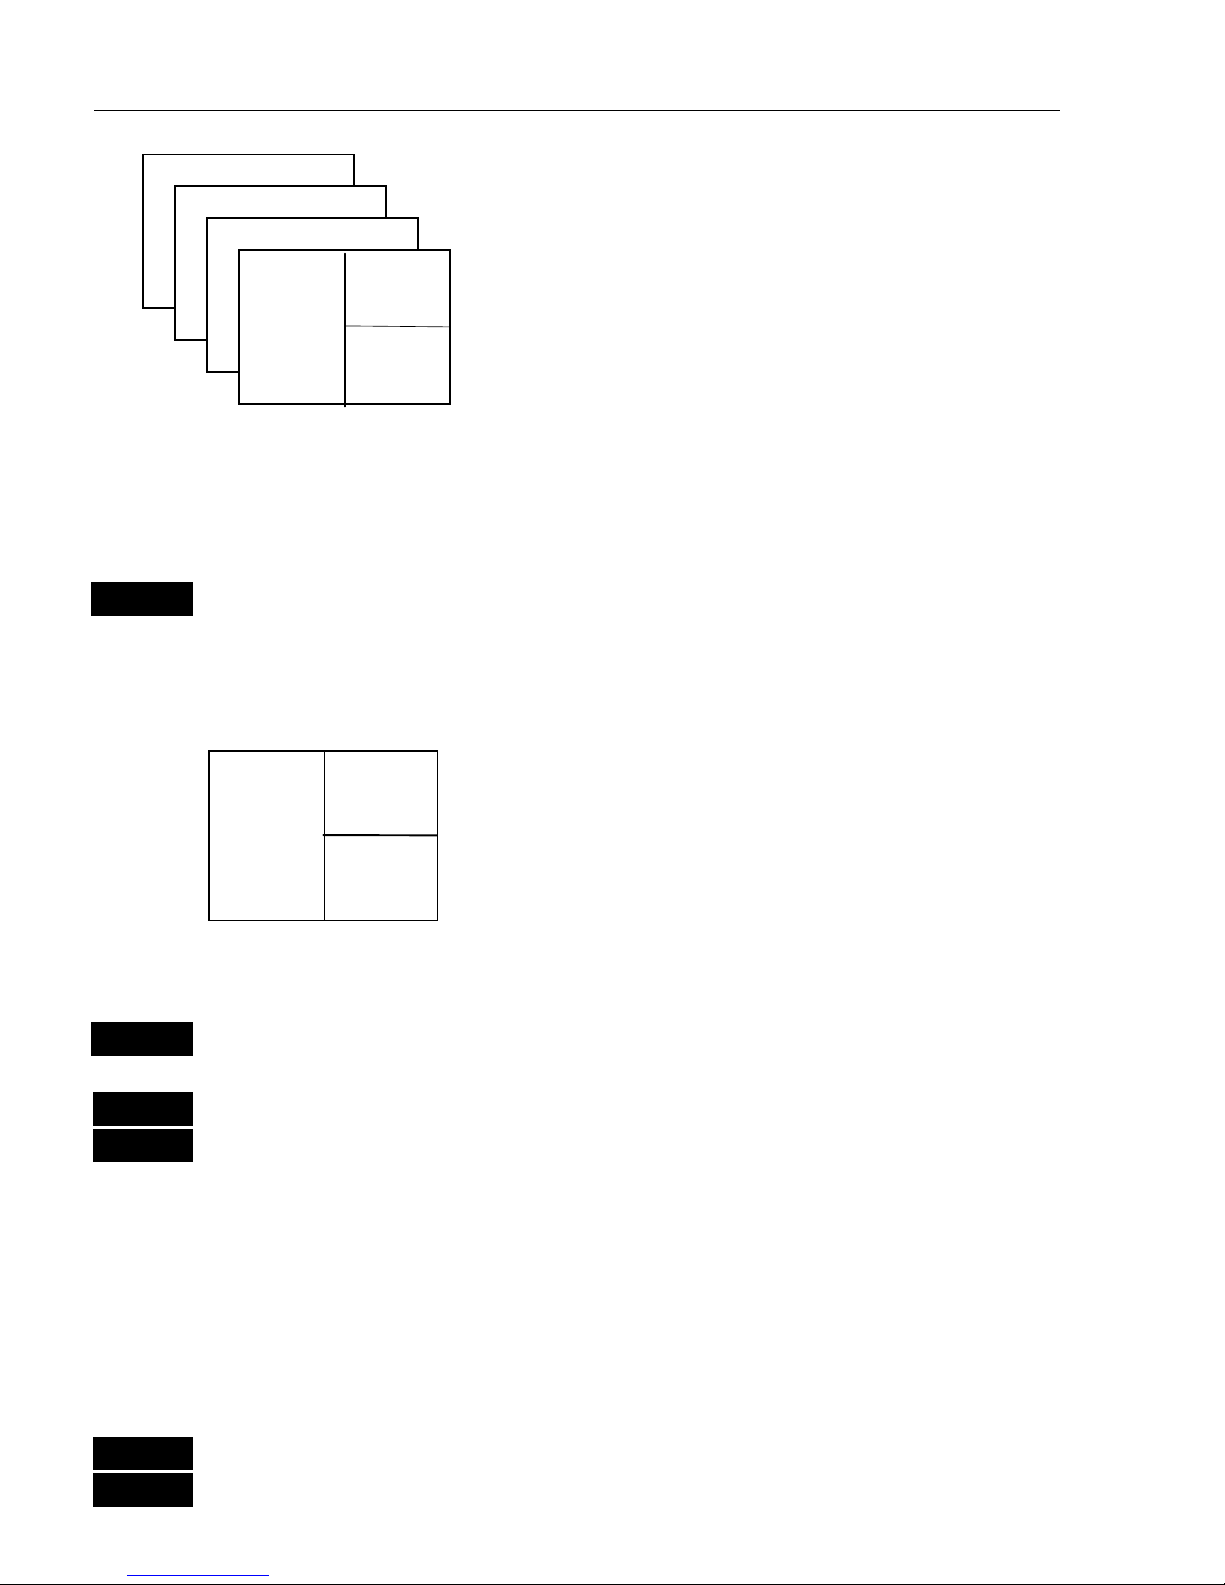
As many as 4 screen combinations or full
screens can be saved in 4 pages (layers).
Press the
[PAGE] key to toggle between the 4
pages, or hold the [
PAGE] key depressed for
two seconds to start a rotation of the 4 pages.
Press [
PAGE]
again to return to manual
operation.
To mix and match the various chart and data displays you wish to have
in the PAGE and WINdows presentation, you will first need to know
what is pre-set from the factory:
PAGE
Scroll through the four pre-set pages to see if you wish to exchange
any of the displays with a different one.
Example of how to edit a pre-set page:
window
5
window
2
window
3
We pretend that in this page, window 2 contains the
navigation display (highway), window 3 a chart
display in a large scale for overview, and window 5
a chart display in a smaller scale to enlarge a
certain area.
You now wish to insert the Position display in window 3 instead of the
chart display. This is the procedure:
WIN
Press the
[WIN]
key until the frame around window 3 is highlighted
MENU
Call up the menu bar, and…
2,1
then call up the POS menu and select “Position”
- you will now have the Position display in window 3 instead of the
chart display.
Example of how to edit a full screen to four ¼ displays:
We pretend that you are looking at a full screen which you wish to
divide into four ¼ displays. This is the procedure:
MENU First call up the menu bar, and…
2
then call up the POS menu - see example next page.
Page 9
CA42/50/52 Fundamentals & initial start-up Chapter 2
9
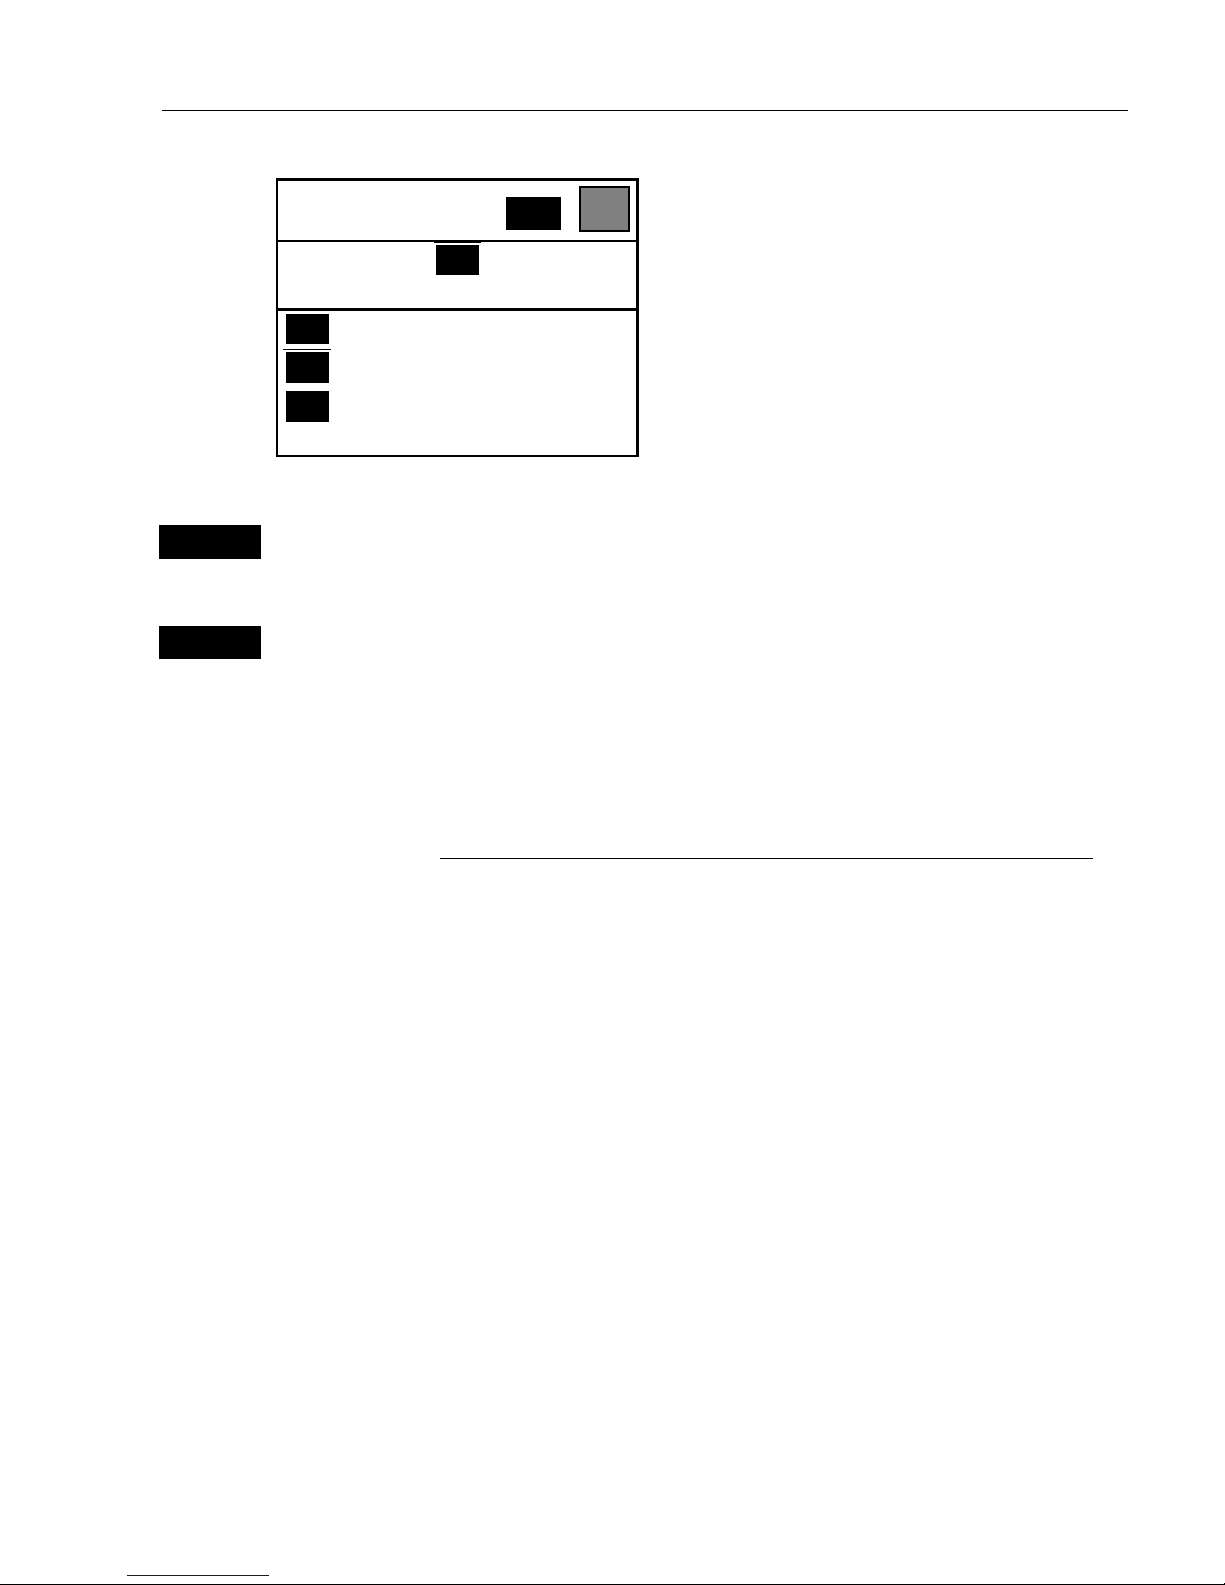
POSITION
WIN
_2_
POS
_1_ Position
_2_ Dual speed
_3_ Speed, course & depth
etc.
What you do now will determine which
WINdow the display you are about to
select will appear in.
Press the
[WIN]
key repeatedly to scroll
through the window system.
WIN
Press the [WIN] key once to select WINdow 1
-which is the left top quarter of the screen.
1
Select the Position display
- you will now have the position display presented in window 1.
The rest of the windows in this page i.e. window 2, 3 and 4 will contain
the displays which were pre-set from the factory. They can all be
exchanged with new displays at your choice.
) However, the same display can not appear twice on the same page,
so in case you are trying to select the same display in a second
window, this is what will happen:
As per above example, you have selected the Position display in
window 1, but it may just happen that the Position display was pre-set
to window 2 – therefore window 2 will now show the legend: “ Select
display via MENU.”
You may select the same display to appear on different pages, but not
on the same page.
) An exception is the radar display, which only can appear in ½
window or full screen, and you can only have the radar display appear
in one page at a time. You can not toggle from page to page and see
different radar displays.
Page 10
CA42/50/52 Fundamentals & initial start-up Chapter 2
10
2.2 Key functions
A description of the key functions is available at the start-up display in
the Quick guide. Some of the key functions are general and can be
applied at any time, other key functions are related to a certain menu(s)
and can only be applied when in the appropriate menu.
WIN
Toggles between windows. The active window will have a highlighted
frame. Only activated windows are operable.
PAGE
Toggles between four pre-selected pages (screens). Hold two seconds
for automatic rotation of pre-selected pages. A new, single press on
[PAGE] will return to normal operation.
MENU
Turns the menu bar on/off. Exits any data display without taking any
action (except the radar function).
ENT
Opens for/confirms insertion and editing of data (except the radar
function). Calls up information on marks, waypoints, etc. on chart
together with several INFO windows from a chart display. Gives
access to setup displays. Exits radar control and setup menus.
Moves cursor in data displays and charts + activates cursor on chart.
Moves left and right in the menu bar. Moves VRM up/down in echo
display.
MOB
Hold two seconds to activate the MOB –“Man overboard” function,
which starts a track and provides guidance back to the MOB position.
ZOOM
+ IN
ZOOM
- OUT
Zooms in for greater chart details (smaller scale) / zooms out for better
overview (larger scale). Increases/decreases range in radar function.
+and– toggles between available values.
GAIN+ GAIN+
(plus) and
GAIN-
(minus) will adjust presentation of received
GAIN-
echoes and radar targets.
ECHO
A-SCP
Hotkey to Echo 1 i.e. jumps to window on the screen with Echo 1
display; if none: inserts Echo 1 in active window.
Toggles
A-SCOPE
on/off.
Page 11

CA42/50/52 Fundamentals & initial start-up Chapter 2
11
RADAR
TX
Hotkey to radar display. Hold two seconds to start transmission, go in
Standby or Power off.
CHART
GOTO
Hotkey to Chart 1 i.e. jumps to window on the screen with Chart 1
display; if none: inserts Chart 1 in active window.
Activates INFO window with choice of navigation modes.
PLOT
Plots down the actual ship/cursor position on chart. Activates INFO
window with the possibility of plotting a waypoint, route, line, etc.
ADJ
Activates radar control menu + toggles between 1stand 2ndhalf of the
control menu in half screen displays.
0-9
A-Z
The alpha-numeric keys inserts and selects data in data displays.
Keys 1-9 are also Quick scales – selects fixed scales for charts or fixed
ranges for radar. The 0 key will center the cursor/ship on the chart and
activate/deactivate ‘off-center to cursor’ on the radar display.
CLR
Turns cursor off in chart display. Deletes data in enter or edit mode.
From radar control menu: Returns Tune, Gain or Sea to AUTOmatic
mode, and clears the EBL and VRM markers.
PWR
Calls up a window where you can adjust the lighting in the screen,
background light in keypad, and select Daylight displays, Night display
or custom made display. Hold two seconds to turn the power off.
Page 12
CA42/50/52 Fundamentals & initial start-up Chapter 2
12
2.3 Menu bar
MENU
Toggles the menu bar on/off
To fit in the complete menu bar across the screen, some of the menus
have been abbreviated. However, the last selected menu will be
highlighted, and if it’s an abbreviation of the menu, then the complete
menu title is written above the menu bar e.g.:
NAVIGATION
WIN
_1_
CHART
_2_
POS
_3_
WP/RTE
_4_
NAV
_5_
ECHO
_6_
RADAR
_7_
MISC
_8_
SETUP
_1_ Highway
_2_ Waypoint navigation, etc.
Having selected e.g.
4:NAVIGATION
from the menu bar, its associated
menus will drop down. Key in the number next to the function you
wish to call forward, or use the cursor key to highlight the function and
press
[ENT].
If you want to switch to a different menu, use the cursor key to move to
the adjacent menu.
Most functions in the menus are general, and can be called forward at
any time, but a few are related to a certain menu(s) and can only be
called forward or activated in the appropriate menu. Inactive functions
in the menu will have a different color from the rest of the functions.
Which window is active (see top line of the menu to the right) can also
have something to do with what functions are available. Use the
[WIN]
key to toggle between active windows and keep an eye on the functions
in the menu to see how they may change color.
The menu bar will disappear from the screen at the selection of a
function, or by pressing the
[MENU]
key. Besides, if not used, it
automatically turns off after 30 seconds.
Page 13
CA42/50/52 Fundamentals & initial start-up Chapter 2
13
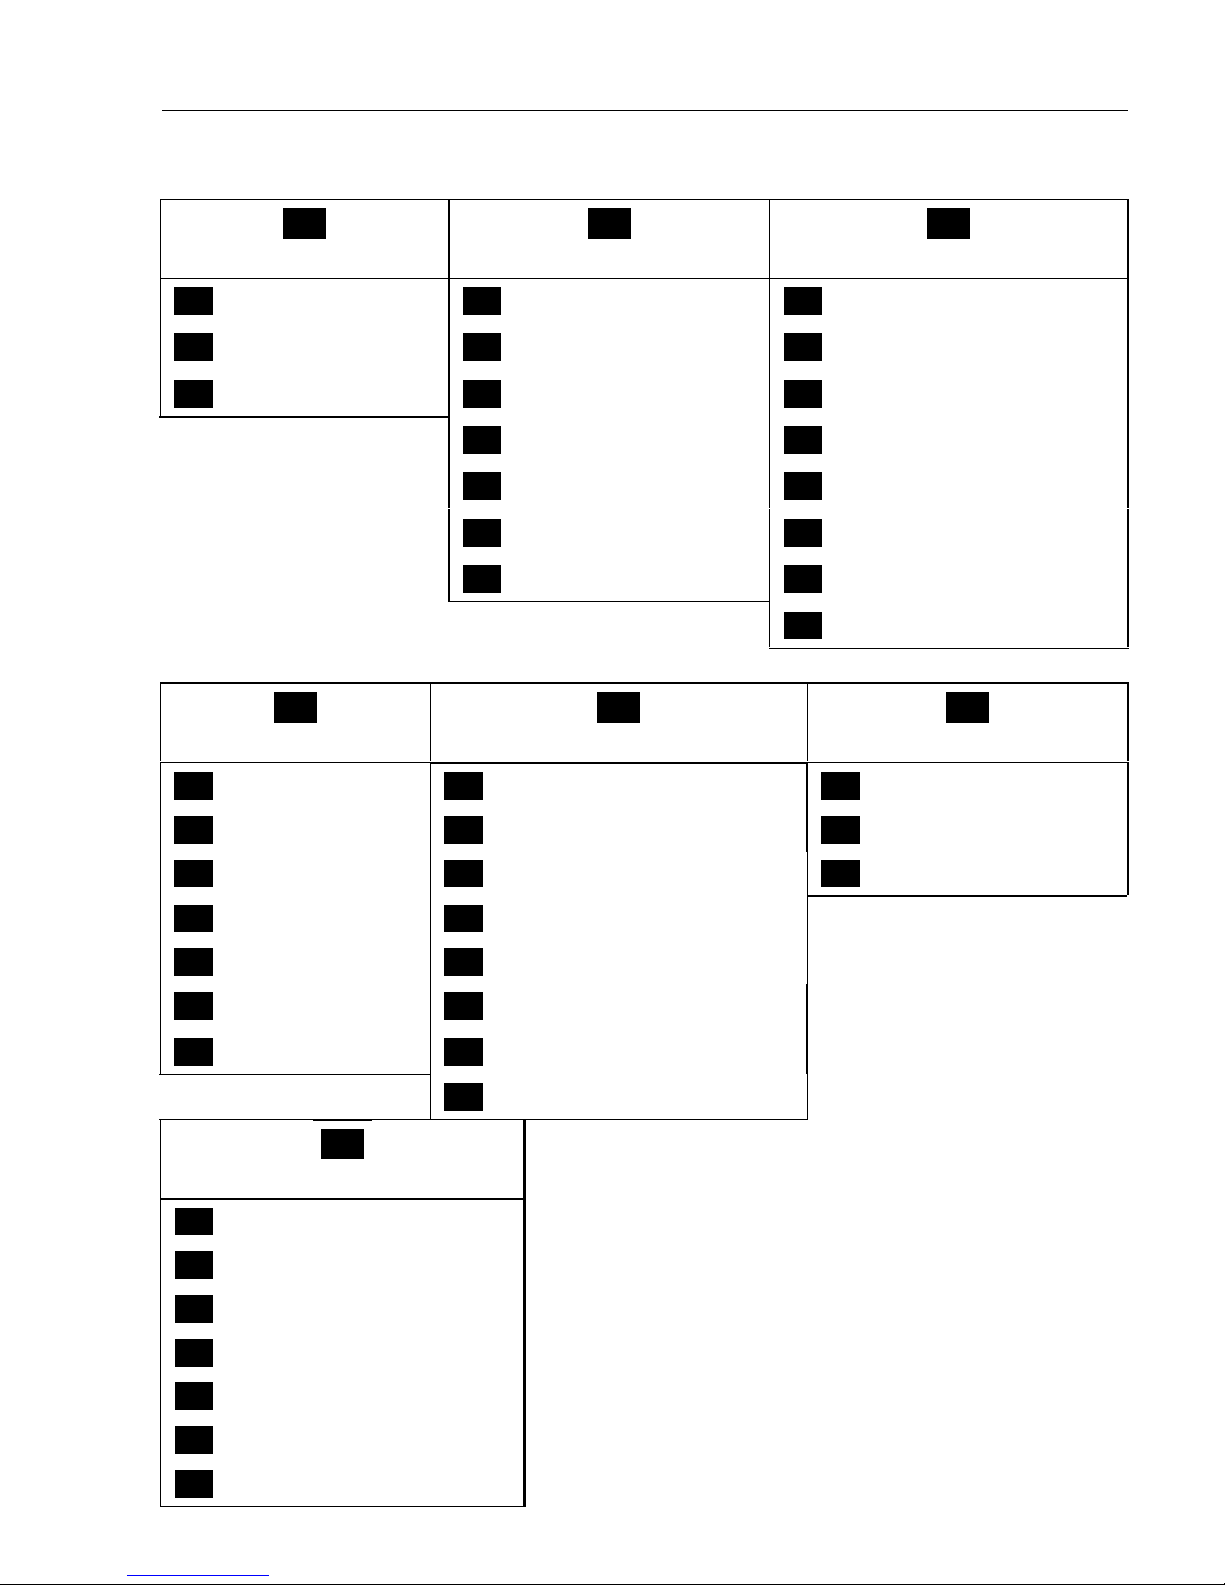
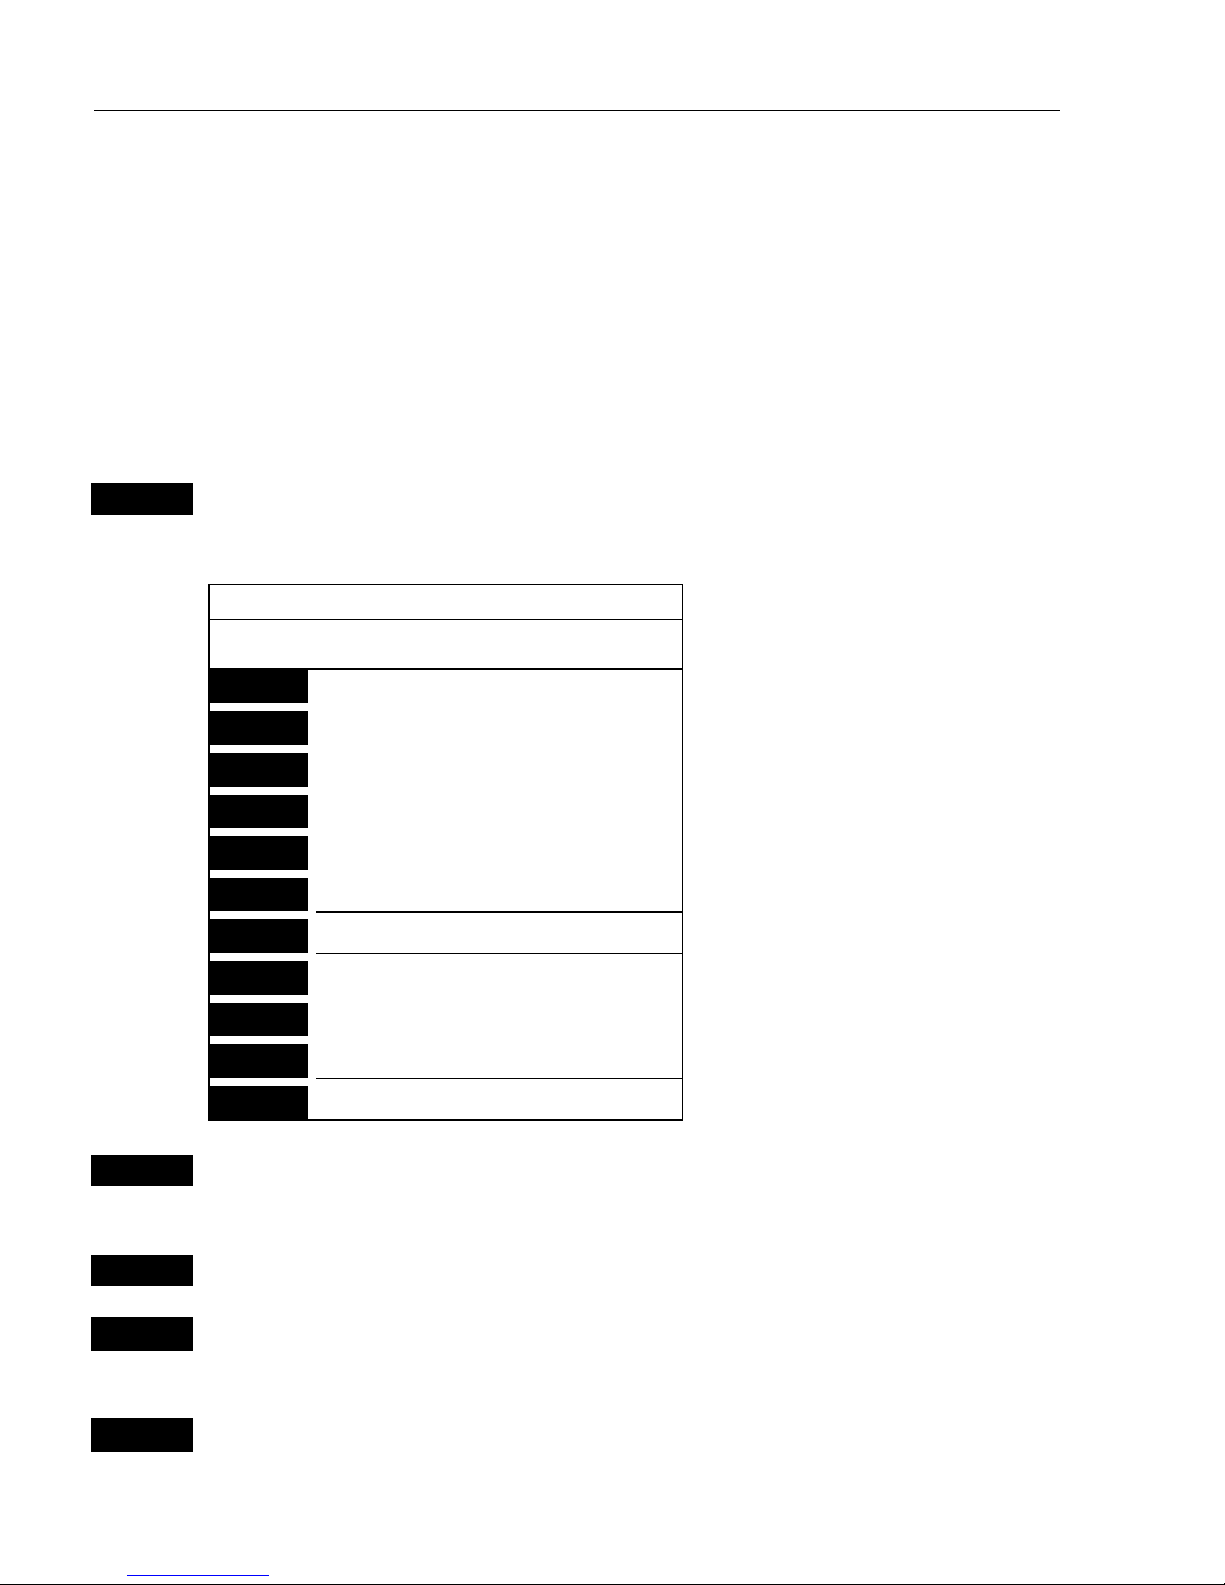
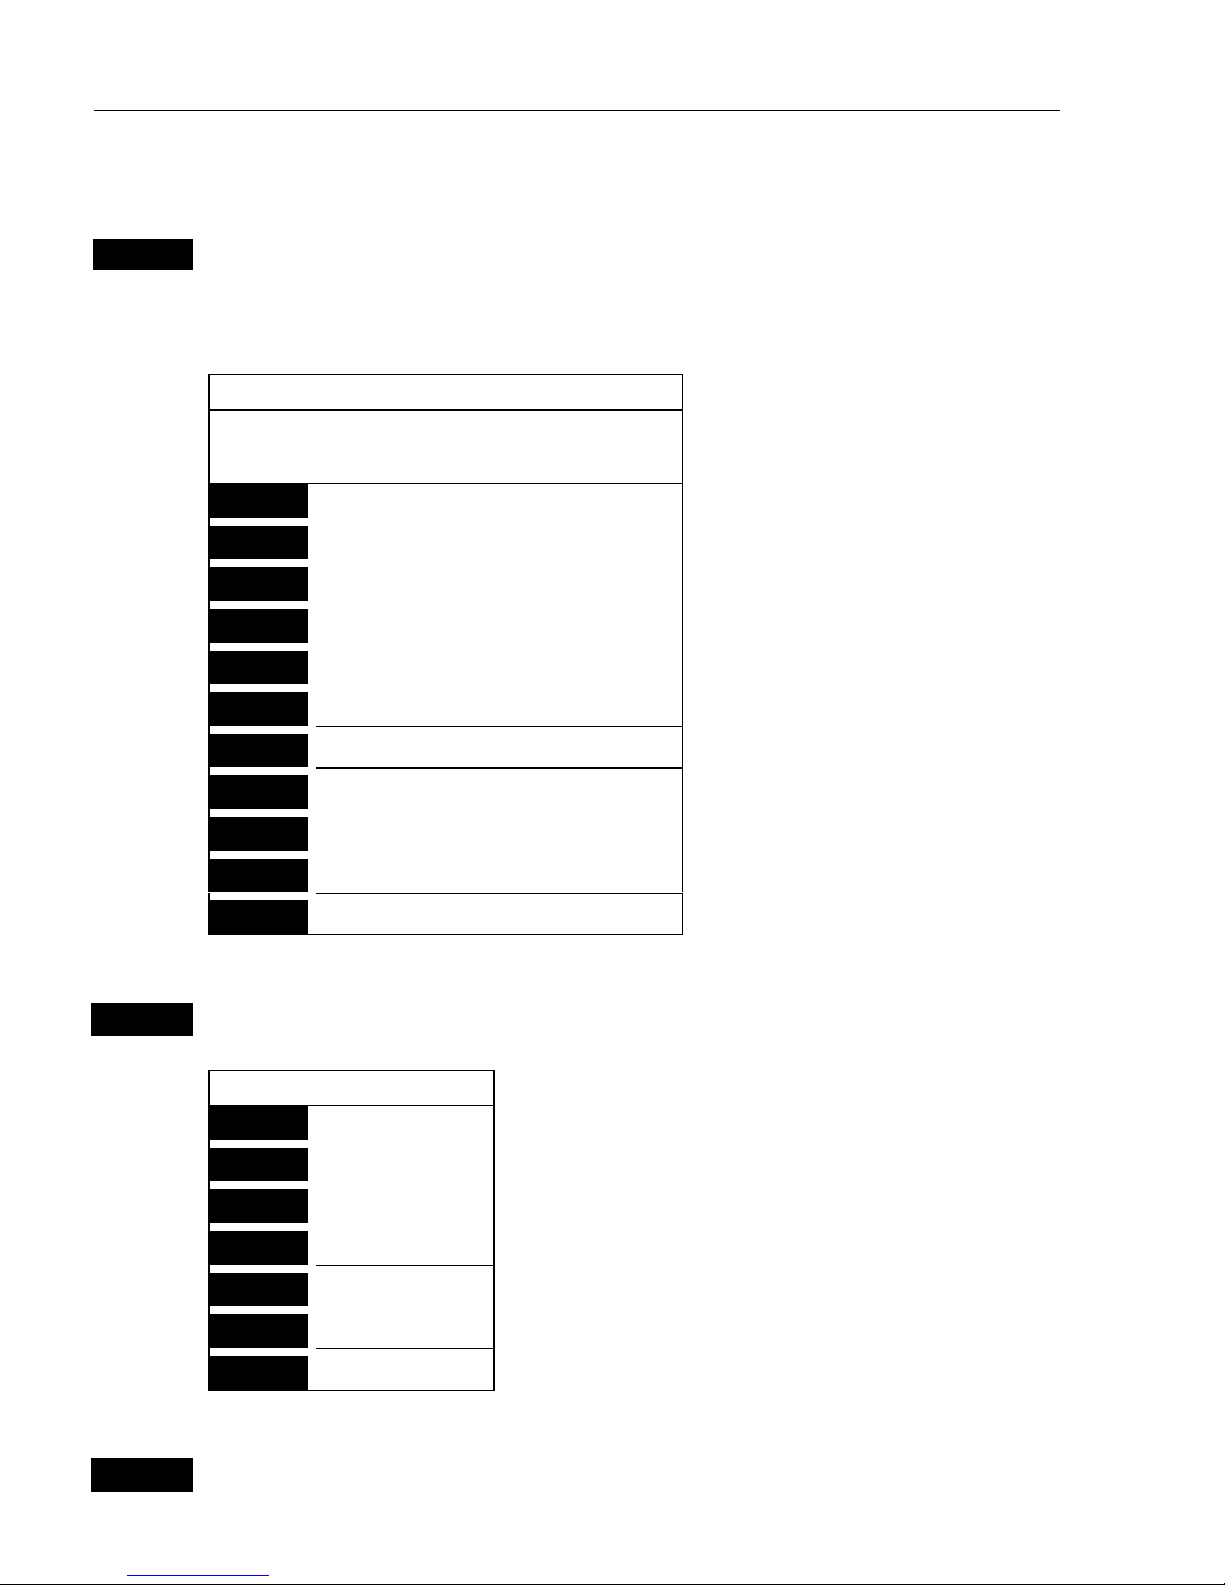
2.4 Menu layout
_1_
CHART
_2_
POS
_3_
WP/RTE
_1_ Chart 1 1:26400000 _1_ Position _1_ WP list
_2_ Chart 2 1:6600000 _2_ Dual speed _2_ Routes
_3_ C-MAP cartridges _3_ Speed, course & depth _3_ Route calculation
_4_ Speed diagram _4_ Lines
_5_ Satellites _5_ Start track
_6_ DGPS _6_ Stop track
_7_ SDGPS _7_ Tracks
_8_ Targets
_4_
NAV (OFF)
_5_
ECHO
_6_
RADAR
_1_ Highway _1_ Echo 50kHz _1_ Radar
_2_ Waypoint navigation _2_ Echo 200kHz _2_ Dual radar
_3_ Route navigation _3_ Bottom expansion 50kHz _3_ Radar setup
_4_ Track navigation _4_ Bottom expansion 200kHz
_5_ Anchor guard _5_ VRM expansion 50kHz
_6_ Trim & highway _6_ VRM expansion 200kHz
_7_ Set & drift _7_ Depth & temperature diagram
_8_ Echosounder setup
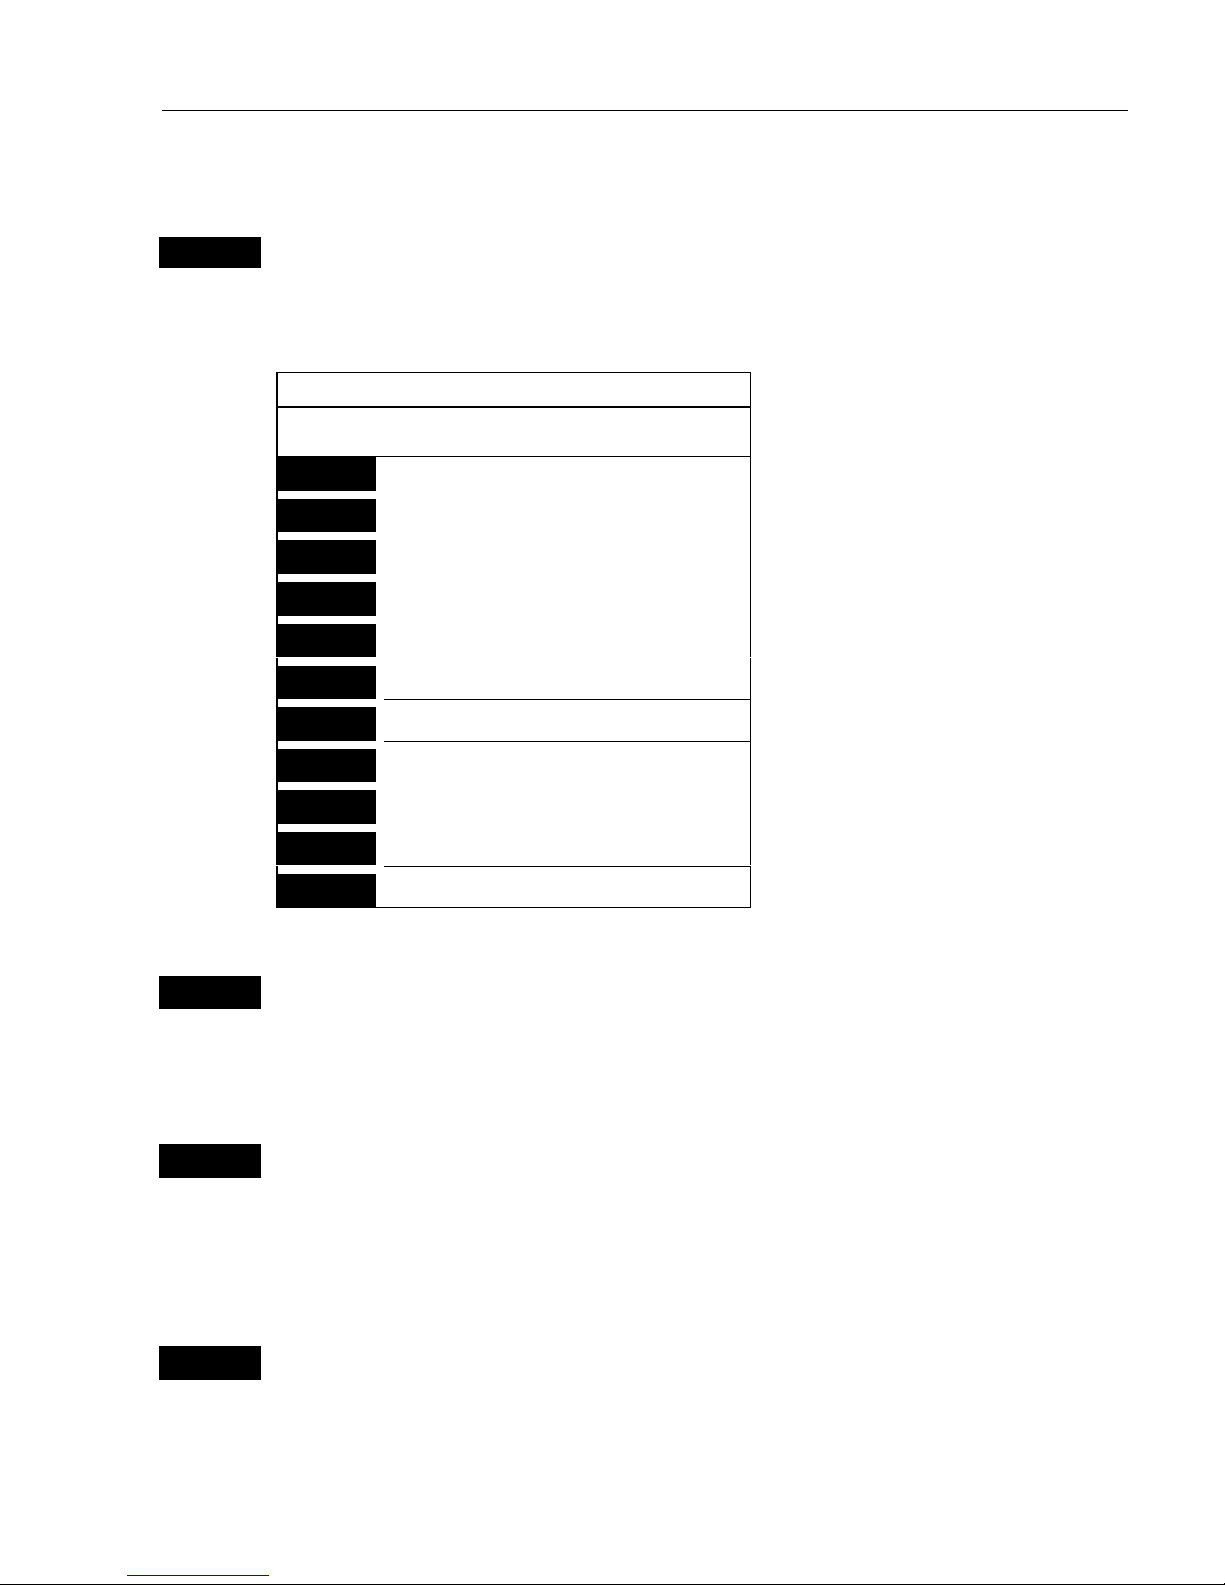
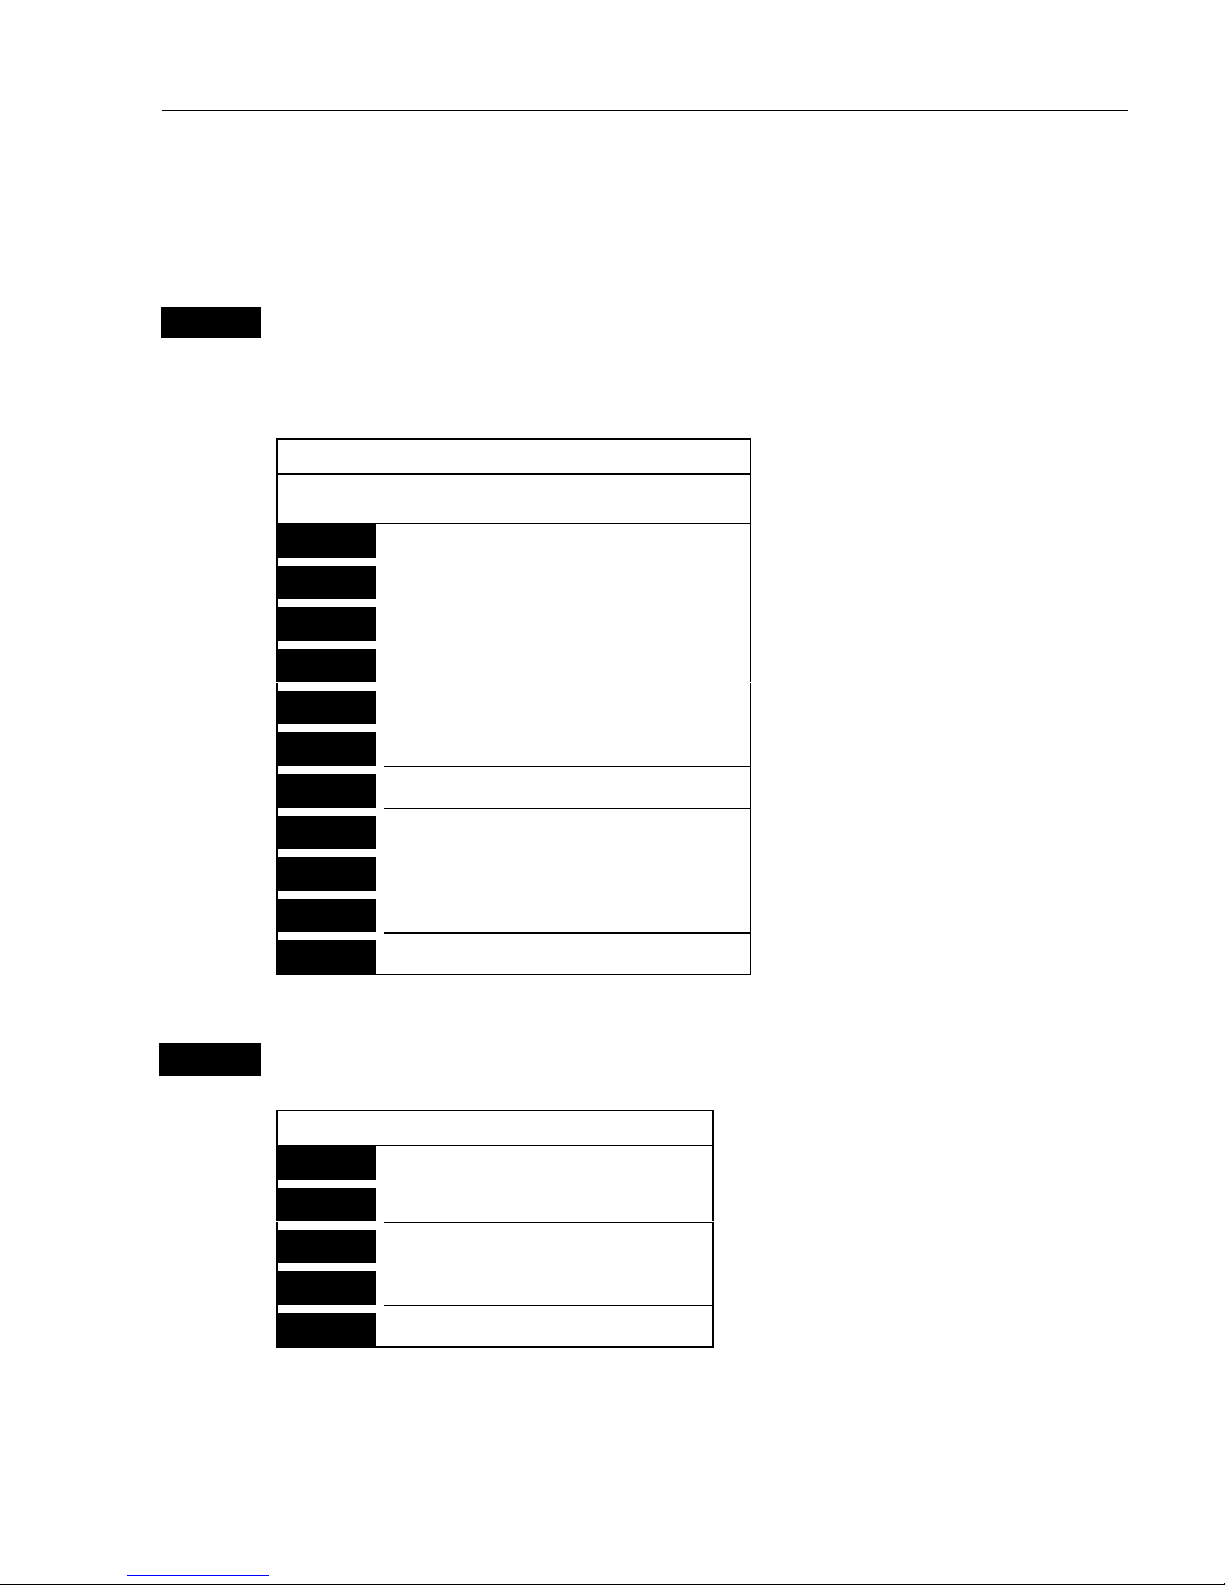
_4_
NAV (ON)
_1_ Highway
_2_ Turn NAV off
_3_ WP advance
_4_ Restart to approaching point
_5_ ETA & AVN
_6_ Trim & highway
The NAV menu is dynamic and will adapt to the
function which is currently active.
← When this menu appears, then one of the
Navigation modes is active.
_7_ Set & drift
Page 14
CA42/50/52 Fundamentals & initial start-up Chapter 2
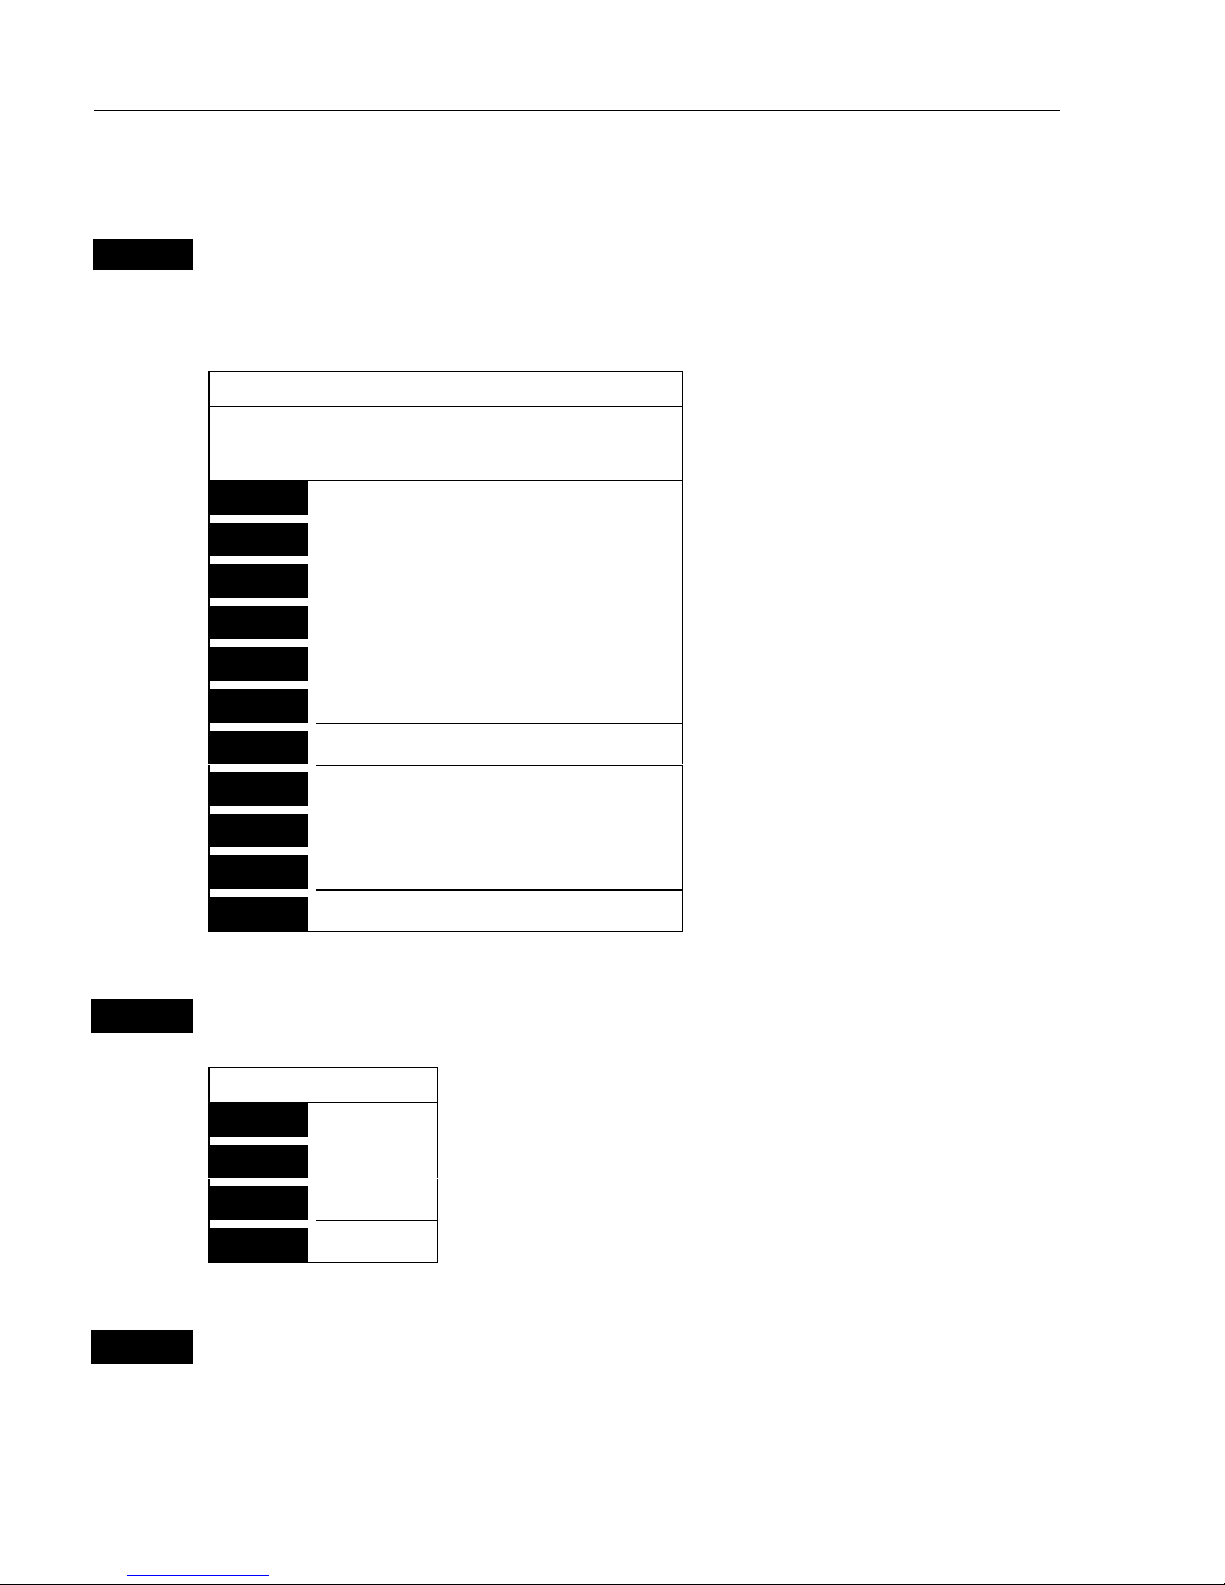
14
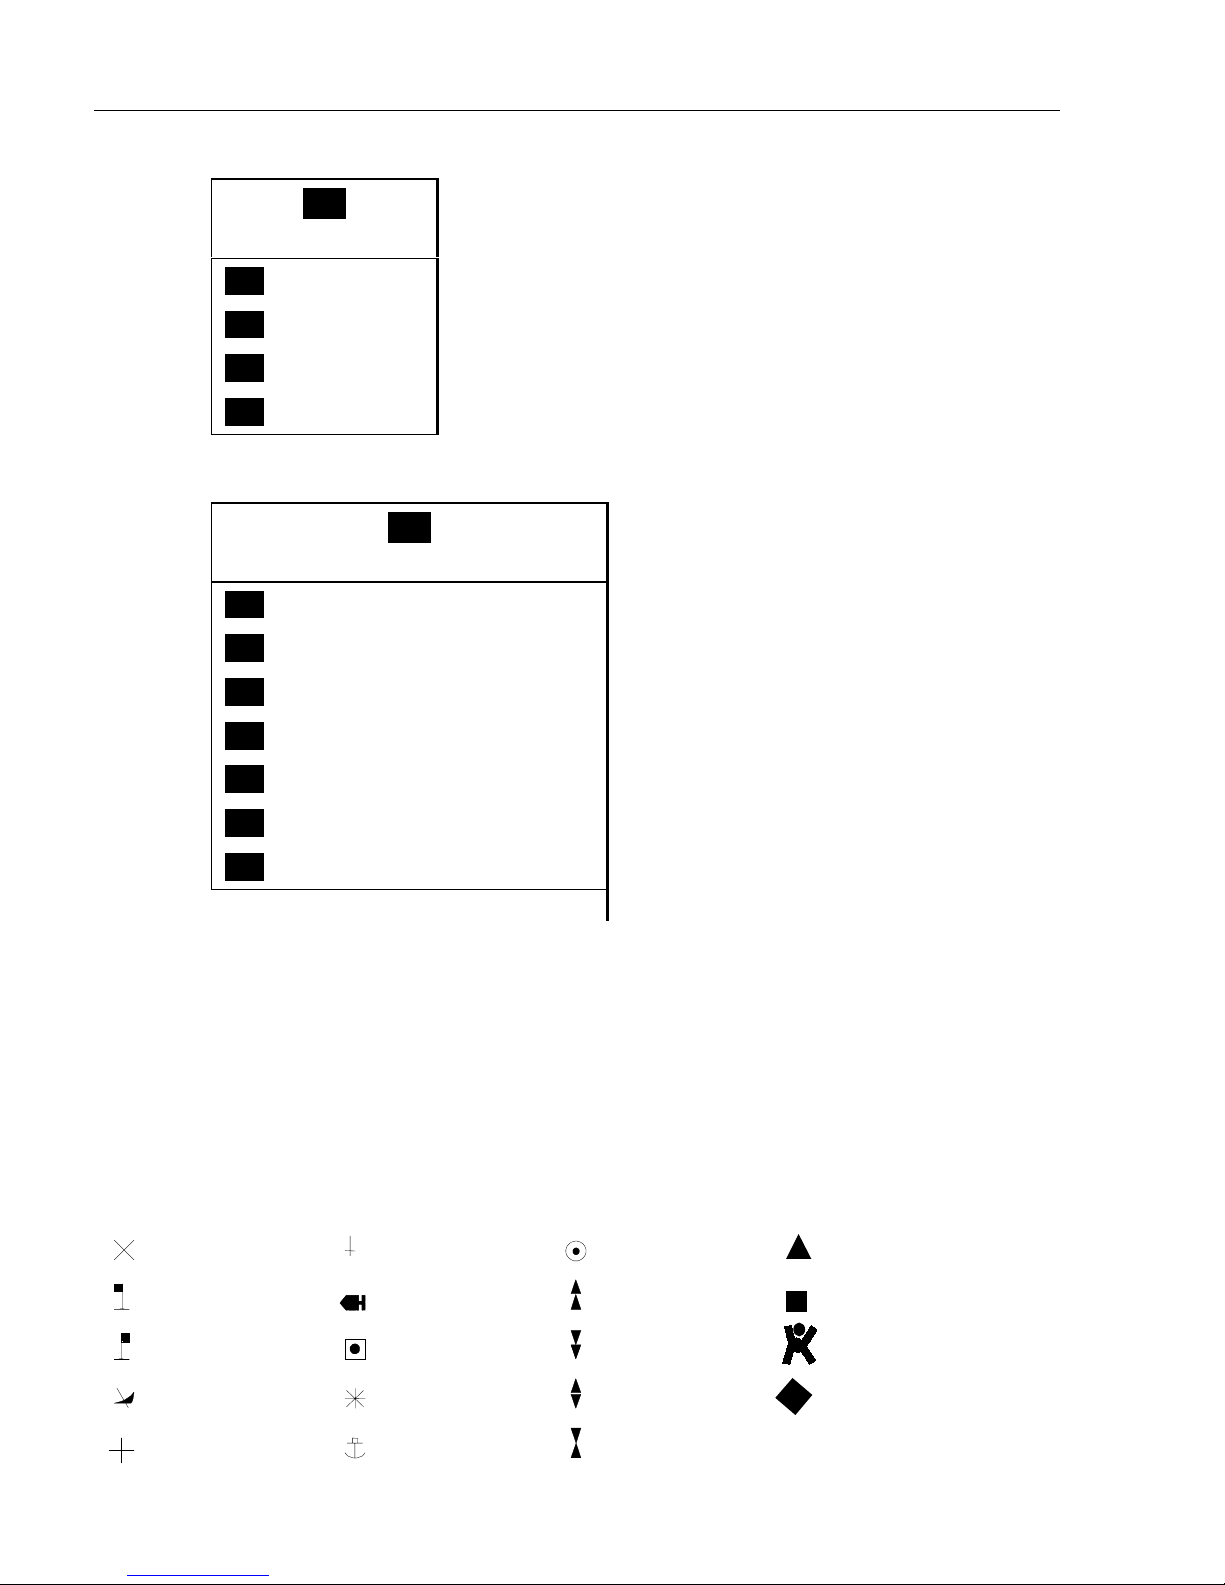
_7_
MISC
_1_ Wind
_2_ MOB position
_3_ DSC alarm
_4_ Data transfer
_8_
SETUP
_1_ Speed alarm, units & language
_2_ NMEA interface
_3_ Alarm/log output
_4_ Decca lanes
_5_ Loran-C
_6_ Display color
_7_ Factory settings
When selecting a sub-menu in the
SETUP menu, the display will
always appear in a pop-up window.
Which means that it will not take the
place of another display, and it will
not mess up the pre-set displays on
the screen.
And once you have confirmed the
changes, or just want to exit the
display, the display will disappear
from the screen, as you have no
further use for it.
2.5 Choice of symbols
Waypoints and other points appearing on the screen can be marked by
one of 18 symbols + 8 EVENT marks in small or large symbols.
Waypoint
Red buoy
Green buoy
Wreck
Danger
Beacon
Fish
Platform
Rock awash
Harbour
Marker
North
South
East
West
Starboard
Port
MOB
EVENT 4
(1 of 8 types in
diamond shape)
Page 15

CA42/50/52 Fundamentals & initial start-up Chapter 2
15
2.6 Naming of routes, points, etc.
First select the key with the desired letter, then you can either repeat
the keystrokes, which will toggle between e.g. A,B,C,1, or once you
have selected one letter you can go back and forth in the alphabet by
means of the +/- keys. Use the cursor key to go to next space or to go
back one space if you make a mistake.
Depending on the selected language the 0 (zero) key will hold special
characters e.g. ЖШЕДЦЬС, and the 9 (nine) key will hold: (empty
space) . Press the
[CLR] key to delete everything from cursor position and to the
right of cursor on that row.
2.7 Initial start-up of the CA42/52 MKII unit
PWR
To turn on the power, press and hold the [PWR] key till a picture
appears on the screen
PAGE
Press [PAGE] to scroll through a quick guide which informs of the use
of the keys and where you can enter owner’ssetup
ENT
Press [ENT] when ready to assume normal operation
PWR
Press
[PWR]
again to adjust the lighting in the screen and select day or
night display, etc., move around in display by means of the cursor key
and change settings with +/- keys, and…
ENT
Confirm with
[ENT]
The unit will now perform a fully automatic start-up and find the correct position without further data entries. The start-up phase is completed when a position appears in the position display – see section 4.1.
The radar function should not start transmission before the antenna is
properly warmed up - refer to section 8.2.3 Start transmission.
Page 16
CA42/50/52 Fundamentals & initial start-up Chapter 2
16
The echosounder function has a demo program, which can be activated
in the Echosounder setup display, refer to section 7.8.
) When a transducer has been installed and selected, and the Echosounder function is set up and ready to perform, please make sure that
the demo mode is switched OFF.
Select display language:
MENU
Call up the menu bar, and…
8,1
press
[8]
and
[1]
to call up the language display
Go to the bottom line in the display
+/-
Select language
ENT
Confirm entry
2.8 Turn power off
PWR
Call up INFO window, and…
PWR
Press and hold until screen turns black
The CAXX is now turned off. All data and setups are saved and stored
in the internal memory and, of course, will be available next time the
unit is turned on.
Page 17
CA42/50/52 Chart menus and INFO windows Chapter 3
17
3.1 Chart menu
_1_
CHART
_1_ Chart 1 1:26400000
- see section 3.1.1.
_2_ Chart 2 1:6600000
- see section 3.1.1.
_3_ C-MAP cartridges
- see section 3.2.
) Forsafetyreasons,navigationwithelectronicchartsshouldalways
be combined with authorized paper charts.
3.1.1 Charts
It is possible to have two charts in different scales on the screen at the
same time. Each chart can be operated individually, and each will have
it’s own cursor and individual chart setup.
MENU
Call up the menu bar, and…
WIN
select the WINdow in which the large-scale chart should appear, and…
1,1
press
[1]
and
[1]
to call up Chart 1in scale 1:26400000
MENU
Call up the menu bar, and…
WIN
select the WINdow in which the detailed chart should appear, and…
1,2
press
[1]
and
[2]
to call up Chart 2 in scale 1:6600000
The chart display opens for the built-in world chart, as well as the
optional, detailed C-MAP electronic charts (C-MAP cart must be
inserted in the drawers below the CA42/50/52 MKII’s keypad).
) Shortcut feature:
CHART
GOTO
Hotkey to Chart 1 i.e. jumps to window on the screen with Chart 1
display; if none: inserts Chart 1 in active window.
Page 18
CA42/50/52 Chart menus and INFO windows Chapter 3
18
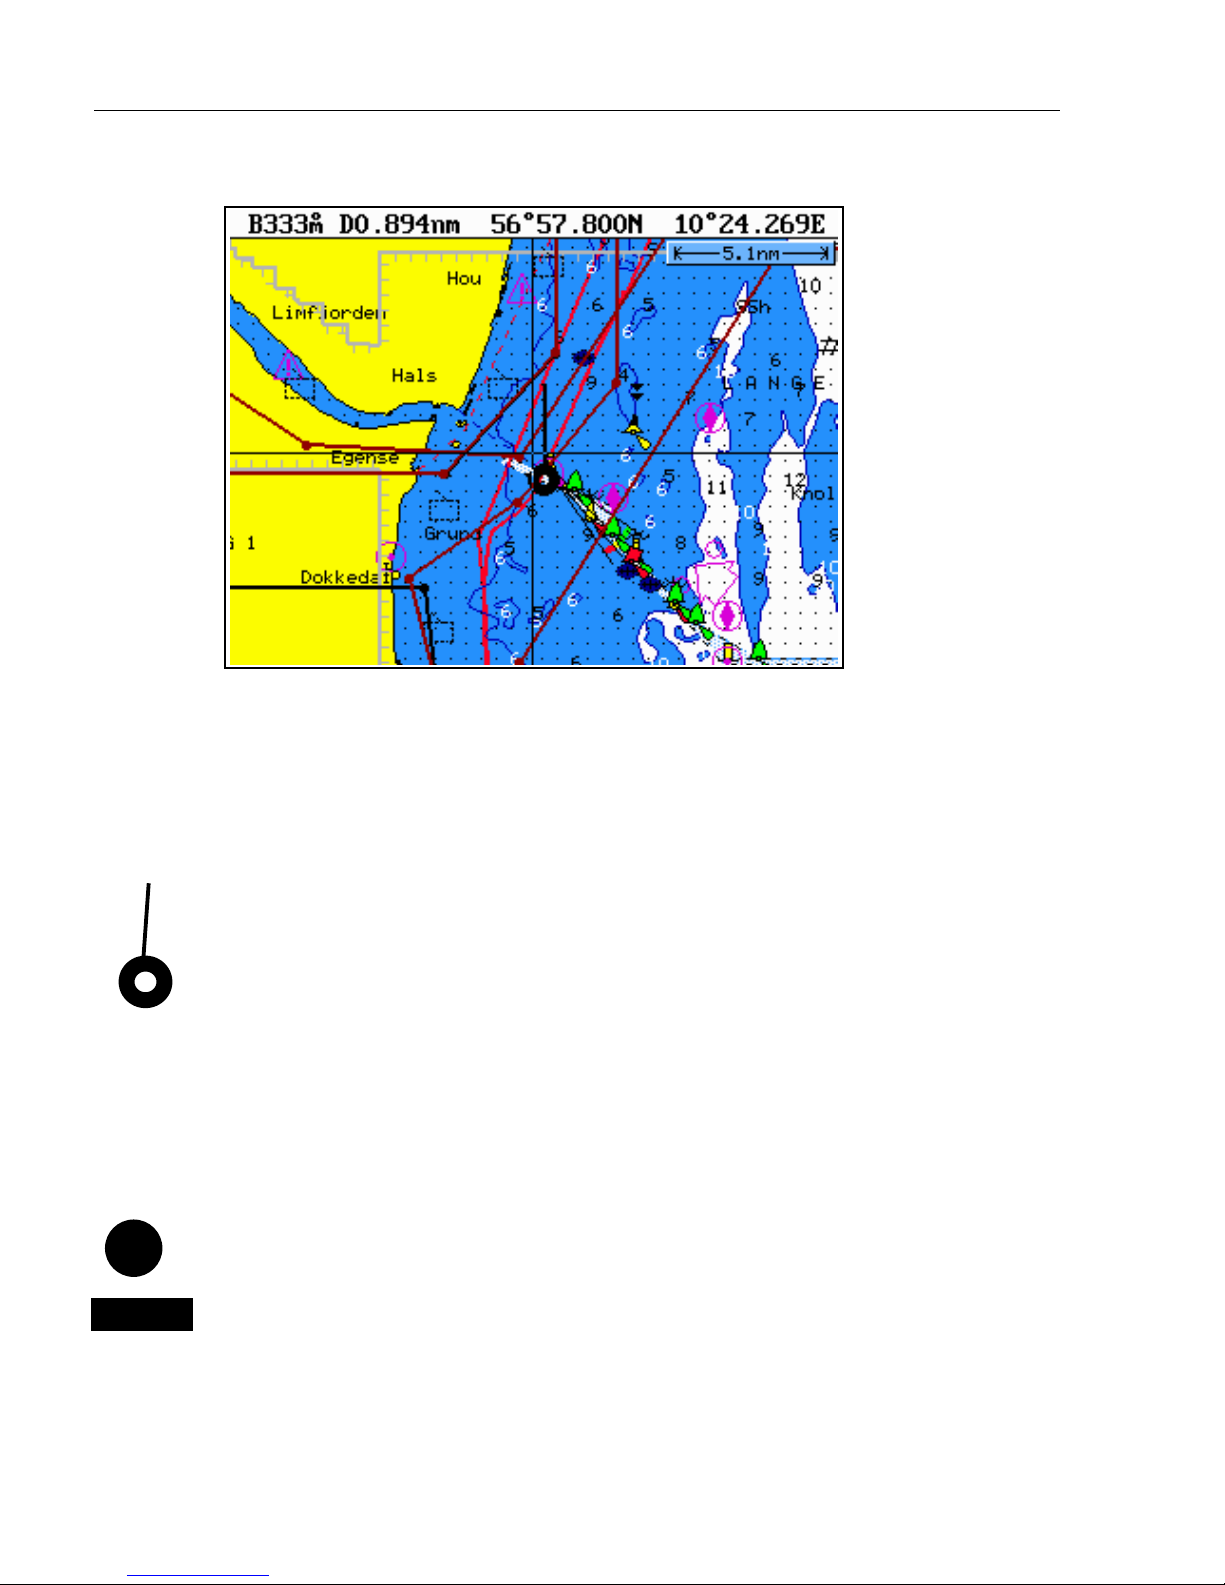
Chart range indicator (5.1 nm) can be set ON/OFF in “Chart setup”.
The top line of the chart display (with cursor off) will give you ship’s
position, speed, course and status of differential data – refer to section
4.1 Status indicator and accuracy.
With cursor on, the top line will show the cursor position in lat/long,
bearing and distance from actual position to cursor position.
The ship symbol indicates the present position on the chart and the
pointer informs of the actual true course (course over ground). There is
a built-in autohome function which automatically moves the chart to
maintain the ship symbol in the display (with cursor off).
) Press
[ENT], [0]
to center the ship on the chart.
Cursor function
With chart display active, press the cursor key to activate the cursor
and…
CLR
Press
[CLR]
to turn the cursor off.
) The chart cursor will automatically switch off if not used in the last
five minutes. The chart will update and bring the ship’s position to the
center of the screen.
Page 19

CA42/50/52 Chart menus and INFO windows Chapter 3
19
Use the cursor key to move cursor in any direction on the screen – the
chart will automatically adjust when cursor reaches the edge of the
screen.
) Press
[0] to center the cursor on the chart.
) In data displays the cursor will be shown in form of either a ruling
box around the active field, or the active field will be highlighted.
Zoom function – with cursor on, the zoom function will zoom around
the cursor. With cursor off, the zoom function will zoom around the
ship´s position.
ZOOM
+ IN
Zoom in for details (smaller scale)
ZOOM
- OUT
Zoom out for overview (greater scale)
1-9
) Use one of the shortcut keys to quickly change the chart scale:
Press [1] = 1:6.600.000,
[4] = 1:200.000,
[7] = 1:6.000,
[2] = 1:2.000.000,
[5] = 1:60.000,
[8] = 1:2.000,
[3] = 1:600.000,
[6] = 1:20.000,
[9] = 1:600
Chart details may not be available in all scales in all areas. Noncovered areas will be marked as hatched or all blue with coordinate
grid (with grid set to AUTO in chart setup), depending on the actual
scale. See section 3.4 Chart setup for more details on what you might
want to see in the chart and not see.
The built-in world chart can be zoomed up/down in six steps from a
scale of approx. 1:33,000,000 to 1:2,000,000.
An over-zoom function enables you to zoom beyond the chart, which
automatically is switched off and replaced by a lat/long coordinate
grid.Inthismodethescalecangodownto1:600.
Page 20
CA42/50/52 Chart menus and INFO windows Chapter 3
20
3.2 C-MAP cartridges
On the front of the CAXX below the keypad are two small watertight
drawers wherein you place the C-MAP cartridge(s) you wish to load.
) Do not attempt to insert or remove cartridges unless the CAXX is
turned off, or chart reading is in stand-by (see below):
MENU
Call up the menu bar, and…
1,3
load the pop-up window for C-MAP cartridge(s)
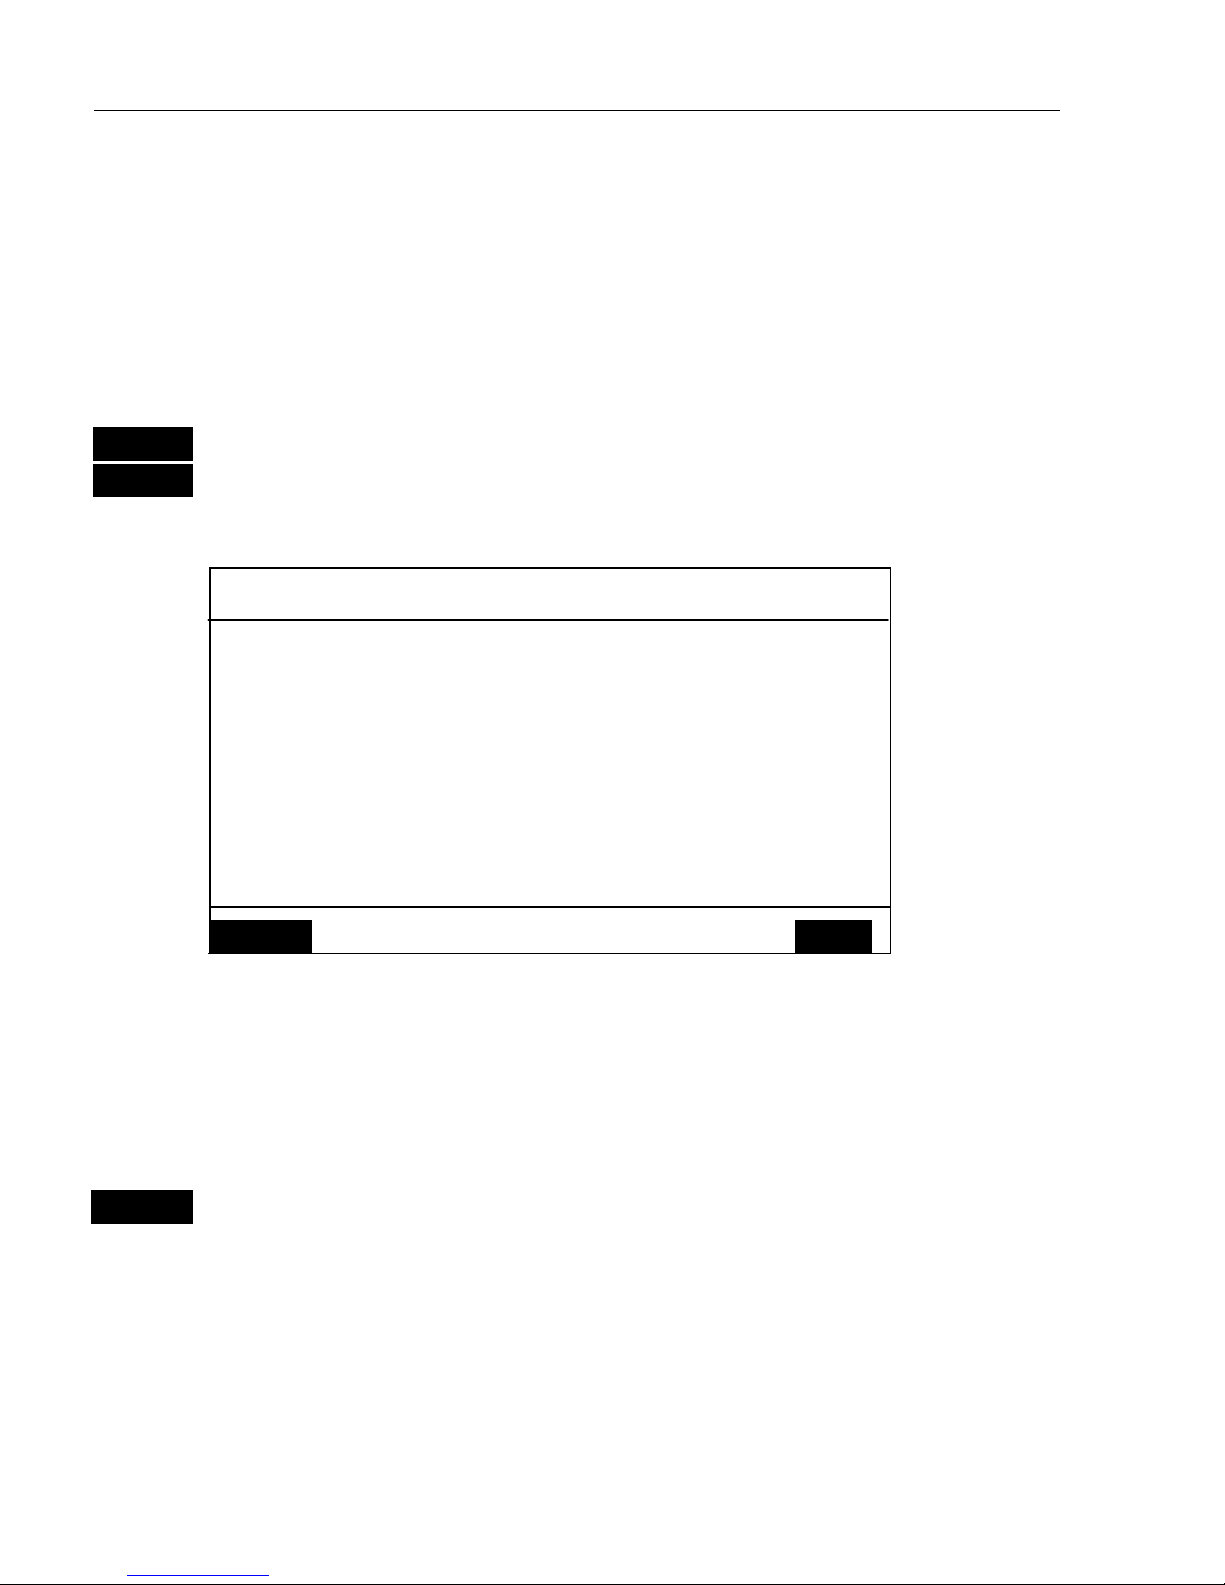
Example:
C-MAP cartridges
UPPER
Name: P&T: MELBOURNE BEACH TO LAKE WORTH INL
Code: NA-B502.02
Date: 13/11/1998
LOWER
Name: DENMARK NORTH COAST & LIMFJORDEN
Code: EN-B102.03
Date: 01/03/1999
Chart
reading is
now in
stand-by, and
you may
insert/
remove
cartridges.
MENU
Exit Test
ENT
To open the drawer below the keypad, press the eject key next to the
drawer. Place the cartridge in the tray with the terminals pointing
towards the unit, and push the drawer back in place – it has to make a
“click” sound to be closed tight and remain watertight.
ENT
Press
[ENT]
to test the data on the C-MAP cartridge which you have
just placed in one of the drawers
The CAXX will now test the data on the cartridge(s) to see if its valid
and free from faults.
) If a cartridge is defect, it must be removed before you can exit the
display.
Page 21

CA42/50/52 Chart menus and INFO windows Chapter 3
21
MENU
Return to chart display
In addition to the larger boundaries of the world chart there will be
separate boundary lines for the individual charts stored on the same
cartridge. However, the boundary lines for the C-MAP chart areas can
be turned off, so they will not be visible on the chart – refer to Chart
setup.
Other chart areas can quickly be reached by means of the zoom keys:
ZOOM
- OUT
Zoom out until desired area becomes visible
Move cursor to approximate area, and…
ZOOM
+ IN
Zoom in
The chart will automatically start to move when cursor reaches the
edge of the screen. When cursor is switched off
[CLR],
the chart will
return to ship’s position.
) See also section 3.4 Chart setup.
Page 22
CA42/50/52 Chart menus and INFO windows Chapter 3
22
3.3 INFO windows
A number of pop-up INFO windows are available mainly from active
chart display. Only a few of the functions in the INFO windows can be
accessed from data displays and other displays. Refer to sections 3.3.x.
3.3.1 Cursor inactive
ENT
With chart in active window, and with cursor off, press
[ENT]
to call
up an info window with the following to choose from:
Scale: 1:6600000
-Actual chart scale.
No user data
at ship’s position
1
Edit user data
-Inactive function.
2
Chart info
-Refer to Appendix C.
3
Find nearest port services
-Refer to Appendix C.
4
Bearing & dist. from A to B
-Inactive function.
5
Lock cursors
-Inactive function.
9
Chart setup
-Refer to section 3.4.
0
Ship to center
GOTO
Select NAV mode
PLOT
Plot new data
PAGE
More user data
MENU
Exit
-Exit info window.
0
Ship to center will adjust the chart to place the ship’s position in the
center of the chart display.
GOTO
Select NAV mode will activate Navigation mode.
PLOT
Plot new data will give you the choice of entering the ship’s position
as Eventmark, waypoint or target.
PAGE
More user data will toggle between available data on the ship’s
position.
Page 23
CA42/50/52 Chart menus and INFO windows Chapter 3
23
3.3.2 Cursor active but not placed on any object or data
ENT
With chart in active window, and cursor not placed on any object or
user data, press
[ENT]
to call up an info window with the following to
choose from:
Scale: 1:6600000
-Actual chart scale.
No user data
at cursor position
1
Edit user data
-Inactive function.
2
Chart info
-Refer to Appendix C.
3
Find nearest port services
-Refer to Appendix C.
4
Bearing & dist. from A to B
5
Lock cursors
9
Chart setup
-Refer to section 3.4.
0
Cursor to center
GOTO
Select NAV mode
-Refer to section 3.3.8.
PLOT
Plot new data
-Refer to section 3.3.9.
PAGE
More user data
-Inactive function.
MENU
Exit
-Exit info window.
4
Bearing & dist. from A to B will quickly provide the bearing and
distance from your current cursor position (A) to an arbitrary point (B).
Move cursor to point B and see the calculation in the small info
window. Press
[MENU]
to exit the function.
5
Lock cursors will lock the cursors in two chart displays on the same
screen and thus make the cursor movements synchronized. To return to
individual cursor control in each chart display, press
[ENT]
and
[5]
to
“Release cursors” again.
) See also “Lock cursors” in Appendix A.
0
Cursor to center will adjust the chart to place the cursor position in the
center of the chart display.
Page 24
CA42/50/52 Chart menus and INFO windows Chapter 3
24
3.3.3 Cursor placed on waypoint
ENT
With chart in active window, and cursor placed on a waypoint, press
[ENT]
to call up an info window with the following to choose from:
WP found
Name: WP 1
LAT 51°49.107N
LON 5°16.007W
-Example.
1
Edit user data
2
Chart info
-Refer to Appendix C.
3
Find nearest port services
-Refer to Appendix C.
4
Bearing & dist. from A to B
-Refer to section 3.3.2.
5
Lock cursors
-Refer to section 3.3.2.
9
Chart setup
-Refer to section 3.4.
0
Cursor to center
-Refer to section 3.3.2.
GOTO
Select NAV mode
-Refer to section 3.3.8.
PLOT
Plot new data
-Refer to section 3.3.9.
PAGE
More user data
MENU
Exit
-Exit info window.
1
Edit user data opens for a new info window:
Waypoint
1
Edit
Change the name, symbol, color, etc.
2
Move
Move waypoint with cursor, and press
[ENT].
CLR
Delete
Delete waypoint ? “YES” / “NO”.
MENU
Exit
Exit info window.
PAGE
More user data will be available if more than one point is plotted on
the same position, where the [PAGE] key then will toggle between data
for each point.
Page 25
CA42/50/52 Chart menus and INFO windows Chapter 3
25
3.3.4 Cursor placed on route leg or line section
ENT
With chart in active display and cursor placed on a route leg or line leg,
press
[ENT]
to call up an info window with the following to choose
from:
Route leg found
Name: RTE 1
Leg: B336° 77.16nm
Total: 4 legs 215.6nm
-Example.
1
Edit user data
2
Chart info
-Refer to Appendix C.
3
Find nearest port services
-Refer to Appendix C.
4
Bearing & dist. from A to B
-Refer to section 3.3.2.
5
Lock cursors
-Refer to section 3.3.2.
9
Chart setup
-Refer to section 3.4.
0
Cursor to center
-Refer to section 3.3.2.
GOTO
Select NAV mode
-Refer to section 3.3.8.
PLOT
Plot new data
-Refer to section 3.3.9.
PAGE
More user data
-Inactive function.
MENU
Exit
-Exit info window.
1
Edit user data opens for a new info window:
Route leg
1
Edit leg
New info window to edit route leg.
2
Insert point
Move cursor and press
[ENT]
to insert point.
3
Edit
New info window to edit route.
CLR
Delete
Delete whole route ? “YES” / “NO”.
MENU
Exit
Exit info window.
Page 26
CA42/50/52 Chart menus and INFO windows Chapter 3
26
3.3.5 Cursor placed on routepoint or linepoint
ENT
With chart in active display and cursor placed on a routepoint or
linepoint, press
[ENT]
to call up an info window with the following to
choose from:
Routepoint found: 2
Name: RTE 1
From start:
To end:
-Example.
1
Edit user data
2
Chart info
-Refer to Appendix C.
3
Find nearest port services
-Refer to Appendix C.
4
Bearing & dist. from A to B
-Refer to section 3.3.2.
5
Lock cursors
-Refer to section 3.3.2.
9
Chart setup
-Refer to section 3.4.
0
Cursor to center
-Refer to section 3.3.2.
GOTO
Select NAV mode
-Refer to section 3.3.8.
PLOT
Plot new data
-Refer to section 3.3.9.
PAGE
More user data
MENU
Exit
-Exit info window.
1
Edit user data opens for a new info window:
Routepoint
1
Edit point
New info window to edit routepoint’s position.
2
Move point
Move cursor and press
[ENT]
to move point.
CLR
Delete point
Delete routepoint ? “YES” / “NO”.
3
Add point
Only from first or last point in route.
4
Edit
New info window to edit route.
5
Delete
Delete whole route ? “YES” / “NO”.
MENU
Exit
Exit info window.
PAGE
More user data will toggle between data on routepoint and route leg.
Page 27
CA42/50/52 Chart menus and INFO windows Chapter 3
27
3.3.6 Cursor placed on trackpoint
Trackpoints are not as easily recognized as Routepoints, you may have
to move the cursor along on the track to locate a trackpoint.
ENT
With chart in active display and cursor placed on a trackpoint, press
[ENT]
to call up an info window with the following to choose from:
Trackpoint found: 3
Name: TRACK 1
Total: 836 points – 83.6nm
-Example.
1
Edit user data
2
Chart info
-Refer to Appendix C.
3
Find nearest port services
-Refer to Appendix C.
4
Bearing & dist. from A to B
-Refer to section 3.3.2.
5
Lock cursors
-Refer to section 3.3.2.
9
Chart setup
-Refer to section 3.4.
0
Cursor to center
-Refer to section 3.3.2.
GOTO
Select NAV mode
-Refer to section 3.3.8.
PLOT
Plot new data
-Refer to section 3.3.9.
PAGE
More user data
MENU
Exit
-Exit info window.
1
Edit user data opens for a new info window:
Trackpoint
CLR
Delete point
Delete trackpoint ? “YES” / ”NO”
1
Delete points from A to B
*) see below.
2
Edit
New info window to edit track.
3
Delete
Delete whole track ?
“YES”/”NO”
MENU
Exit
Exit info window.
*) Move cursor to point B and press [ENT] to delete all trackpoints
between cursor position on chart and point B.
Page 28
CA42/50/52 Chart menus and INFO windows Chapter 3
28
PAGE
More user data if cursor is placed on a MOB track you can toggle
between data on MOB symbol and data on MOB track.
) The symbol and track are edited separately.
3.3.7 Cursor placed on target
ENT
With chart in active display and cursor placed on a marked target, press
[ENT]
to call up an info window with the following to choose from:
Target found
Name: TARGET 1
LAT 57°40.636N
LON 10°34.767W
-Example.
1
Edit user data
2
Chart info
-Refer to Appendix C.
3
Find nearest port services
-Refer to Appendix C.
4
Bearing & dist. from A to B
-Refer to section 3.3.2.
5
Lock cursors
-Refer to section 3.3.2.
9
Chart setup
-Refer to section 3.4.
0
Cursor to center
-Refer to section 3.3.2.
GOTO
Select NAV mode
-Refer to section 3.3.8.
PLOT
Plot new data
-Refer to section 3.3.9.
PAGE
More user data
-Inactive function.
MENU
Exit
-Exit info window.
1
Edit user data opens for a new info window:
Target
1
Edit
Change the name, color, position, etc.
2
Move
Move target with cursor, and press
[ENT].
CLR
Delete
Delete target ? “YES” / “NO”.
MENU
Exit
Exit info window.
Page 29
CA42/50/52 Chart menus and INFO windows Chapter 3
29
3.3.8 GOTO function
CHART
GOTO
Shortcut to Chart 1, press again to call up INFO window with available
navigation modes:
Select NAV mode
1
Cursor
2
Waypoint
3
Route
4
Track
5
Anchor guard
MENU
Exit
To select “Cursor” navigation will require
that the cursor is active.
“Waypoint”, “Route” and “Track”
navigation will require there is one stored
in the memory before it can be activated.
The NAV mode can also be activated from
the NAV menu.
For further details on the different NAV modes, refer to chapter 4.
Waypoints and navigation.
Anchor guard – When setting anchor, check/change the preset alarm
distance etc., so you will be warned in case you drift too far from the
anchored position. The alarm distance can be set anywhere from 0.01
to 9.99 nm in Navigation setup display. See also section 6.3 Anchor
guard.
If pressing the
[GOTO]
key while one of the NAV modes is active, this
pop-up window will appear on the screen:
Navigation is ON
1
Advance
2
Restart to approaching point
3
Turn NAV off
MENU
Exit
Press [1] to advance to next waypoint in the route (Route navigation).
Press [2] if you for some reason have drifted off course and wish to
restart navigation from your actual position to the approaching point.
Page 30
CA42/50/52 Chart menus and INFO windows Chapter 3
30
3.3.9 PLOT function
The CAXX is designed to make navigation easy and safe. Making
routes, drawing lines and plotting waypoints, etc. can all be done
directly on the chart. Very straightforward and uncomplicated.
The PLOT function is available from various displays as indicated
below.
PLOT
With any other display than chart or echo display in active window,
press
[PLOT]
to insert ship’s/cursor’s position as waypoint
PLOT
With chart in active display, press
[PLOT]
to call up an INFO window
with the following to choose from:
PLOT new data
PLOT
Plot eventmark - ship
1
Plot waypoint - cursor
2
Insert waypoint - ship
3
Insert waypoint - cursor
4
Plot waypoint from echogram
5
Make route
6
Draw line
7
Plot target - cursor
8
Set vertical mark
MENU
Exit
PLOT
From any display:
Plot and save ship’s position as a waypoint including actual depth.
1
From active chart display with cursor ON:
Plot and save cursor position as a waypoint.
2
From active chart display:
Plot and save ship’s position as a waypoint including actual depth;
insert a location name (cf.section 2.6), adjust the position by keying in
new figures, change the symbol (cf.section 2.5).
Page 31

CA42/50/52 Chart menus and INFO windows Chapter 3
31
3
From active chart display with cursor ON:
Plot and save cursor position as a waypoint; insert a location name
(cf.section 2.6), adjust the position by keying in new figures, change
the symbol (cf.section 2.5).
4
From active echo display:
Plot and save waypoint including actual depth from echogram, move
cursor and press [ENT] to save spot as waypoint. Add a name, symbol,
color, etc.
5
From active chart display with cursor ON:
You can quickly make a route by plotting cursor’s position, one after
another i.e. the present cursor position will be the first position of the
route you are about to make
.
Move cursor to next position, and press
[PLOT].
Continue in this manner till the route is completed. In case you
make a wrong plot, press
[CLR]
to erase the last plotted position.
Savetheroutewith
[ENT]
or exit the function with
[MENU]
to abandon
the route.
6
From active chart display with cursor ON:
To draw lines or to make a route is the same procedure, please refer to
point 5.
7
From active chart display with cursor ON:
Plot target at cursor position with preset target name, etc.
From chart display with cursor OFF:
The ship’s position will be plotted as target.
After plotting the target it will be saved in the memory, and you can
edit the target later on, either via the menu or directly from the chart:
Place cursor on the target symbol and press
[ENT]
to open an info
window with the heading “Target found”.Press
[1]
Edit user data to
open for new options of editing i.e. move target, delete target, alter the
position, insert a location name (cf.section 2.6) or select a new color
for the target number and symbol (cf.section 2.5).
8
From active echo display:
This function will set a vertical marker (line) at the current ping in the
echo display.
Page 32

CA42/50/52 Chart menus and INFO windows Chapter 3
32
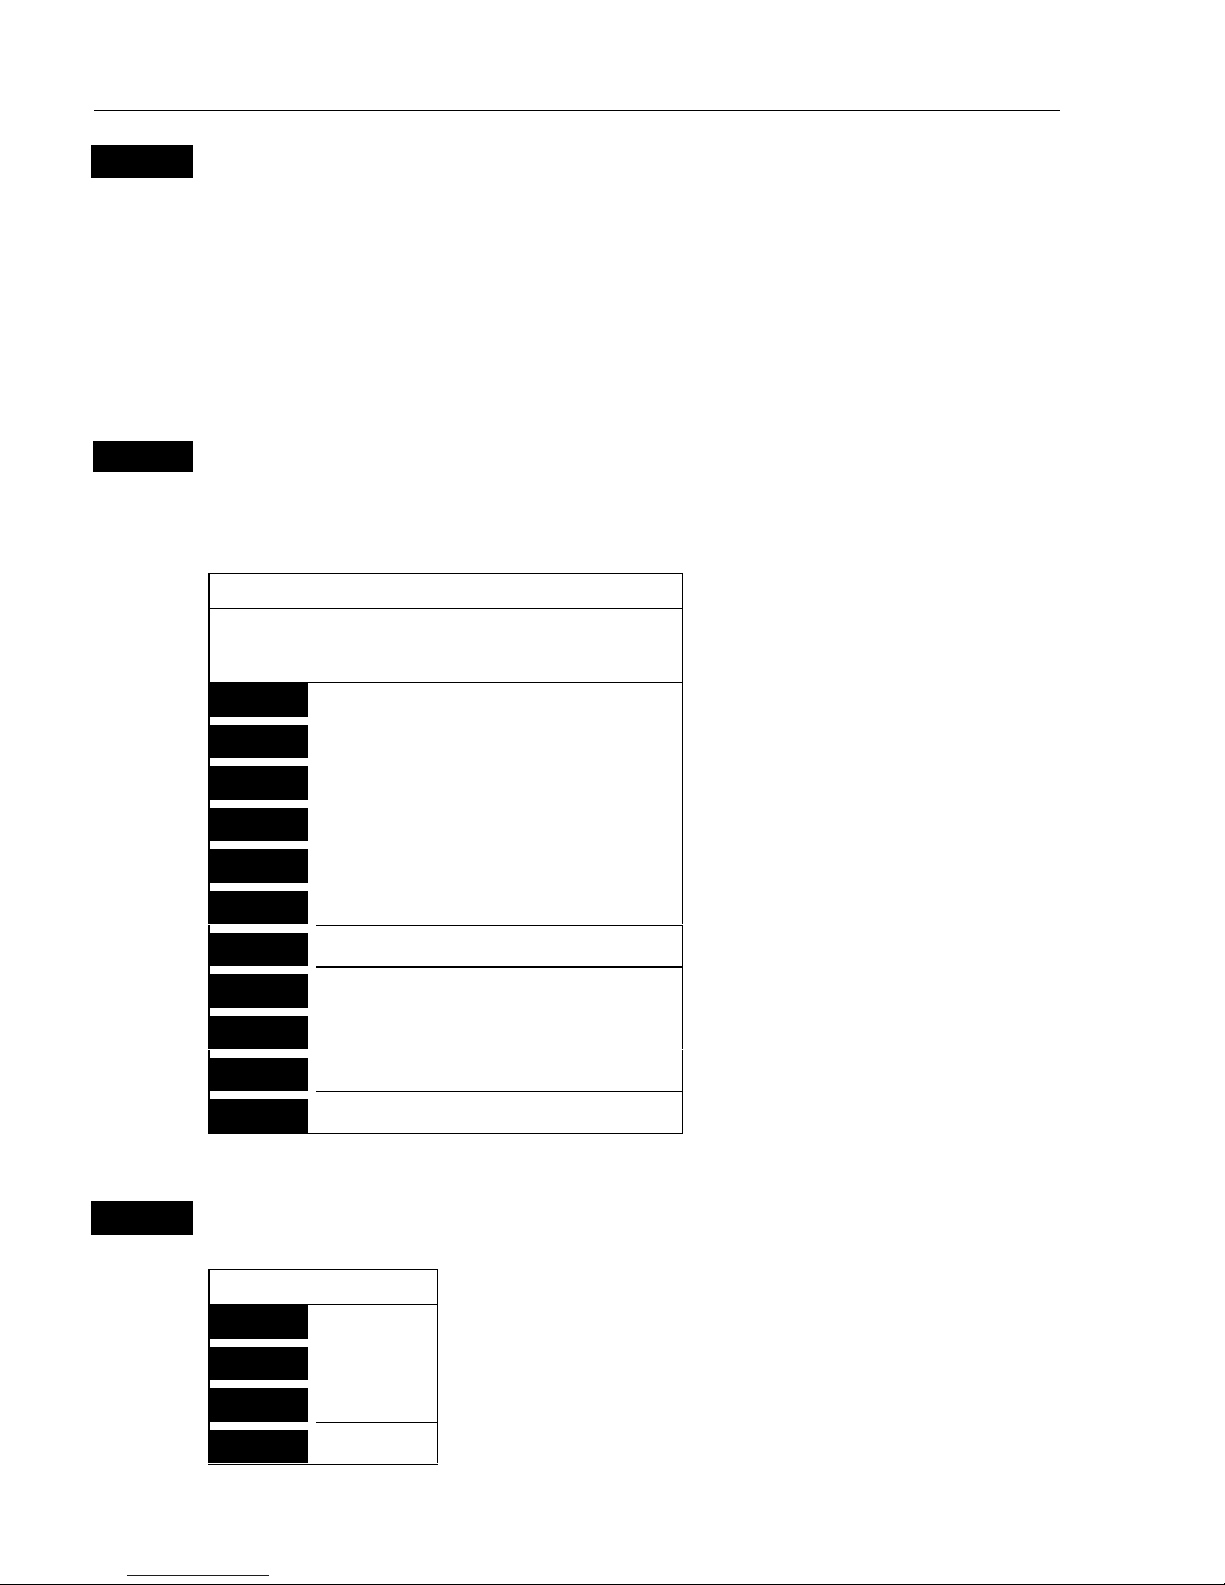
3.4 Chart setup
ENT
9
With chart 1 or chart 2 in active window, press [ENT], [9], to load the
chart setup for the selected chart (1 or 2)
Chart setup
Land settings
Features ON
Landmarks ON
Marine settings
Tides, currents ON
Depths ON
Underwater objects ON
Soundings ON
Nature of seabed ON
Naval aids settings
Ports ON
Caution areas ON
Tracks, routes ON
Lights ON
Buoys ON
Signals ON
Paper chart settings
Names ON
Compass distance ON
Chart settings
Chart NORMAL
Boundary lines ON
Mixing levels OFF
Marine presentation INTERNATIONAL
Simplified draw mode OFF
Quick chart info ON
Chart area SMALL
Orientation NORTH UP TRUE
Rotation resolution 15°
Depth
Level 1 0 – 002m
Level 2 2 – 006m
Level 3 6 – MAX
Grid AUTO
Show range WITH BACKGROUND
Auto chart select ON
Extended level range ON
Non active waypoints ON
Waypoint names ON
Waypoint depths ON
Non active routes AS SELECTED
Route names ON
Non active tracks AS SELECTED
Track names ON
Lines AS SELECTED
Line names ON
Targets AS SELECTED
Target names ON
The settings are dedicated to the chart in the active window and does
not affect the second chart. This enables simultaneous viewing of a
very detailed chart and a less detailed chart.
ENT
Confirm changes and return to chart, or…
MENU
abandon Chart setup and return to chart without making any changes
All C-MAP feature groups i.e. Land settings, Marine settings, Naval
aids settings and Paper chart settings are described in Appendix C.
To obtain a “cleaner” view of the chart details, you can turn some of
the settings OFF if they do not contribute to the clarity of the chart area
you wish to explore. All the listed objects that can be turned on and off
speaks for themselves – they are either “shown on the chart” or “not
shown on the chart”.
Page 33

CA42/50/52 Chart menus and INFO windows Chapter 3
33
All user data in the chart system are listed under ‘Chart settings’ in the display
example and are described below:
Chart can be set to
NORMAL, COMPRESSED and CHART OFF:
NORMAL
- will automatically select the chart level appropriate for the selected
range/scale.
COMPRESSED
- will change the range (scale) / chart level ratio one step, which,
depending on the actual chart, will select a more detailed level.
CHART OFF - will only show all the user-made data such as waypoints, routes,
lines and tracks, etc.
Boundary lines will indicate available C-MAP chart areas.
Mixing levels – when set to ON you will no longer see any blank chart areas, as
the C-MAP library will find the missing area in a different level to cover the
blank area otherwise left on the screen. However, when using this feature, chart
re-draw time will be increased a little.
Marine presentation can be set to INTERNATIONAL or AMERICAN:
INTERNATIONAL – will present NavAids in ‘real life’ shapes and colors for
quick visual recognition (as per official INT1 standard paper chart presentation).
AMERICAN – will present NavAids in simplified shapes and real colors (as
generally found on NOAA paper charts).
Simplified draw mode – when set to ON the NavAids will be shown in generic
symbols for minimum visual clutter on-screen.
Quick chart info – placing the chart cursor on a C-MAP object will activate a
small info window with details on the object. Info window will automatically
close after 10 seconds or when cursor is moved away.
Chart area can be set to
SMALL, MEDIUMorLARGE.
SMALL
– Opens a small chart area big enough to just fill the size of the screen.
When panning and scrolling, the chart will automatically be redrawn.
MEDIUM
– Opens a medium-size chart area for pan and scroll which goes beyond
the size of the screen. The chart redraw time increases equally.
LARGE
– Opens a large chart area for pan and scroll in a size which goes well
beyond the size of the screen. The chart redraw time increases equally.
Page 34

CA42/50/52 Chart menus and INFO windows Chapter 3
34
Orientation can be set to
NORTH UP, HEAD UPorNAV UP
, and the mode can be
RELATIVE or TRUE motion.
NORTH UP
– The chart will always be presented as north up.
HEAD UP – The chart will automatically turn, so your actual course (COG) is up.
If a compass is connected, the reference will automatically change to heading
(compass).
NAV UP
– The chart will automatically turn, so your bearing to destination is up.
) To enable chart rotation the chart cursor must be turned off [CLR].
TRUE
motion – The ‘ship’ will move across the chart.
RELATIVE motion – (‘Chart area’ will default to MEDIUM). The ‘ship’ is locked
to the center of the screen and the chart will move.
Rotation resolution can be set to adjust the chart for each 5, 10, 15, 20 or 25°
changes in present course or heading.
Depth–Level1,2and3 are identified by different colors. The number of
meters in the levels can be changed. The colors are preset, see section 10.6.
Grid the LAT/LON grid can be set AUTO/ON/OFF. The color of the grid is
preset in Palette setup, section 10.6.
Show range ON will add a small line to the chart display indicating that the
length of the line equals a certain number of nautical miles/km.
Auto chart select When sailing with “Auto chart select” ON and cursor turned
OFF, the scale will automatically change to the chart which is available. But
when set to OFF, then the selected scale will remain, also when sailing “out of
the chart”.
Extended level range ON will enable changing range 3-4 steps within the same
chart level after having selected the range via a numeric key.
The remainder of the objects from ‘Non active waypoints’ can all be set to:
ON =shownonchart;OFF = not shown on chart; AS SELECTED =the
choices made for a particular route etc. via the menu e.g.
MENU, 3, 2, ENT, ENT
Edit route, where ‘Course line’ can be set ON or OFF.
Page 35

CA42/50/52 Position menus Chapter 4
35
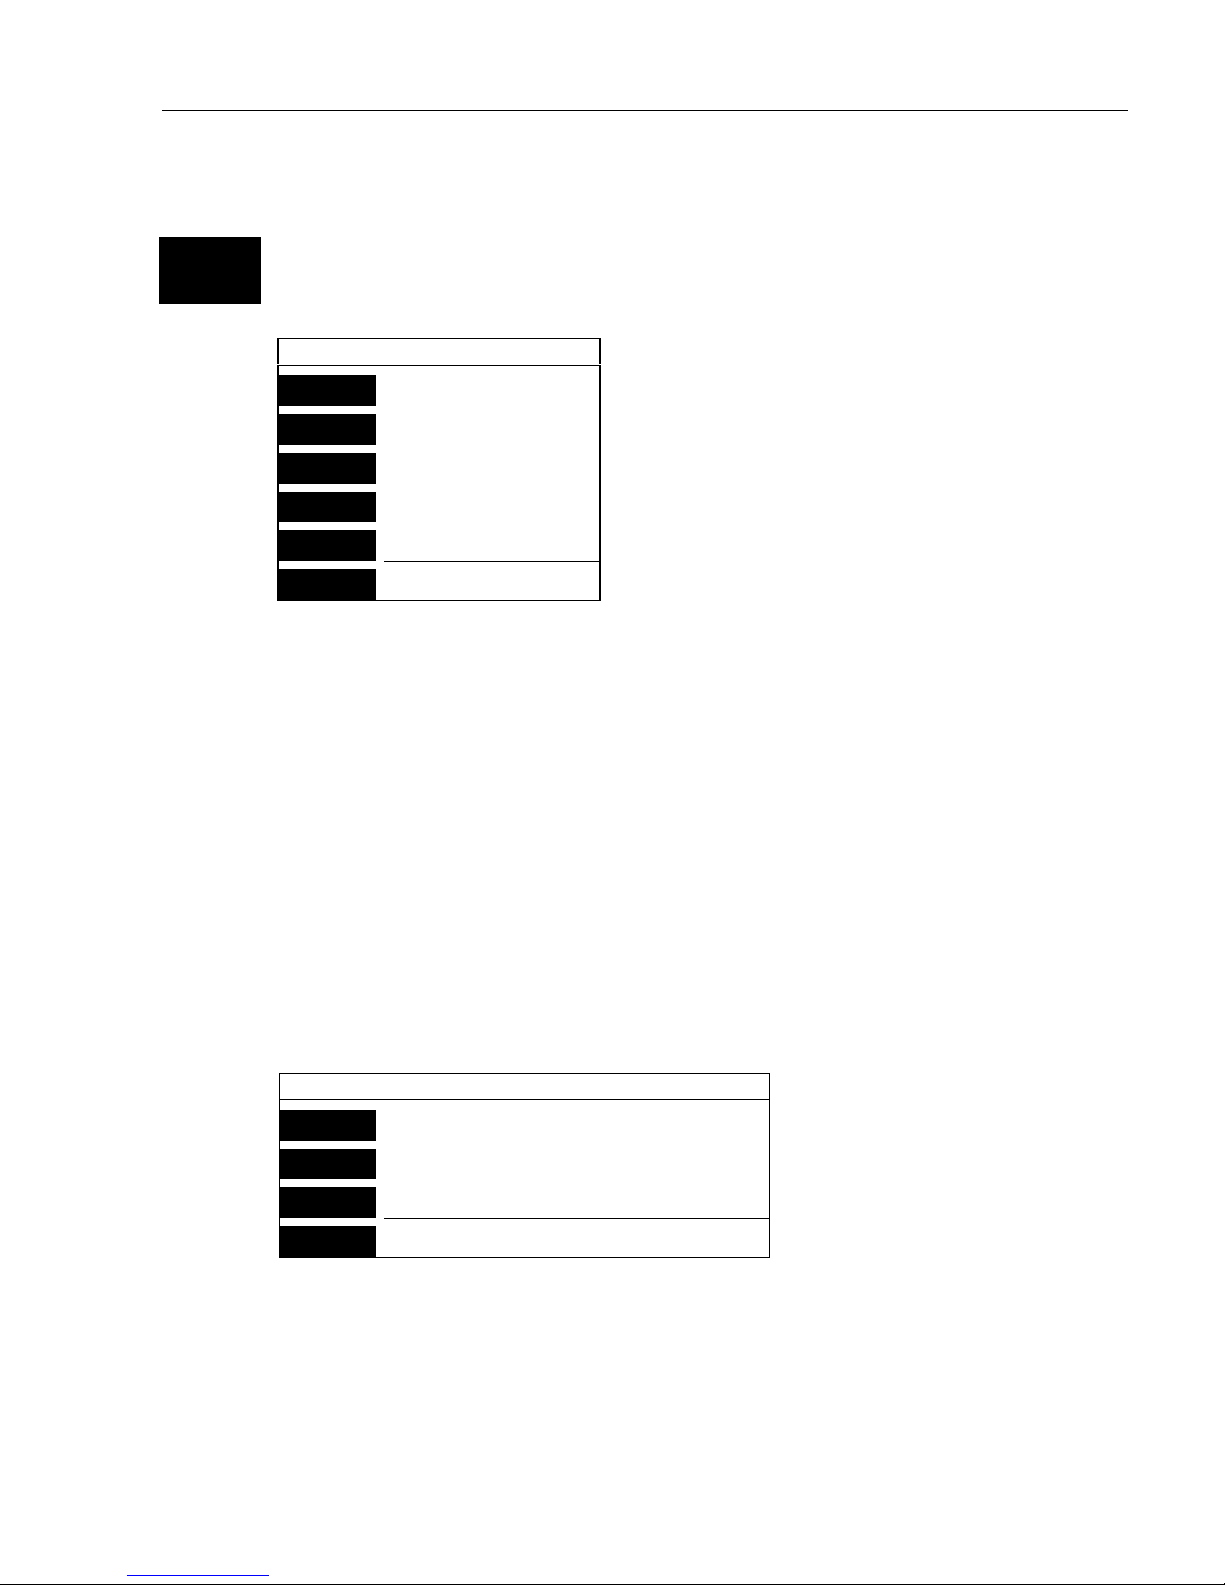
4. Position menu
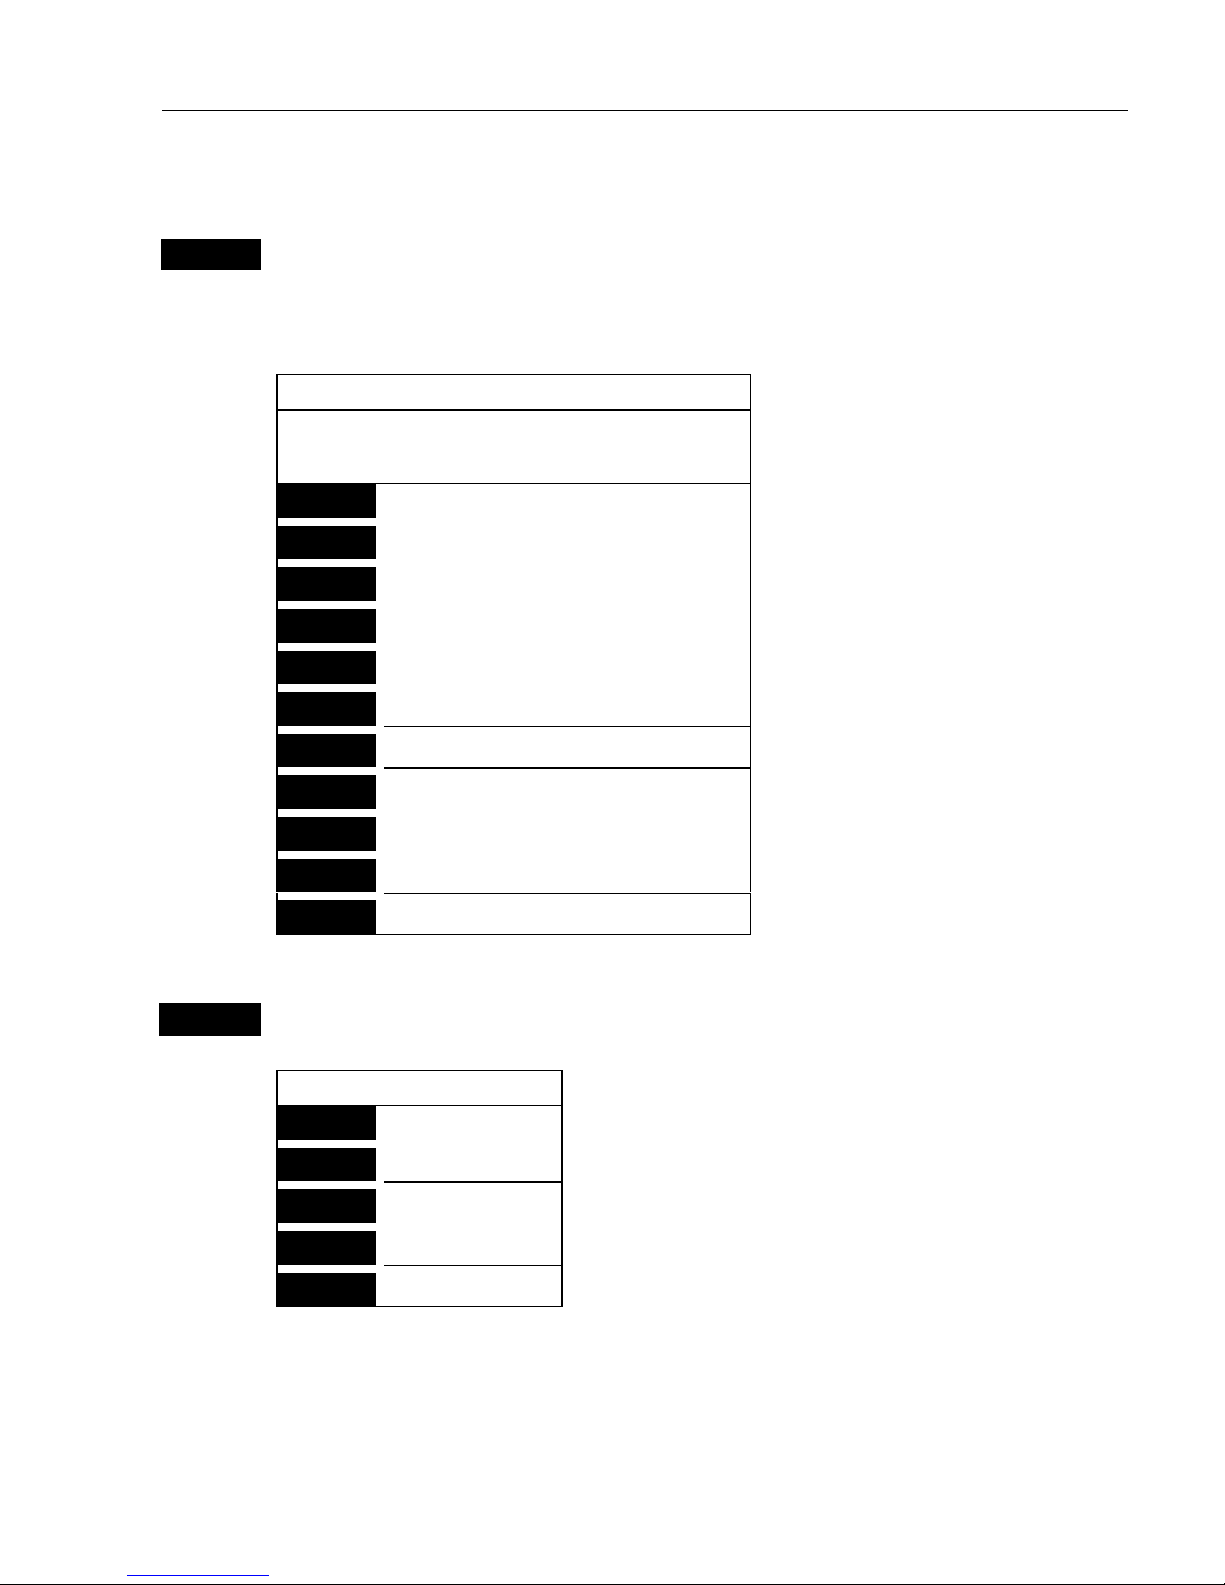
_2_
POS
_1_ Position
- see section 4.1.
_2_ Dual speed
- see section 4.2.
_3_ Speed, course & depth
- see section 4.3.
_4_ Speed diagram
- see section 4.4.
_5_ Satellites
- see section 4.5.
_6_ DGPS
- see section 4.6.
_7_ SDGPS
- see section 4.7.
4.1 Position d isplay
MENU
Call up the menu bar, and…
2,1
load the Position display
Indicates the datum currently selected.
Datum 000
WGS 1984
Log 1
1.1nm
Log 2
1.1nm
LAT 56°52.500N
LON 9°50.700E
Speed Course Compass
0.4kn 17° °
Status
DGPS a
UTC time
8:02:43
UTC date
12-02-2001
Trip log 1
and 2.
Position with
three decimals in
minutes.
Page 36

CA42/50/52 Position menus Chapter 4
36
Speed indicates Speed over ground.
Course, magnetic or true.
Depth or Compass from external sensor, or actual antenna altitude.
UTC or local time and date
Time and date in UTC – Universal Time Coordinates – is equal to
standard time in London (GMT). UTC is not affected by the local
summertime adjustments.
Status indicator for reception of satellites:
a(A)= good, b(B)= acceptable, c(C)= fair, or *= no update - see also
“Status indicator and accuracy” below.
With built-in or connected DGPS receiver:
dGPS= differential data received.
DGPS= differential data received and used for corrections.
SDGPS= satellite differential data received and used for corrections.
Status indicator and accuracy
Small letters (a,b,c,) indicate that SA is active, and the position
accuracy is expected to be better than 100 meters in 95% of the time.
Capital letters indicate that SA is OFF, and the position accuracy is
then expected to be 15 meters or better in 95% of the time.
dGPS indicates that differential data is received, either via built-in
differential receiver or from external receiver.
DGPS or SDGPS indicates that the position is corrected by the
differential data. The accuracy will typically be 1-3 meters for DGPS
and 2-6 meters for SDGPS.
In order to utilize the high accuracy of the GPS system, it is necessary
to align the lat/long calculations to the paper charts you are using.
RefertoPositionsetupdisplayonnextpage.
) When using C-MAP electronic charts, the datum will be aligned
automatically.
Page 37

CA42/50/52 Position menus Chapter 4
37
Position setup
ENT
From position display, press
[ENT]
to load Position setup
Datum 000: World Geodetic System 1984
Log 1: 00001.1nm
Log 2: 00001.1nm
Display position as: LAT/LON
Delta position: 0°00.000N 0°00.000E
Start position: Lat 56°52N Lon 009°50E
Speed and course filter level: 3
Display speed as: SOG
Course and bearing as: MAGNETIC
Additional data: COMPASS
Time: UTC
Time: 08:06:01 Date: 12-02-2002
Go to the function you wish to change
CLR
Reset log
0-9
Key in new values, or…
+/-
Toggle between available values
ENT
Confirm editing and return to Position display
Datum – is preset to WGS 1984 (World Geodetic System 1984), but
can be changed to any of the 118 datums listed in Appendix B e.g. to
match old paper charts or trackplotter data from RS2500/RS4000
(datum #002 European 1950).
The position in the position display and NMEA output will refer to the
selected datum. To select a new datum: Place the cursor next to
“Datum” and leaf through the datum list with +/-, or key in the number.
) The datum in the chart display is fixed i.e. WGS84.
Log – reset log or insert alternative start figure by altering the value in
the “log 1” and/or “log 2” line. Press
[CLR]
to reset the figure, and
press the numeric keys 0-9 to alter the figure.
Page 38

CA42/50/52 Position menus Chapter 4
38
Display position as – the position can be shown in latitude/longitude,
Loran C or decca coordinates (after selecting chain). Toggle with +/-.
Delta position – some paper charts do not indicate a datum, but instead
they have a notation to an offset or delta position to WGS84.
Use numeric keys to key in the position correction.
Start position – can be inserted if exact start position is known.
Speed and course filter level – thereisafilterof10stepsavailable
(0= fast response, 9= stable reading).
Display speed as – SOG Speed Over Ground or STW Speed Through
Water. Toggle with +/-.
) to receive STW information from external instrument (via NMEA
port) will require that NMEA sentence VHW and “Log speed sensor”
are set to ON. Refer to section 10.1 and 10.2.
Course and bearing – readings of course and bearing can be made in
either
MAGNETICorTRUE
. Toggle with +/-.
Additional data – can be set to COMPASS, DEPTH or ANT.
HEIGHT.
COMPASS will show heading from connected sensor.
DEPTH will be shown when NMEA depth data is received from
connected depth instrument.
ANT. HEIGHT will indicate the actual antenna altitude (height above
sea level).
Time – can be set to UTC or local. Toggle with +/-.
Correct actual time and date by means of the numeric keys.
Page 39

CA42/50/52 Position menus Chapter 4
39
4.2 Dual speed display
(trawling speed display)
The analogue differential speed indicator will show how much the
present speed varies from the average speed.
If the difference exceeds +/- 3 knots (or km/h or miles/h), an arrow
will appear which will be pointing out of the scale.
MENU
Call up the menu bar, and…
2,2
load dual speed display
Status
GPS a
UTC time
10:02:43
Water speed
*.*kn
LAT 56°52.500N
LON 9°50.700E
-3 -2 -1 1 2 3
Speed/kn
0.8
Average Spd
0.6
Course
17°
Water speed
readout from
connected
log transducer.
Position with three decimals in minutes.
Analogue differential speed indicator (scale).
Dynamic speed with short filtering time is reacting quickly to changes,
but is also more unsteady.
Average speed with long filtering time gives a very stable reading.
Course over ground, magnetic (m) or true (°).
How to reset dual speed:
ENT
Open for change
ENT
Press
[ENT]
to reset dual speed, or…
MENU
Press
[MENU]
to exit function without making any changes
Page 40
CA42/50/52 Position menus Chapter 4
40
4.3 Speed, course & depth
MENU
Call up the menu bar, and…
2,3
load Speed, course & depth display
Speed over ground
*.*kn
Course
*m
Depth below keel
*.*m
This display is
preset to show:
Speed over ground
in knots,
Magnetic course
and Depth below
keel in meters.
To change the settings for this display:
• Speed over ground can be changed from the Position display settings
to show Speed through water: Press [MENU], [2], [1], [ENT], go to the
line “Display speed as: SOG”, press the [+] key to toggle to STW,
press [ENT] to accept the change. The top line in above display will
now show Speed through water.
• Course can be shown as magnetic or true. Toggle between the two
settings from the Position display: Press [MENU], [2], [1], [ENT], go
to the line “Course and bearing as: MAGNETIC”,pressthe[+]keyto
toggle to TRUE, press [ENT] to accept the change. The middle part in
above display will now show True course e.g. 17°.
• Depth below keel can be changed from the Echosounder setup to
show Depth below surface or Depth below transducer. Press [MENU],
[5], [8], go to the line “Display: DEPTH BELOW KEEL”,pressthe
[+] key to toggle to DEPTH BELOW SURFACE or DEPTH BELOW
TRANSDUCER, press [ENT] to accept the change. The new setting
will be shown in the lower part of the display.
Page 41
CA42/50/52 Position menus Chapter 4
41
S 6.2
kn
V 4.8
kn
W 2.2
kn
[kn] 22:03 22:08
10
8
6
4
2
0
SD:S *.*kn T *° R *° WIND: *.*ms *°R
4.4 Speed diagr a m
MENU
Call up the menu bar, and…
2,4
load “Speed diagram”
S= Speed over ground.
V= Velocity towards waypoint.
W*= Speed through water.
SD (Set and drift)*= Speed and direction, true or relative.
WIND*= Speed and direction.
* Connection to external sensors is required.
ENT
Call “Speed diagram setup”
- see next page
Page 42

CA42/50/52 Position menus Chapter 4
42
Speed diagram setup:
Scale for speed, max: +005kn
Scale for speed, min: -000kn
Speed over ground (SOG): ON
Velocity made good (V): ON
Water speed (W): ON
Time interval: 5 MIN.
The scale for the speed diagram can be adjusted in this display.
Time interval can be set in 8 intervals from 1 minute to 3 hours and
freeze.
Go to the function you wish to change
+/-
Key in new figure or change setting
ENT
Confirm entry and return to Speed diagram
Page 43

CA42/50/52 Position menus Chapter 4
43
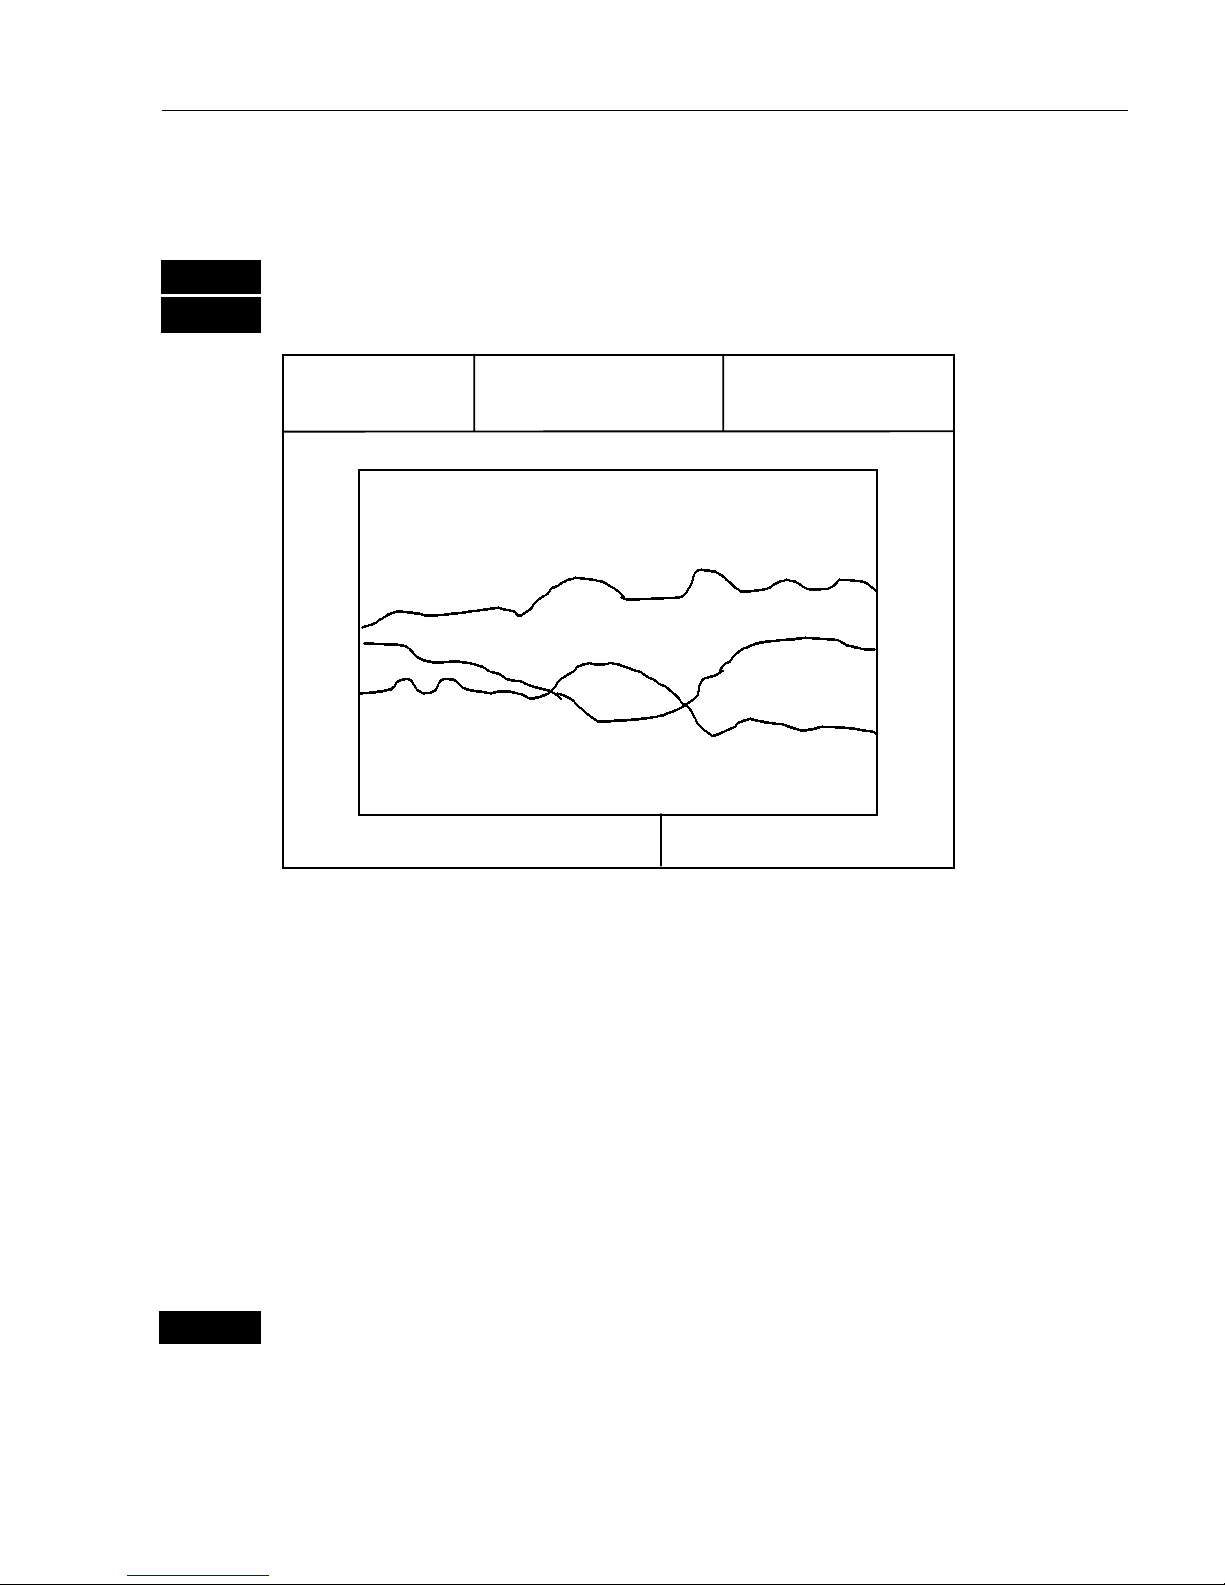
4.5 Satellite stat u s
MENU
Call up the menu bar, and…
2,5
load satellite status display
The display will show which satellites are currently being used for
computation of data. It will show their position together with SNR –
Signal to Noise Ratio. The bottom line shows the status of all the satellites in the GPS system, starting from left to right with the numbers 1
to 32, or the legend: No almanac.
Satellite status (bottom line):
+ indicates the satellite is healthy
- excluded or non-existing satellite
0 satellite data is faulty
* satellite is manually excluded
You may want to exclude a satellite manually in case a particular
satellite is disturbing the navigation.
ENT
Open for change, and…
Place the cursor on the satellite in the bottom line you wish to exclude
GPS: D HDOP: 1.6 DOP limit: 8
SAT
nr
>++++++++ ++ - - ++++ +++++ - ++ + +++-+++-<
2
4
7
8
9
11
13
15
16
21
60
°
30
°
W
E
SNR
050100
SAlarm:OFF
0
°
N
7
2
4
9
11
13
15
16
21
Page 44
CA42/50/52 Position menus Chapter 4
44
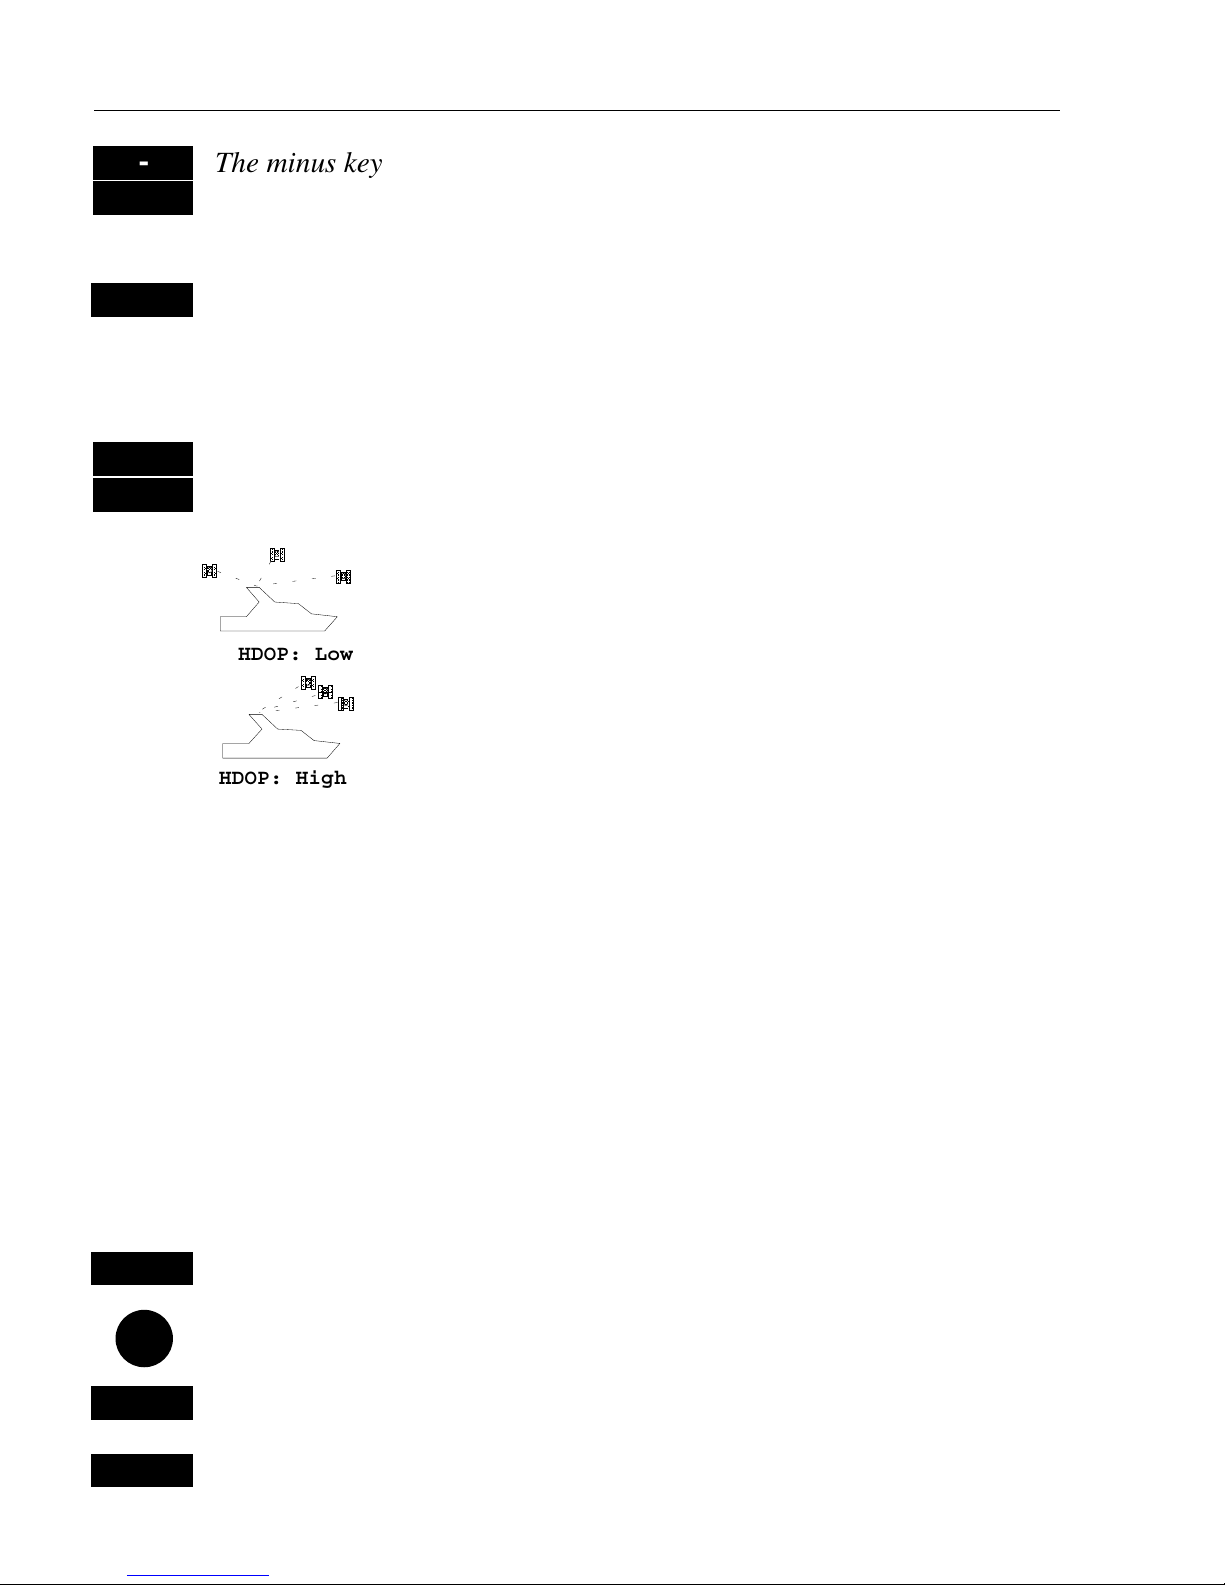
HDOP: High
HDOP: Low
-
The minus key will exclude the satellite, and…
+
the plus key will reinstate it
- these two plus and minus keys are also the
ZOOM
keys!
ENT
Confirm entry
HDOP, PDOP and DOP limits:
MENU
Call up the menu bar, and…
2,5
load satellite status display
The value of HDOP
(horizontal dilution of precision)
expresses “the quality” of the satellite geometry in
relation to 2D positioning and a fixed antenna
altitude.
PDOP (position dilution of precision) is equivalent
to 3D positioning. The values will typically stay
between 1.3 and 8. The lower the value the higher
the “quality”. A poor geometry might produce a
value of more than 20.
If the preset DOP limit is exceeded (indicated by * in the position
display) it will cause the position updating to stop until it once again is
within the limit.
The DOP limit can be changed manually, but should not be set higher than
8 (factory setup), as this may result in poor accuracy – false position.
Position update alarm - go to “Alarm” in the display and set it to “ON”
if you wish to be alerted when there is no position update.
ENT
Open for change
Go to DOP limit (6-99), and…
0-9
Insert new limit
ENT
Confirm entry
Page 45

CA42/50/52 Position menus Chapter 4
45
4.6 DGPS information
The DGPS – differential position corrections – canbeprovidedfroma
built-in module, which is preset to full automatic operation, or from
connected DGPS receiver – see ‘Status indicator’ in position display.
) List of beacon stations is available in addendum, part no.
183.0122.501.
MENU
Call up the menu bar, and…
2,6
load DGPS setup display (with built-in module)
DGPS setup:
Beacon: SKAGEN B312° D87.3nm
Status: LOCKED
Beacon is monitored: YES
Frequency: 298.5kHz MANUAL
Bit rate: 100bps AUTO
Signal strength: 17
Signal to noise ratio (SNR): 23dB
Message:
To receive
valid differential data
will require
that the
navigator is
locked in on
abeacon
station.
ENT
Open for change, and…
Go to the function you wish to alter
+/-
Toggle the function, or…
0-9
insert new figures
ENT
Confirm entry
Beacon – informs the name of the beacon the navigator is locked on to
(if any), together with indication of bearing and distance.
Page 46

CA42/50/52 Position menus Chapter 4
46
Status – can either be:
LOCKED = locked on a beacon and receiving differential data
.
NOT LOCKED =
not locked on a beacon and receiving no differential
data.
NOT INSTALLED = there is no built-in DGPS module in unit.
NOT IN USE
= external DGPS receiver applied.
Beacon is monitored –
YESorNO
.
If
YES
it should be safe to rely on the received differential data,
because the beacon station’s performance is under observation.
If
NO
, then you have to use the received differential data with caution,
as there is no guarantee it is not faulty.
Frequency – the frequency of the beacon station can be set manually if
known. However, when left in
AUTO
the navigator will always search
for the nearest station with a good signal strength.
Bit rate – indicates bits per second, and can be set manually to 25, 50,
100 or 200 bps.
Signal strength – a good signal strength is 20 and up.
Signal to noise ratio (SNR) – should be 8dB and up.
Message – type 16 message will be displayed when received from the
DGPS system. The contents of this message could be something to do
with the performance of the system. Temporarily out of service, etc.
Page 47

CA42/50/52 Position menus Chapter 4
47
4.7 SDGPS inf or m at ion
The SDGPS – satellite differential GPS - is preset to full automatic
operation, which means that the system will utilize the position
corrections from either differential GPS stations (refer to section 4.6)
or satellite differential GPS signals from WAAS, EGNOS or MSAS
(refer to section 4.7.1).
MENU
Call up the menu bar, and…
2,7
load SDGPS setup display
SDGPS setup:
SDGPS select mode: AUTO
Uses corrections from: *****
CHANNEL 1: sat.no.: **** ****
Corrections: NONE
Integrity messages ok: NO
Range used for position fix: NO
Type 0 warning received: NO
CHANNEL 2: sat.no.: **** ****
Corrections: NONE
Integrity messages ok: NO
Range used for position fix: NO
Type 0 warning received: NO
Ignore type 0 warnings: NO
ENT
Open for change
Go to the function you wish to alter (see below)
+/-
Toggle the function
ENT
Confirm entry
SDGPS select mode determines which differential corrections can be
used in the position determination:
AUTO is default mode. Local area DGPS corrections are used when
available. If not available, then SDGPS corrections are used (if these
are available).
MANUAL mode: SDGPS corrections are used (if available). Local
area DGPS corrections are not used.
PASSIVE mode: SDGPS corrections are never used.
Page 48

CA42/50/52 Position menus Chapter 4
48
Uses corrections from - indicates which differential corrections
(DGPS or SDGPS) are currently used for position determination.
CHANNEL 1: sat.no. - indicates which satellite number and name is
currently tracked/searched by channel 1, and what is the tracking state see also section 4.7.1.
Corrections - indicates if corrections are being received on this
channel. If YES: is the quality of the reception sufficiently high for the
corrections to be usable.
NONE: no corrections are received.
RECEIVED: corrections are received, but of insufficient quality.
USABLE: corrections are received and of sufficient quality.
USED: corrections received on this channel are used in the position
determination.
Integrity messages ok - the SDGPS system will transmit messages
concerning the integrity of the GPS satellites. This line will indicate
whether such messages are received and reliable.
Range used for position fix - if the receiver is tracking a particular
SDGPS satellite, it “knows” the distance to that satellite. This line will
indicate whether the distance is used in the position determination.
Type 0 warning received - if an SDGPS satellite is not operating
according to specifications it will transmit a so-called “Type 0 warning”. In this situation, the receiver will not use any information that it
might receive from that satellite. Until the SDGPS system is declared
operational, the SDGPS satellites will always transmit Type 0 warnings.
) It is possible (but not recommendable) to override the Type 0 warnings - refer to last line in SDGPS setup.
Page 49

CA42/50/52 Position menus Chapter 4
49
4.7.1 Satellites in SDGPS system
The SDGPS system consist of eight orbiting geostationary satellites.
It is, however, not expected to become fully employed till sometime in
2003. In the meantime, the system will have limited usage but will be
available to all users with e.g. Simrad XX42/50/52 MKII software,
version 4.20 and up.
Number
Name System Area
120 AOR-E EGNOS - EU Atlantic ocean region east
122 AOR-W WAAS - US Atlantic ocean region west
124 ARTEMIS EGNOS - EU
126 INMARSAT EGNOS - EU
129 MTSAT-1 MSAS - JAPAN
131 IOR EGNOS - EU Indian ocean region
134 POR WAAS - US Pacific ocean region
137 MTSAT-2 MSAS - JAPAN
Tracking state
The letter indicating the tracking state will appear immediately after
the satellite number in the display.
Letter indication: - means that the receiver is:
S searching for satellite.
D trying to synchronize to data stream.
C code locked to signal.
P phase locked to signal.
Page 50

CA42/50/52 Position menus Chapter 4
50
Page 51

CA42/50/52 Waypoint/route menus Chapter 5
51
5. Waypoint / route menus
_3_
WP/RTE
_1_ WP list
- see section 5.1.
_2_
Routes
- see section 5.2.
_3_
Route calculation
- see section 5.3.
_4_
Lines
- see section 5.4.
_5_
Start track
- see section 5.5.
_6_
Stop track
- see section 5.5.
_7_
Tracks
- see section 5.6.
_8_
Targets
- see section 5.7.
5.1 WP list
(waypoints stored in the memory)
The waypoint list will appear in alphabetical order and will include the
waypoint’s position in lat/long. To edit one of the stored waypoints:
MENU
Call up the menu bar, and…
3,1
load WP list
A-Z
Insert name of waypoint you wish to edit, or…
+/-
Leaf through waypoints with +/- keys or up/down cursor
ENT
Open for editing
Place the cursor on the function you wish to change
0-9
Key in new figures, or…
+/-
toggle between available values
PLOT
Move the position to ship’s position, or…
ENT
Confirm entry and return to WP list
) Plot new waypoints with the [PLOT] key. Refer to section 3.3.9.
Page 52

CA42/50/52 Waypoint/route menus Chapter 5
52
5.1.1 Delete waypoints via menu
MENU
Call up the menu bar, and…
3,1
load WP list
+/-
Select waypoint you wish to delete
ENT
Press
[ENT]
to open for editing
WIN
Press [WIN] to delete waypoint
CLR
Confirm entry and return to WP list
) Edit waypoints directly on the chart via info windows. Refer to
section 3.3.3.
5.2 Routes stored in the memory
The route list will keep a record of all the saved routes in the system.
It will provide information on number of waypoints in the route, etc.
Existing routes can be altered via the route list – see further on in this
chapter, or directly on the chart via info windows – refer to sections
3.3.4 and 3.3.5. To delete a route – refer to section 5.2.1.
) Making new routes can be done directly on the chart with the PLOT
function – refer to section 3.3.9, or from the WP list using existing
waypoints – refer to section 5.2.2.
MENU
Call up the menu bar, and…
3,2
load route list
+/-
Toggle through the stored routes with the +/- keys, or…
A-Z
Select route by entering its name (existing route)
Move cursor up/down to select a specific route
ENT
Call up the route details on highlighted route – see next page.
Page 53
CA42/50/52 Waypoint/route menus Chapter 5
53
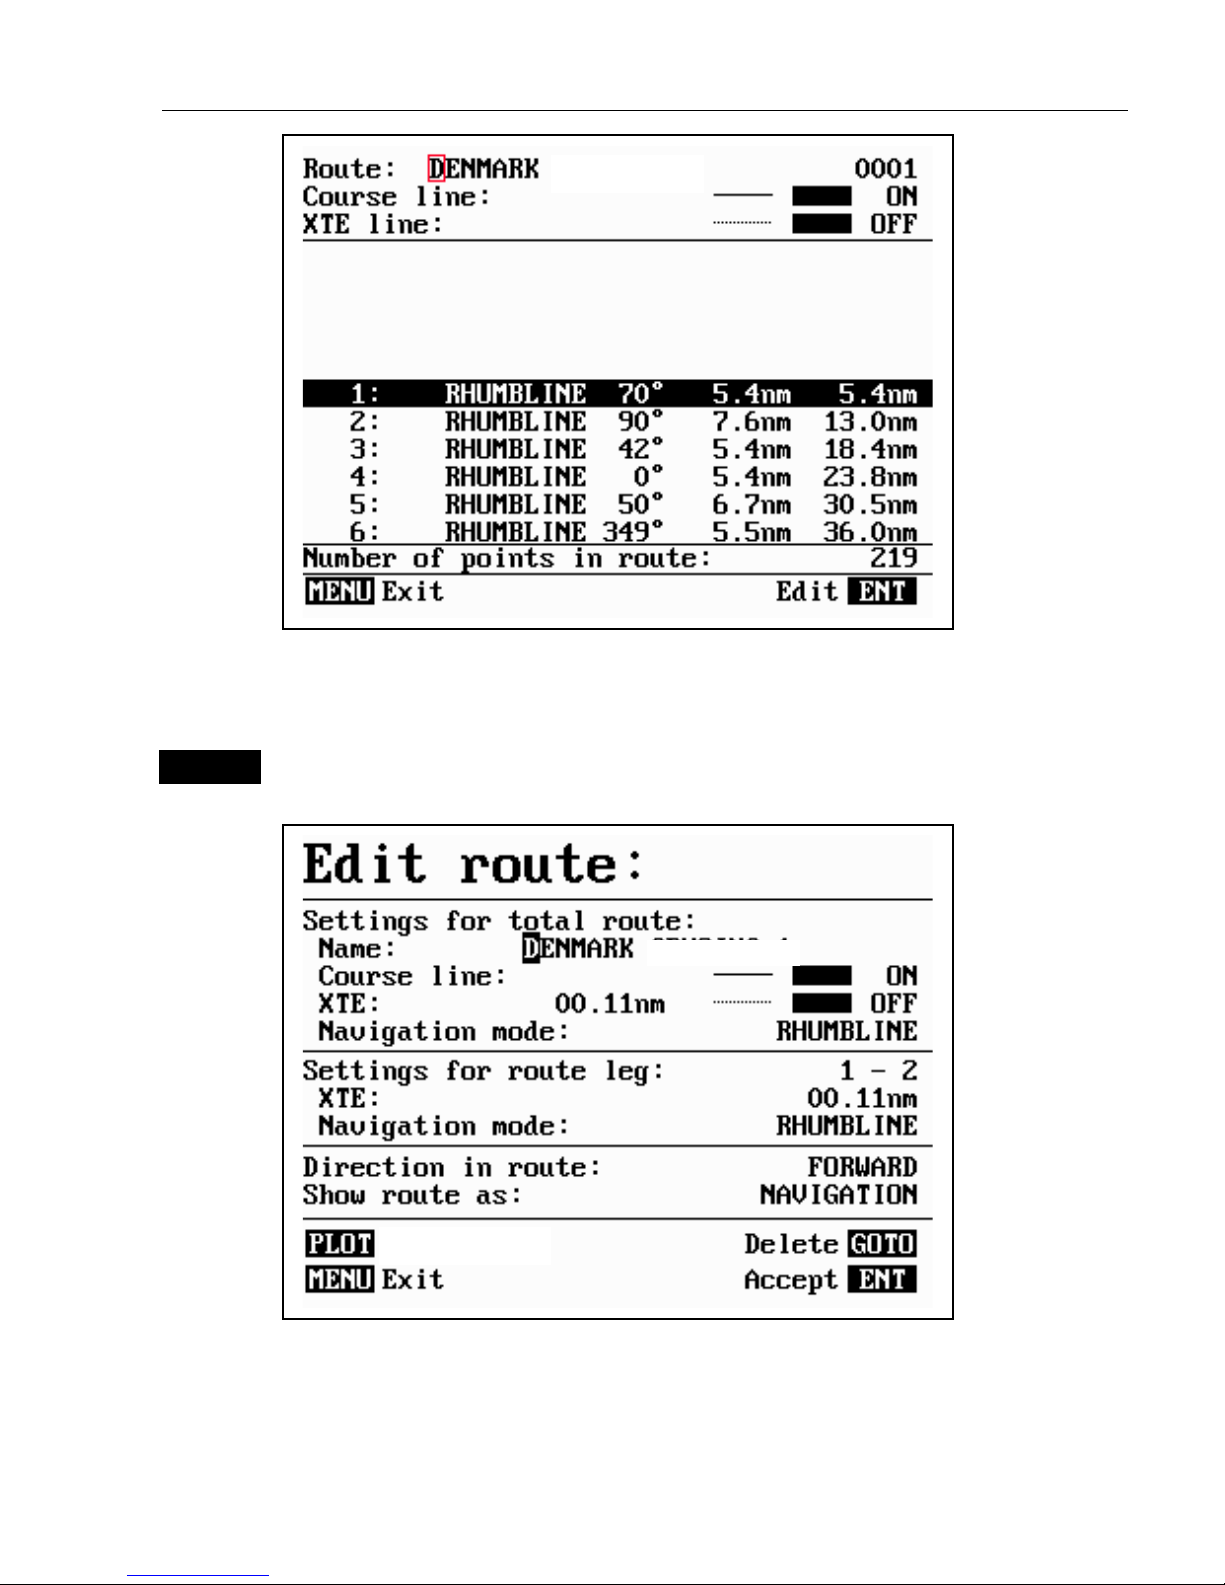
This display provides information on course line, XTE line, route legs,
routepoints, etc.
ENT
Call up the Edit route display – ifyouwishtomakeanychanges.
Turning “Course line” OFF in the Route display will make the route
invisible on the screen. Put it back on the screen by turning it ON
again. The course line and XTE line can be changed in color – there
are a total of 14 colors to choose from, and 9 different line types.
Routepoints
Page 54

CA42/50/52 Waypoint/route menus Chapter 5
54
If the XTE distance is not the same in all legs, the value will be *.*
instead of the 0.10nm. Navigation mode can be either Rhumbline or
Great circle, or … if not set to the same in all legs in a route, the mode
will be:
COMPOSITE.
Direction in route: can be set to either
FORWARDorREVERSE
direction.
Show route as:
NAVIGATION for navigational data in the route display
(example on the previous page), or
POINTS
for a list of route points
together with the points’ position in lat/lon and the XTE limit.
Place the cursor on the function you wish to change
0-9
Key in new figures, and…
+/-
toggle between available values
- if no more alterations are required, go to [ENT], or you can insert/remove routepoints from the route by entering a new display:
PLOT
Open for the function: Remove/insert routepoints
+/-
Existing routepoints can be removed, by using the +/- keys to highlight
CLR
the routepoint you wish to remove, and press [CLR]
New routepoints can be added to the route by using the cursor to go
up/down in the WP list to select the position you wish to add to the
route, then…
+/-
By means of the +/- keys highlight the routepoint where you wish the
PLOT
new position should be placed in the route, and press [PLOT]
- the last point in the RtePt panel is empty, and as such will allow you
to enter a new final routepoint.
ENT
Confirm modification of route and return to the Edit display
- or abandon modification by pressing [MENU]
ENT
Confirm editing
MENU
Return to route list
Page 55

CA42/50/52 Waypoint/route menus Chapter 5
55
5.2.1 Delete route via menu
MENU
Call up the menu bar, and…
3,2
load route list
+/-
Select the route you wish to delete
ENT
Press
[ENT]
to open for editing
WIN
Press [WIN] to delete route
CLR
Confirm
) Edit routes directly on the chart via info windows. Refer to section
3.3.4 and 3.3.5.
5.2.2 Make new route from WP list
When you have a number of waypoints stored in the WP list which
would be convenient to link together as a route it is easily done via the
route list.
MENU
Call up the menu bar, and…
3,2
load route list
CLR
Make new route from WP list
Use the cursor to go up/down in the WP list to select the position you
wish to add to the route, then…
+/-
By means of the +/- keys you can control where the highlighted posi-
PLOT
tion is placed in the route, press [PLOT]
- the last point in the RtePt panel is empty, and as such will allow you
to enter a new final routepoint. Once a WP position is transferred to the
routepoint section, there is no longer any connection between the
position and the waypoint in the WP list.
Select the next position and press [PLOT]. Continue in this manner
until the route is completed. In case you make a wrong plot, you can
Page 56

CA42/50/52 Waypoint/route menus Chapter 5
56
delete the routepoint by highlighting the RtePt number by means of the
+/- keys and then press [CLR] to remove the point from the route.
Display example:
ENT
Save the route with
[ENT]
and go to the Edit display
- or leave the function with [MENU] to abandon the route.
In the Edit route display you can set up the route preferences you need
and also change the name of the route.
Place the cursor on the function you wish to change
0-9
Key in new figures, and…
+/-
toggle between available values
ENT
Confirm editing
MENU
Return to route list
Page 57

CA42/50/52 Waypoint/route menus Chapter 5
57
5.3 Route calculation
To stay well informed during navigation, the Route calculation display
will provide information on how long it takes to go from one point to
another, total distance, arrival time, etc.
MENU
Call up the menu bar, and…
3,3
load route calculation display
Route calculation:
Route: RTE 37
Course line: ON
XTE: ON
Routepoint A: 0001
Routepoint B: 0003
ETA speed: 10.0kn AUTO
Total distance from A to B: 110.5nm
Time to go from A to B: 2h35m
Arrival time: 11:41
Date: 12-02-2001
+/-
Toggle between available routes in the memory
Go to Routepoint A, and
0-9
Select the first route point (A) from where you wish to start the
calculation in the route, and then select the second point (B)
Present speed is automatically used for calculating the arrival time, but
if required, an alternative speed can be inserted:
ENT
Open for change
0-9
and insert new speed value
+/-
Toggle between AUTO and MANUAL
ENT
Confirm entry
Page 58

CA42/50/52 Waypoint/route menus Chapter 5
58
5.4 Lines stored in the memory
The line list will keep a record of all the saved lines in the system.
It will provide information on number of line sections in line, etc.
“Lines” are used for defining a certain area on the chart, e.g. a fishing
ground, a shipwreck, large rocks, restricted areas, etc., or defining a
channel to sail through narrow passages, making your own coast line or
for whatever reason you could use a drawing on the chart.
) To draw new lines you need a chart in the active window, place the
cursor where you wish to start the line, and press
[PLOT].
Then follow
the instructions in the info windows. Refer to section 3.3.9.
Lines can also be edited directly on the chart via info windows. Refer
to section 3.3.4 and 3.3.5.
MENU
Call up the menu bar, and…
3,4
load line display
) Only plotted lines saved in the memory can be called forward.
Line: FISHING BORDER 0005
Line: ON
1: 56°52.700N 009°50.230E
2: 56°52.712N 009°50.431E
3: 56°52.723N 009°50.654E
4: 56°52.756N 009°50.760E
5: 56°52.856N 009°50.899E
6: 56°52.901N 009°51.232E
7: 56°53.230N 009°51.400E
8: 56°53.650N 009°51.432E
9: 56°53.897N 009°51.230E
10: 56°54.220N 009°52.110E
Number of sections in line: 16
This display
indicates
how many
line sections
are used for
the drawing.
+/-
Toggle through the stored lines with the +/- keys, or…
Leaf through the line points by moving cursor up/down
Page 59

CA42/50/52 Waypoint/route menus Chapter 5
59
ENT
Call up the Edit line display - if you wish to make any changes.
Edit line:
Name: FISHING BORDER
Line: ON
Turning
“Line” OFF
will make
the line
drawing
invisible on
the screen.
Putitback
on the screen
by turning it
ON again.
WIN
Delete
MENU
Exit
ENT
Accept
Place the cursor on the function you wish to change i.e. name, line type
or color
+/-
Toggle between available values
ENT
Confirm entry
5.4.1 Delete lines via menu
MENU
Call up the menu bar, and…
3,4
load line display
+/-
Select the line you wish to delete
ENT
Press
[ENT]
to open for editing
WIN
Press [WIN] to delete the line
CLR
Confirm
) Edit lines directly on the chart via info windows. Refer to section
3.3.4 and 3.3.5.
Page 60

CA42/50/52 Waypoint/route menus Chapter 5
60
5.5 Start / stop track
The track function will provide a track trailing the movement of your
ship. With a Simrad TL50 Turbo Loader + ARPA radar connected, you
will also be able to track ARPA targets on the CAXX chart display refer to the TL50 manual for further details.
To start track function from own ship:
MENU
Call up the menu bar, and…
3,5
load Start track pop-up window
Start track:
Name: TRACK 1
Display track: ON
Update: DISTANCE
Interval: 0.100nm
Trackpoints: 0
Type:
As default
from the
factory:
The first
track is
stored as
TRACK1,
the next as
TRACK2,
etc.
MENU
Exit Start
ENT
If you wish to change the default values:
Move cursor to where you wish to make a change
+/-
Toggle between available values, or…
0-9
key in new values
ENT
Start track by pressing
[ENT]
Name of track can be altered (max. 25 characters).
Display track can be set ON and OFF, where OFF will make it
invisible on the screen. Turn ON to put it back on the screen.
Page 61
CA42/50/52 Waypoint/route menus Chapter 5
61
Update of the track can be performed by distance in nautical miles, or
by time interval.
Type of track line i.e. full, dotted, etc. has 9 different types to choose
from in 15 different colors.
To stop track:
MENU
Call up the menu bar, and…
3,6
load Stop track pop-up window
ENT
Press [ENT] to stop the highlighted track
5.6 Tracks stored in the memory
All tracks (of more than 1 trackpoint) will automatically be stored in
the memory. To see which tracks are registered, you can scroll through
the list by:
MENU
Call up the menu bar, and…
3,7
load “Tracks” in active window
Track: TRACK 1
Tracking: OFF
Display track: ON
Trackpoints: 25
Type:
As default
from the
factory:
The first
track is
stored as
TRACK1,
the next as
TRACK2,
etc.
A-Z
Select name of track
- or if a number is included in the track name, place cursor on the
number, and …
+/-
Toggle up/down in the track numbers
Page 62

CA42/50/52 Waypoint/route menus Chapter 5
62
ENT
Open for change
“Display track” can be set ON/OFF, where OFF will make it invisible
on the screen. Turn ON to put it back on the screen.
+/-
Toggle between available values
ENT
Confirm changes
5.6.1 Delete tracks via menu
MENU
Call up the menu bar, and…
3,7
load track display
+/-
Select the track you wish to delete
ENT
Press [ENT] to open for editing
WIN
Press [WIN] to delete the track
CLR
Confirm
) Edit tracks directly on the chart via info windows. Refer to section
3.3.6.
Page 63

CA42/50/52 Waypoint/route menus Chapter 5
63
5.7 Targets stored in the memory
The CAXX can display the bearing and distance of up to three targets
at a time in relation to the vessel e.g. harbors or important navigational
points. A target is a fixed point on the chart which can be plotted by the
cursor or from the ship’s position, or keyed in via the keypad.
Set up targets
The plotted target position is automatically preset to actual position of
ship, or to cursor position when the chart display is active and the
cursor is on – see INFO windows, section 3.3.7.
MENU
Call up the menu bar, and…
3,8
load target display
Targets:
Name: TARGET 1 ON
Position: 56°52.700N 9°50.500E
B 213° D 195.7nm
Name: TARGET 2 ON
Position: 54°51.500N 9°52.135E
B 130° D 215.7nm
Name: TARGET 3 ON
Make the
target
invisible on
the screen by
turning it
OFF.
Putitback
on the screen
by turning it
ON again.
Position: 56°52.700N 9°50.500E
B 345° D 295.7nm
Select the target you wish to change or replace with a different target
by moving the cursor up/down
+/-
Leaf through the targets in the memory
ENT
Open for change, and…
Place cursor where you wish to make a change i.e. name, color, etc.
Page 64

CA42/50/52 Waypoint/route menus Chapter 5
64
A-Z
Key in new values, alphabetical or
0-9
numerical
+/-
Toggle between available values
ENT
Confirm entry
5.7.1 Delete target via menu
MENU
Call up the menu bar, and…
3,8
load target display
+/-
Select the target you wish to delete
ENT
Press
[ENT]
to open for editing
WIN
Press [WIN] to delete the target
CLR
Confirm
) Edit targets directly on the chart via info windows. Refer to section
3.3.7.
Page 65

CA42/50/52 NAV menus & navigation examples Chapter 6
65
6.1 NAV menu – (NAV inactive)
_4_
NAV
_1_ Highway
- see section 6.1.1
_2_ Waypoint navigation
- see section 6.5.2
_3_ Route navigation
- see section 6.5.3
_4_ Track navigation
- see section 6.5.4
_5_ Anchor guard
- see section 6.3
_6_ Trim & highway
- see section 6.2.7
_7_ Set & drift
- see section 6.2.8
This NAV menu will appear when there is no navigation mode active.
See also section 6.2 –whennavigationmodeisactive,section6.3
Anchor guard, 6.4 MOB navigation, and 6.5 Navigation examples.
6.1.1 Highway display
MENU
Call up the menu bar, and…
4,1
load Highway display
Since there is no navigation mode active, you will receive the legend:
NAVIGATION IS OFF. To enter the basic Navigation setup display:
ENT
Press
[ENT]
to call up Navigation setup
- see display example next page.
Before starting out in one of the navigation modes, it may be a good
idea to check out the Navigation setup display and see if the default
settings will suit your need.
Page 66

CA42/50/52 NAV menus & navigation examples Chapter 6
66
Navigation setup:
Anchor alarm distance: 00.50nm
WP circle alarm: 00.10nm OFF
WP and cursor navigation:
XTE alarm: 00.10nm OFF
Navigation mode: RHUMBLINE
Route navigation:
XTE alarm: OFF
Auto waypoint shift: WP-circle
Track navigation:
XTE alarm: 00.10nm OFF
Auto trackpoint shift: WP-line
Navigation mode: RHUMBLINE
+/-
Toggle between available values, or…
0-9
key in a new alarm limit
ENT
Confirm entry
Anchor alarm distance – When setting anchor, check/change the
preset alarm distance, etc., so you will be warned in case you drift too
far from the anchored position. The alarm distance can be set to
anywhere from 0.01 to 9.99nm. See also section 6.3 Anchor guard.
The alarm will automatically reset once you are inside the limits again.
WP circle alarm – forms a circle around each waypoint, and the alarm
distance can be set to anywhere between 0.01 and 9.99nm.
The waypoint alarm will be activated when you reach the circle or the
perpendicular line – WP line alarm – crossing through the waypoint.
When “Auto waypoint shift” is set to “WP-circle” it will override the
“WP circle alarm” function.
XTE alarm – forms a corridor along the ideal track. When crossing
one of the boundaries the XTE alarm will be activated.
The alarm will automatically reset once you are inside the limits again.
The alarm distance can be set to anywhere between 0.01 and 9.99nm.
) In Route navigation the XTE alarm value can be specified for each
route leg – see section 5.2.
Page 67

CA42/50/52 NAV menus & navigation examples Chapter 6
67
Navigation mode –
RHUMBLINE
navigation is used for shorter
distances, and
GREAT CIRCLE for long trips, especially when crossing
at high latitudes.
COMPOSITE
navigation is used when not all legs in a
route are set to the same navigation mode.
Auto waypoint shift – can be set to “WP-circle”, “WP-line” or “OFF”.
When set to WP-circle, the system will change to the next waypoint in
the route after passing the circle line (border).
When set to WP-line, the system will change to next waypoint in the
route after passing the waypoint line (border).
When “Auto waypoint shift” is set to “WP-circle”,thenthealarm
function at the waypoint’s circle will not be activated.
6.2 NAV menu – (NAV active)
_4_
NAV
_1_ Highway
- see section 6.2.1
_2_ Turn NAV off
- see section 6.2.3
_3_ WP advance
- see section 6.2.4
_4_ Restart to approaching point
- see section 6.2.5
_5_ ETA & AVN
- see section 6.2.6
_6_ Trim & highway
- see section 6.2.7
_7_ Set & drift
- see section 6.2.8
This NAV menu will appear when navigation mode is active.
If the selected navigation mode is Waypoint navigation, then point
3:WP advance will not be available and therefore the color of the text
will differ from the rest of the menu text.
See also section 6.1 NAV menu – (NAV inactive), section 6.3 Anchor
guard, 6.4 MOB navigation, and 6.5 Navigation examples.
Page 68

CA42/50/52 NAV menus & navigation examples Chapter 6
68
Route: RTE 3 5
BN: 16.4° TDG: 35.7nm TTG: 2h34m
S8.2
V7.4
C359
°°°°
B314
°°°°
X0.011
D17.3
0.04nm
0.02nm
0.02nm
0.04nm
0.02nm
0.02nm
6.2.1 Highway display
MENU
Call up the menu bar, and…
4,1
load Highway display
With navigation mode active, the highway display will provide a
graphical steering display:
C: Course over ground
X: XTE – Cross-track-error
S: Speed over ground
B: Bearing to approaching
point
D: Distance to approaching
point
V: Speed towards point
Route: Name of active
route
Point: No. of approaching
point
TDG: Total distance to go
BN: Bearing to next point
TTG:Timetogo(onlyfor
waypoint navigation).
n
Ship’s position and course in relation to intended track.
n
o
Intended track between two waypoints or from ship’s position when
NAV is activated.
p
XTE alarm lines – an alarm will be activated if the ship moves across
the lines (if the alarm is enabled).
Refer to section 6.1.1 for alarm setup.
n
o
p
p
Page 69

CA42/50/52 NAV menus & navigation examples Chapter 6
69
6.2.2 Navigation setup
If you wish to make any changes in the navigation setup, you can
quickly enter the navigation setup display by pressing
[ENT]
from the
highway display (graphical steering display).
ENT
Quick access to navigation setup from active highway display, or…
-refer to display example and description of functions in section 6.1.1.
6.2.3 NAV mode – Turn NAV off
MENU
Call up the menu bar, and…
4,2
turn off navigation mode
6.2.4 NAV mode – Waypoint advance
½
MENU
Call up the menu bar, and…
4,3
activate shift to next waypoint
- it will require that navigation mode is active and that “anext
waypoint” exists.
6.2.5 NAV mode – Restart to approaching point
½
MENU
Call up the menu bar, and…
4,4
activate restart to approaching point
- if you for some reason have drifted off course and wish to restart
navigation from your actual position to the approaching point.
Page 70

CA42/50/52 NAV menus & navigation examples Chapter 6
70
6.2.6 NAV mode – ETA & AVN
) Navigation mode must be active to call up the ETA & AVN display.
MENU
Call up the menu bar, and…
4,5
load the ETA & AVN display
ETA:
Arrival time: 12:46
Date: 12-02-2001
ETA mode: AUTO ETA speed: 10.0kn
AVN:
Velocity: 12.5kn
Planned arrival time: 09:24
Date: 12-02-2001
Route: RTE 3 1
ETA – Estimated Time of Arrival - refers to the inserted local time,
and can be calculated to any point used for navigation.
AVN – Approximate Velocity Necessary – is automatically calculated
in knots after you key in the planned arrival time and date.
In route navigation the approaching point and present speed over
ground (AUTO) is automatically used for the calculation.
You can change to any waypoint in the route and also insert an alternative ETA speed (MANUAL).
ENT
Open for change – in route navigation the approaching point is
automatically suggested and present speed is used for calculation.
If required – go to, and…
0-9
Insert alternative routepoint – only in Route navigation.
Page 71

CA42/50/52 NAV menus & navigation examples Chapter 6
71
Go to ETA mode, and…
+/-
Select
AUTO
or MANUAL
Go to AVN, and…
0-9
Insert time and date
ENT
Confirm entry
6.2.7 NAV mode – Trim & highway display
) The readings rely on data from external log and compass, and
navigation mode must be active.
The Set & drift trim display will provide information on actual and
mean speed, velocity and wind.
- see also section 6.2.8 Set & drift display.
MENU
Call up the menu bar, and…
4,6
load the Trim & highway display
B: Bearing.
X: XTE
Cross-trackerror.
D: Distance
to point.
ENT
Open for change
ENT
Reset mean speed indication in display
Route: RTE 3 5
-3 -2 -1 1 2 3
-3 -2 -1 1 2 3
B: 258° X: 0.011nm D: 1.18nm
-3 -2 -1 1 2 3
W/ kn
7.6
Av. W
7.2
Av. V
7.4
V/kn
7.2
Av. S
6.3
S/kn
7.4
0.02nm0.02nm
Page 72

CA42/50/52 NAV menus & navigation examples Chapter 6
72
6.2.8 Set & drift
) The readings rely on data from external log and compass.
MENU
Load menu bar, and…
4,7
load display for “Set & drift”
Set & drift
0.6 kn
T
Relative
direction.
Speed.
True
direction
The set & drift display will show how fast the current is moving in
knots; in what direction (true) it is moving and what direction in
relation to the vessel (relative).
) To obtain information on actual and mean speed, velocity and water
speed – see the “Trim & highway display” in section 6.2.7.
30
60
90
30
60
90
Page 73

CA42/50/52 NAV menus & navigation examples Chapter 6
73
6.3 Anchor guard
MENU
Call up the menu bar, and…
4,5
activate the anchor guard function
- the chart display will provide an impression of the vessel’s position in
relation to the alarm circle.
To check/change the preset alarm distance:
MENU
Call up the menu bar, and…
4,1
load the highway display
ENT
Press
[ENT]
to call up the navigation setup display
Move cursor to the Anchor alarm distance
0-9
Enter new value with numeric keys
ENT
Confirm the change
To turn Anchor guard off again:
MENU
Call up the menu bar, and…
4,2
turn anchor guard off
Page 74

CA42/50/52 NAV menus & navigation examples Chapter 6
74
6.4 MOB na vig a tion
The MOB – Man overboard – display will be activated if you press the
blue
[MOB] key on the CAXX keypad and hold it depressed for two
seconds, or activate an external MOB switch. The MOB display will
provide all relevant data for an efficient rescue operation – see display
examples on the rear of the first page of the manual.
To turn the MOB function off again:
MENU
Call up the menu bar, and…
4,2
turn the MOB function off
To check the last activated MOB position:
MENU
Call up the menu bar, and…
7,2
select MOB position
6.5 Navigation examples
Relevant for all navigation modes are:
- the navigation display with graphical steering – section 6.2.1.
- the ETA & AVN display with Estimated Time of Arrival and
Approximate Velocity Necessary to reach a given point at a
specific time – section 6.2.6.
- the *Set & drift display with indication of how fast the current is
moving in knots, in what direction (true) it is moving and what
direction in relation to the vessel (relative) – section 6.2.8.
- the *Trim & highway display with information on actual and mean
speed over ground, velocity
(VMG)
and water speed – section 6.2.7.
* These readings rely on data from external log and compass.
6.5.1 Chart/cursor navigation. 6.5.2 Waypoint navigation.
6.5.3 Route navigation. 6.5.4 Track navigation.
Page 75

CA42/50/52 NAV menus & navigation examples Chapter 6
75
6.5.1 Chart/cursor navigation
Cursor navigation is the easiest and most straightforward way of
navigation – point and go.
CHART
Shortcut to chart 1 display
Press the cursor key to activate the cursor, then move the cursor to
your destination
GOTO
Call up “Select NAV mode” window, and…
1
select “Cursor”
A course line will now be drawn from actual position (ship’s position)
to destination point (cursor’s position).
Next destination: While on the way, you can easily move the cursor
to the next destination, and when ready to change navigation leg…
GOTO
Press
[GOTO]
and
[2]
to…
2
“Restart to approaching point”
- A new course line will be drawn from ship’s position to destination.
It is possible to mix and match the data you require to have on the
screen e.g. ½ window for the chart display, ¼ window for the
navigation display, and ¼ window for the Trim & highway display,
maybe. The choice is yours. Refer to section 2.1 Fundamentals of the
PAGE and WINdow system.
To turn NAV mode off again:
GOTO
Press
[GOTO]
and
[3]
to…
3
“Turn NAV off” from active chart display
or…
MENU
Press
[MENU]
and
[4], [2]
to…
4,2
“Turn NAV off” via the menu
Page 76

CA42/50/52 NAV menus & navigation examples Chapter 6
76
6.5.2 Wayp oint navigat i on
There are two ways of activating Waypoint navigation:
From the chart or from the menu.
From the chart:
CHART
Shortcut to chart 1 display
Press the cursor key to activate the cursor, then move the chart cursor
to your destination waypoint (orselectfromWPlist-seebelow)
GOTO
Select NAV mode, and…
2
Select Waypoint from WPlist (if chart cursor is placed on a WP, this
WP will be highlighted in the WPlist)
This will activate the pop-up window ‘Navigate to WP’ - now follow
the procedures from the ) a few lines down.
From the menu:
MENU
Call up the menu bar, and…
4,2
select Waypoint navigation
) This will activate the pop-up window “Navigate to WP” from where
you can choose which waypoint you wish to sail to:
Use the cursor to scroll up/down in the waypoint list, or place cursor
on the WP number, and…
+/-
Scroll up/down with +/- keys, or…
0-9
Key in the number of the waypoint you wish to sail to
ENT
Start navigation
A course line will now be drawn from ship’s position to destination
waypoint.
Page 77

CA42/50/52 NAV menus & navigation examples Chapter 6
77
It is possible to mix and match the data you require to have on the
screen e.g. ½ window for the chart display, ¼ window for the
navigation display, and ¼ window for the Trim & highway display,
maybe. The choice is yours. Refer to section 2.1 Fundamentals of the
PAGE and WINdow system.
To turn NAV mode off again:
GOTO
Press
[GOTO]
and
[3]
to…
3
“Turn NAV off” from active chart display with cursor on
or…
MENU
Press
[MENU]
and
[4], [2]
to…
4,2
“Turn NAV off” via the menu
6.5.3 Route navigation
To start Route navigation will require that at least one route is stored in
the memory. Refer to section 3.3.9 PLOT function.
When navigating in a route, you will have a graphical steering display
to navigate by, see section 6.2.1. Know your ETA – Estimated Time of
Arrival, and your AVN – Average Velocity Necessary, see section
6.2.6. Call up the Set & drift display, see section 6.2.8.
There are two ways of activating Route navigation:
From the chart or from the menu
From the chart:
CHART
Shortcut to chart 1 display
Press the cursor key to activate the cursor
GOTO
Select NAV mode
3
Select Route (if chart cursor is placed on a route, this route will be
Page 78

CA42/50/52 NAV menus & navigation examples Chapter 6
78
suggested).
This will activate the pop-up window ‘Navigate in route’ - now follow
the procedures from the ) a few lines further ahead.
From the menu:
MENU
Call up the menu bar, and…
4,3
select Route navigation
) This will activate the pop-up window “Navigate in route” from
where you can choose which route you wish to select for navigation:
+/-
Scroll up/down in the route list until the correct route number / name
appears
Use the cursor to move around in the window if anything needs to be
changed – such as Direction in route, etc.
0-9
Key in the number of the waypoint you wish to sail to
ENT
Start navigation
A course line will now be drawn from ship’s position to the first
waypoint in the route.
It is possible to mix and match the data you require to have on the
screen e.g. ½ window for the chart display, ¼ window for the
navigation display, and ¼ window for the Trim & highway display or
ETA & AVN display, maybe. The choice is yours. Refer to section 2.1
Fundamentals of the PAGE and WINdow system.
GOTO
Pressing
[GOTO]
from chart display during navigation will activate an
INFO window with the following functions to choose from:
1. Advance (to next waypoint in route)
2. Restart to approaching point (in case you have drifted off course)
3. Turn NAV OFF.
Page 79

CA42/50/52 NAV menus & navigation examples Chapter 6
79
MENU
Pressing [MENU] and [4], from an active data display during navigation
4
will give access to the following displays / feature:
1. Highway display
2. Turn NAV off
3. WP advance (to next waypoint in route)
4. Restart to approaching point (in case you have drifted off course)
5. ETA & AVN
6. Set & drift trim
7. Set & drift
6.5.4 Track navigation
A track is created by a series of trackpoints connected by track lines.
Using a track for navigation is somewhat like navigating in a route
with many waypoints.
) To start Track navigation will require that at least one track is stored
in the memory. Tracks which are not yet completed can not be used for
navigation. Refer to section 5.5 Start / Stop track.
When navigating in a track, you will have a graphical steering display
to navigate by, see section 6.2.1. Know your ETA – Estimated Time of
Arrival, and your AVN – Average Velocity Necessary, see section
6.2.6. Call up the Set & drift display, see section 6.2.8.
There are two ways of activating Track navigation:
From the chart or from the menu.
From the chart:
CHART
Load chart display in active window, and…
press cursor key to activate the cursor
GOTO
Select NAV mode
4
Select Track (if chart cursor is placed on a track, this track will be
Page 80

CA42/50/52 NAV menus & navigation examples Chapter 6
80
suggested).
This will activate the pop-up window ‘Navigate in track’ - now follow
the procedures from the ) a few lines further ahead.
From the menu:
MENU
Call up the menu bar, and…
4,4
select Track navigation
) This will activate the pop-up window ‘Navigate in track’ from
where you can choose which track you wish to select for navigation:
+/-
Scroll up/down in the track list until the correct track number / name
appears
Use the cursor to move around in the window if anything needs to be
changed – such as Direction in track, etc.
0-9
Key in the number of the first trackpoint you wish to sail to
Navigate in track:
Track: TRACK 1 0001
Trackpoint: 00001
Bearing: 224° Distance: 0.000nm
Direction in track: FORWARD
XTE alarm: 00.10 OFF
Auto trackpoint shift: WP-circle
Navigation mode: RHUMBLINE
Beep at trackpoint shift: OFF
ENT
Start navigation
A course line will now be drawn from ship’s position to the first point
of destination.
Page 81

CA42/50/52 NAV menus & navigation examples Chapter 6
81
It is possible to mix and match the data you require to have on the
screen e.g. ½ window for the chart display, ¼ window for the
navigation display, and ¼ window for the Trim & highway display or
ETA & AVN display, maybe. The choice is yours. Refer to section 2.1
Fundamentals of the PAGE and WINdow system.
GOTO
Pressing
[GOTO]
from chart display during navigation will activate an
INFO window with the following functions to choose from:
1. Advance (to next trackpoint)
2. Restart to approaching point (in case you have drifted off course)
3. Turn NAV OFF.
MENU
Pressing [MENU] and [4], from an active data display during navigation
4
will give access to the following displays / feature:
1. Highway display
2. Turn NAV off
3. WP advance (to next trackpoint)
4. Restart to approaching point (in case you have drifted off course)
5. ETA & AVN
6. Set & drift trim
7. Set & drift
Page 82

CA42/50/52 NAV menus & navigation examples Chapter 6
82
Page 83

CA42/50/52 Echosounder operation Chapter 7
83
7. Echosounder operation
The echosounder function of the CAXX determines the distance
between its transducer and underwater objects such as fish, lake bottom
or seabed. It does this by utilizing the fact that an ultrasonic wave
transmitted through water travels at a nearly constant speed of 4800 feet
(1500 meters) per second. When a sound wave strikes an underwater
object such as fish or sea bottom, part of the sound wave is reflected
back toward the source. Thus by calculating the time difference between
the transmission of a sound wave and the reception of the reflected
sound wave, the depth to the object can be determined.
The entire process begins in the display unit. Transmitter power is sent
to the transducer as a short pulse of electrical energy. The electrical
signal produced by the transmitter is converted into an ultrasonic signal
by the transducer and transmitted into the water. Any reflected signals
from intervening objects (such as a fish school) are received by the
transducer and converted back into an electrical signal. It is then amplified in the amplifier section, and finally, displayed on the screen.
The picture displayed is made up of a series of vertical scan lines
(pings), one for each transmission. Each line represents a ‘snapshot’ of
what has occurred beneath the boat. The series of snapshots are accumulated side by side across the screen, and the resulting contours of the
bottom and fish between the bottom and surface are displayed.
Selecting echosounder displays
The CAXX provides four types of echosounder displays: standard, bottom zoom, marker zoom and A-scope. Each display has its advantages
and disadvantages. Select the appropriate setup for the echosounder
display in the presentation ‘Setup’ and ‘Echosounder setup’ displays,
considering current sea area and target fish.
) To view the echo display while plotting ship’s route, select a CHART
display in one window and an ECHO display in the adjacent window.
Page 84

CA42/50/52 Echosounder operation Chapter 7
84
7.1 ECHOSOUNDER MENU
_5_
ECHO
_1_ Echo 50kHz
- see section 7.2.
_2_ Echo 200kHz
- see section 7.2.
_3_ Bottom expansion 50kHz
- see section 7.3
_4_ Bottom expansion 200kHz
- see section 7.3.
_5_ VRM expansion 50kHz
- see section 7.4.
_6_ VRM expansion 200kHz
- see section 7.4.
_7_ Depth & temperature diagram
- see section 7.7.
_8_ Echosounder setup
- see section 7.8.
7.2 Echosounder display
Low and high frequency echosounder display can be set up separately
and be shown simultaneously in the same screen, but in separate
WINdows. The low frequency display will show deep water bottom
contours, and the high frequency display will show the mid-water
section with trawl targets or bait fish in a higher resolution.
As an example:
MENU
Press
[MENU],
to call up the menu bar, and…
5,2
press
[5]
and
[2]
to call up the Echo display for 200kHz
- see display example on next page.
The top line in the display informs of: Actual temperature T in Celcius
or Fahrenheit (in half degrees), current speed S in knots or kilometers/
hour or miles/hour – current settings can be changed in Setup for units
(MENU, 6,1).
Actual depth DK i.e. Depth below Keel/Surface/Trans-
ducer – settings can be changed in echosounder setup
(MENU, 5,8).
FREQUENCY
indicates the selected frequency.
PULSE
(not in ¼ size displays) indicates the transmission pulse length.
POWER
(not in ¼ size displays) indicates the transmission power.
(A =
AUTO)
Page 85

CA42/50/52 Echosounder operation Chapter 7
85
This is the basic presentation mode (standard display) for observing
fish schools and seabed. Some surface noise may appear just below the
transmission line.
) Refer to Appendix A for further description of the various functions.
ENT
Direct access to Setup display related to active echo display – 38kHz,
50kHz or 200 kHz – (see section 7.9)
Use the cursor to go to the function you wish to change the value for
+/-
Toggle between available values, and…
ENT
Confirm with
[ENT]
ECHO
A-SCP
Hotkey to Echo 1 display (from
[MENU],[5],[1]
) i.e. jumps to window
on the screen with Echo 1 display; if none: inserts Echo 1 in active
window.
Transmission
line
VRM
Depth range
is adjustable
with +/- keys
or the Quickrange keys
1-9.
Press key 0
to return to
Auto range.
FREQUENCY: 50kHz
PULSE: A- SHORT
POWER: A- 1000W
T *.*°C S 0.0kn DK 5.0 m
Page 86

CA42/50/52 Echosounder operation Chapter 7
86
7.3 Bottom expansion
The advanced bottom lock and expansion feature ensures a reliable
depth readout and provides a compressed standard display in the upper
1/2 of the display. The bottom area can be magnified for better
separation of echoes. The actual size of the expansion window can be
adjusted in the Setup display for 38kHz/50kHz/200kHz.
As an example, from active echo display, 50kHz:
MENU
Press
[MENU],
to call up the menu bar, and…
5,3
press
[5]
and
[3]
to activate bottom expansion of the 50kHz sounder
+/-
Thedepthrangeattherightofthescreencanbeadjustedbymeansof
the + and – keys
ENT
Open Setup display (see section 7.9), if any changes are required
ENT
and confirm changes with
[ENT]
MENU
Return to standard echo display 1 or 2 via Echo menu
FREQUENCY: 50kHz
PULSE: A- SHORT
POWER: A- 1000W
T *.*°C S 0.0kn DK 5.0 m
Page 87

CA42/50/52 Echosounder operation Chapter 7
87
7.4 VRM expansion
This feature will provide an expanded view of the area near the
Variable Range Marker which will give a better separation of echoes.
The actual size of the expansion window can be adjusted in the Setup
display for 38kHz/50kHz/200kHz. As an example, from active echo
display, 50kHz:
MENU
Press [MENU], to call up the menu bar, and…
5,5
press
[5]
and
[5]
to activate VRM expansion of the 50kHz sounder
The zoom level can be selected in seven steps ranging from 3 to 50
meters, or converting to feet or fathoms (refer to Setup for units,
section 10.1). The VRM horizontal line can be moved up/down by
means of the cursor.
+/-
Adjust range with the + and - keys
ENT
Open Setup display (see section 7.9), if any changes are required
ENT
and confirm changes with
[ENT]
MENU
Return to standard echo display 1 or 2 via Echo menu
T *.*°C S 0.0kn DK 5.0 m
FREQUENCY: 50kHz
PULSE: A- SHORT
POWER: A- 1000W
Page 88

CA42/50/52 Echosounder operation Chapter 7
88
7.5 A-scope
The amplitude scope which appears in the right side of the echo
display, can be turned on and off.
The readout indicates the precise amplitude or strength of the last
received ping (sounding), which often can be used for determining
individual species of fish or hardness of the bottom.
From active echo display:
A-SCP
Gain direct access to the A-scope function
The vertical marker in this display is activated by the
[PLOT]
key +
select ‘Set vertical marker’.
+/-
Adjust range with the + and - keys
ENT
Open Setup display (see section 7.9), if any changes are required
ENT
and confirm changes with
[ENT]
A-SCP
Turn A-scope OFF again
T *.*°C S 0.0kn DK 5.0 m
FREQUENCY: 50kHz
PULSE: A- SHORT
POWER: A- 1000W
Page 89

CA42/50/52 Echosounder operation Chapter 7
89
7.6 Variable range marker
From active echo display:
Turn on the Variable Range Marker function, and…
Move the variable range marker up/down
+/-
Adjust the range by means of the +/- keys
CLR
Turn VRM marker off again
7.7 Depth & temperature diagram
MENU
Press
[MENU],
to call up the menu bar, and…
5,7
press
[5]
and
[7]
to activate Depth & temperature diagram
Present water temperature.
8.3°C 12:05 27.2m
[°C] 7:00 7:05 [m]
30 - - 0
- 25
20 -
- 50
10 -
- 75
0 - - 100
Present depth.
Depth over
time or
distance.
Temperature
over time or
distance.
Page 90
CA42/50/52 Echosounder operation Chapter 7
90
ENT
Call Setup for Depth display
Setup for Depth:
Scale for depth: 0 →→→→ 100 m
Color for depth:
Scale for temperature: 0 →→→→ 20 °C
Color for temperature:
Interval of screen: TIME
Time interval: 5 MIN.
Go to the function you wish to change
0-9
Key in new figure, or…
+/-
change setting
ENT
Confirm entry
Scale for depth – there are six depth scales to choose from, ranging
from 0-10m to 0-3000m. Toggle with +/- keys.
Color – for depth and temperature can be changed. Toggle between
available colors by means of the +/- keys.
Scale for temperature – can be set to 0 - 10°,0-20°,0-30°,10-20°
and –10 - 10°.
Interval of screen – Interval for updating of screen can be related to
TIME
or
DISTANCE.
TIME
interval can be set in 6 intervals from 5 minutes to 3 hours
(+ freeze) for refreshing of the screen.
DISTANCE
can be set in 7 intervals ranging from 0.05nm to 90nm in
order to adjust to the boat’s speed, and you can freeze the reading.
Page 91

CA42/50/52 Echosounder operation Chapter 7
91
7.8 Echosounder setup
The ‘Echosounder setup’ display mainly consist of general settings, but
also applies to a specific frequency where stated. The type of transducer selected (and installed) in the first two lines will also determine the
frequencies.
The CAXX features two transceivers, a 50/200kHz (ECHO1) and a
38/200kHz (ECHO2), which gives the following dual frequency
combinations: 38+50, 38+200 and 50+200 kHz.
One combi transducer or two single transducers can be connected.
) Do not connect both a combi + a second transducer at the same time
– see the Installation manual for selection of transducer.
MENU
Call up the menu bar, and…
5,8
press
[5]
and
[8]
to call up the ‘Echosounder setup’ display
Echosounder setup:
Select transducers:
TYPE PORT
Transducer 1: Simrad Combi C50/200 ECHO2
BEAM ANGLE DEPTH
Transducer 1: 12/07° 00.0 m
Keel depth below surface: 00.0 m
Display: DEPTH BELOW KEEL
Data on NMEA-out from: 50kHz
Alarm for fish: Strength: 30dB OFF
Depth DS fish: min: 0010m max: 0100 m
Depth DK alarm min.: 0005.0 m OFF
Depth DK alarm max.: 0100.0 m OFF
Water profile: SALT
Velocity of sound in water: 1470m/s
Time/distance scale: OFF
Echo sampling: BOTTOM
Demo mode: OFF
MENU
Exit Accept
ENT
Use the
cursor key to
move cursor
around in the
display, and
select new
values by
means of the
+/- keys.
The ECHO1 port is for single transducers of 50/200kHz, including
speed and temperature.
The ECHO2 port is for combi transducers as well as single transducers
of 38, 50 and 200kHz, also with temperature.
Choose from the listed transducers where frequencies and other
parameters are preset from the factory.
Page 92

CA42/50/52 Echosounder operation Chapter 7
92
Do not connect transducers containing speed log sensor
!
e.g. Airmar triducer B744V to ECHO2 port, as this will cause
the 1kW pulses to be connected directly to the speed sensor and
thereby damage the electronics beyond repair!
“Display” can show:
DEPTH BELOW SURFACE, DEPTH BELOW
TRANSDUCER, DEPTH BELOW KEEL.
“Data on NMEA-out from” - select the frequency you wish to use for
transfer of data to connected navigator, plotter, etc.
“Alarm for fish” - set the strength from min. 00 (weak echo) to max.
99dB (strong echo), and you can set it ON or OFF.
“Depth DS fish”–defineaspecificareabelowthewatersurfaceof
minimum and maximum depth for concentrated viewing.
“Depth DK alarm min. and max.”–set up a depth limit alarm for depth
below keel.
“Water profile” - choose between SALT and FRESH water. The set-
ting will reflect on the:
“Velocity of sound in water” i.e.
SALT
= 1470 meters per second and
FRESH
= 1430 meters per second as standard. The standard settings can
be even more accurate by slightly increasing the number of meters in
warm waters and decreasing in cold waters.
“Time/distance scale”–will indicate the elapsed time or distance for
the echo picture. The readout will appear in the upper part of the echo
display. Toggle between time and distance in “Scroll synchronisation”,
section 7.9.
“Echo sampling”–is normally left at BOTTOM for total viewing all
the way to the bottom, but can be changed to RANGE for a more
defined search. In RANGE a new transmit pulse will be send out when
the selected range has been reached. This will give a fast ping rate
when searching for fish in mid water. AUTO range will switch to
manual range setting. The depth alarm function has higher priority than
the selected range.
Page 93

CA42/50/52 Echosounder operation Chapter 7
93
“Demo mode” - the echosounder will function as though a transducer
was connected, but all data presented in the displays will be simulated.
ENT
Confirm entry with [ENT]
) The system will not accept an illegal combination of transducers
and will block from confirming changes to the setup display before the
combination is right.
7.9 Presentation setup
The most common settings for adjusting the presentation of the high or
low frequency echo picture are accessed by a single keystroke.
ENT
Press [ENT] from active echo display
Setup 50kHz:
Range start: 000 m
Range: AUTO
Gain: +30dB
White line: OFF
Expansion window: 6 m
TVG: Normal (20 log R)
Ping to ping filter: ON
Signal threshold: OFF
_Color threshold: OFF
Depth grid: OFF
Transmit pulse length: AUTO
Transmit power: AUTO
Scroll synchronization: TIME
Scroll speed: HIGH
Use the
cursor key
to move
around in
the display
and select
new values
by means
of the +/keys.
Go to the function you wish to change
0-9
Key in new figure, or…
+/-
toggle between available values
) Refer to Appendix A, for details on the functions.
ENT
Confirm entry with
[ENT]
and return to the echo display
Page 94

CA42/50/52 Echosounder operation Chapter 7
94
7.10 How the echosounder works
When the CAXX is turned on, the processor begins to send electrical pulses to the
transducer. The ceramic resonators in the
transducer has a special property which
enables it to change dimensions slightly
when a varying voltage is applied.
The voltage is thus converted to mechanical
vibrations (sound waves) which are then
transmitted down through the water.
See Fig. 1.
The sound waves move through the
water until they encounter a change in
density, such as a fish or the bottom.
This causes the sound waves to “echo”
back up through the water. When the
reflected sound waves (echoes) hit the
transducer, the ceramic disk vibrates at
the same frequency.
This generates a varying voltage
between the disk surfaces. This voltage
goes back up through the cable to the
receiver.
The CAXX processes the signals and
presents them on the display screen.
See Fig. 2.
Fig. 2 – Echo returning to the receiver.
Fig. 1 – Transmitted ‘ping’ from
the receiver/transmitter.
Echo from
fish
Transmitted
pulse
Page 95

CA42/50/52 Echosounder operation Chapter 7
95
7.11 Transducer beamwidth
The transducer mounted to the hull of your vessel serves as both a
“speaker” when transmitting, and as a “microphone” when the echo-
sounder is receiving. Similar to the way a flashlight focuses light, most
of the sound from your transducer is focused downwards with a
smaller amount going out to the sides. The amount of focusing of the
sound beam is expressed as a “beamwidth”.
Transducer
Approximation of the
sound pattern below
the transducer
This angle is the
transducers beamwidth
½ maximum intensity
Maximum intensity
Figure 3 – A representation of a transducer beamwidth
Page 96

CA42/50/52 Echosounder operation Chapter 7
96
The center of the sound beam is the most intense, then as you move out
towards the sides of the sound beam there is a point where the intensity
of the sound is half what it was in the center. The distance moved is the
“beamwidth”.SeeFigure3.
7.12 Effects of the vessel’s speed
The display of fish on the CAXX depends directly on the vessel’s
speed, as well as on the depth of the fish. When the vessel is at rest, the
echo traces will appear stretched and flattened. As the vessel’sspeed
becomes greater, the echo traces will become shorter and more arched.
The reason for this change in appearance is that as the vessel speed
increases fewer number of sound “pings” strike each fish. A low vessel
speed will provide the most accurate information of where fish are
located.
Page 97

CA4
2/50
/52 Radar operation Chapter 8
97
8. Radar operation
The CAXX combines chart plotting with radar navigation. For first
time users of Radar, we have included a basic description of the radar
presentation with a basic understanding of how the controls affect the
radar’s operation and display.
The following paragraphs describe the control settings used for initial
display setup, turn-on procedure, inclement weather operation and
finally the turn off procedure. Radar controls are described in chapter
8.2.
8.1 Radar map
The radar picture appearing on the display is a map-like representation
of the area in which the radar is operating. Typically, the ship’s
position is at the center of the display. The operator may reposition or
offset the ship’s position up to 66% of the radius anywhere on the
screen. The ship’s dead ahead bearing is indicated by the heading line
flashing at the 0° relative bearing with every revolution of the sweep
trace (Head-Up mode).
Coastline contours and landmass are generally depicted in solid filled
yellow (DAY) or green (NIGHT) echo areas. Other surface vessels,
and channel buoys, are displayed as smaller single “pips” or echoes.
The radar picture or map can be viewed in many different sizes or
scales from own ship. These sizes are selected by the range scale
controls. Greater detail of radar echoes nearby own ship is shown when
the short or nearby range scales are selected. The best technique for
assessing the radar presentation characteristics is to start with using a
longer range scale and then switching to shorter ranges when nearby
targets appear, or as the ship approaches the coastline, harbor, or other
vessels in the area.
The long range scales (i.e. 3, 6, 12, 24nm) best show the overview of
the ship’s relationship to landmasses, weather fronts, and large ship
targets at or beyond view.
Page 98

CA4
2/50
/52 Radar operation Chapter 8
98
8.1.1 Map orientation
In the RELATIVE mode, the heading line always appears on the screen
at 0° relative according to the on-screen bearing scale, and is coincident with the antenna beam passing the ship’s bow. Thus the top of the
displayed picture represents the direction in which the ship is heading.
All targets appearing on the display are “Relative” to own ship’s position and heading. As you look outside at targets around you, you will
see that the targets are appearing on the Radar display at the same
relative bearing.
The Electronic Bearing Lines (EBL) are available radar tools used to
measure bearings to radar targets from own ship. The bearing readouts
maybeinrelativeortruemodes.
8.1.2 Environmental effects
The effects of weather and water surface conditions generally act to
reduce the ability of radar to detect targets. Weather effects reduce the
long range at which targets can be detected. Water surface clutter
(waves) reduces the ability to detect targets close by. Either can obscure the echoes from targets that may prove dangerous to your vessel.
You can’tseewind on your radar screen, however you can see its
effects when it produces waves and spray on the water surface. “Sea
Return” is most pronounced in the direction from which the wind is
blowing. Proper use of your “Sea clutter” (also known as STC) adjustment can reduce the effect of wind and waves, but care must be taken
not to increase the control to the point where weak targets will be
overlooked.
Rain, hail and snow can return echoes that appear on your radar screen
as a blurred or cluttered area. Targets within the area of precipitation
can be masked by the clutter. The maximum range of the radar pulse is
greatly reduced as the energy of the radar beam is scattered and
absorbed by the water droplets. Proper use of your Rain Clutter (also
known as FTC) adjustment helps you to look into areas of precipitation
to detect targets.
Page 99

CA4
2/50
/52 Radar operation Chapter 8
99
Buoys are moored to the bottom with concrete via chain. The chain is
longer than the depth of the water to allow the buoys to ride in the
current and go up and down with the tide. Unfortunately this allows the
buoys to lean in the direction of the current. Radar reflectors built into
the buoy do not work well when the side of the buoy is pointed to the
sky. Therefore if you are going with the current, the images of the
channel markers may appear faint. If you are going against the current,
the buoys will be leaning in your direction and produce a stronger
image on the radar screen.
The iron mass and angles of the metal in the structure of a bridge can
cause unpredictable interference patterns on your radar. It is not unusual for a reflected image to appear on the radar screen in front of you
just as you pass under the bridge. A similar effect is also common on
sailboats where the radar antenna is mounted close to an aluminum
mast.
Overhead cable crossings can mimic a moving target on your radar
screen. The cable target usually appears to be on a collision course.
The entire length of cable does not appear on the screen, only a point
on the cable, and that point keeps changing giving the illusion of a
moving target.
8.1.3 Effects of ship’s movement
Radar images can be drawn in two ways on the radar display to show
the ship’s motion. The type of display modes are called “Relative
motion” and “True motion”. In Relative motion, the most common
radar display mode, own ship is permanently fixed at the center of the
display but radar echoes (targets) move in relation to your vessel. With
no movement of the ship, a steady display of fixed radar echoes is
shown. If the ship is moving ahead on a constant course, echoes
appearing at the top of the display will move downward across the
display. Your own ship’s position will always remain at the center of
the display.
If the vessel alters course to the right, the displayed echoes will be
displaced by an equal amount in bearing in a counterclockwise
direction, and vice versa. These changes in the display pattern with
ship movement is an extremely important characteristic to remember
Page 100

CA4
2/50
/52 Radar operation Chapter 8
100
when maneuvering around nearby vessels, or buoys.
The True motion display mode can be compared to your vessel moving
on a map or chart. In True motion mode, the surrounding landmass
echoes remain stationary on the screen and if your ship is moving at a
constant course and speed, you will see your position move across the
screen towards the edge of the display. Any other targets which are
underway will also be moving on the display screen at their True
course and True speed. All motion seen on the True motion display is
“TRUE” (meaning motion over the ground).
8.1.4 Navigational echoes
Echoes displayed on the radar screen may be large or small, bright or
faint, depending on the size and shape of the object and its angle
relative to your radar antenna. The radar indication is not always the
same as an observer’s visual indication; a nearby small object may
appear to be the same size as a distant large object on the radar. With
experience, however, different targets can be identified by the relative
size, brightness, and position of their radar echo returns.
Buoys and small boats are one example of targets that are sometimes
difficult to distinguish from each other. Their movement in the waves
do not present a consistent reflecting surface. Consequently, their
echoes have a tendency to fade and brighten or sometimes to disappear
momentarily. Although buoys and small boats often resemble each
other, usually the motion of one target identifies the boat from the
buoy.
High coastlines and mountainous coastal regions are often observed at
the longest ranges of the radar. However, the first sight of landfill on
the radar’s longest ranges may be a mountain several miles inland from
the coastline and not the actual coastline. The coastline may not appear
on the radar until the vessel has approached land nearer the line of
sight distance.
8.1.5 Sea return
Not all radar echoes are produced by hard navigation items such as
boats, buoys and land. Some radar echoes may be received from
irregularities on the surface of the water, particularly at close range by
 Loading...