

Page 1

Industry Sector, IA&DT
SCE Training Curriculum
for Integrated Automation Solutions
Totally Integrated Automation (TIA)
Siemens Automation Cooperates with Education
PA Module P03-01
SIMATIC PCS 7 – Advanced Layout of UIs
SCE Training Curriculum Page 1 of 42 To be used only at Educational and R&D Facilities
PA Module P03-01, Edition 09/2013 Unrestricted / © Siemens AG 2013. All Rights Reserved
P03-01_AdvancedLayout_R1309_en.doc
Page 2

Industry Sector, IA&DT
Matching SCE Trainer Packages for these curriculums
SIMATIC PCS 7 Software block of 3 packages
Order No. 6ES7650-0XX08-0YS5
SIMATIC PCS 7 Software block of 6 packages
Order No. 6ES7650-0XX08-2YS5
SIMATIC PCS 7 Software Upgrade block of 3 packages
Order No. 6ES7650-0XX08-0YE5 or 6ES7650-0XX17-0YE5
SIMATIC PCS 7 Hardware Set including RTX Box
Order No. 6ES7654-0UE13-0XS0
Please note that these trainer packages may be replaced with subsequent packages.
An overview of the available SCE packages is provided under: siemens.com/sce/tp
Continued education
For regional Siemens SCE continued education, contact your regional SCE contact partner
siemens.com/sce/contact
Additional information relating to SCE
siemens.com/sce
Note on Usage
The training curriculum for the integrated automation solution Totally Integrated Automation (TIA) was
prepared for the program "Siemens Automation Cooperates with Education (SCE)“ specifically for
training purposes at public educational and R&D facilities. Siemens AG is not liable regarding the
contents.
This document may only be used for initial training on Siemens products/systems. This means: it may
be copied entirely or partially and handed to trainees for use within the scope of their training. Passing
on or copying this document and communicating its contents is permitted within public training and
continued education facilities for training purposes.
Exceptions require written permission by Siemens AG. Contact person: Roland Scheuerer
roland.scheuerer@siemens.com.
Violators are subject to damages. All rights including translation rights are reserved, particularly in the
event a patent is granted or a utility model or design is registered.
Usage for industrial customer courses is explicitly not allowed. We do not agree to the commercial
utilization of these documents.
We would like to thank the Technical University Dresden, particularly Prof. Dr. Leon Urbas and Annett
Krause MS, as well as the Michael Dziallas Engineering Corporation and those who provided support
in preparing this training curriculum.
SCE Training Curriculum Page 2 of 42 To be used only at Educational and R&D Facilities
PA Module P03-01, Edition 09/2013 Unrestricted / © Siemens AG 2013. All Rights Reserved
P03-01_AdvancedLayout_R1309_en.doc
Page 3

Industry Sector, IA&DT
ADVANCED LAYOUT OF UIS
TRAINING OBJECTIVE
After working through this module, the students have additional knowledge regarding the
design of the user interface of an operator station. They are able to make additional
information available on the detail level. To this end, they use adapted message lists and
trend curves. The students are able to combine created composites into a user defined
object and redesign existing objects as user defined objects. These objects can then be
made available for reuse.
THEORY IN BRIEF
In this chapter, some aspects of OS engineering are considered in greater depth. While in
chapter P02-01 automatic generation of process images was primarily discussed, now
supplementary techniques for designing process control are described.
The flow diagrams (refer to P02-01) are usually arranged in the following hierarchical
levels:
– Plant display
– Area display
– Plant section/group display
– Detail display
This classification can result from the plant hierarchy. While the upper levels aim for a good
overview of the entire plant or corresponding areas, the plant section display and the detail
display are to provide considerably more information about the area under consideration to
make situation-conforming settings of parameters or fault diagnosis possible.
In addition to detailed information about the current state of the areas under consideration,
the representation of process values in curves is particularly helpful to analyzing
deviations. In curves, the time characteristics of a process value are represented. With one
glance, the operator can immediately read off the following information:
– The time when striking changes occurred in the course
– Process values at the time mentioned above
– Gradients for certain points in time
– Dependencies between process values at simultaneous display
– Extreme values (when and how large)
– Fluctuation range
– Set point deviations
– Frequencies
Curve displays provide the operator with an expanded basis for decisions regarding control
action. If a process value is outside the permissible range, based on the curve the user is
informed of process value development in the most recent past and can detect whether the
value continues to change for the worse or is improving.
SCE Training Curriculum Page 3 of 42 To be used only at Educational and R&D Facilities
PA Module P03-01, Edition 09/2013 Unrestricted / © Siemens AG 2013. All Rights Reserved
P03-01_AdvancedLayout_R1309_en.doc
Page 4

Industry Sector, IA&DT
Multi purpose plant
Educt tanks Reaction Product tanks
Tank 1
Rinsing
Tank 2 Tank 3
Reactor 1Reactor
2
Tank 1 Tank 2 Tank 1
Plant and area
display
Plant section
display
Detail display
THEORY
HIERARCHY OF FLOW DIAGRAMS
In chapter P02-01 the objectives of process control as well as of basic design concepts and
techniques for OCM interfaces (operator control and monitoring interfaces) were described.
Chapter P01-03 introduced the physical model of a system consisting of a plant, a plant
section, equipment module and an individual control unit. Analogously, a hierarchy of flow
diagrams exists in process visualization that is arranged as follows, according to [1]:
– Plant diagram
– Area diagram
– Plant section/group diagram
– Detail diagram
The hierarchy of the flow diagram facilitates orientation and specific display selection. The
uppermost levels Plant display and Area display provide an overview and are usually
represented schematically. In small plants, the plant display corresponds to the area
display (refer to Figure 1). In the plant display, it has to be possible to select each area
directly. In the area display, the plant sections are displayed in a manner that their state
can be recognized and the plant section can be selected and operated. The plant section
and group display reflect functional relationships; typical units, final control units and
control systems can be operated. Detail displays are of great importance to parameter
assignment, commissioning and error search if there are plant faults. In detail displays,
individual devices and units are represented and by means of effective lines, the functional
relationships can be visualized. For example, the signal flow of a control loop can be
tracked. [1].
CURVES
Curves are used for process control during intended operation, or for diagnosing faults [2].
They supplement the display with flow diagrams, particularly because they indicate the
dependence of process values on time.
Related displays are: the display of a process value depending on the path, on other
process variables, and even of several reference variables that are not described here,
however.
Figure 1: Hierarchy of mimics
SCE Training Curriculum Page 4 of 42 To be used only at Educational and R&D Facilities
PA Module P03-01, Edition 09/2013 Unrestricted / © Siemens AG 2013. All Rights Reserved
P03-01_AdvancedLayout_R1309_en.doc
Page 5

Industry Sector, IA&DT
The Purpose of Curves
Curves are displayed to show courses. By selecting different time horizons, different tasks
can be implemented. Three variants exist in reference to the time the operator has the
curve displayed.
1. The curve shows the past without the present. Such a curve is called history and is
used for analysis. This can refer to a fault analysis but also to an analysis to optimize
process control.
2. The curve shows the present with the recent past. This type is called pre-history. It can
be used to display a trend. It is the most frequently used type of display regarding
process control. From the course, the operator is able to read off qualitative values
such as rising, falling, or steady and quantitative values such as the process value at a
certain time, or the difference regarding a setpoint.
3. The curve shows the most recent past, the present and the future, and is called
prediction display (refer to Figure 2). It is used to predict a process value and allows
the user to intervene before the event occurs. To represent the future, the possible
value course has to be calculated in advance.
Figure 2: Prediction display according to [2]
In general, the following values can be determined quite well through curves:
– Points in time where striking changes occurred in the course
– Process values at the points in time indicated before
– Gradients at certain points in time
– Dependencies between process values at simultaneous displays
– Extreme values (when and how large)
– Fluctuation ranges
– Deviations from the setpoint
– Frequencies
This variety of characteristics that can be read off shows the importance of curve displays.
While the current process values and extreme values that occurred can be represented
otherwise -for example, with analog or digital displays- the display of the other
characteristics in such a compressed and immediately understandable form is difficult to
conceive [3].
SCE Training Curriculum Page 5 of 42 To be used only at Educational and R&D Facilities
PA Module P03-01, Edition 09/2013 Unrestricted / © Siemens AG 2013. All Rights Reserved
P03-01_AdvancedLayout_R1309_en.doc
Page 6

Industry Sector, IA&DT
Prehistory
History
Position of the time span
shown in the curve field
Always relative to the
present
Through an absolute point
in time and a selected time
span or through two
absolute points in time
Labeling of the time axis
Relative time indications; if
needed, can be switched to
absolute time indication
Absolute time indications
can be switched to time
indications relative to a
defined point in time of an
event
Updates
Curve is updated during the
display whereby all curve
points are shifted
Curve does not change
Value axis
The value axis is usually
located at the point in time of
the present (at the right
margin of the display)
The value axis is located on
the left margin of the display
Acquisition and Storage of Curve Values
For the displayed course to reflect the actual course, the sampling rate of the process
value has to correspond at least to twice the change frequency of the process value. In
most cases, this requirement can be met with cyclical acquisition every 1s [2].
In PCS 7, the sampling rate corresponds to the acquisition cycle of a process value. As
long as a process value is not archive, only the pre-history of the process value can be
displayed. By archiving a process value (refer to chapter P02-03) the history can be
displayed also, since archive variables are resorted to.
When curves are displayed, the pre-history differs from the history as shown in Table 1.
Table 1: Visible Differences between Prehistory and History [2]
Designing Curve Displays
In [2], guidelines for designing curve displays are provided. PCS 7 implements the basic
design details by default; for that reason, they are described here only briefly. There are
design rules, however, that you can implement yourself by means of the settings at OS
engineering. To do this in a specific way, a few details are introduced here.
The curve display is displayed in the working area of the display area (refer to P02-01). It
consists of the title field, the curve labeling field, and the curve field. The title field should
contain the information for the unambiguous assignment to the process environment. In the
curve labeling field, it should be possible to read off the relationship of displayed the curve
and the process value. The curve display field is used to display the curve and should be
as large as possible. To implement the curve display field, the following information is
provided.
To facilitate reading off the values, grid lines have to be available. The value axis in this
case should display several lines as an extension of the scale marks, and the time axis
several lines according to the current time grid. The number of grid lines should be low and
optically remain in the background. To this end, they should not be shown in color or blue.
Reading rulers can provide additional support.
SCE Training Curriculum Page 6 of 42 To be used only at Educational and R&D Facilities
PA Module P03-01, Edition 09/2013 Unrestricted / © Siemens AG 2013. All Rights Reserved
P03-01_AdvancedLayout_R1309_en.doc
Page 7
Industry Sector, IA&DT
Primary Task
Preassigned Display
Time Spans
Updating Cycle (only
for prehistory)
Scale Mark
Commissioning
5 min
1 s
1 min
Process Control
or Analysis
15 min
1 s
5 min
30 min
2 s
5 min
2 h
8 s
30 min
8 h
32 s
1 h
24 h
96 s
4 h
4 days
384 s
12 h
Analysis
7 days
-
1 day
30 days
-
7 days
90 days
-
15 days
360 days
-
90 days
The curves should be displayed colored as continuous lines or as a series of dots. Color
coding can be selected as required. The number of curves for each curve display field
should be limited to six. The colors of the curves should be easily distinguishable from
each other.
To implement the curve course, the following directions are recommended:
– From right to left: more recent values to the right, older values to the left
– From top to bottom: more recent values on top, older values on the bottom
The deciding factor in this case is whether a display time span that is as large as possible
(from left to right) or a value resolution that is as high as possible (from top to bottom) is
needed.
When curves with a prehistory are displayed, the curve course is updated; the entire curve
shifts in the direction of the past (refer to Figure 2). If there is a shift with each new entry,
the entire curve display field can be used to display the prehistory, and the operator can
follow the display well since the curve is shifted only a little. If needed, it should be possible
to stop the update.
For labeling the value axis, 1, 2 and 5 should be used for scale marks as well as their
decade multiple. The value axis can be scaled in units or in percent. Table 1 shows where
the value axis should be located. Also, a display with two value axes can be useful; in this
case, the percent axis for all curves is displayed to the left, and the display of the values of
a curve in units to the right. The time axis should always be labeled as shown in Table 1.
To display time spans [2] offers the time spans and scale marks recommended in Table 2.
It was taken into account here that if there is a change to another display time span, the
same point in time can be located again.
Table 2: Recommended Display Time Spans [2]
SCE Training Curriculum Page 7 of 42 To be used only at Educational and R&D Facilities
PA Module P03-01, Edition 09/2013 Unrestricted / © Siemens AG 2013. All Rights Reserved
P03-01_AdvancedLayout_R1309_en.doc
Page 8

ACTIVEX CONTROLS
Working area
Message list filtered by Reactor R001
Curve display with process values for Reactor R001
- temperature
- level
- manipulated value of the controller
- ...
M
M
PID-Regler
T
L
Detail display of Reactor R001
Curves are configured in OS engineering of PCS 7 either by setting up curve groups
(Chapter P02-03) or by using configurable ActiveX Controls. PCS 7 provides ActiveX
Controls for alarms, curves, and tables. Curves can be used to display time characteristics
(Online Trend Control) and also to display dependencies between process values
(Function Trend Control).
In the Online Trend Control, two different sources exist for displaying a curve. The first
source is the process value that is buffered while the ActiveX Control is active. With this
source, the trend can be displayed during monitoring. Here it is important that when
ActiveX Control is closed, the values can no longer be called. If the second source is used,
the data is taken from the archive (refer to P02-03). The process values taken from there
can be displayed again and again. Depending on the time span selected, past data
(history) can be called as well as the most recent data (prehistory). These values can be
called again as long as they are in the short term archive. The size of the short term
archive depends on the configuration as described in chapter P02-03.
Additional ActiveX Controls are the display of process values in tables (Online Table
Control) or of the alarms in alarm lists (Alarm Control). Alarm Control receives its data
always from the archive while the table, analogous to the Online Trend Control, has
different sources.
ActiveX Controls are quite suitable for designing detail displays, since they provide
additional information specifically for a detail area. To this end, specific process values for
the corresponding detail display or filters for alarm lists can be selected and preconfigured;
for example, by means of the attribute Origin. Figure 3 sketches a possibility for designing
the detail display.
Industry Sector, IA&DT
Figure 3: Layout for a detail display
SCE Training Curriculum Page 8 of 42 To be used only at Educational and R&D Facilities
PA Module P03-01, Edition 09/2013 Unrestricted / © Siemens AG 2013. All Rights Reserved
P03-01_AdvancedLayout_R1309_en.doc
Page 9

Industry Sector, IA&DT
USER DEFINED OBJECTS
A user defined object (UDO for short) is an object that can be dynamical and consists of
individual objects. At OS Engineering, we identify the properties that can be changed and
select them for the user defined object. Thus, only the most important properties of all
individual objects are visible and provide a good overview of the properties. In addition, it is
possible to specify some properties as unalterable for all instances, and combining each
individual object for each instance is dispensed with also.
On the other hand, there is the increased effort for the careful selection of the properties;
however, it amortizes quickly through multiple use. User defined objects that are to be used
multiple times are stored in the library.
Also, alterability is facilitated since, for example, a block name or a CFC name has to be
changed only at the user defined object and not at all individual objects.
The individual instances can be changed or supplemented with additional objects any time.
If C-Actions are used for dynamical actions, this is done in the case of user defined objects
in a script, and not in many individual objects. This increases the performance of
visualization.
LITERATURE
[1] VDI/VDE 3699 Blatt 3: Prozessführung mit Bildschirmen – Fließbilder, Nov 1999.
(Process Control with Screens – Flow Diagrams)
[2] VDI/VDE 3699 Blatt 4: Prozessführung mit Bildschirmen – Kurven, Aug 1997.
[3] Kindsmüller, M. C.: Trend-Literacy, Shaker Verlag 2006.
[4] Siemens AG: Projektierungshandbuch Operator Station (V7.1), März 2009.
(Configuration Manual Operator Station)
SCE Training Curriculum Page 9 of 42 To be used only at Educational and R&D Facilities
PA Module P03-01, Edition 09/2013 Unrestricted / © Siemens AG 2013. All Rights Reserved
P03-01_AdvancedLayout_R1309_en.doc
Page 10

Industry Sector, IA&DT
STEP BY STEP INSTRUCTIONS
TASK
In this task, the display structure will be expanded by another level in order to show more
detail for the individual tanks and reactors.
In the example, create in the display for reactor R001 a detail view with a bar display for
the reactor level, an online trend display and a message window for displaying the alarms
associated with Reactor R001.
Then, for better reusability (for example, for Reactor 002) change the bar display into a
user defined object.
TRAINING OBJECTIVE
In this chapter, the student learns the following:
– To set up an ActiveX Control for displaying alarms
– To filter the display of alarms matching the hierarchy
– To insert and parameterize an ActiveX Control of the type ‘Online Trend’ to display
archive variables
– To create from a group of objects a user defined object
– Parameterizing and using user defined objects
These instructions are based on the project ‘PCS7_SCE_0203_Ueb_R1305_en.zip‘.
PROGRAMMING
1. First, insert a picture in the folder ‘Reactor R001’ and name it ‘Reactor R001‘. (
Reactor R001 Insert New Object Picture Reactor_R001)
SCE Training Curriculum Page 10 of 42 To be used only at Educational and R&D Facilities
PA Module P03-01, Edition 09/2013 Unrestricted / © Siemens AG 2013. All Rights Reserved
P03-01_AdvancedLayout_R1309_en.doc
Page 11

Industry Sector, IA&DT
2. Then, adapt the settings of the plant hierarchy to the expansion. ( Tools Plant
Hierarchy Settings)
3. The number of hierarchy levels is retained. However, at the third level a checkmark
has to be placed at 'Included in HID‘; otherwise, there may be problems during
simulation. ( Included in HID OK Yes)
SCE Training Curriculum Page 11 of 42 To be used only at Educational and R&D Facilities
PA Module P03-01, Edition 09/2013 Unrestricted / © Siemens AG 2013. All Rights Reserved
P03-01_AdvancedLayout_R1309_en.doc
Page 12

Industry Sector, IA&DT
4. Then, the block icons have to be generated in the new picture.
( Reactor R001 Plant Hierarchy Create/Update Block Icons)
5. Have the object name created from the chart names and include, as previously, a
lower level hierarchy level. ( Object name: Chart Lower hierarchy levels included:
1 OK)
SCE Training Curriculum Page 12 of 42 To be used only at Educational and R&D Facilities
PA Module P03-01, Edition 09/2013 Unrestricted / © Siemens AG 2013. All Rights Reserved
P03-01_AdvancedLayout_R1309_en.doc
Page 13

Industry Sector, IA&DT
6. Read the note regarding the compilation of the OS due now. The log can also be
displayed. Confirm the dialog with ‘Yes’. ( Yes )
SCE Training Curriculum Page 13 of 42 To be used only at Educational and R&D Facilities
PA Module P03-01, Edition 09/2013 Unrestricted / © Siemens AG 2013. All Rights Reserved
P03-01_AdvancedLayout_R1309_en.doc
Page 14

Industry Sector, IA&DT
7. Now, once more activate in the ‘Plant View’ Compile and Download Objects.
( SCE_PCS7_Prj PLC Compile and Download Objects)
8. Prior to starting the compilation, make sure that S7-PLCSIM is started and the CPU is
in the ‘STOP’ mode. Regarding the charts, everything is compiled and downloaded.
Regarding the OS, compile the entire OS (a general reset is not necessary) as
recommended in Step 3. ( Start Close)
SCE Training Curriculum Page 14 of 42 To be used only at Educational and R&D Facilities
PA Module P03-01, Edition 09/2013 Unrestricted / © Siemens AG 2013. All Rights Reserved
P03-01_AdvancedLayout_R1309_en.doc
Page 15

Industry Sector, IA&DT
9. Now, in the ‘Component view’, start WinCC by highlighting and opening ‘OS(1)’. (
OS(1) Open Object)
10. In the folder ‘Graphics Designer’ open the picture ‘Reactor_R001.Pdl’. ( Graphics
Designer Reactor_R001.Pdl)
SCE Training Curriculum Page 15 of 42 To be used only at Educational and R&D Facilities
PA Module P03-01, Edition 09/2013 Unrestricted / © Siemens AG 2013. All Rights Reserved
P03-01_AdvancedLayout_R1309_en.doc
Page 16

Industry Sector, IA&DT
11. Now, in the Object Properties, first change the geometry corresponding to your
resolution (for example, 1024x616 at 1024X768) and the background colors to ‘white’.
For the color setting to be accepted, the static in the global color scheme has to be
switched to ‘No‘. ( Object Properties Colors Background color white
Effects Global Color scheme No)
SCE Training Curriculum Page 16 of 42 To be used only at Educational and R&D Facilities
PA Module P03-01, Edition 09/2013 Unrestricted / © Siemens AG 2013. All Rights Reserved
P03-01_AdvancedLayout_R1309_en.doc
Page 17

Industry Sector, IA&DT
12. Next, from the project library, drag in the face plate for reactor R001. ( View
Library Project Library Reactor_V1_0)
13. In the picture ‘Reactor_R001.Pdl’, ungroup the group with the reactor in the center. (
Group Ungroup)
SCE Training Curriculum Page 17 of 42 To be used only at Educational and R&D Facilities
PA Module P03-01, Edition 09/2013 Unrestricted / © Siemens AG 2013. All Rights Reserved
P03-01_AdvancedLayout_R1309_en.doc
Page 18

Industry Sector, IA&DT
14. Next, select in the object palette Smart objects and then ‘Bar‘. Then position the bar
over the reactor tank.
( Object Palette Standard Smart Objects Bar)
SCE Training Curriculum Page 18 of 42 To be used only at Educational and R&D Facilities
PA Module P03-01, Edition 09/2013 Unrestricted / © Siemens AG 2013. All Rights Reserved
P03-01_AdvancedLayout_R1309_en.doc
Page 19

Industry Sector, IA&DT
15. Now, in the configuration dialog, open the tag selection and as data source the ES
variables; then open the hierarchy ‘A1_multipurpose_plant/T2_reaction/reactor R001/
A1T2L001/A1T2L001/Monitor…‘. On the right side, select the tag ‘PV#Value‘.
( ES Variables A1_multipurpose_plant/T2_reaction/reactor R001/A1T2L001/
Monitor_A1T2L001/PV#Value OK)
16. Next, select the maximum and minimum value, ( Update: Upon change Maximum
value: 1000 Minimum value: 0 )
SCE Training Curriculum Page 19 of 42 To be used only at Educational and R&D Facilities
PA Module P03-01, Edition 09/2013 Unrestricted / © Siemens AG 2013. All Rights Reserved
P03-01_AdvancedLayout_R1309_en.doc
Page 20

Industry Sector, IA&DT
17. Now, the display is positioned exactly over the reactor and some levels are moved to
the back (Arrange Within the level One to back) for the stirrer, the heater and the
labeling to be visible again; then open the Properties for additional adaptations.
( Properties)
18. In the ‘Properties’ change to ‘Other‘ the 'TooltipText‘ in ‘A1T2L001‘. ( Properties
Other Tooltip Text A1T2L001 ( OK)
SCE Training Curriculum Page 20 of 42 To be used only at Educational and R&D Facilities
PA Module P03-01, Edition 09/2013 Unrestricted / © Siemens AG 2013. All Rights Reserved
P03-01_AdvancedLayout_R1309_en.doc
Page 21
Industry Sector, IA&DT
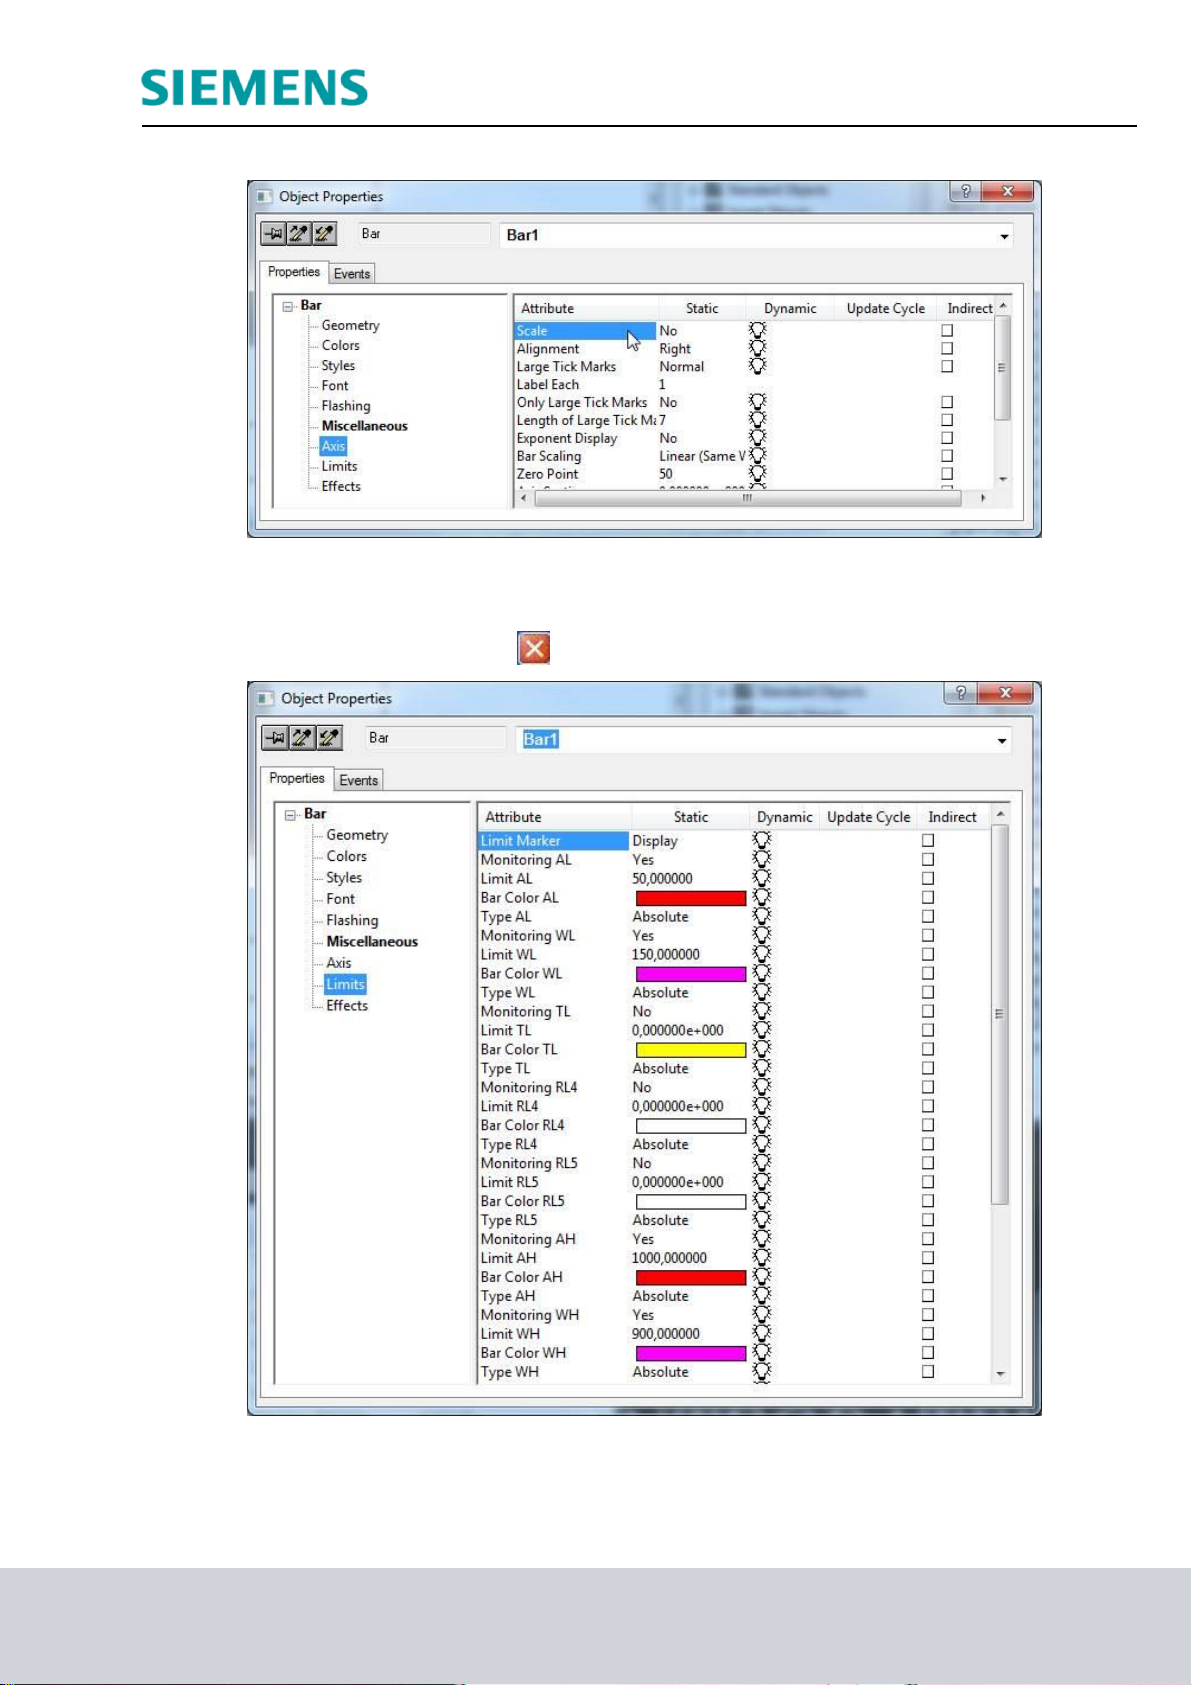
19. Then, select ‘Axis‘. Here, set the attribute ‘Scale‘ to ‘No‘.
20. In ‘Limits‘, specify the known low and high limit, their monitoring and the color of the
bars if the limit is exceeded. ( Properties Bar Limits Low/high limit: refer to
display/Monitoring: Yes )
SCE Training Curriculum Page 21 of 42 To be used only at Educational and R&D Facilities
PA Module P03-01, Edition 09/2013 Unrestricted / © Siemens AG 2013. All Rights Reserved
P03-01_AdvancedLayout_R1309_en.doc
Page 22

Industry Sector, IA&DT
21. In the object palette, under the tab ‘Control‘ select the WinCC AlarmControl. Then
draw a rectangle with the mouse. ( Object palette Controls WinCC
AlarmControl)
22. Next, in the property dialog that is displayed automatically only change the text for
window title to ‘Alarmlist reactor A1T2R001’. ( General Text: Alarmlist reactor
A1T2R001)
SCE Training Curriculum Page 22 of 42 To be used only at Educational and R&D Facilities
PA Module P03-01, Edition 09/2013 Unrestricted / © Siemens AG 2013. All Rights Reserved
P03-01_AdvancedLayout_R1309_en.doc
Page 23

Industry Sector, IA&DT
23. In the tab ‘Message lists‘ select -as shown here- the ‘Message blocks’. Make the
selection by adding message blocks with the buttons ; message blocks
are removed with the buttons . So that only the alarms are displayed
that match the picture, select ‘Fixed selection’.
( Message lists Fixed selection: Edit)
24. In the screen display below select as 'Criterion‘ the source, for Operand ‘contains’ and
for Setting the text ‘R001’ as shown. ( Criterion: Source Operand: contains
Setting: R001 OK)
SCE Training Curriculum Page 23 of 42 To be used only at Educational and R&D Facilities
PA Module P03-01, Edition 09/2013 Unrestricted / © Siemens AG 2013. All Rights Reserved
P03-01_AdvancedLayout_R1309_en.doc
Page 24

Industry Sector, IA&DT
25. Now, under ‘Online configuration’, select that the setting changes are not retained
during runtime.
( Online configuration Online configuration: Do not retain OK)
26. In runtime of the PCS7 project, the alarms are now displayed in the picture
‘Reactor_R001’. Using the icon the configuration can be changed; however, it is
lost after a picture change.
SCE Training Curriculum Page 24 of 42 To be used only at Educational and R&D Facilities
PA Module P03-01, Edition 09/2013 Unrestricted / © Siemens AG 2013. All Rights Reserved
P03-01_AdvancedLayout_R1309_en.doc
Page 25

Industry Sector, IA&DT
27. Next, select from the object palette, under the tab ‘Control‘, the WinCC
OnlineTrendControl. Then, draw a rectangle with the mouse to position the window for
the curve view. ( Object palette Controls WinCC OnlineTrendControl)
28. In the configuration dialog that is displayed automatically, at ‘Trends’ first change the
object name of ‘Trend 1‘ to ‘PID – Setpoint‘. ( Trends Object name ‘PID –
Setpoint‘)
SCE Training Curriculum Page 25 of 42 To be used only at Educational and R&D Facilities
PA Module P03-01, Edition 09/2013 Unrestricted / © Siemens AG 2013. All Rights Reserved
P03-01_AdvancedLayout_R1309_en.doc
Page 26

Industry Sector, IA&DT
29. Next, link the trend to an archive tag by clicking on the button and then select the
setpoint SP#Value of A1T2T001. ( Tag name SystemArchive
..ControlA1T2T001.SP#Value)
SCE Training Curriculum Page 26 of 42 To be used only at Educational and R&D Facilities
PA Module P03-01, Edition 09/2013 Unrestricted / © Siemens AG 2013. All Rights Reserved
P03-01_AdvancedLayout_R1309_en.doc
Page 27

Industry Sector, IA&DT
30. Now add another trend and apply the settings shown. ( Trends New Object
name: ‘PID – actual value‘ Name: PV Tag name: Control_A1T2T001.PV#Value
Limits High limit: 60 Apply)
SCE Training Curriculum Page 27 of 42 To be used only at Educational and R&D Facilities
PA Module P03-01, Edition 09/2013 Unrestricted / © Siemens AG 2013. All Rights Reserved
P03-01_AdvancedLayout_R1309_en.doc
Page 28

Industry Sector, IA&DT
31. The next trend is the manipulated value; it has the following settings. ( Trends
New Object name: ‘PID – Manipulated value‘ Name: MV Tag name:
Control.MV#Value Trend color: green OK Apply)
SCE Training Curriculum Page 28 of 42 To be used only at Educational and R&D Facilities
PA Module P03-01, Edition 09/2013 Unrestricted / © Siemens AG 2013. All Rights Reserved
P03-01_AdvancedLayout_R1309_en.doc
Page 29

Industry Sector, IA&DT
32. The last trend we add is the level A1T2L001.
SCE Training Curriculum Page 29 of 42 To be used only at Educational and R&D Facilities
PA Module P03-01, Edition 09/2013 Unrestricted / © Siemens AG 2013. All Rights Reserved
P03-01_AdvancedLayout_R1309_en.doc
Page 30
Industry Sector, IA&DT
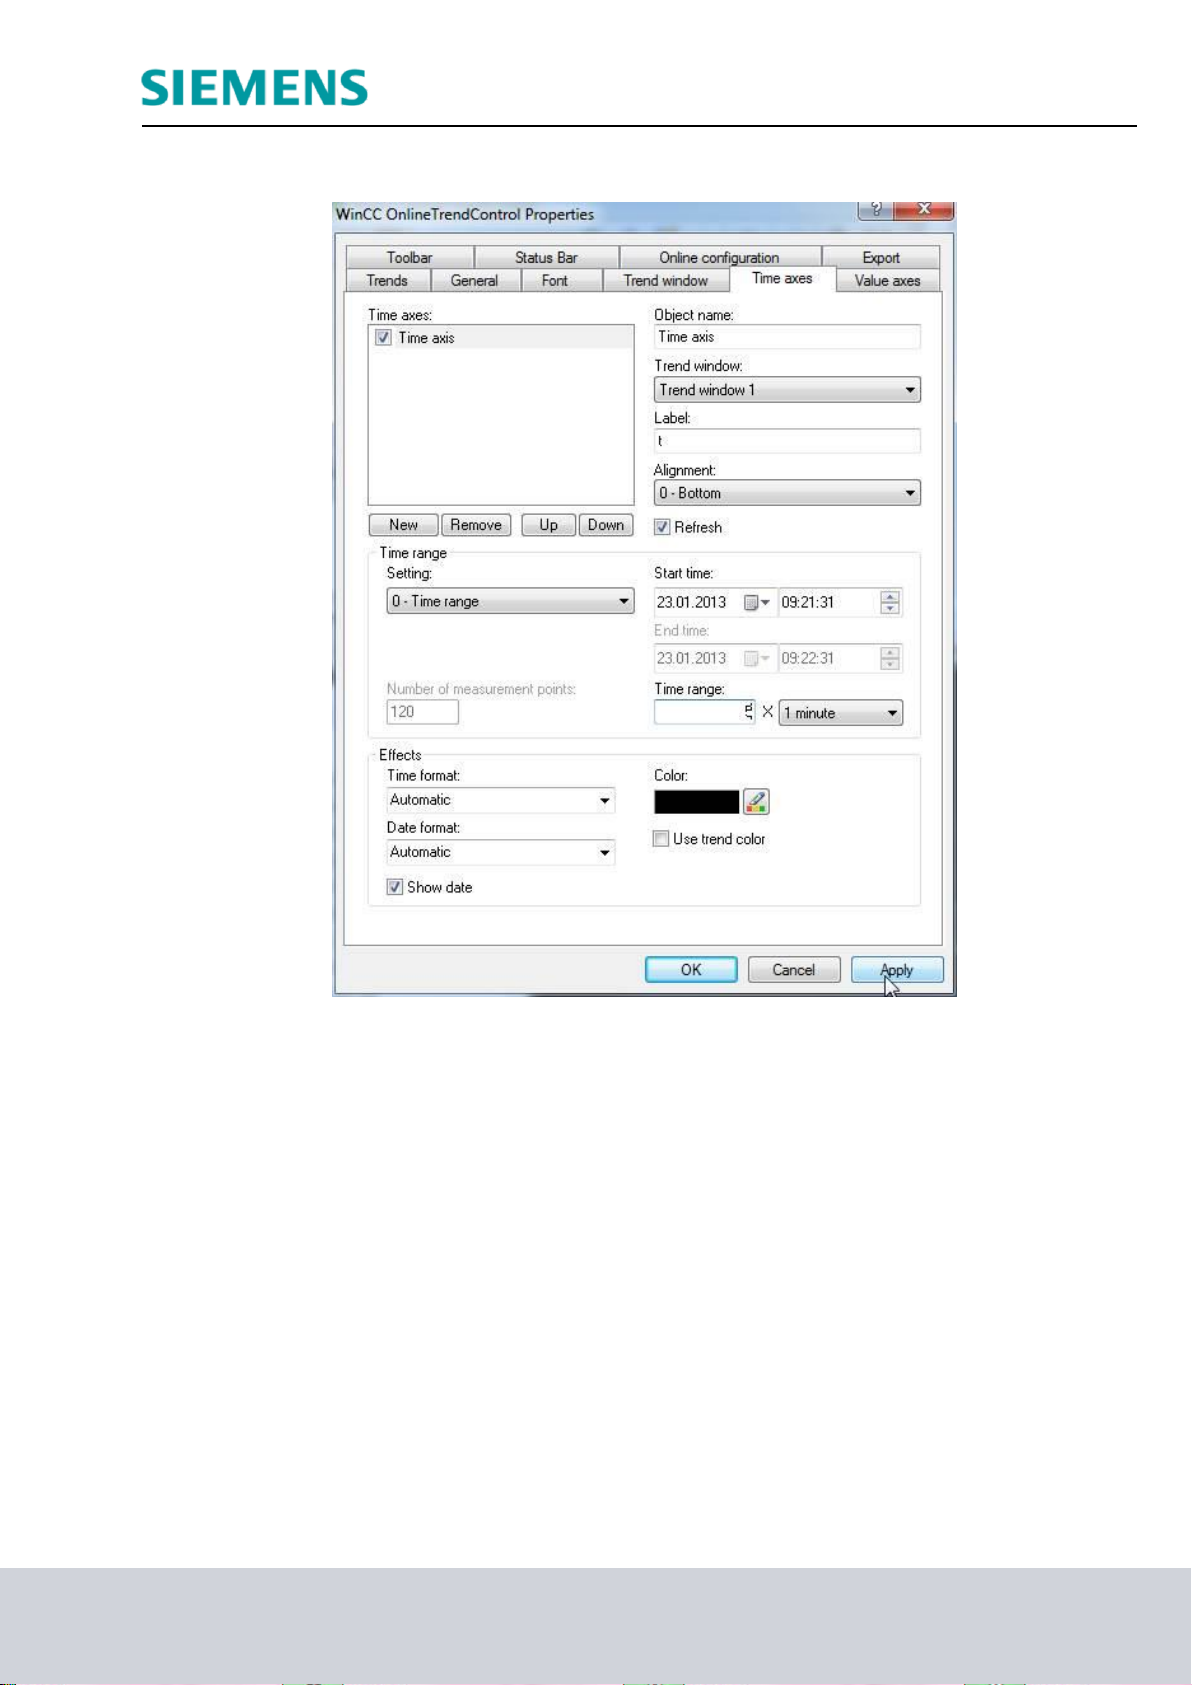
33. Now change to the tab Time axes. There, set the parameters shown. ( Time axes
Object name: Time axis Label: t Time range: 5 x 1 minute)
SCE Training Curriculum Page 30 of 42 To be used only at Educational and R&D Facilities
PA Module P03-01, Edition 09/2013 Unrestricted / © Siemens AG 2013. All Rights Reserved
P03-01_AdvancedLayout_R1309_en.doc
Page 31

Industry Sector, IA&DT
34. Then, in the register Value axes, set up three value axes: one for the temperature
values of 0 .. 100°C, one for the manipulated value 0 .. 100% and one for the level of 0
.. 1000 ml. ( Value axes Object name: Value axis Temperature Label: °C
Value range: automatic New …)
SCE Training Curriculum Page 31 of 42 To be used only at Educational and R&D Facilities
PA Module P03-01, Edition 09/2013 Unrestricted / © Siemens AG 2013. All Rights Reserved
P03-01_AdvancedLayout_R1309_en.doc
Page 32

Industry Sector, IA&DT
35. Now we assign the value axes to the trends. ( Trends PID – Setpoint: Value axis
Temperature PID - Process value: Value axis Temperature PID Manipulated
value: Value axis Manipulated variable Level: Value axis Level OK)
SCE Training Curriculum Page 32 of 42 To be used only at Educational and R&D Facilities
PA Module P03-01, Edition 09/2013 Unrestricted / © Siemens AG 2013. All Rights Reserved
P03-01_AdvancedLayout_R1309_en.doc
Page 33

Industry Sector, IA&DT
36. During the runtime of the PCS 7 project, the following trend is displayed in the picture
‘Reactor_R001’.
37. The steps below show how a number of objects can be grouped into a single ‘User
defined object’. First, however, it is important that none of the included objects has
been grouped. If such groups exist, they have to be ungrouped.
( Group Ungroup)
SCE Training Curriculum Page 33 of 42 To be used only at Educational and R&D Facilities
PA Module P03-01, Edition 09/2013 Unrestricted / © Siemens AG 2013. All Rights Reserved
P03-01_AdvancedLayout_R1309_en.doc
Page 34

Industry Sector, IA&DT
38. Then, highlight all objects and right click on the selection. Now, select ‘Create
customized object‘. ( Customized object Create)
39. In the configuration dialog, in the left window click on ‘User defined’ and select the first
property of one of the customized objects that can be parameterized later in the
finished user defined object. Drag this property into the left window to UserDefined2. (
User defined Bar1 Process Driver Connection User defined)
SCE Training Curriculum Page 34 of 42 To be used only at Educational and R&D Facilities
PA Module P03-01, Edition 09/2013 Unrestricted / © Siemens AG 2013. All Rights Reserved
P03-01_AdvancedLayout_R1309_en.doc
Page 35
Industry Sector, IA&DT
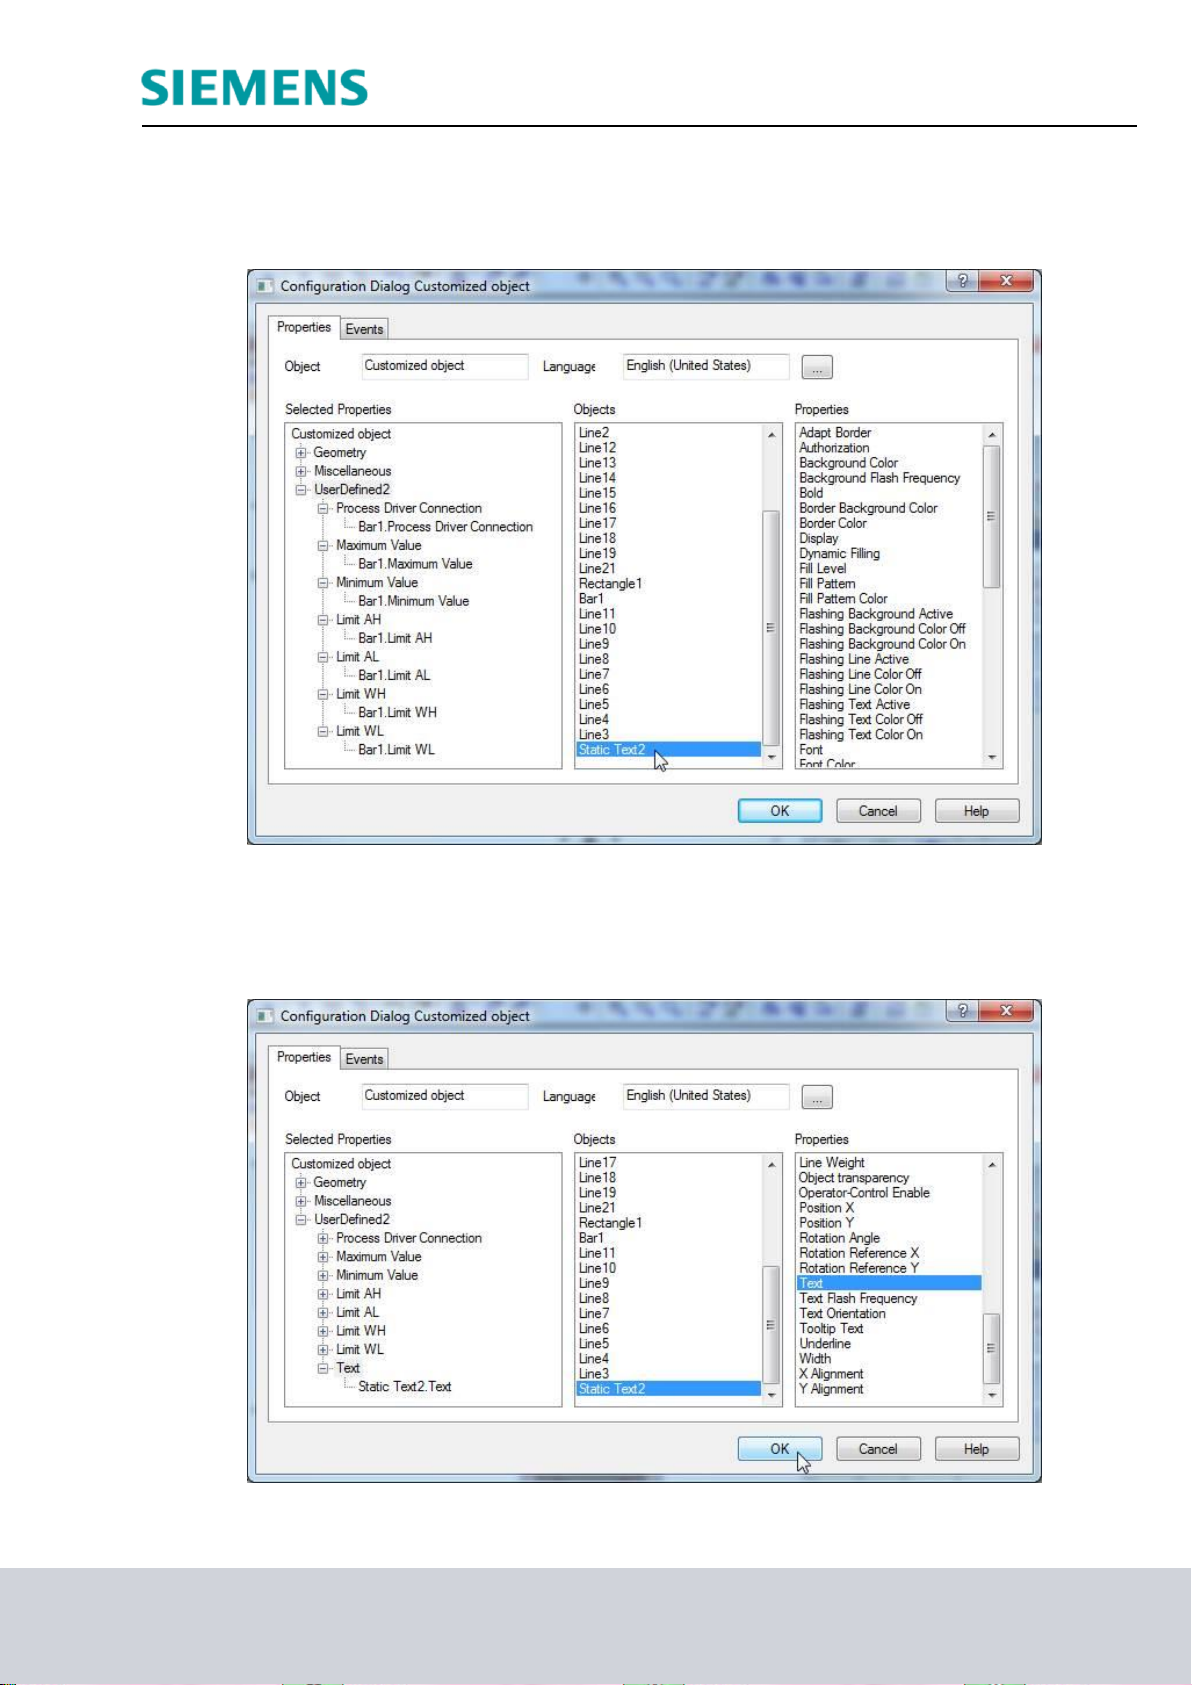
40. In this manner, select from the object Bar1 the properties ‘Process Driver Connection’,
‘Maximum value’, ‘Minimum value’, ‘LimitAL’, ‘LimitWL’, ‘LimitAH’ and ‘LimitWH’. (
Bar1: Maximum value Bar1: Minimum value Bar1: LimitAL Bar1: LimitWL
Bar1: LimitAH Bar1: LimitWH)
41. For the text window ‘Static Text2’ that describes the reactor, have the ‘Text’ displayed.
Then, accept the user defined object with OK.
( StaticText2: Text OK)
SCE Training Curriculum Page 35 of 42 To be used only at Educational and R&D Facilities
PA Module P03-01, Edition 09/2013 Unrestricted / © Siemens AG 2013. All Rights Reserved
P03-01_AdvancedLayout_R1309_en.doc
Page 36

Industry Sector, IA&DT
42. Now, copy the finished user defined object to store it in the project library for later use.
( Copy)
43. Next, select the icon ‘ ’ to display the library. ( Project Library Insert
)
44. Next, change the name of the user defined object in the library to
‘customObject_reactor_V1_0’. ( customObjekt_reactor_V1_0 Close)
SCE Training Curriculum Page 36 of 42 To be used only at Educational and R&D Facilities
PA Module P03-01, Edition 09/2013 Unrestricted / © Siemens AG 2013. All Rights Reserved
P03-01_AdvancedLayout_R1309_en.doc
Page 37

Industry Sector, IA&DT
45. Now return to the user defined object in the picture ‘Reactor_R001.Pdl’ and select its
properties ( Properties)
46. There, in the properties under Customized object, the selected properties for the subobjects are displayed under ‘Customized object’. For the ‘Process Driver Connection’
click on‘ ’ for ‘Dynamic’ and then select the tag. ( Tag)
SCE Training Curriculum Page 37 of 42 To be used only at Educational and R&D Facilities
PA Module P03-01, Edition 09/2013 Unrestricted / © Siemens AG 2013. All Rights Reserved
P03-01_AdvancedLayout_R1309_en.doc
Page 38

Industry Sector, IA&DT
47. From the ES variables, select ‘A1_multipurpose_plant/T2_reaction/reactor_R001
/A1T2L001/A1T2L001/Monitor_A1T2L001/PV#Value’. ( ES variables
A1_multipurpose_plant/ T2_reaction/reactor_R001/ A1T2L001/ A1T2L001/
Monitor_A1T2L001/PV#Value OK)
48. Now, for ‘Dynamic’, select an ‘Update Cycle’ of ‘1s’. Next, set the other properties as
shown here. Then close the window. ( Update: 1s Text: Reactor\r\nA1T2R001
)
SCE Training Curriculum Page 38 of 42 To be used only at Educational and R&D Facilities
PA Module P03-01, Edition 09/2013 Unrestricted / © Siemens AG 2013. All Rights Reserved
P03-01_AdvancedLayout_R1309_en.doc
Page 39

Industry Sector, IA&DT
49. Finally, we should position the faceplates (picture blocks) correctly, label and save
them.
50. Now, we want to use the customized object in the picture ‘Reactor_R002.Pdl’. To this
end, set up a new picture in the plant view of the SIMATC Manager in the folder
Reactor R002, and compile the changes of the OS(1).
SCE Training Curriculum Page 39 of 42 To be used only at Educational and R&D Facilities
PA Module P03-01, Edition 09/2013 Unrestricted / © Siemens AG 2013. All Rights Reserved
P03-01_AdvancedLayout_R1309_en.doc
Page 40
Industry Sector, IA&DT
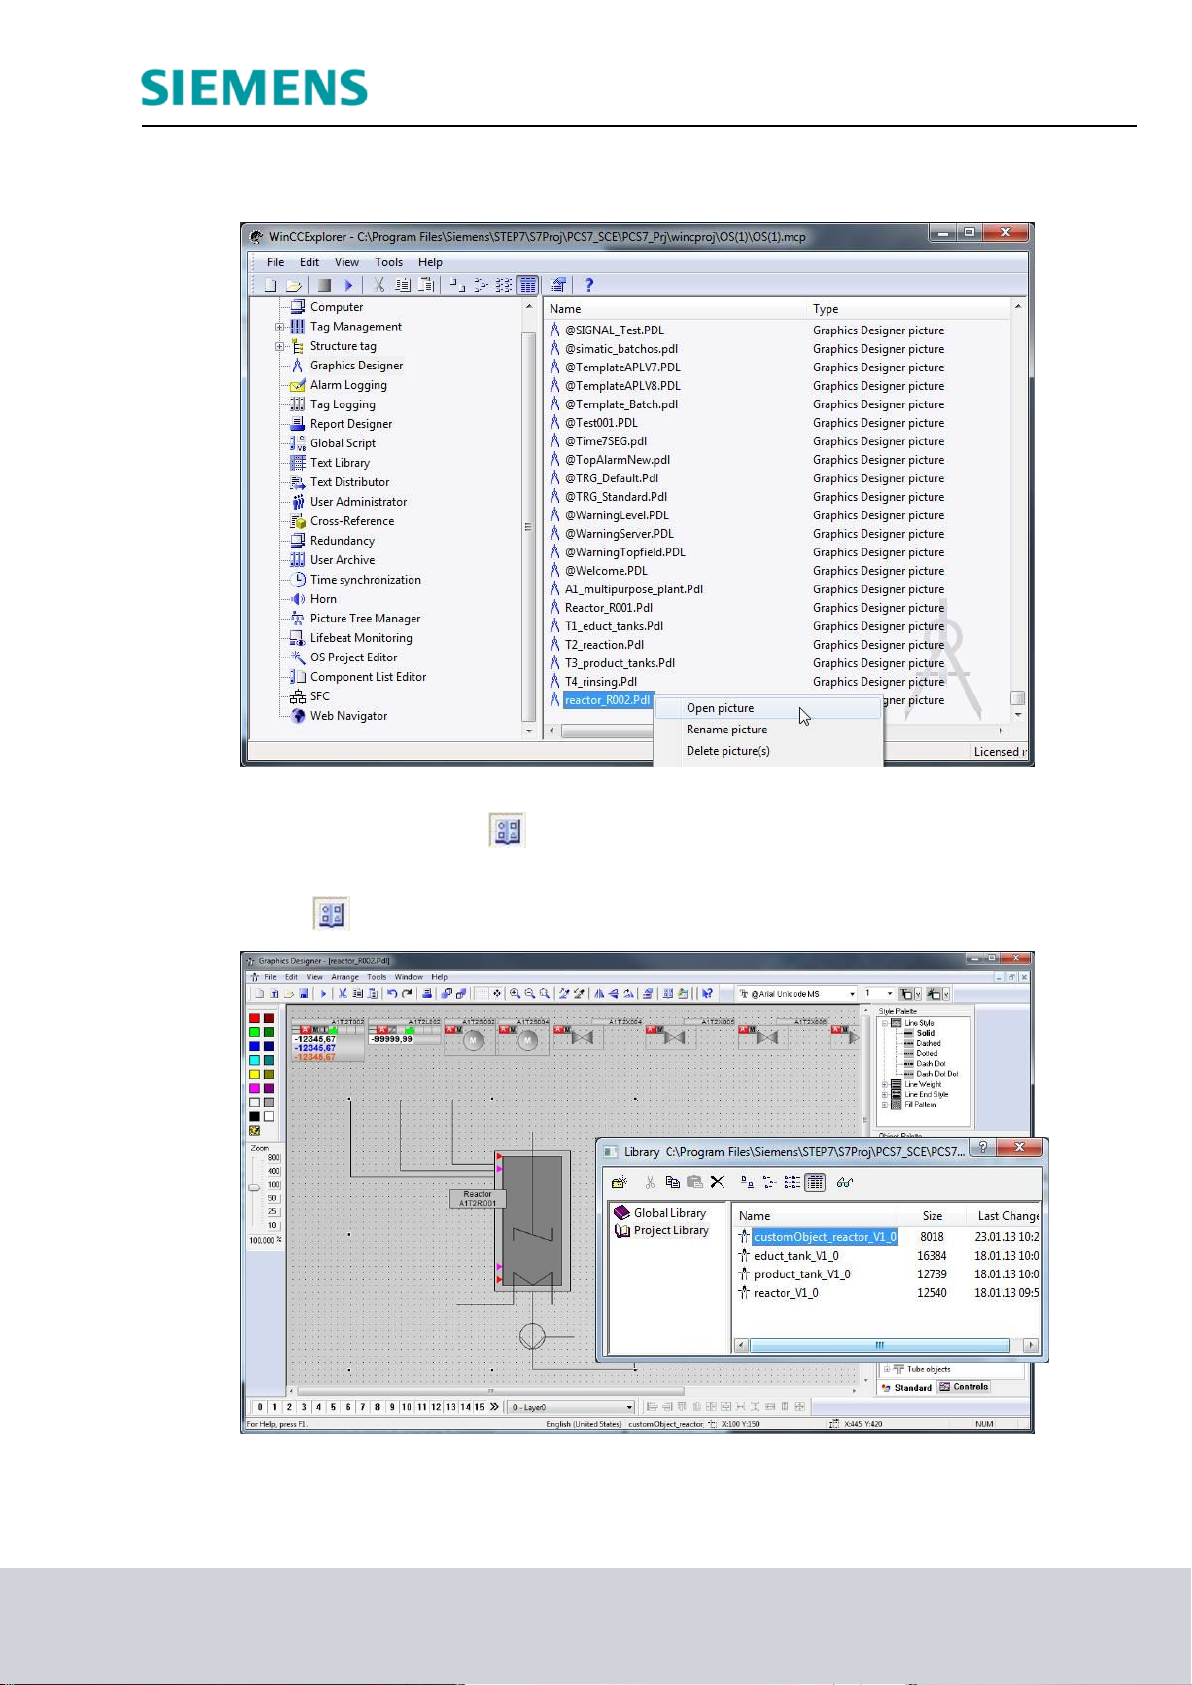
51. Now open the picture ‘Reaktor_R002‘ in the Graphics Designer.
( Graphics Designer Reactor_R002.Pdl Open picture)
52. By clicking on the icon ‘ ’ the libraries are displayed; from the ‘Project Library’ drag
the ‘customObjekt_reactor_V1_0’ into the picture.
( Project Library customObject_reactor_V1_0)
SCE Training Curriculum Page 40 of 42 To be used only at Educational and R&D Facilities
PA Module P03-01, Edition 09/2013 Unrestricted / © Siemens AG 2013. All Rights Reserved
P03-01_AdvancedLayout_R1309_en.doc
Page 41

Industry Sector, IA&DT
53. In the properties you can now access, under ‘UserDefined’, the selected properties of
the customObject. Thus, you created an object with a specific selection of properties
that can be used again and again quickly and effectively. ( Properties Object
Properties UserDefined)
54. Finally, set the geometry, the background color and the deselection of the color
scheme as you did in Step 11. Now, arrange the faceplates and insert a picture title.
SCE Training Curriculum Page 41 of 42 To be used only at Educational and R&D Facilities
PA Module P03-01, Edition 09/2013 Unrestricted / © Siemens AG 2013. All Rights Reserved
P03-01_AdvancedLayout_R1309_en.doc
Page 42

EXERCISES
In the exercises, we apply what we learned in the Theory section and the Step by Step
Instructions. To this end, we use and expand the existing multi-project from the step by
step instructions (PCS7_SCE_0301_R1305_en.zip).
We are creating a new user defined object for the tanks with an upper and lower sensor. It
can also be used to generate detail displays for the other plant sections.
In addition, the detail displays are to be accessible from the overview page by clicking on
the corresponding text.
To the existing detail display of reactor R002, additional ActiveX Controls are added.
TASKS
1. Create a new display on the level of educt_tank B001. Get the template for the tank
2. Now, create from the tank a customized object. Select the modifiable parameters. The
Industry Sector, IA&DT
from the library and ungroup the group.
names of the new parameters are possibly not unique. They should be adapted.
3. In the overview display, generate links to the newly created displays by expanding the
existing static texts by a dynamic. Use the Dynamic Wizard – Display functions –
Picture change in the working area, as in chapter P02-01.
4. In the detail display ‘Reactor_R002‘ insert an alarm list and then configure the list in a
way that only alarms for Reactor R002 are displayed.
5. Last, instead of an OnlineTrendControl configure an OnlineTableControl and have the
level, the actual value, the setpoint and the manipulated value of the control system
displayed.
SCE Training Curriculum Page 42 of 42 To be used only at Educational and R&D Facilities
PA Module P03-01, Edition 09/2013 Unrestricted / © Siemens AG 2013. All Rights Reserved
P03-01_AdvancedLayout_R1309_en.doc
 Loading...