

Page 1
Bulletin 5370
Color CVIM Module
MATH-PAK Option
(Catalog No. 5370–CMPK)
User’s Manual
ALLEN-BRADLEY
Page 2

ALLEN-BRADLEY
Important User Information
Solid state equipment has operational characteristics differing from those of
electromechanical equipment. “Application Considerations for Solid State
Controls” (Publication SGI-1.1) describes some important differences
between solid state equipment and hard–wired electromechanical devices.
Because of this difference, and also because of the wide variety of uses for
solid state equipment, all persons responsible for applying this equipment
must satisfy themselves that each intended application of this equipment is
acceptable.
In no event will the Allen-Bradley Company be responsible or liable for
indirect or consequential damages resulting from the use or application of
this equipment.
The examples and diagrams in this manual are included solely for illustrative
purposes. Because of the many variables and requirements associated with
any particular installation, the Allen-Bradley Company cannot assume
responsibility or liability for actual use based on the examples and diagrams.
No patent liability is assumed by Allen-Bradley Company with respect to use
of information, circuits, equipment, or software described in this manual.
Reproduction of the contents of this manual, in whole or in part, without
written permission of the Allen-Bradley Company is prohibited.
1993 Allen-Bradley Company, Inc.
Page 3

Table of Contents
Color CVIM MATH-PAK
User’s Manual
A–B
Using This Manual
Introduction to the
MATH–PAK Option
Installation
Chapter 1
Chapter Objectives 1–1. . . . . . . . . . . . . . . . . . . . . . . . . . . . . . . . . . . . . . . . .
Manual Contents 1–1. . . . . . . . . . . . . . . . . . . . . . . . . . . . . . . . . . . . . . . . . .
Intended Audience 1–1. . . . . . . . . . . . . . . . . . . . . . . . . . . . . . . . . . . . . . . . .
Notice of Attention 1–2. . . . . . . . . . . . . . . . . . . . . . . . . . . . . . . . . . . . . . . .
Related Publications 1–2. . . . . . . . . . . . . . . . . . . . . . . . . . . . . . . . . . . . . . .
Trademarks 1–2. . . . . . . . . . . . . . . . . . . . . . . . . . . . . . . . . . . . . . . . . . . . . .
Chapter 2
Chapter Objectives 2–1. . . . . . . . . . . . . . . . . . . . . . . . . . . . . . . . . . . . . . . . .
MATH-PAK Preview 2–1. . . . . . . . . . . . . . . . . . . . . . . . . . . . . . . . . . . . . . .
Definition of a Formula 2–1. . . . . . . . . . . . . . . . . . . . . . . . . . . . . . . . . .
How Formula Results Are Applied 2–2. . . . . . . . . . . . . . . . . . . . . . . . .
Accessing the MATH-PAK Features 2–4. . . . . . . . . . . . . . . . . . . . . . . .
Copy and Paste Functions 2–5. . . . . . . . . . . . . . . . . . . . . . . . . . . . . . . .
Runtime Displays 2–5. . . . . . . . . . . . . . . . . . . . . . . . . . . . . . . . . . . . . . .
Chapter 3
Chapter Objectives 3–1. . . . . . . . . . . . . . . . . . . . . . . . . . . . . . . . . . . . . . . . .
Installing the MATH-PAK Option 3–1. . . . . . . . . . . . . . . . . . . . . . . . . . . . .
Defining Formulas
Chapter 4
Chapter Objectives 4–1. . . . . . . . . . . . . . . . . . . . . . . . . . . . . . . . . . . . . . . . .
Formula Definition: Basic Steps 4–1. . . . . . . . . . . . . . . . . . . . . . . . . . . . . .
Selecting a Formula 4–2. . . . . . . . . . . . . . . . . . . . . . . . . . . . . . . . . . . . . . . .
Selecting the Formula Number(s) 4–3. . . . . . . . . . . . . . . . . . . . . . . . . .
Defining a Formula 4–4. . . . . . . . . . . . . . . . . . . . . . . . . . . . . . . . . . . . . . . .
Accessing the Formula Entry Keyboard 4–5. . . . . . . . . . . . . . . . . . . . .
Using the Formula Entry Keyboard 4–7. . . . . . . . . . . . . . . . . . . . . . . . .
Example Formula Entry 4–9. . . . . . . . . . . . . . . . . . . . . . . . . . . . . .
Edit / Control Keys 4–10. . . . . . . . . . . . . . . . . . . . . . . . . . . . . . . . . . . . . .
Example of Formula Editing 4–11. . . . . . . . . . . . . . . . . . . . . . . . . .
Operands 4–12. . . . . . . . . . . . . . . . . . . . . . . . . . . . . . . . . . . . . . . . . . . . . .
Entering Constants as Operands 4–16. . . . . . . . . . . . . . . . . . . . . . . .
Operators 4–17. . . . . . . . . . . . . . . . . . . . . . . . . . . . . . . . . . . . . . . . . . . . .
Operator Execution Hierarchy 4–20. . . . . . . . . . . . . . . . . . . . . . . . .
Operator Usage 4–21. . . . . . . . . . . . . . . . . . . . . . . . . . . . . . . . . . . . . . . . .
Mathematical Operators 4–21. . . . . . . . . . . . . . . . . . . . . . . . . . . . .
Statistical Operators 4–29. . . . . . . . . . . . . . . . . . . . . . . . . . . . . . . . .
Logical Operators 4–33. . . . . . . . . . . . . . . . . . . . . . . . . . . . . . . . . . .
Conditional Operators 4–35. . . . . . . . . . . . . . . . . . . . . . . . . . . . . . . .
Additional Formula Examples 4–35. . . . . . . . . . . . . . . . . . . . . . . . . . . . .
Flagging Consecutive Rejects 4–35. . . . . . . . . . . . . . . . . . . . . . . . .
i
Page 4

Table of Contents
Color CVIM MATH-PAK
User’s Manual
Defining Formulas
Analysis Functions and
Runtime Displays
Chapter 4 (continued)
Creating a Shift Register 4–36. . . . . . . . . . . . . . . . . . . . . . . . . . . . .
Naming a Formula 4–37. . . . . . . . . . . . . . . . . . . . . . . . . . . . . . . . . . . . . . . . .
Enabling / Disabling a Formula 4–38. . . . . . . . . . . . . . . . . . . . . . . . . . . . . . .
Using Copy and Paste 4–39. . . . . . . . . . . . . . . . . . . . . . . . . . . . . . . . . . . . . .
Example Copy and Paste 4–41. . . . . . . . . . . . . . . . . . . . . . . . . . . . . . . . .
Setting Range Limits and Assigning Outputs 4–41. . . . . . . . . . . . . . . . . . . .
Entering Range Limits for Formulas 4–43. . . . . . . . . . . . . . . . . . . . . . . .
Inspection Statistics Table 4–44. . . . . . . . . . . . . . . . . . . . . . . . . . . .
Example Range Limit Setting 4–45. . . . . . . . . . . . . . . . . . . . . . . . . . . . .
Assigning Range Limits to Results Output Lines 4–46. . . . . . . . . . . . . .
Enabling Results and Range Limits for Corresponding Tools 4–47. . . . .
Chapter 5
Chapter Objectives 5–1. . . . . . . . . . . . . . . . . . . . . . . . . . . . . . . . . . . . . . . . .
Analysis Functions 5–1. . . . . . . . . . . . . . . . . . . . . . . . . . . . . . . . . . . . . . . . .
Statistics (Learn Mode) for Failed Tools 5–2. . . . . . . . . . . . . . . . . . . . . . . .
Runtime Displays 5–3. . . . . . . . . . . . . . . . . . . . . . . . . . . . . . . . . . . . . . . . . .
Runtime Tools Displays 5–4. . . . . . . . . . . . . . . . . . . . . . . . . . . . . . . . . .
I/O Page 5–4. . . . . . . . . . . . . . . . . . . . . . . . . . . . . . . . . . . . . . . . . . . . . .
Results and Stat1 Page Displays 5–5. . . . . . . . . . . . . . . . . . . . . . . . . . .
Color CVIM
Communications with
MATH-PAK Installed
ii
Appendix A
Objective A–1. . . . . . . . . . . . . . . . . . . . . . . . . . . . . . . . . . . . . . . . . . . . . . . .
Formula Data Replaces Tool Data A–1. . . . . . . . . . . . . . . . . . . . . . . . . . . . .
Results Blocks A–2. . . . . . . . . . . . . . . . . . . . . . . . . . . . . . . . . . . . . . . . . . . .
Configuration Blocks A–6. . . . . . . . . . . . . . . . . . . . . . . . . . . . . . . . . . . . . . .
Discrete Bits A–9. . . . . . . . . . . . . . . . . . . . . . . . . . . . . . . . . . . . . . . . . . . . . .
Index
Tables
1.A Chapter Descriptions 1–1. . . . . . . . . . . . . . . . . . . . . . . . . . . . . . . . .
4.A Formula numbers and corresponding gage/window numbers 4–3. .
4.B Edit / Control Keys 4–10. . . . . . . . . . . . . . . . . . . . . . . . . . . . . . . . . .
4.C Operand Definitions 4–14. . . . . . . . . . . . . . . . . . . . . . . . . . . . . . . . . .
4.D Operator Definitions 4–18. . . . . . . . . . . . . . . . . . . . . . . . . . . . . . . . .
A.1 Formula numbers and corresponding gage/window numbers A–1. .
A.2 Results Block 1 – Formula/Tool Results A–3. . . . . . . . . . . . . . . . . .
A.3 Results Block 2 – Formula/Tool Results A–4. . . . . . . . . . . . . . . . . .
A.4 Results Block 3 – Formula/Tool Results A–6. . . . . . . . . . . . . . . . . .
A.5 Configurations block numbering for formulas 1–56
(and corresponding tools) A–7. . . . . . . . . . . . . . . . . . . . . . . . . . . . .
Page 5

Table of Contents
Color CVIM MATH-PAK
User’s Manual
Tables (continued)
A.6 Configuration blocks 46–77 – for formulas 9–16, 25–32, 41–56
(gages 1–32) – fault and warning ranges A–8. . . . . . . . . . . . . . . . . .
A.7 Configuration blocks (even numbered, 110–156) for formulas 1–8,
17–24, 33–40 (windows 1–24) – fault and warning ranges A–9. . . .
A.8 Discrete Input Bits for formulas and corresponding tools A–10. . . . .
Figures
2.1 Color image vs. gray-scale image 2–1. . . . . . . . . . . . . . . . . . . . . . .
2.1 Inspection results data handling without MATH–PAK formulas 2–2
2.2 Inspection results data handling when using a MATH–PAK
formula 2–3. . . . . . . . . . . . . . . . . . . . . . . . . . . . . . . . . . . . . . . . . . . .
2.3 Accessing the MATH-PAK features 2–4. . . . . . . . . . . . . . . . . . . . .
2.4 Copy and Paste functions 2–5. . . . . . . . . . . . . . . . . . . . . . . . . . . . . .
2.5 Results Page displaying formula results 2–5. . . . . . . . . . . . . . . . . .
3.1 Inserting the MATH-PAK installation card 3–2. . . . . . . . . . . . . . . .
3.2 Title banner indicating the presence of the MATH-PAK option 3–3
4.1 Selecting the formula number 4–2. . . . . . . . . . . . . . . . . . . . . . . . . .
4.2 Using the Jump box and calculator pad 4–4. . . . . . . . . . . . . . . . . . .
4.3 Accessing the formula entry keyboard pad 4–5. . . . . . . . . . . . . . . .
4.4 Switching between the two key sets of the formula entry keyboard 4–6
4.5 Edit/control keys 4–10. . . . . . . . . . . . . . . . . . . . . . . . . . . . . . . . . . . .
4.6 Operand keys 4–12. . . . . . . . . . . . . . . . . . . . . . . . . . . . . . . . . . . . . . .
4.7 Operator keys (initial key set) 4–17. . . . . . . . . . . . . . . . . . . . . . . . . .
4.8 Example application, using the subtraction operator 4–22. . . . . . . . .
4.9 Example of using the DST function 4–25. . . . . . . . . . . . . . . . . . . . .
4.10 Arcsine and arctangent operation results 4–26. . . . . . . . . . . . . . . . . .
4.11 Arccosine operation results 4–27. . . . . . . . . . . . . . . . . . . . . . . . . . . .
4.12 Example application: Using the arctangent to calculate
an angle q 4–27. . . . . . . . . . . . . . . . . . . . . . . . . . . . . . . . . . . . . . . . .
4.13 Example application: Using operands GAGE2 and GAGE2.3 4–28
4.14 Example application: Finding angular results greater than 90° 4–28.
4.15 Example application: Finding angular results greater than 270° 4–29
4.16 Example application, using three gages to find an
average measurement 4–30. . . . . . . . . . . . . . . . . . . . . . . . . . . . . . . . .
4.17 Example application, using windows and the mode operator 4–32. .
4.18 Example application, using gages and the variance operator 4–33. .
4.19 Using the keyboard to set the formula name 4–37. . . . . . . . . . . . . . .
4.20 Enabling a formula 4–38. . . . . . . . . . . . . . . . . . . . . . . . . . . . . . . . . . .
4.21 Copying a formula 4–40. . . . . . . . . . . . . . . . . . . . . . . . . . . . . . . . . . .
4.22 Assigning range limits 4–43. . . . . . . . . . . . . . . . . . . . . . . . . . . . . . . .
4.23 Example: Range limits for linear gaging 4–45. . . . . . . . . . . . . . . . .
4.24 Example: Formula with conditional operation for comparing gage
results 4–46. . . . . . . . . . . . . . . . . . . . . . . . . . . . . . . . . . . . . . . . . . . . .
iii
Page 6

Table of Contents
Color CVIM MATH-PAK
User’s Manual
Figures (continued)
4.25 Selecting output lines for range limits 4–47. . . . . . . . . . . . . . . . . . . .
4.26 Enabling the range limits and outputs for tools 4–48. . . . . . . . . . . . .
5.1 Selecting the Tool Display menu 5–1. . . . . . . . . . . . . . . . . . . . . . . .
5.2 The Range Fail box 5–2. . . . . . . . . . . . . . . . . . . . . . . . . . . . . . . . . .
5.3 Runtime Display menu – setup mode 5–3. . . . . . . . . . . . . . . . . . . .
5.4 Display menu – run mode 5–3. . . . . . . . . . . . . . . . . . . . . . . . . . . . .
5.5 Formulas displayed in Failed Tools display during run mode
operation 5–4. . . . . . . . . . . . . . . . . . . . . . . . . . . . . . . . . . . . . . . . . .
5.6 Formulas displayed on I/O Page display during run mode
operation 5–5. . . . . . . . . . . . . . . . . . . . . . . . . . . . . . . . . . . . . . . . . .
5.7 Calculator pad for entering number of displayed
formula/tool results 5–6. . . . . . . . . . . . . . . . . . . . . . . . . . . . . . . . . .
5.8 Typical help message for the Disp. Windows option 5–7. . . . . . . . .
iv
Page 7

Chapter
Chapter Objectives
A–B
1
Using This Manual
Contents
Chapter Objectives 1–1. . . . . . . . . . . . . . . . . . . . . . . . . . . . . . . . . . . . . . . .
Manual Contents 1–1. . . . . . . . . . . . . . . . . . . . . . . . . . . . . . . . . . . . . . . . . .
Intended Audience 1–1. . . . . . . . . . . . . . . . . . . . . . . . . . . . . . . . . . . . . . . .
Cautions 1–2. . . . . . . . . . . . . . . . . . . . . . . . . . . . . . . . . . . . . . . . . . . . . . . .
Related Publications 1–2. . . . . . . . . . . . . . . . . . . . . . . . . . . . . . . . . . . . . . .
Trademarks 1–2. . . . . . . . . . . . . . . . . . . . . . . . . . . . . . . . . . . . . . . . . . . . . .
The objective of this chapter is to provide an overview of the contents and
organization of this manual, to describe the intended audience, and to list
related publications.
Manual Contents
The contents of this manual are briefly described in
Table 1.A
Chapter Descriptions
Chapter/
Appendix
1 Using This Manual Provides an overview of the manual.
2
3 Installation
4 Defining Formulas
5
A
Analysis and Runtime
Communications with
MA TH-PAK Installed
Title Description
Introduction to the
MA TH-PAK Option
Displays
Color CVIM
Previews the main features and capabilities of
the MA TH–PAK option.
Describes how to install the MA TH-PAK option
into the Color CVIM module.
Describes how to access the MATH-PAK
formula keyboard, lists and describes the
formula operators and operands, discusses
selecting and enabling/disabling formulas,
discusses the Copy and Paste functions, and
discusses setting range limits and assigning
outputs.
Desribes the use of analysis functions and
runtime displays with MA TH-PAK installed.
Lists the effects that MATH-PAK formulas
have on the results and configuration blocks
available through the serial and parallel ports.
Table 1.A below.
Intended Audience
Before using this manual, you should be familiar with the Color CVIM
module features and the procedures used in configuring the Color CVIM
module for operation.
• For information regarding the Color CVIM module, refer to the Color
CVIM User’s Manual, Cat. No. 5370–ND009 (Series A).
1–1
Page 8

Chapter 1
Using This Manual
• If you plan to use Color CVIM communications, refer also to the Color
CVIM Communications Manual, Cat. No. 5370–ND0010 (Series A).
• If you plan to use other software option packages along with the
MATH-PAK option, refer to the user’s manuals for the respective
software package as necessary.
Notice of Attention
Related Publications
Notices of attention are included when the COLOR CVIM module or
peripheral equipment could be damaged if the listed procedure is not
followed. The following format is used:
ATTENTION: Identifies information about practices or
circumstances that can lead to personal injury or death, property
!
damage, or economic loss.
Attentions help you:
• identify a hazard
• avoid the hazard
• recognize the consequences
Important: Identifies information that is especially important for successful
application and understanding of the product.
The following manuals are cited for reference in this manual:
• User’s Reference Manual, Bulletin 5370–CVIMC, Cat. No. 5370–ND009
(Series A), also referred to as the Color CVIM User’s Manual in this
publication.
Trademarks
1–2
• Communications Manual, Bulletin 5370–CVIMC, Cat. No. 5370–ND010
(Series A), also referred to as the Color CVIM Communications Manual
in this publication.
The following trademarks apply to products mentioned in this manual:
Color CVIM Module – Allen–Bradley Cat. No. 5370–CVIMC
MATH–PAK Option – Allen–Bradley Cat. No. 5370–CMPK
Page 9

Chapter
Chapter Objectives
MATH-PAK Preview
A–B
2
Introduction to the MATH–PAK Option
Contents
Chapter Objectives 2–1. . . . . . . . . . . . . . . . . . . . . . . . . . . . . . . . . . . . . . . .
MATH-PAK Preview 2–1. . . . . . . . . . . . . . . . . . . . . . . . . . . . . . . . . . . . . . . .
This chapter briefly describes the features and capabilities available with the
MATH–PAK option package installed in the Color CVIM module.
The MATH–PAK option enables your Color CVIM module to automatically
perform a variety of mathematical and/or logical operations, using formulas
that you define, on inspection data from any of the module’s analysis tools.
The MATH-PAK option is designed to give you much greater flexibility in
the use and application of the Color CVIM module’s inspection capabilities,
allowing you to quickly perform complex data manipulation on the fly. Also,
because these calculations are handled within the Color CVIM module itself,
the MATH-PAK option can help simplify the programming of, or help
eliminate the need for, an external system host computer or controller.
Definition of a Formula
A MATH-PAK formula is defined by the user. A formula consists of one or
more mathematical or logical operators, and one or more operands, which
combine to provide a mathematical or a logical (1 or 0) result.
Note: The term operator refers to the mathematical, logical, or other
operation performed, such as add, multiply, square root, cosine, AND, etc.
The term operand refers to the initial data value upon which the operations
are performed, such as a gage result, or a constant.
You can define up to 56 different formulas, each consisting of a number of
different components (operators and operands).
MATH-PAK formulas can perform a variety of operations, from simple
arithmetic to more complex trigonometric functions, square roots or statistics
values, and a number of other mathematical or logical operations. Operators
can be used alone in a formula, or in combination.
MATH-PAK formulas can perform operations on a variety of operands,
including the numerical results from a tool, tool pass/fail status, object
contour analysis results, statistics based on a tool’s results, and even the
results from other formulas.
Formula results can be logical (1 or 0), integer, or fixed point (decimal).
2–1
Page 10
Chapter 2
Introduction to the MATH-PAK Option
Example formulas: This simple formula scales a window’s results by a
constant multiplier (using the multiply operator (
*) and 2 operands –
window 4 and the constant, 0.75):
WINDOW4 * 0.75
The formula below averages the results from gages 1, 2, and 3 (using the add
operator (+) and the 3 gage operands, then using the divide operator ( / ) and
the constant, 3):
(GAGE1 + GAGE2 + GAGE3) / 3
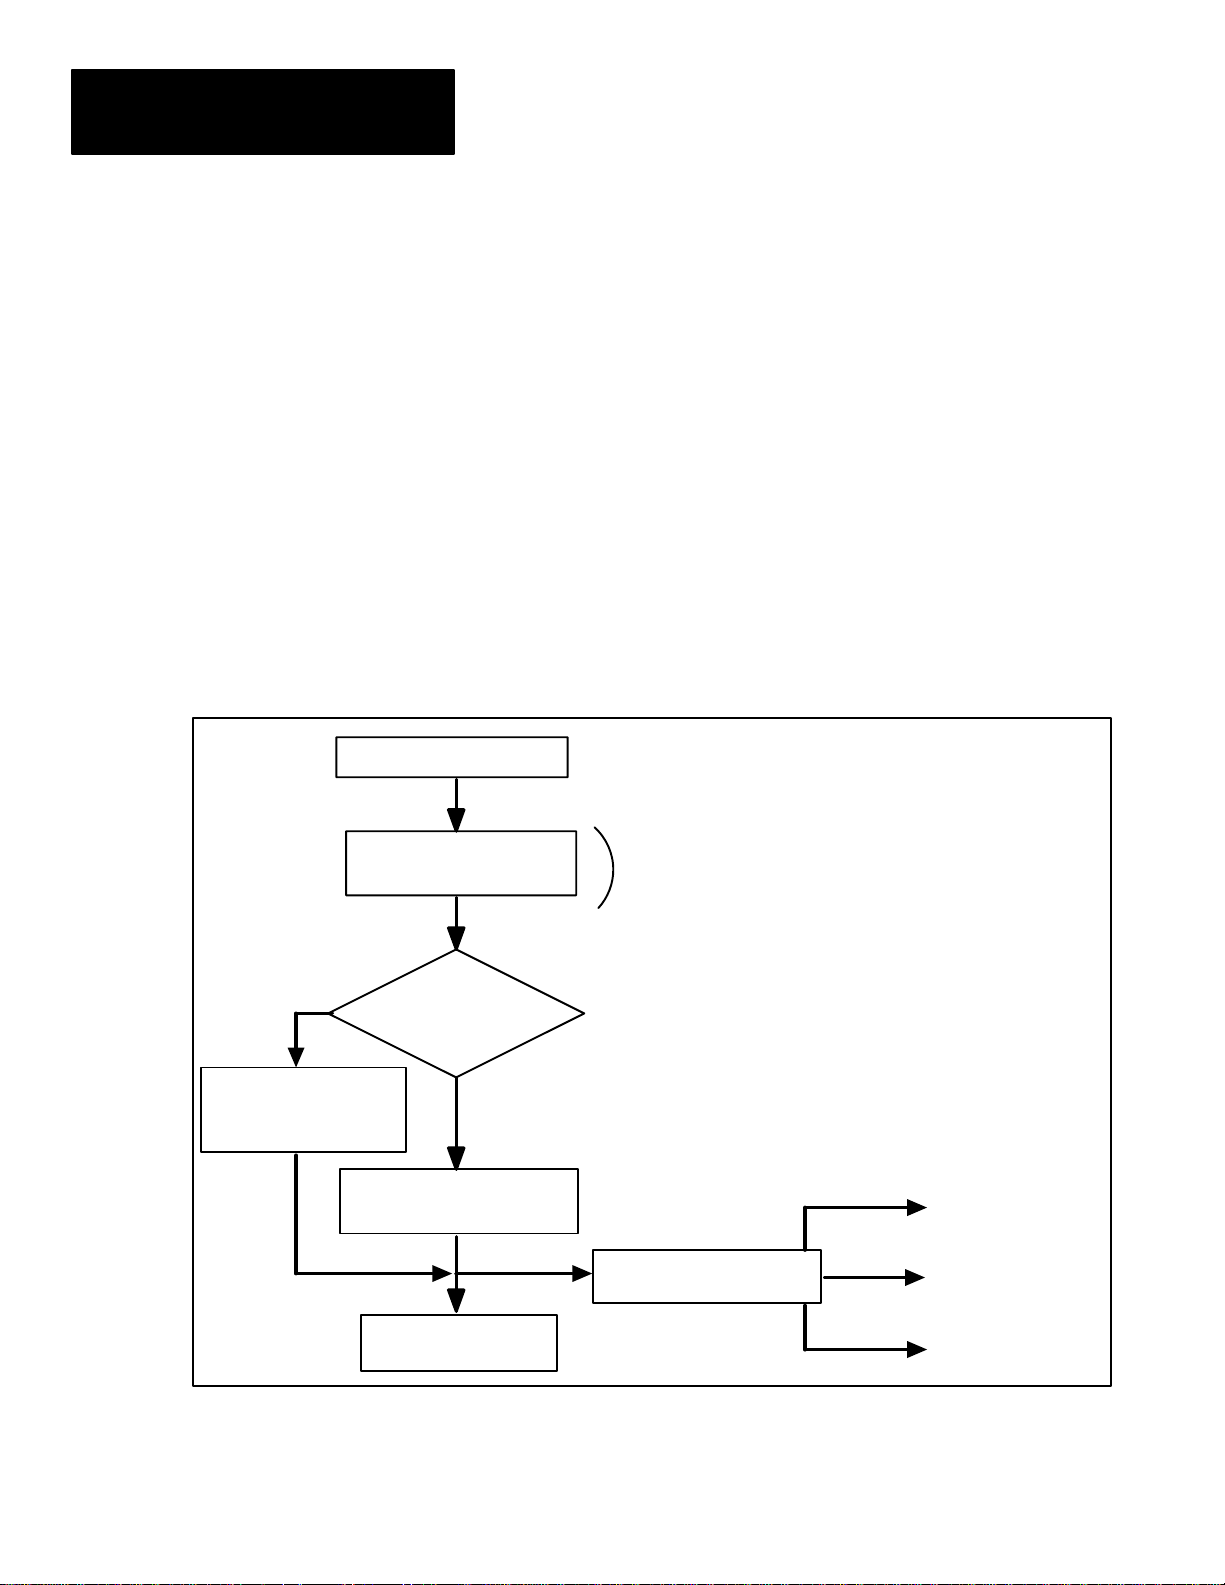
How Formula Results Are Applied
Figure 2.1 illustrates how the inspection tool results are range-checked and
applied to discrete outputs, without MATH-PAK installed.
Color CVIM Inspection
Inspection results data
from one or more tools
No
Appropriate
fault/warning bit(s)
cleared
fault/warning bit(s) set
Figure 2.1 Inspection results data handling without MATH–PAK formulas
Without
MATH-PAK
formulas, tool
results data and
pass/warn/fault
status are
available for use
Range limits
exceeded or
tool failed?
Yes
Appropriate
directly – as is.
To: Chassis
backplane
2–2
Results data stored
in Color CVIM memory
Bit(s) sent to
assigned output(s)
To: 1771 Remote
I/O port
To: RS-232 port
Upon completion of each inspection cycle, the Color CVIM module stores
the resulting inspection data from each analysis tool used in the inspection.
This information is accessible to host devices connected to the Color CVIM
through the backplane, 1771 Remote I/O port, or RS-232 port.
Page 11
Color CVIM Inspection
Inspection results
from one or more tools
Chapter 2
Introduction to the MATH-PAK Option
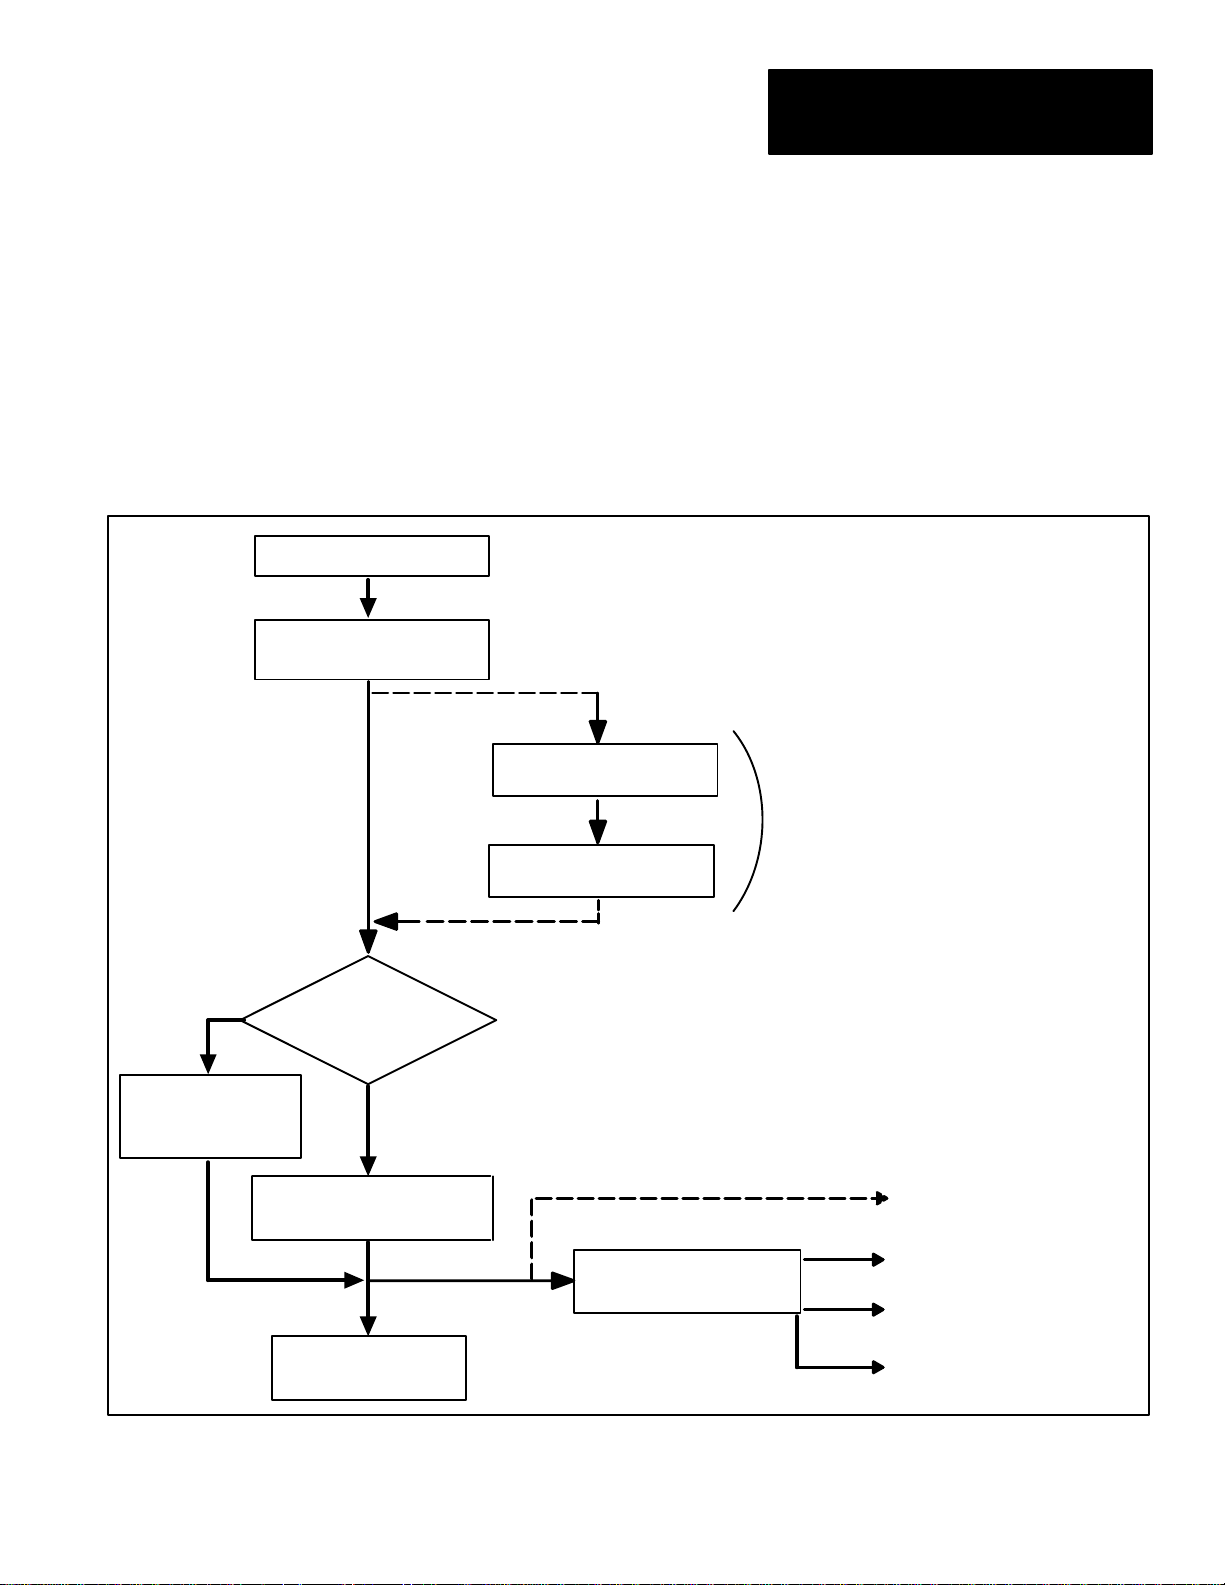
When the MATH-PAK option is installed, the results information for each
inspection is also available for use in MATH-PAK formulas. You can define
formulas to combine or manipulate, in any number of ways, the inspection
data gained from one or more tools used in the inspection.
Figure 2.2 illustrates how the inspection results can be manipulated by
formulas with MATH-PAK installed.
Figure 2.2 Inspection results data handling when using a MA TH–PAK formula
No
Appropriate
fault/warning bit(s)
cleared
fault/warning bit(s) set
Range limits
exceeded or
tool failed?
Yes
Appropriate
Bit(s) sent to
assigned output(s)
Formula manipulates
data from tool(s)
Results from formula
Results data stored in
Color CVIM memory
2: Formula results can
replace, or be provided along
with, tool results.
Using MATH-PAK
formulas, tool results
can be combined or
1
manipulated.
1: Formula results can be
range-checked instead of, or
along with, tool results.
To: MATH–PAK formula(s)
(if applicable)
To: Chassis
2
backplane
To: 1771 Remote
I/O port
To: RS-232 port
Range limits and output assignment: For each formula you define, as with
the inspection tools, you can set warning and fault range limits for the
results, and assign the range limits to discrete outputs (see Figure 2.2).
2–3
Page 12
Chapter 2
Introduction to the MATH-PAK Option
Depending on your requirements, you can configure the Color CVIM module
so that it range-checks formula results instead of, or in addition to, the initial
tool results.
Data communication: The formula results information is, as with
inspection tool results, also accessible to devices connected to the Color
CVIM module through the backplane, 1771 Remote I/O port, or RS-232 port.
Depending on your requirements, you can configure the Color CVIM module
so that formula results are accessible instead of, or in addition to, the initial
tool results.
Accessing the MATH-PAK Features
With the MATH-PAK option installed, the MATH-PAK features are accessed
through the added Config. Results box on the Archival menu. To access
the Config. Results (MATH-PAK) menu, you would:
• Pick Misc → Archival to access the Archival menu (see Figure 2.3).
• Pick Config. Results on the Archival menu.
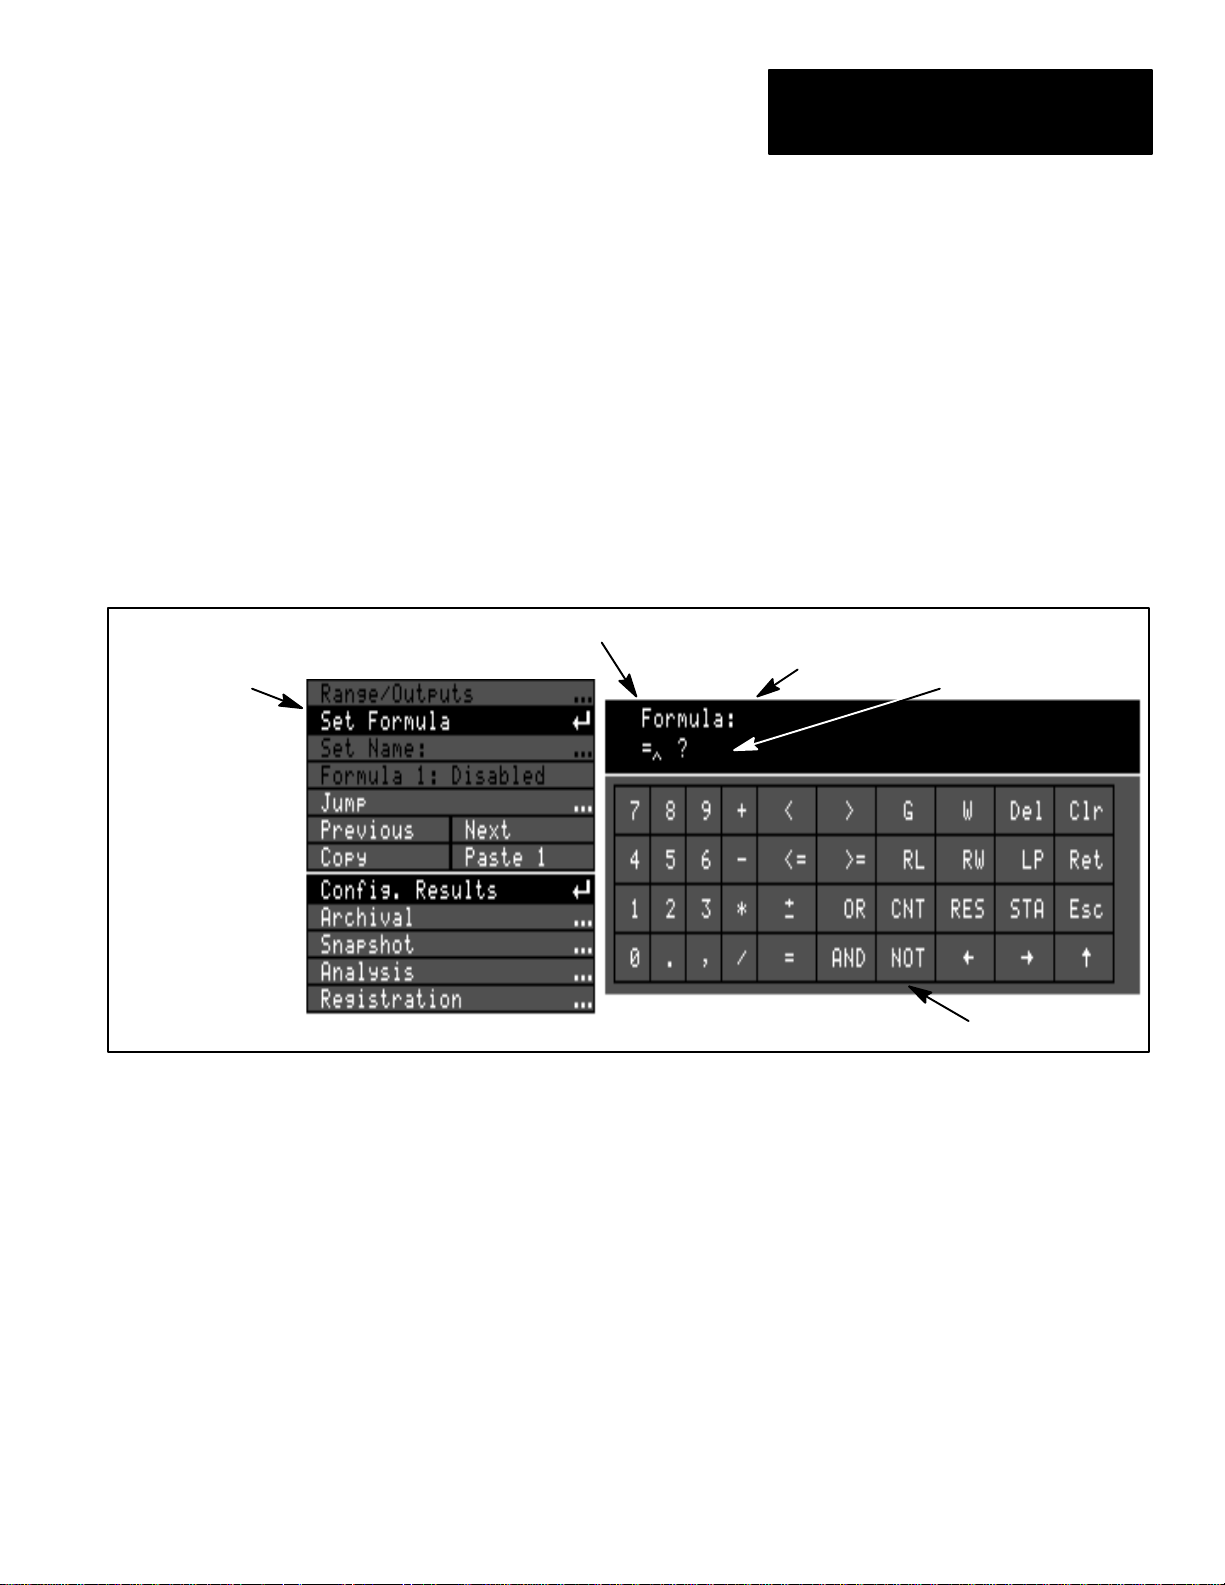
To define a formula, you would pick Set Formula on the Archival menu.
When you do, the formula entry keyboard appears (see Figure 2.3). You then
enter a formula by picking the appropriate boxes on the formula keyboard.
Figure 2.3 Accessing the MA TH-PAK features
Formula
entry
keyboard
2–4
Page 13
Chapter 2
Introduction to the MATH-PAK Option
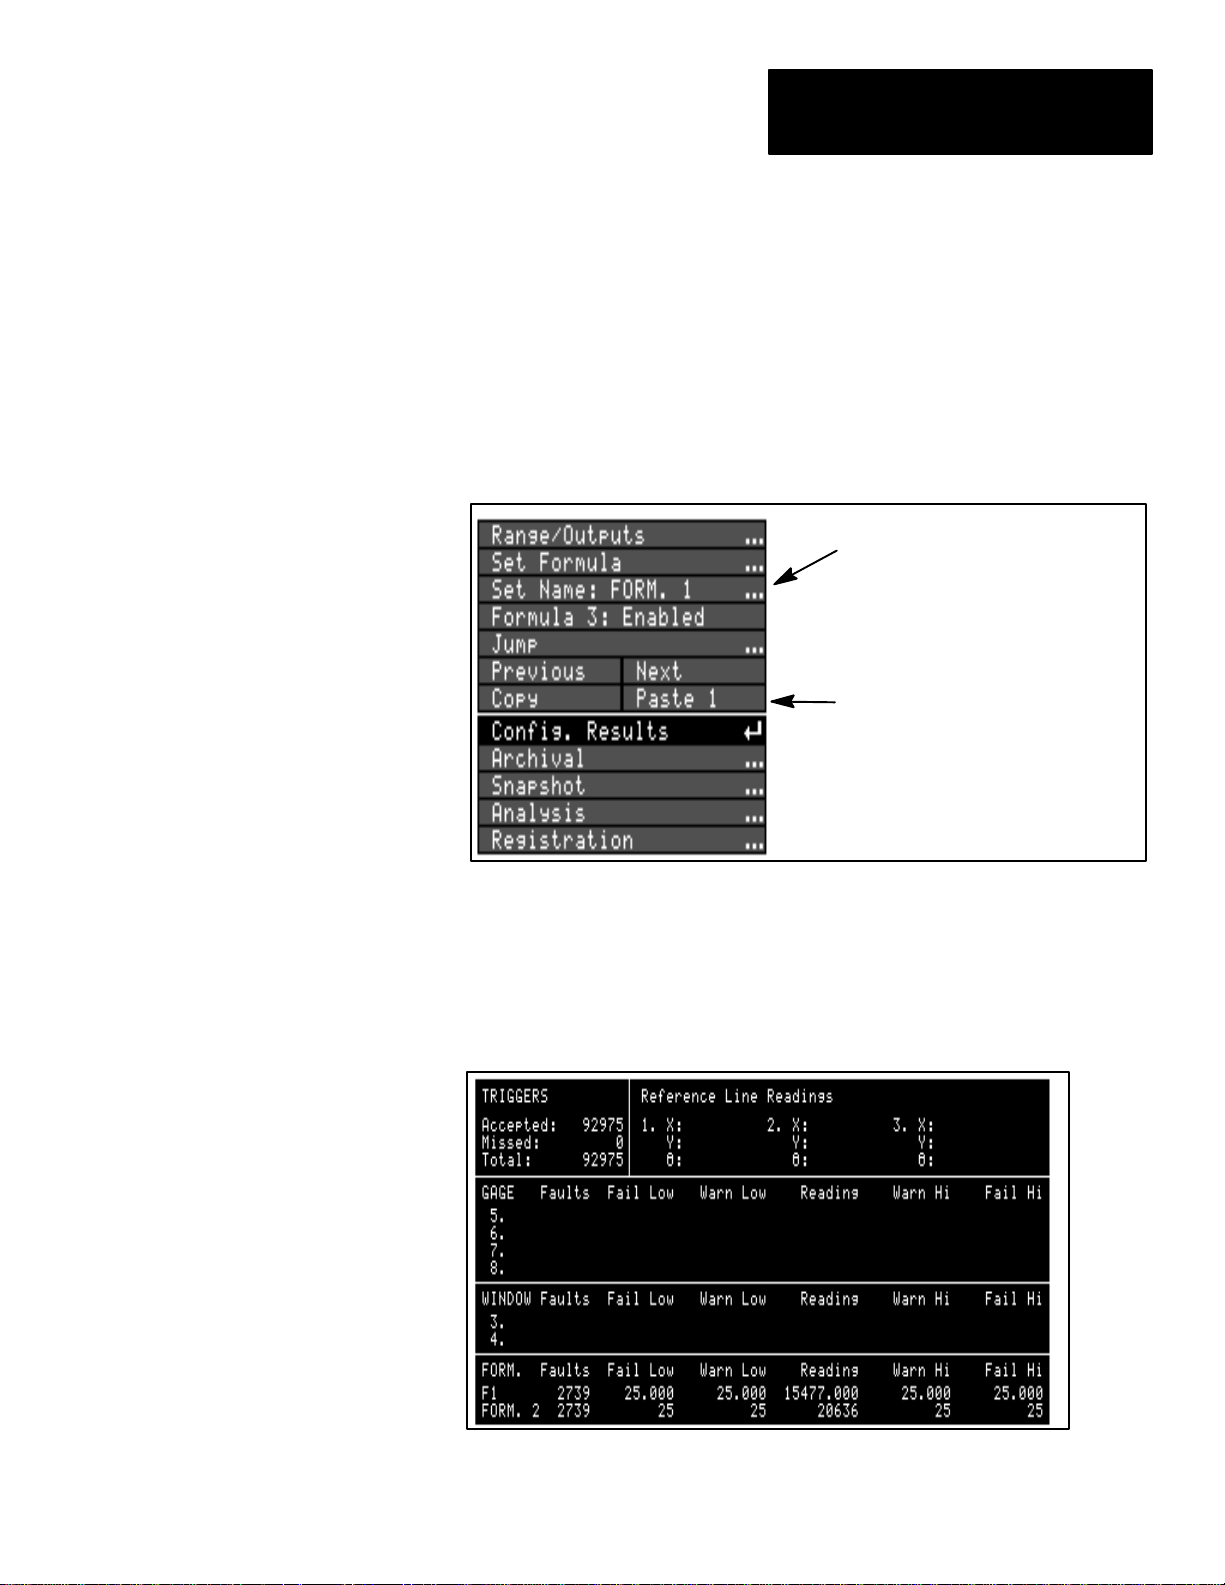
Copy and Paste Functions
You can copy the definition of one formula to another using the Copy and
Paste menu items which are part of the new MATH–PAK menus (see
Figure 2.4). After you copy one formula to another, for example, you can
make changes to the formula as necessary. This can save time and effort
during setup, especially when you want to try out different variations of a
formula you have defined, or if two or more formulas will be very similar.
Figure 2.4 Copy and Paste functions
Config. Results menu
Copy and Paste boxes
Runtime Displays
With the MATH-PAK option installed, the runtime displays can
accommodate the MATH-PAK formulas. For example, the Results page can
list the formula results along with other tool results (see Figure 2.5).
Figure 2.5 Results Page displaying formula results
2–5
Page 14

Chapter
Chapter Objectives
Installing the MATH-PAK Option
A–B
3
Installation
Contents
Chapter Objectives 3–1. . . . . . . . . . . . . . . . . . . . . . . . . . . . . . . . . . . . . . . .
Installing the MATH-PAK Option 3–1. . . . . . . . . . . . . . . . . . . . . . . . . . . . . .
This chapter describes how to install the MATH-PAK option in the
Allen–Bradley 5370–CVIMC Color CVIM module.
The MATH-PAK option is provided on the supplied memory card. This
section describes how to install the MATH-PAK option. Please note the
following considerations:
Required Firmware: The Color CVIM module must have the Revision
A02 (or higher) firmware before the MATH-PAK option can be installed
(the firmware revision is listed on the title banner on the monitor screen
following powerup).
One–Time Installation: You need only install the MATH-PAK option
once; once installed, the MATH-PAK option remains installed for all
subsequent powerups.
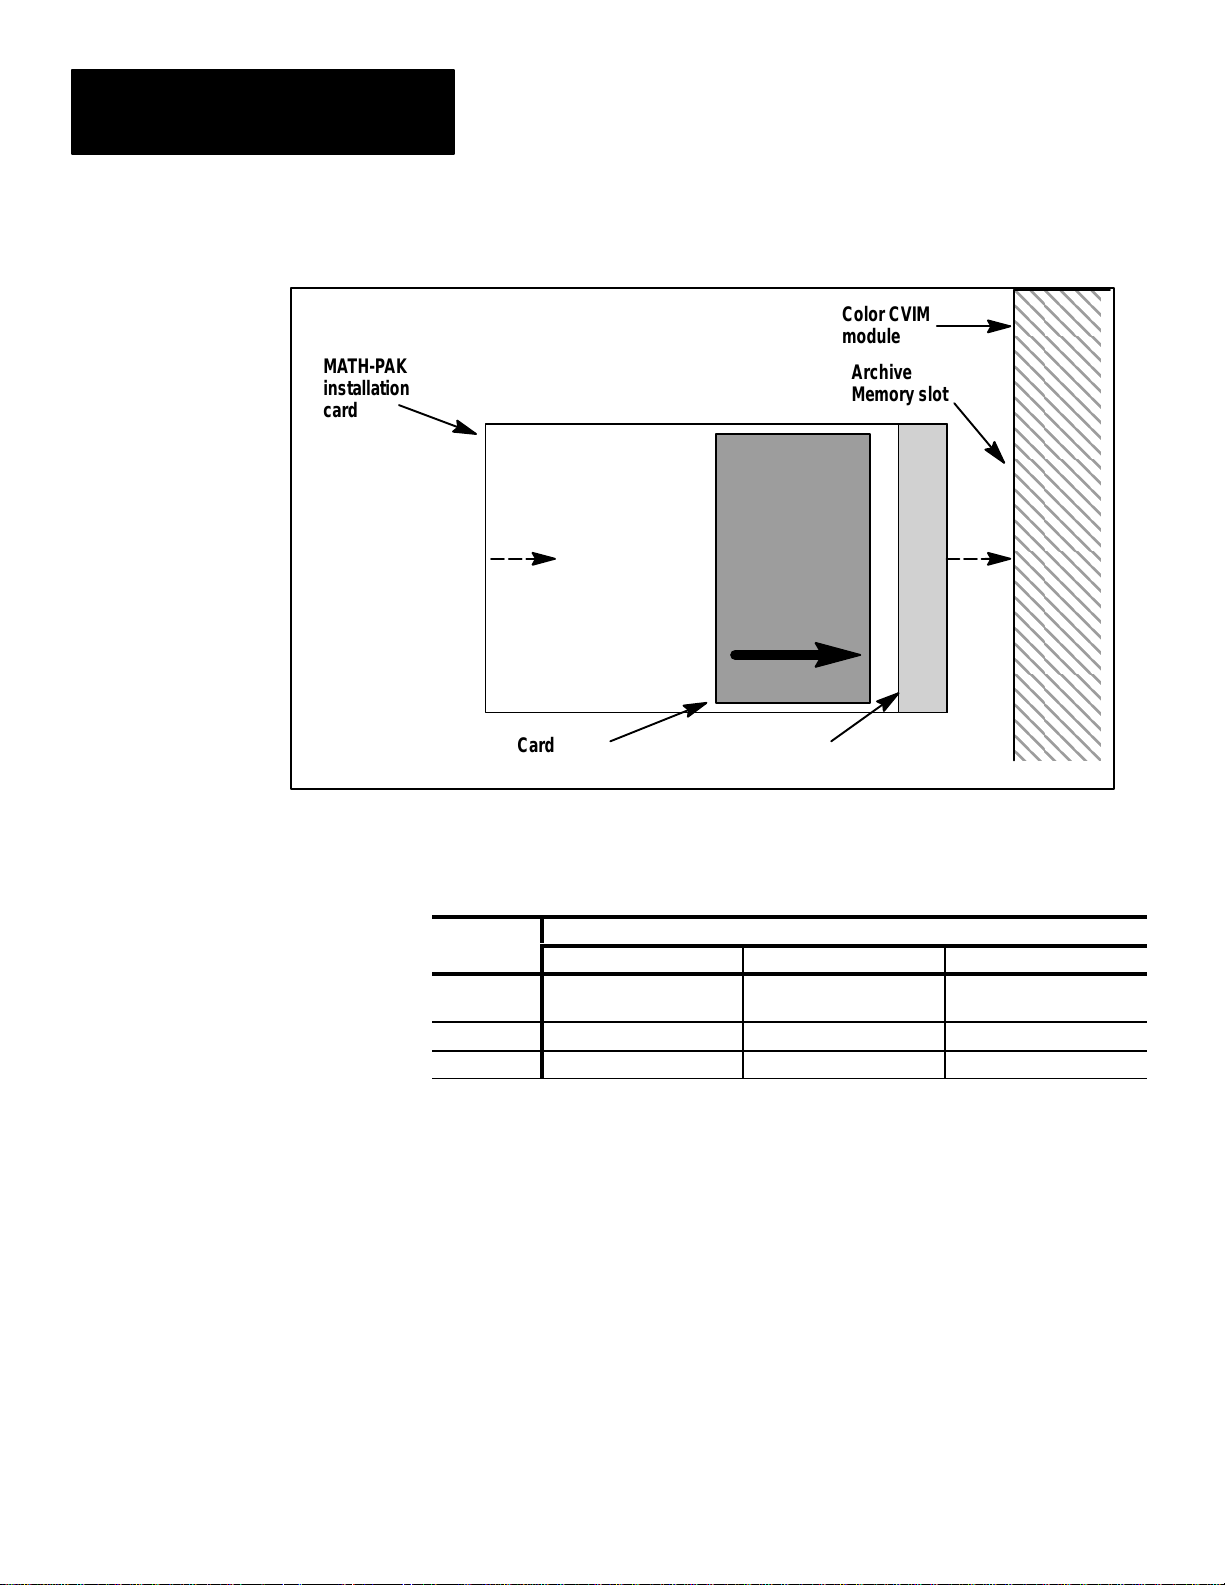
To install the MATH-PAK option in your Color CVIM module:
• Remove DC power from the Color CVIM module.
• Insert the MATH-PAK installation card into the Archive Memory slot on
the Color CVIM module. Insert the end with the metal strip facing right
(see Figure 3.1, page 3–2).
• Restore DC power to the Color CVIM module – this starts the loading
sequence.
ATTENTION: Do not remove power to the Color CVIM
module during loading of the MATH-PAK option. Doing so may
!
damage the Color CVIM module.
3–1
Page 15
Chapter 3
Installation
MATH-PAK
installation
card
Figure 3.1 Inserting the MA TH-PAK installation card
Color CVIM
module
Archive
Memory slot
Card Label
Metal Strip
The loading process requires about 45 seconds. The LEDs near the top of
the face of the Color CVIM module indicate the progress of the
three–phase loading process (with each phase taking about 15 seconds):
LEDs
Pass/Fail
Trigger 1 Green Green Off
Trigger 2 Off Green Green
1
Red–to–yellow–
to–green
MA TH-PAK Loading Phase
2 3
Green
Red–to–yellow–
to–green
When the loading process is complete, the Color CVIM module initiates
its normal powerup sequence.
• Once the powerup sequence is complete, you can verify that the
MATH-PAK option is installed by checking for the MATH-PAK
indication on the powerup title banner on the monitor; if the MATH-PAK
option is installed, it is listed as on of the “Packages” on the title banner,
along with other installed options, if any.
• Remove the MATH-PAK installation card from the Archive Memory slot.
At this point, the MATH-PAK option has been successfully installed, and can
be used as required in your Color CVIM module configurations.
3–2
Page 16

Chapter
Chapter Objectives
A–B
4
Defining Formulas
Contents
Chapter Objectives 4–1. . . . . . . . . . . . . . . . . . . . . . . . . . . . . . . . . . . . . . . .
Formula Definition: Basic Steps 4–1. . . . . . . . . . . . . . . . . . . . . . . . . . . . . .
Selecting a Formula 4–2. . . . . . . . . . . . . . . . . . . . . . . . . . . . . . . . . . . . . . .
Defining a Formula 4–4. . . . . . . . . . . . . . . . . . . . . . . . . . . . . . . . . . . . . . . .
Naming a Formula 4–37. . . . . . . . . . . . . . . . . . . . . . . . . . . . . . . . . . . . . . . . .
Enabling/Disabling a Formula 4–38. . . . . . . . . . . . . . . . . . . . . . . . . . . . . . . .
Using Copy and Paste 4–39. . . . . . . . . . . . . . . . . . . . . . . . . . . . . . . . . . . . . .
Setting Range Limits and Assigning Outputs 4–41. . . . . . . . . . . . . . . . . . . .
This chapter describes how to configure MATH-PAK formulas, including
how to select formulas, how to access and use the formula entry keyboard to
define a formula, and how to copy formulas.
Formula Definition: Basic Steps
The MATH–PAK option enables your Color CVIM module to automatically
perform a variety of mathematical and/or logical operations, using formulas
that you define, on inspection data from any of the module’s analysis tools.
A MATH-PAK formula is defined by the user. A formula consists of one or
more mathematical or logical operators, and one or more operands, which
combine to provide a mathematical or a logical (1 or 0) result.
The result of the formula can be assigned range limits, and the range limits
can be assigned to outputs.
You can define up to 56 different MATH-PAK formulas.
Listed below are the basic steps involved in initially defining a formula:
1. Select formula – Select the number of the formula to define, taking into
consideration that results from enabled formulas can replace output from
corresponding tools.
2. Define and save formula – Define the formula by selecting and placing,
in logical sequence, the appropriate components (operands and
operators) using the formula entry keyboard, accessed through the Set
Formula box.
3. Name formula – Enter a descriptive name for the formula, if desired, by
picking the Set Name box and using the character entry keyboard.
4. Enable formula – Enable the formula, if appropriate, by picking the
Formula #: Disabled box.
5. Set range limits and assign outputs – Set range limits and assign
outputs for the formula, as required, by picking the Range/Outputs box.
4–1
Page 17
Chapter 4
Defining Formulas
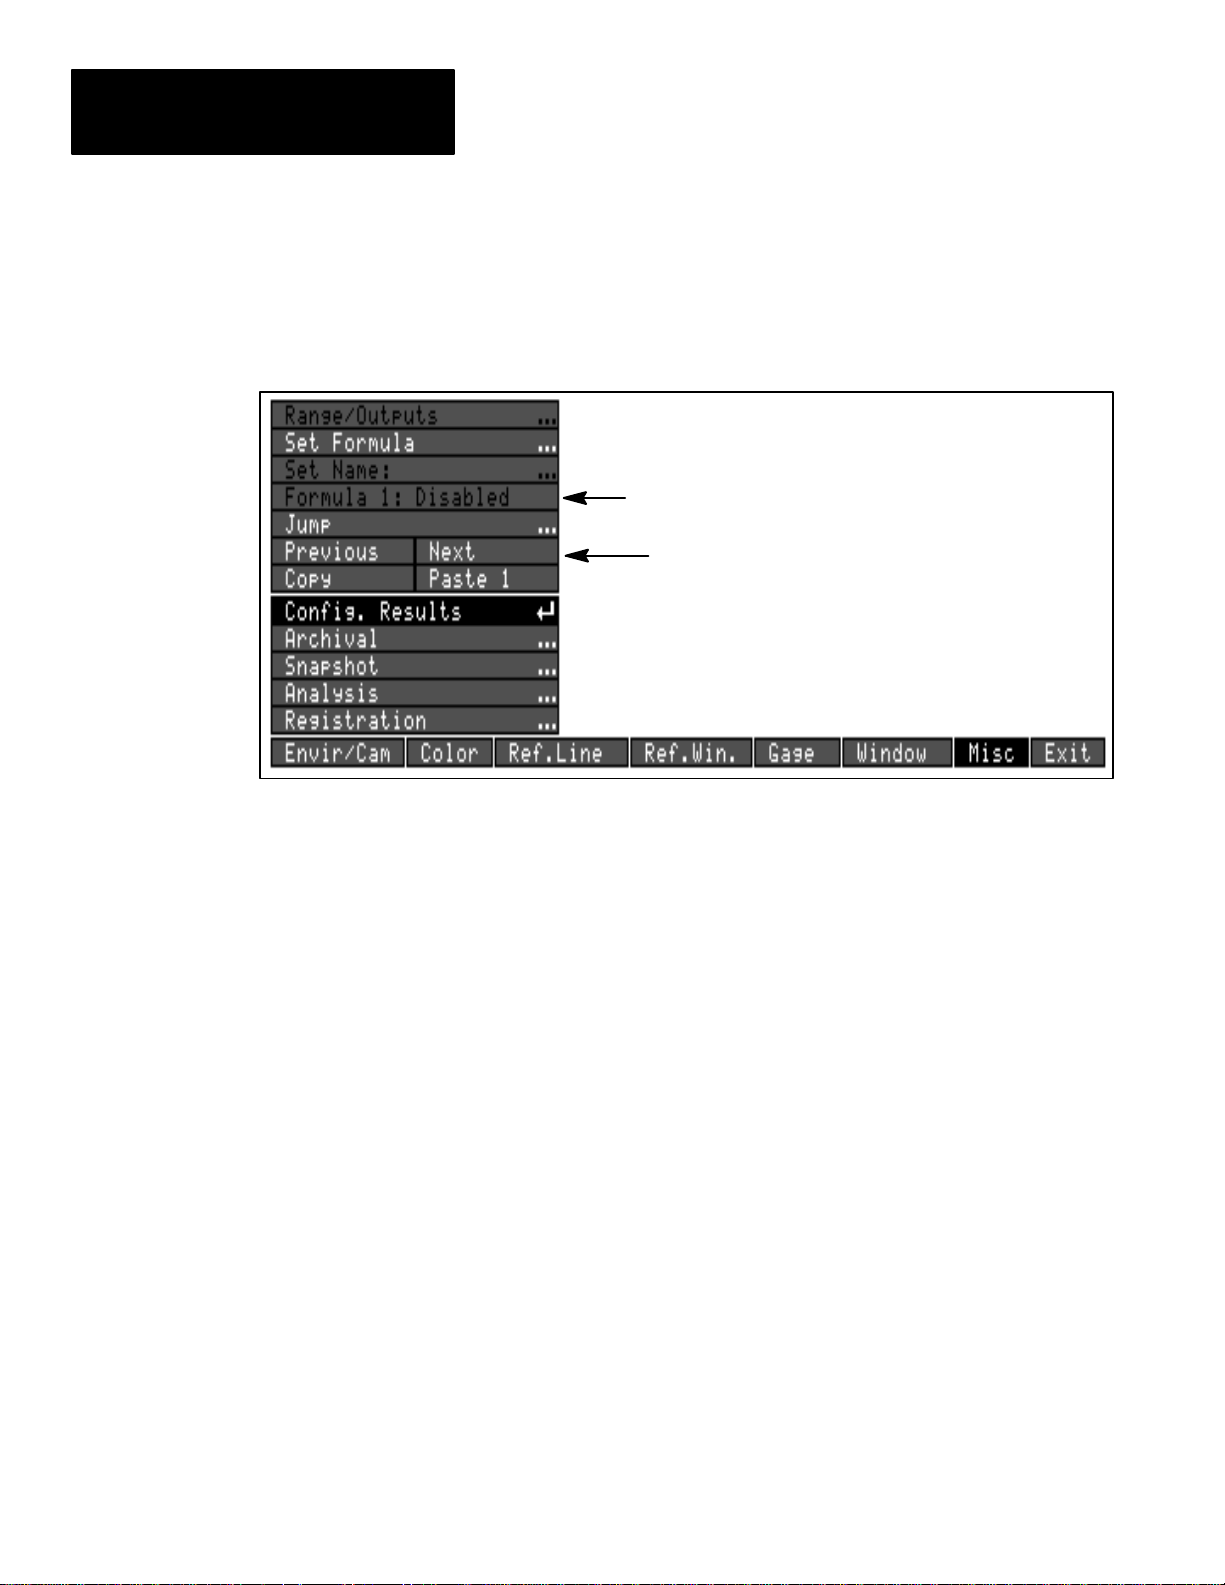
Selecting a Formula
The first step in defining a formula is to select, by number (from 1–56), the
formula you want to define. The current formula number is listed in the
Formula #: box on the Config. Results menu (see Figure 4.1).
Figure 4.1 Selecting the formula number
Formula # box
Previous / Next boxes
In selecting the formula(s) you want to define, and also when selecting
windows and gages to define, consider the following points:
• Formulas are evaluated in numerical order: If you define formulas
which require results information from some other formula(s) from the
current inspection, make sure the formulas providing the required results
precede (in terms of numerical order) the formula requiring those results.
• Formulas prevent the use of corresponding gage and window
outputs: Any formula you select and enable will disable the use of
results outputs from a corresponding gage or window, as listed in
Table 4.A, page 4–3. Note that gages 33–64 and windows 25–48 are
not listed in Table 4.A; they are not affected by the use of formulas.
Warning message: Whenever you enable a formula, a warning message
appears, identifying the corresponding tool that is being prevented from
driving an output (see “Enabling / Disabling a Formula” on page 4–38).
• Formula results replace the results of the corresponding gage and
window in the results blocks: When you enable a formula, its
inspection results are listed in the results block, in place of the
corresponding gage or window results (as listed in Table 4.A, page 4–3).
Results blocks contain the comprehensive inspection results available by
transfer through the Color CVIM backplane, or through one of the Color
CVIM serial ports (see Appendix A for communications information).
When any formula is enabled, the Color CVIM module disables the
Range/Outputs box on the Range/Reference menu for the corresponding
tool (see “Setting Range Limits and Assigning Outputs” on page 4–41).
4–2
Page 18

Chapter 4
Defining Formulas
To avoid losing the use of particular window or gage outputs or results,
when defining formulas, select formula numbers which do not correspond to
any gages or windows you have previously defined (see Table 4.A, page
4–3), or that you intend to define. Or, define a formula to provide the result
value for a tool for which there is a conflict (see “Operands” in this chapter).
Otherwise, during setup of gages and windows, select gage and window
numbers that will not conflict with the formulas you intend use. One way to
do this is to select only gages numbered from 33–64, or windows numbered
from 25–48, which are not affected by the use of formulas.
Use Copy and Paste functions: If you define a formula that turns out to
correspond to a gage or window whose output or results block information
you wish to use, you can copy that formula to another formula number that
does not conflict (see “Using Copy and Paste” on page 4–39).
See Appendix A for communications information: Appendix A provides
more information on the specific effects that using formulas has on the
results blocks, on the configuration blocks, and on the discrete input bits.
Table 4.A
Formula numbers and corresponding gage/window numbers
Formula Tool Formula Tool Formula Tool Formula Tool
1 Window 1 15 Gage 7 29 Gage 13 43 Gage 19
2 Window 2 16 Gage 8 30 Gage 14 44 Gage 20
3 Window 3 17 Window 9 31 Gage 15 45 Gage 21
4 Window 4 18 Window 10 32 Gage 16 46 Gage 22
5 Window 5 19 Window 11 33 Window 17 47 Gage 23
6 Window 6 20 Window 12 34 Window 18 48 Gage 24
7 Window 7 21 Window 13 35 Window 19 49 Gage 25
8 Window 8 22 Window 14 36 Window 20 50 Gage 26
9 Gage 1 23 Window 15 37 Window 21 51 Gage 27
10 Gage 2 24 Window 16 38 Window 22 52 Gage 28
11 Gage 3 25 Gage 9 39 Window 23 53 Gage 29
12 Gage 4 26 Gage 10 40 Window 24 54 Gage 30
13 Gage 5 27 Gage 11 41 Gage 17 55 Gage 31
14 Gage 6 28 Gage 12 42 Gage 18 56 Gage 32
Selecting the Formula Number(s)
There are two ways to select the formula number:
• Use the Previous / Next boxes to decrement / increment the formula
number, until the desired number appears (see Figure 4.1, page 4–2).
• Use the Jump box to enter the desired formula number directly (see
Figure 4.2, page 4–4).
4–3
Page 19
Chapter 4
Defining Formulas
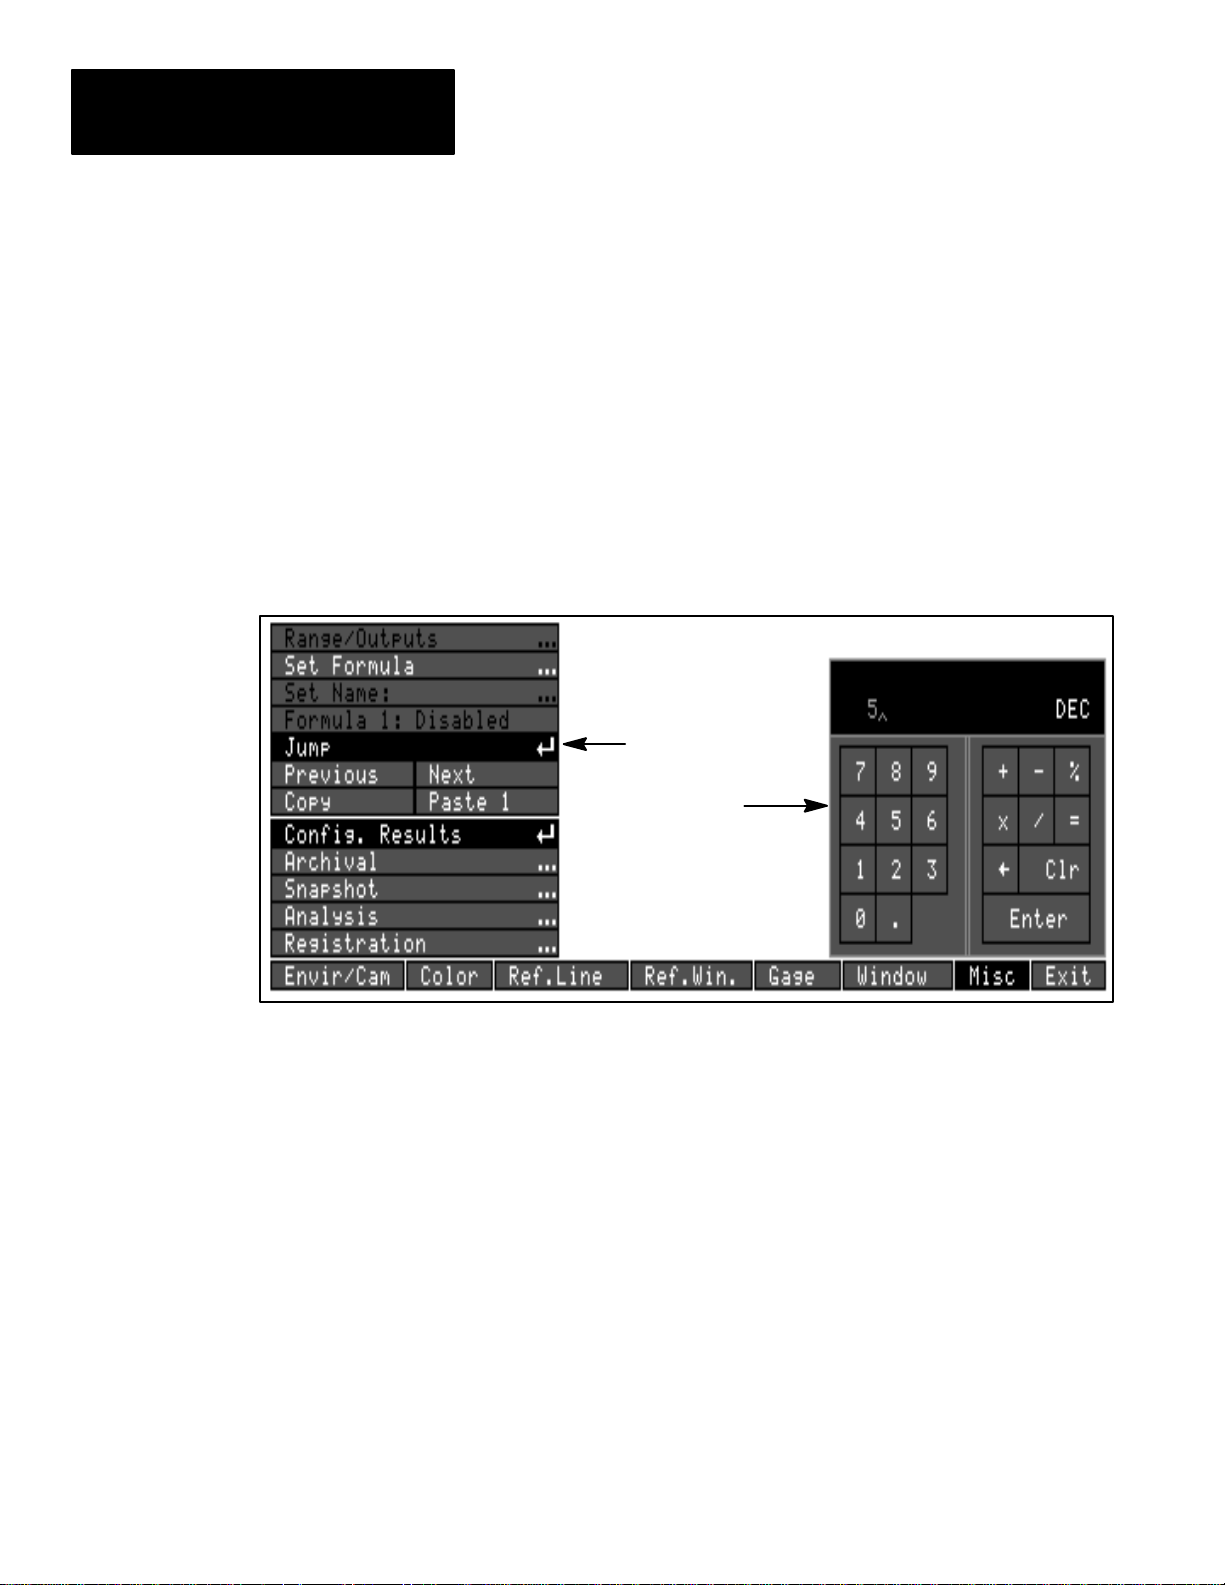
To use the Jump box to select the formula number:
• Pick Misc → Config. Results to access the Config. Results menu.
• Pick the Jump box on the Config. Results menu. The calculator pad
appears (see Figure 4.2).
• Pick the appropriate numeric key boxes on the calculator pad to select the
desired formula number.
• When the desired formula number appears in the calculator pad display,
pick Enter on the calculator pad. This changes the selected formula to
the number on the calculator pad display.
Figure 4.2 Using the Jump box and calculator pad
Defining a Formula
Jump box
Calculator pad
Formulas can be defined in a variety of ways to perform a variety of
calculations.
Multiple operators, of different types, can be combined in different ways
within a formula. “Nesting” of operations within a formula can be employed
through the use of the parentheses. Or, a formula can consist of a single
operand, with no operators.
A first step in formula definition is to review the available operators and
operands – this information is listed in the sections “Entering Operands” and
“Entering Operators” in this chapter.
4–4
The next step in formula definition is to decide on the formula content, and
results desired from the formula – that is, determine what you want the
formula to do, based on your application requirements.
Once you have decided on the formula requirements, to define a formula, use
the formula entry keyboard, which is described in the following two sections.
Page 20
Set Formula box
Chapter 4
Defining Formulas
Accessing the Formula Entry Keyboard
In order to define a formula you have selected, access the formula entry
keyboard by selecting the Set Formula box. To do this:
• Pick Misc → Config. Results to access the Config. Results menu.
(see Figure 4.3).
• Pick Set Formula on the Config. Results menu. The formula entry
keyboard appears.
Figure 4.3 Accessing the formula entry keyboard
Keyboard display area
Formula name field
Formula entry field
Key Area
The formula entry keyboard enables you to select the various operands,
operators, and other elements that will make up the formula you are defining.
The keyboard has two main areas – the key area, and the display area (see
Figure 4.3).
Display area: The display area lists the formula name (which can be
user-assigned), and lists the formula components as you select them.
Key area: You pick the keys in the key area in order to select components
(operators and operands) to define the formula. The keys fall into several
general categories – operand keys, operator keys, numeric keys, edit keys,
and miscellaneous other keys.
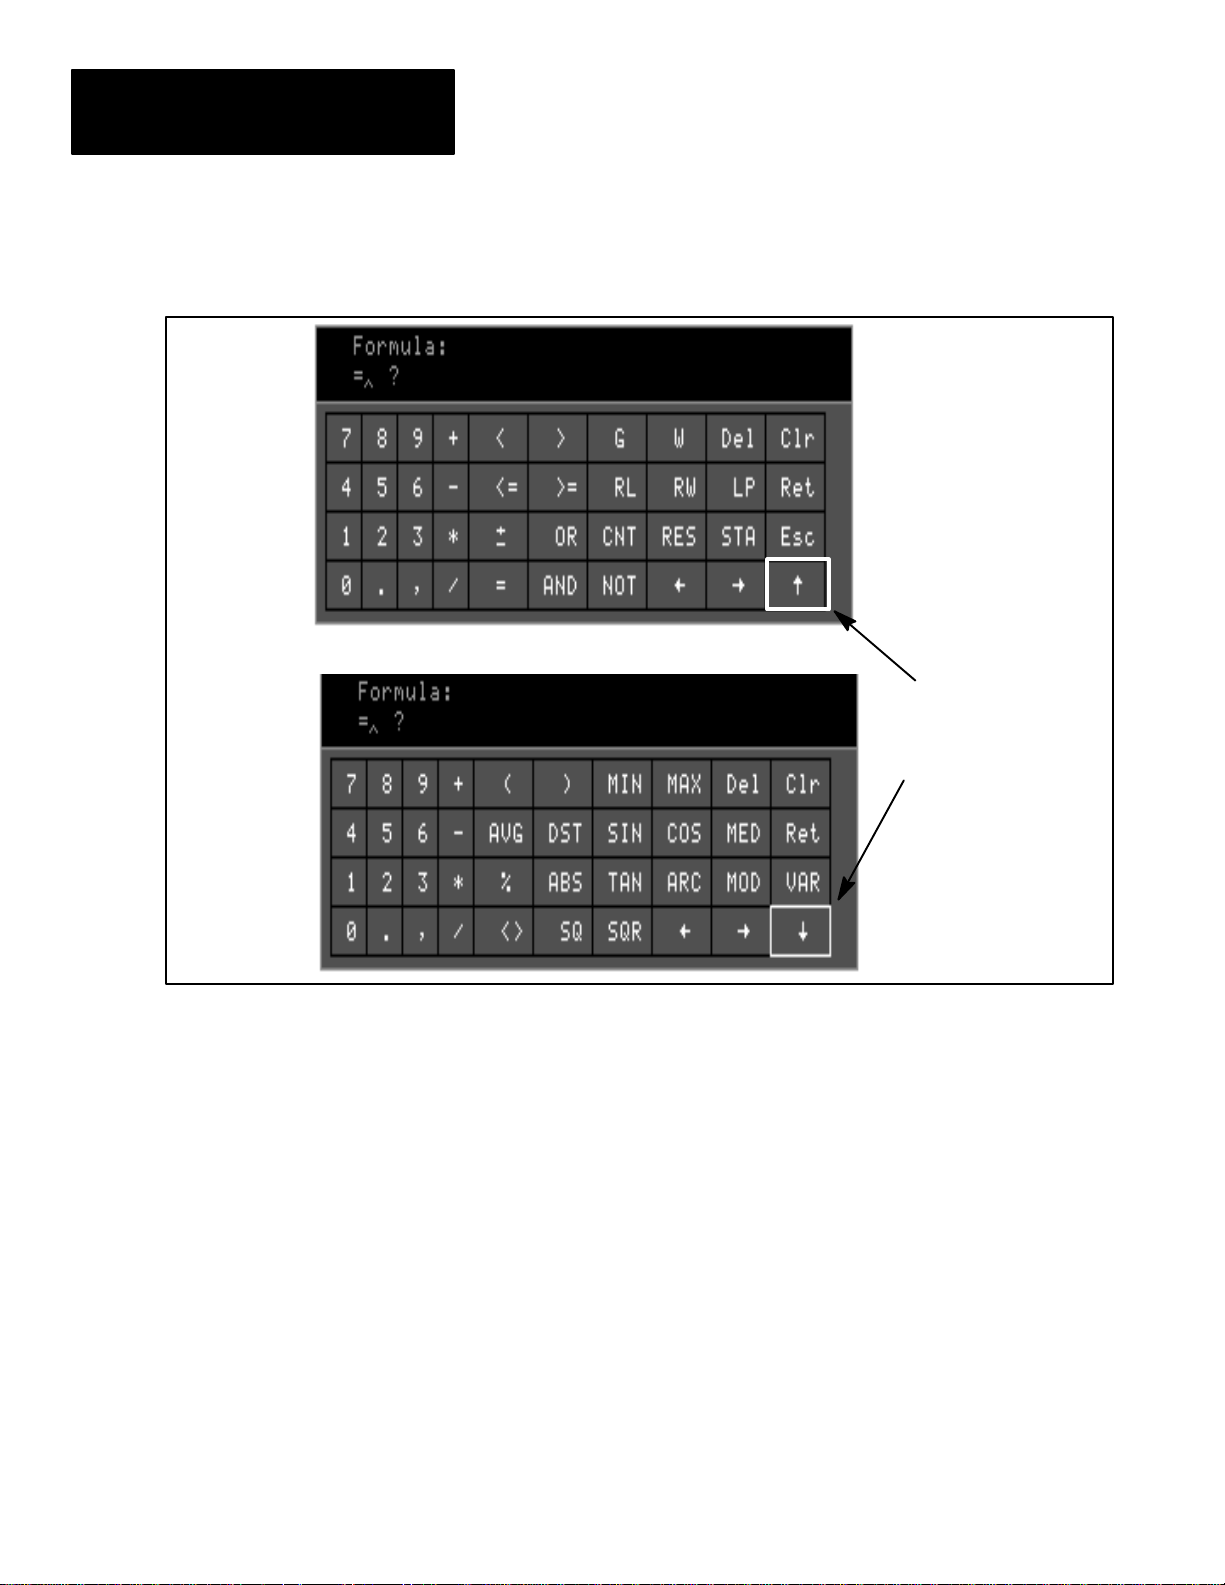
Accessing the two key sets: The formula entry keyboard actually has two
different key sets, in order to accommodate all of the formula elements. You
can easily switch between the two key sets as necessary (see Figure 4.4).
4–5
Page 21
Chapter 4
Defining Formulas
Figure 4.4 Switching between the two key sets of the formula entry keyboard
Initial
key set
Secondary
key set
Picking the up or down
arrow key switches
between the two key
sets
To switch between key sets, use the ↑ and ↓ arrow keys (see Figure 4.4):
• Pick the up (↑) arrow key to switch from the initial key set to the
secondary key set.
• Pick the down (↓) arrow key to switch back to the initial key set.
The initial key set contains all of the available operand keys, along with
various operator keys, the numeric keys, and the edit/control keys. Each of
these key types is discussed in later sections in this chapter.
4–6
The secondary key set offers additional operator types, replacing the initial
operands and some of the operators. It retains some of the initial keys,
including the numeric keys, the arithmetic keys, and the edit/control keys.
Page 22
Formula is displayed
Chapter 4
Defining Formulas
Using the Formula Entry Keyboard
To define a formula, you would generally follow the steps listed below:
• Pick Set Formula on the Config. Results menu to access the formula
entry keyboard (see Figure 4.3, page 4–5).
• Enter your formula – Pick the keys on the keyboard which correspond to
the operators, operands, and other items (decimal points, commas,
parentheses) you are using in the formula. As you pick your formula
entries, they appear in the keyboard display:
A cursor indicates the point at which the next component entered will
appear.
• You can edit the formula as you enter it, using these edit keys:
← → Pick the arrows keys (← or→) to move the cursor to the left or right
along the formula, in order to insert a component at a particular point in a
formula, or to prepare to delete a particular component.
Del Pick the Del(ete) key to erase the entry to the left of the cursor.
Clr Pick the Clr (clear) key to erase the entire formula.
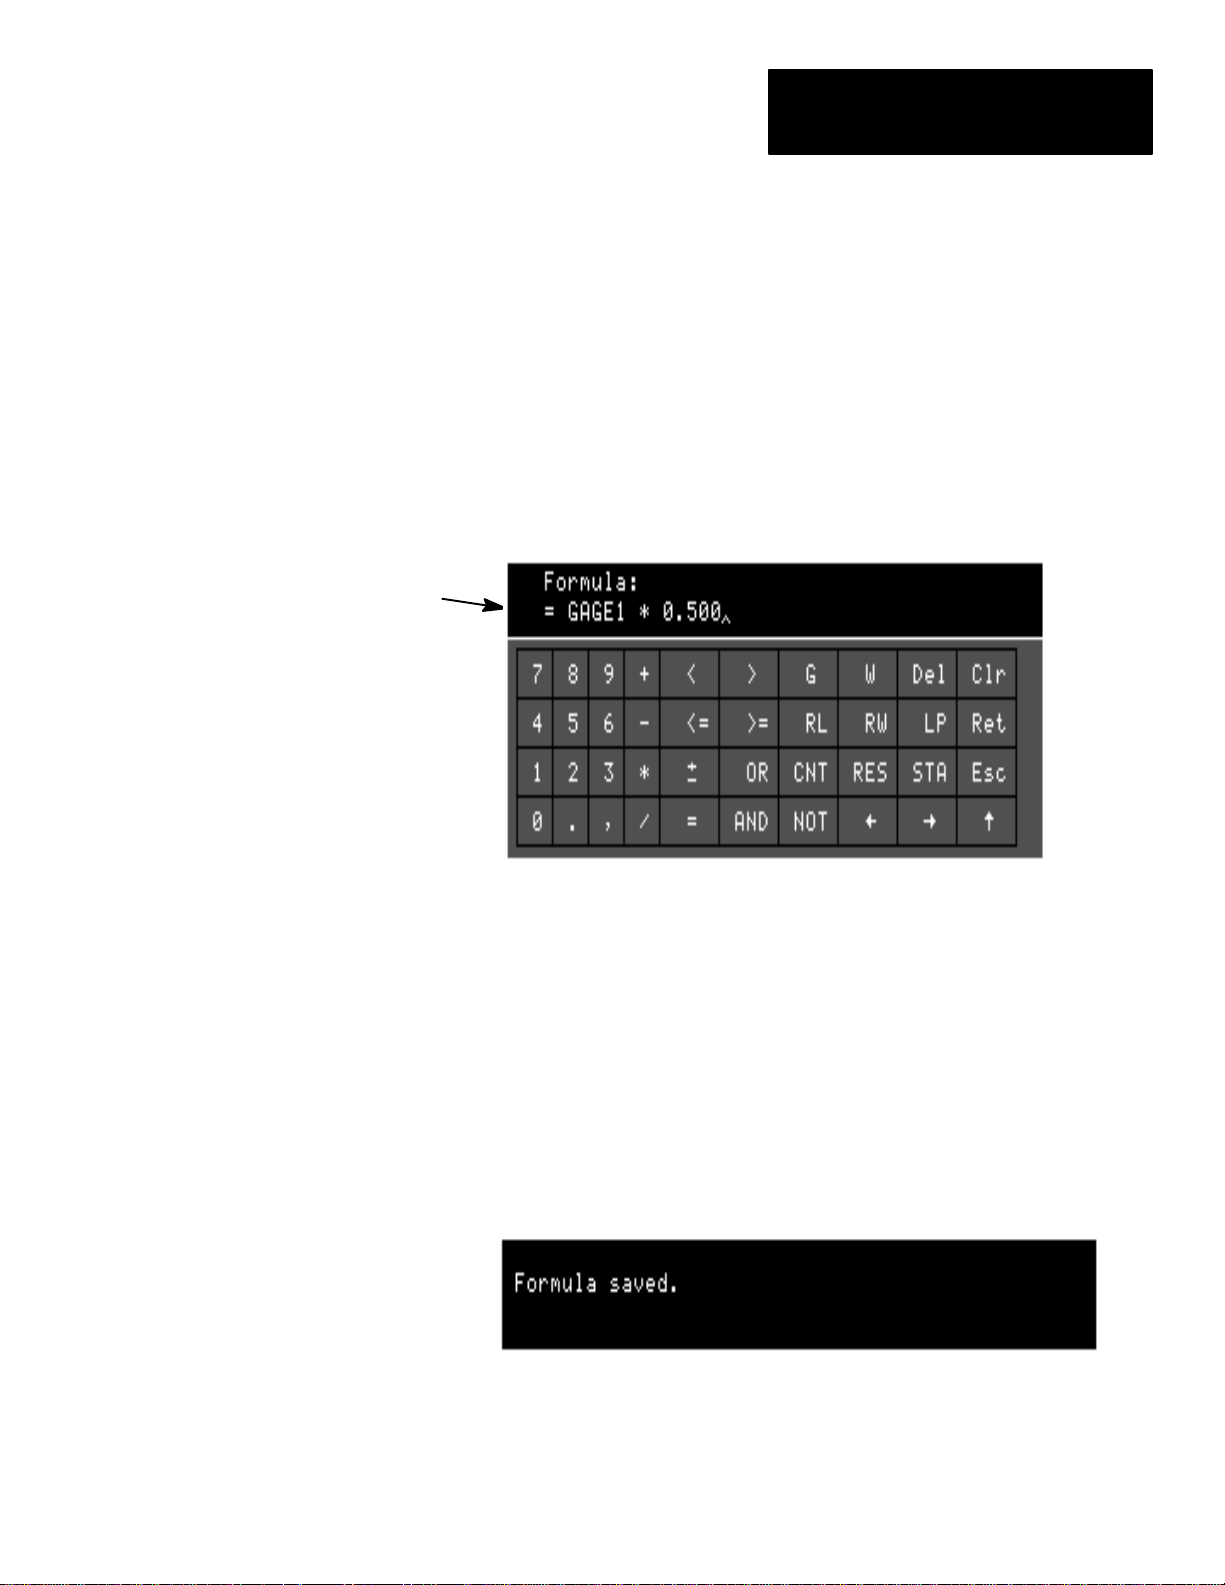
• When finished, you can pick the Ret key to save a formula, or pick the
Esc key, to restore the formula content to what it was when last saved.
When you pick the Ret key, the formula is saved, and a message appears:
You can continue to edit the formula after picking the Ret key – however,
to save the changed formula, you must pick the Ret key when finished.
Saving the formula also enables the Set Name and Formula #:
Disabled boxes on the Config. Results menu, which allow you to
enable and name the formula.
4–7
Page 23
Chapter 4
Defining Formulas
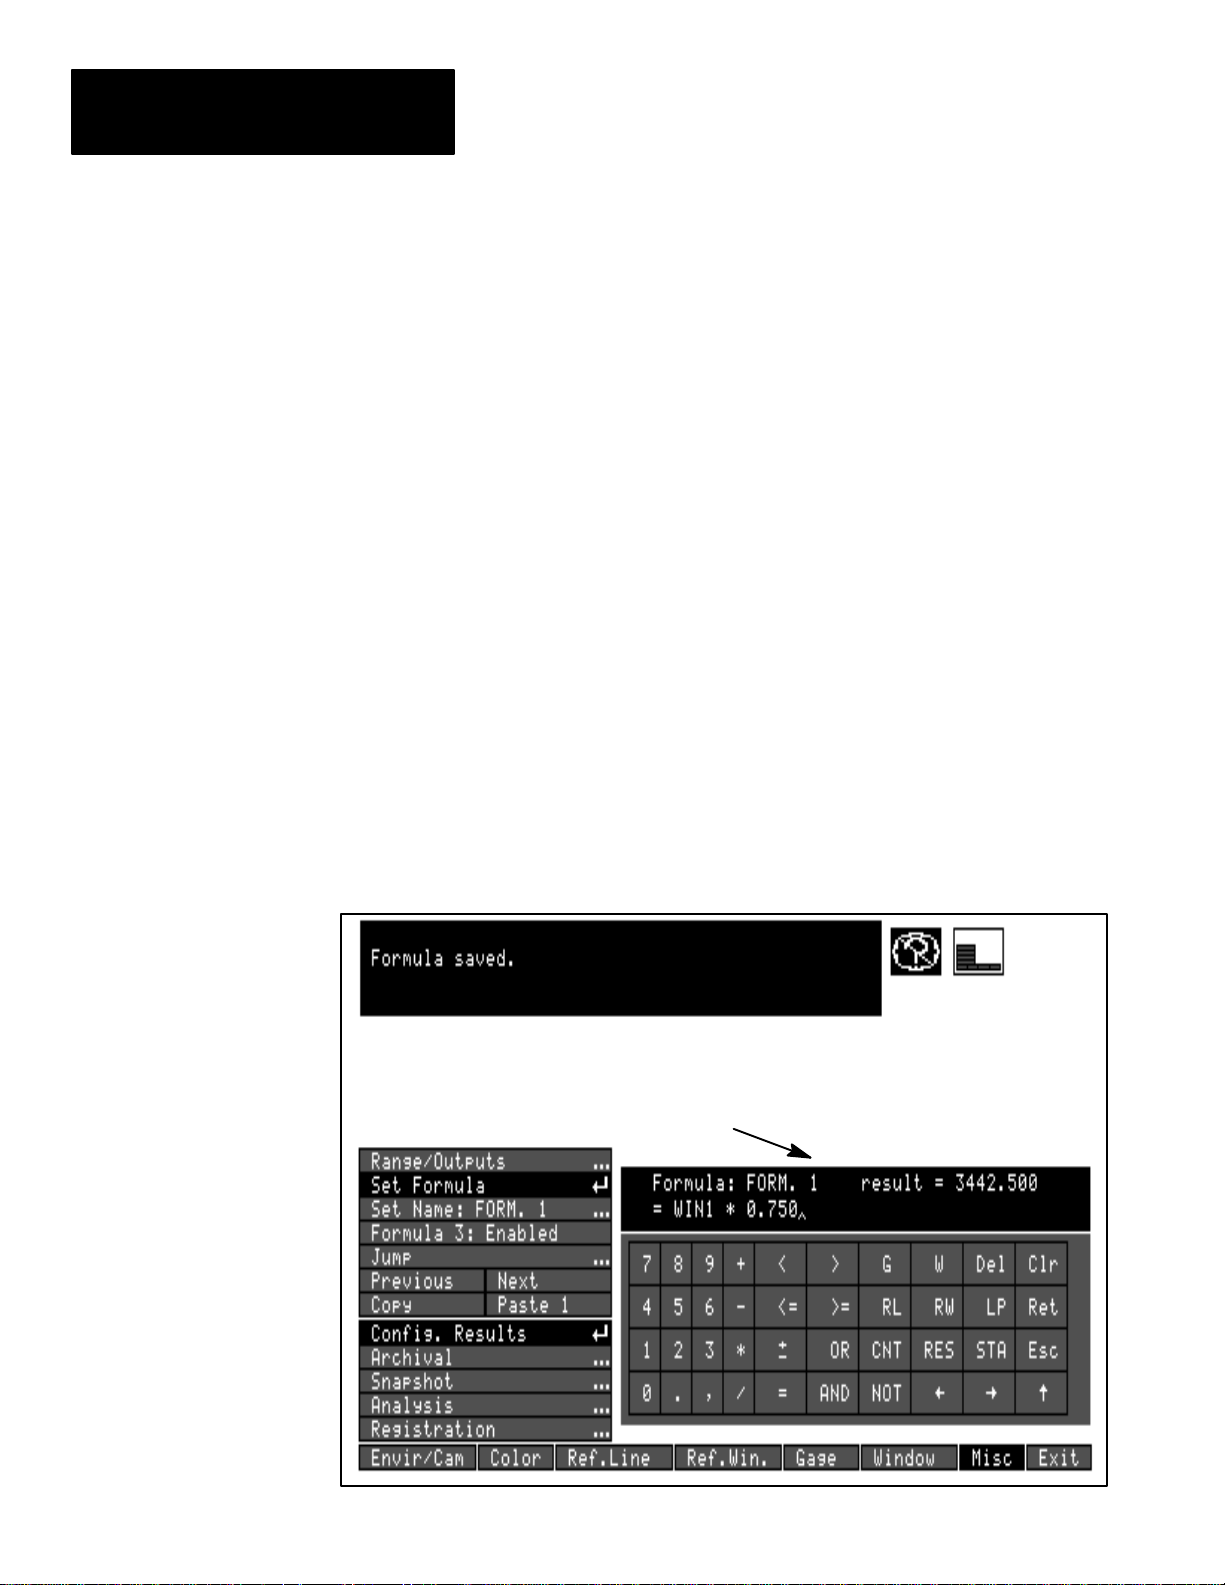
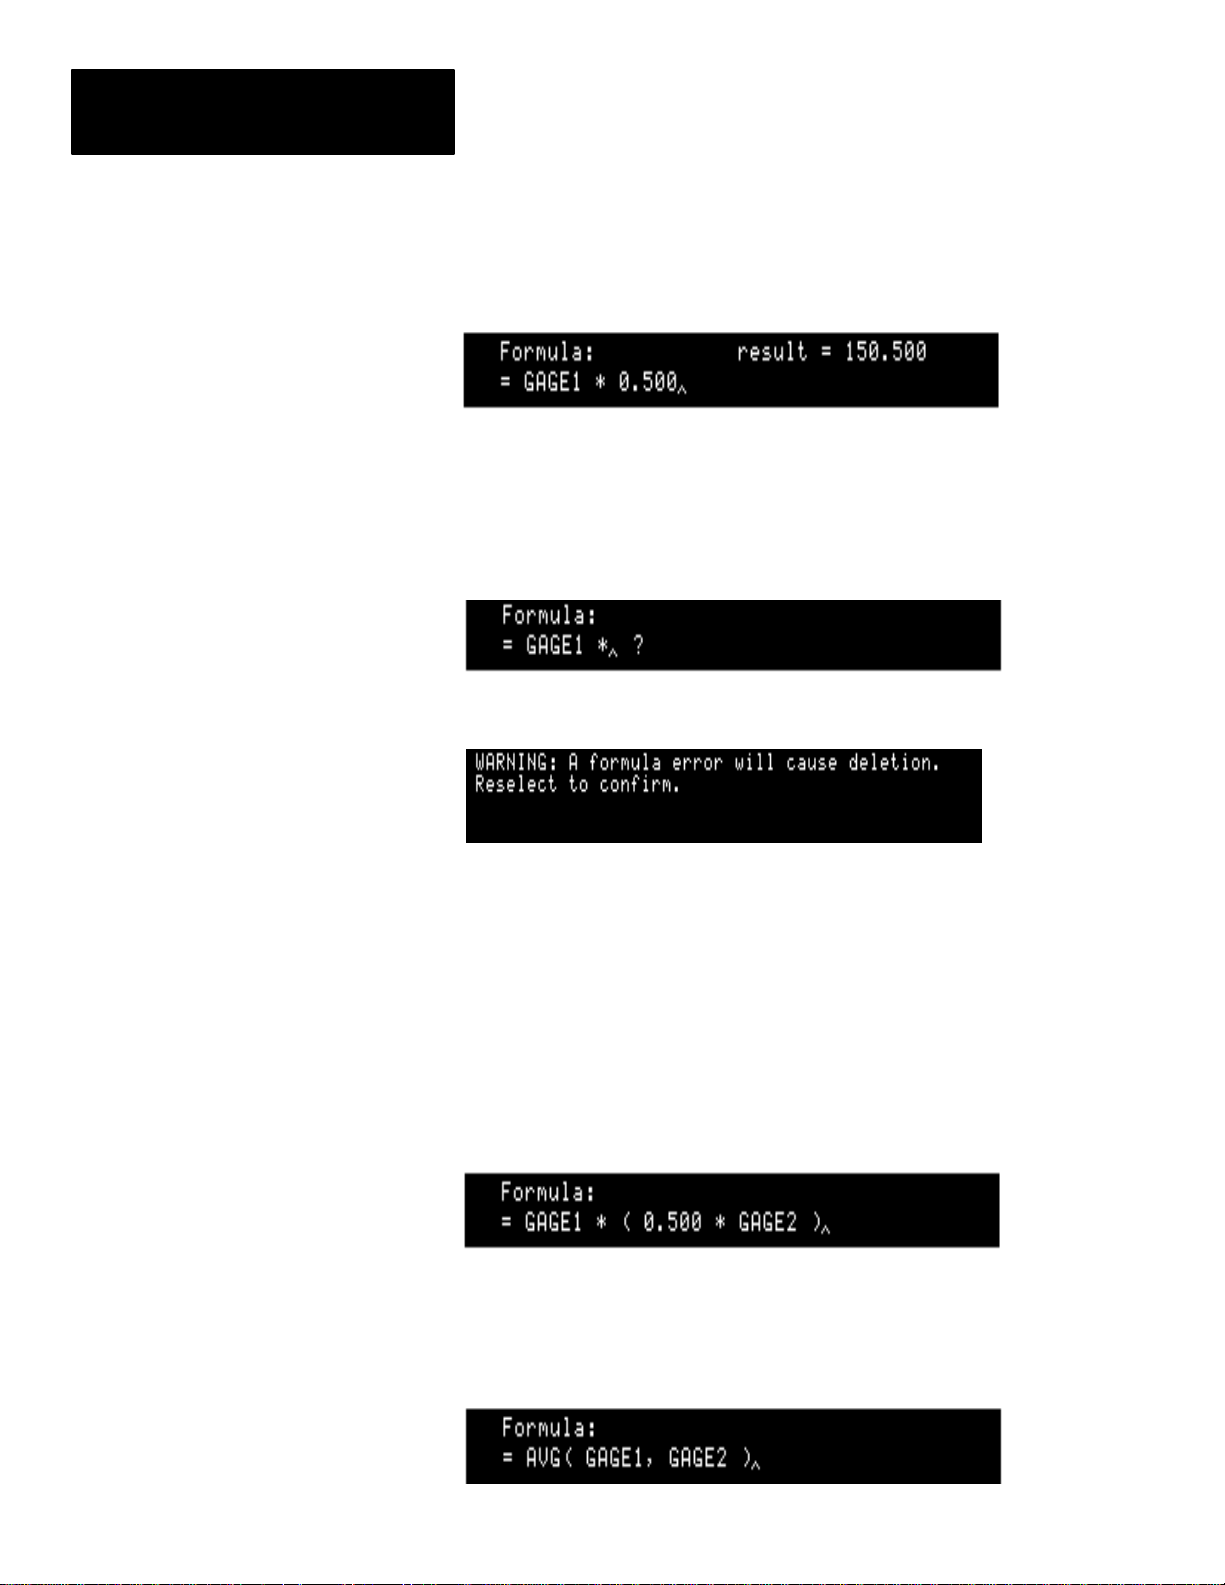
Results Display: When you pick the Ret key, and the formula is saved,
the current result of the formula is listed in the keyboard display area:
The result format is either integer, or fixed decimal point, depending on
the requirements of the operator(s) and/or operand(s) in the formula.
Question mark (?) – incorrect syntax: The question mark (?) in the
display, when present during formula entry, indicates that the formula is
incomplete as entered, and/or that the syntax for one or more of the
formula components is incorrect:
If you pick the Ret key while a (?) appears in the display, this warning
message appears at the top of the screen:
To avoid losing your current formula entry, pick any key besides the Ret
key (other than Clr or Esc). Otherwise, picking the Ret key at this point
will clear the formula entry.
• Using parentheses in formulas: Parentheses can be used when entering
formulas, in two different ways –
Prioritizing operations – You can place parentheses around an operator
and its operands in order to prioritize that operation – that is, the
operation in parentheses can be used as an operand by another operator.
“Nesting” of operations within a formula can be employed, where a
parenthetical portion is itself contained within another parenthetical
portion of the formula.
4–8
Listing operands – Some operators require that you enter one or more
operands in a parenthetical list following the operator. In these cases,
when you pick the operator, the “open” parenthesis is displayed. After
you list the operand or operands (separated by commas), you then enter
the “close” parenthesis.
Page 24
Example Formula Entry
Chapter 4
Defining Formulas
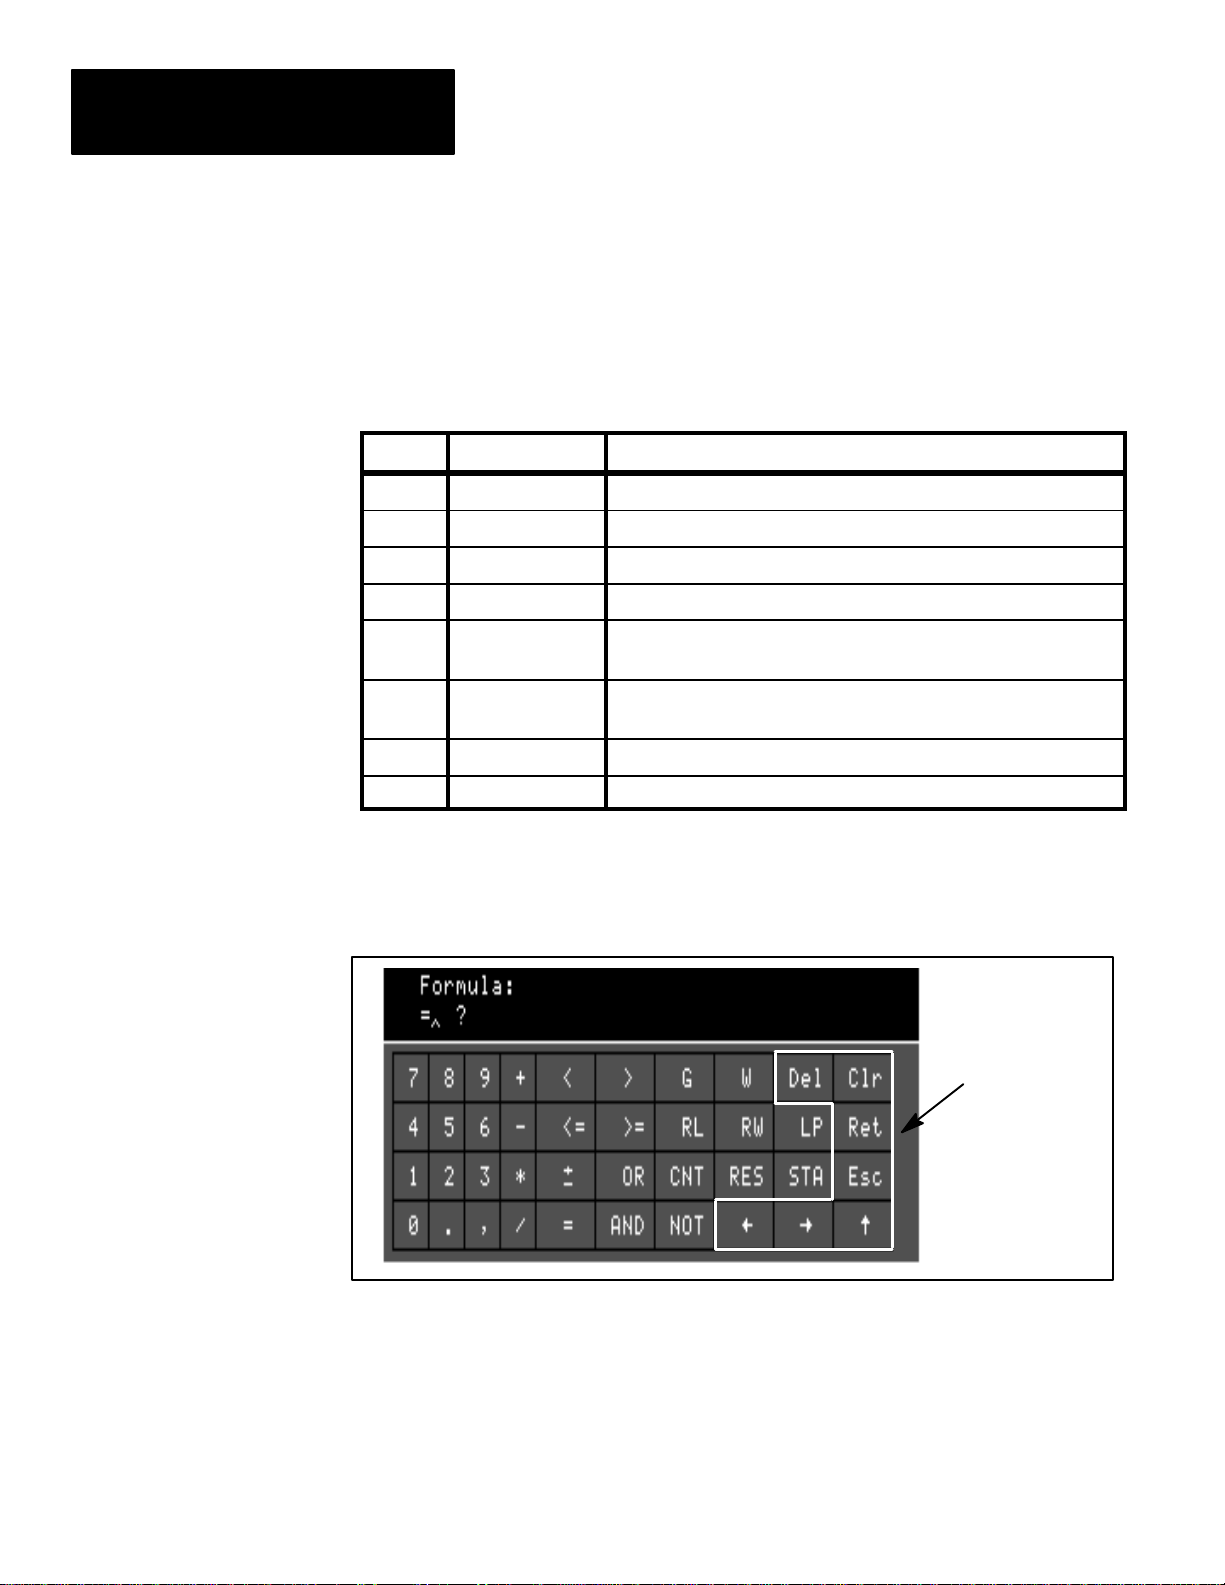
To enter this formula:
AVG (GAGE1,GAGE2) * 0.250
• Select an undefined formula (see “Selecting a Formula” in this chapter),
and pick the Set formula box to access the formula entry keyboard.
• Pick the AVG key on the formula entry keyboard (located on the
secondary key set). The formula keyboard display shows:
Formula:
Cursor
= AVG( ?
The “?” indicates the formula is incomplete to this point; the cursor
indicates the point at which the next component will be entered.
• Pick G (on the initial key set), to begin to enter the GAGE1 operand:
Formula:
= AVG( GAGE0 ?
• Pick 1, to complete the entry of the GAGE1 operand:
Formula:
= AVG( GAGE1 ?
• Pick “ , ” (comma) , then G, then 2:
Formula:
= AVG( GAGE1, GAGE2 ?
• Pick “ ) ” (close parenthesis) on the secondary key set. The formula is
now correct in syntax at this point; the “?” disappears:
Formula:
= AVG( GAGE1, GAGE2 )
• Pick “
Pick the Ret key to save the formula; a result is displayed:
” , then “.” (decimal point), then 2, then 5:
*
Formula:
= AVG( GAGE1, GAGE2 ) * 0.25
Formula: result: 602.000
= AVG( GAGE1, GAGE2 ) * 0.250
4–9
Page 25
Chapter 4
Defining Formulas
Edit / Control Keys
You can edit the contents of a formula, using the edit/control keys, which are
listed and described in Table 4.B.
Table 4.B
Edit / Control Keys
Key
Del Delete Deletes the formula item to the left of the cursor.
Clr Clear Clears the entire formula.
Ret Return Causes the formula to be saved in memory.
Esc Escape Restores the formula to its condition when last saved.
←
→
↓
↑
Name Edit / Control Function
Left arrow
Right arrow
Down arrow Selects the second keyboard from the first keyboard.
Up arrow Selects the first keyboard from the second keyboard.
Moves the cursor to the left. Picking and holding the light
pen tip down moves the cursor continuously left.
Moves the cursor to the right. Picking and holding the
light pen tip down moves the cursor continuously right.
All of the edit/control keys can be found on either of the two key sets
(Figure 4.5 shows key locations).
Figure 4.5 Edit/control keys
4–10
Edit/control
keys
To edit a formula:
← → Pick the arrows keys (← or→) to move the cursor to the left or right
along the formula, in order to insert a component at a particular point in a
formula, or to prepare to delete a particular component.
Del Pick the Del(ete) key to erase the entry to the left of the cursor.
Clr Pick the Clr (clear) key to erase the entire formula.
Page 26
Chapter 4
Defining Formulas
After editing a formula, pick either Ret or Esc:
Ret Pick the Ret key to save the formula as edited.
Esc Pick the Esc key to restore the formula to the way it was when last saved.
Example of Formula Editing
To edit this formula:
and change it to: AVG (GAGE1,GAGE3) * 1.250
AVG (GAGE1,GAGE2) * 0.250
• Pick the arrows keys (← or→) as necessary to move the cursor to the
right of the
Formula:
= AVG( GAGE1, GAGE2 ) * 0.250
GAGE2 operand:
• Pick the Del key to erase the GAGE2 operand:
Formula:
= AVG( GAGE1, ? ) * 0.250
• Pick G, then 3:
Formula:
= AVG( GAGE1, GAGE3 ) * 0.250
• Move the cursor to the right of the 0.250 operand:
Formula:
= AVG( GAGE1, GAGE3 ) * 0.250
• Pick the Del key; notice the entire 0.250 operand is erased:
Formula:
= AVG( GAGE1, GAGE3 ) * ?
• Pick 1, then “.” (decimal point), then 2, then 5:
Formula:
= AVG( GAGE1, GAGE3 ) * 1.25
After editing the formula, you can pick either Ret or Esc. Pick the Ret
key to save the formula as edited. Pick the Esc key to restore the formula
to the way it was when last saved.
4–11
Page 27
Chapter 4
Defining Formulas
Operands
With respect to MATH-PAK formulas, an operand is a symbol (such as
GAGE1 or WINDOW3.2 or 32.45) that represents a mathematical or
logical value. Operands represent such values as tool results, statistics,
constants, or formula results (see Table 4.C, starting on page 4–14, for
operand listings and descriptions).
Figure 4.6 Operand keys
Initial
key set
Operand keys
To enter a particular operand in a formula:
• Pick the appropriate operand key on the formula entry keyboard – the
corresponding operand symbol appears in the display area of the
keyboard (see Figure 4.6).
• Typically you must then pick additional keys (decimal point and/or
numeric keys) to complete the operand entry.
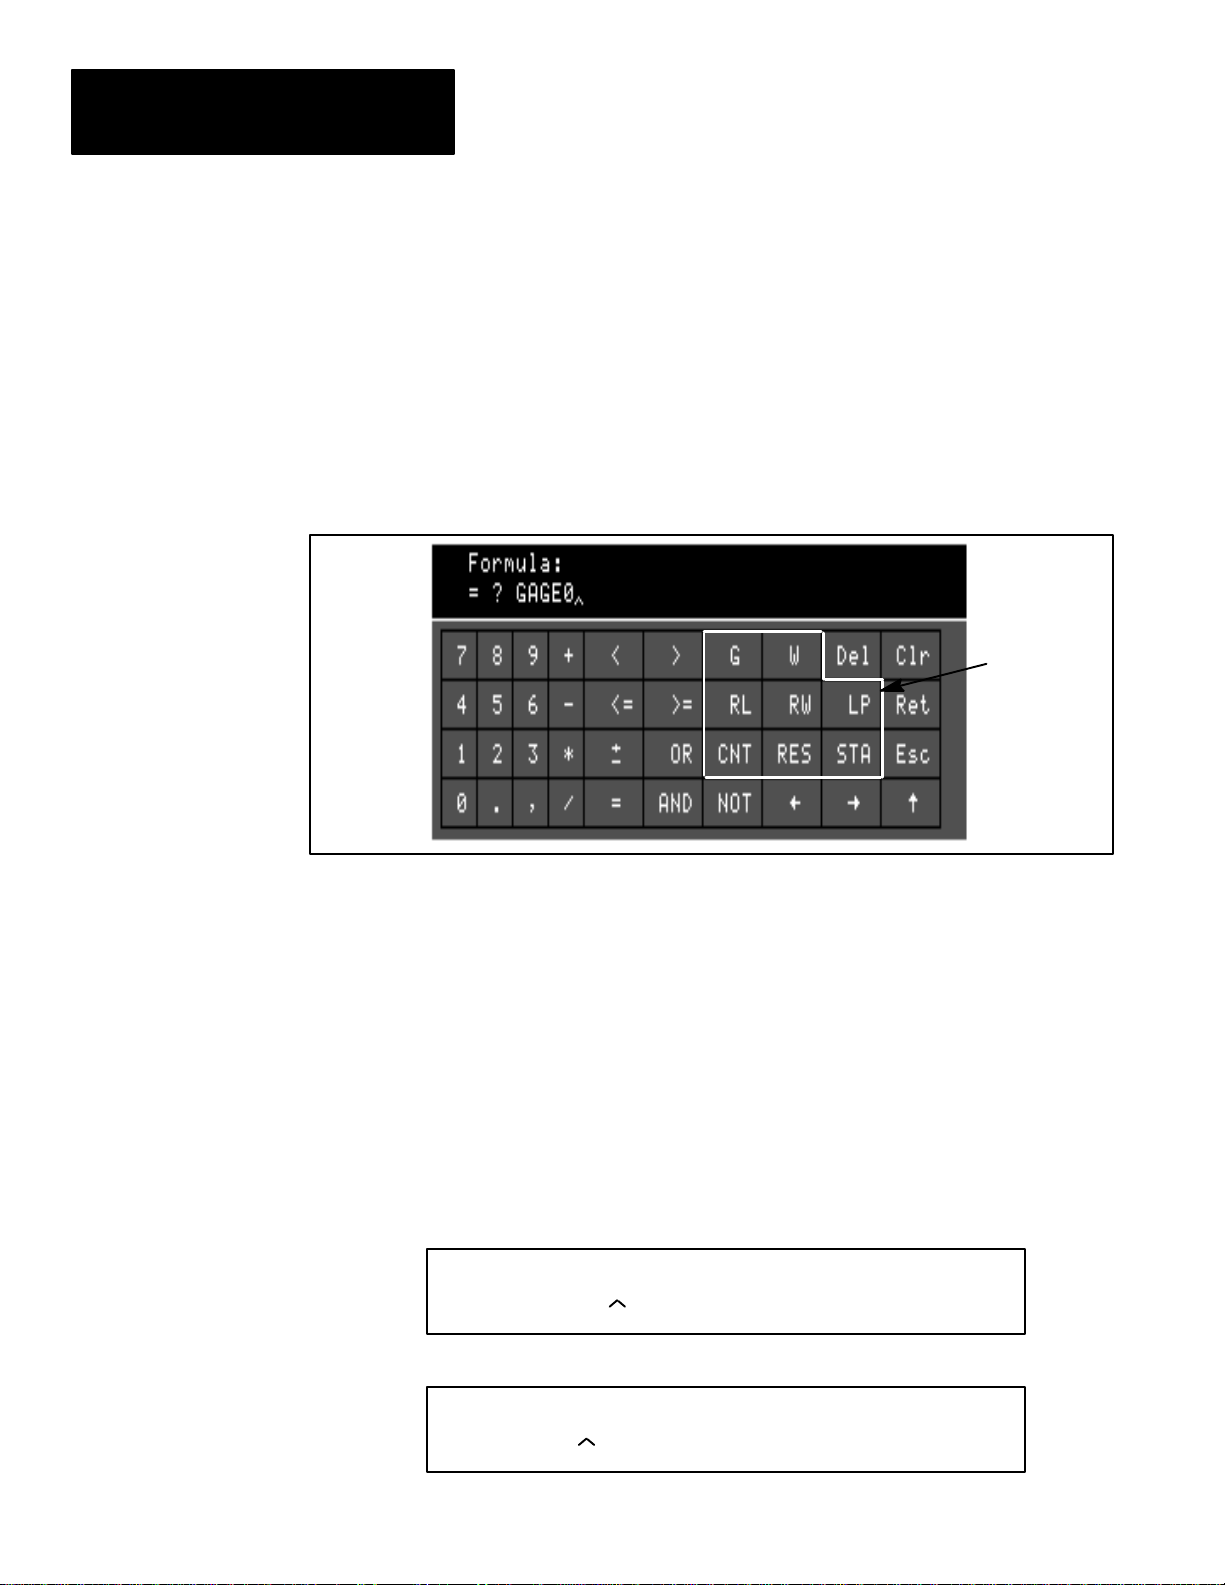
For example, to enter the operand for gage 5 numerical results (number of
pixels, number of edges, and so on), enter the operand
GAGE5, as follows:
• Pick G on the formula entry keyboard – this will initially display the
operand
GAGE0 in the formula display area:
4–12
Formula:
= ? GAGE0
• Pick 5 – this will change the operand to GAGE5.
Formula:
= GAGE5
Page 28

Chapter 4
Defining Formulas
Using a sub-code: The operands can be defined so as to provide any of a
number of different types of results data. You do this by including a
sub-code – a decimal point and a number (refer to Table 4.C, page 4–14, for
the definitions of the valid sub-codes).
For example, to specify the pass/fail results from gage 5, in the example
above, you would enter the operand
GAGE5.2:
• Pick G on the formula entry keyboard – this will initially display the
operand
GAGE0 in the formula display area:
Formula:
= ? GAGE0
• Pick 5, then “.” (decimal point), then 2 – this will change the operand to
GAGE5.2.
Formula:
= GAGE5.2
You can see in Table 4.C, page 4–14, that the “.2” sub-code definition is
“Pass/fail condition for fault range (1 = pass, 0 = fail).” During inspections, then,
if gage 5 were to fail, the value 0 would be entered for the
operand. Conversely, if gage 5 passes, the value of 1 is entered.
Listing operands: Some operators require that you enter one or more
operands in a parenthetical list following the operator. In these cases, when
you pick the operator, the “open” parenthesis is displayed. After you list the
operands (separated by commas), you then enter the “close” parenthesis.
For example, to average the results from gages 1 and 2, enter the formula:
Gage5.2
AVG( GAGE1, GAGE2)
• Pick the AVG key on the formula entry keyboard (located on the
secondary key set). The formula keyboard display shows:
Formula:
= AVG( ?
• Pick G (on the initial key set), then 1, then “,” (comma), then G, then 2.
Formula:
= AVG( GAGE1, GAGE2 ?
• Pick “ ) ” (close parenthesis) on the secondary key set. The formula is
now correct in syntax at this point; the “?” disappears.
4–13
Page 29

Chapter 4
Defining Formulas
Table 4.C (part 1 of 3)
Operand Definitions
Key
Operand
Type
CNT Counter
G Gage
W Window
*Operand Symbol *Sub-code (s) Type of Data Returned to Formula
CNT.s
(s = 0 to 2)
GAGEn.s
(n = 1 to 64)
(s = 0 to 9)
WINn.s
(n = 1 to 48)
(s = 0 to 19)
.9
.10
.11
.12
.13
.14
.15
.16
.17
.18
.19
.0
.1
.2
.0
.1
.2
.3
.4
.5
.6
.7
.8
.9
.0
.1
.2
.3
.4
.5
.6
.7
.8
1,2
1,2
1,2
1,2
1,2
1,2
1,2
1,2
1,2
1,2
1,2
Total number of triggers.
Number of missed triggers.
Number of master range faults.
Gage measurement value (# of pixels, # of edges, etc.).
Pass/fail condition for warning range (1 = pass, 0 = fail).
Pass/fail condition for fault range (1 = pass, 0 = fail).
Second coordinate value (Y coordinate for X Position gage;
X coordinate for Y Position gage).
Number of faults detected.
Nominal value.
Fault range high.
Fault range low.
Warning range high.
Warning range low.
Window measurement value (# of pixels, # of objects, etc.).
Pass/fail condition for warning range (1 = pass, 0 = fail).
Pass/fail condition for fault range (1 = pass, 0 = fail).
Number of faults detected.
Nominal value.
Fault range high.
Fault range low.
Warning range high.
Warning range low.
Total number of objects counted before target filtering.
Perimeter value of first counted object.
Area value of first counted object.
X center value of first counted object.
Y center value of first counted object.
Inertial value of first counted object.
Theta value of first counted object.
Min radius value of first counted object.
Max radius value of first counted object.
H size value of first counted object.
L size value of first counted object.
*The letter n = tool or formula number (as appropriate). The letter s = operand subcode.
1
Window sub-codes 9-19 pertain to the object–counting operation only. The “first counted object” is the object which, among those that satisfy the filter
parameters, is closest to the upper-left corner of the window.
2
If a filter parameter is not enabled for the window, a result of –1000 is returned for that parameter.
4–14
Page 30

Table 4.C (part 2 of 3)
Operand Definitions
Chapter 4
Defining Formulas
Key
Operand
Type
RL Ref. Line
RW Ref.
Window
*Operand Symbol *Sub-code (s) Type of Data Returned to Formula
REFLn.s
(n = 1 to 3)
(s = 0 to 3)
.0
.1
.2
.3
X coordinate value of edge position on reference line.
Y coordinate value of edge position on reference line.
Pass/fail condition for reference line (1 = pass, 0 = fail).
Theta from a reference line configured for “X–X then Y” or
“Y–Y then X” rotation compensation.
REFWn.s
(n = 1 to 3)
(s = 0 to 16)
.4
.0
.1
.2
.3
.4
.5
.6
.7
.8
.9
.10
.11
.12
.13
.14
.15
.16
Number of faults detected.
Cumulative position: X coordinate value.
Cumulative position: Y coordinate value.
Cumulative angle (θ).
Cumulative pass/fail condition (1 = pass, 0 = fail).
Active feature #1 position: X coordinate value.
Active feature #1 position: Y coordinate value.
Active feature #1 score value.
Active feature #1 pass/fail condition (1 = pass, 0 = fail).
Active feature #2 position: X coordinate value.
Active feature #2 position: Y coordinate value.
Active feature #2 score value.
Active feature #2 pass/fail condition (1 = pass, 0 = fail).
Active feature #3 position: X coordinate value.
Active feature #3 position: Y coordinate value.
Active feature #3 score value.
Active feature #3 pass/fail condition (1 = pass, 0 = fail).
Number of faults detected.
.0
.1
LP Light
Probe
LPRB.s
(s = 0 to 20)
.2
.3
.4
.5
.6
.7
.8
.9
.10
.11
.12
.13
.14
.15
.16
.17
.18
.19
.20
*The letter n = tool or formula number (as appropriate). The letter s = operand sub-code.
Light probe brightness value for red channel.
Light probe brightness value for green channel.
Light probe brightness value for blue channel.
Pass/fail condition for warning range (1 = pass, 0 = fail).
Pass/fail condition for fault range (1 = pass, 0 = fail).
Number of faults detected.
Nominal value for red channel.
Fault range high for red channel.
Fault range low for red channel.
Warning range high for red channel.
Warning range low for red channel.
Nominal value for green channel.
Fault range high for green channel.
Fault range low for green channel.
Warning range high for green channel.
Warning range low for green channel.
Nominal value for blue channel.
Fault range high for blue channel.
Fault range low for blue channel.
Warning range high for blue channel.
Warning range low for blue channel.
4–15
Page 31

Chapter 4
Defining Formulas
Table 4.C (part 3 of 3)
Operand Definitions
Key
RES Formula
STA Statistics
*The letter n = tool or formula number (as appropriate). The letter s = operand sub-code.
1
The n values 1-56 can refer to either tools or formulas. If the formula corresponding to the selected n number is enabled, the formula statistics are supplied;
otherwise, the corresponding tool results are supplied. Refer to Table 4.A, page 4–3, for a listing of the formulas and corresponding tools.
2
Statistics are available only if the Color CVIM module is run in “learn” mode.
Operand
Type
Result
*Operand Symbol *Sub-code (s) Type of Data Returned to Formula
RSLTn.s
(n = 1 to 56)
(s = 0 to 2)
STATn.s
(n = 1 to 112)
(s = 0 to 4)
1,2
.0
.1
.2
.0
.1
.2
.3
.4
Formula (n) results data value.
Pass/fail condition for warning range (1 = pass, 0 = fail).
Pass/fail condition for fault range (1 = pass, 0 = fail).
Formula/tool (n) statistics: Number of samples taken.
Formula/tool (n) statistics: Minimum reading value.
Formula/tool (n) statistics: Maximum reading value.
Formula/tool (n) statistics: Mean value.
Formula/tool (n) statistics: Standard deviation value.
Entering Constants as Operands
You can, of course, enter constant values, in either integer or fixed point
(decimal) format, to act as operands in a formula, if appropriate. To do this,
use the numeric keys (0–9), and the decimal point (.) key (for fixed point
numbers) which are found on both of the two key sets (see Figure 4.4, page
4–6).
4–16
For example, to enter the constant operand 1.25:
• Pick 1, then “.” (decimal point), then 2, then 5:
Formula:
= 1.25 ?
Here are some additional considerations when entering constant values:
Integer range: Integer values entered must be within the range –32767 to
32767. Values outside this range are not accepted into the formula.
Fixed point (decimal) range: Fixed point decimal values entered must be
within the range –32767.999 to 32767.999. Values outside this range are not
accepted into the formula.
Fixed point operands are always listed with 3 decimal places – trailing 0’s
are added if necessary, or, if more than 3 decimal places are entered, the
value is truncated to three decimal places.
Negative values: Negative values are created by placing the Unary minus
(
±) operator to the immediate left of the positive constant entered.
Page 32

Chapter 4
Defining Formulas
Operators
With respect to MATH-PAK formulas, an operator is a symbol (such as “+”
or “–”) or term (such as “AND” or “AVG”) that represents a mathematical or
logical operation that is to be performed. Table 4.D, starting on page 4–18,
lists the operator keys, and describes the corresponding operators.
To enter a particular operator in the formula:
• Pick the appropriate operator key on the formula entry keyboard – when
you pick an operator key, the corresponding operator symbol appears in
the display area of the keyboard (see Figure 4.7).
Note: Additional operators are located on the secondary key set, which is
accessed by picking the ↑ key on the initial key set.
Figure 4.7 Operator keys (initial key set)
Initial
key set
Operator
keys
Prioritizing operations: Place parentheses around an operator and its
operand(s) in order to prioritize that operation – that is, the result of the
operation(s) in parentheses can be used as an operand by another operator.
“Nesting” is possible, too – this allows a parenthetical portion of a
formula to be contained within another parenthetical portion.
ARC TAN ((GAGE2 – GAGE3) / (GAGE2.3 – GAGE4))
Listing operands: Some operators require that you enter one or more
operands in a parenthetical list following the operator. In these cases,
when you pick the operator, the “open” parenthesis is displayed along
with the operator. After you list the operands (separated by commas), you
then enter the “close” parenthesis.
AVG( GAGE1, GAGE2 )
4–17
Page 33

Chapter 4
Defining Formulas
Table 4.D (part 1 of 2)
Operator Definitions
Key / Symbol
Operator Type
*Result
Type
Operator Usage
Format
Operator Function
Mathematical
+ Add INT/FP X +Y Adds the right operand to the left operand.
– Subtract INT/FP X – Y Subtracts the right operand from the left operand.
*
Multiply INT/FP
X * Y
Multiplies the left operand by the right operand.
/ Divide INT/FP X / Y Divides the left operand by the right operand.
±
Unary minus INT/FP
± X
% Modulo INT/FP X % Y
ABS Absolute value INT/FP ABS(X)
When placed to the immediate left of an operand, it
negates the numeric value of the operand.
Produces the whole number remainder of the division
of the left operand by the right operand.
Produces the absolute value of the listed operand
(negates the value if it is negative).
SQ Square INT/FP SQ(X) Computes the square of the listed operand.
SQR Square root FP SQR(X) Computes the square root of the listed operand.
Computes distance from a point A to a point B – given
DST Distance FP
DST(X1,Y1,
X
2,Y2)
SIN Sine FP SIN(X)
four listed coordinate operands X
computing the square root of the sum of the squared
differences (X
and Y2–Y1).
2–X1
Computes the sine of a listed operand (angle –
assumed in degrees). Returns a fixed point number.
, Y1, X2, and Y
1
2
– by
COS Cosine FP COS(X)
TAN Tangent FP TAN(X)
Arc (prefix to
ARC
SIN, COS, or
FP
TAN)
Logical
AND Logical AND INT/FP X AND Y
OR Logical OR INT/FP X OR Y
NOT Logical NOT INT/FP NOT X
*INT=integer format. FP = fixed point (decimal) format
4–18
SIN
ARC COS (X)
TAN
Computes the cosine of a listed operand (angle –
assumed in degrees). Returns a fixed point number.
Computes the tangent of a listed operand (angle –
assumed in degrees). Returns a fixed point number.
ARC combines with SIN, COS, or TAN function, to
create the respective inverse function – arcsine,
arccosine, or arctangent. These inverse functions
produce an angular result (in degrees).
Produces a “1” result if both the left and right operands
are nonzero; otherwise, produces a “0” result.
Produces a “1” result if either the left or right operand
is nonzero; otherwise, produces a “0” result.
Used to invert a logical value – Produces a “0” result if
the operand is nonzero; produces a “1” result if
operand is 0.
Page 34

Table 4.D (part 2 of 2)
Operator Definitions
Chapter 4
Defining Formulas
Key / Symbol
Operator Type
*Result
Type
Operator Usage
Format
Operator Function
Statistical
AVG Average INT/FP AVG(X, Y, ...) Computes the average of a list of operands.
MAX Maximum INT/FP MAX(X, Y, ...) Finds the maximum numeric value among operands.
Finds the middle numeric value in a list of operands by
MED Median INT/FP MED(X, Y, ...)
sorting the list in ascending order and returning the
value located at the center position in the sorted list.
MIN Minimum INT/FP MIN(X, Y , ...) Finds the minimum numeric value in a list of operands.
MOD Mode INT/FP MOD(X, Y, ...)
Finds the listed value that appears most often. If no
value appears more than once, finds the lowest value.
Computes the variance of a list of operands. The
VAR Variance FP VAR(X, Y, ...)
variance is the sum of the square of the difference
between each operand and the average value of the
operands, divided by the number of operands.
Conditional
= Equal INT/FP X = Y
〈 〉
Not equal INT/FP
X 〈 〉 Y
Produces a “1” result if the left operand is equal to the
right operand; otherwise, produces a “0” result.
Produces a “1” result if the left operand is not equal to
the right operand; otherwise, produces a “0” result.
> Greater than INT/FP X > Y
< Less than INT/FP X < Y
>=
<=
Greater than or
equal
Less than or
equal
INT/FP X >= Y
INT/FP X <= Y
Other
. Decimal point –– ––
, Comma –– –– Used to separate the operands in a list of operands.
( Open –– –– Used with “)” to prioritize operations with a formula.
) Close –– ––
*INT=integer format. FP = fixed point (decimal) format
Produces a “1” result if the left operand is greater than
the right operand; otherwise, produces a “0” result.
Produces a “1” result if the left operand is less than the
right operand; otherwise, produces a “0” result.
Produces a “1” result if the left operand is greater than
or equal to the right operand; otherwise, produces a
“0” result.
Produces a “1” result if the left operand is less than or
equal to the right operand; otherwise, produces a “0”
result.
Used when entering a fixed point decimal value. Also
used in designating an operand sub-code.
Used with “(” to prioritize operations with a formula.
Also used to end operand listing for some operators.
4–19
Page 35

Chapter 4
Defining Formulas
Operator Execution Hierarchy
The order and priority of execution of the operations defined in a formula,
where multiple operators are used, follows that of general mathematical
rules. Operators of higher priority are executed first. In cases of equal
priority, the operators are executed from left to right.
For example, multiplication and division have higher priority than addition
or subtraction.
This formula would first divide the results of gage 2 by 3, and then add the
result to the gage 1 result:
Add operator
Divide operator
GAGE1 + GAGE2 / 3
Prioritizing operations: You can place parentheses around an operator and
its operands in order to prioritize that operation – that is, the result of the
operation in parentheses will be used as an operand by another operator.
This formula would first add the result of gage 1 and gage 2, and then divides
the result by 2:
Add operator
Divide operator
(GAGE1 + GAGE2) / 2
In defining formulas, as in general mathematical practice, it is best to use
parentheses in formulas where multiple operators are used, to ensure the
formula is executed as expected, rather than relying on priority rules.
Nesting operations within a formula: “Nesting” of operations within a
formula can be employed, where a parenthetical portion is itself contained
within another parenthetical portion of the formula.
4–20
The formula below would first add 2 to the result of gage 2, then multiply
this result by the gage 1 result, and then subtract 2 from the product:
Nested operation
(GAGE1 * (GAGE2 + 2)) – 2
Page 36

Chapter 4
Defining Formulas
Operator Usage
The MATH-PAK operators generally fall into one of four categories –
mathematical, statistical, logical, and conditional (refer to Table 4.D,
beginning on page 4–18, for a brief description of the operator types, which
are listed according to category). The operators are discussed in the
following sections, according to category.
Mathematical Operators
This section discusses the mathematical operators, which include the
arithmetic operators, trigonometric operators, inverse trigonometric
operators, and other operators.
Arithmetic operators: + – /
*
+ (addition) – Adds the two operands on either side of the “+”
– (subtraction) – Subtracts the operand on the right of the “–” from the
operand on the left.
/ (division) – Divides the operand on the left of the “/” by the
operand on the right.
* (multiplication) – Multiplies the two operands on either side of the “*”
Format / Usage: In general, enter and use the arithmetic operators in
formulas just as you would in writing an arithmetic equation – use two
operands with an operator, placing the arithmetic operator in the formula
between the two operands, as shown in the example below:
Multiply operator placed between two operands
GAGE1 * GAGE2
Arithmetic hierarchy of execution: In general, arithmetic operations are
executed from left to right, with multiplication and division operators
evaluated before either addition or subtraction, as in general practice.
Example usage: This formula averages the results from gages 1 and 2. The
formula first uses the add operator (+) to add the 2 gage operands (because
the parentheses prioritize the add operation), then uses the divide operator
( / ) to divide the result of the add operation by the constant, 2:
(GAGE1 + GAGE2) / 2
4–21
Page 37

Chapter 4
Defining Formulas
Subtraction example: The following formula uses the subtraction operator to
find the difference between two gage measurements:
GAGE2 – GAGE1
In this example, each of two gages is set to measure the X position of the
center of an object (see Figure 4.8). Two gages are used, because the objects
being measured are of different colors, so each of the two gages is assigned
the appropriate color. The above formula subtracts the gage 1 result from the
gage 2 result, yielding the horizontal distance between the two objects.
Figure 4.8 Example application, using the subtraction operator
Gage 1
X
X
Gage 2
Unary minus operator:
Format/Usage: The unary minus operator (
) negates the value to its
immediate right in the formula. The unary minus operator can be used with
1) operands, including parenthetical expressions, and 2) operator/operand
portions of the formula – that is, operators of the type that are followed by a
parenthetical listing of operands.
Formula symbol: When you pick the
key to enter the unary minus into a
formula, the “–” (minus) symbol is entered. Take care not to confuse this
with the subtraction operator, which looks the same when entered.
4–22
Example usage: Use the
operator to negate the value of an operand:
– GAGE2 * GAGE3
Use the operator to negate the value of an operator/operand:
1.250 * – AVG (GAGE2, GAGE3, GAGE4)
Page 38

Chapter 4
Defining Formulas
Modulo operator: %
Format/Usage: The modulo operator (%) performs the “long division”
operation on one operand by a second operand, and yields the whole number
remainder of that division operation. In general, use two operands, placing
the modulo operator in the formula between the two operands. The left
operand is the dividend, the right operand is the divisor.
The modulo operator can be applied in formulas, for example, to produce
binary values from decimal-based integer values.
Example usage: Use the modulo operator to calculate a 5-place “binary”
result from a gage 1 object-counting result (for values 0–31 decimal), using a
series of 10 formulas:
Formula 1:
Formula 2: GAGE1 / 2
Formula 3: RSLT2 % 2
Formula 4: RSLT2 / 2
Formula 5: RSLT4 % 2
Formula 6: RSLT4 / 2
Formula 7: RSLT6 % 2
Formula 8: RSLT6 / 2
Formula 9: RSLT8 % 2
Formula 10: RSLT9
100 + RSLT3 * 10 + RSLT1
*
For example, if the gage 1 result were 19:
Formula 1:
Formula 2: 19 / 2 (RSLT2=9)
Formula 3: 9 % 2 (RSLT3=1)
Formula 4: 9 / 2 (RSLT4=4)
Formula 5: 4 % 2 (RSLT5=0)
Formula 6: 4 / 2 (RSLT6=2)
Formula 7: 2 % 2 (RSLT7=0)
Formula 8: 2 / 2 (RSLT8=1)
Formula 9: 1 % 2 (RSLT9=1)
GAGE1 % 2
10000 + RSLT7 * 1000 + RSLT5
*
19 % 2 (RSLT1=1)
Formula 10: 1
10000 + 0 * 1000 + 0 * 100 + 1
*
*
10 + 1 (RSLT 10=10011)
In the above example, the result of formula 10 is 10011, which, if interpreted
as a binary value, would equal 19 (decimal).
4–23
Page 39

Chapter 4
Defining Formulas
Absolute value operator: ABS
Format/Usage: The absolute value operator (ABS) provides the absolute
value of the operand or expression enclosed in the following parentheses. To
use the absolute value operator, enter the ABS operator – which includes the
open parenthesis “(” – then enter the operand or expression, and then enter
the close parenthesis “).”
The absolute value operator can be used with 1) single operands, 2) operator/
operand expressions, such as arithmetic expressions, 3) operator/operand
portions of the formula – that is, operators of the type that are followed by a
parenthetical listing of operands.
Example usage: Use the absolute value operator with a parenthetical
subtraction operation, to ensure a positive result value:
ABS (GAGE2 – GAGE1)
Square operator: SQ
Format/Usage: The square operator (SQR) computes the square (an
operand multiplied by its own value) of an operand or expression enclosed in
the following parentheses. To use the square operator, enter the SQ operator
– which includes the open parenthesis “(” – then enter the operand or
expression, and then enter the close parenthesis “).”
The square operator can be used with 1) single operands, 2) operator/
operand expressions, such as arithmetic expressions, 3) parenthetical
operator/operand expressions, and 4) operator/operand portions of the
formula – that is, operators of the type that are followed by a parenthetical
listing of operands.
Example usage: Use the square operator with a linear gaging measurement to
calculate the area of a square object.
SQ (GAGE2) – WINDOW1.11
Square root operator: SQR
4–24
Format/Usage: The square root operator (SQR) computes the square root of
the operand or expression enclosed in the following parentheses. To use,
enter the SQR operator – which includes the open parenthesis “(” – then
enter the operand or expression, and then enter the close parenthesis “).”
Negative operand value: If the operand used returns a negative value, the
square root operator result is zero (0).
The square root operator can be used with 1) single operands, 2) operator/
operand expressions, such as arithmetic expressions, 3) parenthetical
Page 40

Chapter 4
Defining Formulas
operator/operand expressions, and 4) operator/operand portions of the
formula – that is, operators of the type that are followed by a parenthetical
listing of operands.
Example usage: Use the square root operator with a parenthetical expression
which adds the squares of gage 2 and gage 3, possibly to calculate a distance
(by the Pythagorean theorem):
SQR (SQ (GAGE2) + SQ (GAGE3))
Distance operator: DST
Format/Usage: The distance operator (DST) computes the distance between
two points, given the x- and y-coordinates of the two points.
Window 1
Object
identified by
color in
Window 1
The format for the DST operator: DST (X
, Y1, X2, Y2), where X1 and Y
1
1
are assumed to be the x- and y-coordinates of the first point, and X2 and Y
are assumed to be the x- and y-coordinates of the second point.
To use the distance operator, enter the DST operator – which includes the
open parenthesis “(” – then enter four operands or expressions, separated by
commas, and then enter the close parenthesis “).”
Example usage: Use the distance operator to find the distance between two
objects identified and located by two different windows:
DST (WIN1.12, WIN1.13, WIN2.12, WIN2.13)
Operands WIN1.12 and WIN1.13 indicate the x- and y-coordinates,
respectively, of the center of gravity of the object identified by color in
window 1 (see Figure 4.9). Similarly, operands WIN2.12 and
WIN2.13 indicate the x- and y-coordinates, respectively, of the center of
gravity of the object identified by color in window 2.
Figure 4.9 Example of using the DST function
Distance from
window 1 object
to window 2
object
Window 2
Object
identified by
color in
Window 2
2
4–25
Page 41

Chapter 4
Defining Formulas
Trigonometric operators: SIN COS TAN
SIN – Calculates the sine value of the listed operand.
Assumes the operand to be a value (q) stated in degrees.
COS – Calculates the cosine value of the listed operand.
Assumes the operand to be a value (q) stated in degrees.
TAN – Calculates the tangent value of the listed operand.
Assumes the operand to be a value (q) stated in degrees.
The tangent (q) = sine (q) cosine (q).
Format / Usage: In general, enter and use the trigonometric operators in
formulas just as you would in writing an equation – place the trigonometric
operator in the formula – which provides the open parenthesis “(” – followed
by the operand, and then close the expression with the parenthesis “).”
Example usage: This formula yields the sine for the gage 2 result (
GAGE2):
SIN(GAGE2)
Inverse trigonometric operators: ARC SIN ARC COS ARC TAN
ARC SIN – (arcsine) Calculates the angle (q) value (in degrees) of the
operand. Assumes the operand to be a sine value.
ARC COS – (arccosine) Calculates the angle (q) value (in degrees) of
the operand. Assumes the operand to be a cosine value.
ARC TAN – (arctangent) Calculates the angle (q) value (in degrees) of
the operand. Assumes the operand to be a tangent value.
Format / Usage: To enter an inverse trigonometric function, place the
operator in the formula immediately followed by the respective trigonometric
operator. Then enter the operand, followed by the “)” (close parenthesis).
Valid range: Operand values for arcsine and arccosine operators must be
between –1 and 1. Values beyond this range will provide a result of 0, and
the formula will fail.
Figure 4.10 Arcsine and arctangent operation results
ARC
4–26
–90
90
d
d
d
–45
(0 to –90d if sine < 0 )
d
0
d
(0 to 90
d
45
if sine > 0 )
Result (implied angle) is
always given as a value
between –90
° and 90°
Page 42

Chapter 4
Defining Formulas
Results: Inverse trigonometric function results imply an angle or angular
measurement. The result of an arcsine or arctangent operation is always
given as being between –90° and 90° (see Figure 4.10, page 4–26).
The result of an arccosine operation is always given as being between 0° and
180° (see Figure 4.11).
Figure 4.11 Arccosine operation results
Implied center of
circular gage,
aligned with
workpiece center
180
d
d
45
135
d
90
d
( 0 to 90d if cosine > 0 )( 90 to 180d if cosine < 0 )
Result (implied angle) is
d
0
always given as a value
between 0
° and 180°
Example arctangent usage: One objective of an inspection is to measure the
angle, clockwise, of an object on a workpiece, relative to an imaginary
horizontal line through the workpiece center (see Figure 4.12).
In this case, gage 2, a circular gage, is set to the Y Position operation, with
the feature offset defined to locate of the center of the object (see
Figure 4.12) on a circular workpiece. The Y Position operation for a
circular gage finds directional vertical distance from the defined feature to
the implied center of the gage. It is assumed here that the implied center of
the gage is aligned with the center of the workpiece.
Figure 4.12 Example application: Using the arctangent to calculate an angle q
Workpiece
Horizontal line drawn
through workpiece center
Gage 2 (circular)
finds the position of
the center of the
object on the
workpiece
ARC TAN (GAGE2 / GAGE2.3) + 180 * (GAGE2.3 < 0)
X
Object
This formula provides the required angular measure:
Formula finds the angle of
the object, relative to a
horizontal line drawn
through workpiece center
4–27
Page 43

Chapter 4
Defining Formulas
Here is how the example formula works: First, the formula calculates the
arctangent value of the ratio
GAGE2 / GAGE2.3, which is the vertical
distance between the object and the workpiece center divided by the
corresponding horizontal distance (see Figure 4.13). Note that if the operand
GAGE2.3 equals 0 (zero), the formula fails (you cannot divide by 0).
Figure 4.13 Example application: Using operands GAGE2 and GAGE2.3
Horizontal distance
(operand GAGE2.3)
from workpiece center
to object center
Vertical distance
(operand GAGE2)
from workpiece center
to object center
X
Object
Then the formula conditionally adds 180 to the measure ( + 180 *
(GAGE2.3 < 0) )
, to provide for angular measurements greater than
90° when necessary (remember that the arctangent operator result is always
given as between –90° and 90° – see Figure 4.10, page 4–26).
If, for example, the value of
GAGE2.3 is negative, it means the object is
somewhere to the left of the workpiece center, which implies an angle greater
than 90° (see Figure 4.14). In this case, the conditional expression
(GAGE2.3 < 0) is then true, which yields the value 1 for the conditional
expression. The value 1 is multiplied by 180 in the formula and added to the
arctangent result. As shown in Figure 4.14, the arctangent value of the
ratio
(GAGE2 / GAGE2.3) is –55. However, since the operand
GAGE2.3 is negative (since the object is to the left of the workpiece
center), 180 is added to the value –55, for a result of 125.
Figure 4.14 Example application: Finding angular results greater than 90°
q
= –55° (arctangent
measure of the
object relative to the
workpiece center)
4–28
q
X
Angle of object, relative to
workpiece center (125
°)
Page 44
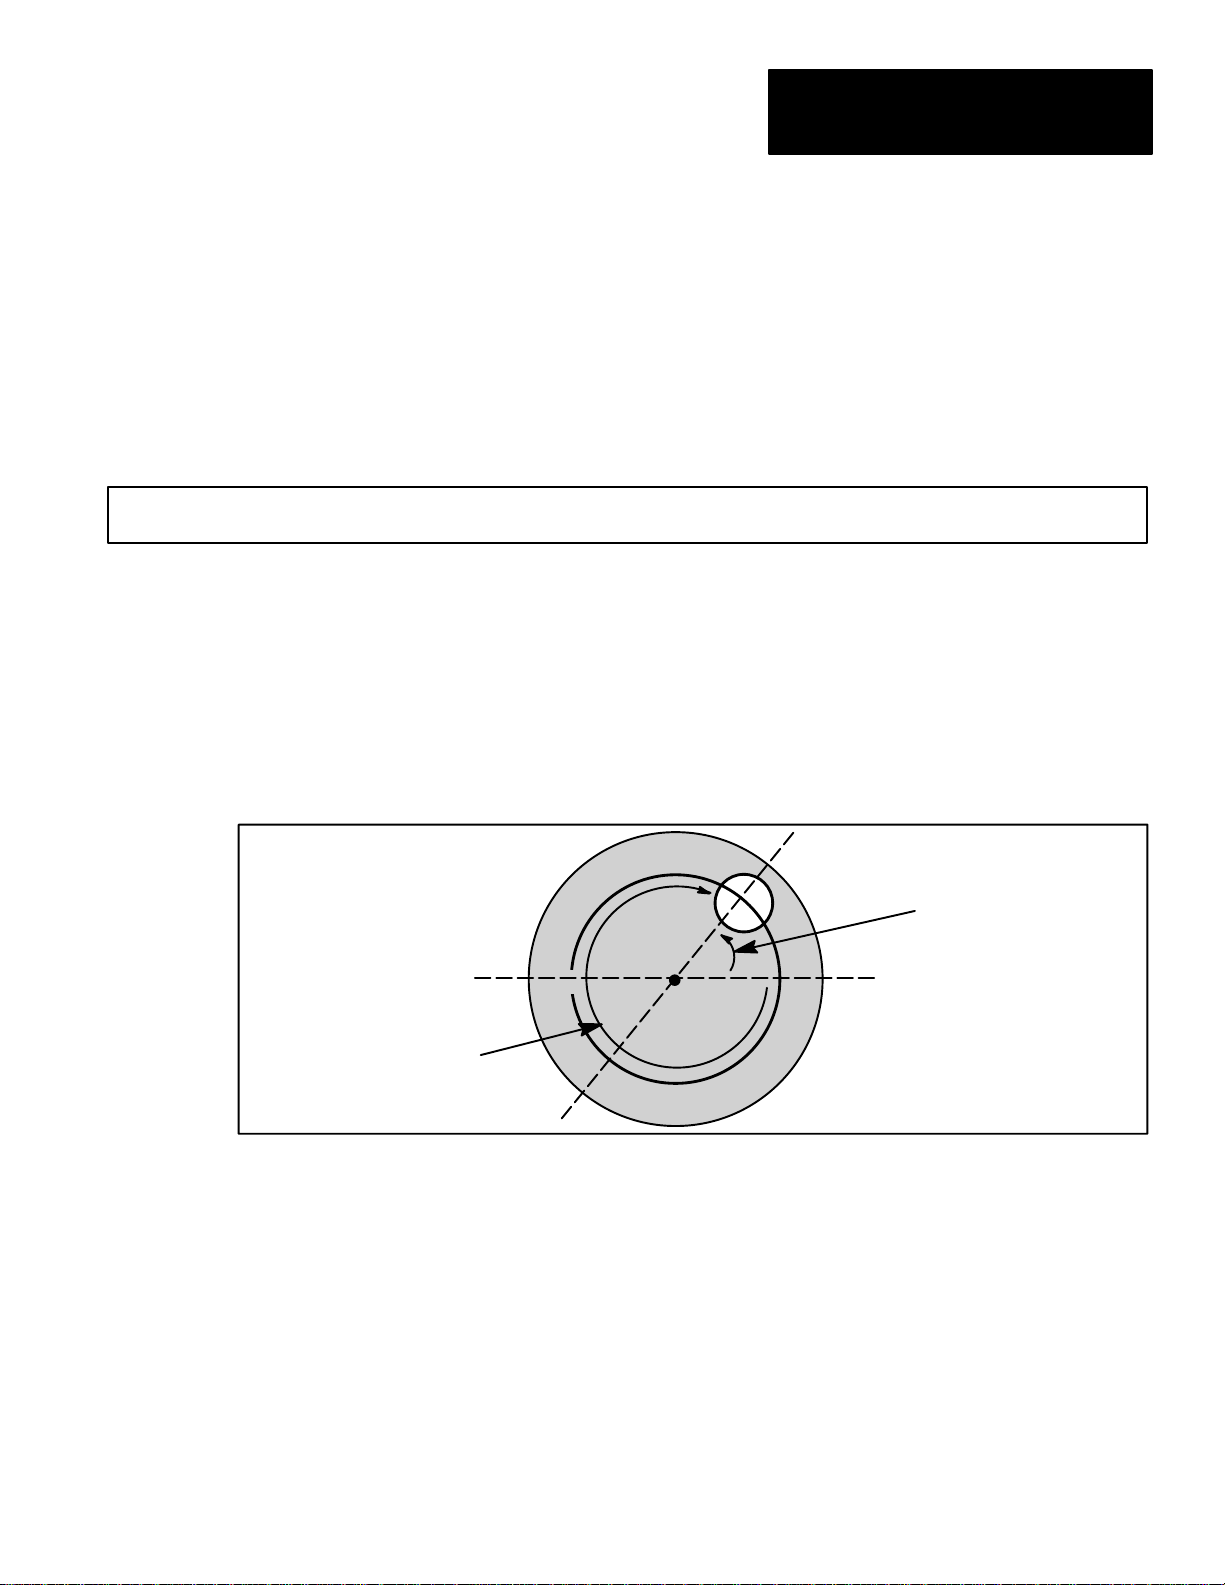
Chapter 4
Defining Formulas
When the value of GAGE2.3 is positive, the conditional expression
(GAGE2.3 < 0) equals 0, so that 0 is added to the arctangent value.
Note that the previous example formula does not provide positive angular
measurements for arctangent values between 0° and –90° (see Figure 4.15),
which would correspond to positive angular measurements from 270° to
360°. In order to supply values from 270° to 360° rather than values 0° to
–90° , you could redefine the formula to also conditionally add 360:
ARC TAN(GAGE2 / GAGE2.3) + 180 *(GAGE2.3 < 0) + 360 * (GAGE2.3>0 AND GAGE2 < 0)
If the value of GAGE2.3 is positive (meaning the object is to the right of
the workpiece center), and the value of GAGE2 is negative (meaning the
object is above the workpiece center), the conditional / logical expression
(GAGE2.3>0 AND GAGE2 < 0) equals 1. The value 1 is multiplied by
360 and added to the arctangent value. As shown in Figure 4.15, the operand
GAGE2.3 would be a positive value, and the value of GAGE2 is negative,
so that 360 would be added to the arctangent value –55, for a formula result
of 305.
Angle of object, relative to
workpiece center (305
°)
Figure 4.15 Example application: Finding angular results greater than 270°
X
q
q = –55° (arctangent
measure of the
object relative to the
workpiece center)
Statistical Operators
This section discusses the statistical operators, which include AVG (average),
MAX (maximum), MED (median), MIN (minimum), MOD (mode), and VAR
(variance).
Format/Usage: To use any of the statistical operators, enter the respective
operator (AVG, MED, etc.) – which includes the open parenthesis “(” – then
enter the operand or expression, and then enter the close parenthesis “).”
The statistical operators can be used with 1) single operands, 2) operator/
operand expressions, such as arithmetic expressions, 3) parenthetical
4–29
Page 45

Chapter 4
Defining Formulas
operator/operand expressions, and 4) operator/operand portions of the
formula – that is, operators of the type that are followed by a parenthetical
listing of operands.
Average operator:
AVG
The average operator computes the average value of the operands and/or
expressions that are listed in parentheses following the operator.
Example usage: The formula below averages the results from 3 gages:
AVG(GAGE1,GAGE2,GAGE3)
In this example, each of three gages is set for linear gaging, in order to
measure the distance between the center of two objects (see Figure 4.16).
The formula above provides the average measurement of the three gages. In
this example, if the average value is beyond an acceptable range, the part is
rejected.
Figure 4.16 Example application, using three gages to find an average measurement
Gages 1-3,
each measuring
distance between
the two objects of
the same color
XXX
4–30
XXX
Maximum operator: MAX
The maximum operator returns the maximum value among the operands
and/or expressions listed in parentheses following the operator.
Example usage: The formula below finds the maximum value among the
results of 3 gages:
MAX(GAGE1,GAGE2,GAGE3)
In this example, each of three gages is set for linear gaging, in order to
measure the distance between the center of two objects (see Figure 4.16).
The formula above yields the maximum value among the measurements of
the three gages. In this example, if the maximum value is above a certain
level, the part is rejected.
Page 46

Chapter 4
Defining Formulas
Median operator: MED
The maximum operator returns the median value among the operands and/or
expressions listed in parentheses following the operator. The median value is
the value for which there are an equal number of values in the list above and
below the value. For example, for the list (2, 5, 7, 4, 3), the median is 4.
Note: If there is an even number of operands in the list, there cannot be an
equal number of values below and above the median value. In this case, the
median value returned is the value with one less value above than below in
the list. For example, for the list (2, 5, 4, 7), the median is 5.
Example usage: The formula below finds the median value among the
results of 3 gages:
MED(GAGE1,GAGE2,GAGE3)
In this example, each of three gages is set for linear gaging, in order to
measure the distance between the center of two objects (see Figure 4.16,
page 4–30). The formula above yields the median value among the
measurements of the three gages. For example, if the three gages returned
the values 1.250, 1.291, and 1.242, the median value would be 1.250, since
one value is above (1.291) and one value is below (1.242).
Minimum operator:
MIN
The minimum operator returns the minimum value among the operands
and/or expressions listed in parentheses following the operator.
Example usage: The formula below finds the minimum value among the
results of 3 gages:
MIN(GAGE1,GAGE2,GAGE3)
In this example, each of three gages is set for linear gaging, in order to
measure the distance between the center of two objects (see Figure 4.16,
page 4–30). The formula above yields the minimum value among the
measurements of the three gages. In this example, if the minimum value is
below a certain level, the part is rejected.
Mode operator:
MOD
The mode operator returns the value among the listed operands and/or
expressions which occurs most often. If more than one value occurs most
often, the lower of these values is returned.
4–31
Page 47

Chapter 4
Defining Formulas
For example, from the list (1, 2, 2, 3, 3), the value 2 and the value 3 both
appear twice. In this case, the value 2 is returned.
Example usage: The formula below finds the mode value among the results
of four object-counting windows:
MOD(WIN1,WIN2,WIN3,WIN4)
In this example, each of four windows is set for object-counting, in order to
identify parts by the number of objects counted (see Figure 4.17). The parts
can rotate from inspection to inspection, so the exact number of objects to be
found in each window is uncertain. Each window identifies object by color,
and by object shape. In this example, if the mode value (most commonlyoccurring value) is not 3, the part is rejected.
Figure 4.17 Example application, using windows and the mode operator
Windows 1-4
each count
objects
Object
identified by
color and
shape
Variance operator: VAR
The variance operator computes the variance value of the operands and/or
expressions that are listed in parentheses following the operator.
The variance operator computes the variance by:
1) Taking the average of the listed values;
2) Subtracting each listed value from the average, to obtain the difference
from average for each value, then squaring each difference;
4–32
3) Adding up all the values obtained in step 2) to obtain the sum of the
squares of the differences;
4) Dividing the sum obtained in step 3) by the number of listed operands.
The variance operator can be used as a means of evaluating variations among
measurements in an inspection.
Page 48

Chapter 4
Defining Formulas
Example usage: The formula below finds the variance of the results from 6
gages:
VAR(GAGE1,GAGE2,GAGE3,GAGE4,GAGE5,GAGE6)
In this example, each of six gages is set for linear gaging, in order to measure
the distance between the center of two objects (see Figure 4.18). The
formula above provides the variance of the measurements of the six gages.
In this example, if the variance value is beyond an acceptable range, the part
is rejected.
Figure 4.18 Example application, using gages and the variance operator
Gages 1-6,
each measuring
distance between
the two objects of
the same color
XXX
XXX
XXX
XXX
Logical Operators
The logical operators, AND, OR, and NOT, perform the indicated logical
function, and return a logical (1 or 0) result. Generally, it makes sense to use
operands which are logical values (1 or 0), such as conditional operation
results, or tool pass/fail results. Nonetheless, you can use operands of any
value.
AND operator
The AND operator evaluates two operands as to whether or not each equals 0
(zero), and then provides either a 1 or 0 result, as follows:
1 result – Only if both operands are non-zero.
0 result – If either or both of the operands equals zero.
Format / Usage: In general, use two operands with the operator, placing the
AND operator in the formula between the two operands.
Example usage: This formula ANDs the pass/fail results from gages 1 and 2.
A pass condition yields a 1 result, a fail yields a 0 (zero) result. The formula
4–33
Page 49

Chapter 4
Defining Formulas
yields a 1 result if both gages pass, and a 0 (zero) result if either or both
gages fail.
(GAGE1.2 AND GAGE2.2)
OR operator
The OR operator evaluates two operands as to whether or not each equals 0
(zero), and then provides either a 1 or 0 result, as follows:
1 result – If either or both operands are non-zero.
0 result – Only if both of the operands equal zero.
Format / Usage: In general, use two operands with the operator, placing the
OR operator in the formula between the two operands.
Example usage: This formula ORs the pass/fail results from gages 1 and 2.
A pass condition yields a 1 result, a fail yields a 0 (zero) result. The formula
yields a 1 result if either or both gages pass, and a 0 (zero) result only if both
gages fail.
(GAGE1.2 OR GAGE2.2)
NOT operator
The NOT operator inverts the logical evaluation (1 or 0) of an operand or
expression in a formula, assigning a logical value as follows:
0 – If the operand is non-zero.
1 – If the operand equals 0 (zero).
Format / Usage: Place the NOT operator to the immediate left of the operand
in the formula.
Example usage: This formula first ANDs the pass/fail results from gages 1
and 2. A pass condition yields a 1 result, a fail yields a 0 (zero) result.
4–34
(GAGE1.2 AND GAGE2.2) AND NOT GAGE3.2
Then, the formula takes the result of the first AND operation, and ANDs it
with the inverse (NOT) of the pass/fail result of gage 3. In this case, the
result of the formula is 1, only if both gage 1 and gage 2 pass, and gage 3
fails. Otherwise, the result is 0.
Page 50

Chapter 4
Defining Formulas
Conditional Operators
A conditional operator compares two operands, and returns a true (1) or false
(0) value for the indicated condition. The conditional operators include
= (equal to), <> (not equal to), <= (less than or equal to), => (greater than or
equal to), < (less than) , and > (greater than).
Format / Usage: Use two operands or parenthetical expressions with the
operator, placing the conditional operator in the formula between the two
operands.
Example conditional operators: This formula compares the numerical result
of gage 1 to gage 2 to see if the two are equal, and also compares the
numerical result of gage 2 to that of gage 3, to see if they are not equal.
(GAGE1 = GAGE2) AND (GAGE2 <> GAGE3)
In this case, the result of the formula is 1 (true), if the gage 1 result equals the
gage 2 result, and if the gage 2 result does not equal the gage 3 result.
Otherwise, the result is 0 (false).
Additional Formula Examples
This section presents additional formula examples, to illustrate some of the
additional functionality and flexibility possible through the use of formulas.
Flagging Consecutive Rejects
This example requires the use of two formulas, the result of which is to
provide an output signalling the occurrence of 10 consecutive rejects.
Assume that the example application requires the use of gages 1 and 2, and
of windows 1 and 2.
Formula 1 would be as follows:
GAGE1.2 AND GAGE2.2 AND WIN1.2 AND WIN1.2
The result of formula 1 will be 1 if all tools pass, otherwise, the result will be
0 (zero).
Formula 2 would be as follows:
(RSLT2 + NOT RSLT1) * NOT RSLT1
4–35
Page 51

Chapter 4
Defining Formulas
For each inspection, if any tool fails, the value RSLT1 =0. Therefore the
value NOT RSLT1 =1. Thus, for any inspection that fails, the value 1 is
added to RSLT2 by the portion of the formula
Thus, if consecutive failures occur, the value of RSLT2 is incremented by
one for each failure. This is because the RSLT2 value (the result of formula
2) is retained from inspection to inspection.
As soon as an inspection passes, however, the value RSLT2 is reset to 0.
This is because when an inspection passes the value RSLT1 =1. Therefore
the value NOT RSLT1 =0. Thus, in the formula, when an inspection passes,
the quantity
The fault range limit for formula 2, in this example, is set to 10. Thus when
10 consecutive failures occur, Formula 2 fails. The output of the formula 2
range limits can be assigned to a results output and used to trigger a signal
the event of 10 consecutive failures.
(RSLT2 + NOT RSLT1) is multiplied by 0.
(RSLT2 + NOT RSLT1).
Creating a Shift Register
This example requires the use of four formulas, the result of which is to
provide a shift register effect, which produces a pass/fail output that is
delayed by four triggers.
Assume that the example application requires the use of window 3.
Formula 4 would be set to yield the numerical result of window 3:
WIN3
Formula 3 would be set to yield the result of formula 4:
RSLT4
Formula 2 would be set to yield the result of formula 3:
RSLT3
Formula 1 would be set to yield the result of formula 2:
4–36
RSLT2
The formulas are evaluated in numerical order for each inspection. Thus, for
each inspection, formula 1 is first set to the formula 2 result value, then
formula 2 is set to the formula 3 result value, then formula 3 is set to the
Page 52

Chapter 4
Defining Formulas
current value of formula 4, then formula 4 is set to the current value of
window 3. The result of this shifting of window 3 results is that the formula
1 result equals the window 3 result from four inspections ago.
The fault range limit for formula 1, in this example, is set to the appropriate
parameters for window 3. The output of formula 2 can be assigned to a
results output and used to trigger a signal the event window 3 failure.
This application example is particularly useful where indexing of parts
occurs, and where the action taken on a part failure occurs further down the
line (in this example “further down” means “four triggers down”).
Naming a Formula
Once you have defined a formula’s contents, you can name the formula using
the Set Name box on the Config. Results menu. Entering descriptive
names for formulas can be useful – during run mode, for example, formulas
can be displayed according to their pass/fail status. It may be easier, when a
formula is displayed, to identify a formula’s function if it has a name relating
to its content or functionality.
Default name: In case you do not name a formula, a default name is entered
automatically, when you define the formula. The default name for a formula
is F#, where # is the formula number.
Define formula first: The Set Name box for a selected formula is disabled
until the formula has been defined. Thus you cannot enter a formula name
until you enter a valid definition (see “Defining a Formula” in this chapter).
Figure 4.19 Using the keyboard to set the formula name
To enter a formula name:
• Pick Set Name on the Config. Results menu. The keyboard appears
(see Figure 4.19).
4–37
Page 53

Chapter 4
Defining Formulas
• Enter the desired formula name, by picking the appropriate keys on the
keyboard (see Chapter 5 in the Color CVIM User’s Manual for more
keyboard usage information). Pick Ret when the name is entered as
desired. When you do, this message appears:
Name restrictions: Names can contain up to seven characters, including
spaces. Any additional characters entered are truncated from the right.
Enabling / Disabling a Formula
Once you have defined a formula’s contents, you must then enable the
formula, in order for the formula to function as part of the configuration, and
in order to set range limits and assign outputs for the formula.
Define formula first: The Formula #: Disabled box for a selected formula
is itself disabled until the formula has been defined. Thus you cannot enable
a formula until you first define it (see “Defining a Formula” in this chapter).
To enable a formula:
• Pick the Formula #: Disabled box on the Config. Results menu (see
Figure 4.20).
Figure 4.20 Enabling a formula
Formula #: Disabled box
4–38
A warning message appears, listing the corresponding gage or window
which is affected.
Page 54

Chapter 4
Defining Formulas
• Pick the Formula #: Disabled box again to confirm. The box toggles to
Enabled, and the Range/Outputs box for the formula is enabled.
To disable a formula:
• Pick the Formula #: Enabled box on the Config. Results menu. A
warning message appears, stating that a corresponding gage or window
can now be range checked (when its range checking is also enabled):
• Pick the Formula #: Enabled box again to confirm. The box toggles to
Disabled, and the Range/Outputs box for the formula is disabled.
Using Copy and Paste
Here are some additional considerations for enabling formulas:
Formulas prevent the use of associated gage and window outputs: Any
formula you select and enable will disable the use of results outputs from a
corresponding gage or window (as listed in Table 4.A, page 4–3).
Formula results replace the results of the corresponding gage and
window in the results blocks: When you enable a formula, its inspection
results are listed in the results block, in place of the corresponding gage or
window results (as listed in Table 4.A, page 4–3). Results blocks contain
the comprehensive inspection results available by transfer through the Color
CVIM backplane, or through one of the Color CVIM serial ports.
For more information: See “Selecting a Formula” in this chapter, and see
also Appendix A, for more information on the effects of using formulas.
The Copy and Paste features, which are found on the Config. Results
menu, allow you to copy all the contents a selected formula, along with the
formula name, to one or more other formula numbers.
Using Copy and Paste can save you time and effort in creating your
formulas, especially when you intend to use a number of similar formulas, or
if you want to investigate a number of variations of a formula.
You can also use Copy and Paste when you have defined a formula whose
formula number is such that it conflicts with a tool whose results you want to
access (see “Selecting a Formula” in this chapter). You could resolve the
conflict by copying the formula to a non-conflicting formula number (one
whose corresponding tool is either disabled or whose results are not
required), and then disable the original formula (see Figure 4.21, page 4–40).
4–39
Page 55

Chapter 4
Defining Formulas
To use the Copy and Paste features, follow this general procedure:
• Select the source formula – Pick the Next or Previous box, or use the
Jump box, to set the formula number to the formula you wish to copy.
• Pick the Copy box. This marks the current formula selection as the
source. The Paste box will then designate the number of the source.
• Select the destination – Pick the Next or Previous box, or use the Jump
box, to set the number to the destination – the formula which will receive
contents from the source.
• Pick the Paste box. The formula contents are automatically copied from
the previously selected source formula to the currently selected
destination formula.
Figure 4.21 Copying a formula
Previous / Next boxes
Copy / Paste boxes
Note these additional considerations regarding the Copy/Paste features:
Previous contents overwritten: When you copy the contents of the source
formula into the destination formula, the previous contents of the destination,
if any, are overwritten.
Source formula remains selected: The source formula selection remains as
selected until a different source formula is selected. This means that you can
copy the source formula contents to a number of different formulas.
Copied formula contents pasted: When you pick the Paste box, the
copied contents of the selected source are pasted. For example, suppose that
you select formula 1 and pick the Copy box, then change some of the
contents of formula 1 before picking the Paste box. When you do pick the
Paste box, the copied former version, not the current version, of formula 1
would be pasted to the destination formula.
4–40
Page 56

Chapter 4
Defining Formulas
Formula name copied: The formula name is copied as well as the formula
contents. When you copy a formula, you may want to change the name of
the formula at the destination, or at the source, as appropriate.
Name and contents copied: Only the formula contents and formula name
are copied; the range limits and output assignment(s) are not copied.
Copying an undefined formula: If you copy an undefined formula (one
which has no contents currently entered), when you paste the formula to a
formula which has already been defined, you will delete the destination
formula, and this message will be displayed:
Setting Range Limits and Assigning Outputs
Example Copy and Paste
To copy the contents of formula 1 to formula 2, you would do the following:
• Pick the Previous or Next boxes, or use the Jump box, as required to
select formula 1.
• Pick the Copy box to select formula 1 as the source. The Paste box will
display the number of the source formula – in this case, the box reads
Paste 1, for formula 1 (see Figure 4.21, page 4–40).
• Pick the Next box to select the destination formula – formula 2.
• Pick the Paste box to place the source formula contents into the
destination formula.
The Paste box retains the source formula listing (1, in this case) until you
use the copy box to select another source formula. The source formula
designation is updated if and when you select a different source formula.
Once you have defined a formula’s contents, and have enabled the formula,
you can set range limits and assign outputs for the formula. The usage and
function of range limits and output line assignment for a formula are
identical to that of inspection gages and windows (see also the chapter on
range limits and output lines in the Color CVIM User’s Manual).
The term range limit refers to the tolerance limits you set for the formula
results. You can specify High and Low FAULT RANGE limits, and/or the
High and Low WARNING RANGE limits, for the formula results.
4–41
Page 57

Chapter 4
Defining Formulas
The two sets of range limits have this relationship:
LF <=
LW <= REFERENCE <= UW <= UF, where:
LF = Low FAULT RANGE limit
LW = Low WARNING RANGE limit
UW = High WARNING RANGE limit
UF = High FAULT RANGE limit
The REFERENCE value could be based, for example, on the “mean”
formula result from a trial series of inspections conducted with the Color
CVIM module running in learn mode.
Once you have set the High and Low WARNING RANGE and/or FAULT
RANGE limits for a formula, you can assign the limits to output lines, which
would then be activated whenever the respective range limits were exceeded.
Formula status: If a formula inspection result lies within both the FAULT
RANGE and WARNING RANGE limits, a “pass” condition exists for that
formula. If the result lies outside a WARNING RANGE limit, but within
the FAULT RANGE limits, a WARNING condition exists for the formula.
In addition, if the formula result also lies outside the FAULT RANGE limits,
a FAULT condition also exists for that formula.
Formula result format/conversion: The result for a particular formula is
expressed in either fixed decimal point, or integer value, as appropriate for
the operands and operators in use. When you set the range limits, either the
integer format or fixed decimal point format is used by the Color CVIM
automatically, as appropriate for the type of result.
4–42
If the formula is changed after the range limits are set, so that the required
result format changes, the format of the range limit is converted
automatically. If a fixed point range limit is converted to integer format, the
range limit value is rounded to the nearest integer value.
Result Restrictions: Integer results for a formula are restricted to the range
of "2,147,483,647. Fixed point (decimal) results for a formula are
restricted to the range of "32767.000. If a formula result goes beyond the
allowable range, a result of 0 is returned, and the formula fails.
Master range status: The FAULT status for each formula has an effect on
an output called the Master Range. For each inspection, if any user-defined
FAULT RANGE limit is exceeded, the Master Range status is activated; if
Master Range is assigned to one of the output lines, the output line is
activated accordingly (see Chapter 11 in the Color CVIM User’s Manual for
information on the Master Range and output line assignment).
Multiple range limit assignment to a single output: You can assign more
than one range limit to a single Results output line. For example, you can
assign both the High and Low WARNING RANGE limits to one Results
Page 58

Chapter 4
Defining Formulas
output line, and assign both the High and Low FAULT RANGE limits to
another Results output line.
Formulas prevent the use of associated gage and window outputs: Any
formula you select and enable will disable the use of results outputs from a
corresponding gage or window (as listed in Table 4.A, page 4–3).
Entering Range Limits for Formulas
After you determine the appropriate FAULT RANGE and/or WARNING
RANGE limit values for a formula, you can enter these values using the
range/output setup table.
Define and enable formula first: A formula must be both defined and
enabled before you can enter range limits.
To access the range/output setup table for a formula:
• Pick Range/Outputs on the Config. Results menu to display the
range/output table (see Figure 4.22).
Figure 4.22 Assigning range limits
Range/output
table
Calculator pad
Inspection
statistics
table
If all range limits are currently set to zero as shown in Figure 4.22, enter the
appropriate High and Low FAULT RANGE and/or WARNING RANGE
limits in the following order:
1. Pick the High box under FAULT RANGE. When you do, the calculator
pad appears, as shown in Figure 4.22.
4–43
Page 59

Chapter 4
Defining Formulas
2. Enter the desired value (positive or negative) for the FAULT RANGE
High limit.
3. Repeat steps 1. and 2. for the Low box under FAULT RANGE, entering
the Low limit for the FAULT RANGE.
4. Repeat steps 1. and 2. for the High box under WARNING RANGE.
5. Repeat steps 1. and 2. for the Low box under WARNING RANGE.
If the range limits are not currently zero, the following rules apply:
• If you change a FAULT RANGE limit to a smaller value than the
corresponding WARNING RANGE limit, the WARNING RANGE limit
will change to the new FAULT RANGE limit, and this message appears:
• If you attempt to change the High WARNING RANGE limit to a larger
value than the High FAULT RANGE limit . . .
• Or, if you attempt to change the Low WARNING RANGE limit to a
smaller value than the Low FAULT RANGE limit . . .
• Or, if you attempt to change an High range limit to a smaller value than
the associated Low range limit . . .
• Or, if you attempt to change an Low range limit to a larger value than the
associated High range limit . . .
the following message will flash briefly in the calculator pad window . . .
WARNING OUT OF RANGE
. . . and the previous value will be retained.
Inspection Statistics Table
This table can contain data from a series of inspections with the Color CVIM
module running in the learn mode (see Chapter 20, Runtime options, in the
Color CVIM User’s Manual, for more information).
4–44
The Nominal value in the table is not available for formulas.
The remaining values in the statistics table are the number of inspections
performed (Samples) and the statistical results based on a series of
inspections performed in learn mode. If no inspections have been performed
with the Mode set to Learn, these values will be all zeros (as shown in
Figure 4.22, page 4–43).
Page 60

Chapter 4
Defining Formulas
Using the learn mode statistics: You can run a series of trial inspections,
using a representative sample of workpieces, with the Color CVIM module
in Learn mode, in order to accumulate a statistical basis for setting the
FAULT RANGE and WARNING RANGE limits. For more information on
the learn mode, refer to the Chapter 20 in the Color CVIM User’s Manual.
Example Range Limit Setting
Here is an example of setting the range limit values for a formula:
AVG(GAGE1, GAGE2, GAGE3)
which averages the values of three gages (see Figure 4.23), in relation to the
REFERENCE value:
• The REFERENCE (ideal or nominal) value is 15.000.
• WARNING RANGE – Low 14.800. High 15.200.
• FAULT RANGE – Low 14.600. High 15.400.
With the range limits set as shown above, if a formula result is outside either
WARNING RANGE limit (above 15.200 or below 14.800), but within the
FAULT RANGE limits, the formula will have a WARNING condition only.
If an inspection result is outside either FAULT RANGE limit (above 15.400
or below 14.6), the formula will have both a WARNING and a FAULT
condition.
Figure 4.23 Example: Range limits for linear gaging
Gages measure distance
from feature A to feature B
Gage 1
Gage 2
Gage 3
A B
A B
A B
15 cm (Ideal)
Here is an example of setting the range limit values for a conditional
operation by a formula (see Figure 4.24, page 4–46), where the
REFERENCE value, 1, is the only acceptable value:
4–45
Page 61

Chapter 4
Defining Formulas
• The REFERENCE (ideal or nominal) value is 1.
• WARNING RANGE – Low 0. High 2.
• FAULT RANGE – Low 0. High 2.
With the range limits set as shown above, the only acceptable formula result
is 1. If the formula result is not 1, the formula fails. Note that in this case
WARNING RANGE limits are the same as the FAULT RANGE limits.
Figure 4.24 Example: Formula with conditional operation for comparing gage results
GAGE1 > GAGE2
Assigning Range Limits to Results Output Lines
As with range limits for gages and windows, you can assign outputs to the
range limits you set for formulas. To assign a formula range limit to a
Result output line:
• Pick the Output box under the FAULT RANGE or WARNING RANGE
heading, as appropriate. The USAGE menu appears (see Figure 4.25,
4–47).
• Pick the appropriate Results box in the USAGE menu.
You can select outputs lines only if have been previously assigned to results.
For example, as shown in Figure 4.25, only output lines #1 and #2 are
enabled and available; they are the only lines with a Results assignment, in
this case. The other output lines are either assigned other functions or are not
used; thus, they are not available for range limit use. For information on
assigning functions to output lines, see Chapter 11, Discrete I/O Line
Configuration in the Color CVIM User’s Manual.
Remember, you can assign more than one range limit to a single Results
output line. For example, you might assign both the High and Low
WARNING RANGE limits to one Results output line, and assign both the
High and Low FAULT RANGE limits to a different Results output line.
4–46
Or, for example, you might assign the FAULT RANGE limits for several
different formulas to a single Results output, if this meets your application
requirements. In this case, the Results output would be activated if any one
of the assigned FAULT RANGE limits for any of the formulas were
exceeded.
Page 62

Chapter 4
Defining Formulas
Figure 4.25 Selecting output lines for range limits
USAGE
menu
Enabling Results and Range Limits for Corresponding Tools
Any formula you select and enable will disable the use of results outputs
from a corresponding gage or window, as listed in Table 4.A, page 4–3. In
order to use the results from a tool which corresponds to a formula in use,
you must disable the formula, then enable the tool results, as described
below:
• Disable the formula (see “Enabling / Disabling a Formula” in this
chapter) which corresponds to the tool (as listed in Table 4.A, page 4–3).
• Pick the Range/Reference box on the corresponding gage or window
(see Figure 4.26, page 4–48).
• Pick the Range box to toggle the setting to Enabled. This enables the
Range/Outputs box.
• Pick Range/Outputs to display the range/output setup table.
• Set the range limits and assign outputs as necessary (for more
information, refer to Chapter 13 in the Color CVIM User’s Manual).
Clearing of Range Limits and Output Assignments for Tools: If you
define range limits and assign outputs for a tool, and you then enable a
formula corresponding to that tool (as listed in Table 4.A, page 4–3), the
range limits and output assignments for the tool are reset to default values
(no output assignments, and range limits set to 0).
4–47
Page 63

Chapter 4
Defining Formulas
Pass status for tools whose results are disabled by a corresponding
window: Any formula you select and enable will disable the use of results
outputs from a corresponding gage or window, as listed in Table 4.A, page
4–3. Any tool whose results are thus disabled will always be assigned a
pass status by the Color CVIM module. This means, for example, that
during runtime, any tool whose results are thus disabled will appear in green
when the All Tools display is selected.
Figure 4.26 Enabling the range limits and outputs for tools
Range: box
Range/Reference: box
4–48
Page 64

Chapter
Chapter Objectives
Analysis Functions
A–B
5
Analysis Functions and Runtime Displays
Contents
Chapter Objectives 5–1. . . . . . . . . . . . . . . . . . . . . . . . . . . . . . . . . . . . . . . .
Analysis Functions 5–1. . . . . . . . . . . . . . . . . . . . . . . . . . . . . . . . . . . . . . . .
Statistics (Learn Mode) for Failed Tools 5–2. . . . . . . . . . . . . . . . . . . . . . . .
Runtime Displays 5–3. . . . . . . . . . . . . . . . . . . . . . . . . . . . . . . . . . . . . . . . .
This chapter describes the use of Analysis functions and runtime displays
with MATH-PAK installed.
The Color CVIM module’s Analysis functions allow you to obtain the
inspection processing time required for your current configuration. With
MATH-PAK installed, the analysis function calculations can also include the
formulas you have enabled and defined.
You can determine which tools are included in analyzing the processing time,
including formulas, by using the Tool Display menu.
Figure 5.1 Selecting the T ool Display menu
Tool Display
menu
To access the Tool Display menu (see Figure 5.1):
• Pick Misc → Analysis to access the Analysis menu.
• Pick Tool Display to access the Tool Display menu.
With the Tool Display menu selected, you can see that the Formulas box
allows you to specifically analyze the formulas for processing time (see
Figure 5.1). If you pick the All Tools box, all tools are included in the
analysis, including formulas.
5–1
Page 65

Chapter 5
Analysis Functions and Runtime Displays
Statistics (Learn Mode) for Failed Tools
With MATH-PAK installed, the Color CVIM module allows you to select
whether you will include or exclude data from failed tools when collecting
statistics (when running the Color CVIM in learn mode).
You determine whether data from failed tools is included in the statistics
through the use of the Range Fail box on the Runtime Init. menu (see
Figure 5.2):
• Pick Exit → Runtime Init. to access the Runtime Init. menu.
• Pick the Range Fail: box to toggle the setting between No Stats and
Stats.
The effects of the Range Fail selection are as follows:
Stats: Statistics collected will include results from failed tools as well as
from tools which pass.
No Stats: Statistics collected will include results only from tools which
pass.
Figure 5.2 The Range Fail box
Range Fail box
5–2
Page 66

Chapter 5
Analysis Functions and Runtime Displays
Runtime Displays
The Color CVIM module’s runtime displays allow you to observe updated
inspection results during run mode, as the inspections occur. With
MATH-PAK installed, the various runtime displays can also include the
formulas you have enabled and defined. These runtime displays include:
• Runtime tools displays (All Tools or Failed Tools)
• I/O Page
• Results Page
• Stat. Page 1
Selecting runtime display – setup mode: During setup mode, you can
select the initial runtime display using the Runtime Display menu, accessed
through the Exit box on the main menu (see Figure 5.3):
• Pick Exit → Runtime Display to access the Runtime Display menu.
• Pick the desired Runtime Display option.
Figure 5.3 Runtime Display menu – setup mode
Runtime Display
menu
Selecting runtime display – run mode: You can select the runtime display
during run mode, using the Display menu (see Figure 5.4):
• Pick the Display box to access the Display menu.
• Pick the desired Display option.
Figure 5.4 Display menu – run mode
Display
menu
5–3
Page 67
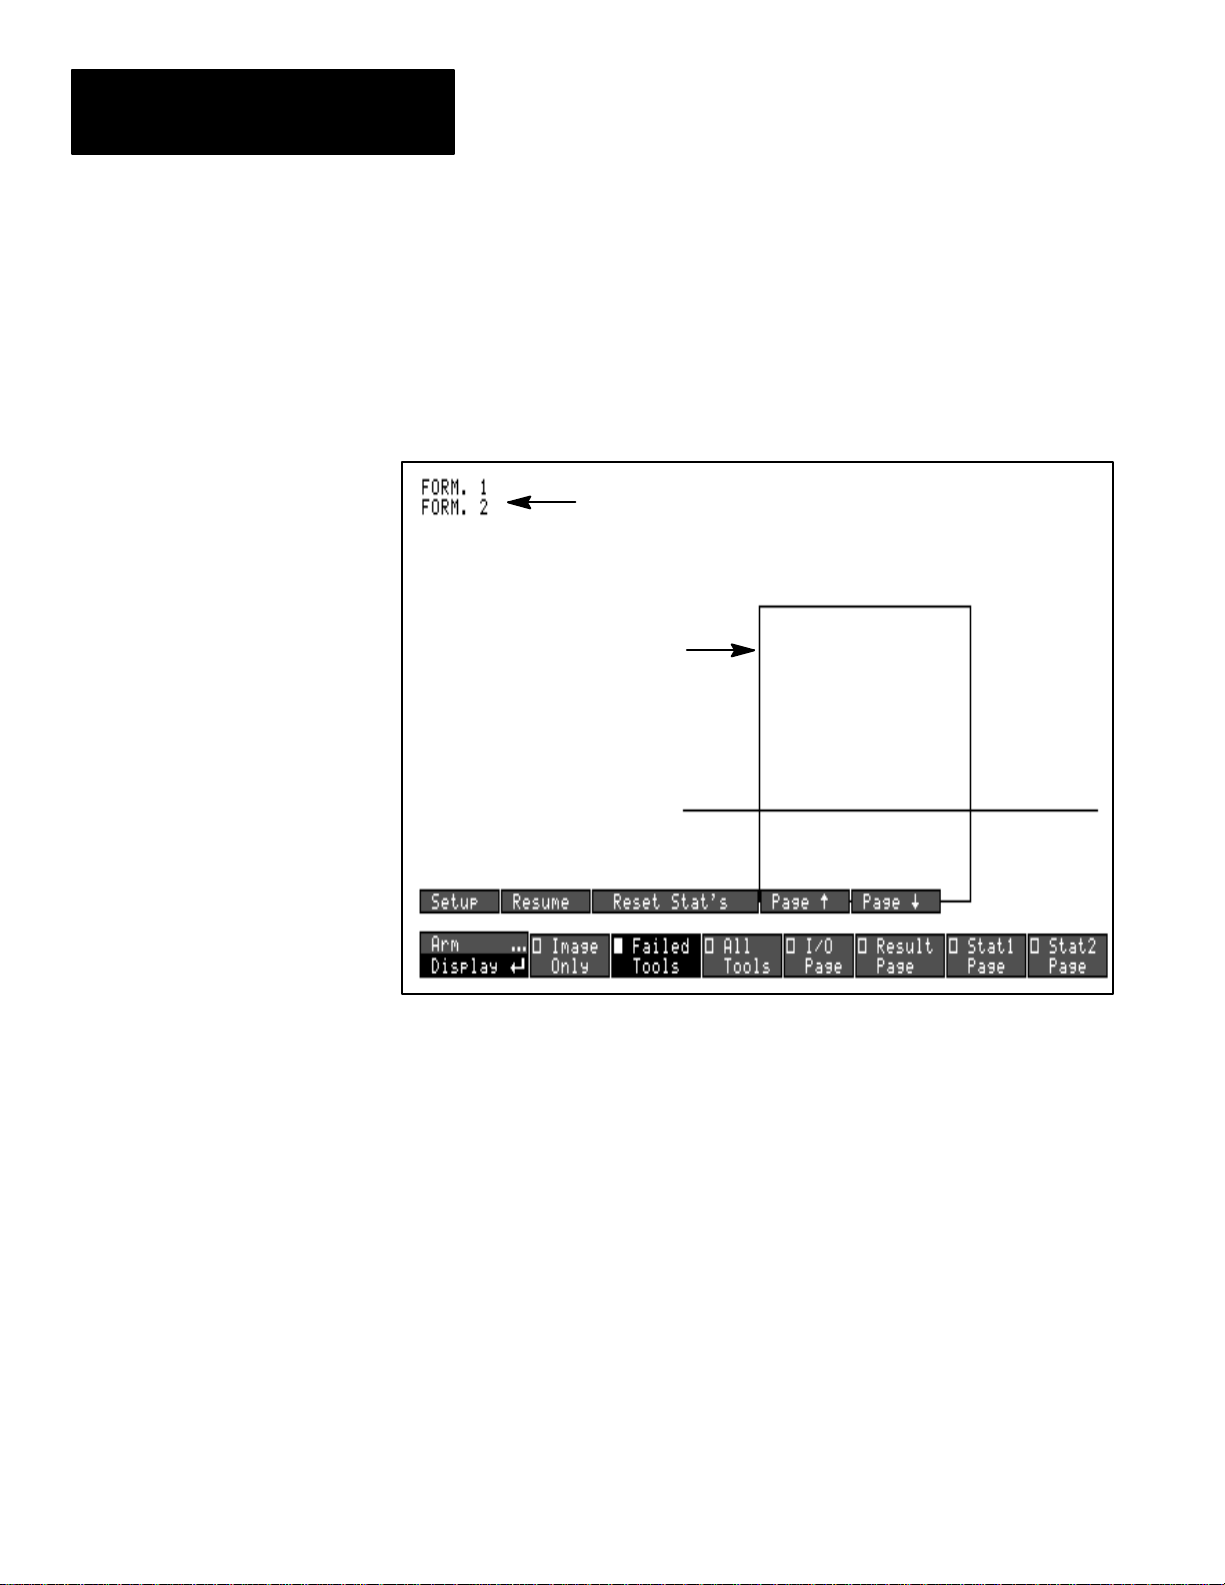
Chapter 5
Analysis Functions and Runtime Displays
Runtime Tools Displays
With MATH-PAK installed, the tools displays, All Tools and Failed Tools,
will include the enabled formulas. Formulas are displayed by formula name,
in numerical order, in the top left corner of the screen (see Figure 5.5).
Figure 5.5 Formulas displayed in Failed T ools display during run mode operation
Formulas
listed in red (or
yellow)
Tools displayed
in red (or
yellow)
5–4
During runtime, any enabled formulas are listed according to the runtime
Display menu selection (see Figure 5.5):
All Tools – Displays all enabled tools and formulas. The displays are
color-coded – failed tools and formulas are displayed in red; tools which
are within fault range limits, but not within warning range are displayed
in yellow; tools which are within all range limits are green.
Failed tools – Displays only the tools and formulas whose results are
beyond the fault (red) and/or warning range (yellow).
I/O Page
Formula output status is displayed on the I/O Page during run mode –
formula results are found on the third page of the I/O Page display.
As with other tool output status, formula output status is color-coded – green
(pass), yellow (warning), or red (fault).
Page 68

Formula status
shown on
I/O Display
Chapter 5
Analysis Functions and Runtime Displays
To display the formula result on the I/O Page during run mode:
• Pick Display → I/O Page to access the I/O Page display.
• Pick the Page ↓ button twice, to page down to the formula page.
Figure 5.6 Formulas displayed on I/O Page display during run mode operation
Results and Stat1 Page Displays
Formula results can be displayed on the Result Page during run mode –
along with gage and window results – provided a number of formulas
displayed is selected, during setup, using the Disp. Formulas box on the
Runtime Init. menu.
Similarly, formula statistics can be displayed on the Stat1 Page during run
mode – along with gage and window statistics.
The Disp. Formulas, Disp. Windows, and Disp. Gages parameters on the
Runtime Init. menu determine the mix of formulas,windows, and gages
whose corresponding data appear on each individual page of the Result
Page (and Stat1 Page) display panels during the run mode (these display
panels each include several “pages” of data).
To enter a value for number of formulas (or gages or windows) displayed:
• Pick Exit → Runtime Init. to access the Runtime Init. menu.
5–5
Page 69

Chapter 5
Analysis Functions and Runtime Displays
• Pick the Disp. Formulas box (or Disp. Windows or Disp. Gages box,
as appropriate); when you do, the “calculator pad” appears on the screen
as shown in Figure 5.7.
• Enter the value using the calculator pad number keys, then pick the Enter
key; the new value will appear in the Disp. Formulas box (or Disp.
Windows or Disp. Gages menu box).
Figure 5.7 Calculator pad for entering number of displayed formula/tool results
Disp. Formulas box
Calculator pad
Results Display Limitations: Since the Stat1 Page and Result Page
display panels are of a fixed size, the mix of window, gage, and light probe
results that can fit on one page of these panels must be traded off.
The maximum number of gages and/or windows you can indicate for display
(per display page) depends on whether the Disp. Probe (light probe data) is
enabled or disabled, and whether you are displaying only one kind of data
(that is, only formula, or window, or only gage data), or you are displaying a
combination of formula, window, and/or gage data.
With Disp. Probe (light probe data) disabled – If you display only one type
of data, you can display up to 12 of the the single type – that is, 12 formulas
only or 12 windows only or 12 gages only. Or you can combine two types of
tools – so that the total number of the two types is l0 or less. Or you can
combine three types of tools – so that the total of the three types is 8 or less.
5–6
With Disp. Probe (light probe data) enabled – If you display only one type
of data, you can display up to 9 of the the single type – that is, 9 formulas
only or 8 windows only or 9 gages only. Or you can combine two types of
tools – so that the total number of the two types is 7 or less. Or you can
combine three types of tools – so that the total of the three types is 5 or less.
Page 70

Chapter 5
Analysis Functions and Runtime Displays
For example, assume no light probe results are displayed (that is, Disp.
Probe: set to Disabled). If you set Disp. Formulas to 4, you can set Disp.
Windows to a value from 0–6. If you then set Disp. Windows to 3, you can
then set you can set Disp. Gages to a value from 0–1. If you then set Disp.
Gages to 1, this would display the data from formulas 1–4, windows 1–3,
and gage 1 on the first page of the Stat1 Page and Result Page display
panels, formulas 5–8, windows 4–6, and gage 2 on the second page, and so
on.
Help message: If you pick the “help” symbol
Formulas, Disp. Windows or Disp. Gages box selected, the help message
box . . .
Figure 5.8 Typical help message for the Disp. W indows option
. . . will show you the current maximum number of formulas, windows or
gages that you can select, given the number of tools currently selected, and
the enabled/disabled status of the light probe results display.
To display the formula/tool results on the Result Page during run mode:
with the Disp.
• Pick Display → Result Page to access the Result Page display.
• Pick the Page ↓ and Page ↑ buttons to page up or down through the
formula and tool results.
To display the formula/tool statistics on the Stat1 Page during run mode:
• Pick Display → Stat1 Page to access the Stat1 Page display.
• Pick the Page ↓ and Page ↑ buttons to page up or down through the
formula and tool statistics.
5–7
Page 71

Appendix
Objective
A–B
A
Color CVIM Communications with
MATH-PAK Installed
This appendix discusses and lists the configuration, result, and discrete bit
output information for MATH-PAK formulas, which is accessible through
the communication ports of the Color CVIM module. This information
includes:
• Location and format of formula results blocks.
• Accessing formula results and statistics.
• Location and format of formula configuration blocks.
• Location and format of discrete bit outputs for formulas.
Formula Data Replaces Tool Data
Formula Tool Formula Tool Formula Tool Formula Tool
1 Window 1 15 Gage 7 29 Gage 13 43 Gage 19
2 Window 2 16 Gage 8 30 Gage 14 44 Gage 20
3 Window 3 17 Window 9 31 Gage 15 45 Gage 21
4 Window 4 18 Window 10 32 Gage 16 46 Gage 22
5 Window 5 19 Window 11 33 Window 17 47 Gage 23
6 Window 6 20 Window 12 34 Window 18 48 Gage 24
7 Window 7 21 Window 13 35 Window 19 49 Gage 25
8 Window 8 22 Window 14 36 Window 20 50 Gage 26
9 Gage 1 23 Window 15 37 Window 21 51 Gage 27
10 Gage 2 24 Window 16 38 Window 22 52 Gage 28
11 Gage 3 25 Gage 9 39 Window 23 53 Gage 29
12 Gage 4 26 Gage 10 40 Window 24 54 Gage 30
13 Gage 5 27 Gage 11 41 Gage 17 55 Gage 31
14 Gage 6 28 Gage 12 42 Gage 18 56 Gage 32
The Color CVIM communications manual (Cat. No. 5370-ND010) describes
how to access the configuration, results, and discrete bit output information
through the various communication ports – the backplane, remote I/O port,
and the RS-232 port. That information also applies with MATH–PAK
installed, except when any formulas are enabled. When a formula is enabled
in the Color CVIM configuration, the results, discrete bit, and configuration
information for all enabled formulas will replace the results, discrete bit, and
configuration information for the corresponding gages or windows.
Table A.1 provides a listing of formula numbers and the corresponding tools.
Table A.1
Formula numbers and corresponding gage/window numbers
A–1
Page 72

Appendix A
Color CVIM Communications with MATH-PAK Installed
Results Blocks
The Color CVIM communications manual lists and describes all of the
accessible results blocks. The results information for an enabled formula
will replace the results information for a corresponding gage or window in
the results blocks, as shown in the following tables:
• Table 4.C, page 4–14, shows the locations of the formula results in results
block 1.
• Table 4.D, page 4–18, shows the locations of the formula results in results
block 2.
• Table 4.B, page 4–10, shows the locations of the formula results in results
block 3.
Configurable results block: Results block 6 is a configurable results block
(refer to the Color CVIM communications manual for more information). If
need be, you can configure results block 6 to supply tool results information
that has been replaced by formula information in results blocks 1–3. You
cannot configure the results block 6 to provide formula results information.
When attempting to use results block 6 to obtain gage or window statistics
information, the gage or window statistics will be replaced by formula
statistics, if the corresponding formula is enabled (refer to Table A.1, page
A–1, for a listing of the formula numbers and the corresponding tools).
Data types for formula results:
• If the results are for a formula which includes any items that require fixed
point values, then the result will be conveyed in fixed point values
(16.16).
• If the results are for a formula which has only items that require integer
values, then the result will be conveyed in integer values (32.0).
A–2
Page 73

Word #
RS–232
PI
Backplane
56–57 24–25 0–15
58–59 26–27 0–15
60–61 28–29 0–15
62–63 30–31 0–15
64–65 32–33 0–15
66–67 34–35 0–15
68–69 36–37 0–15
70–71 38–39 0–15
72–73 40–41 0–15
74–75 42–43 0–15
76–77 44–45 0–15
78–79 46–47 0–15
80–81 48–49 0–15
82–83 50–51 0–15
84–85 52–53 0–15
86–87 54–55 0–15
and
Remote
I/O
Bit #
Table A.2
Results Block 1 – Formula/T ool Results
Enabled Formula
(Formula Not Enabled)
Formula #1 Result
(Window #1 Value)
Formula #2 Result
(Window #2 Value)
Formula #3 Result
(Window #3 Value)
Formula #4 Result
(Window #4 Value)
Formula #5 Result
(Window #5 Value)
Formula #6 Result
(Window #6 Value)
Formula #7 Result
(Window #7 Value)
Formula #8 Result
(Window #8 Value)
Formula #9 Result
(Gage #1 Value)
Formula #10 Result
(Gage #2 Value)
Formula #11 Result
(Gage #3 Value)
Formula #12 Result
(Gage #4 Value)
Formula #13 Result
(Gage #5 Value)
Formula #14 Result
(Gage #6 Value)
Formula #15 Result
(Gage #7 Value)
Formula #16 Result
(Gage #8 Value)
Usage Notes
Appendix A
Color CVIM Communications with MATH-PAK Installed
A–3
Page 74

Appendix A
Color CVIM Communications with MATH-PAK Installed
Word #
RS–232
PI
Backplane
98–99 2–3 0–15
100–101 4–5 0–15
102–103 6–7 0–15
104–105 8–9 0–15
106–107 10–11 0–15
108–109 12–13 0–15
110–111 14–15 0–15
112–113 16–17 0–15
114–115 18–19 0–15
116–117 20–21 0–15
118–119 22–23 0–15
120–121 24–25 0–15
122–123 26–27 0–15
124–125 28–29 0–15
126–127 30–31 0–15
128–129 32–33 0–15
130–131 34–35 0–15
132–133 36–37 0–15
134–135 38–39 0–15
136–137 40–41 0–15
and
Remote
I/O
Bit #
(Formula Not Enabled)
Table A.3 (part 1 of 2)
Results Block 2 – Formula/Tool Results
Enabled Formula
Formula #17 Result
(Window #9 Value)
Formula #18 Result
(Window #10 Value)
Formula #19 Result
(Window #11 Value)
Formula #20 Result
(Window #12 Value)
Formula #21 Result
(Window #13 Value)
Formula #22 Result
(Window #14 Value)
Formula #23 Result
(Window #15 Value)
Formula #24 Result
(Window #16 Value)
Formula #25 Result
(Gage #9 Value)
Formula #26 Result
(Gage #10 Value)
Formula #27 Result
(Gage #11 Value)
Formula #28 Result
(Gage #12 Value)
Formula #29 Result
(Gage #13 Value)
Formula #30 Result
(Gage #14 Value)
Formula #31 Result
(Gage #15 Value)
Formula #32 Result
(Gage #16 Value)
Formula #33 Result
(Window #17 Value)
Formula #34 Result
(Window #18 Value)
Formula #35 Result
(Window #19 Value)
Formula #36 Result
(Window #20 Value)
Usage Notes
A–4
Page 75

Word #
RS–232
PI
Backplane
138–139 42–43 0–15
140–141 44–45 0–15
142–143 46–47 0–15
144–145 48–49 0–15
146–147 50–51 0–15
148–149 52–53 0–15
150–151 54–55 0–15
152–153 56–57 0–15
154–155 58–59 0–15
156–157 60–61 0–15
and
Remote
I/O
Bit #
Table A.3 (part 2 of 2)
Results Block 2 – Formula/Tool Results
Enabled Formula
(Formula Not Enabled)
Formula #37 Result
(Window #21 Value)
Formula #38 Result
(Window #22 Value)
Formula #39 Result
(Window #23 Value)
Formula #40 Result
(Window #24 Value)
Formula #41 Result
(Gage #17 Value)
Formula #42 Result
(Gage #18 Value)
Formula #43 Result
(Gage #19 Value)
Formula #44 Result
(Gage #20 Value)
Formula #45 Result
(Gage #21 Value)
Formula #46 Result
(Gage #22 Value)
Usage Notes
Appendix A
Color CVIM Communications with MATH-PAK Installed
A–5
Page 76

Appendix A
Color CVIM Communications with MATH-PAK Installed
Word #
RS–232
PI
Backplane
162–163 2–3 0–15
164–165 4–5 0–15
166–167 6–7 0–15
168–169 8–9 0–15
170–171 10–11 0–15
172–173 12–13 0–15
174–175 14–15 0–15
176–177 16–17 0–15
178–179 18–19 0–15
180–181 20–21 0–15
and
Remote
I/O
Bit #
(Formula Not Enabled)
Table A.4
Results Block 3 – Formula/Tool Results
Enabled Formula
Formula #47 Result
(Gage #23 Value)
Formula #48 Result
(Gage #24 Value)
Formula #49 Result
(Gage #25 Value)
Formula #50 Result
(Gage #26 Value)
Formula #51 Result
(Gage #27 Value)
Formula #52 Result
(Gage #28 Value)
Formula #53 Result
(Gage #29 Value)
Formula #54 Result
(Gage #30 Value)
Formula #55 Result
(Gage #31 Value)
Formula #56 Result
(Gage #32 Value)
Usage Notes
Configuration Blocks
A–6
The Color CVIM communications manual lists and describes all of the
accessible configuration blocks. The configuration information for an
enabled formula (fault and warning range information only) will replace the
configuration information for a corresponding gage or window in the
configuration blocks, as shown in the following tables:
• Table A.5, page A–7, shows a summary cross-listing of the configuration
block numbers for corresponding formulas and tools.
• Table A.6, page A–8, shows the configuration block information (blocks
46–77) for formulas 9–16, 25–32, 41–56 (gages 1–32).
• Table A.7, page A–9, shows the configuration block information (even
numbered blocks, 110–156) – for formulas 1–8, 17–24, 33–40 (windows
1–24).
Page 77

Appendix A
Color CVIM Communications with MATH-PAK Installed
Table A.5
Configurations block numbering for formulas 1–56 (and corresponding tools)
Formula Tool
1 Win. 1 110 29 Gage 13 58
2 Win. 2 112 30 Gage 14 59
3 Win. 3 114 31 Gage 15 60
4 Win. 4 116 32 Gage 16 61
5 Win. 5 118 33 Win. 17 142
6 Win. 6 120 34 Win. 18 144
7 Win. 7 122 35 Win. 19 146
8 Win. 8 124 36 Win. 20 148
9 Gage 1 46 37 Win. 21 150
10 Gage 2 47 38 Win. 22 152
11 Gage 3 48 39 Win. 23 154
12 Gage 4 49 40 Win. 24 156
13 Gage 5 50 41 Gage 17 62
14 Gage 6 51 42 Gage 18 63
15 Gage 7 52 43 Gage 19 64
16 Gage 8 53 44 Gage 20 65
17 Win. 9 126 45 Gage 21 66
18 Win. 10 128 46 Gage 22 67
19 Win. 11 130 47 Gage 23 68
20 Win. 12 132 48 Gage 24 69
21 Win. 13 134 49 Gage 25 70
22 Win. 14 136 50 Gage 26 71
23 Win. 15 138 51 Gage 27 72
24 Win. 16 140 52 Gage 28 73
25 Gage 9 54 53 Gage 29 74
26 Gage 10 55 54 Gage 30 75
27 Gage 11 56 55 Gage 31 76
28 Gage 12 57 56 Gage 32 77
Config.
Block
Formula Tool
Config.
Block
A–7
Page 78

Appendix A
Color CVIM Communications with MATH-PAK Installed
Table A.6
Configuration blocks 46–77 – for formulas 9–16, 25–32, 41–56 (gages 1–32) – fault and
warning ranges
Remote I/O
& RS–232
Word #*
17 0–15 Fault Range High (Integer)
18 0–15 Fault Range High (Fraction)
19 0–15 Fault Range Low (Integer)
20 0–15 Fault Range Low (Fraction)
21 0–15 Warning Range High (Integer)
22 0–15 Warning Range High (Fraction)
23 0–15
24 0–15 Warning Range Low (Fraction)
25–27 0–15 Reserved
* Refer to Color CVIM Communications Manual, Chapter 6, for Pyramid Integrator long word descriptions.
Bit # Definition Usage Notes
Warning Range Low
(Integer)
Words 17 and 18 represent a 16 (bit).16 (bit)
fixed point decimal value or 32 bit integer R
Words 19 and 20 represent a 16 (bit).16 (bit)
fixed point decimal value or 32 bit integer.
Words 21 and 22 represent a 16 (bit).16 (bit)
fixed point decimal value or 32 bit integer.
Words 23 and 24 represent a 16 (bit).16 (bit)
fixed point decimal value or 32 bit integer.
Configuration blocks 46–77 provide the fault and warning range information
for gages 1–32, respectively, if no corresponding formulas are enabled. If
formulas are enabled, the fault and warning ranges for the enabled formulas
will replace the ranges for corresponding gages in the configuration blocks.
For a listing of configuration blocks for corresponding formulas and tools,
refer to Table A.5, page A–7.
A–8
Page 79

Remote I/O
& RS–232
Word #
15 0–15 Fault Range High (Integer)
16 0–15 Fault Range High (Fraction)
17 0–15 Fault Range Low (Integer)
18 0–15 Fault Range Low (Fraction)
19 0–15
20 0–15
21 0–15
22 0–15
23 0–15 Reserved
Bit # Definition Usage Notes
Warning Range High
(Integer)
Warning Range High
(Fraction)
Warning Range Low
(Integer)
Warning Range Low
(Fraction)
Appendix A
Color CVIM Communications with MATH-PAK Installed
Table A.7
Configuration blocks (even numbered, 110–156) for formulas 1–8, 17–24, 33–40
(windows 1–24) – fault and warning ranges
Words 15 and 16 represent a 16 (bit).16 (bit)
fixed point decimal value or 32 bit integer.
Words 17 and 18 represent a 16 (bit).16 (bit)
fixed point decimal value or 32 bit integer.
Words 19 and 20 represent a 16 (bit). 16 (bit)
fixed point decimal value or 32 bit integer.
Words 21 and 22 represent a 16 (bit).16 (bit)
fixed point decimal value or 32 bit integer.
Discrete Bits
Configuration blocks 110-156 (even-numbered) provide the fault and
warning range information for windows 1–24, respectively, if no
corresponding formulas are enabled. If formulas are enabled, the fault and
warning ranges for the enabled formulas will replace the ranges for
corresponding windows in the configuration blocks. For a listing of
configuration blocks for corresponding formulas and tools, refer to
Table A.5, page A–7.
Formula contents: The contents of the defined formulas are stored in
blocks in a portion of Color CVIM memory referred to in the Color CVIM
Communications Manual as “template” memory. In order to transfer the
formula content information, you must set the discrete bits for template block
transfer (refer to, in the Color CVIM Communications Manual, Table 4.C,
Word 23, Block Transfer Type bits).
The Color CVIM communications manual lists and describes all of the
accessible discrete bits. The discrete bit information for an enabled formula
(fault and warning range flags) will replace the discrete bit information for a
corresponding gage or window, as shown in Table A.8, beginning on page
A–10.
A–9
Page 80

Appendix A
Color CVIM Communications with MATH-PAK Installed
Table A.8 (part 1 of 6)
Discrete Input Bits for formulas and corresponding tools
PI Backplane Remote I/O RS–232 ASCII RS–232 DF1
Word # Bit # Word # Bit #* Hex # Bit # Byte # Bit #
17 0 1 0 4 0 11 0
17 1 1 1 4 1 11 1
17 2 1 2 4 2 11 2
17 3 1 3 4 3 11 3
17 4 1 4 4 4 11 4
17 5 1 5 4 5 11 5
17 6 1 6 4 6 11 6
17 7 1 7 4 7 11 7
17 8 1 10 5 0 10 0
17 9 1 11 5 1 10 1
17 10 1 12 5 2 10 2
17 11 1 13 5 3 10 3
17 12 1 14 5 4 10 4
17 13 1 15 5 5 10 5
17 14 1 16 5 6 10 6
17 15 1 17 5 7 10 7
18 0 2 0 6 0 13 0
18 1 2 1 6 1 13 1
18 2 2 2 6 2 13 2
18 3 2 3 6 3 13 3
*Remote I/O bit numbers are octal-based.
Definition Usage
Formula 1 / Window 1
Warning Flag
Formula 1 / Window 1
Fault Flag
Formula 2 / Window 2
Warning Flag
Formula 2 / Window 2
Fault Flag
Formula 3 / Window 3
Warning Flag
Formula 3 / Window 3
Fault Flag
Formula 4 / Window 4
Warning Flag
Formula 4 / Window 4
Fault Flag
Formula 5 / Window 5
Warning Flag
Formula 5 / Window 5
Fault Flag
Formula 6 / Window 6
Warning Flag
Formula 6 / Window 6
Fault Flag
Formula 7 / Window 7
Warning Flag
Formula 7 / Window 7
Fault Flag
Formula 8 / Window 8
Warning Flag
Formula 8 / Window 8
Fault Flag
Formula 17 / Window 9
Warning Flag
Formula 17 / Window 9
Fault Flag
Formula 18 / Window 10
Warning Flag
Formula 18 / Window 10
Fault Flag
0 = Pass
1 = Fail
0 = Pass
1 = Fail
0 = Pass
1 = Fail
0 = Pass
1 = Fail
0 = Pass
1 = Fail
0 = Pass
1 = Fail
0 = Pass
1 = Fail
0 = Pass
1 = Fail
0 = Pass
1 = Fail
0 = Pass
1 = Fail
0 = Pass
1 = Fail
0 = Pass
1 = Fail
0 = Pass
1 = Fail
0 = Pass
1 = Fail
0 = Pass
1 = Fail
0 = Pass
1 = Fail
0 = Pass
1 = Fail
0 = Pass
1 = Fail
0 = Pass
1 = Fail
0 = Pass
1 = Fail
A–10
Page 81

Appendix A
Color CVIM Communications with MATH-PAK Installed
Table A.8 (part 2 of 6)
Discrete Input Bits for formulas and corresponding tools
PI Backplane Remote I/O RS–232 ASCII RS–232 DF1
Word # Bit # Word # Bit #* Hex # Bit # Byte # Bit #
18 4 2 4 6 4 13 4
18 5 2 5 6 5 13 5
18 6 2 6 6 6 13 6
18 7 2 7 6 7 13 7
18 8 2 10 7 0 12 0
18 9 2 11 7 1 12 1
18 10 2 12 7 2 12 2
18 11 2 13 7 3 12 3
18 12 2 14 7 4 12 4
18 13 2 15 7 5 12 5
18 14 2 16 7 6 12 6
18 15 2 17 7 7 12 7
19 0 3 0 8 0 15 0
19 1 3 1 8 1 15 1
19 2 3 2 8 2 15 2
19 3 3 3 8 3 15 3
19 4 3 4 8 4 15 4
19 5 3 5 8 5 15 5
19 6 3 6 8 6 15 6
19 7 3 7 8 7 15 7
*Remote I/O bit numbers are octal-based.
Definition Usage
Formula 19 / Window 11
Warning Flag
Formula 19 / Window 11
Fault Flag
Formula 20 / Window 12
Warning Flag
Formula 20 / Window 12
Fault Flag
Formula 21 / Window 13
Warning Flag
Formula 21 / Window 13
Fault Flag
Formula 22 / Window 14
Warning Flag
Formula 22 / Window 14
Fault Flag
Formula 23 / Window 15
Warning Flag
Formula 23 / Window 15
Fault Flag
Formula 24 / Window 16
Warning Flag
Formula 24 / Window 16
Fault Flag
Formula 33 / Window 17
Warning Flag
Formula 33 / Window 17
Fault Flag
Formula 34 / Window 18
Warning Flag
Formula 34 / Window 18
Fault Flag
Formula 35 / Window 19
Warning Flag
Formula 35 / Window 19
Fault Flag
Formula 36 / Window 20
Warning Flag
Formula 36 / Window 20
Fault Flag
0 = Pass
1 = Fail
0 = Pass
1 = Fail
0 = Pass
1 = Fail
0 = Pass
1 = Fail
0 = Pass
1 = Fail
0 = Pass
1 = Fail
0 = Pass
1 = Fail
0 = Pass
1 = Fail
0 = Pass
1 = Fail
0 = Pass
1 = Fail
0 = Pass
1 = Fail
0 = Pass
1 = Fail
0 = Pass
1 = Fail
0 = Pass
1 = Fail
0 = Pass
1 = Fail
0 = Pass
1 = Fail
0 = Pass
1 = Fail
0 = Pass
1 = Fail
0 = Pass
1 = Fail
0 = Pass
1 = Fail
A–11
Page 82

Appendix A
Color CVIM Communications with MATH-PAK Installed
Table A.8 (part 3 of 6)
Discrete Input Bits for formulas and corresponding tools
PI Backplane Remote I/O RS–232 ASCII RS–232 DF1
Word # Bit # Word # Bit #* Hex # Bit # Byte # Bit #
19 8 3 10 9 0 14 0
19 9 3 11 9 1 14 1
19 10 3 12 9 2 14 2
19 11 3 13 9 3 14 3
19 12 3 14 9 4 14 4
19 13 3 15 9 5 14 5
19 14 3 16 9 6 14 6
19 15 3 17 9 7 14 7
20 0 4 0 10 0 17 0
20 1 4 1 10 1 17 1
20 2 4 2 10 2 17 2
20 3 4 3 10 3 17 3
20 4 4 4 10 4 17 4
20 5 4 5 10 5 17 5
20 6 4 6 10 6 17 6
20 7 4 7 10 7 17 7
20 8 4 10 11 0 16 0
20 9 4 11 11 1 16 1
20 10 4 12 11 2 16 2
20 11 4 13 11 3 16 3
*Remote I/O bit numbers are octal-based.
Definition Usage
Formula 37 / Window 21
Warning Flag
Formula 37 / Window 21
Fault Flag
Formula 38 / Window 22
Warning Flag
Formula 38 / Window 22
Fault Flag
Formula 39 / Window 23
Warning Flag
Formula 39 / Window 23
Fault Flag
Formula 40 / Window 24
Warning Flag
Formula 40 / Window 24
Fault Flag
Formula 9 / Gage 1
Warning Flag
Formula 9 / Gage 1
Fault Flag
Formula 10 / Gage 2
Warning Flag
Formula 10 / Gage 2
Fault Flag
Formula 11 / Gage 3
Warning Flag
Formula 11 / Gage 3
Fault Flag
Formula 12 / Gage 4
Warnig Flag
Formula 12 / Gage 4
Fault Flag
Formula 13 / Gage 5
Warning Flag
Formula 13 / Gage 5
Fault Flag
Formula 14 / Gage 6
Warning Flag
Formula 14 / Gage 6
Fault Flag
0 = Pass
1 = Fail
0 = Pass
1 = Fail
0 = Pass
1 = Fail
0 = Pass
1 = Fail
0 = Pass
1 = Fail
0 = Pass
1 = Fail
0 = Pass
1 = Fail
0 = Pass
1 = Fail
0 = Pass
1 = Fail
0 = Pass
1 = Fail
0 = Pass
1 = Fail
0 = Pass
1 = Fail
0 = Pass
1 = Fail
0 = Pass
1 = Fail
0 = Pass
1 = Fail
0 = Pass
1 = Fail
0 = Pass
1 = Fail
0 = Pass
1 = Fail
0 = Pass
1 = Fail
0 = Pass
1 = Fail
A–12
Page 83

Appendix A
Color CVIM Communications with MATH-PAK Installed
Table A.8 (part 4 of 6)
Discrete Input Bits for formulas and corresponding tools
PI Backplane Remote I/O RS–232 ASCII RS–232 DF1
Word # Bit # Word # Bit #* Hex # Bit # Byte # Bit #
20 12 4 14 11 4 16 4
20 13 4 15 11 5 16 5
20 14 4 16 11 6 16 6
20 15 4 17 11 7 16 7
21 0 5 0 12 0 19 0
21 1 5 1 12 1 19 1
21 2 5 2 12 2 19 2
21 3 5 3 12 3 19 3
21 4 5 4 12 4 19 4
21 5 5 5 12 5 19 5
21 6 5 6 12 6 19 6
21 7 5 7 12 7 19 7
21 8 5 10 13 0 18 0
21 9 5 11 13 1 18 1
21 10 5 12 13 2 18 2
21 11 5 13 13 3 18 3
21 12 5 14 13 4 18 4
21 13 5 15 13 5 18 5
21 14 5 16 13 6 18 6
21 15 5 17 13 7 18 7
*Remote I/O bit numbers are octal-based.
Definition Usage
Formula 15 / Gage 7
Warning Flag
Formula 15 / Gage 7
Fault Flag
Formula 16 / Gage 8
Warning Flag
Formula 16 / Gage 8
Fault Flag
Formula 25 / Gage 9
Warning Flag
Formula 25 / Gage 9
Fault Flag
Formula 26 / Gage 10
Warning Flag
Formula 26 / Gage 10
Fault Flag
Formula 27 / Gage 11
Warning Flag
Formula 27 / Gage 11
Fault Flag
Formula 28 / Gage 12
Warning Flag
Formula 28 / Gage 12
Fault Flag
Formula 29 / Gage 13
Warning Flag
Formula 29 / Gage 13
Fault Flag
Formula 30 / Gage 14
Warning Flag
Formula 30 / Gage 14
Fault Flag
Formula 31 / Gage 15
Warning Flag
Formula 31 / Gage 15
Fault Flag
Formula 32 / Gage 16
Warning Flag
Formula 32 / Gage 16
Fault Flag
0 = Pass
1 = Fail
0 = Pass
1 = Fail
0 = Pass
1 = Fail
0 = Pass
1 = Fail
0 = Pass
1 = Fail
0 = Pass
1 = Fail
0 = Pass
1 = Fail
0 = Pass
1 = Fail
0 = Pass
1 = Fail
0 = Pass
1 = Fail
0 = Pass
1 = Fail
0 = Pass
1 = Fail
0 = Pass
1 = Fail
0 = Pass
1 = Fail
0 = Pass
1 = Fail
0 = Pass
1 = Fail
0 = Pass
1 = Fail
0 = Pass
1 = Fail
0 = Pass
1 = Fail
0 = Pass
1 = Fail
A–13
Page 84

Appendix A
Color CVIM Communications with MATH-PAK Installed
Table A.8 (part 5 of 6)
Discrete Input Bits for formulas and corresponding tools
PI Backplane Remote I/O RS–232 ASCII RS–232 DF1
Word # Bit # Word # Bit #* Hex # Bit # Byte # Bit #
22 0 6 0 14 0 21 0
22 1 6 1 14 1 21 1
22 2 6 2 14 2 21 2
22 3 6 3 14 3 21 3
22 4 6 4 14 4 21 4
22 5 6 5 14 5 21 5
22 6 6 6 14 6 21 6
22 7 6 7 14 7 21 7
22 8 6 10 15 0 20 0
22 9 6 11 15 1 20 1
22 10 6 12 15 2 20 2
22 11 6 13 15 3 20 3
22 12 6 14 15 4 20 4
22 13 6 15 15 5 20 5
22 14 6 16 15 6 20 6
22 15 6 17 15 7 20 7
23 0 7 0 15 0 23 0
23 1 7 1 16 1 23 1
23 2 7 2 16 2 23 2
23 3 7 3 16 3 23 3
*Remote I/O bit numbers are octal-based.
Definition Usage
Formula 41 / Gage 17
Warning Flag
Formula 41 / Gage 17
Fault Flag
Formula 42 / Gage 18
Warning Flag
Formula 42 / Gage 18
Fault Flag
Formula 43 / Gage 19
Warning Flag
Formula 43 / Gage 19
Fault Flag
Formula 44 / Gage 20
Warning Flag
Formula 44 / Gage 20
Fault Flag
Formula 45 / Gage 21
Warning Flag
Formula 45 / Gage 21
Fault Flag
Formula 46 / Gage 22
Warning Flag
Formula 46 / Gage 22
Fault Flag
Formula 47 / Gage 23
Warning Flag
Formula 47 / Gage 23
Fault Flag
Formula 48 / Gage 24
Warning Flag
Formula 48 / Gage 24
Fault Flag
Formula 49 / Gage 25
Warning Flag
Formula 49 / Gage 25
Fault Flag
Formula 50 / Gage 26
Warning Flag
Formula 50 / Gage 26
Fault Flag
0 = Pass
1 = Fail
0 = Pass
1 = Fail
0 = Pass
1 = Fail
0 = Pass
1 = Fail
0 = Pass
1 = Fail
0 = Pass
1 = Fail
0 = Pass
1 = Fail
0 = Pass
1 = Fail
0 = Pass
1 = Fail
0 = Pass
1 = Fail
0 = Pass
1 = Fail
0 = Pass
1 = Fail
0 = Pass
1 = Fail
0 = Pass
1 = Fail
0 = Pass
1 = Fail
0 = Pass
1 = Fail
0 = Pass
1 = Fail
0 = Pass
1 = Fail
0 = Pass
1 = Fail
0 = Pass
1 = Fail
A–14
Page 85

Appendix A
Color CVIM Communications with MATH-PAK Installed
Table A.8 (part 6 of 6)
Discrete Input Bits for formulas and corresponding tools
PI Backplane Remote I/O RS–232 ASCII RS–232 DF1
Word # Bit # Word # Bit #* Hex # Bit # Byte # Bit #
23 4 7 4 16 4 23 4
23 5 7 5 16 5 23 5
23 6 7 6 16 6 23 6
23 7 7 7 16 7 23 7
23 8 7 10 17 0 22 0
23 9 7 11 17 1 22 1
23 10 7 12 17 2 22 2
23 11 7 13 17 3 22 3
23 12 7 14 17 4 22 4
23 13 7 15 17 5 22 5
23 14 7 16 17 6 22 6
23 15 7 17 17 7 22 7
*Remote I/O bit numbers are octal-based.
Definition Usage
Formula 51 / Gage 27
Warning Flag
Formula 51 / Gage 27
Fault Flag
Formula 52 / Gage 28
Warning Flag
Formula 52 / Gage 28
Fault Flag
Formula 53 / Gage 29
Warning Flag
Formula 53 / Gage 29
Fault Flag
Formula 54 / Gage 30
Warning Flag
Formula 54 / Gage 30
Fault Flag
Formula 55 / Gage 31
Warning Flag
Formula 55 / Gage 31
Fault Flag
Formula 56 / Gage 32
Warning Flag
Formula 56 / Gage 32
Fault Flag
0 = Pass
1 = Fail
0 = Pass
1 = Fail
0 = Pass
1 = Fail
0 = Pass
1 = Fail
0 = Pass
1 = Fail
0 = Pass
1 = Fail
0 = Pass
1 = Fail
0 = Pass
1 = Fail
0 = Pass
1 = Fail
0 = Pass
1 = Fail
0 = Pass
1 = Fail
0 = Pass
1 = Fail
A–15
Page 86

Index
A
Absolute value operator, 4–24
Analysis function, 5–1, 5–2
AND operator, 4–33
Arccosine operator, 4–26
Arcsine operator, 4–26
Arctangent operator, 4–26
Arithmetic operators, 4–21
Arrow keys, 4–6
Attention, notices of, 1–2
Audience, intended, 1–1
Average operator, 4–30
B
Bits, discrete, A–9
(table), A–10
C
Chapter descriptions (table), 1–1
Conditional operators, 4–35
Config. Results box, 4–5
Configurable results block, A–2
Configuration blocks, A–6
(table), A–7
Formula contents, A–9
Constants, entering as operands, 4–16
Contents, Manual, 1–1
Copy and paste
Introduction, 2–5
Using, 4–39
Additional considerations, 4–40
Example, 4–41
Corresponding tools/formulas, 4–3
Cosine operator, 4–26
D
Data types
Constants, 4–16
Formula results, A–2
Default name, 4–37
Defining a formula, 4–4
See also Formula
D (cont.’d)
Disabling a formula, 4–38
Discrete bits, A–9
(table), A–10
Distance operator, 4–25
E
Edit/control keys, 4–10
Enabling a formula, 4–38
F
Firmware, required for installing MATH–PAK, 3–1
Fixed point
Constant operand, 4–16
Formula results, A–2
Formula
Accessing MATH–PAK features, 2–4
Configuration blocks, A–6
(table), A–7
Formula content, A–9
Copy and paste, 4–39
Defining, 4–4
Basic steps, 4–1
Introduction, 2–1
Enabling / disabling, 4–38
Entry keyboard, 4–5
Using, 4–7
Example
Additional, 4–35
Editing, 4–11
Entry, 4–9
How results are applied, 2–2
Naming, 4–37
Operands, 4–12
Definitions (table), 4–14
Operators, 4–17
Definitions (table), 4–18
Execution hierarchy, 4–20
Usage, 4–21
Results
Blocks, A–2
Conversion, 4–42
Data types, A–2
Restrictions, 4–42
Runtime displays, 5–4
Selecting, 4–2
Index – 1
Page 87

Index
I
I/O page display, 5–4
Installing the MATH–PAK option, 3–1
Required firmware, 3–1
Integer
Constant operand, 4–16
Formula results, A–2
Intended audience, 1–1
Inverse trigonometric operators, 4–26
J
Jump box, 4–4
K
Keyboard, Formula entry, 4–5
Question mark (?), 4–8
Results display , 4–8
Using, 4–7
Keys
Edit/control, 4–10
Operand, 4–12
Operator, 4–17
Switching between initial and secondary sets, 4–6
L
Loading process, MATH–PAK installation, 3–2
Logical operators, 4–33
M
Manual contents, 1–1
MATH–PAK
Accessing features, 2–4
Installing, 3–1
Required firmware, 3–1
Preview, 2–1
Mathematical operators, 4–21
Maximum operator, 4–30
Median operator, 4–31
Minimum operator, 4–31
Mode operator, 4–31
Modulo operator, 4–23
N
Naming a formula, 4–37
Nesting of operations, 4–20
NOT operator, 4–34
O
Operand, 4–12
Definitions (table), 4–14
Entering constants, 4–16
Sub–code, using, 4–13
Operator, 4–17
Definitions (table), 4–18
Execution hierarchy, 4–20
Usage, 4–21
Arithmetic, 4–21
Conditional, 4–35
Inverse trigonometric, 4–26
Logical, 4–33
Mathematical, 4–21
Statistical, 4–29
Trigonometric, 4–26
OR operator, 4–34
Outputs, assigning, 4–41, 4–46
P
Parentheses, using, 4–8
Listing operands, 4–8, 4–13, 4–17
Prioritizing operations, 4–8, 4–17
Paste, copy and
Introduction, 2–5
Using, 4–39
Preview, MATH–PAK, 2–1
Publications, related, 1–2
R
Range Fail box, 5–2
Range limits, setting, 4–41
Entering for corresponding tools, 4–47
Entering for formulas, 4–43
Statistics table, 4–44
Example, 4–45
Index – 2
Page 88

Index
R (cont.’d)
Rejects, flagging consecutive (formula example),
4–35
Related publications, 1–2
Restrictions
Constant values, 4–16
Naming, 4–38
Results page display, 5–6
Results
Blocks, A–2
(table), A–3
Configurable, A–2
Conversion, 4–42
Display
Formula entry keyboard, 4–8
Runtime, 5–5
Restrictions for formulas, 4–42
Tool
(Operands table), 4–14
Enabling, 4–47
Runtime displays, 2–5, 5–3
Runtime tools display, 5–4
I/O page, 5–4
Results page, 5–5
Help message for, 5–7
Limitations, 5–6
Stat1 page, 5–5
S (cont.’d)
Sine operator, 4–26
Square operator, 4–24
Square root operator, 4–24
Statistical operators, 4–29
Statistics
For failed tools, 5–2
Runtime display (Stat1 page), 5–5
Table for range limits, 4–44
T
Tangent operator, 4–26
Tools
Configuration blocks, A–6
Formula contents, A–9
Corresponding to formulas, 4–3, A–1
Display
Analysis function, 5–1
Runtime, 5–4
Failed, statistics for, 5–2
Results
(Operand table), 4–14
Blocks, A–2
Trademarks, 1–2
Trigonometric operators, 4–26
S
Selecting a formula, 4–2, 4–3
Set Formula box, 4–5
Set Name box, 4–37
Shift register, creating (formula example), 4–36
U
Unary minus operator, 4–22
V
Variance operator, 4–32
Index – 3
Page 89

1993 Allen-Bradley Company
ALLEN-BRADLEY
A ROCKWELL INTERNATIONAL COMPANY
With offices in major cities worldwide.
WORLD HEADQUARTERS
Allen-Bradley
1201 South Second Street
Milwaukee, WI 53204 USA
Tel:(414) 382–2000
Telex:43 11 016
FAX:(414)382–4444
Catalog No. 5370–ND016 (Series A)
EUROPE/MIDDLE EAST/
AFRICA HEADQUARTERS
Allen–Bradley Europe B.V.
Amsterdamseweg 15
1422 AC Uithoorn
The Netherlands
Tel:(31) 2975/43500
Telex:(844) 18042
FAX:(31) 2975/60222
A subsidiary of Rockwell International, one of the world’s largest technology companies,
Allen-Bradley meets today’s automation challenges with over 85 years of practical plant floor
experience. More than 13,000 employees throughout the world design, manufacture and
apply a wide range of control and automation products and supporting services to help our
customers continuously improve quality, productivity and time to market. These products and
services not only control individual machines, but also integrate the manufacturing process
while providing access to vital plant floor data that can be used to support decision–making
throughout the enterprise.
ASIA/PACIFIC HEADQUARTERS
Allen–Bradley (Hong Kong) Limited
Room 1006, Block B, Sea View Estate
2-8 Watson Road
Hong Kong
Tel:(852)887-4788
Telex:(780) 64347
FAX:(852)510-9436
CANADA HEADQUARTERS
Allen–Bradley Canada Limited
135 Dundas Street
Cambridge, Ontario N1R 5X1
Canada
Tel:(519)623–1810
FAX:(519)623–8930
LATIN AMERICA
HEADQUARTERS
Allen-Bradley
1201 South Second Street
Milwaukee, WI 53204 USA
Tel:(414)382–2000
Telex:43 11 016
FAX:(414)382–2400
40064–005–01 (A)
Printed in USA
 Loading...