

Page 1

Cedex HiRes Analyzer
Addendum 2 to
Operator’s Guide, Version 1.0
Software Version 2.2.1 August 2012
For life science research only.
Not for use in diagnostic procedures.
Page 2

Information regarding
the Cedex HiRes Analyzer
Dear Valued User of the Cedex HiRes Analyzer,
Roche Diagnostics Ltd. has merged into Roche Diagnostics International Ltd and therefore
the company name has changed to
Roche Diagnostics International Ltd
In order to harmonize and improve our support, the legal manufacturer changes as follows:
Roche Diagnostics GmbH
Sandhofer Strasse 116
68305 Mannheim
Germany
If you have any further questions regarding this matter, please do not hesitate to contact your
Roche Diagnostics representative. To call, write, fax, or email us, visit the Roche Applied Science
home page, http://www.roche-applied-science.com and select your home country.
Country-specific contact information will be displayed.
The address of the legal manufacturer in section
“Prologue/Contact Addresses” changes as follows:
Old adress New adress
Roche Diagnostics Ltd.
Forrenstrasse
CH-6343 Rotkreuz
Switzerland
Roche Diagnostics GmbH
Sandhofer Strasse 116
68305 Mannheim
Germany
CEDEX and INNOVATIS are trademarks of Roche.
06845932001 a 0 812
For life science research only. ©2012 Roche Diagnostics.
Not for use in diagnostic procedures. All rights reserved.
Page 3

Cedex HiRes Analyzer
Addendum 1 to Operator’s Guide, Version 1.0
Software Version 2.2.1
January 2012
For life science research only.
Not for use in diagnostic procedures.
Page 4

Information Regarding the
Cedex HiRes Analyzer Operator’s Guide
Please read the following information, which updates information given
in the Cedex HiRes Analyzer Operator’s Guide
Dear valued user of the Cedex HiRes Analyzer
This addendum includes:
c Updated information about the procedure for removal, reinstallation or replacement of the syringe.
If you have any further questions regarding this matter, please do not hesitate to contact
our Technical Services Department at your best convenience. To call, write, fax, or email
us, visit the Roche Applied Science home page, http://www.roche-applied-science.com
and select your home country. Country-specific contact information will be displayed.
Page 5

3
Maintenance and Care
E
E
Syringe Maintenance
Section E: Maintenance and Care
Chapter 5: Syringe Maintenance
Follow the syringe maintenance procedure described on pages 130 – 131 to remove, reinstall or replace the
syringe of the Cedex HiRes System. After removal, reinstallation or replacement of the syringe, a calibration
check of the Cedex HiRes System must also be performed. Use Cedex Density Reference Standard Beads to
check the calibration and confirm that the FlowFactor is correct. If necessary, adjust the FlowFactor.
To perform the Cedex HiRes System calibration check and FlowFactor adjustment, follow the instructions
described in the online Instructions for Use for the Density Reference Standard Beads, available for download
at:
https://www.roche-applied-science.com/PROD_INF/index.jsp?&id=iforu
Ordering Information
Product Pack Size Cat. No.
Density Reference Standard Beads 1× 10 ml Batch A 06 422 659 001
Density Reference Standard Beads 1× 10 ml Batch B 06 422 667 001
Page 6

Published by
Roche Diagnostics GmbH
Sandhofer Straße 116
683 05 Mannheim
Germany
© 2012 Roche Diagnostics.
All rights reserved.
www.roche-applied-science.com
066385 97001 0112
For life science research only.
Not for use in diagnostic procedures.
CE DEX and INNOVATIS are trademarks of Roche.
Page 7
Cedex HiRes Analyzer Operator’s Guide
Software Version 2.2.1
May 2011
For life science research only.
Not for use in diagnostic procedures.
Page 8

Page 9

3
Table of Contents
Prologue 9
I. Revision History ................................................................................................................................................................ 9
II. Contact Addresses .......................................................................................................................................................... 9
III. Declaration of Conformity .........................................................................................................................................10
IV. Warranty ..............................................................................................................................................................................10
V. Trademarks ........................................................................................................................................................................10
VI. Copyrights ..........................................................................................................................................................................10
VII. Intended Use .....................................................................................................................................................................10
VIII. Software License Agreement ..................................................................................................................................11
IX. Preamble .............................................................................................................................................................................14
X. Contents of this Operator’s Guide ........................................................................................................................ 14
XI. Conventions used in this Guide .............................................................................................................................14
XII. FCC Notifi cation ..............................................................................................................................................................15
XIII. Warnings and Precautions ........................................................................................................................................16
XIV. Disposal of the Analyzer ............................................................................................................................................ 17
A Overview 19
1 Description of the Cedex HiRes System ...........................................................................................................20
2 The Measurement Procedure ..................................................................................................................................21
3 Data Analysis .................................................................................................................................................................. 22
4 Technical Specifi cations of the Analyzer .......................................................................................................... 23
B System Description 25
1 Installing the Cedex HiRes System ...................................................................................................................... 25
2 Choosing a Suitable Location .................................................................................................................................26
2.1 Connecting or disconnecting the device ..................................................................................................................26
3 Connecting Hardware Components ....................................................................................................................27
3.1 Completing the Windows Mini-setup ........................................................................................................................27
4 Installing Cedex HiRes Software 2.2 or Updating to Cedex HiRes Software 2.2 ....................... 28
4.1 Installing the Cedex HiRes Software 2.2 .................................................................................................................. 28
4.1.1. Setting the Cedex Server to Autostart .......................................................................................................................32
4.2 Starting up the Software .................................................................................................................................................33
4.3 Updating Older Cedex HiRes Software version 2.x to Cedex HiRes Software 2.2 ..................................... 34
4.3.1. Overview ................................................................................................................................................................................34
4.3.2. Updating to Cedex HiRes Software 2.2 .....................................................................................................................34
4.3.3. Restoring a Cedex HiRes Software 2 Backup ......................................................................................................... 37
5 Starting the Cedex HiRes System after Installation ...................................................................................3 9
6 Securing Access Rights ..............................................................................................................................................40
6.1 Access Control at the Windows Operating System Level ...................................................................................40
6.2 Access Control at the Cedex HiRes System Software Level ..............................................................................40
Page 10

4
Cedex HiRes Analyzer Operator’s Guide
Table of Contents
C Operation 41
1 Overview of the Cedex Control Center ...............................................................................................................41
1.1 Menu Bar ..............................................................................................................................................................................41
1.2 System Menu .......................................................................................................................................................................41
1.3 Measurement Menu ......................................................................................................................................................... 42
1.4 Functions Menu ..................................................................................................................................................................42
1.5 Reports Menu .................................................................................................................................................................... 43
1.6 Master Data Menu ............................................................................................................................................................43
1.7 Setup Menu .........................................................................................................................................................................43
1.8 Help Menu ............................................................................................................................................................................ 44
1.9 Shortcut Area ......................................................................................................................................................................44
1.10 Tracking of Status of Events Carried out by the Analyzer ..................................................................................44
2 Preparing the Analyzer for Measurements ...................................................................................................... 45
2.1 Switching on ........................................................................................................................................................................45
2.2 Logging in at the Computer Operating System Level ..........................................................................................45
2.3 Starting the Cedex HiRes Software 2.2 ....................................................................................................................45
2.4 Performing a HW Startup and Prime ..........................................................................................................................46
2.5 Preparing the Reagent Kit ..............................................................................................................................................47
2.5.1. Installing or Changing the Reagent Kit .................................................................................................................... 47
2.5.2. Refi lling Containers Individually ..................................................................................................................................48
2.6 Checking the Analyzer .....................................................................................................................................................49
3 Carrying out a Single Measurement ...................................................................................................................50
3.1 Opening the Measurement window and specifying the Operating Mode and Sample Data ..............51
3.2 Defi ning the Measurement and Analysis (Process) Parameters .....................................................................52
3.3 Preparing the Sample and Attaching it to the Multi Sample Tray or Sample Port ....................................53
3.3.1. Starting the Measurement .............................................................................................................................................53
3.3.2. End of Measurement ........................................................................................................................................................54
3.4 Interrupting a Measurement..........................................................................................................................................55
4 Working with the Multi Sampler ............................................................................................................................56
4.1 The Multi Sampler DefaultCup ..................................................................................................................................... 57
4.2 Preparing the Measurement .......................................................................................................................................... 58
4.2.1. Using the Multi Sample Tray ..........................................................................................................................................58
4.2.2. Ejecting the Multi Sample Tray ..................................................................................................................................... 58
4.2.3. Performing a Prime ............................................................................................................................................................59
4.3 Carrying out Measurements with the Multi Sampler ...........................................................................................59
4.3.1. The Multi Run Data Entry Window ..............................................................................................................................59
4.3.2. Preparing for Multiple Measurements in the Multi Run Window ................................................................... 59
4.3.3. Activating Sample Rows and Starting the Measurement .................................................................................60
4.3.4. Adding Measurements to the List while Measurements are Running .........................................................62
4.3.5. Modifying Data Entry, Changing Samples .............................................................................................................. 63
4.3.6. Non-Linear Measurements in a Sample Series ....................................................................................................63
4.4 Interrupting a Multi Run ..................................................................................................................................................63
4.5 Disruption of Measurements ......................................................................................................................................... 63
4.6 Results ...................................................................................................................................................................................64
4.6.1. The Multi Run Result List................................................................................................................................................64
5 Switching off the Cedex HiRes Analyzer...........................................................................................................65
5.1 Carrying out an LM Shutdown and HW Shutdown ..............................................................................................65
5.2 Logging out ..........................................................................................................................................................................66
5.3 Shutting down the Control Center ..............................................................................................................................66
Page 11

5
Table of Contents
D Software 67
1 Using the Measurement Results Window ........................................................................................................67
1.1 Result Data area .................................................................................................................................................................68
1.2 Sample Parameters and Processing Parameters areas .......................................................................................69
1.3 Image Area ...........................................................................................................................................................................70
1.3.1. Viewing Individual Cell Images ..................................................................................................................................... 70
1.3.2. Viewing a Cell Image Using the Image View Window ........................................................................................71
1.3.3. Excluding Images from the Evaluation Process/Including Excluded Images .............................................72
1.3.4. Viewing the Prescan Image ...........................................................................................................................................73
2 Using the Measurement List ....................................................................................................................................74
2.1 Viewing Analysis Results ................................................................................................................................................75
2.2 Searching for Measurements ........................................................................................................................................75
3 Editing Existing Analysis Results/Data Sets ................................................................................................... 76
3.1 The Reprocess Button ...................................................................................................................................................... 76
3.2 Effective Data Sets ............................................................................................................................................................77
4 Graphical Display of the Analysis Results........................................................................................................78
4.1 Enlarging the Histograms ...............................................................................................................................................78
4.2 Aggregate Histogram ....................................................................................................................................................... 79
4.3 Cell Diameter Histogram .................................................................................................................................................81
4.4 Object Diameter Histogram ...........................................................................................................................................82
4.5 Defi ning Diameter Intervals in the Diameter Histograms...................................................................................82
4.6 Compactness Histogram .................................................................................................................................................83
4.7 Measurement Statistics Histogram .............................................................................................................................84
5 Cultivation Time Chart .................................................................................................................................................85
5.1 Creating a CTC View ......................................................................................................................................................... 85
5.1.1. The View Area .....................................................................................................................................................................86
5.1.2. The Series of Measurements Belonging to Selected View Area .....................................................................86
5.1.3. Adding Measurements to a View ................................................................................................................................87
5.1.4. Editing Measurements in a View .................................................................................................................................88
5.1.5. Viewing List of Measurements in a Series ...............................................................................................................88
5.1.6. Deleting Views and Series .............................................................................................................................................. 89
5.1.7. Exporting a View ................................................................................................................................................................89
5.2 Creating a Cultivation Time Chart ...............................................................................................................................89
5.2.1. The Data Selection Area .................................................................................................................................................90
5.2.2. Fitting to the Lowest Common Value .........................................................................................................................91
5.2.3. Measurement Series Offset ...........................................................................................................................................91
5.2.4. Variable Axis Calibration .................................................................................................................................................91
5.2.5. The Exponential Regression Button ............................................................................................................................ 92
5.2.6. Printing out a Cultivation Time Chart ......................................................................................................................... 92
6 General Functions of the System ..........................................................................................................................93
6.1 Data Management ............................................................................................................................................................93
6.1.1. Printing Reports ..................................................................................................................................................................93
6.1.2. Export to fi le ......................................................................................................................................................................... 94
6.2 Data Exchange ....................................................................................................................................................................95
6.2.1. Export ....................................................................................................................................................................................95
6.2.2. Import ..................................................................................................................................................................................... 96
6.3 Viewing and Evaluating the Audit Trail File ..............................................................................................................96
6.4 User Preferences ................................................................................................................................................................ 97
6.4.1.
Adjusting Result Display in the Measurement List and Multi Run windows .............................................. 97
6.4.2. Specifying Default Measurement Parameters ........................................................................................................ 98
6.4.3. Specifying Other Default Parameters ......................................................................................................................... 98
6.4.4. Specifying the Workarea for the Analysis Data ......................................................................................................99
6.5 Changing own Password ................................................................................................................................................99
Page 12

6
Cedex HiRes Analyzer Operator’s Guide
Table of Contents
D Software Continued
7 Administrator Functions ...........................................................................................................................................100
7.1 Administration of User Accounts ...............................................................................................................................100
7.1.1. Creating User Accounts ...............................................................................................................................................100
7.1.2. Assigning Access Rights ............................................................................................................................................ 101
7.1.3. Creating user groups ......................................................................................................................................................102
7.1.4. Editing and Deleting User Accounts ........................................................................................................................102
7.1.5. Creating and Editing User roles .................................................................................................................................103
7.2 Password Management ................................................................................................................................................104
7.2.1. Specifying Password Characteristics ....................................................................................................................... 104
7.2.2. Assigning New Passwords ...........................................................................................................................................105
7.3 Assigning Work Areas ....................................................................................................................................................105
7.4 The System Options ....................................................................................................................................................... 106
7.4.1. Automatically Start the Hardware Management ................................................................................................ 106
7.4.2. Modifying the Standard Setting for the Multi Sampler DefaultCup .............................................................107
7.4.3. Turning off Automatic Incrementation of Sample Cup Position .....................................................................107
7.4.4. Turning off the Flow Chamber Prescan .................................................................................................................. 108
7.4.5. Error Level Displayed to Users ................................................................................................................................... 109
7.4.6. Liquid Container Confi guration ................................................................................................................................. 109
7.4.7. Disabling the Reagent Control ..................................................................................................................................109
7.4.8. Default Settings ............................................................................................................................................................... 109
7.5 Adjustment of the Image Analysis using the Live Operator ..................................................................................110
7.5.1. Description of the Cell Type List and Live Operator ...........................................................................................111
7.5.2. The Cell Type List Window ............................................................................................................................................111
7.5.3. Creating a New Cell Type..............................................................................................................................................112
7.5.4. Editing an Existing Cell Type ........................................................................................................................................113
7.5.5. Viewing an Existing Cell Type ......................................................................................................................................113
7.5.6. Deleting an existing Cell Type .....................................................................................................................................114
7.5.7. Working with the Live Operator..................................................................................................................................115
7.5.8. Description of the Individual Operator Parameters ............................................................................................117
7.6 Archiving Data .................................................................................................................................................................119
7.6.1. Archive .................................................................................................................................................................................119
7.6.2. Restore .................................................................................................................................................................................120
7.6.3. Deleting Archived Data .................................................................................................................................................120
Page 13

7
E Maintenance and Care 121
1 Cleaning and Maintenance Check List ............................................................................................................121
2 Scheduling Automatic Cleaning Routines .....................................................................................................122
3
Daily and Manual Maintenance and Cleaning Routines .......................................................................... 123
3.1 Checking the Reagent Containers when Manually Refi lling .........................................................................123
3.2 Cleaning Routines Carried out by the Liquid Management ............................................................................124
3.2.1. Cleaning Options .............................................................................................................................................................124
3.2.2. The Hardware Management Window ......................................................................................................................126
3.2.3. Carrying out a Cleaning Routine ................................................................................................................................126
3.2.4. Interrupting/Terminating a Cleaning Routine ........................................................................................................126
3.3 Scanning the Chamber to Verify the Effectiveness of Cleaning Routines ................................................126
4 Automatic Adjustment and Alignment Verifi cation ..................................................................................128
5 Syringe Maintenance ................................................................................................................................................ 130
5.1 Removing the Syringe ................................................................................................................................................... 130
5.2 Assembling and Installing the Syringe ................................................................................................................... 131
5.3 Maintenance of the Syringe Guide and Spindle ..................................................................................................132
6 Maintenance of the Flow chamber, 8-Way Valve and the remaining Hardware
Components .................................................................................................................................................................133
7 Operational Data ..........................................................................................................................................................133
8 The System Suitability Test (SST) ..................................................................................................................... 134
8.1 Creating SST Checkpoints........................................................................................................................................... 134
8.1.1. Creating SST Checkpoints With and Without Measurements ....................................................................... 134
8.1.2. Running a Water Blank ............................................................................................................................................... 136
8.1.3. Setting up the SSTFailureReaction in the System Options Menu ................................................................ 136
8.2 Performing an SST ...........................................................................................................................................................137
8.2.1. Performing an SST with Measurements .................................................................................................................137
8.2.2. Performing an SST without Measurements .......................................................................................................... 138
8.3 Tracking Trends in SST Results over Time ............................................................................................................. 139
8.3.1. Tracking Trends in SST Checkpoints with Measurements .............................................................................. 139
8.3.2. Tracking SST Checkpoints without Measurements .......................................................................................... 141
8.4 Locking – Unlocking the System ................................................................................................................................142
F Troubleshooting 143
1 Diagnosis of the Cedex HiRes Analyzer ..........................................................................................................143
2 Trace and Logging ....................................................................................................................................................... 144
3 The System Audit Trail File ..................................................................................................................................... 144
G Appendix 145
1 System Options und User Preferences ............................................................................................................145
Table of Contents
Page 14

8
Cedex HiRes Analyzer Operator’s Guide
Page 15
9
Prologue
Prologue
I. Revision History
Version Revision Date
1.0 May 2011
© Copyright 2011, Roche Diagnostics GmbH, all rights reserved.
Information in this document is subject to change without notice. No part of this document may be reproduced
or transmitted in any form or by any means, electronic or mechanical, for any purpose, without the express
written permission of Roche Diagnostics GmbH.
Questions or comments regarding the contents of this Operator’s Guide can be directed to your local Roche
Diagnostics representative.
Every effort has been made to ensure that all the information contained in the Cedex HiRes System Operator’s
Guide is correct at the time of printing.
However, Roche Diagnostics GmbH reserves the right to make any changes necessary without notice as part of
ongoing product development.
II. Contact Addresses
Manufacturer Roche Diagnostics Ltd.
Forrenstrasse
CH-6343 Rotkreuz
Switzerland
Distribution Roche Diagnostics GmbH
Sandhofer Straße 116
D-68305 Mannheim
Germany
Distribution in USA Roche Diagnostics
9115 Hague Road
PO Box 50457
Indianapolis, IN 46250
USA
Revision History
Page 16
10
Cedex HiRes Analyzer Operator’s Guide
III. Declaration of Conformity
The instrument meets the requirements laid down in Council Directive 2004/108/ EC relating
to “Electromagnetic Compatibility” and Council Directive 2006/95/EC relating to “Low Voltage
Equipment”. The following standards were applied: IEC/EN 61326-1 (EMC) and IEC/EN 61010-1
(Safety).
UL 61010-1 Electrical Equipment for Measurement, Control and Laboratory Use; Part 1:
General Requirements CAN/CSA-C22.2 No. 61010-1 (Second Edition) — Safety Requirements
for Electrical Equipment
IV. Warranty
The warranty conditions are specifi ed in the sales contract. Contact your Roche Diagnostics representative for
further information.
Any unauthorized modifi cation of the Cedex HiRes Analyzer and/or the Cedex HiRes Software will result in
invalidity of the guarantee and service contract.
V. Trademarks
CEDEX and INNOVATIS are trademarks of Roche.
Other brands or product names are trademarks of their respective holders.
VI. Copyrights
Cedex HiRes Analyzer Operator’s Guide. Copyright© 2011 Roche Diagnostics GmbH, all rights reserved.
Operating instructions and manuals are protected by copyright. No part of this document may be reproduced,
edited or translated without prior written consent of Roche Diagnostics GmbH except as permitted under the
terms of the copyright.
VII. Intended Use
The Cedex HiRes Analyzer automatically determines the cell concentration and viability of cell suspensions for
the purpose of life science research only.
The Cedex HiRes Analyzer is for life science research only. Not for use in diagnostic procedures.
It was neither developed nor validated by the manufacturer for any kind of in vitro diagnostic application.
Declaration of Conformity
Page 17

11
Prologue
VIII. Software License Agreement
Read the following terms and conditions of this Software License Agreement (“Agreement”) carefully before
installing the Cedex 2 Software, hereinafter referred to as (“Software”). Proceeding with the installation of the
Software will constitute acceptance of the terms and conditions of this Agreement. By accepting the terms and
conditions of this Agreement, the end user (“Licensee”) assumes all responsibility and liability for the selection
of this Software to achieve the intended results, and for its installation and subsequent use. If Licensee is not
willing to be bound by the terms and conditions of this Agreement, the Software package must be promptly
returned to Roche (“Supplier”) with a copy of the receipt against refunding of the purchase price for this
Software.
1. Programm License Agreement
Licensee assumes all responsibility and liability for the selection of this Software to achieve the intended results,
and for its installation and subsequent use. The Software is protected by copyright.
2. Grant of Software License
Supplier is entitled to grant to Licensee subject to continuous compliance with all the provisions hereinafter, a
non exclusive, single use license to use the Software upon the terms and conditions contained in this Agreement.
Licensee may:
a. Use the Software on workstations which have to be owned, leased or otherwise controlled by Licensee,
whether in a network or other confi guration.
b. Transfer the Software by assigning the rights under this Agreement to another party, provided that the other
party agrees in writing to accept the terms and conditions of this Agreement. In addition, Licensee must
ensure that the copyright notice is maintained on the Software transferred.
Licensee may not:
a. Use the Software, in whole or in part, except as expressly provided in this Agreement.
b. Use the Software on more than one workstation at a time.
c. Copy, sell, or otherwise transfer the Software or assign its rights under this Agreement, in whole or in part,
to another party, except as expressly provided in this Agreement.
d. Rent, distribute, license or sublicense the Software.
e. Create derivative works based on Software.
f. Modify, adapt, translate, reverse engineer, decompile or disassemble the Software.
Supplier reserves all rights not expressly granted herein, including, but not limited to, the rights to market the
Software either directly or through affi liates, distributors and/or third parties.
For further information, please contact your local Roche Applied Science support organization. You will fi nd
the contact information on the following webpage:
www.roche applied science.com.
3. Limited Warranty
The Software is provided “as is” without warranty of any kind, either expressed or implied, including, but not
limited to the implied warranties of merchantability and fi tness for a particular purpose. The entire risk as to
the quality and performance of the Software is with Licensee, should the Software prove to be defective. Licensee
assumes the entire costs of all necessary servicing, repair, or correction. However, Supplier warrants that the
program media on which the Software is furnished is free from defects in materials and workmanship under
normal use for a period of ninety (90) days from the date of delivery as evidenced by a copy of your receipt.
SUPPLIER MAKES NO FURTHER WARRANTIES OR GUARANTEES NOR EXPLICIT NOR IMPLIED
Software License Agreement
Page 18

12
Cedex HiRes Analyzer Operator’s Guide
4. Disclaimer of Warranties
AS FAR AS PERMITTED UNDER THE GOVERNING LAW AS SET FORTH UNDER SECTION 11 OF THIS
AGREEMENT THE WARRANTY SET FORTH IN THE PREVIOUS PARAGRAPH, IS IN LIEU OF ALL
OTHER WARRANTIES, EXPRESS OR IMPLIED, ARISING BY LAW, FROM A COURSE OF PERFORMANCE,
A COURSE OF DEALING, TRADE USAGE, OR OTHERWISE. AS FAR AS PERMITTED UNDER THE
GOVERNING LAW AS SET FORTH UNDER SECTION 11 OF THIS AGREEMENT SUPPLIER AND ANY
ENTITY CONTROLLING, CONTROLLED BY OR UNDER COMMON CONTROL WITH SUPPLIER
(“SUPPLIER’S AFFILIATE”) SPECIFICALLY DISCLAIM, WITHOUT LIMITATION, ALL WARRANTIES
OF ANY KIND, WHETHER EXPRESS OR IMPLIED, INCLUDING, WITHOUT LIMITATION, THE
IMPLIED WARRANTIES OF MERCHANTABILITY, FITNESS FOR A PARTICULAR PURPOSE, AND
NON INFRINGEMENT. SUPPLIER AND SUPPLIER’S AFFILIATES MAKE NO REPRESENTATION OR
WARRANTY AS TO THE SOFTWARE OR AS TO THE RESULTS TO BE ATTAINED BY LICENSEE OR ANY
THIRD PARTY FROM THE SOFTWARE. LICENSEE ACKNOWLEDGES THAT IT HAS NOT RELIED UPON
ANY REPRESENTATIONS OR WARRANTIES MADE BY SUPPLIER OR A SUPPLIER’S AFFILIATE EXCEPT
FOR THOSE EXPRESSLY AND SPECIFICALLY SET FORTH IN THIS AGREEMENT.
5. Limitations of Remedies
Supplier’s sole liability and Licensee’s sole remedy shall be:
a. The replacement of the program media not meeting Supplier’s limited warranty and which is returned to
Supplier with a copy of Licensee’s receipt;
b. If Supplier is unable to deliver replacement of program media which is free of defects in material and
workmanship, Licensee may terminate this Agreement by returning the Software and a copy of Licensee’s
receipt to Supplier, and Licensee’s money will be refunded.
IN NO EVENT WILL SUPPLIER OR ANY OF SUPPLIER’S AFFILIATES (OR THEIR RESPECTIVE OFFICERS,
EMPLOYEES, CONSULTANTS, ATTORNEYS OR AGENTS), BE LIABLE FOR ANY SPECIAL, INDIRECT,
INCIDENTAL, OR CONSEQUENTIAL DAMAGES (INCLUDING, BUT NOT LIMITED TO, LOST PROFITS,
LOST DATA OR INFORMATION, LOSS OF USE OF THE SOFTWARE, BUSINESS INTERRUPTION, LOSS
OF BUSINESS REPUTATION OR GOODWILL, OR DOWNTIME COSTS) WHICH THE LICENSEE OR
THIRD PARTIES MAY INCUR OR EXPERIENCE, DIRECTLY OR INDIRECTLY ARISING OUT OF OR
RELATING TO THE SOFTWARE, THIS AGREEMENT, OR THE TERMINATION OF THIS AGREEMENT,
EVEN IF SUPPLIER OR A SUPPLIER’S AFFILIATE HAS BEEN ADVISED OF THE POSSIBILITY OF SUCH
DAMAGES AND NOTWITHSTANDING ANY FAILURE OF ESSENTIAL PURPOSE. THE AGGREGATE
LIABILITY, ON A COMBINED BASIS, OF SUPPLIER AND SUPPLIER’S AFFILIATES (AND THEIR
RESPECTIVE OFFICERS, EMPLOYEES CONSULTANTS, ATTORNEYS, AND AGENTS) FOR DAMAGES
FOR ANY CAUSE WHATSOEVER DIRECTLY OR INDIRECTLY RELATING TO OR ARISING OUT OF
THIS AGREEMENT OR THE SOFTWARE, AND REGARDLESS OF THE FORM OF ACTION, SHALL BE
LIMITED TO, AT SUPPLIER’S OPTION, REPLACEMENT OF THE SOFTWARE OR REFUND OF THE
FEES RECEIVED BY SUPPLIER OR A SUPPLIER’S AFFILIATE FROM LICENSEE WITH RESPECT TO THE
SOFTWARE.
6. General Information
Licensee may not sublicense, assign or transfer the license or the Software, in whole or in part, except as expressly
provided in this Agreement. Any attempt otherwise to sublicense, assign or transfer any of the rights, duties or
obligations hereunder is void.
Software License Agreement
Page 19

13
Prologue
7. Intellectual Property Rights
Licensee shall only hold those rights to the Software that are expressly described in Section 2 of this Agreement.
Any other rights with regard to the Software, including without limitation, ownership rights and patent,
copyright, trademark, trade secret and other intellectual property rights, shall remain the sole property
of Supplier. Licensee will not remove from the Software any references to copyrights, trademarks or other
ownership rights, or cover up or alter any such references. Licensee will take all reasonable steps to prevent any
unauthorized use, reproduction, sale, or publication of the Software or the unauthorized provision of access
thereto. Licensee will indemnify and hold harmless Supplier from any losses, damages, claims and expenses
(including, without limitation, reasonable legal expenses) relating to any infringement of the rights of Supplier
caused by Licensee, Licensee’s breach of this Agreement or Licensee’s use of the Software in a manner not
authorized under this Agreement.
8. Duration and Termination
The Agreement is effective until terminated. Licensee may terminate this Agreement at any time by destroying the
Software and documentation relating to the Software in any form. The Agreement will terminate automatically
and without notice from Supplier, if Licensee fails to comply with any term or condition of this Agreement.
Licensee agrees to destroy the Software upon termination of this Agreement by Supplier. On any termination of
this Agreement, all rights of use of the Software held by Licensee shall expire.
9. Import, Export and Use of the Software
Licensee shall be exclusively responsible for ensuring compliance with the relevant legislation relating to its
rights to import, export or use the Software.
10. Miscellaneous
Should any part of this Agreement be declared void or unenforceable by a court of competent jurisdiction, the
remaining terms shall remain in full force and effect.
Failure of Supplier to enforce any of its rights in this Agreement shall not be considered a waiver of its rights,
including but not limited to its rights to respond to subsequent breaches.
By opening and using this Software Licensee acknowledges that he has read this Agreement, understands it,
and agrees to be bound by its terms and conditions. Licensee further agrees that this Agreement is the complete
and exclusive statement of the Agreement between Licensee and Supplier and supersedes any proposal or prior
agreement, oral or written, any other communications between Licensee and Supplier relating to the subject
matter of this Agreement.
The headings of the several Sections of this Agreement are intended for convenience of reference only and are
not intended to be a part of or to affect the meaning or interpretation of this Agreement.
11. Governing Law and Place of Jurisdiction
This Agreement shall be governed by and construed in accordance with the laws of Germany, without giving
effect to any choice of law principles thereof. The parties agree that the United Nations Convention on Contracts
for the International Sale of Goods (1980) is specifi cally excluded from application to this Agreement.
The parties agree that courts of Mannheim, Germany, shall have exclusive jurisdiction over any dispute arising
out of or in connection with this Agreement.
Software License Agreement
Page 20

14
Cedex HiRes Analyzer Operator’s Guide
IX. Preamble
Before setting up operation of the Cedex HiRes Analyzer, it is important to read this Operator’s Guide thoroughly
and completely. Non-observance of the instructions contained herein or performing an operation not stated in
this Operator’s Guide could involve safety hazards.
X. Contents of this Operator’s Guide
This Operator’s Guide describes the operation of the Cedex HiRes Analyzer. It contains the following chapters:
Chapter A Overview presents the specifi cations of the Cedex HiRes Analyzer.
Chapter B System Description contains the installation requirements of the Cedex HiRes Analyzer and a
description of the system’s components. This chapter also gives a short overview of the basic functions and
operation of the system.
Chapter C Operation describes the operating procedures for the Cedex HiRes Analyzer, including the correct
placement of the reagents and disposables and instructions for carrying out single and multiple measurements
of cell samples.
Chapter D Software provides a detailed description of the Cedex HiRes Analyzer software functions and
features.
Chapter E Maintenance and Care describes the maintenance and care procedures that are required for the
Cedex HiRes Analyzer.
Chapter F Troubleshooting contains troubleshooting information for the Cedex HiRes Analyzer.
Chapter G Appendix contains a detailed list of System Options and User Preferences, and an index.
XI. Conventions used in this Guide
Text Conventions
To present information consistently and memorably the following text conventions are used in this Operator’s
Guide:
Numbered list:
Steps in a procedure that must be performed in the order listed.
Italic type:
Used for operating instructions for the Cedex HiRes Software. In addition,
important notes and information notes are shown in italic type.
Blue italic type:
Refers to a different section in this Operator’s Guide, which should be consulted.
Preamble
Page 21
15
Prologue
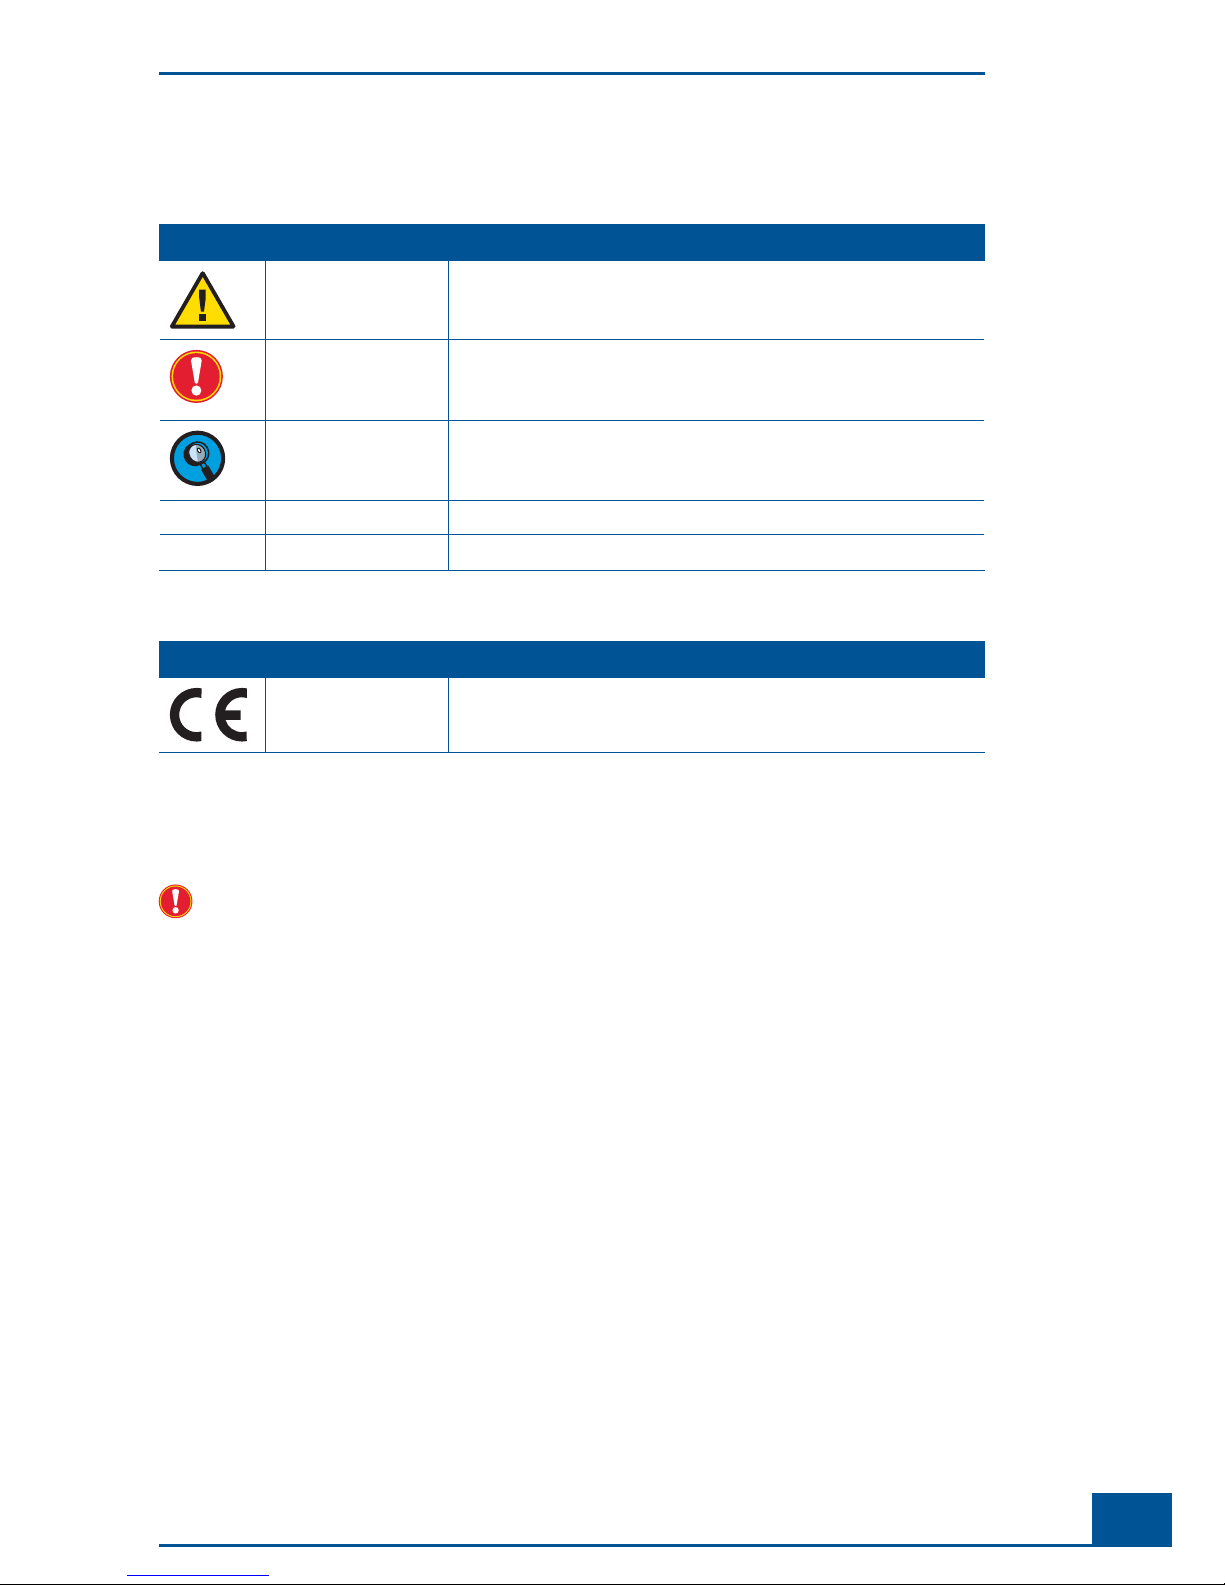
Symbols
In this Operator’s Guide the following symbols are used as visual signals:
Symbol Heading Description
WARNING This symbol is used to indicate that non-compliance with instructions or
procedures could lead to physical injury or even death or could cause
damage to the system.
IMPORTANT NOTE Information critical to the success of the procedure or use of the product.
INFORMATION NOTE Additional information about the current topic or procedure.
Procedure continued on next page.
■
End of procedure.
The following symbols appear on the analyzer
Symbol Heading Description
CE MARK The CE mark on the analyzer type plate indicates conformity with
requirements of the directives relevant for this analyzer.
XII. FCC Notifi cation
Changes or modifi cations to this unit not expressly approved by the party responsible for compliance may
void the user‘s authority to operate the equipment.
Note: This equipment has been tested and found to comply with the limits for a Class A digital device, pursuant
to Part 15 of the FCC Rules. These limits are designed to provide reasonable protection against harmful
interference when the equipment is operated in a commercial environment. This equipment generates, uses
and can radiate frequency energy and, if not installed and used in accordance with the instruction manual, may
cause harmful interference to radio communications. Operating this equipment in a residential area is likely to
cause harmful interference, in which case the user will be required to correct the interference at his own expense.
FCC Notifi cation
Page 22
16
Cedex HiRes Analyzer Operator’s Guide
XIII. Warnings and Precautions
Moving parts may cause hand injuries. Never use the Cedex HiRes Analyzer without the protective cover
on the Multi Sampler and Syringe Module.
It is important that the following safety instructions and guidelines be observed in order to ensure safe and
reliable operation of Cedex HiRes Analyzer:
Place the device on a dry and sturdy surface, free of vibrations.
Avoid transporting the device as much as possible once it has been assembled.
Prevent the device from getting wet.
Protect the device from dust and smoke.
Do not expose the device to direct sunlight.
Ensure there is suffi cient air circulation around the Cedex HiRes Analyzer during operation (particularly
around the computer and monitor).
Operate within a constant temperature range of 50°F – 100°F (10°C – 40°C).
For best performance it is recommended to keep the analyzer permanently on and only shut down the
software application on a regular basis.
The Cedex HiRes Analyzer should only be used with the supplied or specifi ed devices (Cedex HiRes
Analyzer, Cedex HiRes Software, monitor, computer, Multi Sampler, Reagent Tray).
Do not install any additional software on the corresponding computer.
Only trained personnel in a controlled laboratory environment should operate the Cedex HiRes Analyzer.
All services and repairs should be performed only by authorized service technicians.
Always ensure that there are suffi cient reagents in the reagent containers.
Clean the containers before reusing them.
Always observe the safety regulations when handling Trypan Blue, Detergent, Cleaning Solution or acids
and bases.
Waste contaminated with tissue or cells, e.g. Cedex Sample Cups, pipette tips, etc., must be disposed of
according to the recommended rules for handling biohazard materials.
Any leaks in the Liquid Management system must be repaired immediately. Contact your distributor or
authorized service technician.
Always ensure that there is a Cedex Sample Cup attached to the single sample port or placed in the Default-
Cup position on the Multi Sample tray.
Only use Cedex Detergent for the cleaning process in the Liquid Management system.
Only use Cedex Sample Cups from Roche Diagnostics GmbH for the conveyance of cell samples to the
sample port.
Other sample cups can cause irreparable damage to the Cedex HiRes Analyzer!
Always wear protective clothing, particularly gloves, when handling samples.
To prevent damage to the fl ow chamber, no particles larger than 80 µm should enter the measurement
system.
Particles ( especially microcarriers) larger than 90 µm should not gain access into the analyzer because they
cause irreparable damage and render the device non-functional.
Dirt or dust particles should not gain access into the device.
Ensure that all equipment required for sample preparation, e.g. Cedex Sample Cups, pipette tips, etc., are
stored in a dust-free environment since coarse dust particles can impair the fl ow chamber’s functionality.
Check that the Cedex Sample Cup is free of contamination before use. Only clean Cedex Sample Cups can
guarantee optimal functioning of the Cedex HiRes Analyzer.
Warnings and Precautions
Page 23
17
Prologue
Ensure that the Trypan Blue solution is free of contamination, otherwise fi lter prior to use. Roche Diagnostics
GmbH recommends the use of the Cedex HiRes Reagent Kit.
Secure your measurement data.
If the system has been upgraded from some previous version to Software version 2.2, it is possible that some
default settings in the System Options may have slightly different values than those described in this manual.
The settings described in this manual apply to systems on which Software version 2.2 has been installed as
the original software.
The software and hardware of your Cedex HiRes System can differ from the information described here, but
this should not make a difference to the operational functions in general.
The manufacturer is not responsible or liable for any damages resulting from improper use or failure to
comply with the regulations in the Operating Instructions.
Electrical Safety
The Cedex HiRes Analyzer is designed in accordance with Protection Class I
(IEC). The chassis/
housing of the instrument is grounded to protection earth
(PE) by means of a cord. For protection
against electrical shock hazards, the instrument must be directly connected to an approved
power source
such as a three-wire grounded receptacle for the 110 V or 230 V line. Do not use
an ungrounded receptacle; have a qualifi ed electrician replace the ungrounded receptacle with
a properly (PE) grounded receptacle in accordance with the local electrical code. Do not use an
extension. Any break in the electrical ground path, whether inside or outside the instrument,
could be hazardous.
Under no circumstances should the user attempt to modify or deliberately
defeat the safety
features of this instrument. If the power cord becomes
cracked, frayed, broken, or otherwise
damaged, replace it immediately with the equivalent part from Roche Diagnostics.
XIV. Disposal of the Analyzer
Disposal Recommendations
All electrical and electronic products should be disposed of separately from the municipal waste system. Proper
disposal of your old appliance prevents potential negative consequences for the environment and human health.
The analyzer must be treated as biologically contaminated hazardous
waste.
Decontamination (i.e.,
a combination of processes, including cleaning, disinfection
and/or sterilization) is required before
reuse, recycling or disposal.
Dispose of the analyzeraccording to local and/or laboratory regulations.
For more information contact your local Roche Support personnel.
Components of your control unit such as the computer, monitor, keyboard, etc. which are marked
with the crossed-out wheeled bin symbol are covered by the European Directive 2002/96/EC on
waste electrical and electronic equipment (WEEE) of the European Parliament and the Council of
January 27, 2003.
These items must be disposed of via designated collection facilities appointed by government or
local authorities.
For more information about disposal of your old product, please contact your city offi ce, waste
disposal service or local Roche Support personnel.
Disposal Recommendations
It is left to the responsible laboratory organization to determine whether control unit components are
contaminated or not. If contaminated, treat in the same way as the analyzer.
Disposal of the Analyzer
Page 24

18
Cedex HiRes Analyzer Operator’s Guide
Page 25

19
Overview
A
A
A Overview
The Cedex HiRes Analyzer automatically determines the cell concentration and viability of cell suspensions.
The analysis is based on the Trypan Blue Exclusion Method whereby cell suspensions are stained and analyzed.
The data obtained allows for the evaluation of the overall state of the cell culture, including the specifi c growth
rate and doubling time of a cell population, as well as the documentation of the cultivation process.
The evaluation of the samples is based on automatically obtained digital images that are analyzed using analysis
software on a separate computer (Cedex HiRes Control Unit). All the necessary steps – from the staining of
the samples to the recording and evaluation of the image data – are automatically performed by the analyzer.
Recognition and differentiation of cells as either viable or dead is done under standardized conditions, which
provides very precise and objective results.
A variety of parameters, including Viable Concentration, Total Concentration, Viability, Total Object Count,
Average Compactness and Average Diameter are analyzed using result data from single images, as well as from
all of the selected images of a sample. Standard deviation (Std. Dev.) of the number of cells from image to image is also calculated. In addition, the Aggregate Rate, which shows the percentage of the total number of cells
that appear in aggregates (clusters), is determined for both single images and all of the images. The use of a Live
Operator makes it possible to directly observe the effects on the analysis of a sample when the image analysis
software ( Operator) is adjusted.
Graphical representations of the measurement results can be viewed in the Measurement Statistics Histogram,
Diameter Histogram, Compactness Histogram, Aggregate Histogram and Cultivation Time Chart. In the
Measurement Statistics histogram, individual images can be compared to give a better overview of the distribution of the cells in the images. The Cell Diameter Histogram shows the diameter distribution of living cells.
The Object Diameter Histogram shows the diameter distribution of all objects detected such as cells, debris,
air bubbles and viable and dead cell aggregates. The deviation of the shape of living cells from that of an ideal
sphere is represented in the Compactness Histogram. The Aggregate Histogram provides an overview of the
amount and size of aggregation found in the cell culture.
The Cultivation Time Chart displays growth curves and cultivation parameters in a time- dependent manner.
The results of the Cultivation Time Chart can be separately printed out. For further processing of the results in
other programs, data export in formats such as Excel-compatible formats and CSV (Comma Separated Values,
generally applicable) is possible. The Cultivation Time Chart includes calculations for the doubling time [T]
and specifi c growth-rate [µ].
The Cedex HiRes Software 2.2 can be operated on Windows® XP Professional. Secure data handling, as well as a
carefully designed user management system, guarantee compatibility with 21 CFR, Part 11. Access security for
the Cedex HiRes System has been stepped up. Access is only allowed for authorized persons. The workstation
can be automatically blocked after a certain number of consecutive entries of a false password via the Systems
Options. A warning message will appear before the last allowed attempt.
Page 26
20
Cedex HiRes Analyzer Operator’s Guide
A
A
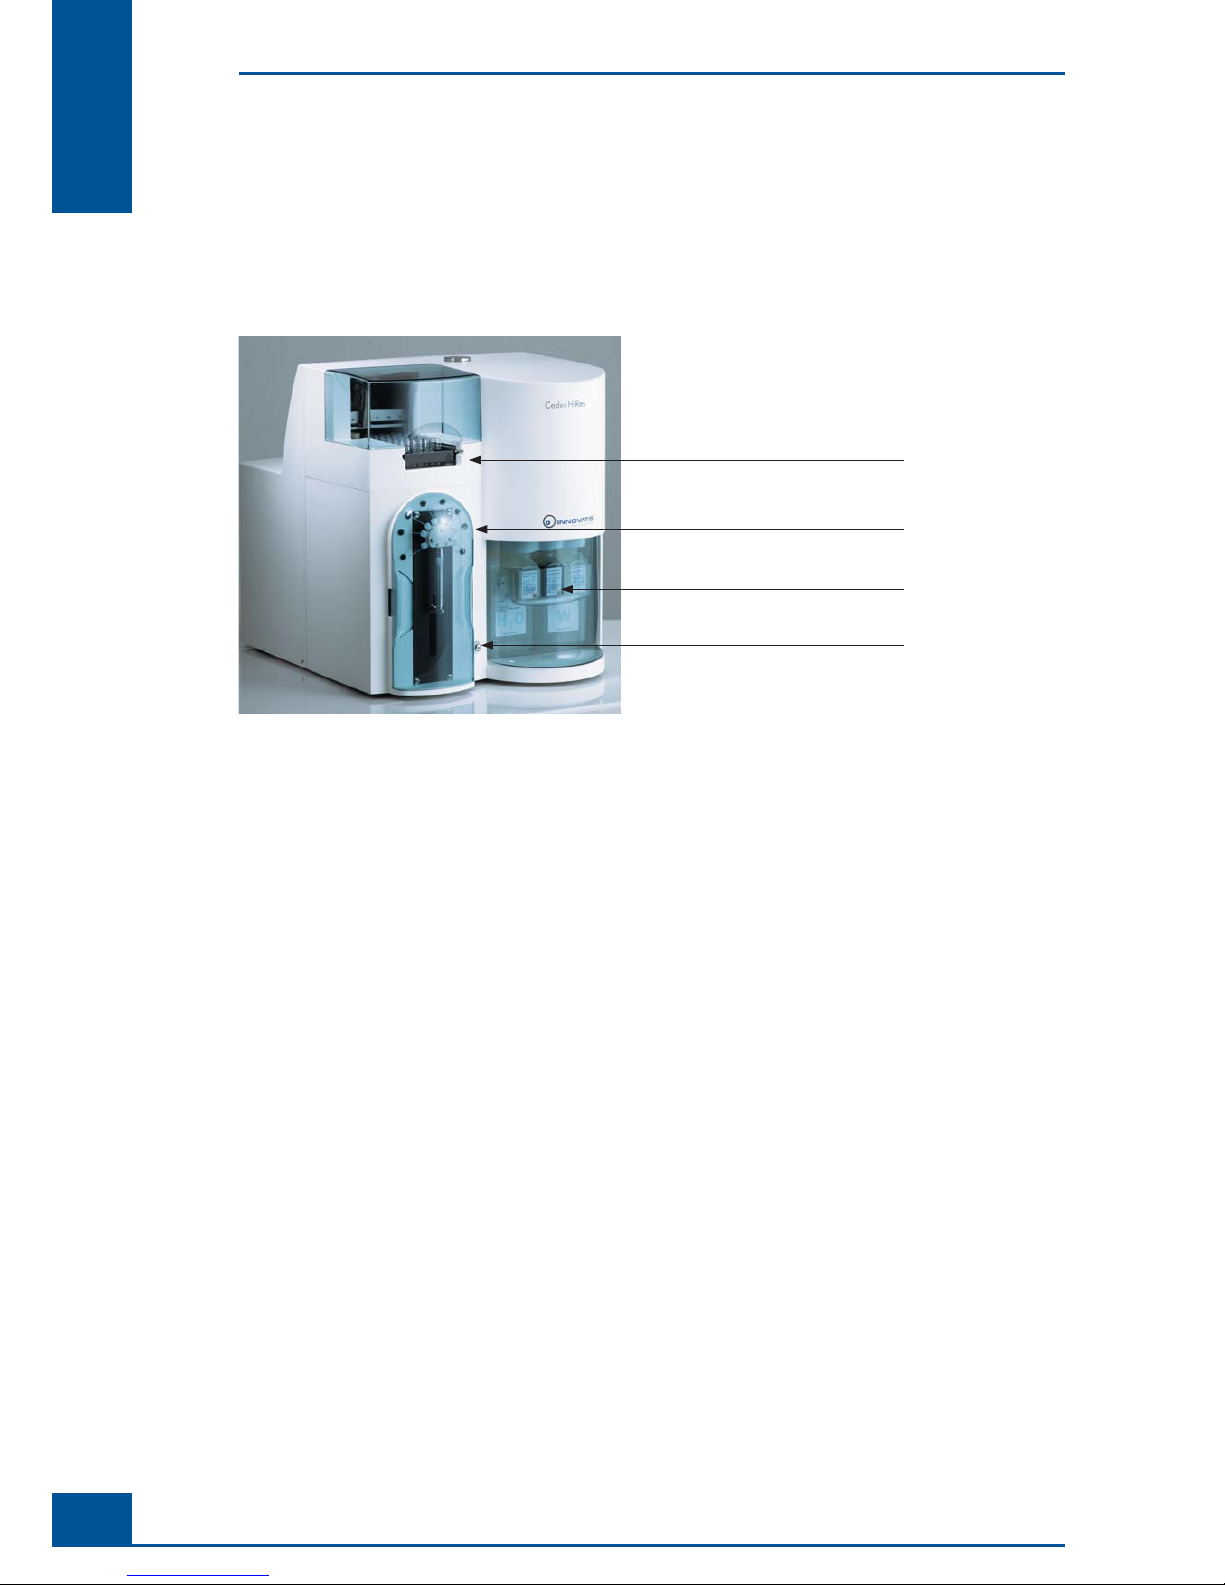
1 Description of the Cedex HiRes System
The Cedex HiRes System consists of two functional units, the Analyzer (see Figure 1) and the Control Unit
(computer equipped with Cedex HiRes Software 2.2).
Preparation and processing of the samples takes place in the analyzer. The analysis software is installed on a
computer and controls the analyzer, as well as the analysis and evaluation of the images obtained.
Multi Sampler tray with
Cedex Sample Cups
Syringe module with 8-way valve
Tray with the Cedex Reagent Kit
ON/OFF Switch
Figure 1: The Cedex HiRes Analyzer
The analyzer consists of two main components, the hardware for image capturing (scanner) and the Liquid
Management system.
The fl ow chamber is specially developed to allow for the analysis of a defi ned volume of cell suspension. The
Liquid Management system is responsible for staining the sample as well as for fi lling and cleaning the fl ow
chamber and liquid feed system.
The volumes of sample and dye, as well as specifi c cleaning solutions required for each cleaning routine, are
precisely controlled via the syringe module with the 8-way distribution valve. The individual components of the
Liquid Management system are easily accessible to allow for trouble-free maintenance and control.
Description of the Cedex HiRes System
Page 27

21
Overview
A
A
2 The Measurement Procedure
The determination of the number of viable cells (cells/ml) and viability of cell suspensions (the percentage
of viable cells from the total cell sample) is a fully automated, standardized procedure based on the manual
Trypan Blue Exclusion Method. A defi ned volume of Trypan Blue is added by the syringe to the Cedex Sample
Cup containing the cell suspension. The cell suspension and dye are optimally mixed between the syringe and
Cedex Sample Cup by controlled pump actions and then incubated for exactly the same amount of time for
each measurement. This minimizes effects on the viability measurements that might be caused by the toxicity
of the Trypan Blue.
After the incubation period, the stained cell suspension in the syringe is then transported in one portion via
the capillary tubes and the 8-way valve into the precision fl ow chamber, an image of which is scanned with the
scanner. The scanned image of the fl ow chamber is then cut up into smaller images for evaluation.
Once the measurement procedure is completed, a cleaning routine is automatically per formed by the Liquid
Management system. It is only possible to begin a new measurement after the cleaning routine has fi nished.
The Trypan Blue Exclusion Method
The Trypan Blue Exclusion Method is based on the principle that viable cells will not take up the dye, while
dead or dying cells have a compromised membrane that allows for the up take of the dye. Thus, dead cells will
appear darkly stained.
Trypan Blue has a greater affi nity for serum proteins than cellular proteins. If the image has a dark
background due to high quantities of stained serum proteins, centrifuge the cell sample and resuspended it in
a protein-free medium or physiological saline solution prior to counting.
The Measurement Procedure
Page 28

22
Cedex HiRes Analyzer Operator’s Guide
A
A
3 Data Analysis
The analysis software and its graphical user interface ( GUI), known as the Cedex Control Center, enables
the user to work with Cedex HiRes Analyzer. The image analysis software (Operator) recognizes structures
and identifi es particles, thus differentiating cells from cell debris and dirt particles. Live and dead cells are
differentiated according to their degree of Trypan Blue staining.
The image processing is integrated in the Cedex Control Center in such a way that the user or Administrator
can check on its function in the system. The analysis process cannot be altered during data recording in order
to allow for consistent and objective measurement results.
Data Analysis
Page 29

23
Overview
A
A
4 Technical Specifi cations of the Analyzer
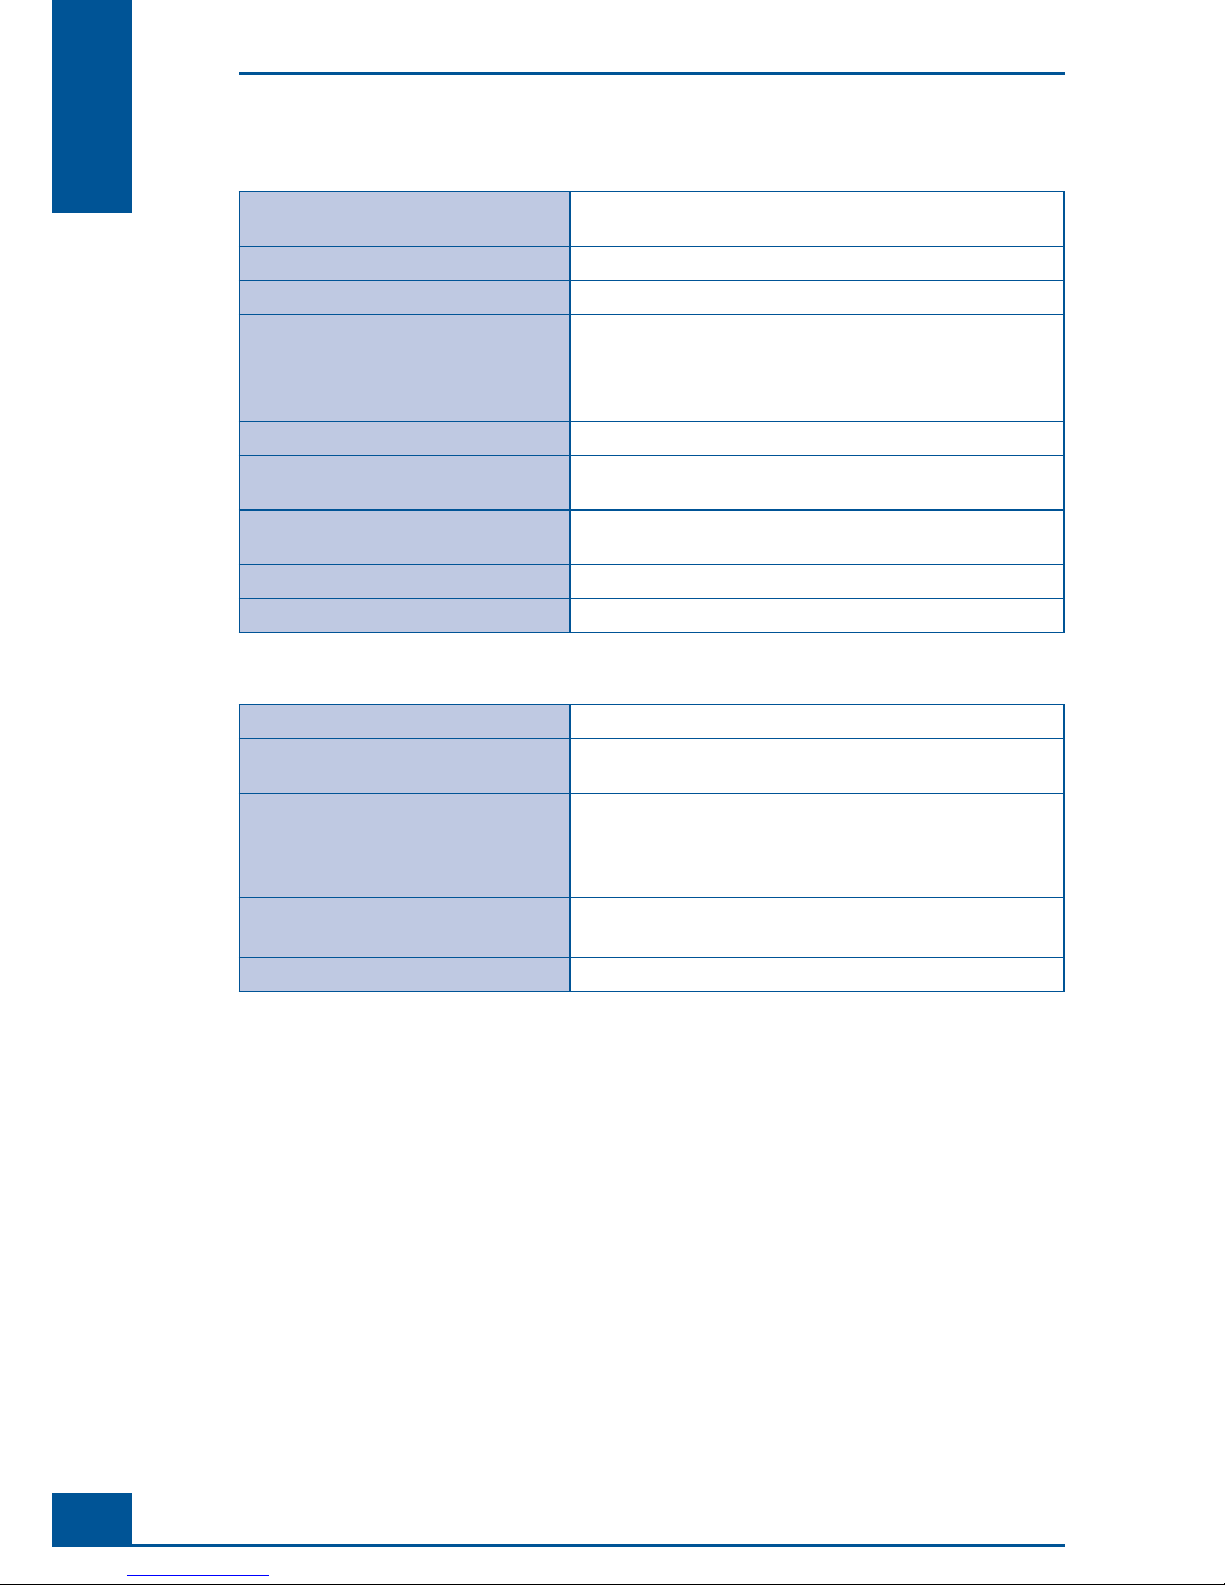
Cedex HiRes Analyzer
Method of measurement
Digital image and pattern recognition
Viable/dead cell differentiation
Trypan Blue Exclusion Method
Detectable cell concentration range
5 × 10
4
– 1 × 10⁷ cells per ml
Detectable cell diameter range
2 µm – 40 µm
Detectable object diameter range
1 µm – 90 µm
Required sample volume
300 µl
Average measurement period
< 4.0 min
Geometric resolution
0.8 µm/Pixel
Chamber height
100 µm
Material and diameter of the capillaries
Te fl on, 765 µm
Operating temperature
(Optimal image quality is achieved
between 20°C and 30°C)
+10 to +40°C
Maximum temperature change
5°C per hour
Maximum humidity deviation
5% per hour
Operating Humidity
20% – 80% relative humidity (non-condensing)
Dimensions
Height: 470 mm
Width: 405 mm
Depth: 505 mm
Weight with Multi Sampler: 28.9 kg
Weight without Multi Sampler: 26.9 kg
Energy requirements
100 – 250 VAC, 50 – 60 Hz
Energy consumption
24 VDC 2.0 A
Pollution Degree
2 (according to IEC 61010-1)
Installation Category
II (according to IEC 61010-1)
Technical Specifi cations of the Analyzer
Page 30
24
Cedex HiRes Analyzer Operator’s Guide
A
A
Hardware Requirements for the Cedex HiRes Control Unit
Computer x86-Architecture, Intel Pentium IV
minimum 2 GHz required, 3 GHz recommended
Operating system Windows® XP Professional
RAM Minimum 1 GB RAM
Hard-disk storage 100 MB free hard-disk storage for installation of application.
Minimum 20 GB free hard-disk storage for data storage of
approx. 1000 measurements
Recommended 80 GB
USB 2 free ports
Firewire 1 free port
(400 Mbps, with 4 or 6 contacts)
CD/DVD burner Minimum CD burner required, DVD burner recommended if
computer will not be connected to a server
Graphic card Resolution: 1024 × 768 Pixel, 24-bit color
Monitor (color monitor or -TFT) 1024 × 768 Pixel, 24-bit color
Multi Sampler
Number of samples 1 – 20
Average measurement period for
20 samples < 90 min
Dimensions Height: 170 mm
Width: 190 mm
Depth: 260 mm
completely integrated into the Cedex HiRes Analyzer
Energy requirements 24 VDC, 2,0 A
derived from internal supply
Energy consumption max. 10 W
Technical Specifi cations of the Analyzer
Page 31

25
System Description
B
B
B System Description
1 Installing the Cedex HiRes System
The Cedex HiRes System comprises the Cell Analyzer and the Control Unit (PC equipped with the Cedex
HiRes Software 2.2). The Cell Analyzer and Control Unit are delivered and assembled by a service technician
authorized by Roche Diagnostics GmbH. The service technician assembles the Cell Analyzer. He/she controls
the installation, activates the security settings, runs the focus adjustments and ensures that the Cedex HiRes
System is operational. Finally, he/she will create a report on the installation and current status of the device.
We recommend choosing your local IT specialist as the system administrator for the general administration of
the Windows operations. This person controls the confi gurations that regulate system access at the level of the
operating system.
Installation of the Cedex HiRes System is done in the following steps:
The system administrator should set up net access and/or printer installation, if desired, before the service
technician assembles the Cedex HiRes System.
The Cedex HiRes System is assembled by a service technician authorized by Roche Diagnostics GmbH.
The service technician installs the analyzer and checks the security settings in the software.
The service technician will check the software information, perform a focus adjustment and ensure that the
Cedex HiRes System is ready to use. Finally, he/she will create a current status report of the device.
The system administrator is responsible for setting up the user accounts for the operating system. The
system administrator is also responsible for ensuring data safety and security of the system.
The Administrator for the Cedex HiRes System then sets up Cedex HiRes System user accounts and assigns
them the required rights (see “Administration of User Accounts”).
Please be aware that the correct operation of the analyzer and software can only be guaranteed if no other
software has been loaded on to the computer.
The software and hardware of your Cedex HiRes Analyzer may differ from the information described here,
but this should not make a difference to the operational functions in general.
Installing the Cedex HiRes System
Page 32

26
Cedex HiRes Analyzer Operator’s Guide
B
B
2 Choosing a Suitable Location
The Cedex HiRes Analyzer is highly sensitive and consists of top-quality electronic and optical components.
To guarantee optimal and reliable performance of the Cedex HiRes Analyzer, select the appropriate location in
accordance with the safety regulations described in the Prologue.
Avoid further transportation of Cedex HiRes Analyzer after the professional installation.
The transportation locks for the scanner must be attached to the inside of the casing before the Cedex
HiRes Analyzer is transported once again. Please contact a Roche Diagnostics GmbH authorized service
technician in such a case. Vibrations or shaking must also be avoided when transporting the analyzer over
short distances and when operating the system. Focus adjustment must be done after transportation (see
“Automatic Adjustment and Alignment Verifi cation”).
Injury from heavy loads
The Cedex HiRes Analyzer weight is 29 kg. (63.8 lbs). No attempt should be made by the user to remove or
set up the instrument alone. You may injury your hands, fi ngers, or back when putting the analyzer in place.
2.1 Connecting or disconnecting the device
First connect the device using the power cord to the external power supply. On the power supply is a power
switch. When turned to ON, it is illuminated indicating the power supply is alive. A blue power switch is located
on the front panel of the Cedex HiRes System. When the switch is turned to ON it illuminates, indicating that
the device is alive. In case of problems, turned the device switch to OFF and then switch the power supply to
OFF.
In case of emergency, remove the power line from the Cedex HiRes System immediately.
ON/OFF Switch
Figure 2: The ON/OFF switch for the Cedex HiRes Analyzer
Choosing a Suitable Location
Connecting or disconnecting the device
Page 33

27
System Description
B
B
3 Connecting Hardware Components
Firewire socket for connection of scanner to Control Unit via a fi rewire cable.
USB socket for connection of pump and MS20 to the Control Unit.
Power input socket for power cord (24 VDC).
Figure 3: Hardware connections
3.1 Completing the Windows Mini-setup
When starting the Cedex HiRes Control Unit for the very fi rst time, a Windows mini-setup may run. The
setup allows the user tweak the fi nal settings of the new system (e.g., selection of time zone, keyboard etc.). The
mini-setup dialogs should be self-explanatory. The following list provides some additional information to get
through the process. Note that the order of screens may be different and some topics may not appear on your
system:
Roche technical services strongly recommends not changing the regional settings. Changes in the regional
settings may result in problems with date and time format within the Cedex HiRes Software.
You may be required to enter the 25-digit product code. It is located on the computer.
Protect your PC: Roche technical services recommends turning on automatic updates if the Control Unit is
permanently connected to the internet via a LAN. Otherwise, click no, not right now.
Computer name: The Control Unit name has already been set to a unique name. However, your company
might enforce a different naming convention. If you are not sure, leave it as it is. The name can be changed
at any time later on.
Computer description: This is a purely informational fi eld that helps to identify the Control Unit in a net-
work. You may want to enter a short descriptive text. Again, this setting can be adjusted later.
If asked to choose an Administrator account password, be sure to make a note of the password and store it
in a safe place.
If asked to choose whether to add the computer to a domain, Roche technical services recommends choos-
ing No. Your local network policy may require a different strategy, but you are free to join a domain any time
later on.
Register with Microsoft: It is not necessary to register your Windows copy with Microsoft, so No can be
safely chosen. Note that registration is not activation (see below).
Internet account setup: The operating system has been confi gured for access to the Internet over a Local
Area Network (LAN). Roche technical services recommends clicking No and proceeding to the next step.
When the mini-setup has fi nished, the Control Unit will automatically restart and present the login screen
after a short while.
Some Control Units may require immediate Windows activation. Follow the instructions on the screen.
Roche technical services recommends activation over the internet if the Control Unit is already connected
to a LAN. However it may be necessary to activate Windows XP via telephone if the Control Unit is not yet
connected to the internet.
Connecting Hardware Components
Completing the Windows Mini-setup
Page 34

28
Cedex HiRes Analyzer Operator’s Guide
B
B
4 Installing Cedex HiRes Software 2.2 or Updating to
Cedex HiRes Software 2.2
The Cedex HiRes Software 2.2 is pre-installed on the computer delivered with the Cedex HiRes System. This
chapter provides instructions for installing the Cedex HiRes Software 2.2, should it be required. In addition,
instructions are provided for updating older Cedex HiRes Software 2 versions to Cedex HiRes Software 2.2.
4.1 Installing the Cedex HiRes Software 2.2
Before carrying out any form of installation or update procedure, the actual (effective) values for the Flow-
Factor and ChamberHeight must be noted down and stored for future reference! These values may need
to be adjusted in the System Options after the installation or update procedure is complete. The value for
FlowFactor is located in the System Options menu under the General tab. The value for the ChamberHeight
is located in the System Options menu under the Hardware tab. See the chapter “System Options and User
Preferences” in the Appendix for more information.
The Cedex HiRes Software 2.2 must be installed from a Windows account with administrator privileges (e.g.,
Win-Admin, see “Securing Access Rights”)
The Cedex HiRes Software 2.2 requires a Firebird database server, which is installed automatically during
the setup process.
To install Cedex HiRes Software version 2.2, do the following:
1
Run the Cedex 2.2.1.exe from the install CD by double-clicking on it.
2
A window will open asking for confi rmation of the installation of the Firebird database software:
Figure 4
3
Confi rm the dialog with OK. The Firebird database software will be installed or updated:
Figure 5
4
After completion of the installation of the Firebird database software, the setup will ask for confi rmation of
the installation of the .Net Framework:
Figure 6
Installing Cedex HiRes Software 2.2 or Updating to Cedex HiRes Software 2.2
Installing the Cedex HiRes Software 2.2
Page 35

29
System Description
B
B
If an older Cedex HiRes Software version 2.x is installed on the computer, the confi rmation dialog shown
in Figure 4 will not appear. Instead, the following window will appear:
Figure 7
If this occurs, proceed according to the directions in the chapter “Updating Older Cedex HiRes Software
version 2.x to Cedex HiRes Software 2.2
”.
5
Click on Next in the Setup window shown below
Figure 8
6
Check the I Agree box then click on Next in the License Agreement window shown below:
Figure 9
Installing Cedex HiRes Software 2.2 or Updating to Cedex HiRes Software 2.2
Installing the Cedex HiRes Software 2.2
Page 36

30
Cedex HiRes Analyzer Operator’s Guide
B
B
7
The Installations Settings window will appear. Select Cedex Server and Cedex Client,
then click on Next.
Figure 10
8
In the Installation Folder window (shown below), choose the folder recommended
by the program. Ensure
that the option Install Cedex 2.2 for Everyone is selected,
then click on Next.
Figure 11
9
In the following window, click on Next to start the installation:
Figure 12
Installing Cedex HiRes Software 2.2 or Updating to Cedex HiRes Software 2.2
Installing the Cedex HiRes Software 2.2
Page 37

31
System Description
B
B
10
A window showing the progress of the installation will appear as shown below:
Figure 13
11
During the installation, the following Cedex 2.2 Confi guration window will appear:
Figure 14
To continue with the installation, certain actions must be carried out in this window:
1) a password for the Database User must be entered,
2) the serial number of the Cedex HiRes Analyzer must be entered, and
3) the system settings must be verifi ed.
Do the following:
a. Enter cedex as the password for the database access (a database user, CEDEXUSER, is automatically
created with that password). Write down the password for future reference!
b. Enter the serial number of your Cedex HiRes Analyzer.
c. Verify the Cedex System Type in the Cedex System identifi cation group box.
d. Uncheck the use Multi Sampler checkbox if you don’t have a Multi Sampler.
e. Enter a description of your system in the Cedex System identifi cation group box.
12
After completing all steps in the Cedex 2.2 Confi guration window, the Next button will become active.
Click on the Next button to continue the installation.
Figure 15
Installing Cedex HiRes Software 2.2 or Updating to Cedex HiRes Software 2.2
Installing the Cedex HiRes Software 2.2
Page 38

32
Cedex HiRes Analyzer Operator’s Guide
B
B
13
After installation of the software, the Installation Complete window will appear. Click on Close to confi rm.
Figure 16
14
The Setup Succeeded window will appear if the installation was completed successful. Confi rm with OK.
Figure 17
15
Test and Archive certifi cates are automatically installed into the “Trusted Root” certifi cate store during setup.
■
4.1.1. Setting the Cedex Server to Autostart
The Cedex Server must be started before the Cedex Client software can be started. If desired, the Cedex Server
can be confi gured so that it starts automatically when the computer is turned on. To confi gure the Cedex Server
to autostart, do the following:
1
Open a Windows explorer window by right-clicking with the mouse on the Windows Start button and
selecting Open All Users.
2
Copy the shortcut Cedex Server from the Start menu Programs/Cedex 2.2 to the Startup folder
(found in the Start menu under Programs/Startup).
3
Open the properties window for the Cedex Server by right-clicking on the icon and selecting Properties.
Select the Shortcut tab and change the property for Run to Minimized via the drop-down menu.
■
Installing Cedex HiRes Software 2.2 or Updating to Cedex HiRes Software 2.2
Installing the Cedex HiRes Software 2.2
Page 39

33
System Description
B
B
4.2 Starting up the Software
Once the installation of the software is complete, the software can be started and fi nal adjustments made. Do
the following:
1
Check for the presence of the Innovatis MicroScanner in the Device Manager as shown below:
Figure 18
2
Start Cedex Server fi rst (if the Cedex Server has not already automatically started), then the Cedex Client.
3
Windows Security Alert may possibly ask whether the programs CedexServer and GUI should be blocked.
If this occurs, press the Unblock button for each.
4
Log in as SuperUser (password: spass).
5
Confi rm the empty reagent container warnings.
6
If there is a message that hardware components could not be found at the confi gured serial ports, terminate
the Cedex Client and the Cedex Server after the message Hardware startup completed appears, and
restart the software as described in step 1, above.
7
Verify that the system is not running in demo mode (i.e., make sure there is no Demo label visible in the
Cedex Control Center).
8
Open the Diagnosis window via the Setup menu of the Cedex Control Center and verify the confi guration
of the system. For a Cedex HiRes Analyzer with Multi Sampler there must be a module ASXPort (or AS20Port
if the Multi Sampler was confi gured for AS20 mode).
9
Each Cedex HiRes Analyzer has a few unique specifi cations related to the particular fl ow chamber that
has been put in. These numbers must be verifi ed and/or adjusted in the System Options window before
measurements can be run. Verify and/or make the following changes in the System Options window
under either the General or the Hardware tabs:
a. Verify MultiSamplerPresent (0 = Single Port, 1 = Auto/Multi Sampler) in the Hardware tab.
b. Enter the appropriate value for the ChamberHeight in the Hardware tab.
c. Enter the appropriate value for the FlowFactor in the General tab.
10
Replace or refi ll the Reagent Kit containers. See “Preparing the Analyzer for Measurements”.
11
Carry out a Prime.
12
Carry out an automatic adjustment via the Automatic Adjustment window in the Functions menu.
■
The Cedex HiRes Analyzer is now ready to use.
Installing Cedex HiRes Software 2.2 or Updating to Cedex HiRes Software 2.2
Starting up the Software
Page 40

34
Cedex HiRes Analyzer Operator’s Guide
B
B
4.3 Updating Older Cedex HiRes Software version 2.x to Cedex HiRes
Software 2.2
4.3.1. Overview
Before starting an update of your current Cedex HiRes Software 2 installation to Cedex HiRes Software version
2.2, ensure that:
You have Administrator access to the computer.
The Firebird database password (i.e., of the SYSDBA account) is available in case it has been changed, e.g.,
because the installation has been made 21 CFR Part 11 compliant.
A storage device with enough disk space is available for a backup of the current installation. A storage device
with enough disk space is available for a backup of the current installation. Check the size of the folder
containing all Cedex Software 2 fi les, including the database fi le (usually the directory C:\Cedex2). The size
of the backup will be approximately the size of this folder.
Enough time is scheduled for a backup of the current installation (approximately one hour for backup to a
fast external hard drive per 10 GB disk space used in the Cedex 2 directory, including the database fi le).
4.3.2. Updating to Cedex HiRes Software 2.2
Make sure that you have created a backup of the Cedex HiRes Database and that you have fully read and
understood the following instructions before proceeding with the update of the Cedex HiRes Software! If an
error occurs or if you do something wrong, this could result in data loss and/or could prevent the Cedex HiRes
Software 2.2 from operating!
1
Run the Cedex 2.2.1.exe from the install CD by double-clicking on it.
2
If the Firebird database software is not up to date, the following dialog will appear:
Figure 19
Should the dialog appear, confi rm it with OK to update the Firebird database software:
Figure 20
Installing Cedex HiRes Software 2.2 or Updating to Cedex HiRes Software 2.2
Updating Older Cedex HiRes Software version 2.x to Cedex HiRes Software 2.2
Page 41

35
System Description
B
B
3
After the update of the Firebird database software has fi nished, the following main dialog will appear:
Figure 21
If an older Cedex HiRes Software version 2.x is not installed on the computer, the confi rmation dialog
shown in Figure 21 will not appear. Instead the following dialog will appear:
Figure 22
Should this occur, proceed according to the instructions in the chapter “Installing the Cedex HiRes Software
2.2
” and “Starting up the Software”.
4
By default, Cedex HiRes Software version 2 is installed under the directory C:\Cedex2. If your software
was installed under another directory, the fi eld under the Cedex 2 directory line must be changed to the
appropriate directory. Change the entry in this fi eld by clicking on the change button next to Cedex 2
directory fi eld.
5
By default, the location of the Cedex HiRes Software Database fi le is C:\Cedex2\DB\CEDEX.FDB. If the
database fi le is in a different location, the fi eld under to the Cedex 2 directory must be changed to the
appropriate pathway. Change the Cedex 2 database fi le if it is not C:\Cedex2\DB\CEDEX.FDB by clicking
on the change button next to Cedex 2 database fi le.
6
If the password of the Firebird database administrator SYSDBA has been changed (e.g., because the system
has been made 21 CFR Part 11 compliant), uncheck use standard SYSDBA password (“masterkey”).
In this case, the database password will be requested just before the update is carried out.
To create the backups successfully, it is necessary that the user account used for updating has read
access to the Cedex 2 directory and Cedex HiRes Database fi le. Verify the backup fi les before
proceeding with the update!
7
Click on the Create backup of current installation button (see Figure 21) and select the destination directory
for the backup by clicking on the OK button. A Browse window
will appear in which the destination directory
can be selected, as shown below:
Figure 23
Installing Cedex HiRes Software 2.2 or Updating to Cedex HiRes Software 2.2
Updating Older Cedex HiRes Software version 2.x to Cedex HiRes Software 2.2
Page 42

36
Cedex HiRes Analyzer Operator’s Guide
B
B
8
In the next window, check that the source directory/database fi le and destination (backup) directory settings
are correct. If correct, click on the Ye s button to start the backup.
Figure 24
9
The backup process may take from several minutes up to hours depending on the size of the installation and
the read/write speed of the backup media. A fi le copy dialog will show the backup progress:
Figure 25
10
After successful backup of the installation, the message below will appear. Confi rm by clicking on the OK
button:
Figure 26
11
The update process can now be started. Click on the Update current installation to version 2.2.1 button
as shown below:
Figure 27
12
If you unchecked the use standard SYSDBA password (“masterkey”) checkbox in
step 6, enter the
database of the Firebird SYSDBA account and click on the OK button
as shown in the fi gure below:
Figure 28
13
A backup reminder and warning will appear that must be confi rmed by clicking on the YES button:
Figure 29
Installing Cedex HiRes Software 2.2 or Updating to Cedex HiRes Software 2.2
Updating Older Cedex HiRes Software version 2.x to Cedex HiRes Software 2.2
Page 43

37
System Description
B
B
14
Check the I Accept box then click on Next in the License Agreement window shown below:
Figure 30
15
A Cedex Job Runner window that provides a protocol of the update process will
open. At the end of the
update, a success message should appear. Confi rm by clicking
on the OK button:
Figure 31
16
Verify that there are no errors or exceptions displayed in the Cedex Job Runner window. If any errors or
exceptions appear, please contact your local Roche technical services.
■
The Cedex HiRes Software version 2 installation is now updated to version 2.2.
4.3.3. Restoring a Cedex HiRes Software 2 Backup
This procedure should only be carried out in case a failure occurs during installation of the Cedex HiRes
Software 2.2 update as described in “Updating to Cedex HiRes Software 2.2”. Carry out this procedure only
after consultation with Roche technical services!
If you choose to restore the backup, all data stored in the current database will be overwritten by the data
stored in the backup database! This means, for example, all measurements and all confi guration changes
carried out on the system after the original backup was made will be lost, even if the measurements have been
archived or exported.
Installing Cedex HiRes Software 2.2 or Updating to Cedex HiRes Software 2.2
Updating Older Cedex HiRes Software version 2.x to Cedex HiRes Software 2.2
Page 44

38
Cedex HiRes Analyzer Operator’s Guide
B
B
Carry out the following steps to restore the Cedex HiRes Software 2 backup that was created in step step 7 in the
chapter “
Updating to Cedex HiRes Software 2.2”:
1
Locate the active Cedex2 folder on the hard disk. It is usually located at C:\Cedex2, which is the default
location selected during installation. Delete the Cedex2 folder by right clicking on it and selecting Delete:
Figure 32
2
Confi rm the upcoming message by clicking on Ye s :
Figure 33
3
Locate the folder where the backup of the Cedex2 folder and database has been stored. Copy that folder by
right clicking on it and selecting Copy:
Figure 34
4
Navigate to the location from which the Cedex2 folder was deleted in step 1 (usually C:\). Paste the backup
in this location:
Figure 35
Installing Cedex HiRes Software 2.2 or Updating to Cedex HiRes Software 2.2
Updating Older Cedex HiRes Software version 2.x to Cedex HiRes Software 2.2
Page 45

39
System Description
B
B
5
The Cedex2 folder will be copied:
Figure 36
6
Verify that the backup Cedex2 folder is placed in the location where the folder deleted in step 1 was located
(the directory should usually be C:\Cedex2).
7
(optional) If the active database fi le is located in a folder different from the DB sub
folder contained within
the Cedex2 folder, locate the database fi le (name: CEDEX.FDB)
in the folder where the backup of the Cedex2
folder and the database has been stored.
Copy it to the location of the original database fi le, overwriting
the existing one.
8
Verify that the Cedex HiRes Software 2 installation is working as expected.
■
5 Starting the Cedex HiRes System after Installation
The hardware components of the Cedex HiRes System must be switched on before the analysis software can be
started, otherwise the software will not be properly initialized.
After the initial installation, switch on the individual devices in the order given below:
1
Switch on the Cedex HiRes Analyzer.
2
Switch on the monitor and the PC. The fi rst time the computer is started, a registration window for access at
the operating system level will appear. Follow the instructions to register with Windows.
■
In order to ensure that the Cedex HiRes Analyzer is fully operational, an Intensive Clean must be carried
out once per week even if the system is not yet in use for measurements. Therefore, a Reagent Kit must be
installed directly after the installation of the Cedex HiRes System to allow for the required cleaning routines
(see “Preparing the Reagent Kit” and “Cleaning Routines Carried out by the Liquid Management”).
Starting the Cedex HiRes System after Installation
Page 46

40
Cedex HiRes Analyzer Operator’s Guide
B
B
6 Securing Access Rights
6.1 Access Control at the Windows Operating System Level
We recommend choosing your local IT specialist as the system administrator for the general administration of
the Windows operations. This person should undertake the confi guration of the settings that regulate access to
the system at the operating system level. One default user at the operating system level has been factory installed:
The Win-Admin user (default password Win-Admin) acts as system administrator for the operating system
and has full access to all elements on the desktop including the ability to add/delete programs.
6.2 Access Control at the Cedex HiRes System Software Level
To launch the software, do the following:
1
Check that the Cedex Server software has already been automatically started (it may appear as a minimized
window in the task bar at the bottom of the computer screen). If it is not automatically started, start the
server by double-clicking on the Cedex Server icon on the desktop.
2
Start the Cedex HiRes Software 2.2 by double clicking the Cedex Client icon on the desk top (the Cedex
Server must be successfully launched before the Cedex Client can be started). The Log In window of the
Cedex HiRes System will open.
3
Enter the username and password in the respective fi elds. By default, the following users are available after
installation:
a. Superuser (password spass)
b. Administrator (password apass)
■
For the Cedex HiRes Software, there should generally be at least three levels of users. In addition to normal
Cedex HiRes System users, who will only use the Cedex HiRes System for carrying out measurements, both a
Cedex HiRes System Superuser and an Administrator should be appointed. The Cedex HiRes System Super-
user assumes the main responsibility of handling the Cedex HiRes System, whereas the Administrator creates
and administers user accounts.
For security reasons, both the Administrator and Superuser should protect their access to the Cedex HiRes
Software 2.2 with new passwords after initial installation. Follow the instructions below to secure access and
defi ne a new password:
1
Log in as Administrator or Superuser.
2
Click on the System menu in the Cedex Control Center.
3
Click on Change own password. The Change Password window will appear.
4
Enter the old password fi rst. The new password needs to be entered twice.
5
Confi rm by pressing OK.
■
After logging in, users can change their own passwords at any time by following the same procedure.
After installation, the user Administrator should set up regular user accounts and provide the necessary rights
before regular users run measurements (see “Administration of User Accounts”).
For security reasons, the Cedex HiRes System Administrator is generally only accorded administrative rights
and cannot carry out, reprocess or view measurements.
Securing Access Rights
Access Control at the Windows Operating System Level
Page 47

41
Operation
C
C
C Operation
1 Overview of the Cedex Control Center
The Cedex Control Center is divided into three elements:
Menu bar
Shortcuts area
Event window detailing status of events carried out by the analyzer
A description of the individual areas is given below (see Figure 37):
Figure 37: The Cedex Control Center
1.1 Menu Bar
The menu bar at the top of the Control Center has 7 menu items:
System menu
Measurements menu
Functions menu
Reports menu
Master Data menu
Setup menu
Help menu
1.2 System Menu
The menu items have the following functions:
Exit: exits the Control Center.
Logout: for logging out of the Control Center.
Change own password: for changing the password of a user who is logged in.
Lock – Unlock System: for automatically or manually locking and unlocking of the system with regard to
running measurements.
Overview of the Cedex Control Center
Menu Bar
Page 48

42
Cedex HiRes Analyzer Operator’s Guide
C
C
1.3 Measurement Menu
The individual menu items have the following functions:
Measurement List: This provides a list of the measurements that have been run. Measurements can be
sorted or fi ltered using specifi c criteria and then viewed (see “Using the Measurement List”).
Single Measurement: Selecting this menu item will open a new window in which single measurements can
be run (see “
Opening the Measurement window and specifying the Operating Mode and Sample Data”).
Multi Run: Selecting this menu item will open a new window in which multiple measurements can be run
(see “The Multi Run Data Entry Window”).
Cultivation Time Chart: This opens a new window in which multiple measurements can be analyzed in a
graph form (see “Cultivation Time Chart”).
1.4 Functions Menu
Clicking on the items in the Functions menu will open windows with the following functions:
Reagent Kit Status: This window shows the percent of each reagent left. Confi rmation of a reagent change
is also executed via this window.
Operational Data: The operating hours, number of measurements and liquid consumption are tracked in
this window.
Cleaning Routines: Various cleaning routines can be run using this window.
Syringe Maintenance: Used for preparing the syringe for removal and installation.
Hardware Management: Prime and shutdown of the Liquid Management, as well as start-up and shutdown
of the hardware, are executed in this window.
Automatic Adjustment: An automatic focus adjustment is run in this window.
SST: This opens a window in which System Suitability Tests (SST) can be set up and executed. The status of
SSTs are also displayed.
Scheduling: Automatic Prime, LM Shutdown and cleaning routines can be scheduled in this window.
Export to File: Measurement results can be exported into various formats, including Excel, from this
window.
Data Exchange: Data can be imported or exported from the database of one system to the database of
another system using these windows.
Archiving: Data from the database can be archived or restored in these windows.
Overview of the Cedex Control Center
Measurement Menu
Page 49

43
Operation
C
C
1.5 Reports Menu
Reports can be generated using this menu for the following types of information:
Operational Data
Measurement Data
System Confi guration Parameters
Audit Trail
Report about the Multi Run
Automatic Adjustment and Alignment Verifi cation
1.6 Master Data Menu
The menu items have the following functions:
Reagent Container Confi guration: This window allows the user to set the minimum and maximum vol-
umes for the reagents, as well as to set the volumes for the warning and lock levels.
User Preferences: The user preferences for default parameters such as measurement parameters,
measurement lists and Cultivation Time Chart can be individually set using this window.
Cell Type List: This allows for the creation of customized Cell Types.
1.7 Setup Menu
Clicking on these menu items will open up windows with the following functions:
Audit Trail: Opens a window that tracks all actions of the system.
System Options: Various system parameters can be changed by the Superuser using this window.
User and Rights Management: The Administrator can create new users and administer their rights in this
window.
Diagnosis: At the request of local Roche technical services, a diagnosis of the entire system can be run with
the options listed in this window.
Trace and Logging: At the request of Roche technical services, logs of various functions of the system can be
created in this window.
Report Templates: Report templates can be created using this window.
Overview of the Cedex Control Center
Reports Menu
Page 50

44
Cedex HiRes Analyzer Operator’s Guide
C
C
1.8 Help Menu
The Help menu provides general information about the analysis software.
1.9 Shortcut Area
Several buttons that act as short-cuts to certain functions are available in this area, including:
List: Opens the Measurement List window.
Measure: Opens the Measurement window for running a single measurement.
Multi Run: Opens the Multi Run window for running multiple measurements.
CTC: Opens the CTC Views window for setting up Cultivation Time Charts.
SST: Opens the System Suitability Test List window for setting up and executing SSTs.
Clean: Opens the Cleaning window.
HWM: Opens the Hardware Management window
Log Out: Logs the user out of the Cedex Control Center.
1.10 Tracking of Status of Events Carried out by the Analyzer
In the Event window below the Shortcut area, the status of events that have been carried out by the analyzer is
tracked. If, for example, a cleaning routine is run, the completion of the routine will be noted in this window.
Previous events can be looked at by using the scroll bar on the right. The window is cleared each time the
software is shut down.
Overview of the Cedex Control Center
Help Menu
Page 51

45
Operation
C
C
2 Preparing the Analyzer for Measurements
2.1 Switching on
Each element is switched on separately as follows:
1
Switch on the Cedex HiRes Analyzer.
2
Switch on the monitor and the PC.
■
Cedex HiRes Analyzer hardware components must be switched on before starting the analysis software.
Otherwise, the analysis software may not be correctly initialized.
2.2 Logging in at the Computer Operating System Level
A prompt for a username and password will appear on the computer when everything has been turned on
correctly. The user should log in as Win-Admin, password Win-Admin unless a different Windows operating
system account has been set up.
2.3 Starting the Cedex HiRes Software 2.2
To launch the Software, do the following:
1
Check that the Cedex Server software has already automatically started (it may appear as a minimized
window in the task bar at the bottom of the computer screen). If not, start the server by double-clicking on
the Cedex Server icon on the desktop.
2
Start the Cedex HiRes Software 2.2 by double clicking the Cedex Client icon on the desktop (the Cedex
Server must be started before the Cedex Client can be started). The Log In window of the Cedex HiRes
Analyzer program will open.
3
Enter the username and password (if a password is required) in the respective fi elds.
Factory installed default user is Superuser (password spass).
4
If you are logging in for the fi rst time under a new username, you might be forced to change your password.
5
Click on the OK button to log in or press <Return>. The Cedex Control Center appears after a successful
login.
■
The user may be prompted to create a new password the fi rst time the Cedex HiRes Software 2.2 is started. This
serves the purpose of replacing the temporary password given to the user by the Administrator when the user
account was created. Follow the program instructions or see “Changing own Password“.
The Administrator, Superuser or regular user has access to the assigned functions once he/she has logged into
the Cedex Control Center. The regular user only has access rights to routine operations depending on the
confi gurations set by the Administrator. Access rights may vary according to options chosen for each user
account.
Preparing the Analyzer for Measurements
Switching on
Page 52

46
Cedex HiRes Analyzer Operator’s Guide
C
C
2.4 Performing a HW Startup and Prime
Two elements of the analyzer are usually shut down at the end of the day: the Hardware Management and
the Liquid Management. When the Hardware Management is shut down, several elements of the analyzer,
such as the scanner, Multi Sampler and pump, are not yet initialized. A HW Startup will initialize hardware
interfaces and must be done before a measurement can be performed. If a measurement is attempted before the
Hardware Management has been started, an error message will appear, “Cannot start a new process: Hardware
Management is not started”. The HW Startup may be automatically carried out when the software is launched
if the Administrator has set this up in the system options.
In the case of the Liquid Management, the capillary tubes and syringe are fi lled with air or water when the
analyzer is fi rst installed or any time an LM Shutdown has been performed (see, “Carrying out an LM Shutdown
and HW Shutdown”). Performing a Prime will fi ll the capillary tubes and 8-way valve with the appropriate
reagents. All measurements are based on the capillary tubes having a precise amount of reagents in them.
Not performing a Prime will lead to cell samples being incorrectly stained and, consequently, inaccurate
measurement results.
A Prime must, therefore, be performed after an LM Shutdown has been executed in order to run a measurement.
Since LM Shutdown should be run at the end of the previous day, a Prime is necessary prior to the fi rst
measurement of the day. No measurement is possible without performing a Prime fi rst. If a measurement is
attempted before the machine has been primed, an error message will appear, “Cannot start new process: system
is not primed”.
Both the HW Startup and the Prime functions are located in the same window. Follow the instructions below
to perform a HW Startup and Prime:
1
Click on the HWM button in the Cedex HiRes Control Center or else select Hardware Management
under the Functions menu. The Hardware Management window will open.
2
If the Hardware Management has not been started, the current status fi eld will have the message “HW not
started and LM not primed”.
3
Click on HW Startup if required. The Hardware Management will start and the current status fi eld will have
the message “HW started and LM not primed”.
4
Ensure that a Reagent Kit is installed (see “Preparing the Reagent Kit”) and a clean, empty Cedex Sample
Cup is correctly positioned on the Multi Sample Tray in the DefaultCup position (see “
The Multi Sampler
DefaultCup
”) or attached to the single sample port.
5
Click on Prime. The duration of a Prime procedure is displayed in the Estimated total time area. The time
displayed is an estimate based on the time required for the previous Prime. The message “HW started and
LM primed”, appears in the current status fi eld when the Prime has been completed.
6
Click on to close the window.
■
There should not be a break of more than 2 hours between a Prime and a measurement. If more than 2 hours
have passed since the last measurement, a new Prime must be performed.
Preparing the Analyzer for Measurements
Performing a HW Startup and Prime
Page 53

47
Operation
C
C
2.5 Preparing the Reagent Kit
To ensure optimal performance, the reagents must be free of impurities such as dust, crystals, biological
material or fl uff. The Roche Diagnostics GmbH Cedex HiRes Reagent Kit guarantees optimal handling with the
best possible safety. One Reagent Kit pack is suffi cient for 100 measurements, including the standard cleaning
routines.
2.5.1. Installing or Changing the Reagent Kit
Proceed as follows to install or change the Reagent Kit:
1
Perform an LM Shutdown if the Liquid Management system has been primed (see “Carrying out an LM
Shutdown and HW Shutdown
”).
2
Open the Reagent Kit chamber in Cedex HiRes Analyzer by pushing the front upwards until it clicks into
place (see Figure 38, below).
3
Remove the old Reagent Kit with the tray and dispose of the old reagent bottles if necessary.
4
Open the new Reagent Kit and remove the covers from the individual containers.
5
Place the Reagent Kit containers in the appropriate positions in the reagent tray
(see Figure 38, below).
6
Close the front cover by pulling it all the way down. When the front cover is closed, the capillaries are
automatically correctly positioned in the individual containers.
7
Select the Reagent Kit Status option in the Functions menu of the Cedex HiRes Control Center. The
Reagent Kit Status window will open.
8
Click on the Replace all containers button in right-hand corner of the Reagent Kit Status window to
confi rm the changing of the Reagent Kit (see Figure 39). The Reagent Control display at the bottom righthand corner of the Cedex Control Center will turn from red to green and indicate the number of runs left.
9
Attach a clean Cedex Sample Cup to the sample port or place it in the DefaultCup position on the Multi
Sample tray and perform a Prime (see “
The Multi Sampler DefaultCup”).
■
Container for Detergent
Container for Trypan Blue
Container for Cleaning Solution
Waste container
Container for distilled or de-ionized water
Figure 38: Position of the Reagent Tray with the individual containers
Preparing the Analyzer for Measurements
Preparing the Reagent Kit
Page 54

48
Cedex HiRes Analyzer Operator’s Guide
C
C
Figure 39: Confi rming change of the Reagent Kit
For reliable functioning of the reagent control (correct number of possible measurements, or reporting an
impending overfl ow of the waste container), it is critical that all of the reagent containers are correctly fi lled
to the line with the appropriate liquid or, in the case of the waste container, completely emptied (see “Refi lling
Containers Individually ”). The changing of the reagents must then be confi rmed in the software as soon as
the Reagent Tray has been put back into the chamber. Failure to do all of the above will result in a mismatch
between the calculated reagents available as shown in the Reagent Control and the actual reagent amounts
in the containers or space available in the waste container.
The reagent control function that monitors reagent and waste levels can be turned off. See “Disabling the
Reagent Control”, for more information.
2.5.2. Refi lling Containers Individually
In order to ensure optimal functioning of the analyzer, each Reagent Kit container must be thoroughly cleaned
before refi lling. Impurities such as dust and fl uff or contamination with micro-organisms may thus be avoided.
Reagents can be refi lled, or emptied in the case of waste, on an individual basis. Each change can be individually
confi rmed by clicking on the respective Set Full button or Empty button, in the case of waste, in the Reagent
Kit Status window (see Figure 39).
If you are using your own reagents, it may be necessary to fi lter them before use. Roche Diagnostics GmbH
recommends using the Cedex HiRes Reagent Kit.
Preparing the Analyzer for Measurements
Preparing the Reagent Kit
Page 55

49
Operation
C
C
To refi ll individual containers with reagents, follow the instructions below:
1
Rinse all reagent containers well before refi lling! Ensure there are no impurities such as dust or fl uff in the
containers.
2
Fill the detergent container to the required level with Cedex Detergent (see label).
Only Cedex Detergent or a detergent with identical specifi cations should be used for the cleaning
procedures in order to prevent damage to the sensitive surface of the Liquid Management components.
3
Fill Roche Diagnostics GmbH Cleaning Solution in the Cleaning Solution container to the required level
(see label).
4
Fill distilled or de-ionized water in the water container to the required level (see label).
5
Fill 0.2% Trypan Blue solution in the Trypan Blue container to the required level (see label). Roche Diagnostics
GmbH recommends using 0.2%Trypan Blue solution. If necessary, dilute a more concentrated Trypan Blue
solution with buffer (Phosphate Buffered Saline (PBS), pH 7.4).
6
Place all of the reagent containers, as well as the emptied waste container, in the appropriate positions in the
Reagent Tray (see Figure 38).
7
A Cedex Sample Cup should always be attached to the single sample port (if a single sample port is
available; see Figure 40). The Cedex Sample Cup (4 ml) is correctly attached when it is in an upright position
beneath the sample port and the capillary tube almost reaches the bottom of the Cedex Sample Cup. In the
case of a system with a Multi Sampler, the Cedex Sample Cup must be placed in the DefaultCup position on
the Multi Sample Tray (see “
The Multi Sampler”).
If the Trypan Blue is completely used up during measurements and then refi lled, a Prime must be
performed again before running the next sample (see “
Performing a HW Startup and Prime”). If a
Prime is not performed, the Prescan of the fi rst measurement after refi lling of Trypan Blue will fail and
the measurement will be considered invalid (there will be no check in the Valid checkbox found in the
Measurement window (see ”
Viewing the Prescan Image”). Subsequent measurements will be valid.
■
2.6 Ch ecking the Analyzer
Since measurement results obtained with the Cedex HiRes Analyzer depend on correctly fi lled reagent containers
and the proper performance of the analyzer, the user should check the analyzer for possible wear and tear, and
also check whether the reagent containers have the correct volume prior to each set of measurements, as follows:
1
Check the syringe module (2.5 ml syringe and 8-way valve) for wear and tear or contamination. Renew the
syringe if required (see “
Syringe Maintenance”).
2
Check the number of runs possible. This is listed in the right-hand corner of the Control Center next to a
green or red circle. Change the Reagent Kit punctually. Observe the reminder to change the Reagent Kit
(see “
Installing or Changing the Reagent Kit“).
3
Check whether there is an empty Cedex Sample Cup attached to the sample port or a Cedex Sample Cup
in the DefaultCup position on the sample tray in the case of a Multi Sampler. If there isn’t, attach one
(see Figure 40 or “
The Multi Sampler“).
4
Perform a Hardware Management (HW) Startup if necessary.
5
Perform a Prime if a Reagent Kit is installed and new measurements are to be carried out (see “Performing a
HW Startup and Prime
”).
6
Have the cell suspension samples or particle solutions ready for the analysis.
■
Preparing the Analyzer for Measurements
Checking the Analyzer
Page 56

50
Cedex HiRes Analyzer Operator’s Guide
C
C
3 Carrying out a Single Measurement
The following section describes the procedure for carrying out a single measurement. For setting up and
carrying out multiple measurements, see “Working with the Multi Sampler”.
A number of relevant parameters and entries must be specifi ed in the Measurement window prior to carrying
out measurements. They include:
Choosing the operating mode and specifying sample data.
Defi ning the measurement and analysis (process) parameters.
The measurement procedure can only begin when the steps above have been completed.
Perform a HW Startup and Prime prior to the fi rst measurement if the Liquid and Hardware Management
system were previously shut down (see “Performing a HW Startup and Prime”).
Carrying out a Single Measurement
Page 57

51
Operation
C
C
3.1 Opening the Measurement window and specifying the Operating Mode
and Sample Data
Open the Measurement window either by clicking on the Measure button in the Shortcuts area or by selecting
Single Measurement in the Measurements menu. The entry areas for choosing the desired operation and
specifying the sample data are located in the Sample Parameters and Processing parameters areas of the
Measurement window. The parameters should be entered just before measuring in order to ensure a direct
relationship between the sample and the data.
Follow the instructions below to specify sample data for a single measurement:
1
Open the Measurement window by clicking on the Measure button in the Shortcuts area or by selecting
Single Measurement in the Measurements menu.
2
Enter a clearly defi ned Reactor ID to describe the sample (e.g., the name of the cell culture) in the Reactor
ID area. You may either choose a Reactor ID from the drop down list or enter a new Reactor ID. A new entry
can be defi ned by up to 20 alphanumerical symbols.
3
Enter a clearly defi ned Sample ID in the Sample ID area (e.g., P001). The Sample ID can be freely defi ned.
If the intended measurement is not the fi rst in a row of measurements, i.e. if it has the same Reactor ID
as a previous measurement, then the software will automatically enter the consecutive Sample ID into the
Sample ID area (e.g. P001, P002,...). In that case, it is not necessary to enter the Sample ID manually unless
a different Sample ID is desired.
4
If desired, use the Sample Drawing drop-down menu to select the date when the sample was drawn. Note
that the process date and time, i.e. the date and time the sample was measured, is automatically entered.
5
Choose the appropriate dilution factor from the Dilution drop-down list (e.g., 1:3, 1:2, 1:5… etc.).
When a dilution of 1:2 is prepared, then 1 part cell suspension has been added to 1 part dilution medium.
A dilution of 1:5 means that 1 part cell suspension has been added to 4 parts dilution medium, etc. For
undiluted samples, a dilution factor of 1:1 should be entered. It may be necessary to dilute samples with
very high cell densities ( >1 × 10
7
cells/ml) manually prior to measuring. The dilution ratio chosen from
the drop down list only relates to the manual dilution of the sample prior to placing the sample on the
system. Dilutions that are an automatic part of the measurement process in the analyzer are already
taken into account by the Cedex HiRes Software. The calculations are carried out automatically and have
nothing to do with the entered dilutions.
6
Select the sample volume of 300 µl in the Volume drop-down menu. Currently, only the 300 µl option is
available for the Cedex HiRes Analyzer.
7
The System name, as well as the process date and time of the assignment, will be automatically transferred
to the “Processing parameters” area in the Measurement window.
8
Entering a comment for a measurement is optional. Enter the remarks in the Comment box on the Sample
Parameters area, if desired.
■
Carrying out a Single Measurement
Opening the Measurement window and specifying the Operating Mode and Sample Data
Page 58

52
Cedex HiRes Analyzer Operator’s Guide
C
C
3.2 Defi ning the Measurement and Analysis (Process) Parameters
The measurement and analysis parameters are defi ned in the Processing Parameters area of the Measurement
window. In principle, all routine measurements can be carried out using the standardized default settings that
are factory set. To change the settings, follow the instructions below:
1
Select the sample port type in the Sample Port drop-down list:
Multi or Auto: this option will only appear on systems with Multi Samplers.
Single: this option will only appear on systems with a single sample port.
Remote: This option is not yet available.
2
Manually enter the cup position for the sample in the Cup Position window if there is a Multi Sampler (see
“
Working with the Multi Sampler”).
In the case of single measurements run via the Measurement window on a Cedex HiRes System with
a Multi Sampler attached, the software will auto matically incrementally increase the sample cup position
number with each new measurement. The cup position can also be fi xed (see “
Turning off automatic
incrementation of sample cup position
”).
3
Select the Cell Type that optimally recognizes your cells from the Cell Type drop-down list. (see “Adjustment
of the Image Analysis using the Live Operator
”). The following Cell Types are available by default:
Min. Size for small cells with a diameter of about 6 µm, e.g., lymphocytes, default sedimentation time is
90 seconds.
Std. Size for normal sized cells with a diameter of about 12 µm, e.g., HB58, default sedimentation time is
45 seconds.
Max. Size for large cells of more than 16 µm, e.g., K562, default sedimentation time is 45 seconds.
If a new Cell Type has been created, it can also be selected from the same Cell Type drop-down list. See
“
Adjustment of the Image Analysis using the Live Operator” for more detailed information about creating new
Cell Types.
The 45 second sedimentation time set by default for the Std. Size and Max. Size may not allow enough
time for a prescan to be performed. In some cases of slow computer systems, the prescan may require
slightly more time than the default sedimentation time. If this occurs, a message “Warning: sedimentation
time was exceeded” will appear in the main Cedex Control Center window. However, there will be no
effect on the measurement procedure other than a slightly longer sedimentation time. The sedimentation
time can be increased for the Std. Size and Max. Size, if desired, in order ensure a sedimentation
time that is longer than the prescan time (see “
Editing an Existing Cell Type”). Alternatively, the Prescan
function can be turned off (see “
Turning off the Flow Chamber Prescan”).
The Cell Types may have somewhat different names and sedimentation times if the system has been
upgraded from some previous version to Software version 2.2. In the case of a system that has been
upgraded to version 2.2, the default sedimentation time for all Cell Types may be 90 seconds.
Sedimentation time can be adjusted via the Cell Type List window (see “
Creating a New Cell Type”).
4
S
elect the desired precision level in the Precision drop-down list. The precision level
determines the volume
to be analyzed. A higher analyzed volume will require a somewhat longer measurement time but more cells
will be counted, which will lead to a more precise calculation.
Minimum: approximately 3 images are used for the analysis.
Normal: approximately 6 images are used for the analysis.
Superior: approximately 8 images are used for the analysis.
Maximum: approximately 11 images are used for the analysis.
The precision names may appear differently if the system has been upgraded from some previous version
to Software version 2.2. In the case of a system that has been upgraded to version 2.2, the precision levels
may be called Low (corresponding to Minimum), Medium (corresponding to Normal), High (corresponding to Superior) and Very High (corresponding to Maximum). The same volumes are analyzed
for the corresponding levels.
One image in the Cedex HiRes Software 2.2 corresponds to approximately 25 images
in the Cedex HiRes
Software version 1.10. Thus a Minimum precision (3 images) roughly corresponds to 75 images of
Software version 1.10 of the Cedex HiRes Software, while Normal precision roughly corresponds to
150 images, Superior precision to 200 images and Maximum precision to 275 images.
5
Prepare the sample and attach the Cedex Sample Cup containing the sample to the sample port or place
it in the appropriate spot on the Multi Sample Tray (see “
Preparing the Sample and Attaching it to the Multi
Sample Tray or Sample Port
”, below).
■
Carrying out a Single Measurement
Defi ning the Measurement and Analysis (Process) Parameters
Page 59

53
Operation
C
C
3.3 Preparing the Sample and Attaching it to the Multi Sample Tray or
Sample Port
Prepare the sample prior to measuring according to the following instructions:
1
Transfer the selected volume of a well-mixed cell suspension to a clean Cedex Sample Cup.
The Cedex HiRes Analyzer tolerates volume variations of +/- 10%. Any greater variation in sample
volume will lead to inaccurate results, and the Reagent Control monitor will no longer function
correctly. The Cedex HiRes Analyzer can
determine cell concentrations in the range of between
5× 10
4
– 1× 10⁷ cells/ml. Any higher concentration requires a manual dilution. Cells with a diameter
range of between 2 µm – 40 µm
can be assessed accurately. Object recognition performance lies
between 1 µm and 90 µm.
2
Remove the present Cedex Sample Cup from the Multi Sample Tray (or sample port). Attach the prepared
Cedex Sample Cup containing the cell suspension to the sample port (see Figure 40; the Cedex Sample Cup
is correctly attached to the sample port when it is in an upright position directly beneath it and the capillary
tube almost reaches the base of the Cedex Sample Cup) or place in the appropriate cup position on the
Multi Sample Tray (see Figure 42).
Figure 40: Attaching the Cedex Sample Cup to the sample port
■
3.3.1. Starting the Measurement
Ensure that the entire measurement system, including the sample, is ready for a measurement
as follows:
1
Ensure that the Cedex Sample Cup is correctly placed in the Multi Sample Tray or attached to the sample
port.
2
Ensure that the reagent containers are suffi ciently fi lled and in their correct positions.
3
Ensure that the waste container is empty.
4
Click on Start Measurement in the middle of the Measurement window to begin the measurement.
■
After the sample has been injected into the chamber, the cells are allowed to settle to the bottom of the fl ow
chamber for a specifi ed amount of time (the sedimentation phase). The amount of time the cells are allowed to
sediment is set at 90 seconds by default for the Min. Size Cell Type and 45 seconds for Std. Size and Max. Size.
However, the sedimentation time can be changed to suit the needs of individual cell lines by creating a new Cell
Type (see “Adjustment of the Image Analysis using the Live Operator”).
The fl ow chamber is checked for impurities with a separate scan ( Prescan) during the sedimentation phase
(see “Viewing the Prescan Image”). If it is ascertained that there are impurities in the fl ow chamber, an error
message, “Dirt or bubbles detected during prescan!” will appear. The measurement will be completed and the
results calculated even in the case of a Prescan failure. However, when the measurement results are viewed in
the Measurement window there will be no check in the Valid checkbox below the Image area. (see Figure 41).
Carrying out a Single Measurement
Preparing the Sample and Attaching it to the Multi Sample Tray or Sample Port
Page 60

54
Cedex HiRes Analyzer Operator’s Guide
C
C
If the error message appears, check the Prescan at the end of the measurement to see if it is acceptable or
not. If the fl ow chamber appears to have had dirt or impurities in it, then carry out a Standard Clean before
performing a new measurement (see “
Carrying out a Cleaning Routine”). If the Prescan is acceptable, the
measurement results can still be used.
The 45 second sedimentation time set by default for the Std. Size and Max. Size may not allow enough
time for a prescan to be performed. In some cases of slow computer systems, the prescan may require slightly
more time than the default sedimentation time. If this occurs, a message “Warning: sedimentation time was
exceeded” will appear in the main Cedex Control Center window. However, there will be no effect on the
measurement procedure other than a slightly longer sedimentation time. The sedimentation time can be
increased for the Std. Size and Max. Size, if desired, in order ensure a sedimentation time that is longer than
the prescan time (see “Editing an Existing Cell Type”). Alternatively, the Prescan function can be turned off
(see “Turning off the Flow Chamber Prescan”).
3.3.2. End of Measurement
A cleaning procedure automatically begins immediately after the scanning ends. The entire Liquid Management
system is rinsed during this procedure (Ultra Fast Clean). Once this procedure has been completed, a green bar
appears in the Measurement window. In addition, the message “Process fi nished EndEvent (Measurement)”
appears in the Event window on the Cedex Control Center.
In the Measurement window, the top section of the Result Data area displays the overall results of the
measurement. The bottom section displays, in succession, the results from each image taken. When a line is
selected in the list of results of single images, the corresponding image will be displayed in the Image area (see
“Image Area”).
Figure 41: Cedex HiRes Analyzer Measurement window with the fi nal results
The measurement results can be directly printed out via the Print button in the middle of the measurement
window.
To set up a new measurement, click on the New Measurement button in the middle of the Measurement
window. If the next measurement belongs to the same Reactor ID as previous measurements, then the
consecutive Sample ID will automatically be entered into the Sample ID area by the analysis software without
further entries being necessary. If a different Sample ID is desired, the new Sample ID can be typed in manually.
Carrying out a Single Measurement
Preparing the Sample and Attaching it to the Multi Sample Tray or Sample Port
Page 61

55
Operation
C
C
When the fi nal measurement in a set of samples has been completed, or if there is a longer pause before the next
measurement, the user should carry out a Standard Clean in the Liquid Management system in addition to the
Ultra Fast Clean procedure that is automatically carried out between measurements (see “
Cleaning Options”).
If multiple users have been created for the Cedex HiRes Software 2.2, log out of the software once the cleaning
procedure has been completed to allow the next user access to the Cedex HiRes Analyzer.
The Cedex Sample Cup from the last measurement should remain attached to the sample port or left in the
Multi Sampler Tray in the DefaultCup position during the complete cleaning procedure. The cup should only
be removed when a new Cedex Sample Cup has been attached for the next measurement.
If the Cedex HiRes Analyzer is to be shut down after a set of measurements, or at the end of the day, the
complete Liquid Management system should be cleaned with an LM Shutdown procedure to maximize the lifespan of the Cedex HiRes Analyzer and guarantee optimal performance. The entire Liquid Management system
is rinsed with distilled or de-ionized water during the LM Shutdown, and the Trypan Blue is then pumped out
of the capillary (see “Carrying out an LM Shutdown and HW Shutdown”).
3.4 Interrupting a Measurement
An orange EMERGENCY STOP button is located on the left-hand side of the Measurement window and can
be activated during the measuring procedure to interrupt the analysis process. If the EMERGENCY STOP is
selected, an error message will appear asking, “Do you want to cancel the process?”. Click on Ye s to stop and
abort the process immediately. Click on No to put the process on hold.
If Yes is selected, the EMERGENCY STOP button will change to read Unlock Queue. The system must be
unlocked by clicking on this button before more measurements can be run. If No is selected, the EMERGENCY
STOP button will change to read Resume. Click on this button to resume the measurement process.
Only use the Emergency Stop button in a case of emergency. Actual measurement data may be lost.
Carrying out a Single Measurement
Interrupting a Measuremen
Page 62

56
Cedex HiRes Analyzer Operator’s Guide
C
C
4 Working with the Multi Sampler
Moving parts of the Multi Sampler may cause hand injuries. The Multi Sampler needle may cause
injuries during operation. Never use the Cedex HiRes Analyzer without the protective cover in place for the
Multi Sampler.
The Multi Sampler is part of the Cedex HiRes Analyzer (see Figure 42 and Figure 43). The Multi Sampler can
convey up to 20 cell suspension samples in sequence to the Cedex HiRes System for analysis. Once the samples
have been loaded in the Multi Sample Tray and the analysis parameters for each sample have been set, the
samples are automatically delivered to the Cedex HiRes System and analyzed.
Sampling probe
Protective Cover
Cedex Sample Cups
Multi Sample Tray
Figure 42: Multi Sampler
Working with the Multi Sampler
Page 63

57
Operation
C
C
Sampling probe
Multi Sample Tray
Figure 43: Cedex HiRes Analyzer including Multi Sampler
4.1 The Multi Sampler DefaultCup
The position of the Cedex Sample Cup used for the Prime, LM Shutdown, calibration
and cleaning routines is
called the DefaultCup. This sample cup does not differ from the usual Cedex Sample Cups. The standard (default) position for the DefaultCup is position 1 of the Multi Sample Tray. The 20 numbered positions are clearly
marked directly on the Multi Sample Tray.
An empty Cedex Sample Cup must be manually placed in the position set for the DefaultCup before running
LM Shutdown, focus adjustment, Prime and all cleaning routines.
The position in which the DefaultCup is placed can be changed. See “Modifying the Standard Setting for the Multi
Sampler DefaultCup”. The position of the DefaultCup does not infl uence measurements. All 20 positions on the
Multi Sample Tray can be used for measurements. However, should a sample be present in the DefaultCup
position during Prime, LM Shutdown, focus adjustment or any cleaning routines, it can no longer be used for
a measurement.
Working with the Multi Sampler
The Multi Sampler DefaultCup
Page 64

58
Cedex HiRes Analyzer Operator’s Guide
C
C
4.2 Preparing the Measurement
4.2.1. Using the Multi Sample Tray
Fill the appropriate volume of samples into Cedex Sample Cups (maximum 20) and place them on the Multi
Sample Tray according to the desired sequence. Gently insert the tray into the notch until the automatic tray
rope starts pulling it in.
Multi Sample Tray with
Cedex Sample Cups
Notch for taking in the
Multi Sample Tray
Figure 44: Multi Sampler including Multi Sample Tray
As a safety precaution, leave all of the empty Cedex Sample Cups in the Sample Tray after the measurements
have been completed.
4.2.2. Ejecting the Multi Sample Tray
The Multi Sample Tray can be ejected by gently pushing on the tray only when the system is idle. The tray
cannot be ejected if the system is moving or the needle is down in a cup.
If a problem occurs w ith the system when the needle is down (see, for example, “Disruption of Measurements”),
restart the Hardware Management to render the tray ejectable again (see “Carrying out an LM Shutdown
and HW Shutdown”). In some cases it may be necessary to restart the Cedex HiRes Software 2.2 and Analyzer.
Working with the Multi Sampler
Preparing the Measurement
Page 65

59
Operation
C
C
4.2.3. Performing a Prime
The Prime and HW Startup are performed as usual in the Liquid Management window as described in
“
Performing a HW Startup and Prime”. An empty Cedex Sample Cup must be placed in the DefaultCup position
(default position 1) of the Multi Sample Tray when running a Prime.
4.3 Carrying out Measurements with the Multi Sampler
Before carrying out measurements, ensure that the system is operational as described in “Checking the Analyzer”.
4.3.1. The Multi Run Data Entry Window
Click on the Multi Run button in the Shortcuts area of the Cedex Control Center or select Multi Run in the
Measurements menu. The Multi Run window will appear, and entries for sample data and parameters for the
analysis process are entered via this window (see Figure 45).
In addition to the entry columns for ReactorID, SampleID, Cell Type, Dilution and Precision, there are also
columns for Status and CupNr. The CupNr column shows the sample cup position on the Multi Sample Tray.
The Status column displays the state of the sample before, during and at the end of a measurement.
4.3.2. Preparing for Multiple Measurements in the Multi Run Window
The Multi Run window automatically displays all 20 possible sample cup positions. To set up and carry out
multiple measurements with the Multi Run do the following:
1
Transfer 300 µl of a cell suspension sample into Cedex Sample Cups and place the cups in the desired
locations on the Multi Sample Tray.
2
Click anywhere in the row of the MultiRun Measurements Preparation area that corresponds to the
location of a Cedex Sample Cup containing a sample. The row will be converted
to edit mode, and the sample
and process parameters for the measurement can be
defi ned (see “Opening the Measurement window and
specifying the Operating Mode and Sample Data
” and Figure 45).
3
Enter the desired sample data and parameters for the sample (see “Defi ning the Measurement and Analysis
(Process) Parameters
”).
4
Enter a comment in the fi eld Comment, if desired.
5
Repeat steps 2 – 4 for the remaining samples to be measured.
6
The rows in which entries are in the process of being fi lled out will remain in edit mode. To clear the entire
list of entries and start with a new list, click on the Clear List button on the right-hand side of the Multi
Run window.
■
Measurement of up to 20 samples in a row leads to prolonged incubation (up to 90 minutes) of cells at room
temperature. Tests in our lab using several different cell lines (CHO-K1 and several hybridoma cell lines)
showed no noteworthy infl uence of the prolonged incubation times on the measurement results. However,
this result may not necessarily apply to all cell lines available on the market. We, therefore, recommend testing especially sensitive cell lines in advance to determine the number of samples that can be measured in a
row without affecting the cells.
Working with the Multi Sampler
Carrying out Measurements with the Multi Sampler
Page 66

60
Cedex HiRes Analyzer Operator’s Guide
C
C
Figure 45: Adding sample information to the Multi Run window
4.3.3. Activating Sample Rows and Starting the Measurement
After all sample information has been entered in the Multi Run preparation area, the samples can be activated
and, thus, added to the process queue. To activate samples and start the measurement, do the following:
1
Activate the status of each sample row by double clicking in the Status fi eld of the row to be activated. The
row appears pale blue, and further modifi cations of sample information is impossible. Return to the Edit
status by double clicking on the Status area of the sample row to allow for further changes, if required.
2
Alternatively, all samples can be activated or deactivated simultaneously by double clicking on the word
Status in the column heading at the top of the Multi Run preparation area. Confi rm the safety query with
Ye s to accept the modifi cation.
3
After some or all rows have been activated, click on the Start button on the right-hand side of the Multi Run
window to start the analysis of the activated measurements.
■
When measuring begins, the row of the sample being measured will be highlighted in yellow, and the progress
of the measurement will be tracked in the status column. When a measurement is fi nished, the row will be
highlighted in green and status column will indicate Done. In addition, the estimated time required for the
measurement is shown in the Estimated time remaining fi eld.
Images taken of the sample are displayed in the upper right-hand corner of the Multi Run window during the
measurement. In addition, results for Total Cell Concentration, Viable Cell Concentration and Viability are
displayed in the upper left-hand corner of the Multi Run window during and after a measurement has fi nished.
Working with the Multi Sampler
Carrying out Measurements with the Multi Sampler
Page 67

61
Operation
C
C
The Status column can display the following information (see Figure 45, above and Figure 46):
Edit: Indicates that sample data is actively open for editing and is in the process of being edited.
Sample data in edit mode has not yet been added to the process queue, and samples placed
in positions in edit mode will not be analyzed when the Multi Run is started. Rows in edit
mode are white.
Active: Indicates that the sample is ready for analysis, which starts automatically once the Start
button is pressed. Rows in active mode are highlighted light blue.
Scheduled: All rows marked as active will be added to the process queue and converted to scheduled
mode after pressing the Start button. Rows marked as edit will remain in edit mode.
Prepare: Indicates that the system is preparing to measure the sample marked with this status. The
row is highlighted in yellow.
Measure: Indicates that the system is in the middle of carrying out a measurement of the sample
marked with this status. The row is highlighted in yellow.
Cleaning: Indicates that the system is carrying out the cleaning routine after a completion of a
measurement. The row is highlighted in yellow.
Done: indicates that measurement and analysis of a sample marked with this status has been
completed successfully. The row is highlighted in green.
Failed: The measurement of this cup has failed.
Aborted: The measurement of this cup has been aborted by the user.
No Cup: There was no cup at this position in the multi sampler when it was ready for measurement.
Blocked: The lift was blocked when the cup should have been measured.
The status of a particular measurement is tracked in the Status column. The Errors and messages window gives
a list of each step completed and any errors that may have occurred.
Working with the Multi Sampler
Carrying out Measurements with the Multi Sampler
Page 68

62
Cedex HiRes Analyzer Operator’s Guide
C
C
Figure 46: Multi Run window during measurement
Only samples that have the status of active or scheduled will be measured. Samples that are in edit mode
have not yet been added to the process queue and will not be measured until they have been activated.
If an automated cleaning has been scheduled via the Scheduler function, the cleaning routine has a lower
priority than scheduled measurements and will be added to the process queue after all activated (status: ac-
tive or scheduled) measurements have been carried out (see “ Scheduling Automatic Cleaning Routines” for
more information about automating cleaning routines). Note that measurement information placed in the
Multi Run preparation area that have the status of edit are not added to the queue! Therefore, if a Cedex
Sample Cup containing a sample is added to the Multi Sample Tray in the DefaultCup position, and the row
for that sample is left in edit mode, the cup will be used for a cleaning routine should one be scheduled to be
carried out at that time. It is therefore critical to ensure that a Cedex Sample Cup containing a sample to be
measured is never placed in the DefaultCup position on Multi Sample tray and left in edit mode during a
Multi Run. Samples placed in the DefaultCup position for measurement should be immediately set to active
or scheduled in order to be added to the process queue and, thus, have precedence over all scheduled cleaning
routines.
4.3.4. Adding Measurements to the List while Measurements are Running
Sample rows in which data has not yet been entered can be fi lled out at any time while the Multi Run is running.
In addition, sample rows containing fi nished measurements (status: done) can be cleared and prepared for a
new measurement by double-clicking in the Status fi eld of the row with the fi nished measurement. Sample data
for a measurement cannot be modifi ed after that measurement has begun.
Working with the Multi Sampler
Carrying out Measurements with the Multi Sampler
Page 69

63
Operation
C
C
4.3.5. Modifying Data Entry, Changing Samples
Information about the operation and process parameters for samples that have not yet been analyzed can be
modifi ed during the run. To modify information of measurements that are in active or schedule mode but have
not yet been started, do the following:
1
Double-click on the Status fi eld of the measurement to be modifi ed. The status fi eld will indicate that the
sample is in edit mode.
2
Make desired changes to the measurement.
3
Double-click on the Status fi eld to re-activate the measurement (status: active or scheduled).
■
Wait until the Multi Sample Tray has stopped moving before changing the samples!
4.3.6. Non-Linear Measurements in a Sample Series
Measurements of activated samples are always done in a linear fashion following a sequence of 1 –20. If samples
need to be analyzed individually and not in the usual linear ascending order of 1–20, the samples to be analyzed
later should be inactivated and remain in the Edit status for the meantime. When all active samples in the
sample tray are completed, subsequent measurements with the newly activated samples can begin.
4.4 Interrupting a Multi Run
The Start button will switch to a Stop button after a Multi Run has started. Click on the Stop button to pause or
stop the Multi Run. If a measurement is being carried out when the Stop button is pressed, that measurement
will be completed. All scheduled measurements (status: scheduled) will switch to active mode, and the Stop
button will revert to Start. Click on the Start button again to continue analysis of activated measurements.
4.5 Disruption of Measurements
Error messages may appear if a sample can’t be run. For example:
If a Cedex Sample Cup is not available in its position on the Multi Sample Tray during measurements, then
the No Cup message will appear.
If the Multi Sample Tray is not inserted or not inserted correctly, then the Tray not inserted message will
appear.
Some errors may block the analysis of the rest of the measurements. The level of error that should stop the
analysis of all samples can be determined using the Error Level drop-down list at the top of the Multi Run
window. The options for the level of error that will stop the analysis are:
Fatal: Only errors involving a system / hardware crash, when functionality is not available, will stop analysis.
Critical: Data loss or any other error that results in an invalid measurement will stop the analysis.
Error: Errors that do not result in an invalid measurement will stop the analysis.
Warning: Warning messages with information for the user will stop the analysis.
Message: Any message will stop the analysis.
Working with the Multi Sampler
Disruption of Measurements
Page 70

64
Cedex HiRes Analyzer Operator’s Guide
C
C
4.6 Results
After a Multi Run has fi nished, the results for all measurements obtained by the Cedex HiRes System are stored
and displayed as described in “Using the Measurement List”. In addition, some results for the measurements
carried out are displayed in the Analyzed Measurements fi eld at the bottom of the Multi Run window.
4.6.1. The Multi Run Result List
At the bottom of the Multi Run window, the Analyzed Measurements fi eld displays the list of results for
measurements previously carried out. Measurements are listed in order of process time, from the newest
measurements at the top of the list to the oldest measurements at the bottom. All measurements carried out
using the Multi Run window will be displayed in this fi eld unless the Clear Resultlist button has been pressed.
Clicking on the Clear Resultlist button will clear all measurement results from the list. In addition, measurements
displayed in this fi eld can be restricted to only the measurements carried out by the user logged into the system
(mine), measurements that have not yet been printed out (unprinted), and/or measurements carried out on
that particular day (today).
Measurement results can be printed out via the Print Report button located just above the Analyzed
Measurements fi eld (see “Printing Reports” for more information about print report options).
The following information is, by default, shown in the result list:
User
Workarea
Reactor ID (classifying the cell sample)
Sample ID (naming the measurement)
Valid check-box
Total cell concentration [× 105 cells/ml]
Viable cell concentration [× 105 cells/ml]
Viability [%]
Sample Drawing (defi ned by user, if desired)
Process Time (date and time sample was measured)
Comment (if added by the user)
Other results, such as Average Diameter, can be added for display in the result list via the User Preferences (see
“Adjusting Result Display in the Measurement List and Multi Run windows”). Double-click on a measurement
to view all results. If the result list has been cleared, previously carried out measurements can still be viewed,
printed out and exported via the Measurement List window (see “Using the Measurement List”).
Working with the Multi Sampler
Results
Page 71

65
Operation
C
C
5 Switching off the Cedex HiRes Analyzer
Switching off the Cedex HiRes Analyzer should always be carried out in the following order:
1
Carry out an LM Shutdown.
2
Shut down the analysis software (optional, see note below regarding the use of the scheduler).
3
Shut down the operating system.
4
Switch off the individual devices.
■
If Prime, LM Shutdown or routine cleaning routines have been scheduled via the scheduler, the software
application must be left on and the HW must be started (see “ Scheduling Automatic Cleaning Routines”).
5.1 Carrying out an LM Shutdown and HW Shutdown
All of the capillary tubes in the Liquid Management system are cleaned and rinsed with distilled or de-ionized
water during an LM Shutdown. In addition, the Trypan Blue is withdrawn from the 8-way valve/syringe and
replaced with air. This is to prevent the capillary tubes and fl ow chamber from becoming damaged. The HW
Shutdown shuts down several elements of the hardware system including the scanner, Multi Sampler and pump.
Follow the instructions below to carry out an LM Shutdown:
1
Click on the HWM button in the Shortcuts area of the Control Center to open the Hardware Management window. Alternatively, the Hardware Management window can be opened by selecting Hardware
Management in the Functions menu at the top of the Control Center (see Figure 47).
2
Click on the LM Shutdown button in the lower right-hand corner of the window to shut down the Liquid
Management. The estimated time required for the LM Shutdown is displayed in the “Estimated Total Time”
section of the Hardware Management window.
3
When everything has been shut down, the Current Status fi eld will have the message “HW started and LM
not primed”. If both the Liquid Management and the Hardware Management has been shut down, the the
message “HW not started and LM not primed” will appear.
4
Click on to close the window.
■
Figure 47: Hardware management window
See also “
The Hardware Management Window”.
Switching off the Cedex HiRes Analyzer
Carrying out an LM Shutdown and HW Shutdown
Page 72

66
Cedex HiRes Analyzer Operator’s Guide
C
C
5.2 Logging out
To log out of the Cedex Control Center, select Logout under the System menu or click on the Logout button in
the Cedex Control Center. If an LM Shutdown has not yet been carried out, the message, “Do you really want to
log out without performing an LM Shutdown?”, will appear. Either click on Yes to log out immediately or click
on No, perform an LM Shutdown, then log out.
The software will be ended and the login window will reappear. Logout is possible during a measurement
without infl uencing it. A message indicates that measurements are in progress.
5.3 Shutting down the Control Center
Follow the instructions below:
1
Perform an LM Shutdown to shut down the Liquid Management system
(see “
Carrying out an LM Shutdown”).
2
Shut down the software by selecting Exit under the System menu or by clicking on to close the window.
The security query, “Do you really want to exit the Cedex Control Center?“, will appear.
3
Click on Ye s to shut down the program.
■
Restarting the analysis software is necessary for the next measurement session (see “Starting the Cedex HiRes
Software 2.2 ”).
If at all possible, the analyzer should never be turned off. If it is necessary to turn it off, the
analyzer needs at least
2 hours to warm up before it can be used for measurements.
Switching off the Cedex HiRes Analyzer
Shutting down the Control Center
Page 73

67
Software
D
D
D Software
1 Using the Measurement Results Window
Measurement results are displayed in the Measurement window (see Figure 49). If a single measurement has
been run using the Measurement window, the analysis results obtained from that measurement are automatically
displayed in the same window after the analysis process has been completed. Measurement results from Multi
Runs are displayed in the Multi Run result list until the list has been cleared.
In addition, measurement results can be viewed via the Measurement List window. To access this window,
click on the List button in the Shortcuts area of the Cedex Control Center or select Measurement List in
the Measurements menu. The Measurement List window will open, showing all of the measurements stored
in the database (see Figure 48). See “Using the Measurement List” for more details about working with the
Measurement List.
Figure 48: Measurement List window
To see the results of a particular measurement, highlight the row containing the measurement to be viewed
by clicking on the
fi eld to the left of the appropriate line, then clicking on the View button in the bottom
right-hand corner. The Measurement window will open with the results of that particular measurement. The
Measurement window has 4 separate sections (see Figure 49):
Result Data area
Sample Parameters area
Processing Parameters area
Image area
Some of the obtained data can also be displayed as graphic diagrams by clicking on the Diagrams button (see
“
Graphical Display of the Analysis Results” and “Cultivation Time Chart” for more details). It is also possible to
access the Live Operator from this window by clicking on the Live Operator button (see “Adjustment of the
Image Analysis using the Live Operator”).
Using the Measurement Results Window
Page 74

68
Cedex HiRes Analyzer Operator’s Guide
D
D
1.1 Result Data area
The Result Data area in the bottom half of the Measurement window has two separate sections: the section just
below the words “Result Data” displays the overall results for the measurement, while the section further down
displays the results for each image analyzed.
Figure 49: The Measurement window with results
The parameters shown in the Result Data area for both the overall results and individual image results include:
Viable Cell Conc. Value:
This value indicates the concentration of viable cells [× 105 cells/ml].
Total Cell Conc. Value:
This value indicates the total cell concentration [× 105 cells/ml].
Viability (%) Value:
This value indicates the proportion of viable cells (%) to the total number of cells (viable and dead cells).
Total Cell Count:
This value indicates the total number of cells counted.
Avg Compactness Value:
This value indicates the average variation, in shape, of viable cells from an ideal sphere, with the ideal sphere
shape equaling >1<. Higher values indicate the extent of variation
and, therefore, the overall state of the cell
culture (e.g., damage caused by shear force etc.).
Average Diameter Value:
This value indicates the average diameter of viable cells [µm].
Aggregate Rate Value:
The Aggregate Rate specifi es the percentage of all cells (Total Cell Count) present in aggregates (clusters).
Dead Cell Conc. Value:
This value indicates the dead cell concentration [× 105cells/ml].
Viable Cell Count Value:
This value indicates the number of viable cells counted.
Dead Cell Count Value:
This value indicates the number of dead cells counted.
Total Object Count Value:
This value indicates the number of all detected objects counted.
Using the Measurement Results Window
Result Data area
Page 75

69
Software
D
D
In addition, the Result Data area for the individual images has an Excluded column next to the image number.
Images that could lead to incorrect measurement results during analysis, e.g. due to impurities or large bubbles,
are automatically recognized as invalid and excluded from evaluation by the analysis software. If this occurs, the
image will be marked with a check in the checkbox of the Excluded column. Users can also manually exclude
individual images from the calculations or include images that were automatically excluded by the software by
clicking on the check-box in this column.
1.2 Sample Parameters and Processing Parameters areas
The Sample Parameters area of the Measurement window shows the parameters entered by the user before
running the measurement. If any measurements have been reprocessed, the original or reprocessed data can
be selected in the drop-down menu of the Data Set section. If data has been reprocessed at some point, the
Effective checkbox will indicate which data set has been determined to be the effective version (see “
The
Reprocess Button”). Comments for the measurement can be added in this area at any time.
The Processing Parameters area lists the process parameters of the measurement, including Cell Type, used
to analyze the images (see “
Adjustment of the Image Analysis using the Live Operator”), the precision selected
and the date and time the process was run. None of the values in this area can be changed. Click on the Show
parameters button below the Cell Type drop-down menu to open a window that shows the actual Live Operator
Parameters values used for that Cell Type (see Figure 50, below).
Figure 50: Window displaying the Live Operator parameter settings for the Cell Type used for a measurement
Using the Measurement Results Window
Sample Parameters and Processing Parameters areas
Page 76

70
Cedex HiRes Analyzer Operator’s Guide
D
D
1.3 Image Area
1.3.1. Viewing Individual Cell Images
The Cedex HiRes Software 2.2 enables a close view of a single image or an enlarged display for evaluation.
Individual images can be viewed in the Image area of the Measurement window. The results from the individual
images are listed at the bottom of the Measurement window in the Result Data area. When a row with the
results of a particular image is highlighted in this section, the image connected with those results is displayed in
the Image area at the top right-hand corner of the Measurement window. To see a different image in this area,
click on a different row in the Result Data area.
Only one image is displayed in the Image area in the Measurement window. Alternatively, an overview of all
cell images can be displayed by clicking on the Image List button beneath the Image area, which will display
the Image List window containing thumbnails of all of the images used for the calculation of results (see Figure
51, below).
Figure 51: Image List window showing all images used for the analysis
Double-click on an image in the Image List window to open a new window, called the Image View. This
window contains an enlarged version of the selected image, as well as some further options for viewing the
image. Double-clicking on the image displayed in the Image area of the Measurement window will also open
the Image View window.
Using the Measurement Results Window
Image Area
Page 77

71
Software
D
D
1.3.2. Viewing a Cell Image Using the Image View Window
It is possible to see which cells were marked viable and dead cells by the analysis software via the Image View
window. The user can thus get a sense of how cell shapes and clusters have been evaluated by the software.
The Cedex HiRes Software 2.2 offers various options for optimizing measurement results by adjusting the
Operator used for the image analysis. Thus, the image analysis Operator can be adjusted for abnormal cell
culture images or for specifi c internal counting strategies. For more information about adjusting the image
analysis, see “
Adjustment of the Image Analysis using the Live Operator”.
The Image View offers the following information and options:
Viable Cells: number of viable cells.
Dead Cells: number of dead cells.
Show Circles check-box: switches on/off the marking of cells recognized as living or dead. Viable cells
are marked with a uniform green circle and dead cells are marked with a red circle. The circle diameter
corresponds to the cell diameter. Objects are marked with a blue circle.
Zoom: Image enlargement.
Brightness and contrast settings.
Navigating a window when the image is enlarged (scroll bars appear at the bottom and right edge of the
image when the image is zoomed in).
Scrolling through all of the images for a particular measurement using the arrows in the lower
right-hand corner.
Figure 52: Viewing a cell image using the Image View window
Using the Measurement Results Window
Image Area
Page 78

72
Cedex HiRes Analyzer Operator’s Guide
D
D
Certain areas of the image can be enlarged by following the instructions below:
1
Place the mouse pointer on the top left-hand corner of the area to be enlarged.
2
Hold the left mouse button pressed down and move it to the lower right-hand corner of the area to be
enlarged.
3
Release the mouse button; the selected area will fi ll the whole window.
■
Return to the original size of the image by following the instructions below:
1
Place the mouse pointer anywhere on the diagram.
2
Hold the left mouse button pressed down and form a box from the bottom right corner to the upper left
corner.
3
Release the mouse button. The chart will then return to in its original size.
■
Click on Close to shut the window or use the button.
1.3.3. Excluding Images from the Evaluation Process/Including Excluded Images
Images can be excluded from analysis by the user. Also, images that have been excluded automatically by the
analysis software (due to, for example, excessive bubbles or dirt) can be included in the result analysis, if desired.
Exclusion and inclusion of images for a particular measurement are done via the check-box in the Excluded
column in the Result Data area of the Measurement window.
If there is a check in the Valid check-box, the image is considered valid, which means that the cell image has
been included in the calculation process. The user can choose to manually exclude the image by clicking on the
checkbox in the Excluded column for the selected image. The image will still be marked as Valid, but will also
be excluded from the calculation of results.
No check in the Valid check box means that the cell image is not considered valid and has been automatically
excluded from the calculation process. In that case, a check-mark will automatically appear in the Excluded
column. To include an image that was excluded by the software, click away the check-mark in the Excluded
column. The image will still be marked as invalid via the lack of check-mark in the Valid check-box, but will be
included in the calculation of results.
Should stripy shadows or lines appear on the images, a new focus adjustment needs to be run as poor image
quality can affect the results of the measurement (see “Automatic Adjustment and Alignment Verifi cation”).
Using the Measurement Results Window
Image Area
Page 79

73
Software
D
D
1.3.4. Viewing the Prescan Image
During a measurement, a so-called Prescan is carried out before the cells are scanned. The entire fl ow chamber
is scanned in order to identify impurities and bubbles that may infl uence the measurement. The Prescan image
is stored together with the measurement and can be viewed when the Measurement window with results has
been opened for that measurement. If the quality of the chamber condition is not good enough, there will be
no check in the Valid check-box under the Image area, and a note will be placed in the Audit Trail File that dirt
was detected.
The Prescan image for a particular measurement can be accessed via the View Prescan button located in the
Image area of the Measurement window. To open an Image View window containing the Prescan image, do
the following:
1
Click on the View Prescan button in the Image area of the Measurement window.
A part of the Prescan image will appear in the image window.
2
Double-click on the Prescan image; the Image View window containing the full Prescan image will open.
■
The Image View with the Prescan image offers the following options:
Zoom: Image enlargement.
Brightness and contrast settings.
Navigating a window when the image is enlarged (scroll bars appear at the bottom and right edge of the
image when the image is zoomed in).
In addition, areas of the image can be enlarged or returned to the original size (see “Viewing a Cell Image Using
the Image View Window”).
Using the Measurement Results Window
Image Area
Page 80

74
Cedex HiRes Analyzer Operator’s Guide
D
D
2 Using the Measurement List
Data from measurements that have been carried out and stored in the database can be accessed via the
Measurement List window. Open the Measurement List window by either clicking on the List button in the
Shortcuts area of the Cedex Control Center or by selecting Measurement List in the Measurements menu at
the top of the Control Center. Measurements are stored in the order in which they were carried out, with the
most recent measurement placed at the top of the list.
Two types of information can be displayed in the list of measurements: information about sample and process
parameters and information about some results. If there is no check in the Show measurement results box at
the bottom left-hand corner of the window, sample and process parameters for measurements are displayed
(see Figure 53, below).
Figure 53: Measurement List window displaying the Sample Identifi cation and Process Parameters
To see measurement results in the list, click on the check box next to Show measurement results (see Figure
54, below). By default, the list displays the results for total cell concentration, viable cell concentration and
viability. Other results, such as Average Diameter or Compactness, can be added for display in the result list of
the Measurement List window via the User Preferences (see “
Adjusting Result Display in the Measurement List
and Multi Run windows”).
Figure 54: Measurement List window with the option Show measurement results selected
Using the Measurement List
Page 81

75
Software
D
D
A number of actions can be carried out in the Measurements List window including searching for measurements
using a variety of fi lters, viewing measurement sample and process parameters, viewing measurement results,
printing reports, exporting measurements to a fi le and reprocessing measurements (see “
The Reprocess Button”).
2.1 Viewing Analysis Results
View existing data sets by double-clicking on the measurement or by highlighting the row containing the desired
measurement and then clicking on the View button in the bottom right-hand corner of the Measurement List
window. This will open a Measurement window containing all of the relevant data results for the selected
measurement (see “Using the Measurement Results Window”).
2.2 Searching for Measurements
It is possible to search for measurements using a number of different fi lter criteria including sample drawing
date, process date, Reactor ID, and Sample ID in the Filter By area at the top of the Measurement List window.
To search for measurements based on the sample drawing date or the process date, for example, do the following:
1
Click on the drop-down menu button next to the Sample Drawing Date From or Process Date From
sections. A calendar will appear in which the desired starting date for fi ltering can be selected.
2
When a date has been selected, a check will appear in the check-box next to the date to indicate that a fi lter
is active based on that date.
3
Click on the drop-down menu button next to the date in order to select the desired ending date.
4
Once the dates for fi ltering the measurements have been selected, click on the Find button in the upper
right-hand corner of the Measurement List window.
5
All of the measurements that match the dates given for sample drawing (using the Sample Drawing
Date From section,) or that were run within the dates specifi ed in the Process Date From section, will
be displayed in the measurement list in the bottom half of the window.
■
It is possible to select measurements with regard to both sample drawing date and process date. If the desired
dates for both the sample drawing dates and process dates are selected, only those measurements that meet all
4 date criteria will be displayed when the Find button is clicked on.
Measurements can also be searched for based on Reactor ID and/or Sample ID by fi lling in the information in
these sections of the Filter By area. In addition, measurements can be searched for based on user by typing in
the user name in the User section, by work area (using the drop-down menu in the Workarea section), by data
set (in the DataSet area) and by Cell Type (using the drop-down menu in the Cell Type section).
If a measurement has been reprocessed, the original and all reprocessed versions of the measurement will be
listed. The data set version of a particular measurement that has been selected as the Effective data set will
have a check in the check-box of the DSEffective column. The original data set of a particular measurement
will have a check in the check in the check-box of the DSOriginal column (see “Effective Data Sets”).
Using the Measurement List
Searching for measurements
Page 82

76
Cedex HiRes Analyzer Operator’s Guide
D
D
3 Editing Existing Analysis Results/ Data Sets
The Cedex HiRes Software 2.2 allows for existing measurement results or data sets to be modifi ed and
reprocessed. These changes are done on existing software data (image and analysis results) and, therefore, do
not require any adjustments to the analyzer. Existing measurement results can be edited via the Reprocess
button in the lower right-hand corner of the Measurement List window.
3.1 The Reprocess Button
Reprocessing existing measurement results/data sets, i.e. viewing a set of image data and evaluating them with
new analysis parameters, can be done in the Reprocess mode, which is only accessible to authorized system
users.
The reprocess mode offers the following options:
Enter, modify or delete a comment.
Correct the dilution (see “Defi ning the Measurement and Analysis (Process) Para meters”).
Change the Cell Type (see “Adjustment of the Image Analysis using the Live Operator”).
To reprocess a measurement, do the following:
1
Open the Measurement List window by clicking on the List button in the Shortcuts area of the Cedex
Control Center or by selecting the Measurement List option in the Measurements menu of the Control
Center.
2
Highlight the row of the measurement to be reprocessed and click on the Reprocess button in the lower
right-hand corner. A Measurement window will open containing all of the result data for that measurement.
3
Enter a new name for the data set in the DataSet section of the Sample Parameters area.
4
Make the desired changes to the new data set. Changes can be made with regard to the comment, dilution
factor and Cell Type in the appropriate sections of the Sample Parameters and Processing Parameters areas.
5
Click on the Reprocess button in the center of the Measurement window to start the reprocessing of the
measurement based on the new parameters.
6
When the reprocessing is fi nished a window will open asking whether the new data set should be the
effective data set (see “
Effective Data Sets”).
■
A new data set is available once the evaluation has been completed. All changes can be retraced by viewing previously created data sets, which are shown in the Measurement List window.
The reprocessing procedure creates additional data sets. Original data is not overwritten.
Editing Existing Analysis Results/Data Sets
The Reprocess Button
Page 83

77
Software
D
D
3.2 Effective Data Sets
When measurements are reprocessed, it is possible to label one of the resultant data sets as Effective. The
Effective data set is the version of the measurement (original or reprocessed) that has the correct parameters.
Once a data set has been selected as Effective it will be labeled as such in the Measurement List window.
It is possible to later change which data set is labeled the Effective data set by doing the following:
1
Select the data set version of the measurement to be labeled Effective in the Measurement List window.
2
Click on the Reprocess button. A Measurement window will open containing the results for that data set.
3
Click on the box to the left of the word “Effective” in the Measurement window. A check will appear in the
box.
4
Close the Measurement window.
5
Click on Find in the Measurement List window to refresh the list; the newly selected data set will appear
as the Effective data set.
■
Editing Existing Analysis Results/Data Sets
Effective Data Sets
Page 84

78
Cedex HiRes Analyzer Operator’s Guide
D
D
4 Graphical Display of the Analysis Results
In addition to displaying the overall analysis values, the Cedex HiRes Software 2.2 can also display graphic
diagrams of the results. These diagrams can be viewed after the analysis is fi nished by clicking on the Diagrams
button in the Result Data area of the Measurement window. When the Diagrams button has been selected,
the Diagram window will open. 5 different histograms are available: Aggregate Histogram, Cell Diameter
Histogram, Compact Histogram, Object Diameter Histogram and Measurement Statistics. Click on the
respective button to open the desired diagram.
All the results represented in the diagrams are based on valid images accepted for evaluation. This means that
individual images may be sorted out due poor quality (e.g., bubbles, dirt particles, etc) in the interest of an
accurate measurement result. This is done automatically by the analysis software or manually by the user (see
“
Excluding Images from the Evaluation Process/Including Excluded Images”).
4.1 Enlarging the Histograms
Certain areas of the histograms can be enlarged by following the instructions below:
1
Place the mouse pointer on the top left-hand corner of the area to be enlarged.
2
Hold the left mouse button pressed down and move it to the lower right-hand corner of the area to be
enlarged.
3
Release the mouse button and the selected area will fi ll the complete window.
■
Return to the original size of the histogram by following the instructions below:
1
Place the mouse pointer anywhere on the diagram and right-click with the mouse.
2
A small window will open with the options “Unzoom” or “Undo all Zoom/Pan”.
3
If the chart was enlarged more than once, selecting “Unzoom” will reduce the image to the point before the
last enlargement. Selecting “Undo all Zoom/Pan” will return the chart to its original size.
■
In addition, the diagrams can be moved around within the window by placing the mouse pointer anywhere in
the diagram, holding down the middle mouse button and moving the mouse.
Graphical Display of the Analysis Results
Enlarging the Histograms
Page 85

79
Software
D
D
4.2 Aggregate Histogram
The Cedex HiRes Analyzer offers an evaluation of aggregates in cell cultures. Clusters of up to 15 cells are
displayed. Click on the Aggregate Histogram button in the Histograms window to open the corresponding
histogram window.
The Aggregate Histogram shows the number of cells in the cell culture found in aggregates, as well as how
many cells each aggregate is composed of. Both the actual cell number and the percentage distribution can be
displayed.
Figure 55: The Aggregate Histogram, detailed view (divided into living and dead cells), here: (absolute) number of cells
The Number of Cells [#] identifi ed is displayed on the y-axis and at the top of the bars. The Aggregate Size, in
terms of the number of cells per aggregate, is given on the x-axis. Figure 55 shows, for example, that 148 living
and 40 dead cells of all identifi ed cells were found in aggregates of two cells.
Graphical Display of the Analysis Results
Aggregate Histogram
Page 86

80
Cedex HiRes Analyzer Operator’s Guide
D
D
The percentages can be displayed using the percent button.
Figure 56: The Aggregate Histogram, detailed view, here: percentage distribution of cells
The percentage of cells [%] found in aggregates compared to the total live or dead cell count is displayed on the
y-axis. The aggregate size, in terms of the number of cells per aggregate, is given on the x-axis. Figure 56 shows,
for example, that 3.66% of all living cells and 7.29% of all dead cells are found in aggregates of two cells.
The Total Cell Count (living and dead cells combined) per aggregate is mapped in the histogram using the total
button. Figure 57 shows, for example, that 188 cells of the measurement are found in aggregates of two cells.
Figure 57: The Aggregate Histogram, total view (sum of living and dead cells), here: number of cells
Graphical Display of the Analysis Results
Aggregate Histogram
Page 87

81
Software
D
D
The percentage of cells found in aggregates, in relation to the total cell count, can be displayed using the percent
button as is shown in Figure 58.
Figure 58: The Aggregate Histogram, total view (sum of living and dead cells), Here: percentage
4.3 Cell Diameter Histogram
Clicking on the Cell Diameter Histogram button will bring up the Cell Diameter Histogram. The Cell Diameter
Histogram represents living cells (!) with a defi nable diameter. This diagram is based on the single diameters
of all cells in the measurement.
Figure 59: Cell Diameter Histogram
Graphical Display of the Analysis Results
Cell Diameter Histogram
Page 88

82
Cedex HiRes Analyzer Operator’s Guide
D
D
4.4 Object Diameter Histogram
Clicking on the Object Diameter Histogram button will bring up the Object Diameter Histogram (see Figure
60). Analogous to the representation of the diameter of the living cells, the diameter of all (!) recognized objects
is shown here, including objects such as cells, debris, air bubbles and viable and dead cell aggregates.
Figure 60: Object Diameter Histogram
4.5 Defi ning Diameter Intervals in the Diameter Histograms
The Cell and Object Diameter Histograms have three sliders that can defi ne separate diameter intervals. This
allows for dividing a diameter histogram into a maximum of four parts. The sliders can be activated by clicking
on the corresponding boxes and moving the sliders to the desired positions. One can also defi ne the margins of
the intervals by entering the numerical values on the left hand side of each slider.
The borders of the fi rst interval are defi ned by the minimum value and the fi rst numerical value entered. The
next two values defi ne the upper borders of the second and third intervals. The fourth interval is defi ned by the
upper border of the third interval and the maximum value.
The number of viable cells, their percentage of the total viable cell number and the viable cell concentrations [×
105 cells/ml] are listed in a table for each of the individual intervals. Similarly, the number of the objects analyzed,
their percentage compared to the number of all objects recognized, as well as the object concentration [× 105
objects/ml], are listed in a table under the Object Diameter Histogram for each of the individual intervals. The
intervals set in the Cell Diameter or Object Diameter histograms can be saved for future reference. In addition,
default intervals can be automatically set for all measurements via the User Preferences (see “Specifying Default
Measurement Parameters”).
Graphical Display of the Analysis Results
Defi ning Diameter Intervals in the Diameter Histograms
Page 89

83
Software
D
D
4.6 Compactness Histogram
The ratio between the cell circumference and the cell area is based on an ideal sphere (4), which is equivalent
to the value >1< on the abscissa of the Cell Compactness Histogram. The extent of variation between the
cell shapes and an ideal sphere is refl ected in values being greater than 1. The shape of a cell is known as the
Compactness. Click on the Compactness Histogram button to display a diagram that compares viable (!) cell
shapes to that of an ideal sphere.
If a signifi cant number of cells (ordinate) have a high value, this could indicate improper handling of a sample.
The Compactness Histogram can be used to check the state of the cell culture, e.g. if the stirring speed is too
high or nutrient composition is incorrect.
Figure 61: Compactness Histogram
This diagram is based on the compactness of all viable cells in the measurement. To view results of individual
cell images, see “Result Data area”.
Graphical Display of the Analysis Results
Compactness Histogram
Page 90

84
Cedex HiRes Analyzer Operator’s Guide
D
D
4.7 Measurement Statistics Histogram
Click on the Measurement Statistics button to display a column diagram showing the total number of viable
cells (green columns) and dead cells (red columns) found in the images analyzed.
Figure 62: Measurement Statistics histogram
In the bar diagram, the number of living cells is represented in green bars and the number of dead cells in red
bars on top of the green bars. The Combine button, which appears when the Measurement Statistics histogram
is open, can be used to combine several images to give a better overview of the whole sample. Conspicuous
bars can thus be immediately identifi ed, and the user can then view and assess the relevant images (see “Image
Area”). The results of each individual image can be seen again by clicking on the Single button. If an image has
been automatically excluded by the software or manually excluded by the user, the corresponding position in
the diagram will be empty.
Graphical Display of the Analysis Results
Measurement Statistics Histogram
Page 91

85
Software
D
D
5 Cultivation Time Chart
In the Cultivation Time Chart ( cultivation progress/ result diagram), the growth patterns of cell cultures can be
graphically evaluated. It is also possible to export and print out the data.
The CTC Views window required for creating a Cultivation Time Chart can be opened by clicking on the CTC
button in the Shortcuts area of the Cedex Control Center or by selecting the Cultivation Time Chart option
in the Measurements menu. In the CTC Views window, charts can be created, viewed, edited, exported and
deleted.
A collection of data used for the creation of a particular chart is called a View. Each View can have up to 5
separate series of measurements for comparison of data.
5.1 Creating a CTC View
The CTC Views window has two areas (see Figure 63):
The View area is used for viewing, exporting, creating and deleting charts. The Filter By section located at
the top of this area is used for fi nding previously created cultivation time charts.
The Series belonging to selected view area is used for creating, editing, listing or deleting the various
measurement series belonging to the View highlighted in the View area.
Figure 63: CTC Views window
Cultivation Time Chart
Creating a CTC View
Page 92

86
Cedex HiRes Analyzer Operator’s Guide
D
D
5.1.1. The View Area
This area is used for viewing, exporting, creating or deleting a View. If no fi lters have been set, all Views that
have been created will be displayed under the View Name column. If fi lters have been set, only those Views that
match those fi lters will appear under this column. To see the chart for a particular View, highlight the row of the
desired view and click on the View Chart button. To create a new View, click on the button New. Highlighted
rows of Views can also be exported with the Export button or deleted using the Delete button.
Previously created views can be searched for using various fi lter criteria in the Filter By section at the top of
the View area. One can fi lter by name of the View, username of the creator or by the date a View was created or
modifi ed. Enter the desired parameters and click on the Find button. When searching by date, the check-box
next to the date must fi rst be checked. After checking the box, clicking on the drop-down menu to the right of
the date will open up a calendar in which the desired date can be selected.
When the button New is selected, a window will open asking for a name for the new View. A name must be
given before a View can be created. Give a name for the new View and click on OK. The new View will appear
highlighted in the left-hand section of the View window. It is now possible to select the desired measurements
for this View using the Series belonging to selected view area at the bottom half of the CTC Views window.
5.1.2. The Series of Measurements Belonging to Selected View Area
This area is used for creating, editing, viewing and deleting measurement series for a particular View. In order
add to or modify specifi c measurement series for a particular View, that View must be highlighted in the View
area.
Cultivation Time Chart
Creating a CTC View
Page 93

87
Software
D
D
5.1.3. Adding Measurements to a View
Do the following to fi nd and select measurements for a new View or for a View that has already been created:
1
Highlight the View to be modifi ed in the View area of the CTC Views window and click on the New button
on the right-hand side of the Series belonging to the selected view area. This will open the Selection of
Data Series window, in which measurements can be selected for the creation of a View (see Figure 64).
2
Choose the desired System name in case measurements from other systems that have been imported into
the database should be added to the chart (see “
Data Exchange”).
3
Choose the desired Workarea (base directory in which measurement data are stored), the Reactor ID and
the preferred Data Set (original or effective measurement data, see “
Effective Data Sets”).
4
Click on the Find button. All of the Sample IDs associated with that particular Reactor ID will appear in the
upper section of the Selection of Data Series window.
5
Click on the empty column to the left of the measurement to be added to the series in order to highlight that
measurement. Multiple measurements can be highlighted either by holding down the <shift> or <ctrl> key.
6
When all of the desired measurements have been selected, click on the Add selected measurements button.
7
Click on Save. The Selection of Data Series window will automatically close. The CTC Views window will
reappear and show the measurements that have been added to the View in the Series belonging to the
selected view area.
8
To add another series to a View, click on the New button again. The Selection of Data Series window will
open. Follow steps 2 – 7 above to add measurements to the new series.
9
Up to 5 separate series can be added to one View. Once 5 series have been added to a View, the New
button will no longer be available for that View.
■
Figure 64: Selection of Data Series window
Cultivation Time Chart
Creating a CTC View
Page 94

88
Cedex HiRes Analyzer Operator’s Guide
D
D
5.1.4. Editing Measurements in a View
Measurements can be added or removed from a particular View by using the Edit button in the Series belonging
to the selected view area of the CTC Views window. To edit the measurements found in a View, do the following:
1
Highlight the row of the View to be edited in the View area of the CTC Views window.
2
Highlight the particular series of a View to be edited in the Series belonging to the selected view area.
3
Click on the Edit button. This will open the Selection of Data Series window (see Figure 64).
4
Add or remove measurements from the series list by highlighting the measurements and clicking on the
Remove button at the bottom of the window.
5
Click on the Save button. The changes will be saved and the window will automatically close.
6
The CTC Views window will become available and other series in the same View or else other Views can
now be edited.
■
Measurements can also be excluded from a cultivation time chart without being removed from the series. All
measurements selected for a series that are marked with a (✔) in the checkbox of the Use column will be
displayed in the Cultivation Time Chart. Should it not be desirable to display a particular single measurement,
the measurement can be unselected by removing the (✔) in the Use column with a mouse click.
5.1.5. Viewing List of Measurements in a Series
If measurements have been added to a View, a simplifi ed list of the series will appear in the left-hand side of the
Series belonging to the selected view area of the CTC Views window. To see the full list of all measurements
from all series created, click on the List button. This will open the Series List window (see Figure 65). A search
for specifi c measurements in the list can be done using the Filter By area in the upper right-hand corner of the
Series List window. Searches can be made by Workarea, Reactor ID or date of measurement. Once the fi lter
parameters have been set, click on the Find button. The measurements that fi t the parameters will be displayed
in the Measurements area in the lower left-hand corner. Only series that contain measurements with the correct
parameters will be displayed in the Series area in the upper left-hand corner of the Series List window.
Figure 65: Series List window
Cultivation Time Chart
Creating a CTC View
Page 95

89
Software
D
D
5.1.6. Deleting Views and Series
Entire Views can be deleted by highlighting the View and clicking on the Delete button in the View area of the
CTC Views window. If one series of a particular View should be deleted, highlight the relevant View in the View
area, then highlight the series to be deleted in the Series belonging to the selected view area. Click on the Delete
button in the Series belonging to the selected view area of the CTC Views window.
5.1.7. Exporting a View
The series of measurements in a view can be exported via the Export button in the CTC Views window. Select
the View to be exported in the View area of the CTC Views window and click on the Export button. An Export
window will open in which the desired settings and parameters can be selected (see “
Export to fi le”).
5.2 Creating a Cultivation Time Chart
Once a View has been created with the desired series of measurements to be used for a chart, the Cultivation
Time Chart can be created. To create a Cultivation Time Chart, do the following:
1
Highlight the View to be used for the creation of a Cultivation Time Chart in the CTC Views window.
2
Click on the View Chart button, this will open the Cultivation Time Chart window (see Figure 66).
3
Select the parameters to be displayed in the chart by clicking on the desired parameters in the Data
Selection area in the upper right-hand corner of the window (see “
The Data Selection Area”).
4
Select the series to be displayed in the Chart area in the lower right-hand corner of the window.
5
A graph will then be generated showing the selected parameters and series.
■
Only measurements already loaded will be displayed in the Cultivation Time Chart window diagram. The
Selection of Data Series window must be brought up again to add additional measurements.
Cultivation Time Chart
Creating a Cultivation Time Chart
Page 96

90
Cedex HiRes Analyzer Operator’s Guide
D
D
5.2.1. The Data Selection Area
Which curves should be displayed in the diagram is determined in the Data Selection area of the Cultivation
Time Chart window. The following values can be selected for display:
Viable Cell Conc.: Viable cell concentration[cells/ml]
Total Cell Conc.: Total cell concentration [cells/ml]
Viability [%]: Percent viability
Total Cell Count: Total number of all cells counted
Avg. Compactness: Average compactness of living cells [without unit]
Avg. Diameter: Average diameter of living cells [µm]
Std. Dev.: The deviation from image to image of the number of cells found in each image
Aggregate Rate [%]: Percent of cells found in aggregates
Dead Cell Conc.: Dead cell concentration [cells/ml]
Viable Cell Count: The total number of viable cells counted
Dead Cell Count: The total number of dead cells counted
Total Object: The total number of objects counted
Click on the appropriate checkboxes to select the desired values.
Figure 66: Cultivation Time Chart window
The measurement series, including information about which measurements have been used to create the chart,
are listed in the Data Series area in the bottom left-hand corner of the Cultivation Time Chart window. A
legend indicating the symbol (form and color) used for each parameter is at the top of the graph. The color used
for each series is indicated in the Chart area in the lower right-hand corner of the window.
The x-axis units can be displayed as either days [d] or hours [h]. Click on the Time[d] below the x-axis to switch
to hours. The x-axis calibration will be automatically recalculated.
If the mouse pointer is placed over a measurement point in the diagram, detailed information, including the
date and time of the measurement as well as the results, will be displayed next to the point. Also, the graphic
representation can be enlarged or scaled down again with the use of the mouse (see “Enlarging the Diagrams”).
Cultivation Time Chart
Creating a Cultivation Time Chart
Page 97

91
Software
D
D
5.2.2. Fitting to the Lowest Common Value
The Fit lowest common value button enables automatic shifting of the zero-point of single measurement series
to each other. The following can be selected:
Viable Cell Density
Dead Cell Density
Total Cell Density
By means of this function, the zero-point of each series will automatically be shifted on the x-axis, in order to be
able to better compare the measurement series to each other. The lowest common value of all the measurement
series is automatically determined, and the graphs in the diagram are shifted to each other so that the lowest
common value falls on the x-axis at the same point. While doing so, the left-most point of the graph of all the
measurement points is set at value 0.
5.2.3. Measurement Series Offset
In the graph, measurement series are automatically displayed such that all measurement series begin at time
0. The different measurement series can, however, be best compared to each other when the beginning of the
exponential growth phase (log phase) starts at the same time. Therefore, it is possible to shift the curves in the
diagram by changing the offset for each series.
A button in the Offset column of the Data Series area displays the offset set by the user (the button displays 0
[h], if an offset was not set). Clicking on this button opens the Measurement Offset window. The measurement
series offset can be then manually shifted in this window.
Figure 67: The Measurement Offset window
The offset can be separately entered for each of the fi ve measurement series by clicking the button with the
corresponding number of the measurement series. Large time differences can be entered in days [d], small
ones in hours [h] by clicking on the appropriate buttons [d]/[h] . The offset can be set by selecting the desired
series number (colored boxes) and then moving the slider to the desired offset. Using the slider will cause an
immediate shift of the measurement series in the diagram so that it can be immediately seen where the best
position for a series is in the diagram.
The smallest time unit that can be set is 0.10 hours. The OK button confi rms the offset values in the graphics.
5.2.4. Variable Axis Calibration
The buttons lin and log are used to determine whether the y-axis should display in a linear (lin) or logarithmic
(log) scaling for cell concentration data. The default value is lin.
The x-axis units can be displayed as either days [d] or hours [h]. Click on the Time[d] below the x-axis to switch
to hours. The x-axis calibration and division will be automatically adjusted.
Cultivation Time Chart
Creating a Cultivation Time Chart
Page 98

92
Cedex HiRes Analyzer Operator’s Guide
D
D
5.2.5. The Exponential Regression Button
Using the Exponential Regression button in the View section of the CTC Views window, cell culture growth
patterns can be displayed with their Specifi c Growth Rate [µ] and Doubling Time [T]. The corresponding
values appear in the Data Series list (see Figure 68 below).
Figure 68: A view of the Exponential Regression window
Only viable cell concentration will be shown in this graph. The measurement parameters Specifi c Growth Rate
[µ] and Doubling Time [T] of the culture are computed by means of the differential curve.
Click on the to close the Exponential Regression window. The CTC Views window will reappear.
5.2.6. Printing out a Cultivation Time Chart
Cultivation Time Charts can be printed out via the Print button in the Cultivation Time Chart and the
Exponential Regression window. To print out a chart, click on the Print button. A window will open in which
the printer settings can be selected or the chart can be directly printed. Clicking on the Print button will open
a window with a preview of the page to be printed.
Cultivation Time Chart
Creating a Cultivation Time Chart
Page 99

93
Software
D
D
6 General Functions of the System
The Cedex Control Center offers users with the appropriate rights access to a set of functions in addition to the
basic functions of analyzing, modifying and reprocessing samples and measurement results. These functions
allow for easy and user-friendly operations with the Control Center, although some functions may only be
available to the Administrator (see “Administrator Functions”).
6.1 Data Management
6.1.1. Printing Reports
The main Report menu is located directly on the menu-bar of the Cedex Control Center; this menu serves as
direct access to the report functionality for all of the different reports. In addition, Print Report buttons can
be found in all of the appropriate windows (e.g. Measurement List, Audit Trail etc.). Pre-confi gured report
templates can be selected for printing reports, and new templates can be created.
The following information can be printed out:
Operational data
Allows the user to track a device’s operating hours, number of measurements and liquid consumption.
Measurement data
Contains information about measurement parameters and calculated results, e.g., sample identifi cation
data, name and parameters of the Cell Type used, calculated measurement result data etc. Select the desired
option for the form in which the result data should be printed via the Name drop-down menu in the Report
Template for the measurement report. Options include:
Standard (standard measurement report without details)
Full Details (full report including detailed images, results and histograms)
List (for multiple measurements displayed in a list)
Measurement audit trail (measurement report with audit trail entries)
Multiple long (for multiple measurements printed one after the other)
System confi guration parameters
Provides a list of system parameters as displayed in the System Options.
Audit trail
Provides a statement of all user initiated activities and related data.
Automatic adjustment and alignment verifi cation
Presents results from the automatic adjustment of focus, brightness and white/black balance and the
automatic verifi cation of the fl ow chamber alignment for the scanner.
General Functions of the System
Data Management
Page 100

94
Cedex HiRes Analyzer Operator’s Guide
D
D
6.1.2. Export to fi le
Exporting data is done via the Export to fi le area of the Measurement List window or via the Export to fi le
option in the Functions menu of the Control Center. Four different formats can be chosen including CSV,
XML, Excel-DIF and Flat fi le. In addition, a sub-set of parameters to be included in the fi le can be selected.
To export measurement results to a fi le, follow the instructions below:
1
Select the Export to fi le option in the Functions menu of the Control Center. The Measurement List
window will appear with the Export To File button located at the bottom of the window.
2
Select a single measurement from the list by clicking on the fi eld to the left of the desired line.
To choose a set of measurements, hold down the Ctrl button while selecting the appropriate lines.
Alternatively, the desired measurements can be
searched for using different fi lter criteria
(see “
Searching for measurements”).
3
Click on the Export To File button. The Export window will open (see Figure 69).
4
In the Export window, individual Parameter and String delimiters can be defi ned (this only applies to CSV
and Flat fi les).
5
In the Location area, the target path to be used for storage of the export fi le is entered. The button on the
right of the entry fi eld opens a window in which the path can be directly selected. The name of the fi le will
be automatically generated.
6
To specify a sub-set of parameters to be exported, either click the check-boxes beside the preset options
(i.e., All Parameters, Cell Data and Overall Results) or select the desired parameters from the Columns to
Export area. To choose a set of parameters, keep the <Ctrl> button pressed while making selections. The
preset options are:
All Parameters: All parameters about the measurement.
Cell Data: Data for each and every cell and object detected in the measurement.
Overall Results: Results such as average cell diameter, %viability, total cell concentration, viable cell
concentration, etc..
7
In the File format area, select the fi le format by clicking on the appropriate check-boxes. The fi les will
automatically and unchangeably receive .dif or .csv fi le name extensions.
The fi le format Excel-DIF should always be chosen if a fi le is to be exported into Excel.
8
Click on the Export Selected Data button.
9
A message window will appear to confi rm successful export of information.
Click on OK.
■
The measurement data can then be viewed in the fi le created.
Figure 69: The Export window
General Functions of the System
Data Management
 Loading...