

Page 1
User’s Manual
Diabetes Management System
Software version 3.0
Page 2

User’s Manual for the Accu-Chek® Smart Pix diabetes management system
Date of issue: October 2016
© 2016 Roche Diabetes Care
All rights reserved
ACCU-CHEK, ACCU-CHEK AVIVA, ACCU-CHEK AVIVA COMBO, ACCU-CHEK AVIVA CONNECT,
ACCU-CHEK AVIVA EXPERT, ACCU-CHEK AVIVA NANO, ACCU-CHEK AVIVA INSIGHT, ACCU-CHEK GO,
ACCU-CHEK GUIDE, ACCU-CHEK INSIGHT, ACCU-CHEK INSTANT, ACCU-CHEK MOBILE,
ACCU-CHEK NANO, ACCU-CHEK PERFORMA, ACCU-CHEK SPIRIT, ACCU-CHEK SPIRIT COMBO,
ACCU-CHEK SMART PIX, COMBO, PERFORMA COMBO, PERFORMA CONNECT, PERFORMA INSIGHT
and PERFORMA NANO are trademarks of Roche.
All other product names and trademarks are the property of their respective owners.
System requirements:
• Microsoft Windows XP, Windows 7/Windows 8/Windows 10
• PDF reader (for PDF version 1.6/Acrobat 7 and higher)
• Screen resolution of at least 1024 x 768 pixels
Read the User’s Manual carefully before the first use. The installation, use and maintenance/data backup of the Accu-Chek
Smart Pix software are the sole responsibility of the user. Roche accepts no responsibility for any damage or loss resulting
from non-compliance with this User’s Manual.
In addition, we advise you to refrain from installing any software on your computer which is not from a trustworthy source
and to protect your computer against unauthorised third-party access. This particularly applies to the security of any
existing Internet access. Use up-to-date software for virus protection and your firewall and install the security updates and
patches recommended by the manufacturers.
If you have obtained the Accu-Chek Smart Pix software from a USB flash drive: The USB flash drive is the original medium
used to provide the software, but it is not a removable medium for storing data you have created yourself. Avoid potential
data loss (for example from damage to or loss of the USB flash drive) and always store all files locally on your computer or
on a network server.
Do not remove the USB flash drive containing the Accu-Chek Smart Pix software while data is being exchanged. Doing so
could cause irreparable damage to files.
2
Page 3
Important note:
i
your healthcare professional first.
Never change your therapy based on data contained in the
Status
report element; always talk to
Important note:
selected. We therefore strongly recommend that you talk to your healthcare professional before you change the
configuration for blood glucose data (Hypo risk, Mean blood glucose and Variability) as well as for CGM data (hypo
duration, CGM median, CGM variability).
The number of blood glucose tests per test day must be sufficient in order to draw appropriate conclusions
regarding therapy from the statistical analysis. In addition, the tests must be conducted at meaningful points in time
spread over the course of the day. Only then does the analysis in the
relevant blood glucose parameter. If, for example, blood glucose is only tested when blood glucose levels are within
the normal range (euglycaemia) or higher range (hyperglycaemia), the
Important note:
has been properly selected. We therefore strongly recommend that you talk to your healthcare professional before
you change the limit. This function is not a substitute for hypoglycaemia training by your healthcare professional.
Important note:
the Accu-Chek Smart Pix software. All the pages and functions are stored in the device itself or in the software,
where they can be called up. An Internet connection is only required if you wish to automatically update the
Accu-Chek Smart Pix software, download it from the Internet or send data by email.
The displayed blood glucose
The
Hypo limit
You do
can only be a reliable indicator of low blood glucose (hypoglycaemia) if the limit
not
require an Internet connection if you wish to use the Accu-Chek Smart Pix device and
Status
will only be meaningful if the settings have been properly
Status
report element correctly reflect the
Hypo risk
is artificially lowered.
3
Page 4
Version note
This User’s Manual is valid for the Accu-Chek Smart Pix
software,
version 3.0
in connection with an
• Accu-Chek Smart Pix device (model 2),
version 2.2.1
or higher, or
• Accu-Chek Smart Pix device (model 1),
version 3.05
or higher.
You can check the software versions as described below:
Open the Help menu by clicking the icon (on the righthand edge of the button bar). You can display the software
version by clicking
About…
This displays both the software
version of the Accu-Chek Smart Pix software and the version
of the connected Accu-Chek Smart Pix device.
Latest software versions
You can download the latest software versions of the
Accu-Chek Smart Pix system using the
Software update...
option in the Help menu or as an automatic download
(if configured) from the Internet.
4
Page 5

Accu-Chek Smart Pix diabetes management system Contents
1 Overview of the system
1.1 Overview of the device............................................................................................................................................................. 15
1.2 Overview of the status indicator signals of the system............................................................................................... 16
1.3 Software overview ..................................................................................................................................................................... 17
1.4 Buttons overview........................................................................................................................................................................ 18
1.5 Printed symbols.......................................................................................................................................................................... 20
2 Before you start using the system
2.1 What you require to use the system................................................................................................................................... 22
2.2 Copying software to the computer...................................................................................................................................... 24
Connecting the device ..............................................................................................................................................................25
Connecting the USB flash drive ............................................................................................................................................25
Preparing the download version ...........................................................................................................................................25
............................................................................................................................................................11
.................................................................................................................................21
3 Launching and configuring the software
3.1 Launching the software........................................................................................................................................................... 29
3.2 Configuring the software........................................................................................................................................................ 30
General settings ..........................................................................................................................................................................31
Selecting a language .................................................................................................................................................................32
Time and date format ................................................................................................................................................................33
Display options (graphical representation and logbook format) .............................................................................33
Personal settings ........................................................................................................................................................................34
Automatic features .....................................................................................................................................................................35
Save options .................................................................................................................................................................................42
Settings for new patients .........................................................................................................................................................44
Customised settings for the patient record currently displayed ...............................................................................54
Adjusting menu and button bar ............................................................................................................................................55
................................................................................................................29
5
Page 6

Accu-Chek Smart Pix diabetes management system Contents
4 Using the software
4.1 Reading data manually ............................................................................................................................................................ 58
4.2 Reading data automatically.................................................................................................................................................... 62
4.3 Managing records...................................................................................................................................................................... 63
Creating a new patient record ..............................................................................................................................................63
Assigning an existing record .................................................................................................................................................65
Confirming the device assignment ..................................................................................................................................... 65
Importing records ......................................................................................................................................................................66
4.4 Further report and record management features.......................................................................................................... 67
Opening a record ....................................................................................................................................................................... 67
Closing the record and report ...............................................................................................................................................68
Editing patient records ............................................................................................................................................................. 69
Deleting a record .......................................................................................................................................................................70
Archiving a record ..................................................................................................................................................................... 70
Activating the interface to Accu-Chek Connect online .............................................................................................. 71
Adjusting the patient list display ..........................................................................................................................................73
4.5 Exporting reports as PDF files............................................................................................................................................... 75
4.6 Printing reports ........................................................................................................................................................................... 77
4.7 Emailing reports.......................................................................................................................................................................... 79
4.8 Displaying archived reports (PDF files)............................................................................................................................. 82
4.9 Using report elements in other applications.................................................................................................................... 83
4.10 Special functions........................................................................................................................................................................ 84
Searching for software updates for the Accu-Chek Smart Pix device
and the Accu-Chek Smart Pix software ............................................................................................................................85
Setting the date and time in the meter .............................................................................................................................. 87
Additional special functions .................................................................................................................................................. 89
........................................................................................................................................................................57
6
Page 7

Accu-Chek Smart Pix diabetes management system Contents
5 Reports and records
5.1 General information about the reports.............................................................................................................................. 91
Report elements ..........................................................................................................................................................................91
Selecting and assigning preferred report elements ......................................................................................................92
Analysed data ..............................................................................................................................................................................93
Report styles .................................................................................................................................................................................94
Keys and additional information on reports .....................................................................................................................95
5.2 Overview of icons in reports.................................................................................................................................................. 96
5.3 Interactive features in the report ....................................................................................................................................... 101
Toggling panes .........................................................................................................................................................................101
Changing the time range ......................................................................................................................................................102
Changing time intervals ........................................................................................................................................................105
Changing chart contents ...................................................................................................................................................... 106
Toggling the display between BG and CGM results .................................................................................................. 107
Displaying additional information in charts ...................................................................................................................108
Selecting chart contents .......................................................................................................................................................109
5.4 Blood glucose: contents of the report ............................................................................................................................. 110
Overview .....................................................................................................................................................................................110
Trend ............................................................................................................................................................................................115
Standard day .............................................................................................................................................................................119
Standard week ..........................................................................................................................................................................123
Metabolic control ....................................................................................................................................................................127
Statistics ...................................................................................................................................................................................... 130
Device settings .........................................................................................................................................................................137
Basal rate – Bolus ....................................................................................................................................................................137
Basal rates .................................................................................................................................................................................. 139
Insulin pump lists ....................................................................................................................................................................140
....................................................................................................................................................................91
7
Page 8

Accu-Chek Smart Pix diabetes management system Contents
5.5 CGM results ............................................................................................................................................................................... 141
Overview ......................................................................................................................................................................................142
Trend .............................................................................................................................................................................................144
Standard day ..............................................................................................................................................................................145
Standard week ..........................................................................................................................................................................154
Statistics ......................................................................................................................................................................................154
Metabolic control .....................................................................................................................................................................159
5.6 Logbooks..................................................................................................................................................................................... 160
Diary (record) ...........................................................................................................................................................................161
Contents of the diary ..............................................................................................................................................................162
Adjusting the diary view ........................................................................................................................................................163
Editing diary entries ................................................................................................................................................................165
Logbook .....................................................................................................................................................................................175
Daily statistics ..........................................................................................................................................................................177
5.7 Bibliography for reports......................................................................................................................................................... 179
HBGI / LBGI ..............................................................................................................................................................................179
Hypo risk ....................................................................................................................................................................................179
Blood glucose target range ................................................................................................................................................180
Variability ...................................................................................................................................................................................180
Guidance for clinical practice ............................................................................................................................................180
Ambulatory Glucose Profile ................................................................................................................................................181
8
Page 9

Accu-Chek Smart Pix diabetes management system Contents
6 Preparing the devices
6.1 Accu-Chek Active blood glucose meter......................................................................................................................... 187
6.2 Accu-Chek Aviva blood glucose meter
Accu-Chek Aviva Nano blood glucose meter .............................................................................................................. 189
6.3 Accu-Chek Aviva Combo blood glucose meter
Accu-Chek Aviva Expert blood glucose meter ............................................................................................................. 190
6.4 Accu-Chek Aviva Insight diabetes manager................................................................................................................. 191
6.5 Accu-Chek Compact blood glucose meter.................................................................................................................... 192
6.6 Accu-Chek Compact Plus blood glucose meter.......................................................................................................... 193
6.7 Accu-Chek Go blood glucose meter................................................................................................................................ 194
6.8 Accu-Chek Guide blood glucose meter.......................................................................................................................... 195
6.9 Accu-Chek Instant blood glucose meter
Accu-Chek Instant S blood glucose meter ....................................................................................................................196
6.10 Accu-Chek Mobile blood glucose meter........................................................................................................................ 197
6.11 Accu-Chek Performa blood glucose meter
Accu-Chek Performa Nano blood glucose meter .......................................................................................................199
6.12 Accu-Chek Performa Combo blood glucose meter.................................................................................................... 200
6.13 Accu-Chek Performa Insight diabetes manager ......................................................................................................... 201
6.14 Accu-Chek Insight insulin pump....................................................................................................................................... 202
6.15 Accu-Chek Spirit insulin pump .......................................................................................................................................... 203
6.16 Accu-Chek Spirit Combo insulin pump........................................................................................................................... 204
6.17 Note on time settings for the Accu-Chek insulin pumps......................................................................................... 205
6.18 Accu-Chek Insight CGM system........................................................................................................................................ 207
.............................................................................................................................................................183
7 Error signals and troubleshooting
7.1 Errors without error signals.................................................................................................................................................. 210
7.2 Error signals on the device................................................................................................................................................... 211
............................................................................................................................... 209
9
Page 10

Accu-Chek Smart Pix diabetes management system Contents
8 Appendix
8.1 Cleaning the device................................................................................................................................................................. 213
8.2 Disposal of the device............................................................................................................................................................ 213
8.3 Cleaning the USB flash drive............................................................................................................................................... 213
8.4 Disposal of the USB flash drive.......................................................................................................................................... 214
8.5 Using a USB flash drive......................................................................................................................................................... 214
8.6 Abbreviations............................................................................................................................................................................. 215
...............................................................................................................................................................................................213
9 Accu-Chek Smart Pix software Terms of Use
10 Customer support
........................................................................................................................................................................221
.................................................................................................217
10
Page 11

1 Overview of the system
Chapter 1, Overview of the system
The Accu-Chek Smart Pix system is used for the easy and
automatic analysis of blood glucose values, CGM results and
therapy data from various Accu-Chek meters and insulin
pumps. The analysis is provided on a computer in the form of
a report consisting of various configurable report elements.
The system is made up of the following components:
Accu-Chek Smart Pix software
The Accu-Chek Smart Pix software generates the reports
and also allows you to manage the records of several users
or patients. You obtain the software in one of the following
ways:
• With the Accu-Chek Smart Pix device (model 2). The
setup program is stored directly on the device.
• On a USB flash drive.
• Available as a downloadable file from the website
www.accu-chek.com
.
Accu-Chek Smart Pix device
The Accu-Chek Smart Pix device1 is connected to the
computer and communicates with the meters and insulin
pumps. If you obtained the software from a USB flash drive or
as a download, you can also use the Accu-Chek Smart Pix
device (model 1) to communicate via the infrared port, or use
a suitable USB cable (USB, type A to USB, micro B) to
communicate with USB devices.
1. The Accu-Chek Smart Pix device (model 2) and the download
version of the Accu-Chek Smart Pix software are not available
in all countries.
11
Page 12

Chapter 1, Overview of the system
Using the Accu-Chek Smart Pix software with the Accu-Chek
Smart Pix device (model 2)
• Connect the Accu-Chek Smart Pix device (model 2) to
the computer when you want to read data from a
meter or an insulin pump.
• Place the meter or the insulin pump with its infrared
or
port facing the Accu-Chek Smart Pix device,
:
• Connect the meter with a USB port to the Accu-Chek
Smart Pix device by means of a USB cable.
• Launch the Accu-Chek Smart Pix software.
• Prepare the device for transferring data (see
chapter 6).
• Click the
Read device
button.
12
Page 13

Chapter 1, Overview of the system
Using the Accu-Chek Smart Pix software (USB flash drive or
download)
• Connect the Accu-Chek Smart Pix device (model 1) to
the computer when you want to read data from a
meter or an insulin pump.
• Place the meter or the insulin pump with its infrared
or
port facing the Accu-Chek Smart Pix device,
:
• Connect a USB cable for transferring data first to the
meter with a USB port (USB, micro B) and then directly
connect the other end to a free USB port on your
computer (USB, type A).
• Launch the Accu-Chek Smart Pix software.
• Prepare the device for transferring data (see
chapter 6).
•Click the
Read device
button.
13
Page 14

Chapter 1, Overview of the system
The Accu-Chek Smart Pix software is a computer program
and component of the Accu-Chek Smart Pix system. It
contains the following functions:
• Create (and edit) reports.
• Archive reports with selected elements as a PDF file.
• Email reports with selected elements.
• Display and print archived reports.
• Manage and edit user or patient records.
• Importing device data as well as printing and saving
reports can be automated.
• The graphical report elements displayed have
interactive functions for customising the display.
• Install software updates for the Accu-Chek Smart Pix
system.
All reports are displayed and all functions are used from
within the Accu-Chek Smart Pix software.
14
Page 15

1.1 Overview of the device
2
3
1
4
Chapter 1, Overview of the system
The device is made up of the following components, which
are briefly described below.
1
Device1: This device enables connection to various
Accu-Chek meters and insulin pumps with infrared
or USB ports. At the same time, it contains all the files
required for installing the Accu-Chek Smart Pix
software.
2
USB plug for connecting to the computer.
3
Infrared window for communicating with similarly
equipped Accu-Chek meters and insulin pumps.
4
USB cable with USB micro B plug to connect directly
to similarly equipped Accu-Chek meters.
1. Note: This device is not available in all countries.
15
Page 16

Chapter 1, Overview of the system
5
6
1.2 Overview of the status indicator signals of the system
The Accu-Chek Smart Pix system indicates various operating
states with the status indicators on top of the device. If all
status indicators are off, the Accu-Chek Smart Pix device is
not connected to a computer or the computer is not switched
on. The following status indicators may be lit up:
5
6
Device name:
• Glows continuously when the device is connected to
a computer and the computer is switched on. The
device is ready for operation.
• Flashes when a setting or update file is being
received.
Luminous surface:
• Off: the device is ready for operation but not active.
• Pulsates slowly: the device is actively searching for a
meter.
• Glows continuously: the device is reading data,
analysing it or is transferring information (for
example, the time) to the meter.
• Flashes quickly: the device is displaying an error.
16
Software updates for the Accu-Chek Smart Pix system can
be installed via the computer. The device name flashes while
this type of update is being installed.
Page 17

1.3 Software overview
7 8 109 11
12
Chapter 1, Overview of the system
The Accu-Chek Smart Pix software consists of the following
elements:
7
Title bar of the program window, showing the
program name and the buttons for minimising,
maximising and closing the window.
8
Navigation panel for selecting the displayed report
element
9
Button bar containing the buttons for calling up
program functions.
10
Display pane for showing the reports and records.
11
Interactive time axis for displaying and selecting the
time range.
12
Statistics, display options and key (distributed over
three tabs)
The user interface needs a screen resolution of at least
1024 x 768 pixels. On larger screens, the window size can be
maximised in any way within the screen area.
Note about the illustrations in this User’s Manual
Bear in mind that all illustrations of screen content (screenshots) used in this User’s Manual only serve as examples in
terms of both their visual appearance and content. The
actual appearance depends on your individual system and
software settings. The content displayed depends on the
meter data or insulin pump data that was read.
17
Page 18
Chapter 1, Overview of the system
13 17 18161514
1.4 Buttons overview
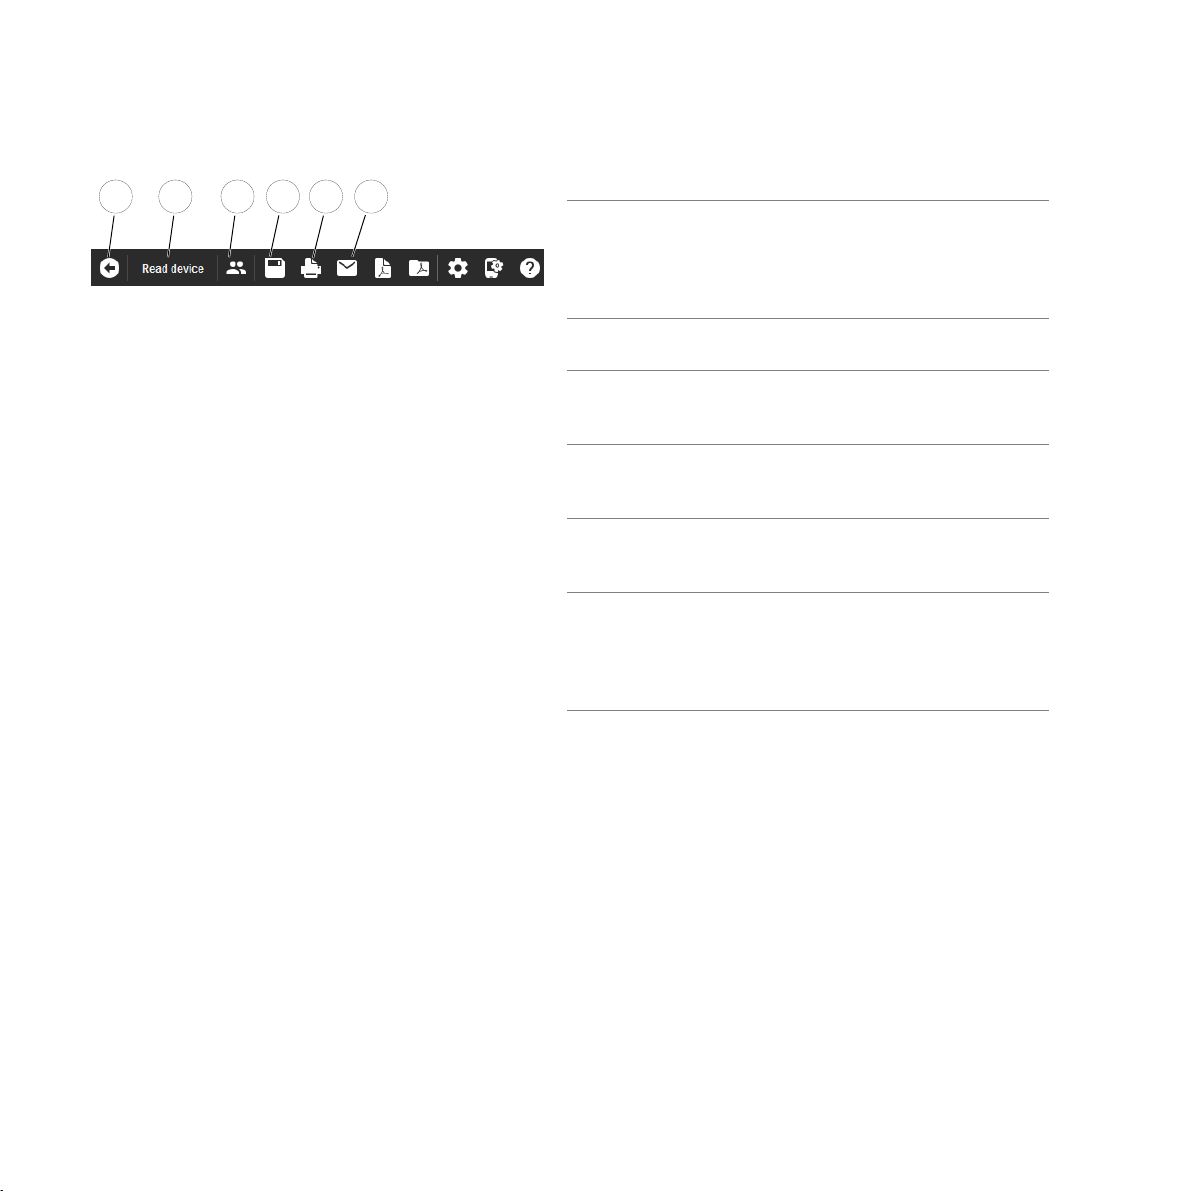
In the program window you will find the following buttons:
13
Back
button
Returns to the report element that was displayed last.
This button is only activated once you leave the
displayed start screen to display another report
element.
14
Read device
button
Activates the data transfer from an available device.
15
Open patient list
button
You can open an existing record from the patient list
or create a new record.
16
Save
button
You can save a record that was just displayed but has
not yet been assigned to a patient.
17
Print
button
Selected report elements are output to a printer of
your choice.
18
Email
button
The default email program on the computer is
launched and selected report elements (in PDF
format) as well as the associated record (if selected)
are automatically attached to an empty email.
18
Page 19
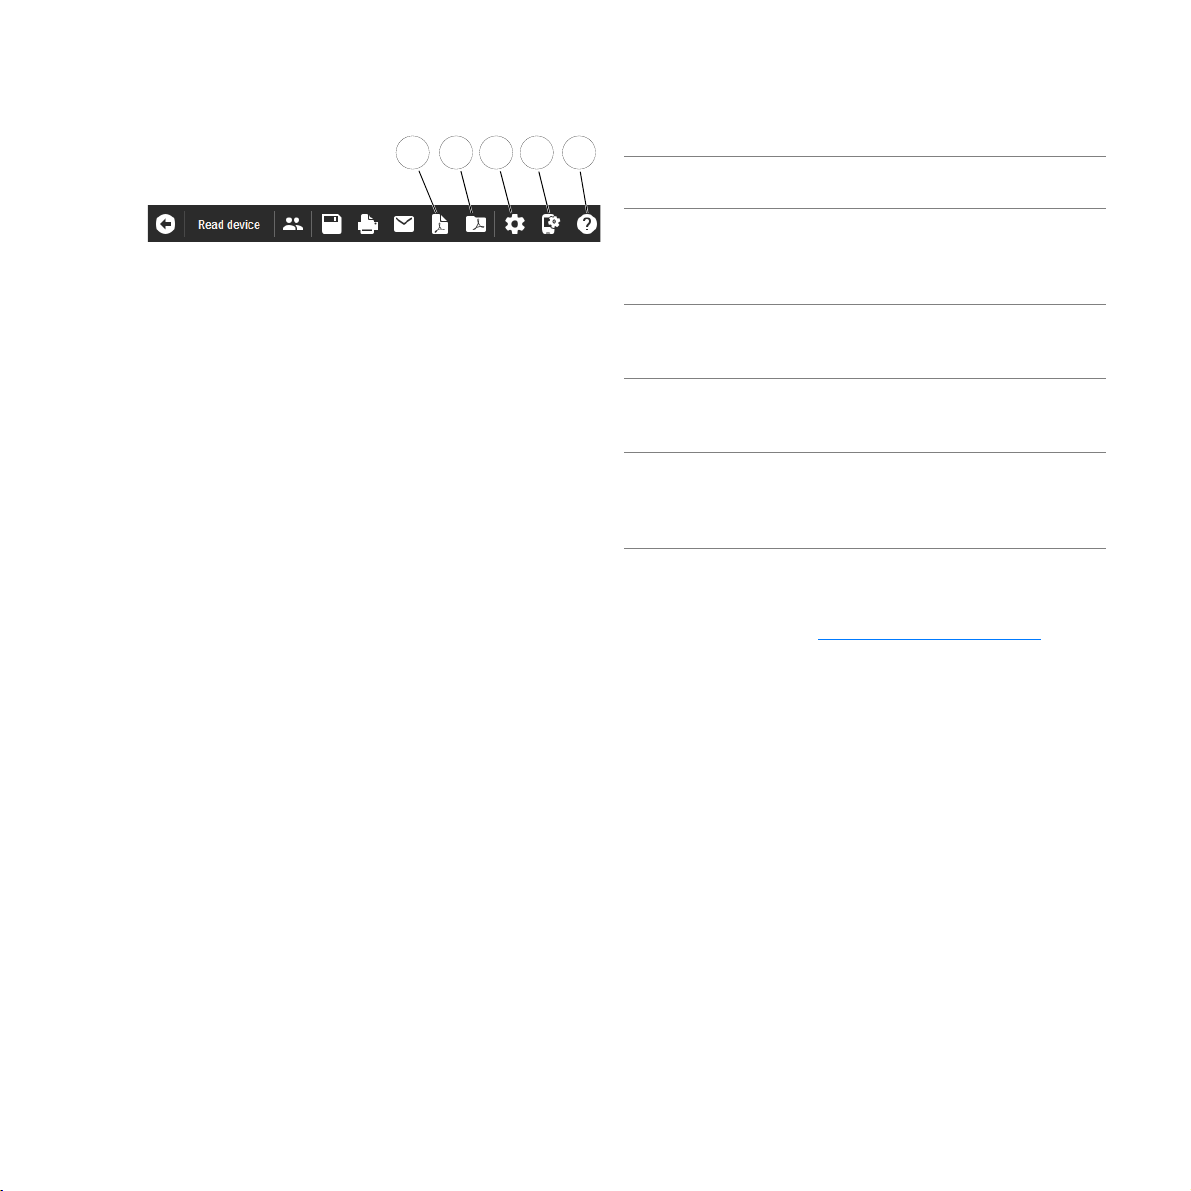
Chapter 1, Overview of the system
2322212019
19
Save as PDF report
button
Selected report elements are saved in a PDF file.
20
Open PDF report
button
Open reports previously saved as PDF files in order to
display or print them using the PDF reader installed
on the computer (for example, Adobe Reader).*
21
Software settings
button
Use this button to adjust the settings for the
Accu-Chek Smart Pix software.
22
Device settings
button
Access to special functions such as the configuration
of suitable devices
23
Help
button
This is where you can find menu options for direct
access to the User’s Manual and to the software
update, and for displaying the program version.
*If you do not yet have a program for displaying PDF files on
your computer, you can, for example, download Adobe Reader
from the Adobe website (http://get.adobe.com/reader/
) free of
charge.
You can configure the arrangement of functions and buttons
on the button bar according to your needs (see page 55).
19
Page 20
Chapter 1, Overview of the system
Email:
dia.smartpix@roche.com
1.5 Printed symbols
Symbol Description
This symbol identifies safety information that indicates a possible risk of damage to your health.
This symbol draws your attention to important information.
i
Manufacturer
Catalogue number
Batch code - year of manufacture
• The Accu-Chek Smart Pix software fulfils the requirements of the European Directive
93/42/EEC on medical devices.
• The USB flash drive fulfils the requirements of the European Directive 2014/30/EU on
electromagnetic compatibility.
This product fulfils the legal requirements of the People’s Republic of China on the use of certain
substances in electronic products.
The USB flash drive falls inside the scope of the European Directive 2012/19/EU (Directive on
waste electrical and electronic equipment, WEEE).
Some passages in this User’s Manual are highlighted by
symbols. Read these passages very carefully. There are more
symbols on the type plate of the device and/or on the
packaging.
20
Consult instructions for use. The User’s Manual for the Accu-Chek Smart Pix diabetes
management system can be opened by clicking on the
Help
button.
A printed version of the User’s Manual for the Accu-Chek Smart Pix diabetes management
system can be requested by email from
dia.smartpix@roche.com
.
Page 21

2 Before you start using the system
Chapter 2, Before you start using the system
You can use the Accu-Chek Smart Pix system (device and
software) on any computer which meets the necessary
system requirements. Any additional computer features
required are listed below.
The Accu-Chek Smart Pix software is supplied on the
Accu-Chek Smart Pix device and is installed directly from it.
In addition, Roche provides the Accu-Chek Smart Pix software on a USB flash drive or as a downloadable file. The
software can be used on a standalone computer as well as
on a network server.
Files generated (for example, records or archived reports) are
either saved locally or on a server where they are available
for shared access. Just as with all other data, you should
protect these files from inadvertent data loss by backing
them up regularly.
If you have obtained the Accu-Chek Smart Pix soft-
i
ware from a USB flash drive: The USB flash drive is
the original medium used to provide the software, but
it is not a removable medium for storing data you
have created yourself. Avoid potential data loss (for
example, from damage to or loss of the USB flash
drive) and always store all files locally on your
computer or on a network server.
21
Page 22

Chapter 2, Before you start using the system
2.1 What you require to use the system
You have... You also require...
Accu-Chek Smart Pix device (model 2)1 • A computer that meets the respective system require-
ments and a printer, if you wish to print reports.
Accu-Chek Smart Pix device (model 1) • A computer that meets the respective system
requirements and a printer, if you wish to print reports.
• The Accu-Chek Smart Pix software (USB flash drive or
download)
• A suitable USB cable (USB, micro B to USB, type A), if you
wish to read data from meters with a USB port.
Accu-Chek Smart Pix software
(USB flash drive or download)
1. Note: This device is not available in all countries.
22
• A computer that meets the respective system
requirements and a printer, if you wish to print reports.
• A suitable USB cable (USB, micro B to USB, type A), if you
wish to read data from meters with a USB port.
• An Accu-Chek Smart Pix device (model 1) if you wish to
read data from meters with an infrared port.
Page 23

Chapter 2, Before you start using the system
The following requirements must be met to be able to use
special functions:
• Adobe Reader or a similar program must be installed
to be able to display and print PDF files (PDF version
1.6/Acrobat 7 and higher).
• Internet access is required to be able to download
software updates, to send emails and to receive data
Accu-Chek Connect
via
online.
• A properly configured email program (Microsoft
Outlook, Windows Live Mail or Mozilla Thunderbird)
must be installed to be able to email reports.
23
Page 24

Chapter 2, Before you start using the system
2.2 Copying software to the computer
The Accu-Chek Smart Pix software can be used locally on
your computer or on a network server. To do this, copy the
entire program folder to a suitable location on the selected
hard disk. Depending on your needs, you have the following
options:
• If you are the only person who will be using the
program, copy the program folder locally to your
computer. You will also save the created files there.
• If you want to use the program in a network and the
same software settings are to apply for every
workstation, install the program folder on the network
server. You will also save the created files there. On
the server, the program can also be used by several
network users at the same time.
• If you want to use the program in a network, but allow
individual software settings for every workstation,
copy the program folder separately to every single
workstation. The created files, however, will be saved
on the server to enable shared access to all data
despite individual settings.
24
Depending on your needs, make the appropriate preparations for copying the software from the following three
options:
Page 25

Chapter 2, Before you start using the system
Connecting the device
To copy the software from the Accu-Chek Smart Pix device
(model 2): Insert the USB plug of the Accu-Chek Smart Pix
device into a free USB port on your computer. You can do this
while your computer is either on or off. This connection
provides the Accu-Chek Smart Pix device with power and it
therefore does not need a battery or a power pack.
After connecting the Accu-Chek Smart Pix device and turning
on the computer as necessary, the glowing Accu-Chek
Smart Pix logo appears and indicates operational readiness.
Simultaneously, the computer recognises the Accu-Chek
Smart Pix device as removable media (similar to a USB flash
drive).
Connecting the USB flash drive
To copy the software from the USB flash drive: Insert the USB
flash drive into the computer. The computer recognises it as
removable media.
Preparing the download version
To copy the software from the download folder: The software
is offered as a compressed data package (ZIP archive) for
download. After downloading the ZIP file (for example, to the
Downloads
extracting the files, the installation folder
Smart Pix Software
folder), extract this file by double-clicking it. After
Accu-Chek
is created in the selected location.
25
Page 26

Chapter 2, Before you start using the system
Copy the program to your computer as follows:
• If this has not been done automatically, open a
window on your computer which displays the contents
of the Accu-Chek Smart Pix device (as a disk), of the
USB flash drive or of the extracted installation folder.
You can do this from
Explorer.
• Double-click the setup program
the instructions on the screen.
• Select the location to which you wish to copy the
“Accu-Chek Smart Pix Software” program folder.
– If you are usually logged on as the administrator,
open the
applicable).
– If you are usually not logged on as the
administrator, select a location which you can
access even with limited access rights, for
example, the
– When installing the program on a network server,
ensure that all users have the necessary access
rights for the selected location.
Programs
My Computer
folder (or
Documents
or Windows
Setup.exe
Programs (x86)
folder.
and follow
, if
26
For security reasons, the Accu-Chek Smart Pix device
i
is furnished with write-protection. Therefore before you
can use it, the Accu-Chek Smart Pix software must be
copied to your computer and then run from there.
Page 27

Chapter 2, Before you start using the system
i
i
• Select the option to install the corresponding drivers if
you have obtained the software from a USB flash drive
or download and wish to read data from meters with a
USB port. This driver installation is not required for the
Accu-Chek Smart Pix device (model 2) because the
drivers are pre-installed on the device.
Administrator access rights are required for installing
the USB driver software.
• Upon completion of the installation, shortcuts are
automatically created in the Windows start menu and/
or on the desktop (depending on the options you
selected).
If you are using the application on several computers
in the network, make sure that the location for saving
the shared files is identical on every computer.
27
Page 28

Chapter 2, Before you start using the system
28
Page 29

3 Launching and configuring the software
3.1 Launching the software
To launch the Accu-Chek Smart Pix software, double-click
either the program file
an existing shortcut (see chapter 2.2).
The program launches with a program window which is still
empty.
• If you only wish to use the program to edit a record
already saved or to display saved reports it is not
necessary to connect the Accu-Chek Smart Pix
device.
• If you wish to use the program to read new data,
connect the Accu-Chek Smart Pix device or a suitable
meter (for example, the Accu-Chek Mobile blood
glucose meter directly via USB) now.
If a suitable device is already connected, you can use the
Read device
Chapter 3, Launching and configuring the software
Accu-Chek Smart Pix Software.exe
button to read the data directly from the device.
or
29
Page 30
Chapter 3, Launching and configuring the software
3.2 Configuring the software
You can customise several areas of the Accu-Chek Smart Pix
software to tailor it to your needs. These settings are
independent of those which may have been applied to the
Accu-Chek Smart Pix device (model 1).
Click the
Software settings
button to open the
corresponding dialogue box. Depending on the actual
situation, you will find selected setup areas in this dialogue
box. This can be seen from the tabs below the top edge of the
window:
• If no record is currently open, you will find the setup
General settings
areas
• If a record is open, you will find the setup area
settings
and a setup area whose name corresponds to
and
Settings for new patients
.
General
the open record, instead.
For all the settings described on the following pages, the
following applies:
OK
• Click the
button to save the modified settings and
close the dialogue box, or:
• Click the
Cancel
button to discard the modified
settings and close the dialogue box without saving the
changes.
30
Page 31

Chapter 3, Launching and configuring the software
General settings
In the
General settings
area you will find configuration
options for the user interface.
•
Language:
Here you can select the language to be
used for the user interface and the reports. If the
Accu-Chek Smart Pix software supports the language
set in the system, the language will be set
automatically.
•
Time format:
Specify the date format, time format and
non-work days for displaying in reports and dialogue
boxes.
•
Personal settings:
Input fields for personalising
printouts or saved files.
•
Display options:
Set the desired options for displaying
reports.
•
Automatic features:
Here you can set automatic
program functions supporting the use of the system in
a healthcare professional’s practice or another
medical institution. You can configure device data to
be automatically read, saved or printed. Updates for
the Accu-Chek Smart Pix system can also be
downloaded automatically from the Internet.
•
Save options:
Here you can select the location for
saving records, as well as naming conventions and the
location for saving PDF reports.
31
Page 32

Chapter 3, Launching and configuring the software
Selecting a language
• Click the currently set language to open the selection
list.
• Click the language you want to select.
32
Page 33

Chapter 3, Launching and configuring the software
Time and date format
• Select the time and date format to be used, for
example, in the calendar or for displaying the point
in time when the data was last read.
• Select the non-work days. These will then be
highlighted in the reports.
Display options (graphical representation and logbook format)
• Select the desired view for blood glucose, carbo-
hydrates and basal rates, either
Graphs one below the other
the report elements
.
week
Trend, Standard day
Combined graph
. This selection applies for
• Select the view for the logbook, either
24 hour allocation
.
and
meal-related
or
Standard
or
33
Page 34

Chapter 3, Launching and configuring the software
Personal settings
• Enter up to three rows of personal data (for example,
name and address of the medical institution). This text
will then appear on all saved or printed reports. The
number of characters per row must not exceed 50.
34
Page 35

Chapter 3, Launching and configuring the software
Automatic features
Automatic features help you simplify the following tasks:
• Automatically import device data and (if applicable)
add it to an existing record.
• Automatically print device data.
• Automatically save device data.
• Automatically download and install software updates.
The term “record” encompasses all the data read from
devices (with manual additions, if applicable) and assigned
to a certain person. Data read from the device will always be
saved (either to a new or an existing record) unless you
No
select
in the corresponding confirmation question when
importing data from the device. If, in such a case, you do not
manually save the imported data later, it will only be
displayed temporarily and will be deleted with the next
import.
When importing data from a device for the first time, a new
record can be created or the device can be assigned to an
existing record. The data from further imports from the same
device(s) is added to the existing data of that person.
35
Page 36

Chapter 3, Launching and configuring the software
If you have enabled one or more of the automatic features
(except
Automatic update
), the program will no longer close
when you close the program window. You will be notified
when the program launches as well as when the program
window closes that the program will continue running in the
background to continue providing the automatic features.
To completely close the program or to restore it to the
foreground, right-click the Accu-Chek Smart Pix icon in the
information area (right-hand side of the Windows taskbar)
Open
or
Quit
and select
.
36
Page 37

Chapter 3, Launching and configuring the software
Automatic import
This feature ensures that data available in the Accu-Chek
Smart Pix system is adopted directly and saved as a record.
•Click the
• In the following dialogue box, click the
automatic import
•Click the
Automatic import
The
check mark indicating that the corresponding feature
has been activated. Features that have not been activated are
displayed with a on their button.
The records will be saved in the folder you selected in
i
Save options
Settings
OK
button next to
checkbox. A check mark will appear.
button to save the entries.
button will now be displayed with a
(see page 42).
Automatic import
Activate
.
37
Page 38

Chapter 3, Launching and configuring the software
Automatic print
To use this feature, you need to select a printer available on
the computer, as well as the reports to be printed.
• Click the
Settings
• In the following dialogue box, click the
automatic print
• Select the desired printer and the paper
Portrait, Landscape
(
button next to
Automatic print
.
Activate
checkbox. A check mark will appear.
or
Automatic
Orientation
).
• Select the report elements you wish to print. Click
once to select a report element (it will be highlighted
in blue); click the same report element again to undo
your selection.
• Click the
Blood glucose
and
CGM
tabs in succession
to separately select the report elements to be printed
for each of these areas.
• Click the
Automatic print
The
OK
button to save the entries.
button will now be displayed with a
check mark indicating that the corresponding feature
has been activated. Features that have not been activated are
displayed with a on their button.
38
Page 39

Chapter 3, Launching and configuring the software
Automatic save
This feature automatically saves reports as PDF files and is
independent of the save feature for records, which is
activated using automatic import.
•Click the
• In the dialogue box that follows, click the
automatic saving of PDF reports
mark will appear.
• Select the desired
• Select the report elements you want to save as a PDF
file. Click once to select a report element (it will be
highlighted in blue); click the same report element
again to undo your selection.
•Click the
to separately select the report elements to be saved
for each of these areas.
•Click the
Automatic save
The
check mark indicating that the corresponding feature
has been activated. Features that have not been activated are
displayed with a on their button.
The PDF files will be saved in the folder with the file
i
name you selected under
Settings
Blood glucose
OK
button next to
Orientation
and
button to save the entries.
button will now be displayed with a
Automatic save
checkbox. A check
of the pages.
CGM
tabs in succession
Save options
.
Activate
(see page 42).
39
Page 40

Chapter 3, Launching and configuring the software
Automatic update
When this function is activated, the Accu-Chek Smart Pix
software automatically checks whether updates are available
for the Accu-Chek Smart Pix system (software, device, User’s
Manual) every time the program launches. Newer versions
are automatically downloaded and installed.
• Click the
• In the dialogue box that follows, click the
automatic update
appear.
• Click the
Automatic update
The
check mark indicating that the corresponding feature
has been activated. Features that have not been activated are
displayed with a on their button.
Records and software settings are retained when an
i
update takes place.
Settings
OK
button next to
checkbox. A check mark will
button to save the entries.
button will now be displayed with a
Automatic update
Activate
.
40
Page 41

Chapter 3, Launching and configuring the software
As soon as a new version is available on the update server, the
respective components are updated as described below:
• The Accu-Chek Smart Pix software is updated the
next time the program launches (after requesting
confirmation).
• A connected Accu-Chek Smart Pix device is updated
the next time the program launches (after requesting
confirmation).
• Newer versions of the User’s Manual in the currently
set language are saved in the program folder in the
_Manuals
button and the
folder and can be called up using the
Help
menu option.
41
Page 42

Chapter 3, Launching and configuring the software
Save options
Here you select the folders where the newly created records
and archived reports will be saved. The automatic features
(described as of page 35) also use these folders for saving
data.
• Select the location you want to use for saving the
records.
• Select the location you want to use for saving the
archived reports (PDF files).
If you have installed the program on several individual
i
computers in a network, ensure that the settings
configured here are identical for all computers. This is
necessary to enable shared access to all records and
archived reports.
42
Page 43

Chapter 3, Launching and configuring the software
In addition, you can configure the naming conventions here
that will be used for future reports that are archived (as PDF
files). You can combine several components in this file name
to help you identify and sort the files later.
File name of PDF reports
The
dialogue box displays two
columns with possible components for the file name. The left
column contains the components not currently used; the
right column contains the components currently in use. The
row below these columns shows a preview of the resulting
name. You can change the composition of the name as
follows:
• From the left column, select a component you want to
Add
use, and click
. The component will move to the right
column.
• From the right column, select a component you no
longer want to use, and click
Remove
. The component
will move to the left column.
• From the right column, select a component you want to
move to another position within the name. Click the
Down
or
buttons to move this component up or down
Up
in the list.
•Click the
OK
button to save the entries.
43
Page 44

Chapter 3, Launching and configuring the software
Settings for new patients
In the
Settings for new patients
window you will find
configuration options for displaying reports. These settings
are always used when you create a new record.
•
Time intervals:
This setting defines the time intervals used
to summarise test results in the long-term view of the
Status
report element.
•
Time range:
The
Time range
setting defines the
number of days or weeks whose test results will be
displayed and analysed in the reports together.
•
Time blocks:
In some report elements, test results are
assigned to defined time blocks. These time blocks
divide the day into eight (or four) periods typical for
the patient, referring to meal or sleep times.
•
BG tests:
A statistical analysis of Hypo risk, Variability
and Mean blood glucose can only be displayed if a
minimum number of test results per day exists. Select
the minimum number of results from which to start
displaying such statements in the
Status
element.
report
44
Page 45

Chapter 3, Launching and configuring the software
•
Maximum basal rate:
You can customise the graphical
display of basal rates to high, medium and low
average rates.
•
Carbohydrate unit:
unit
•
BG unit:
to be used for input and display.
Select the
Select the desired
BG unit
(mg/dL or mmol/L) to use
Carbohydrate
for setting the limits for blood glucose.
•
BG and CGM status:
BG status
the
The statements and statistics in
or
CGM status
area of the
Overview
element display the deviation of the test results from the
target values. Here you can define these target values
that will also be used in other report elements.
• Set the calculation and display parameters.
Mean blood glucose
meters for blood glucose values;
CGM median
and
and
CGM variability
Variability
Hypo duration
serve as para-
for CGM results.
The related settings are made on the separate tabs or
on the combined
BG & CGM – target range
report
Hypo risk
,
tab.
,
45
Page 46

Chapter 3, Launching and configuring the software
Time intervals
With the
Time intervals
setting, you define the time intervals
used to summarise test results in the long-term view of the
Status
report element. You can choose between:
•
Upload intervals
(reading out device data using the
Accu-Chek Smart Pix software, for example, as part of
regular visits to the doctor).
•Quarterly intervals
•Monthly intervals
• Weekly intervals
46
Page 47

Time setup
Chapter 3, Launching and configuring the software
Select the default
Time range
you want a report to analyse
and display. You can change this setting at any time in
reports as they are being displayed to examine them in more
detail or with respect to more long-term developments. All
displayed charts, values and statistics refer to the selected
time range.
By setting
Time blocks
, you divide a 24-hour day into eight
blocks which are determined by important regular events (for
example, main meals). For each time block, you can specify
the start time while the end time is automatically the start
time of the next time block.
The time blocks set here are used in reports to structure
them visually and chronologically.
•Click the
change...
button to open the dialogue box for
setting the time blocks.
• You can set the time in hours and then minutes using
the arrow buttons, or enter the time directly as a
number.
•Click the
In some report elements (for example
Distribution
OK
button to save the settings.
Standard day
and
), these eight small time blocks are summarised
as four large time blocks (before-meal block plus after-meal
block). These large blocks are designated as
Lunch, Dinner
and
Night
.
Breakfast
,
47
Page 48

Chapter 3, Launching and configuring the software
BG tests
To gain meaningful results from statistical analyses, tests
need to be conducted with a certain regularity (distributed
over the course of the day) and recurrence. Select the
minimum number of tests necessary to display a statistical
analysis. If the actual number of tests is below this value, the
Status
report will not display any information on the
,
Variability
risk
there are fewer than 28 test results for the selected time
range or if the test results are not distributed evenly enough
over the course of the day.
Examples:
• 2 tests performed per day, time range 1 week: no
• 2 tests performed per day, time range 2 weeks, 14
• 2 tests performed per day, time range 2 weeks, 20 out
and
Mean blood glucose
analysis possible as there are fewer than 28 test
results in total.
tests were performed in the mornings and 14 in the
afternoons: analysis possible as there are sufficient
test results which are distributed evenly throughout
the day.
of 28 tests were carried out in the mornings: no
analysis possible as the test results are not distributed
evenly throughout the day.
. This also applies if
Hypo
48
Click the button to display additional information.
i
Page 49

Chapter 3, Launching and configuring the software
Maximum basal rate
As the sizes of the individual basal rates can vary, it is
possible to adjust the scale of the insulin dose in the basal
rate chart to the desired range of values.
Carbohydrate unit
Select the carbohydrate unit to be used for displaying the
corresponding amounts in various report elements.
49
Page 50

Chapter 3, Launching and configuring the software
BG unit
Select the
BG unit
(mg/dL or mmol/L) to use for setting the
limits for blood glucose.
BG and CGM status
The statements in the
BG status
or
CGM status
report
element relate to the target values of the following
parameters:
•BG – hypo risk
• BG – variability
• BG & CGM – target range
• CGM – CGM variability
• CGM – hypo duration
50
Each of these parameters is examined and then the analysis
of the results is displayed graphically in three colours. The
colours have the following meaning:
Green
•
means that the values fall within the target
range.
•
Yellow
means that the values fall outside the target
range.
•
Red
means that the values fall significantly outside
the target range.
Page 51

Chapter 3, Launching and configuring the software
Here you enter the limits by means of which the three above
mentioned parameters are to be analysed. This is displayed
by means of coloured dots next to the respective input and
display fields. Where applicable, the entire available setup
area is also displayed (for example, 0 … 400 mg/dL if the
information is in mg/dL).
• The LBGI is used to calculate the
Hypo risk
. This value
represents the recurrence and the resulting risk of
blood glucose values being too low (see bibliography
on page 179). Values should be as low as possible.
The limits are specified.
• In addition, the number of incidences of low blood
glucose per week can be defined as an indicator of
a high hypo risk.
• If you are using CGM data, you can configure the
thresholds in the corresponding
CGM - hypo duration
area.
51
Page 52

Chapter 3, Launching and configuring the software
•The
Variability
is calculated from the standard
deviation (SD) or variance of the analysed results. The
thresholds for the
Variability
can be defined as either
relative SD (based on the mean blood glucose) or as
absolute SD.
• If you are using CGM data, you can configure the
thresholds in the corresponding
CGM variability
area.
52
Page 53

Chapter 3, Launching and configuring the software
•The
•The
•The
BG & CGM – target range
glucose results and CGM results. For blood glucose
results, the arithmetic mean of all test results (mean
blood glucose) is considered. For CGM results, the
central value of all CGM results (CGM median) is
considered. Setting these thresholds determines
which values fall within the target range (green),
above or below the target range (yellow), below the
hypo limit and above the limit for the upper red range
(red) when displaying the status. These values are
also used to display the target range and the hypo
limit in the glucose reports.
Hypo limit
The
blood glucose (hypoglycaemia) if the limit has been
properly selected. We therefore strongly recommend
that you talk to your healthcare professional before
you change the limit. This function is not a substitute
for hypoglycaemia training by your healthcare
professional.
CGM variability
range (IQR). The IQR corresponds to the middle width
of the range between the 25th and 75th percentile,
within which 50 % of all values lie.
CGM - hypo duration
proportion of CGM results which lie below the hypo
limit.
can only be a reliable indicator of low
is calculated from the interquartile
refers to both blood
is calculated from the
i
Click the
CGM status
Reset settings
button to restore the
area to the default settings.
BG and
53
Page 54

Chapter 3, Launching and configuring the software
Customised settings for the patient record currently displayed
This window, whose name depends on the currently opened
record, contains setup options for customising the report.
The setup options are identical to the
patients
.
Settings for new
Use the setup area if you want to change the settings for the
patient record that is currently displayed. The changes made
only
here are
applied to the currently opened record and
saved with it.
54
Page 55

Chapter 3, Launching and configuring the software
Adjusting menu and button bar
You can customise the button bar at the top of the program
window according to your needs. Use this function, for
example, to move rarely used buttons to the
Device settings
menu or move frequently used special functions to the
button bar.
•Click the
• Select the
Device settings
Adjust...
button.
option to open the dialogue box for
configuring the button bar.
• Select an entry which you either rarely or never need
in the left column
pointing right to move this entry to the
menu.
settings
Button bar
, then click on the arrow
Device
• Select an entry you want to place in the button bar in
the right column
arrow pointing left to move this entry to the
column.
bar
Device settings
, then click on the
Button
55
Page 56

Chapter 3, Launching and configuring the software
To move an entry up or down in the list:
• Select the entry you want to move in the column, then
click the up or down arrow to move this entry
to the desired position.
Save
• Click
to apply the new settings.
56
Page 57

4 Using the software
Chapter 4, Using the software
The Accu-Chek Smart Pix software provides you with the
following options:
• Display reports with graphical, tabular and statistical
elements.
• Maximise graphical report elements depending on the
available screen area and examine them in detail.
• Interactively toggle individual elements in the charts
and/or adjust them.
• Archive reports with selected elements as a PDF file.
• Print selected elements of a report.
• Email reports with selected elements.
• Display data read from a device as a record in the
Accu-Chek Smart Pix software, to edit and save it.
• Create records for multiple patients or users and
assign the devices in use.
• Read, send or save records and automate reports.
• Display archived (saved) reports in a PDF reader and
print them.
• Perform software updates.
57
Page 58

Chapter 4, Using the software
4.1 Reading data manually
If you configured the Accu-Chek Smart Pix software so that
no automatic features
will run, you need to trigger the
reading of data manually.
• Prepare the device (meter, diabetes manager or
insulin pump) for transferring data. See chapter 6 or
the User’s Manual of the corresponding device for
detailed information about this preparation.
• Click the
Read device
button.
If data is imported from a device for the
•The
Assign device
button allows you to add the data to
first time
an existing record.
•The
New patient
button allows you to create a new
record and assign the device to it.
•Using the
No, display only
button, you can view the
report on the spot and decide later if you would like to
save, assign or discard the data.
:
58
Page 59

Chapter 4, Using the software
If data has already been imported from the device and
assigned to a record:
Yes
•The
to be added to the existing and pre-selected record.
•The
device to another existing record.
• Using the
report on the spot and decide later if you would like to
save, assign or discard the data.
When reading the data, the time set in the device is
i
compared to the time set in the computer. You will be
notified if these times do not match. You can adjust the
time set in the device directly from the Accu-Chek
Smart Pix software if your device supports this function.
For the data to be analysed correctly (for example,
based on certain weekdays or time blocks), the date
and time settings must be correct.
button allows you to confirm that the data is
Other patient
button allows you to assign the
No, display only
button, you can view the
59
Page 60

Chapter 4, Using the software
i
The data is now imported from the Accu-Chek Smart Pix
device and prepared for a report according to the defaults.
If you had not decided at the time of import where to save or
assign the data, you can do so now. To save the displayed
Save
record permanently, click the
dialogue box will be displayed next depends on whether the
respective device has already been assigned to a patient or
record. For information about creating and managing
records, see page 63 onwards.
Note that unsaved data is only available until you close
the program or the record, or import new data.
button. Which
60
Page 61

Chapter 4, Using the software
If patients are using more than one meter (for example, one
at the workplace and one at home) and you want to read the
data from all the devices for the same report, repeat the steps
described beforehand for each device.
A joint analysis of several devices can only be
i
performed if the imported data is saved. Reports that
are not saved can only represent the data from one
device.
To be able to analyse the combined data from several
i
devices properly, all meters used must have the same
date and time settings. Only then will the reports
provide correct information for recommending a
potential course of treatment.
61
Page 62

Chapter 4, Using the software
4.2 Reading data automatically
If you configured the Accu-Chek Smart Pix software so that
Automatic import
an
will be performed, it is not necessary for
the program to run in the foreground. You can minimise or
close the program window. As soon as the program running
in the background recognises that new data has been
transferred to the Accu-Chek Smart Pix device, you will be
notified and guided through further steps.
As soon as new data is recognised, the following options can
be taken as subsequent steps (as with reading data
manually):
• If you have not yet created a personalised record for
the currently imported data, you can create a new
record for it and assign the device to it.
• If you have already created a personalised record but
not yet assigned the device to it, you can assign it now.
• If you have already created the record and assigned
the device to it, you will only need to confirm that the
data is to be added to the record.
• You also have the option to view the data temporarily
without saving it to a record.
62
Page 63

4.3 Managing records
Chapter 4, Using the software
Creating a new patient record
You can create a new record at any time (irrespective of
existing data), even during an import.
To create a new record:
• If there is no import running, click the
Open patient list
button.
•In the
Patient list
window, click
New patient…
Or:
• When the import dialogue box is displayed, click the
New patient
Edit patient records
In the
button.
dialogue box displaying now, you
need to enter at least the patient’s name. Further identification
information such as first name, date of birth or an existing
patient ID are also possible and/or necessary if several
patients with the same name exist.
You can also add the following additional information to the
patient record as extra search or sort criteria:
• Diabetes type
• Diabetes therapy
• Email address (also for accessing records via
Accu-Chek Connect
online)
63
Page 64

Chapter 4, Using the software
To create the new record:
• Enter the name and any further information you
require. You can use any of the information entered
here to search for the record at a later stage.
OK
• Click the
button to create the record and close the
dialogue box, or:
• Click the
Cancel
button to discard the entries you
made and close the dialogue box without saving the
changes.
If you created the new patient record during an import, the
imported information (meter and data) is automatically
assigned to this new record. From now on, when performing
an automatic import, the connection to the meter will only
need to be confirmed. The data is saved to the selected
record.
64
Page 65

Chapter 4, Using the software
Assigning an existing record
If you have imported data that is to be assigned to a person
with an already existing record (for example, for a new
meter), proceed as described here:
• Click the button.
•Click the
Assign device
button in the dialogue box
displayed.
• Make sure you have the correct record selected.
•Click the
Assign
button.
The device has now been assigned to this record. For future
imports, this connection will only need to be confirmed. The
data is saved to the selected record.
Confirming the device assignment
If the assignment has already been completed, it will be
displayed when saving future imports.
Yes
•Click the
button to add the data to the record
displayed.
The data is saved to the selected record.
•Click the
•Click the
Other patient
Cancel
button to re-assign the device.
button to close the dialogue box
without saving the data.
65
Page 66

Chapter 4, Using the software
Importing records
To add a DIA file which was received by email or restored
from a data backup to your patient list:
• Click the
window.
• In the dialogue box that follows (if there is more than
one file), select the desired DIA file and click
Now the same dialogue box will be displayed as the one
displayed when reading data from an unknown meter. You
can now assign the contents of the file for import to a new or
an existing record.
When importing a DIA file to an existing record, just as
i
when reading meter data, duplicate entries (i.e., entries
that have been read previously) are kept and only new
entries are added.
Import record…
button in the
Patient list
Open
.
66
Page 67

4.4 Further report and record management features
Chapter 4, Using the software
Opening a record
You can open saved records at any time. An opened record
gives you access to all its reports and a tabular
Diary
representation of its data (
).
•Click the
Open patient list
button.
• Click the record you want to select.
•Click the
Select
button.
To quickly find a certain record, you can also enter known
parts of the patient ID into the search window at the bottom
left. Only records matching these entries will be displayed.
67
Page 68

Chapter 4, Using the software
i
Closing the record and report
To close an open record (and/or the currently displayed
report):
Click the icon next to the record ID or meter information.
Note that unsaved data is only available until you close
the program or the record, or import new data.
68
Page 69

Chapter 4, Using the software
Editing patient records
You can edit the master data of a patient record at a later
time.
•Click the
Open patient list
button.
• Click the record you want to select.
•In the
Patient list
window, click
Edit patient records…
• Make the desired changes.
•Click the
OK
button to save the changes and close the
dialogue box, or:
•Click the
Cancel
button to discard the entries you
made and close the dialogue box without saving the
changes.
You cannot use this feature to edit the test results contained
in this record and their associated information. For more
information about editing this information, see page 161
onwards.
69
Page 70

Chapter 4, Using the software
i
Deleting a record
You can delete a record at any time.
The selected record will be deleted upon
confirmation. Be sure that you no longer need the
selected record. Regular data backups also help to
avoid inadvertent data loss.
• Click the
• Click the record you want to select.
•In the
The selected record has now been deleted.
Archiving a record
You can archive records (*.DIA) by copying the complete
Diaries
folder containing the saved records during your
regular data backups.
See page 66 for information about reading a record archived
in this way.
Open patient list
Patient list
window, click
button.
Delete patient
.
70
Page 71

Chapter 4, Using the software
Activating the interface to Accu-Chek Connect online
Patients who collect their data using Accu-Chek Connect
online, for example, using the
Accu-Chek Connect app
or by
uploading the device data, can make the data directly
available for analysis by the Accu-Chek Smart Pix software.
In order to use this function, you need a user account for
Accu-Chek Connect online. If you do not have such an
account, you can create one as follows:
• Open the following Internet address in a browser:
www.accu-chekconnect.com//ui/guest/registration/
register.jsf
• If necessary, select the corresponding country and
language.
• Follow the instructions on the screen to register.
Once the registration is complete, you have a user account
with a
User name
and
Password
.
71
Page 72

Chapter 4, Using the software
• Click the
Patient list
• In the dialogue box that follows, click the
data
Accu-Chek Connect online
window.
… button to enter your
button in the
User name
Edit login
and
Password
• Select the checkbox to activate the automatic data
import via this interface.
You can now invite all users in the patient list to enable their
data for analysis. The data of all the patients who confirmed
this invitation is also available in the Accu-Chek Smart Pix
software through automatic synchronisation with Accu-Chek
Connect online.
The import status of a patient record via the Accu-Chek
Connect interface can be seen by a corresponding icon in
the list.
• Inactive (or not yet invited). Click this icon to
send an invitation to the email address saved in the
record. The icon then changes its appearance to:
• Invited but not yet enabled. Once the patient has
accepted the invitation and has enabled data in
Accu-Chek Connect online, the icon changes its
appearance to:
• Active (invited and enabled)
.
72
Page 73

Chapter 4, Using the software
Adjusting the patient list display
You can toggle the contents displayed in the patient list as
you wish and you can also rename the column headings and
change the column order.
• Right-click any column heading.
• From the context menu, select the contents you want
to display in the patient list (with a check mark).
Remove the check mark for contents you want to hide.
ID1 (Last name) will always be displayed and cannot
be hidden.
• From the context menu, select
Edit patient IDs
want to change the column heading (for example,
,
name
First name
).
if you
Last
• If you categorically do not wish to use a particular
individual ID, deselect the checkbox to the left. The
respective ID will be hidden from the patient list and
Patient
the
dialogue box. ID1 (Last name) will always
be displayed and cannot be disabled.
73
Page 74

Chapter 4, Using the software
• Click a column heading and drag it to any position to
change the display sequence of the columns.
• Click any column heading to sort the table by this
column.
• Click the column heading according to which the
patient list is to be sorted. Click the button next to
the selected column heading to toggle the sorting order
(ascending or descending). You can, for example, sort
according to the date when data was last read from the
device and then all records changed on the current
date can be found at the beginning (or end) of the list.
If there are several records with the same information
i
(for example, the current date) for the selected
sorting basis (for example, date when data was last
read from the device), the resulting group will be
sorted by last name too.
74
Page 75

4.5 Exporting reports as PDF files
Chapter 4, Using the software
When you have read device data or opened a record, you can
save the displayed report as a PDF file.
• Click the button.
• Select the
Save current view
option if you want to save
only the report element currently displayed as a PDF
file.
• Select the
Save...
option if you want to save multiple
report elements as a PDF file. The selection window
appears.
75
Page 76

Chapter 4, Using the software
• Enter the desired file name in the corresponding input
field. You can also keep the default file name (see
Save options
in chapter 3). The file will be given the
name entered here along with the suffix “.pdf”.
• From the displayed reports (displayed on two tabs)
and report elements, select the ones you want to save
in the file. Selected report elements are highlighted in
blue.
– To select an individual report element, click the
corresponding report icon. To select all the report
elements, click the
Select all
button.
– To deselect a highlighted report element, click the
report icon again. To deselect all highlighted report
elements, click the
Deselect all
button.
• When you have selected all the desired report
elements, click the
Save
button.
The PDF file is created and saved to the folder selected in
General settings
Cancel
button instead.
. If you decide not to save the file, click the
76
Page 77

4.6 Printing reports
Chapter 4, Using the software
When you have read device data or opened a record, you can
print the displayed report with the Accu-Chek Smart Pix
software’s print feature.
• If you are printing a currently
displayed report
(regardless of whether it is new or created from a
currently opened record), you will be given the
selection options described below.
• If you have opened an
archived report
PDF file (see page 82), it is displayed and printed
using the respective functions of the PDF program
installed on your computer. This is not part of the
Accu-Chek Smart Pix software.
saved as a
77
Page 78

Chapter 4, Using the software
To print a report:
• Click the button.
• Select the
Print current view
option if you want to print
only the report element currently displayed.
• Select the
Print...
option if you want to print multiple
report elements. The selection window appears.
• Click the printer you wish to use for printing the report
elements.
• From the displayed reports (displayed on two tabs)
and report elements, select the ones you wish to print.
Selected report elements are highlighted in blue.
– To select an individual report element, click the
corresponding report icon. To select all the report
elements, click the
Select all
button.
– To deselect a highlighted report element, click the
report icon again. To deselect all highlighted report
elements, click the
Deselect all
button.
• When you have selected all the desired report
elements, click the
OK
button.
78
The selected report elements are now output to the selected
Cancel
printer. If you decide not to print the file, click the
button instead.
Page 79

4.7 Emailing reports
Chapter 4, Using the software
When you have read device data or opened a record, you can
directly email the displayed report.
A suitable email program must be installed and
i
configured on your computer to be able to use this
function.
This feature will automatically create a PDF file of the
selected report elements, open your email program and
create a new email with the PDF file as an attachment. In
addition, you can attach the record (*.DIA) used as the basis
for this report. See page 66 for information about reading
such a record received by email.
Independently of this, you can send reports previously
exported as PDF files as email attachments (you do not need
the Accu-Chek Smart Pix software for this).
79
Page 80

Chapter 4, Using the software
To email a report:
• Click the button.
• Select the
Send current view
option if you want to send
only the report element currently displayed.
• Select the
Email...
option if you want to send multiple
report elements. The selection window appears.
• Select the corresponding checkbox if you want to
send the complete record (*.DIA) as well.
• From the displayed reports (displayed on two tabs)
and report elements, select the ones you wish to send.
Selected report elements are highlighted in blue.
– To select an individual report element, click the
corresponding report icon. To select all the report
elements, click the
Select all
button.
– To deselect a highlighted report element, click the
report icon again. To deselect all highlighted report
elements, click the
Deselect all
button.
• When you have selected all the desired report
elements, click the
OK
button.
80
Page 81

Chapter 4, Using the software
The selected report elements are now saved to a temporary
PDF file (which will be deleted after the email is sent). If you
Cancel
decide not to send the report elements, click the
button instead.
Your computer’s default email program is then launched and
an empty email is opened. The email subject line is already
filled in (but you can change the text if necessary). The PDF
file just created and the record (if selected) are enclosed as
an attachment.
• Enter the email address of the recipient.
• Write a text referring to the report attached.
• Send the email.
81
Page 82

Chapter 4, Using the software
4.8 Displaying archived reports (PDF files)
All the reports you have previously exported (archived) as a
PDF file using the button can be opened in the Accu-Chek
Smart Pix software at any time.
The exported PDF files are displayed using the PDF
i
reader (for example, Adobe Reader) installed on your
computer, not in the Accu-Chek Smart Pix software.
This is why you can also forward these PDF files to
someone not working with the Accu-Chek Smart Pix
software for information purposes.
• Click the button to open an archived PDF file.
• Select the file you want to use from the dialogue box
now displaying.
Open
• Click the
The PDF reader will now launch and display the selected PDF
file. All the display and print options available here depend
on the installed program.
button.
82
Page 83

4.9 Using report elements in other applications
Chapter 4, Using the software
If you want to use charts or texts from the reports in other
applications (for example, in a text program or a table), you
can do so by copying them to the clipboard.
• Right-click any free area in the report element
displayed.
• Select
Copy text to clipboard
if you would like to use
the displayed information as unformatted text in
another application.
• Select
Copy image to clipboard
if you would like to use
the report element just displayed as an image in
another application.
• Change to the desired application and insert the
contents of the clipboard using the CTRL + V
Paste
keyboard shortcut or using the
menu option.
83
Page 84

Chapter 4, Using the software
4.10 Special functions
The Accu-Chek Smart Pix software allows you to select the
following special functions:
• Performing updates for the Accu-Chek Smart Pix
device
• Manually triggering the search for software and
device updates
• Setting date and time of the majority of supported
blood glucose meters
• Configuring the Accu-Chek Guide meter, the
Accu-Chek Instant meter and the Accu-Chek Active
meter
• Using additional functions which may be available in
the future as a loadable plugin (add-on module)
84
Page 85

Chapter 4, Using the software
Searching for software updates for the Accu-Chek Smart Pix device and the Accu-Chek Smart Pix software
If you have not configured the software to automatically
search for available updates every time the program
launches, you can trigger the search manually with this
function. This is useful, for example, if the computer is not
regularly connected to the Internet.
Help
•Click the
• Select the
button.
Software update...
option.
– If you want to search for updates on the Roche
server, ensure that the computer is connected to
the Internet.
– If you want to install updates from a USB flash
drive, insert the USB flash drive into the computer.
– If you want to install updates from a CD, insert the
CD into the drive.
• Select the desired source and click
Yes
to launch the
search for current software version from the selected
location.
85
Page 86

Chapter 4, Using the software
The search is performed in the background and you can use
the Accu-Chek Smart Pix software without restriction. When
a newer version is found, it is downloaded.
Updating the respective components occurs as described
below:
• The Accu-Chek Smart Pix software is updated the
next time the program launches (after requesting
confirmation).
• A connected Accu-Chek Smart Pix device is updated
the next time the program launches (after requesting
confirmation).
• The latest version of the User’s Manual is saved
locally.
86
Page 87

Chapter 4, Using the software
Setting the date and time in the meter
For the majority of supported meters, you can set the date
and time directly from the Accu-Chek Smart Pix software.
You can correct this manually at any time or when you are
notified during the reading of data that there is a mismatch
between the time on the meter and the time on the
computer.
Correcting the date and time manually
•Click the
• Select the
Device settings
button.
Set date and time
option.
• Prepare the meter for communication as shown in the
dialogue box that follows.
• If the meter allows you to set the time and date, you
can accept the date and time displayed in the
following dialogue box or adjust it as you wish. You
will be notified if your meter does not support this
function.
•Click the
OK
button to send the settings to the meter.
87
Page 88

Chapter 4, Using the software
Correcting the date and time semi-automatically
When you are reading data from a meter, the Accu-Chek
Smart Pix software automatically compares the time and date
settings of the meter with those of the computer. If the device
date and time cannot be set directly, you will be notified of
the difference between the meter and the computer if there
is one. In this case, make the correction directly in the meter.
• If the meter allows you to set the time and date, you
can accept the date and time displayed in the
associated dialogue box or adjust it as you wish.
OK
• Click the
button to send the settings to the meter.
88
Page 89

Additional special functions
The
Device settings
menu contains the following additional
functions:
Chapter 4, Using the software
Clear meter memory:
•
Delete the memory of a
connected meter.
•
Configure meter
(Accu-Chek Guide and Accu-Chek
Instant): Connect one of these devices to set the target
range to be used in that device; you can also set
reminders and activate pattern detection (only for the
Accu-Chek Guide meter).
89
Page 90

Chapter 4, Using the software
•
Configure meter
(Accu-Chek Active meter): Connect
the device to activate reminders for creating a 3-day
profile. The blood glucose results determined in this
context are shown in a separate report element in the
Accu-Chek Smart Pix software.
The 3-day profile helps you create the most meaningful
blood glucose results possible. For three days in a row, seven
tests are performed per day at specified times. Select the
Save
start date and the times of meals. Click
settings on the device or click
Disable
to save the
to turn off structured
testing on the meter.
Blood glucose data obtained as part of this structured testing
protocol is displayed with a grey frame to facilitate
recognition on the time scale. In the
Logbooks
diary view,
this data is highlighted with a magnifying glass icon .
90
Page 91

5 Reports and records
5.1 General information about the reports
Chapter 5, Reports and records
Report elements
The Accu-Chek Smart Pix software creates single-page or
multi-page reports for defined time ranges (for example, the
last 2 or 4 weeks); the time range can be selected as needed.
A report can contain any of the following report elements:
[1] Status
[2] Trend
[3] Standard day
[4] Standard week
[5] Metabolic control
[6] Statistics
[7] Device settings
[8] Basal rate – Bolus (and basal rates)
[9] Insulin pump lists
[10] 3-day profile (SMBG)
[11] Logbooks
The illustration on the left shows examples of reports, either
available as a printout or exported as a PDF file.
91
Page 92

Chapter 5, Reports and records
Selecting and assigning preferred report elements
You can set up the Navigation panel of the software so that
the preferred report elements are directly displayed in the
desired sequence while rarely used report elements are
more...
hidden in the sub-menu (
• In the Navigation panel, click
• Select an entry in the left column
).
more...
and then
Navigation panel
adjust...
,
which you either rarely or never need, then click the
arrow pointing right to move this entry to the
more...
column.
• Select an entry in the right column
more...
, which you
want to have displayed, then click the arrow pointing
left to move this entry to the
Navigation panel
column.
To move an entry up or down in the list:
• Select the entry you want to move in the column, then
click the up or down arrow to move this entry
to the desired position.
Save
• Click
to apply the new settings.
.
92
Independently of the settings made here, only report
elements for which data is actually available are displayed in
the navigation bar. The report element at the top is always
displayed automatically after a data import.
Page 93

Chapter 5, Reports and records
Analysed data
The Accu-Chek Smart Pix software checks the read data to
create the reports. The following data is not included in the
statistics:
• Test results outside the selected time range
• Test results saved without date and time
• Tests with control solution
• Invalid/deleted tests
• Tests outside the measuring range (marked as HI/LO)
Note the following when using the Accu-Chek Smart Pix
software with several meters and patients:
To ensure that the report that belongs to a particular
i
meter is displayed, compare the serial number on the
meter with the data displayed in the top right-hand
corner of every report, for example, patient name or
device name and serial number.
If you want to analyse the data of several devices
i
together, the devices must be
devices involved should have the same date and time
settings. Otherwise the sequence of stored events
may be interpreted incorrectly.
synchronised
, i.e. all
93
Page 94

Chapter 5, Reports and records
Report styles
Some report elements can be displayed in different styles,
which you can toggle directly when displaying the respective
report element. You can find such toggle buttons in the
following report elements:
Toggle button Report element Toggle between...
•
Overview
(Blood glucose
Status, Long-term view
and CGM)
•
Trend
(Blood glucose and
Detailed view, Trend view
CGM)
•
Standard day
(Blood
glucose)
•
Standard week
(Blood
glucose and CGM)
•
Statistics
(Blood glucose
General statistics, Meal-related statistics, Distribution
and CGM)
Basal rate – bolus
•
(Insulin
Basal rate, Basal rates (Chart)
pump)
Insulin pump lists
•
Bolus list, Basal insulin, Pump events
94
• Logbooks
•
Standard day
•
Standard day
magnified view
Standard day
•
•
3-day profile
glucose)
Diary, Logbook (only blood glucose), Daily statistics
(CGM) Trend view in AGP format, CGM curves combined, CGM
curves individually
(CGM),
Meal detail, CGM curves aligned by lowest result
(CGM) Zooming in from the entire day to a meal detail and back
again
(Blood
Logbook (only blood glucose, 3 days), Trend (3 days),
Standard day aligned (3 days)
Page 95

Chapter 5, Reports and records
Keys and additional information on reports
At the bottom of the program window, you will find a general
information and settings area which contains adjusted
statistics, display options and keys, depending on the report
element displayed. Click the corresponding tab on the left
edge to display the associated area:
•The
Statistics
tab contains statistical information
on the selected time range.
•The
Display options
tab allows for toggling
optional information in the report element currently
displayed.
•The
Key
tab contains explanations on the meaning
of the icons displayed.
In the information that follows, you will find detailed
explanations of the various elements.
95
Page 96

Chapter 5, Reports and records
5.2 Overview of icons in reports
Detailed view
Mean blood glucose
Blood glucose value without any additional information. Values below the hypo limit are shown in
red; values above the target range are shown in blue.
Blood glucose value before and/or after meal. Values below the hypo limit are shown in red; values
above the target range are shown in blue.
Value outside the measuring range (indicated on the meter as HI or LO).
Blood glucose value above 400 mg/dL or 25 mmol/L.
Blood glucose value (any icon within the red circle) accompanied by hypo symptoms.
Blood glucose value (any icon within the black circle) with a customised event (marked with an
asterisk * in the blood glucose meter).
Insulin amount for insulin 1 , 2 or 3 , respectively. Insulin amounts are plotted in the chart top
down.
Carbohydrate amounts; displayed at the bottom in some report elements. The carbohydrate amount
is indicated by the height of a single block (or a bar consisting of several blocks). Example:
3 blocks of 10 g each = 30 g
Hypo limit
Trend view
96
Target range
Mean blood glucose and/or CGM median
Standard deviation
Highest value and/or lowest value
Maximum value/minimum value outside the measuring range (HI/LO)
Page 97

Diary
CGM results
Chapter 5, Reports and records
Customised event, for example, test from an alternative site (Alternative Site Testing (AST))
Hypoglycaemia
Carbohydrate amount
Before meal
After meal
Before/during/after exercise
Stress
Illness
Additional information
Tests performed within a 3-day profile
Mean glucose value
Lowest glucose value (Minimum line)
Hypo limit
25th to 75th percentile
10th to 90th percentile
Calibration result
Lowest and/or highest result in the “CGM curves aligned by lowest result” view
97
Page 98

Chapter 5, Reports and records
Insulin pump
Icon Description
Basal rate
Average total basal insulin per day
Basal rate profile
Basal rate change
Basal rate change (with name;
Trend
)
Temporary increase in basal rate/End of temporary increase
Temporary decrease in basal rate/End of temporary decrease
Active basal rate profile (
Statistics
)
Switch to a named basal rate profile (for example, “1”)
Switch from a named basal rate profile (for example, “1”) to another named basal rate profile (for
example, “2”)
Total of basal insulin + bolus insulin per day
98
Page 99

Insulin pump
Chapter 5, Reports and records
Standard bolus, represented in charts top down
Quick bolus, represented in charts top down
Extended bolus, represented in charts top down; the width of the bar shows the duration of the
bolus delivery
Multiwave bolus, represented in charts top down; the width of the bar shows the duration of the
extended portion
Bolus advice, always appears in combination with one of the four bolus type icons described above.
These boluses have been calculated with a bolus calculator (from a corresponding meter).
• Accu-Chek Combo system: Bolus advice is only displayed if the bolus was delivered unchanged
.
• Accu-Chek Insight system: Accepted unchanged boluses and adjusted boluses are both
displayed.
Prime infusion set
Fill cannula
Fill transfer set
Return of piston rod (cartridge change)
Power down/Power up
Time adjustment
Time reset
Insulin pump run
Insulin pump stop
Insulin pump pause
No valid data in selected time range
99
Page 100

Chapter 5, Reports and records
Blood glucose results can contain additional information
(events) which is not represented by icons. These events are
displayed in the comments column of the diary view:
•Snack
•Bedtime
•Fasting
• Before exercise
• After exercise
•Stress
•Illness
•Oral medication
•Customised
•Hypo warning
• Hyper warning
•Premenstrual
•Other
• Exercise 1
• Exercise 2
• Manually entered test result
100
The icons previously described are used for all other events.
 Loading...