

Page 1

SDM-2009 Docking Station
PC Controlled Configuration
Operator’s Manual
Part Number: 71-0262RK
Revision: C
Released: 8/12/13
www.rkiinstruments.com
Page 2

Warranty
RKI Instruments, Inc. warrants gas alarm equipment sold by us to be free from
defects in materia ls and workmans hip, and perform ance for a perio d of one year from
date of shipment from RKI Instruments, Inc. Any parts found defective within that
period will be repair e d or repl ace d, at our optio n, fre e of char ge . This w arra nty do es
not apply to those items which by their nature are subject to deterioration or
consumption in normal service, and which must be cle aned, repaired, or replac ed o n
a routine basis. Examples of such items are:
Absorbent cartridges Batteries
Pump diaphragms and valves Filter elements
Fuses
Warranty is voided by abuse including mechanical damage, alteration, rough
handling, or repairs procedures not in accordance with the instruction manual. This
warranty indicates the full extent of our liability, and we are not responsible for
removal or replacement costs, local repair costs, transportation costs, or contingent
expenses incurred without our prior approval.
THIS WARRANTY IS EXPRESSLY IN LIEU OF ANY AND ALL OTHER
WARRANTIES AND REPRESENTATIONS, EXPRESSED OR IMPLIED, AND
ALL OTHER OBLIGATIONS OR LIABILITIES ON THE PART OF RKI
NSTRUMENTS, INC. INCLUDING BUT NOT LIMITED TO THE WARRANTY
I
OF MERCHANTABILITY OR FITNESS FOR A PARTICULAR PURPOSE. IN
NO EVENT SHALL RKI INSTRUMENTS, INC. BE LIABLE FOR INDIRECT,
INCIDENTAL, OR CONSEQUENTIAL LOSS OR DAMAGE OF ANY KIND
CONNECTED WITH THE USE OF ITS PRODUCTS OR FAILURE OF ITS
PRODUCTS TO FUNCTION OR OPERATE PROPERLY.
This warranty covers instruments and parts sold to users only by authorized
distributors, dealers, and representatives as appointed by RKI Instruments, Inc.
We do not assume indemnification for any accident or damage caused by th e
operation of th is gas mo nitor an d our war ranty is li mited to r eplacement of par ts or our
complete goods.
Warranty
Page 3

Table of Contents
Introduction . . . . . . . . . . . . . . . . . . . . . . . . . . . . . . . . . . . . . . . . . . . . . . . . . . . . . . . . . .1
System Requirements . . . . . . . . . . . . . . . . . . . . . . . . . . . . . . . . . . . . . . . . . . . . . . . . . . 2
Specifications. . . . . . . . . . . . . . . . . . . . . . . . . . . . . . . . . . . . . . . . . . . . . . . . . . . . . . . . . 3
About This Manual. . . . . . . . . . . . . . . . . . . . . . . . . . . . . . . . . . . . . . . . . . . . . . . . . . . . . 4
Cautions & Safety Information. . . . . . . . . . . . . . . . . . . . . . . . . . . . . . . . . . . . . . . . . . . 4
Description. . . . . . . . . . . . . . . . . . . . . . . . . . . . . . . . . . . . . . . . . . . . . . . . . . . . . . . . . . .5
AC Adapter . . . . . . . . . . . . . . . . . . . . . . . . . . . . . . . . . . . . . . . . . . . . . . . . . . . . . . 5
Single-Port AC Adapter. . . . . . . . . . . . . . . . . . . . . . . . . . . . . . . . . . . . . . . . . . . . . . . . . . . . 5
4-Port AC Adapter. . . . . . . . . . . . . . . . . . . . . . . . . . . . . . . . . . . . . . . . . . . . . . . . . . . . . . . . 5
USB Cable . . . . . . . . . . . . . . . . . . . . . . . . . . . . . . . . . . . . . . . . . . . . . . . . . . . . . . 6
Air Filter, Sample Tubing, and Check Valve . . . . . . . . . . . . . . . . . . . . . . . . . . . . . 6
Instrument Panel. . . . . . . . . . . . . . . . . . . . . . . . . . . . . . . . . . . . . . . . . . . . . . . . . . 8
Back Panel . . . . . . . . . . . . . . . . . . . . . . . . . . . . . . . . . . . . . . . . . . . . . . . . . . . . . . 9
Power Jack . . . . . . . . . . . . . . . . . . . . . . . . . . . . . . . . . . . . . . . . . . . . . . . . . . . . . . . . . . . . . 9
Sample Fittings. . . . . . . . . . . . . . . . . . . . . . . . . . . . . . . . . . . . . . . . . . . . . . . . . . . . . . . . . . 9
PC Connection . . . . . . . . . . . . . . . . . . . . . . . . . . . . . . . . . . . . . . . . . . . . . . . . . . . . . . . . . . 9
Control Panel . . . . . . . . . . . . . . . . . . . . . . . . . . . . . . . . . . . . . . . . . . . . . . . . . . . 10
Front Panel . . . . . . . . . . . . . . . . . . . . . . . . . . . . . . . . . . . . . . . . . . . . . . . . . . . . . 11
USB Hub Requirements for Multiple Station Systems. . . . . . . . . . . . . . . . . . . . . . . 11
Hardware Setup . . . . . . . . . . . . . . . . . . . . . . . . . . . . . . . . . . . . . . . . . . . . . . . . . . . . . . 12
Hardware Assembly . . . . . . . . . . . . . . . . . . . . . . . . . . . . . . . . . . . . . . . . . . . . . . 12
Assembling a Manifold for Multiple SDM-2009 Units . . . . . . . . . . . . . . . . . . . . . 13
Exhaust Tubing. . . . . . . . . . . . . . . . . . . . . . . . . . . . . . . . . . . . . . . . . . . . . . . . . . . . . . . . . 13
GAS Tubing. . . . . . . . . . . . . . . . . . . . . . . . . . . . . . . . . . . . . . . . . . . . . . . . . . . . . . . . . . . . 15
Connecting Calibration Gas . . . . . . . . . . . . . . . . . . . . . . . . . . . . . . . . . . . . . . . . 17
EAGLE 2 and GX Type Instrument Connection . . . . . . . . . . . . . . . . . . . . . . . . . . . . 18
Installing the SDM-GX Docking Station PC Controller Program . . . . . . . . . . . . . . . 18
Launching the SDM-GX Docking Station PC Controller Program. . . . . . . . . . . . . . 23
Table of Contents
Page 4

Overview of the SDM-GX Docking Station PC Controller Program. . . . . . . . . . . . . 24
PC Controller Program Functions. . . . . . . . . . . . . . . . . . . . . . . . . . . . . . . . . . . . 24
Main Program Window . . . . . . . . . . . . . . . . . . . . . . . . . . . . . . . . . . . . . . . . . . . . 25
Control Buttons. . . . . . . . . . . . . . . . . . . . . . . . . . . . . . . . . . . . . . . . . . . . . . . . . . . . . . . . . 25
SDM-2009/Instrument Display Area . . . . . . . . . . . . . . . . . . . . . . . . . . . . . . . . . . . . . . . . . 25
Program Status. . . . . . . . . . . . . . . . . . . . . . . . . . . . . . . . . . . . . . . . . . . . . . . . . . . . . . . . . 26
Fitting Indicators. . . . . . . . . . . . . . . . . . . . . . . . . . . . . . . . . . . . . . . . . . . . . . . . . . . . . . . . 26
Setting Up the PC Controller Program. . . . . . . . . . . . . . . . . . . . . . . . . . . . . . . . . . . . 26
Setting Up the Configuration. . . . . . . . . . . . . . . . . . . . . . . . . . . . . . . . . . . . . . . . 26
Setting Up the SDM-2009 Display Orde r . . . . . . . . . . . . . . . . . . . . . . . . . . . . . . 31
Cylinders Window . . . . . . . . . . . . . . . . . . . . . . . . . . . . . . . . . . . . . . . . . . . . . . . . 33
Selecting a Cylinder from the Pre-Defined List. . . . . . . . . . . . . . . . . . . . . . . . . . . . . . . . . 34
Defining New Cylinders. . . . . . . . . . . . . . . . . . . . . . . . . . . . . . . . . . . . . . . . . . . . . . . . . . . 35
Connecting Instruments to the PC Controller Program. . . . . . . . . . . . . . . . . . . . . . 36
Icon View vs. Details View . . . . . . . . . . . . . . . . . . . . . . . . . . . . . . . . . . . . . . . . . 40
Exporting an Instrument List from the Main Program Window . . . . . . . . . . . . . . 41
Automatic Bump Testing and Calibration . . . . . . . . . . . . . . . . . . . . . . . . . . . . . . . . . 42
Bump Testing a GX-2009. . . . . . . . . . . . . . . . . . . . . . . . . . . . . . . . . . . . . . . . . . . . . . . 43
Calibrating a GX-2009 . . . . . . . . . . . . . . . . . . . . . . . . . . . . . . . . . . . . . . . . . . . . . . . . . 54
Troubleshooting. . . . . . . . . . . . . . . . . . . . . . . . . . . . . . . . . . . . . . . . . . . . . . . . . . . . . . 64
Charging an Instrument in an SDM-2009. . . . . . . . . . . . . . . . . . . . . . . . . . . . . . . . . . 65
Recharging the Batteries After Performing a Bump Test or Calibration . . . . . . . 65
Recharging the Batteries Without Performing Any Operations. . . . . . . . . . . . . . 66
Batteries Too Drained for PC Controller Operation. . . . . . . . . . . . . . . . . . . . . . . 67
Logs Window . . . . . . . . . . . . . . . . . . . . . . . . . . . . . . . . . . . . . . . . . . . . . . . . . . . . . . . . 67
Alarm Trend Data . . . . . . . . . . . . . . . . . . . . . . . . . . . . . . . . . . . . . . . . . . . . . . . . 71
Calibration Data . . . . . . . . . . . . . . . . . . . . . . . . . . . . . . . . . . . . . . . . . . . . . . . . . 76
Event Data . . . . . . . . . . . . . . . . . . . . . . . . . . . . . . . . . . . . . . . . . . . . . . . . . . . . . 79
Interval Trend Data . . . . . . . . . . . . . . . . . . . . . . . . . . . . . . . . . . . . . . . . . . . . . . . 81
Memo Data . . . . . . . . . . . . . . . . . . . . . . . . . . . . . . . . . . . . . . . . . . . . . . . . . . . . . 86
Bump Test Data. . . . . . . . . . . . . . . . . . . . . . . . . . . . . . . . . . . . . . . . . . . . . . . . . . 89
Table of Contents
Page 5

Deleting Data in the Logs Window . . . . . . . . . . . . . . . . . . . . . . . . . . . . . . . . . . . 93
Instrument Function Menu . . . . . . . . . . . . . . . . . . . . . . . . . . . . . . . . . . . . . . . . . . . . . 94
Open Function. . . . . . . . . . . . . . . . . . . . . . . . . . . . . . . . . . . . . . . . . . . . . . . . . . . 94
Edit Function. . . . . . . . . . . . . . . . . . . . . . . . . . . . . . . . . . . . . . . . . . . . . . . . . . . . 95
Parameter Tab. . . . . . . . . . . . . . . . . . . . . . . . . . . . . . . . . . . . . . . . . . . . . . . . . . . . . . . . . . 96
Sensor Tab . . . . . . . . . . . . . . . . . . . . . . . . . . . . . . . . . . . . . . . . . . . . . . . . . . . . . . . . . . . 103
Download Function. . . . . . . . . . . . . . . . . . . . . . . . . . . . . . . . . . . . . . . . . . . . . . 104
Clear Logs Function . . . . . . . . . . . . . . . . . . . . . . . . . . . . . . . . . . . . . . . . . . . . . 104
Power Off Function. . . . . . . . . . . . . . . . . . . . . . . . . . . . . . . . . . . . . . . . . . . . . . 104
Config Window. . . . . . . . . . . . . . . . . . . . . . . . . . . . . . . . . . . . . . . . . . . . . . . . . . . . . . 105
Parameter Tab. . . . . . . . . . . . . . . . . . . . . . . . . . . . . . . . . . . . . . . . . . . . . . . . . .105
Database Tab . . . . . . . . . . . . . . . . . . . . . . . . . . . . . . . . . . . . . . . . . . . . . . . . . . 105
Password Tab . . . . . . . . . . . . . . . . . . . . . . . . . . . . . . . . . . . . . . . . . . . . . . . . . .107
Spare Parts List . . . . . . . . . . . . . . . . . . . . . . . . . . . . . . . . . . . . . . . . . . . . . . . . . . . . . 108
CAUTION: Read and understand this manual before using the SDM-2009. Also
read and understand the GX-2009 Operator’s Manual.
Table of Contents
Page 6

Introduction
This section briefl y describes the S DM-2009 D ocking S t ation, the Single Modul e Data
Viewer Program, and the SDM-GX Docking Station PC Controller Program. This
section also describes the SDM-2009 Docking Station PC Controlled Configuration
Operator’s Manual (this document). Table 1 at the end of this section lists the SDM2009’s specifications.
The SDM-2009 Docking Station is an advanced, reliable system that provides
charging, calibration, bump testing, and calibration and bump test records for the
GX-2009 portable gas monitor. It is designed to save the calibration and bump test
records to a USB flash drive (standal one functional ity) or to be conn ected directly to a
computer (PC contr olled f unctiona lity). If calibra tion an d bump test recor ds are stor ed
to a USB flash drive while operating in the standalone configuration, the Single
Module Data Viewer Program can then be used with a Windows-based personal
computer to retrieve calibration and bump test data files from the USB flash drive or
from the comput er’s hard drive if the fi les have b een transferre d to the hard driv e from
the flash drive. If you are using the PC Controller Program while operating in the PC
controlled configuration, you may retrieve instrument data, bump test, and calibrate
up to 10 units at once. Instrument info rmation and data for each instrument can be
viewed directly using the PC Controller Program and can be printed from the PC
Controller Program. For instructions to use the SDM-2009 in the Standalone
configuration, see the SDM-2009 Docking Station Standalone Configuration
Operator’s Manual.
The purpose of this manual is to explain how to set up and use the SDM-2009 in PC
Controlled config uratio n. It also explai ns how to use the SD M-GX Doc king S t ation PC
Controller Program. You will learn how to:
• install and launch the SDM-GX Docking Station PC Controller Program
• setup the SDM-GX Docking Station PC Controller Program for use with the
SDM-2009
• prepare the SDM-2009 for use
• bump test and calibrate up to 10 units using the PC controlled configuration
• use the SDM-2009 to charge a GX-2009
• view, print, and export calibr ation and bump test records
• view instrumen t inf or m ati on and data using the PC Controller Program
• update instrument parameters using the PC Controller Program
1 • Introduction
Page 7

CAUTION: The GX-2009 detect s oxygen defi ciency and elevated levels of oxygen ,
combustible gases, carbon monoxide, and hydrogen sulfide, all of
which can be dange r ous or life threatening. Wh en using the GX-2009,
you must follow the instructions and warnings in the GX-2009
Operator’s Manual to assure proper and safe operation of the unit and
to minimize the risk of personal injury.
CAUTION: The operator of this instr umen t is advised that if the equi pment is u sed
in a manner not specifie d in this manual, the protection pr ovided by the
equipment may be impaired.
System Requirements
To use the SDM-GX Do cking S t ation PC Con troller Sof tware, your personal comp uter
must meet the following requirements:
• Operating System s: Windows® XP, Windows® Vista, Windows® 7.
®
• Processor: IBM
compatible PC running Pentium® 2 processor or equivalent
minimum
• Memory: 3 2 MB RAM minimum
• Hard Disk Space: 32 MB minimum
• CD-RO M Drive
• One (for 4 or less SDM-2009s) or two (for 5 or more SD M-2009s) available
USB port(s), one or two USB hubs may also be needed depending on the
number of SDM-2009s in your system. See “USB Hub Requirements for
Multiple Station Systems” on page 11.
System Requirements • 2
Page 8
Specifications
Table 1: SDM-2009 Specifications
Input Power 12 VDC
NOTE: AC Adapter with 100 - 240 VAC, 50/60 Hz,
0.6A input and 1 2 VDC, 1.2A output provided as
standard.
Environmental Conditions • For Indoor Use Only
• -10° C to 40° C, below 80% Relative Humidity, NonCondensing
Applicable Instrument GX-2009
Memory Capaci ty 64 KB (S tandalone configuration only)
Maximum Record Size 256 bytes (Standalone configuration only)
Maximum Number of
Records Saved
Number of Calibration Gas
Cylinders
Standard Accessories • AC Adapter
200 (Standalone configuration only)
One calibration gas cylinder per bump test or
calibration
• USB Flash Drive
• Single Module Data Viewer Program
• SDM-GX Docking Station PC Controller
Program
• Inlet Air Filter
• Instruction Manual
• 10 Foot Long 5/16 Inch Exhaust Tube
• One 3 Foot Long 3/16 Inch Tube for GAS
Fitting
• 10 Foot Long 3/16 Inch Tube for GAS Fitting
Manifolding
3 • Specifications
• 2 T-Fittings
• Check Valve
• USB Cable, Type A to Type B
Page 9

NOTE: The bump test function of the GX-2009 is included in instruments with
firmware version 03955 or later installed. GX-2009 instruments
shipped after May 2011 include the bump test function. Instruments
that have a serial nu mb er starting with 04516 or later shi pp ed fr om th e
factory with the bump test function available. Instruments that have a
serial number starting with 04515 did not include the bump test
function when shipped from the factory. The factory setting for the
bump test function is off. Any GX-2009 can be bump tested using the
SDM-2009 and the PC Controlle r Program regardless of its firmware
version.
About this Manual
The SD M-2009 D ocking S ta tion PC Controll ed Config uration O perator’s Man ual uses
the following conventions for notes, cautions, and warnings.
NOTE: Describes additional or critical information.
CAUTION: Describes potentia l damage to equipm en t.
WARNING: Describes potential danger that can result in injury or death.
Cautions & Safety Information
• Use only polyurethane sample tubing with the SDM-2009. Consult RKI
Instruments, Inc. for other materials.
• Do not subject the SDM-2009 to infrared or intense light. This may cause
communication errors.
• Do not expose the SD M-2009 to water.
• Do not subject the SDM-2009 to any hard impact.
About this Manual • 4
Page 10
Description
To Pow er Jack
on SDM-2009
Back Panel
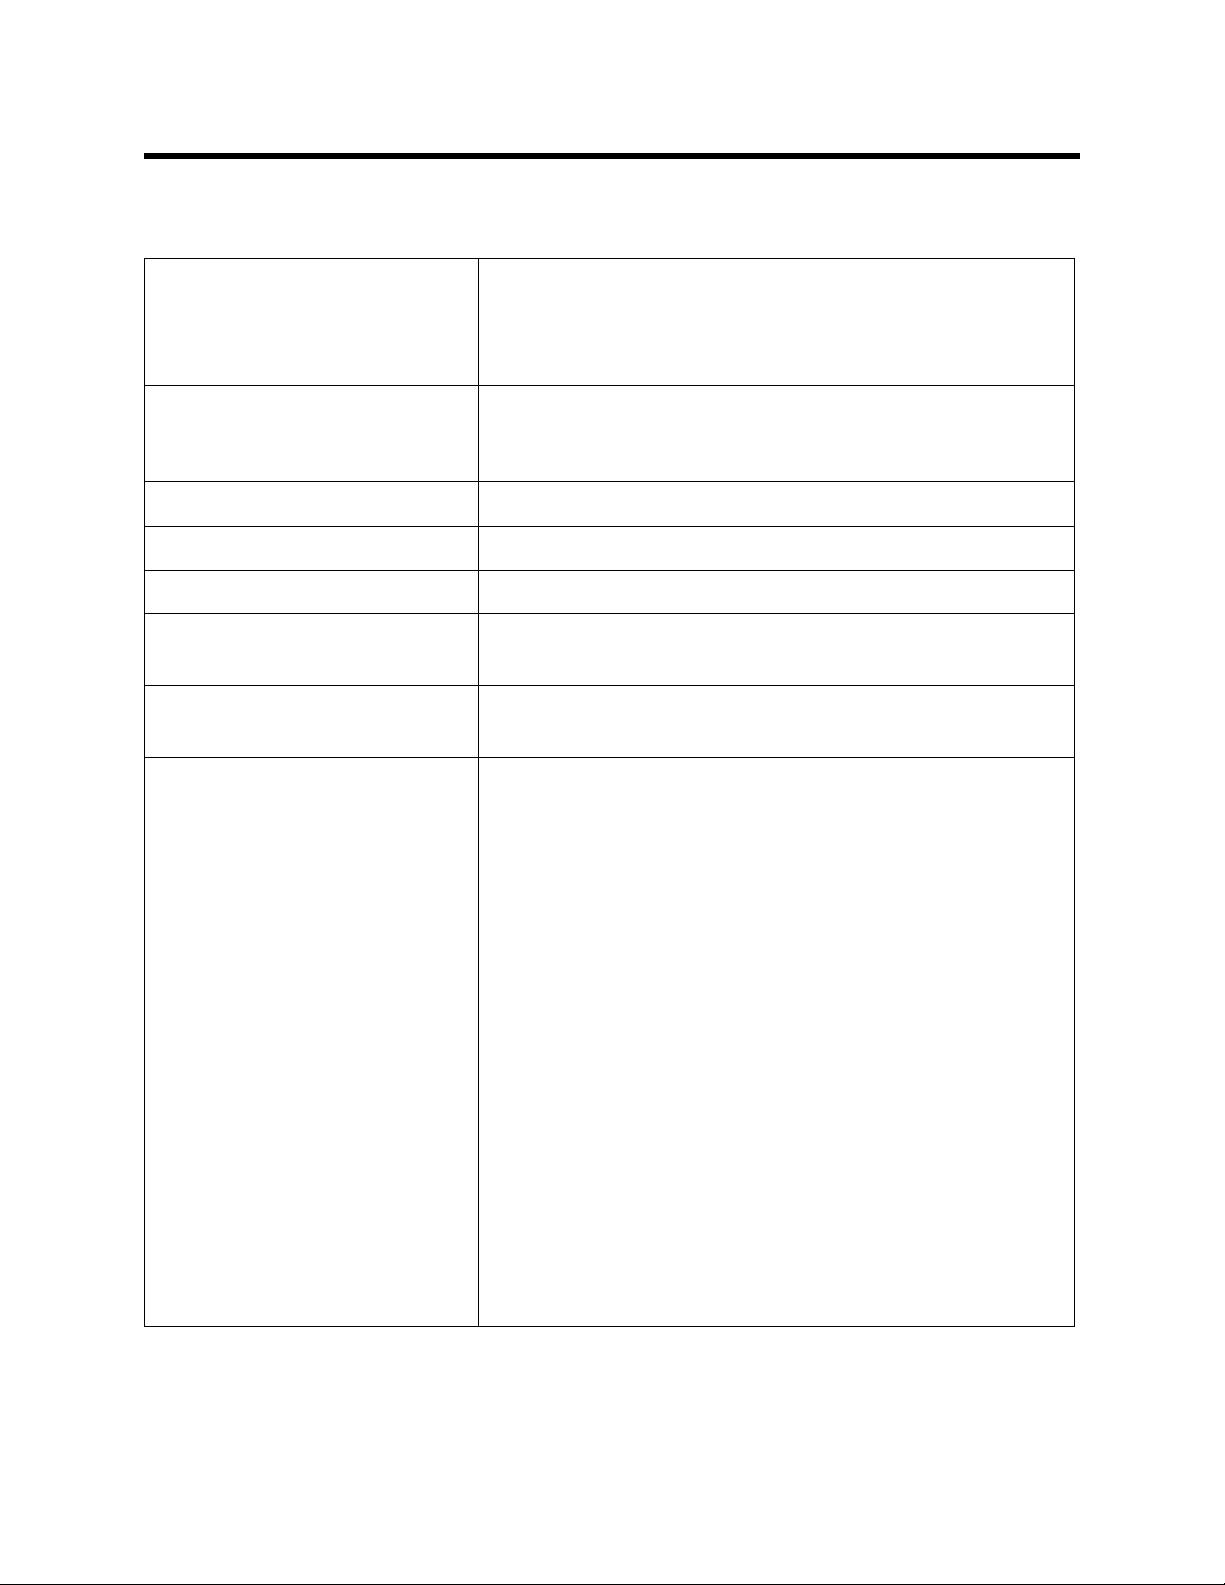
Figure 1: Single-Port AC Adapter
To Power Jack
on SDM-2009
Back Panels
Figure 2: 4-Port AC Adapter
This section describes the SDM-2009 docking station. It is designed to be used on a
table top and cons ists of the AC ad aptor , T ype A to T y pe B USB cable, air filte r , check
valve, 3 plasti c T-fittings, sample tubing, instrument panel, back panel, control panel,
status LEDs, and 2 USB ports.
AC Adapter
Single-Port AC Adapter
The single-port AC ada pt er is a w all plug style ada pter w ith a 5 f oot cable. The en d of
the cable has a plug that connects to the power jack on the SDM-2009’s back panel.
The AC adapter is rated 100 - 240 VAC input, 12 VDC 1.2 A output.
4-Port AC Adapter
The 4-port AC adapt er is a wa l l p lug style adapter with four 5-foot cables . The end of
each cable has a plug that connects to t he power jack on the SDM-2009’s back
panel. The AC adapter is rated 100 - 240 VAC input, 12 VDC 2.0 A output.
5 • Description
Page 11
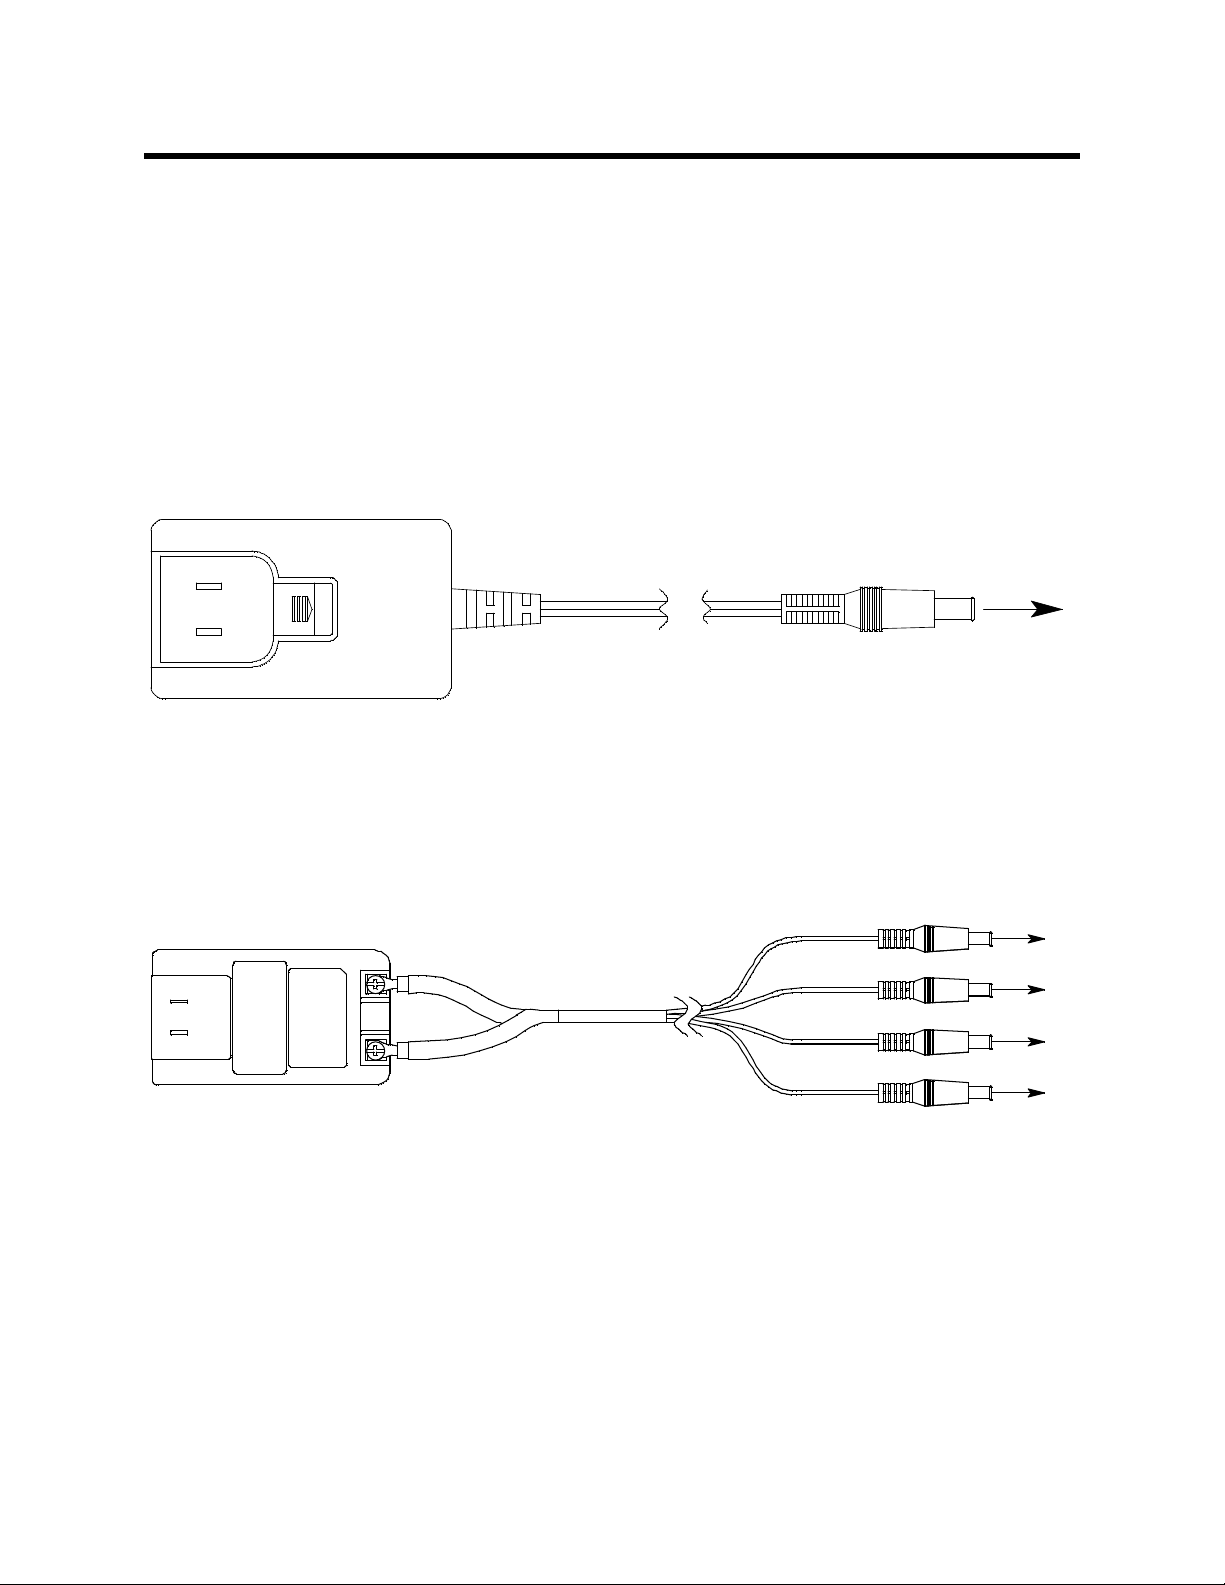
USB Cable
Type A, for
connection to
PC USB port
Type B, for connection
to USB port on the
SDM-2009's back panel
Exhaust Tubing, 5/16 Inch
ID,10 feet
Calibration Gas Sample Tubing, 3/16
Inch ID, 3 feet
Particle Filter for Air Inlet
Manifold Tubing, 3/16 Inch
ID,10 feet
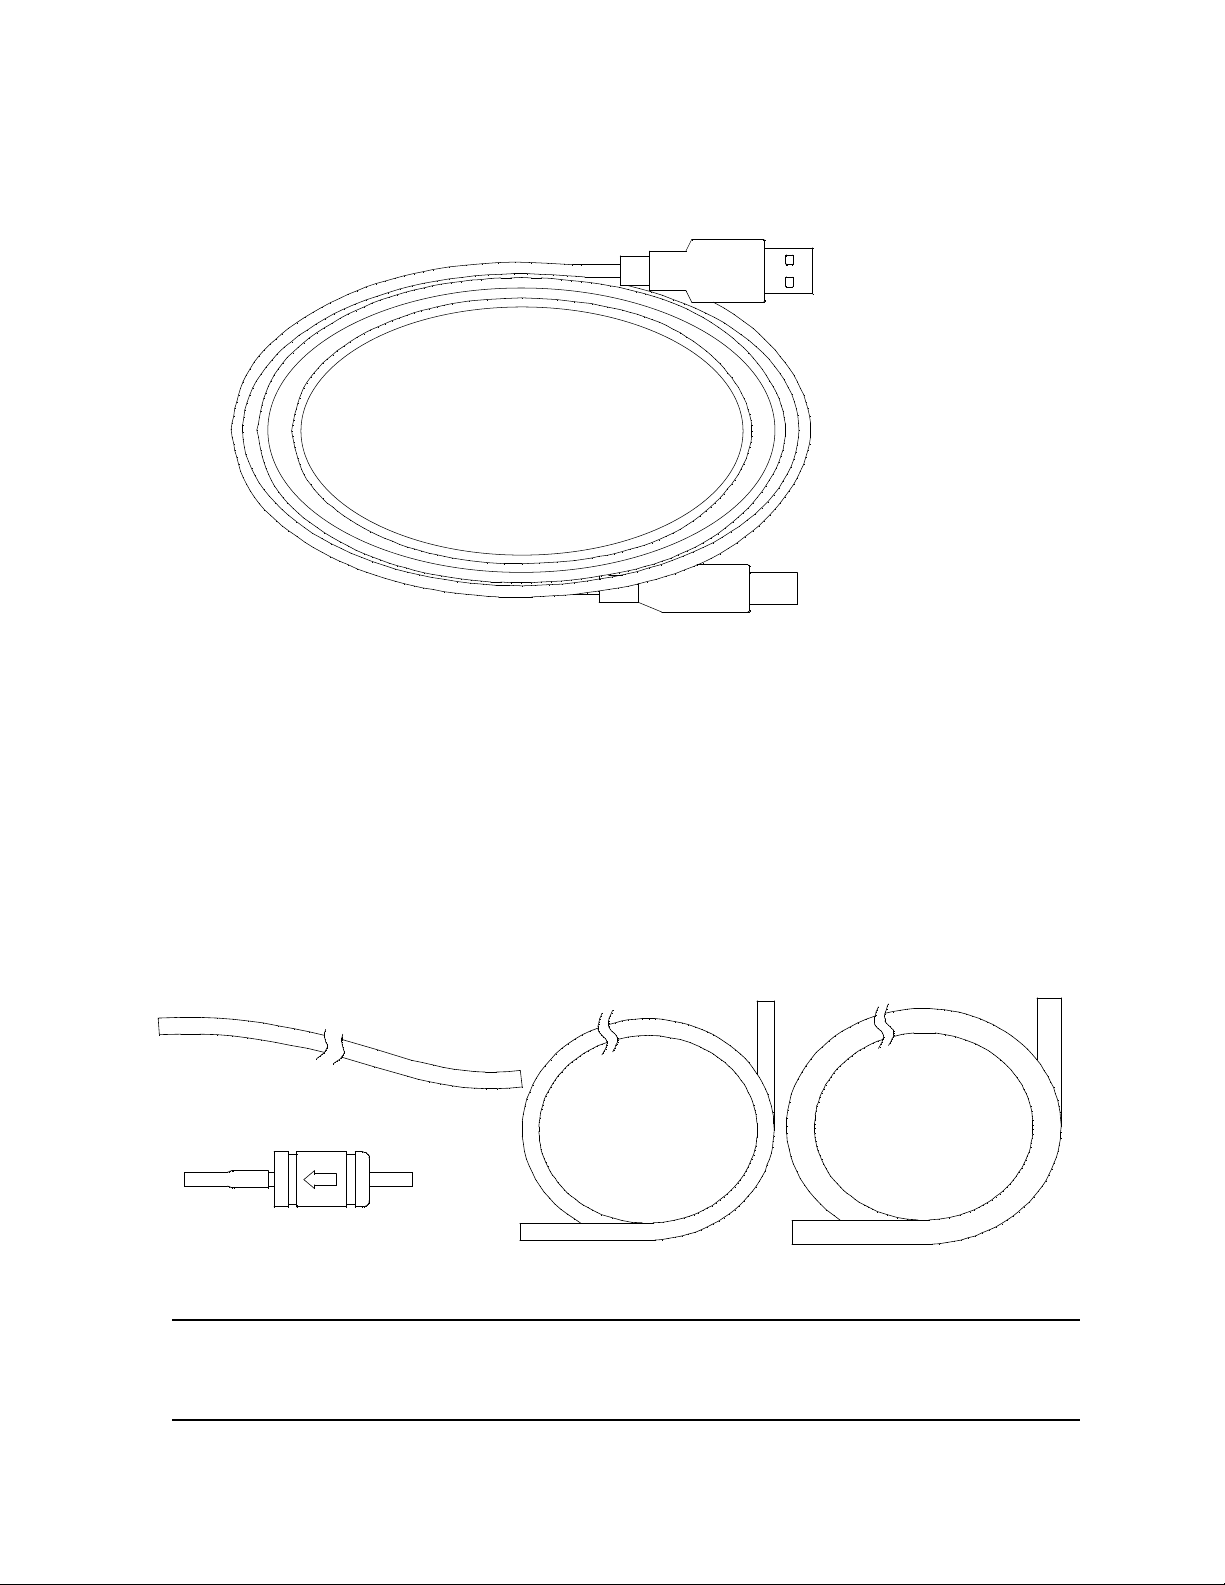
Figure 4: Air Filter & Sample Tubing
A Type A to Type B USB cable is provided with the docking station. It is used to
connect the USB port on the back of the SDM-2009 to a computer.
Figure 3: USB Cable
Air Filter, Sample Tubing, and Chec k Valve
A cylindrical particle filter with a short length of tubing is supplied with the SDM-2009
for installation to the AIR fitting on the back panel. The filter keeps particulate
contamination out of the docking station.
Three types of sample tubes are included with the docking station. One 3 foot length
of 3/16 inch ID polyurethane tubing is provided to connect the regulator on a
calibration cylinder to the GAS fitting on the back panel. One 10 foot length of 3/16
inch ID polyurethane tubing is provided for GAS fitting manifold construction (if
desired). In addition, a 10 foot length of 5/16 inch ID polyurethane tubing is provided
for connection to the exhaust fitting on the back panel to allow routing of the exhaust
to a location such as an open window where the exhaust can disperse.
WARNING: Do not use an exhaust tube that is longer than 10 feet. The increased flow
restriction caused by a longer tube may affect gas response and cause
inaccurate calibration and bump test results.
Description • 6
Page 12
A check valve is included with the SDM-2009. It is intended for use on the exhaust
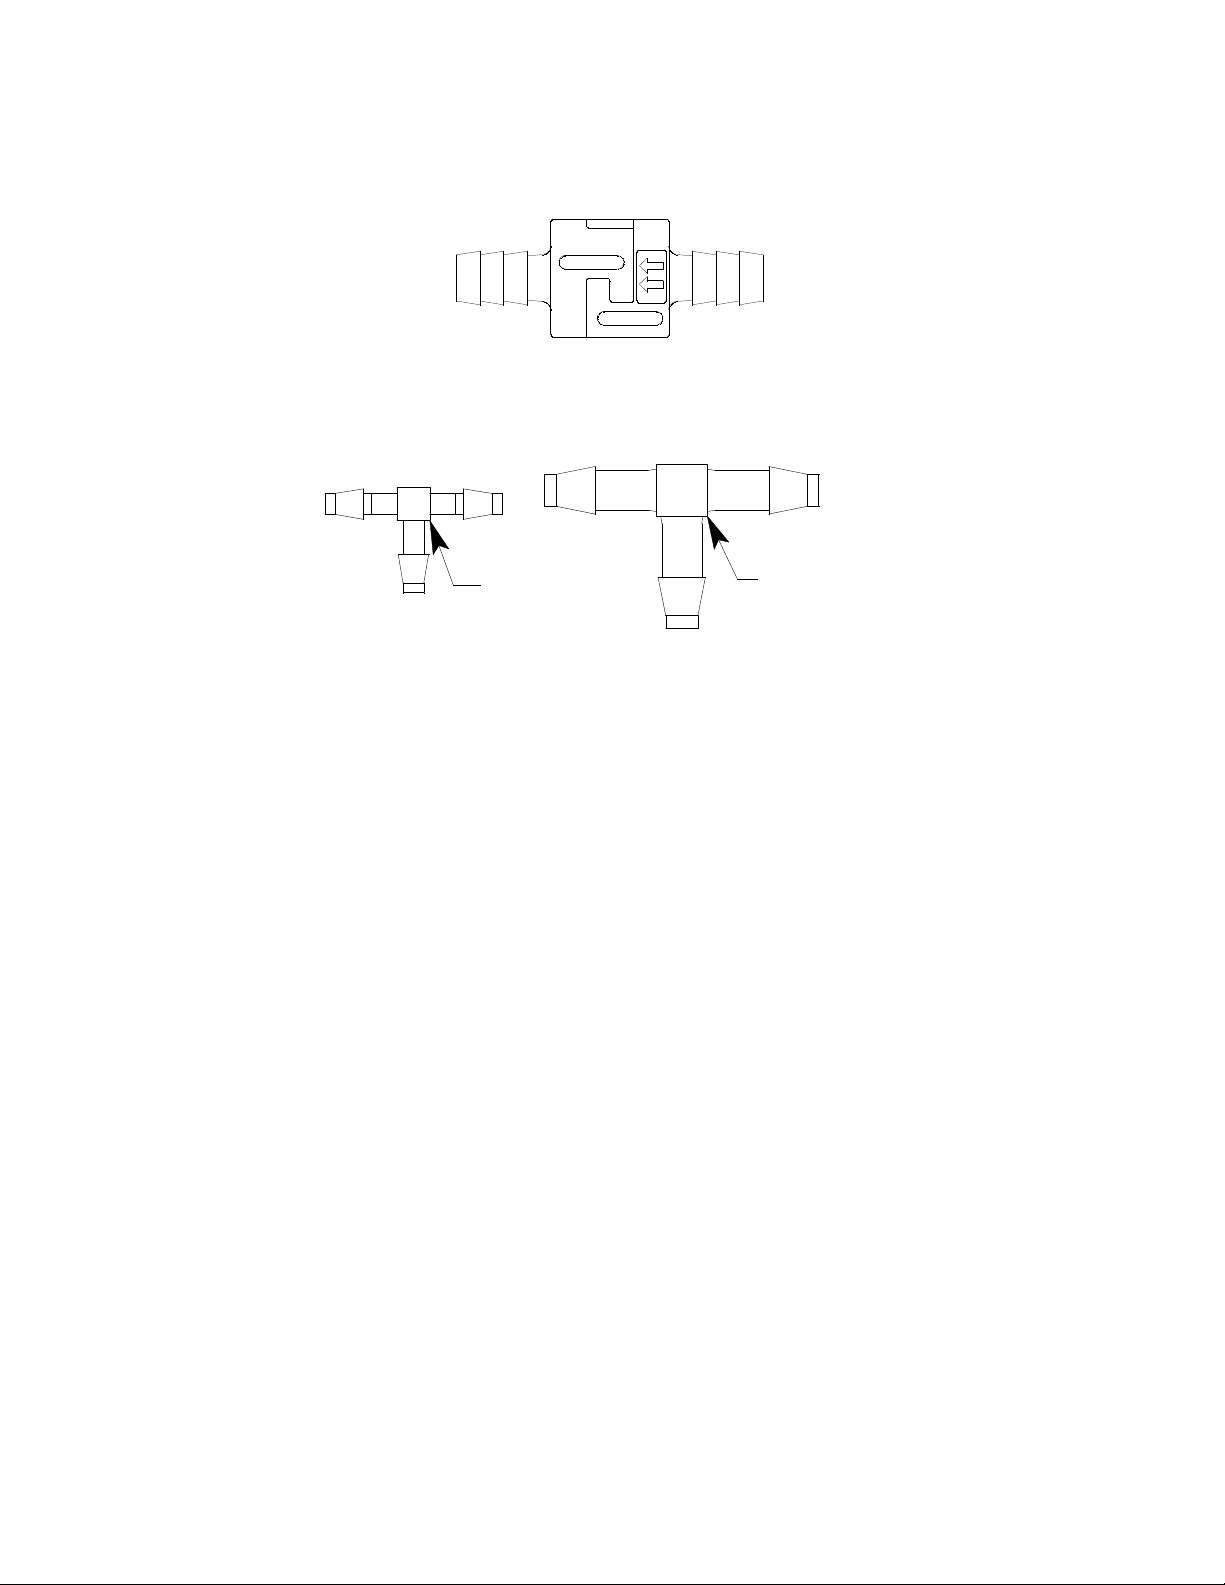
Figure 5: Check Valve
For Exhaust
Tubing
For GAS
Tubing
Figure 6: T- Fittings
fitting when manifolding multiple docking stations together. See “Assembling a
Manifold for Multiple SDM-200 9 Units” on page 13 for manifolding instructions.
Two T-fittings are included with the SDM-2009. The larger fitting is for the exhaust
tubing manifold construction. The smaller fitting is for the GAS tubing manifold
construction.
7 • Description
Page 13
Instrument Cradle
EDIT
ENTER
CAL.
POWER
CHARGE
SDM-2009
1SEC ON
3SEC OFF
COPY
GX-200 9 OFF
BUMP
SDM-2009 Without GX-2009
H2SCO%LELO
2
RKI GX-2009
POWER
MODE
AIR
BUMP
GX-200 9 OFF
COPY
1SEC ON
3SEC OFF
SDM-2009
CHARGE
POWER
CAL.
EDIT
ENTER
Charging Contacts
SDM-2009 With GX-2009
IR Port
Inst rum ent Cradle
Instrument Retaining
Tab
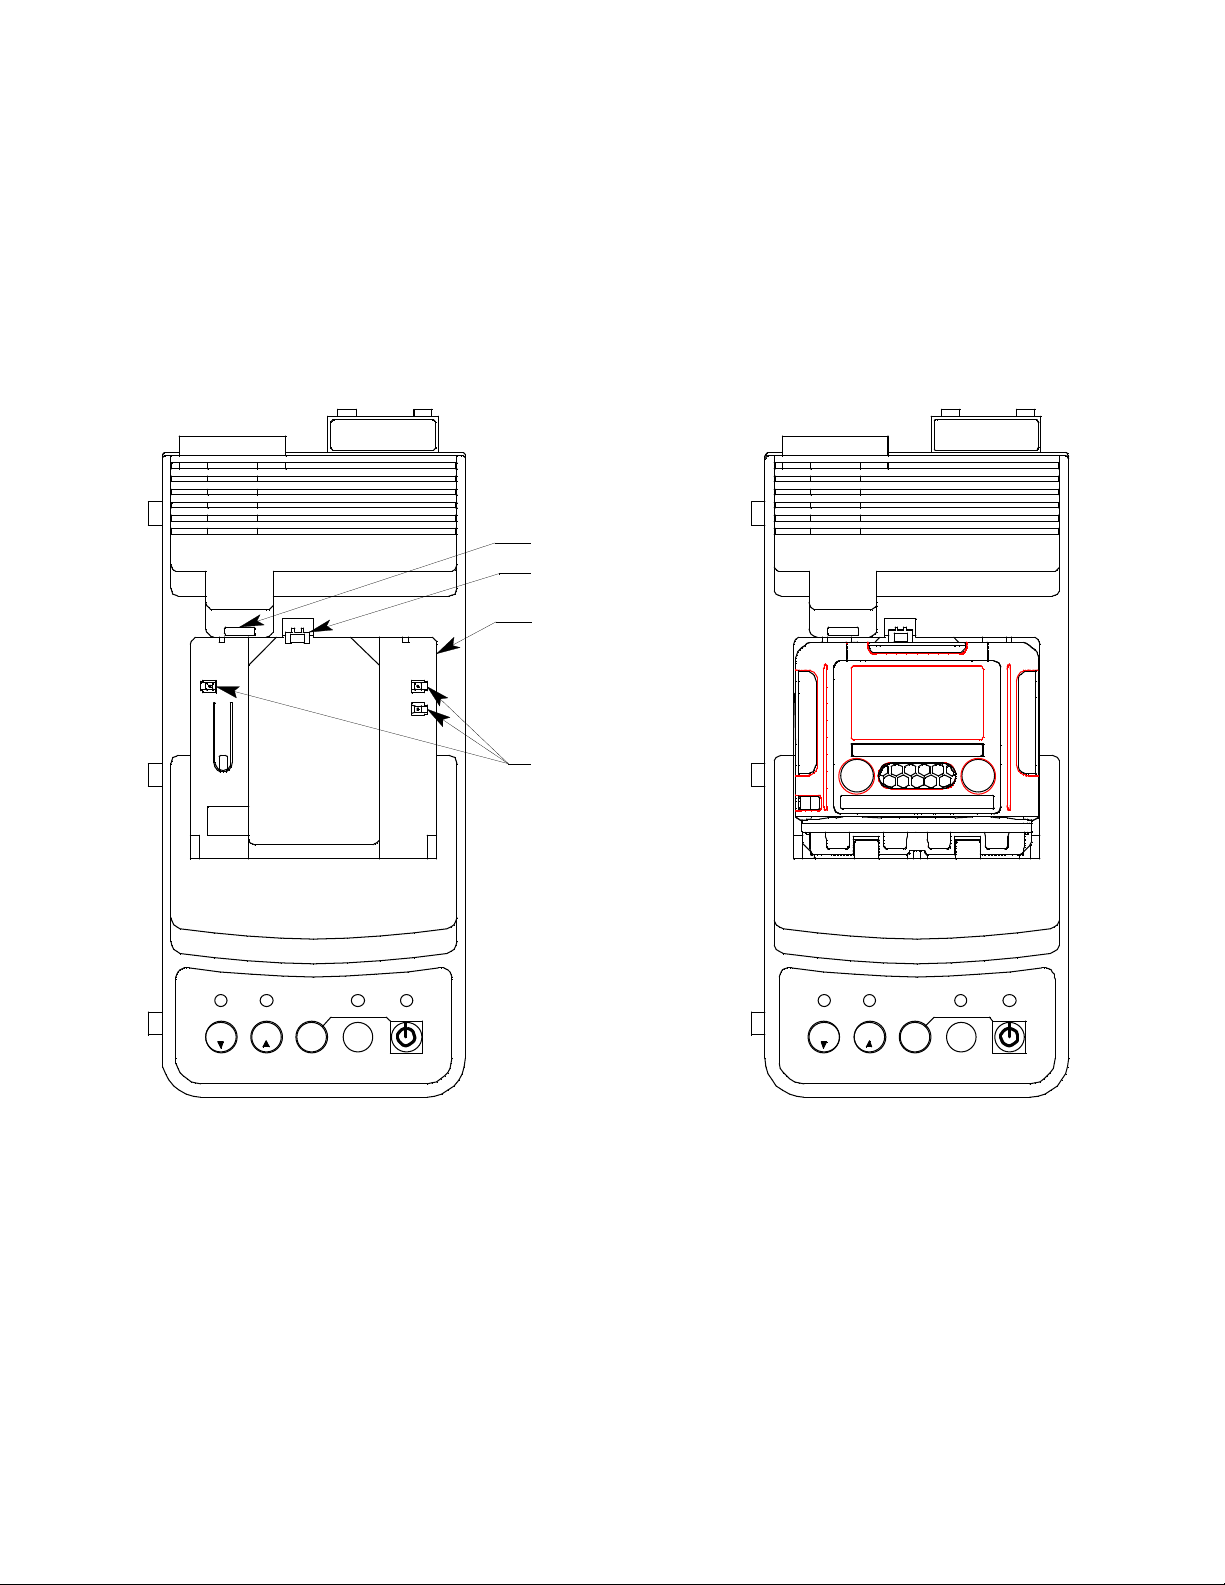
Figure 7: Instrument Cradle
The instrument cradle is a recessed area on the top of the SM-2009 that is designed
to accept the GX-2009. Insert the GX-2009 in the instrument cradle when you
perform a bump test or calibration. The cradle has charging contacts on the bottom
that mate with the contacts on the back of the GX-2009. There are sample ports in
the front of the cradle that match up with the GX-2009’s sensors and route air and
calibration gas to the sensors during a bump test or calibration. An infrared (IR) port
at the back of the cra dle l i ne s up wi th th e GX -2009’s IR port when it is inserted i n th e
cradle and is used to communicate with the GX-2009. A retaining tab that holds the
GX-2009 in the cradle is located to the right of the IR port.
Description • 8
Page 14
Back Panel
Gas Fitti ng
Exhaust Fitting
Back Panel USB
Port (Type B),
For Computer
Connection
Air Fitting
Power Jack
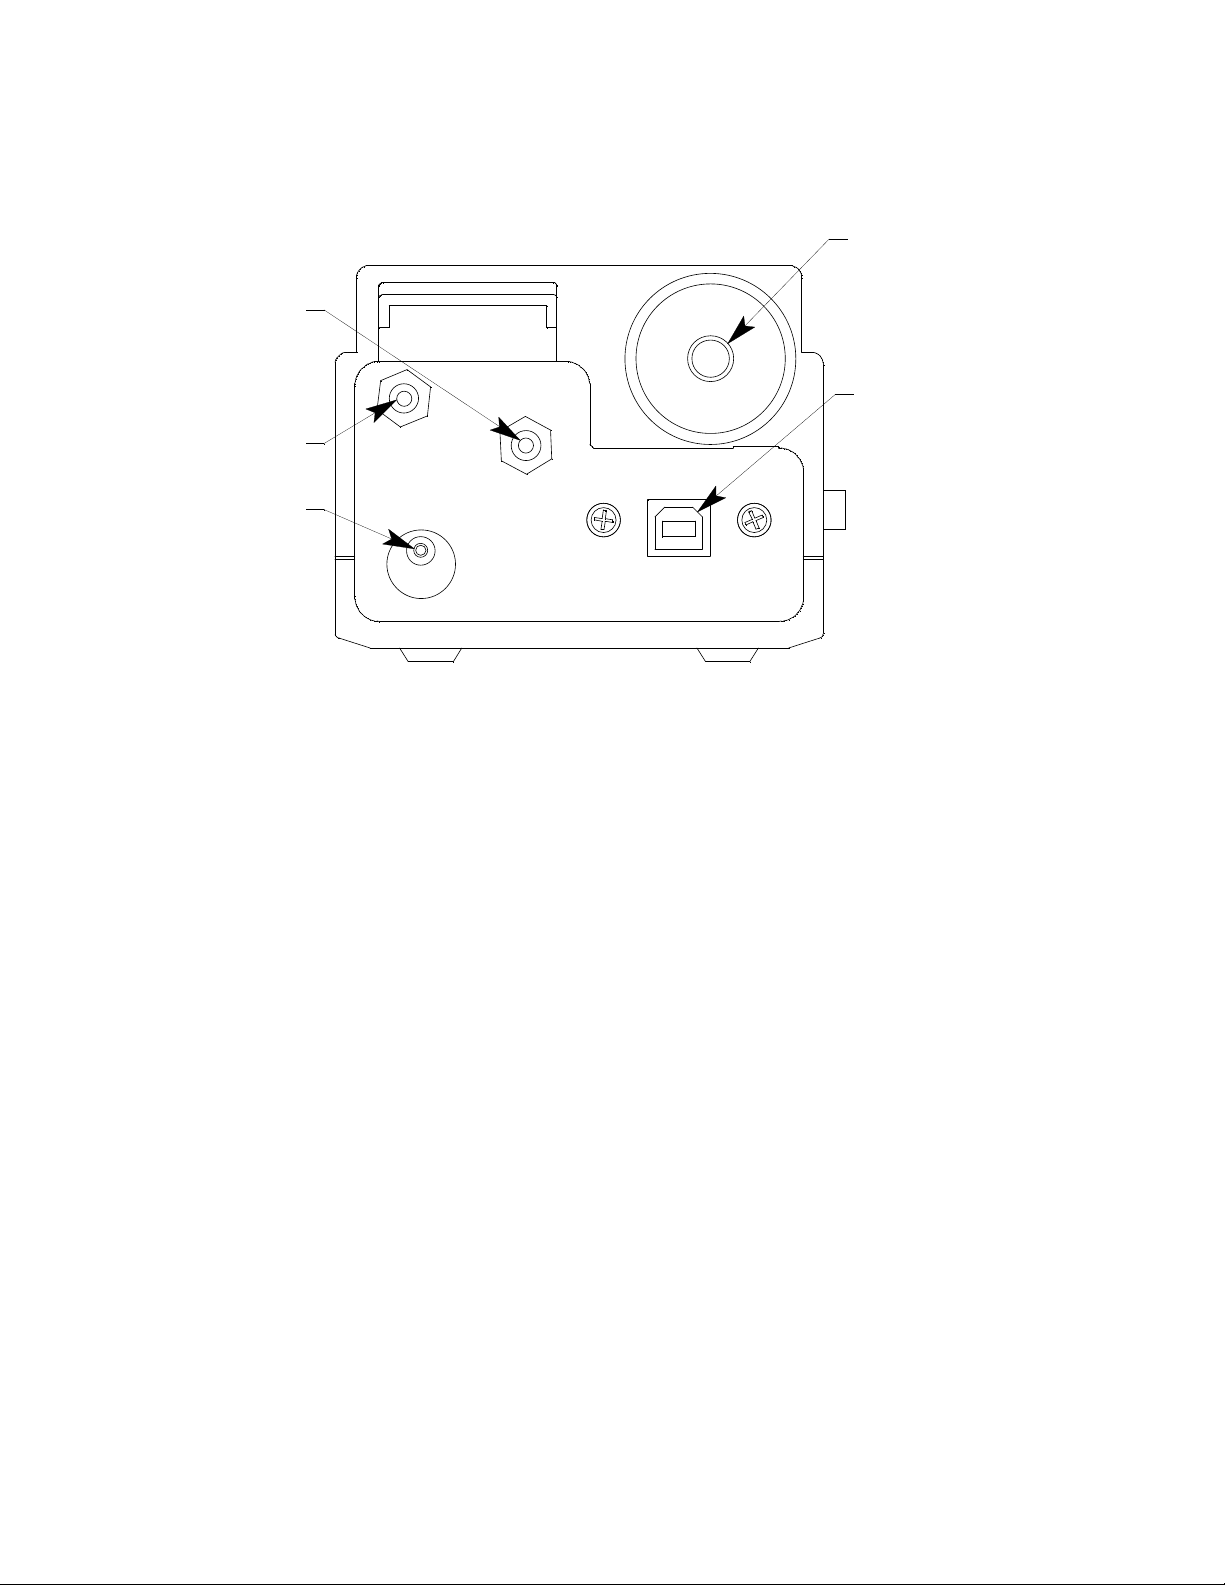
Figure 8: Back Panel
The back panel includes the power jack, sample fittings, and a USB PC connector.
Power Jack
The power jack is located in the bottom left corner of the back panel. The plug on the
end of the AC adapter cable mates to it.
Sample Fittings
Three sample fittings are located on the back of the SDM-2009. The AIR fitting is in
the upper left corner and draws air into the SDM-2009. The GAS fitting is to the right
of the AIR fitting and is used to connect the SDM-2009 to a calibration gas cylinder.
Both fittings accept 3/16 inch ID tubing.
An exhaust fitting is located in the upper right corner. It allows routing of the
exhausted calibration gas to a convenient location. This fitting accepts 5/16 inch ID
tubing. Even though the exhau st gas can be r outed to an area to b e safely disp ersed,
the docking station should still be installed in a well ventilated a rea.
PC Connection
A type B USB connection is located beneath the exhaust fitting on the SDM-2009’s
back panel. It is used to connect the SDM-2009 to a PC.
9 • Description
Page 15
Control Panel
CHARGE
1SEC ON
3SEC OFF
COPY
GX-2009 OFF
POWER
SDM-2009
BUMP CAL.
Control Buttons
EDIT
ENTER
BUMP LED
CHARGE LED
COPY LED
CAL LED
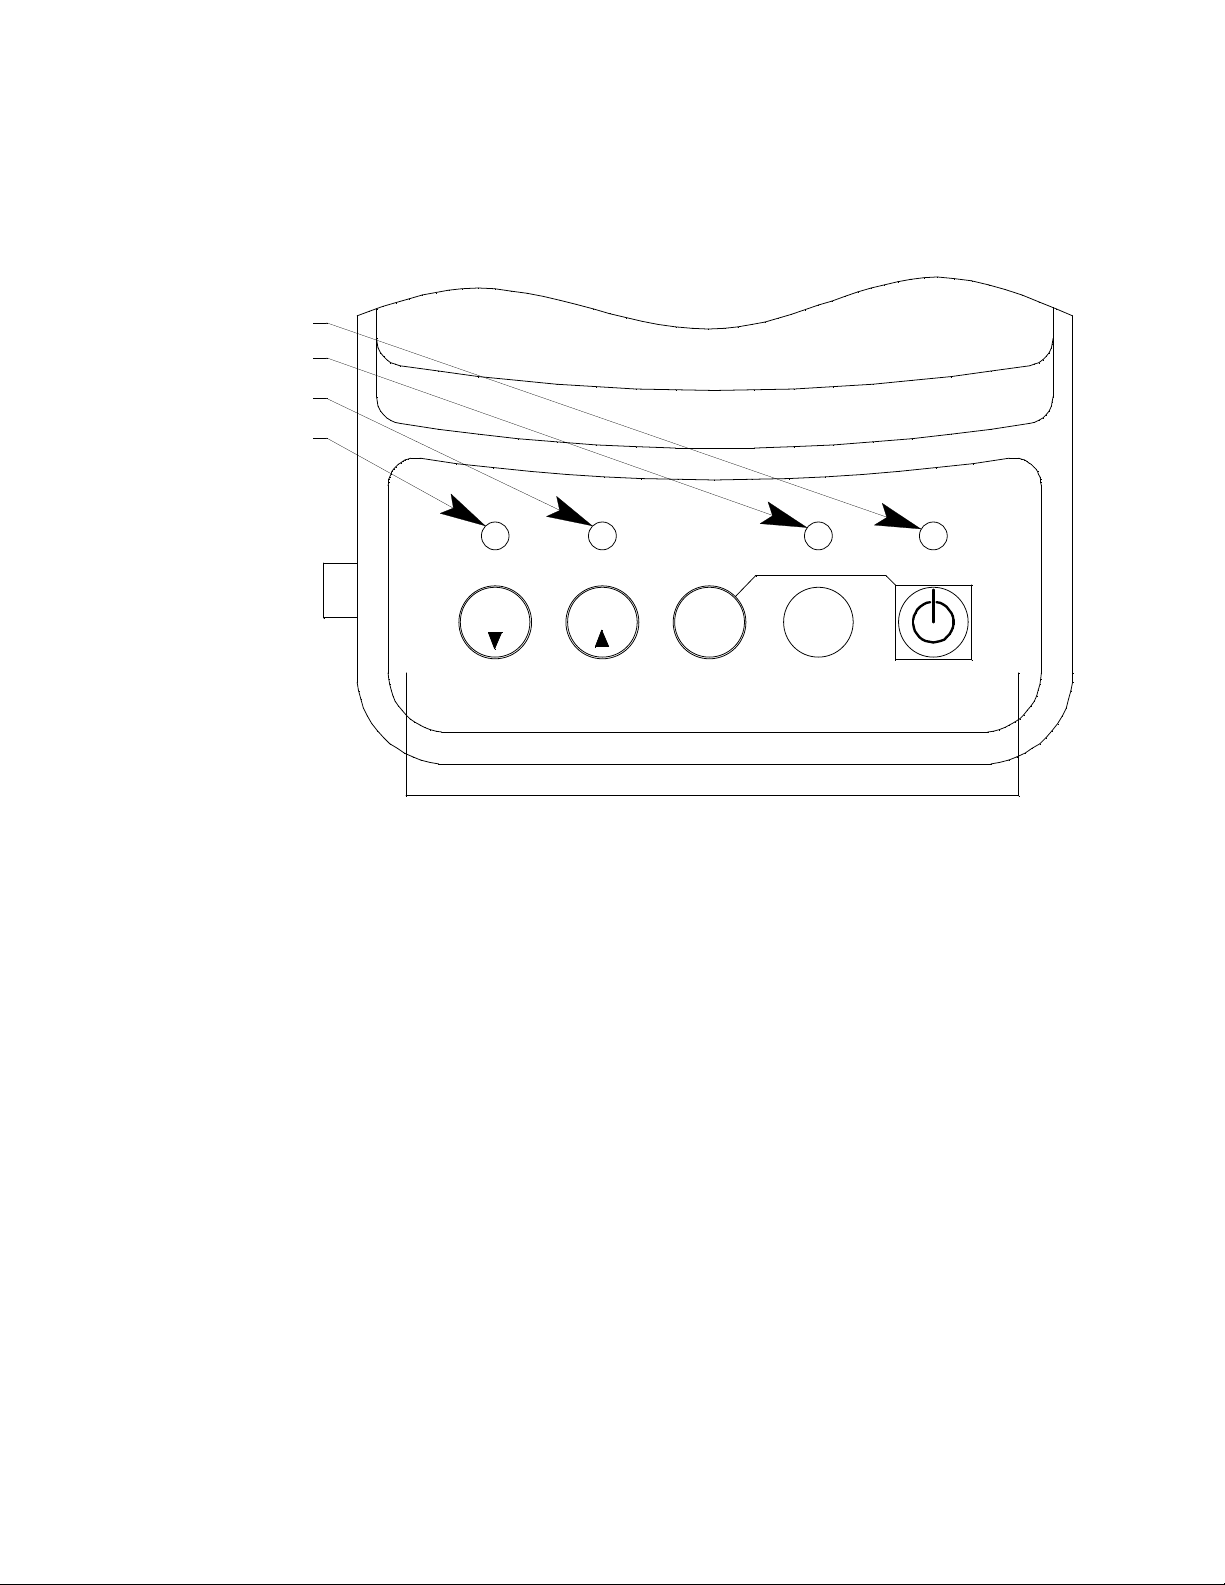
Figure 9: Control Panel
The control panel is us ed to setup and operate the docking station in the Standalone
configuration. It is located at the front of the docking station. It includes the control
buttons, the control button LEDs, and the CHARGE status LED.
Five control butto ns are located on the control p anel. From lef t to right the y are BUMP
T , CAL S , EDIT ENTER, COPY, and POWER. The BUMP T , CAL S , EDIT
ENTER, and COPY control buttons are not used in the PC Controlled configuration of
the SDM-2009. The BUMP T LED and CAL S LEDs indicate the results of bump
tests and calibrations, respectively. The COPY LED does not indicate anything in the
PC Controlled configuration but will be on if the SDM-2009 was used in the
Standalone configuration and calibration and bump test records are still stored in the
SDM-2009’s memory. The CHARGE LED is located above the POWER button and
functions as a pilot LED, a system failure LED, and a charge indication LED.
The POWER button turns the SDM-2009 on and off.
Description • 1 0
Page 16
Front Panel
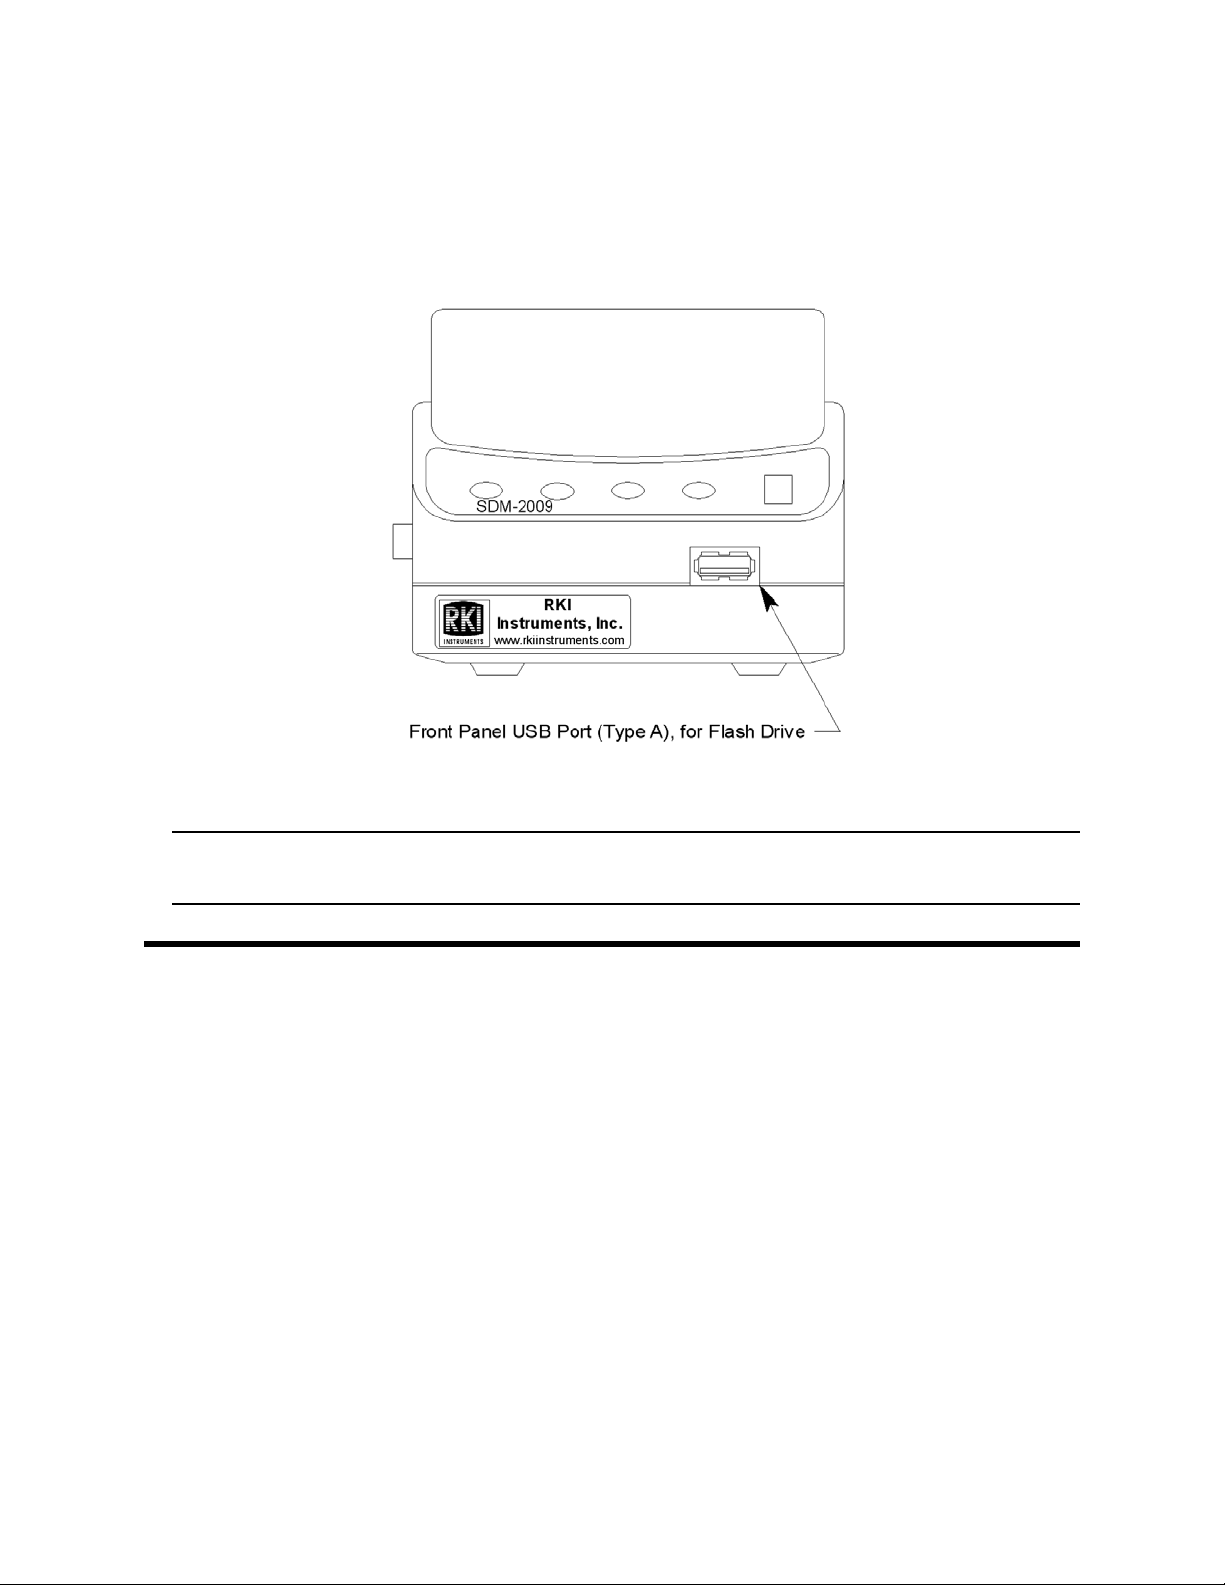
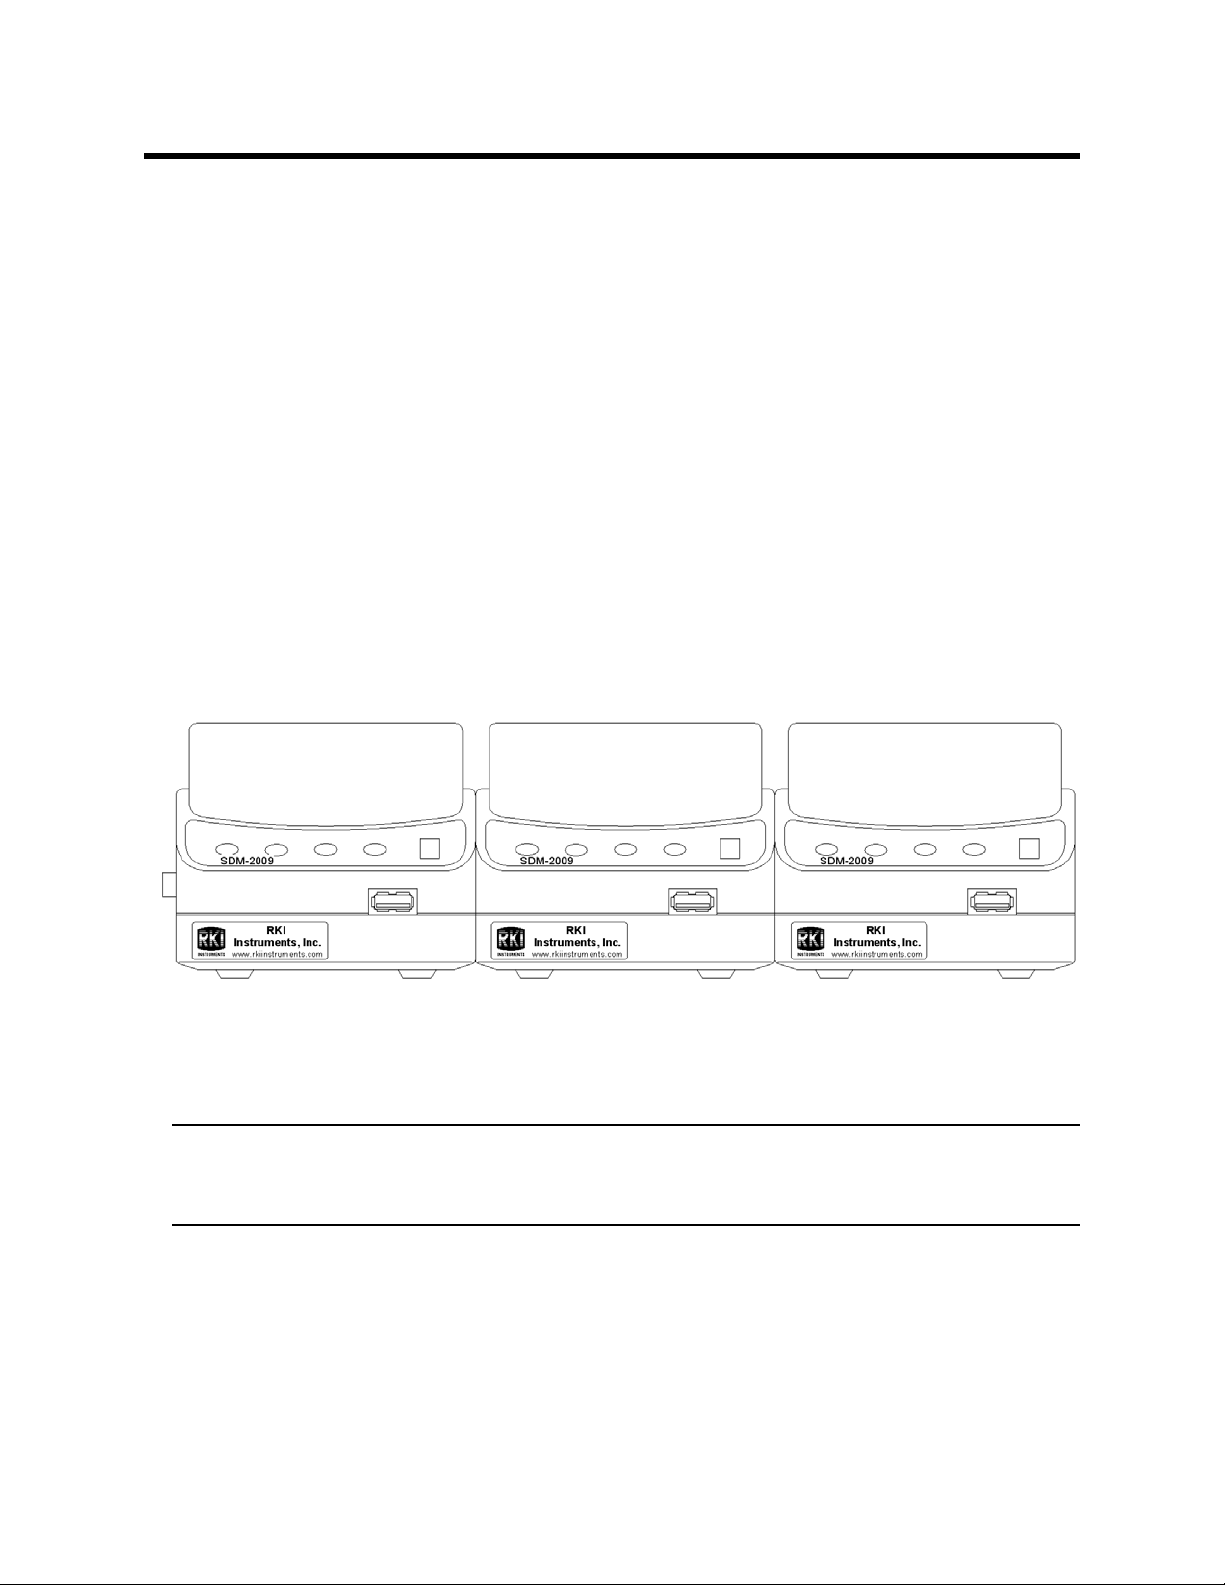
Figure 10: Front Panel
A type A USB port is located on the front of the docking station. This port can be used
to save calibration and bump test data to a USB flash drive. This USB port is for use
only in the Standalone configuration of the SDM-2009 and is not used in the PC
Controlled configuration.
NOTE: The SDM-2009 does not support connection of a computer to the front
USB port, only a USB flash drive.
USB Hub Requirements for Multiple
Station Systems
If you have more docking stations than you have available USB ports, you will need a
USB hub. RKI provides both a 4-port hub and a 7-port hub. If you have more than 7
docking stations, you will need to purchase one of each hub. Do not connect one hub
to the other. Make sure that each USB hub has its own USB port on your computer.
You may also purchase your own USB hub of any port number from your local
electronics store but it must meet the following requirements:
•USB 2.0
®
• compatible with your Windows
An AC adapter comes with the USB hub(s) sold by RKI but does not need to be
plugged in for SDM-2009 operation. If the hub will be used to charge other devices,
the AC adapter needs to be plugged in.
operating system
11 • USB Hub Requirements for Multiple Station Systems
Page 17
Hardware Setup
Figure 11: SDM-2009 Arrangement
This section describes how to assemble the hardware that came with the SDM-2009,
assemble a manifold, and connect calibration gas.
Hardware Assembly
The hardware assembly consists of connecting the AC adapter(s), installing the air
filter(s), installing the check valve(s), connecting the sample tubing and connecting
the USB cable(s). The SDM-GX Docking Station PC Controller software can support
1-10 SDM-2009 docking stations connected at the same time. Perform the following
steps to complete the hardware assembly for each SDM-2009:
1. Place the SDM-2009(s) on a convenient table top near an AC wall socket or
power strip in a well ventilated area. A location near a window that can be
opened is best so that the exhaust can be routed to the window.
2. If you have more than one SDM-2009, arrange them side by side as shown in
Figure 11 below. Each docking station has three connection tabs on the left
side near the bottom of the station and three connection recesses on the right
side near th e bottom of the station. The tabs from one docking statio n can be
pushed into the recesses on another station to mechanically connect the
docking stations.
3. Insert the round plug on the end of each AC adapter’s cable into the power
jack on the back of each SDM-2009.
NOTE: If you have multiple SDM-2009s and are using a 4-port AC adapter,
plug each of the round plugs on the end of the AC adapter into the
power jack on th e back of 4 separate SDM-2009s.
4. Connect the AC adapter’s wall plug into a wall AC socket or power strip.
5. Install th e air filter to the AI R fitting of ea ch SD M-2009 so that th e ar row on the
filter that in dicates dir ection of fl ow is poin ting toward s t he AI R fitt ing. Push the
open end of the flexible tube that is on one end of the filter onto the AIR fitting
on the back of the SDM-2009.
6. Install the 10 foot long 5/16 inch ID flexible tube that is included with each
Hardware Setup • 1 2
Page 18

SDM-2009 on the exh aust fitting of e ach SDM-2009 . Route the t ube to an area
where the exhaust can b e safe ly d isperse d, such as an ope n w indow. Exhaust
tubing from multiple units can be daisy chained together in a manifold for more
convenient operation. In this case, the check valves that are provided with th e
docking stations need to be used. See "Assembling a Manifold for Multiple
SDM-2009 Units" below for instructions.
CAUTION: The maximum recomme nded le ngth for th e exha ust tube is 10 feet. Do
not use more than 10 feet of tubing or tubing with an ID of less than
5/16 inch for the exhaust tube or the bump test and calibration
accuracy will be adversely affected. The exhaust tube that is shipped
with the SDM-2009 has an ID of 5/16 inch and is 10 feet long.
7. Install the 3 foot long 3/16 inch ID tube that is included with the SDM-2009 on
the GAS fitting. GAS tubing from multiple units can be daisy chained together
in a manifold for more convenient operation. See "Assembling a Manifold for
Multiple SDM-2009 Units" below for instructions.
8. Connect the provided USB cord from the type B USB port on the bac k of the
SDM-2009 to an available USB port on your computer or to a USB hub that is
connected to your computer. See “USB Hub Require ment s for M ultipl e Station
Systems” on page 11 for more information about USB hubs.
Assembling a Manifold for Multiple SDM-2009 Units
Up to 10 SDM-2009s can b e manifo lde d toget her. The GAS fitting can be manifolde d
to allow the stations to draw from one calib rati on cyli nd er. The exhaust line s ca n al so
be manifolded together and be routed away from the docking stations with only one
10 foot long 5/16 inch piece of tubing.
Each SDM-2009 is sh ipped with exha ust tubing, GA S tubing, T-fittings in two differ ent
sizes, and a check valve.
Exhaust Tubing
Reference Figure 12 for the in structions below.
1. Cut a 1- 2” pi ece o f 5/ 16 in ch tubi ng fo r each SDM- 2009 a nd con ne ct it to each
unit’s exhaust fi tting.
2. Connect the provided check valves to the short pieces of tubing already
installed at the exhaust fittings. Be sure that the arrows that appear on the
check valve are pointing away fr om the exhaust fitting.
3. Cut a 2-3” piece of 5/16 inch tubing for every SDM-2009 except the first one
and connect it to the other end of the check valve.
4. Insert the larger T-fittings into the tubing so that the remaining two ports on the
T-fitting are perpendicular to the exhaust tube and check valve.
5. For the first SDM-2009, cut a 9-10” piece of 5/16 inch tubing and connect it
from the check valve on the first SDM-2009 to the closest port on the second
SDM-2009’s exhaust T-fitting.
13 • Hardware Setup
Page 19
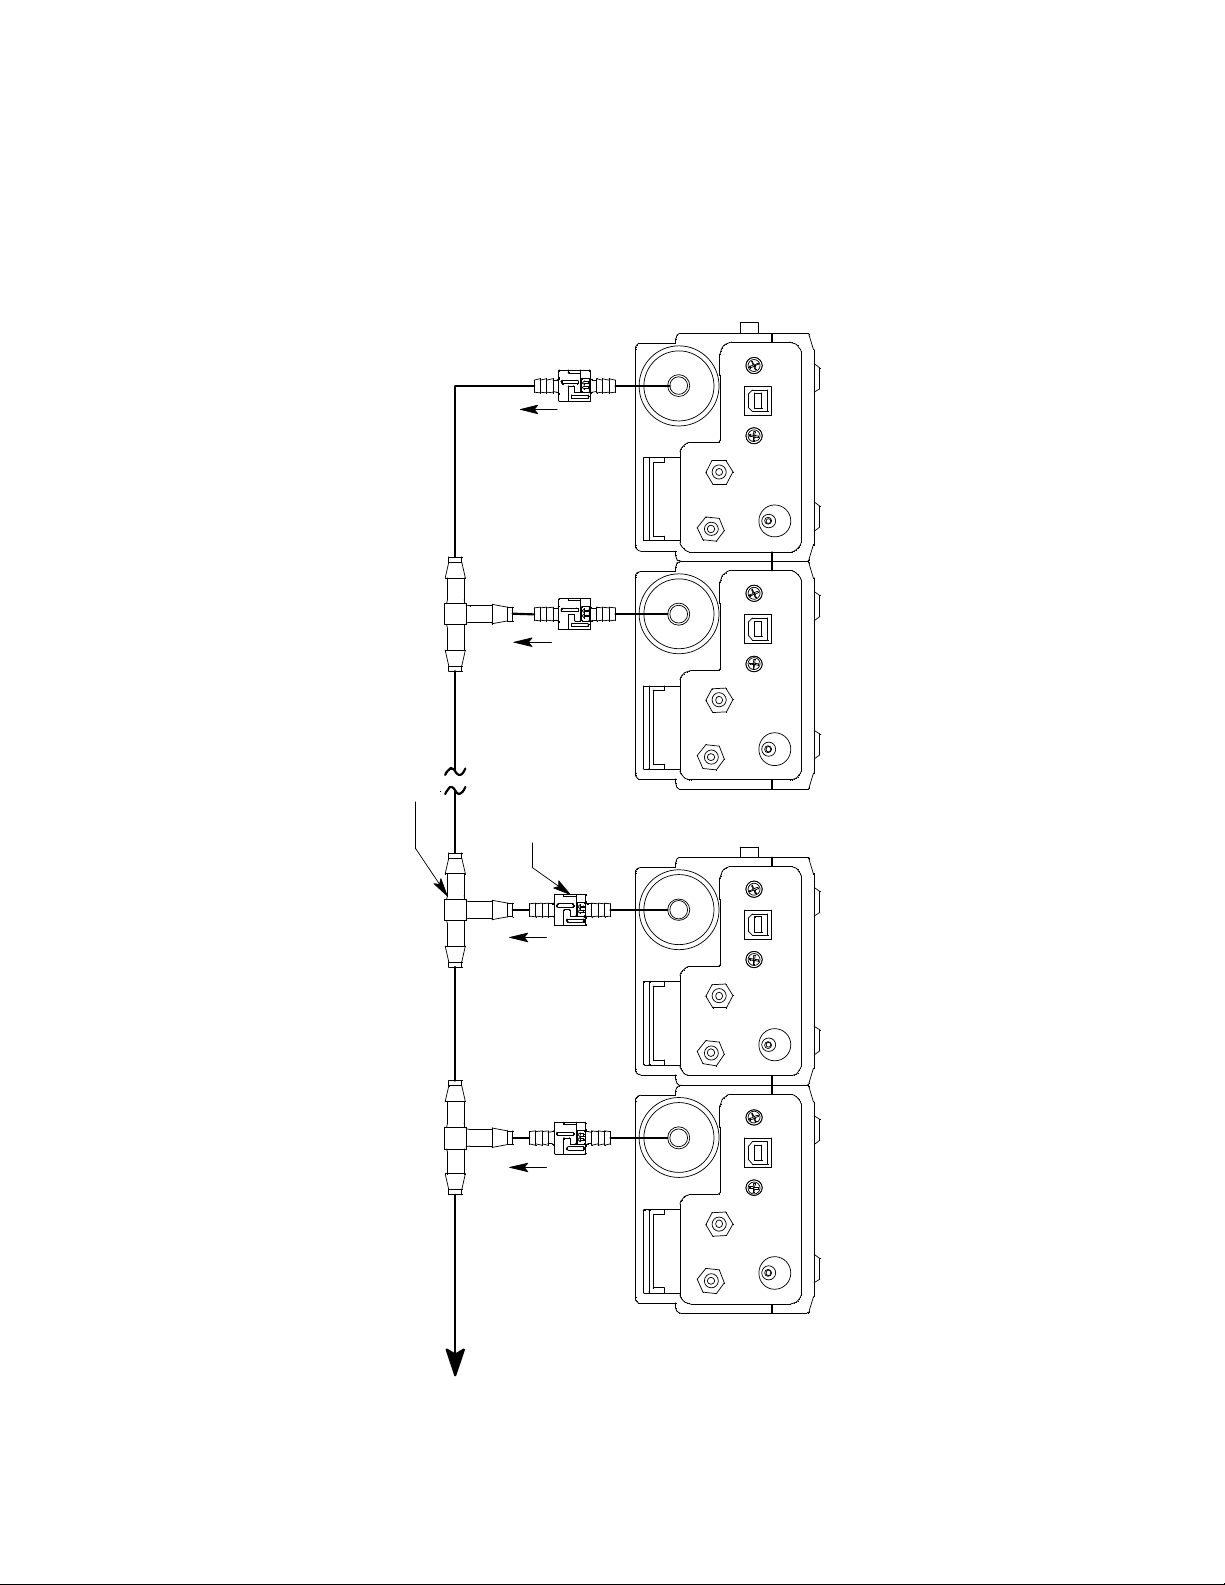
6. Use one of the provided 10 foot lengths of tubing and connect it to the T-fitting
7 inches
T-Fitting
10 Foot Max
Exhaust Tube
To Op en Are a
9 inc hes
AIR
GAS1
GAS1
Unit 2Unit 10
Check Valve
Unit 9
GAS1
AIR
AIR
GAS1
AIR
Unit 1
Figure 12: Exhaust Tubing Connections
on the last SDM-2009 . The maxim um recomm ended e xhaust tub e lengt h is 10
feet.
7. For the r emaini ng SDM- 2009s, cut 6-7” pi eces of 5/16 inch tubing and con nect
the remaining T-fittings.
Hardware Setup • 1 4
Page 20

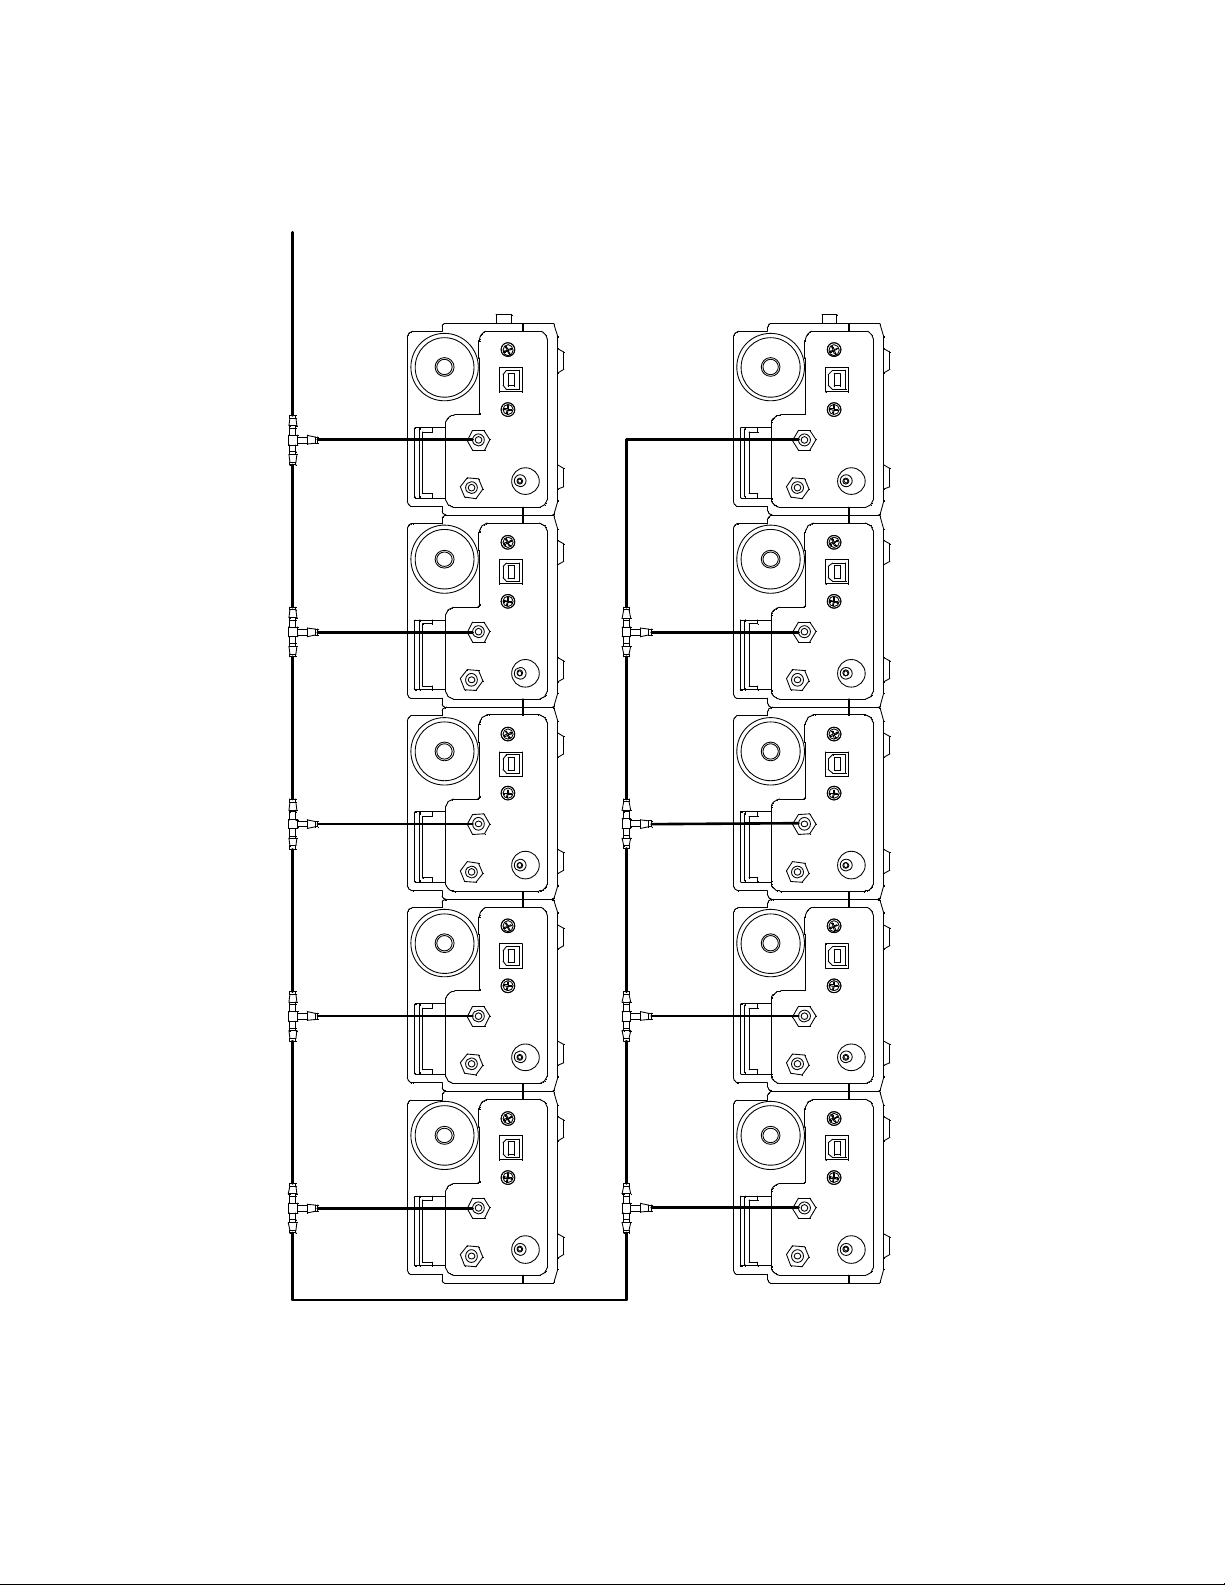
GAS Tubing
Reference Figure 13 for the instructions b elow.
1. Cut a 3-4” piece of 3/16 inch tubing for each GAS fitting on every SDM-2009
except the last one.
2. Connect the tubing to the GAS fitting on every SDM-2009 except the last one.
3. Insert the smaller T-fittings into the tubing so that the remaining two ports on
the T-fitting are perpendicular to the GAS fitting.
4. Cut 6-7” pieces of 3/16 inch tubing and connect the T-fittings.
5. Cut o ne m or e 6- 7” piece of 3/16 inch tubing and conne ct th e GAS fitting of the
last SDM-2009 to the T-fitting from the second to last SDM-2009.
6. Cut 1 piece of 3/16 inch tubing long enough for easy access to the calibration
cylinder and connect it to the T-fitting on the first SDM-2009.
15 • Hardware Setup
Page 21
Unit 1
Unit 10
Unit 2
Unit 9
GAS1
Unit 6
Unit 5
AIR
GAS1
GAS1
GAS1
AIR
GAS1
AIR AIR
GAS1
GAS1
AIR AIR
AIR
GAS1
GAS1
AIR
AIR
GAS1
AIR
Unit 7
Unit 4
Unit 8
Unit 3
Figure 13: Gas Manifold Connections
Hardware Setup • 1 6
Page 22

Connecting Calibration Gas
The GAS fitting on the back of the docking station is designed to be used with a
calibration gas cylinder that is fitted with a demand flow regulator. The AIR fitting may
be used with a demand flow regulator and a cylinder of zero emissions air, but this is
not normally necessary since the docking station will generally be in a fresh air area.
The type of calibratio n g as cyli nd er u s ed de pen ds on the gas sensors installed in the
instrument bein g used with th e calibration station . A 4-gas mix, LEL/Oxygen/CO/H2S,
is used if the instrument being used with the calibration station is a 4-gas unit. If the
instrument does not have an H2S channel, then a 3-gas mix, LEL/Oxygen/CO, is
used. Although a 4-ga s cylinder will work for an instrume nt of any gas combina tion, if
you have multiple instruments with various gas combinations, you may want to keep
a 4-gas cylinder a nd a 3-gas cylinder to help preserve the charcoal filter on the CO
sensor in instruments without an H2S channel. Use Table 2 below as a guide in
determining which calibration gas cylinder is appropriate for your system. See “S pa re
Parts List” on page 108 for a list of available cylinder part numbers.
Table 2: Recommended Gas Cylinders
Typical Instrument Types
Recommended Calibration Gas
Cylinder(s)
LEL/Oxy/H2S/CO 4-gas mix with CH4/Oxy/H2S/CO
LEL/Oxy/CO 3-gas mix with CH4/Oxy/CO
LEL/Oxy/H2S 4-gas mix with CH4/Oxy/H2S/CO
LEL/Oxy 3-gas mix with LEL/Oxy/CO
Oxy/CO 3-gas mix with LEL/Oxy/CO
Oxy/H2S 4-gas mix with LEL/Oxy/H2S/CO
To connect calibration gas to the SDM-2009, do the following:
1. If the area around the docking station is not considered a fresh air area (an
area free of combustible and toxic gases and of normal oxygen content,
20.9%) install a tube not longer than 10 feet on the filter attached to the AIR
fitting on the back of the docking station and route it to a fresh air area or
connect a cylinder of zero air with a demand flow regulator to the AIR fitting.
2. Install the demand flow regulator on the calibration gas cylinder.
3. Connect the demand flow regulator to the GAS inlet fitting using the 3 foot
length of 3/16 inch ID sample tubing provided with the docking station.
17 • Hardware Setup
Page 23

EAGLE 2 and GX Type Instrument Connection
There are 2 different versions of the Docking Station PC Controller program. The
SDM-E2 Docking Station PC Controller program is intended for use with SDM-E2
docking stations and EAGLE 2 instruments. The SDM-GX Docking Station PC
Controller program is intended for use with GX t ype docking stations and GX type
instruments.
Bump tests and calibrations can be performed on multiple EAGLE 2s and GX type
instruments at the same time. The SDM-E2 Docking Station PC Controller program
controls the EAGLE 2 functions while the SDM-GX Docking Station PC Controller
program controls the GX type instrument functions. Both programs can be used
simultaneousl y on your PC. Fo llow all i nstructions i n the SDM- E2 Docking Station PC
Controlled Conf iguration Op erator’s Manual as well as th e instructions in thi s manual.
Installing the SDM-GX Docking Station
PC Controller Software
1. Launch Windows®.
2. Exit from all applications and open windows.
3. There are two ways to install the SDM-GX Docking Station PC Controller
Software: by using the SDM-2009 product CD or by using the SDM-GX
Docking Station PC Controller Software Installation CD.
• If you are using the SD M-2009 Produc t CD, insert the Product CD int o your
computer’s CD-ROM drive. The CD will automatically open revealing
several folders. Open the S DM-GX Docking S tation PC Controller Software
folder, double click on setup.exe and continue with step 4.
• If you are using the SDM-GX Docking Station PC Controller Software
Installation CD, it will automatically begin the installation process. Insert it
in your computer’s CD-ROM drive, then continue with step 4.
4. The SDM-GX Docking Station PC Controller InstallShield Wizard comes up to
guide you through installation. Click Next to proceed to the License Agreement
window.
5. Read the license agreement and click the agreement acceptance selection
box, then click Next to proceed to the Customer Information window.
6. Enter a user name and organization and select if you want to install the
program for all users on the computer or just for your user account, then click
Next to proceed to the Destination Folder window.
7. The default installation folder (C:\Program Files\SDM-GX\) is displayed. If you
want to install the software in the default folder continue with step 8. If you
want to install the software in a different location, click Change and choose a
new installation folder and then continue with step 8.
8. Click Next to proceed t o the Ready to Install the Program window.
EAGLE 2 and GX Type Instrument Connection • 1 8
Page 24
9. Review the installation settings. If they are OK, click Install and the installation
process will begin. If you want to change installation settings, click Back and
change them to the desired settings.
10. During software installation, the installation program may find newer versions
of Windows files on your computer than those in the Installation CD. If this
happens, the installation software will ask you if you want to keep these newer
files. Click Yes to do so.
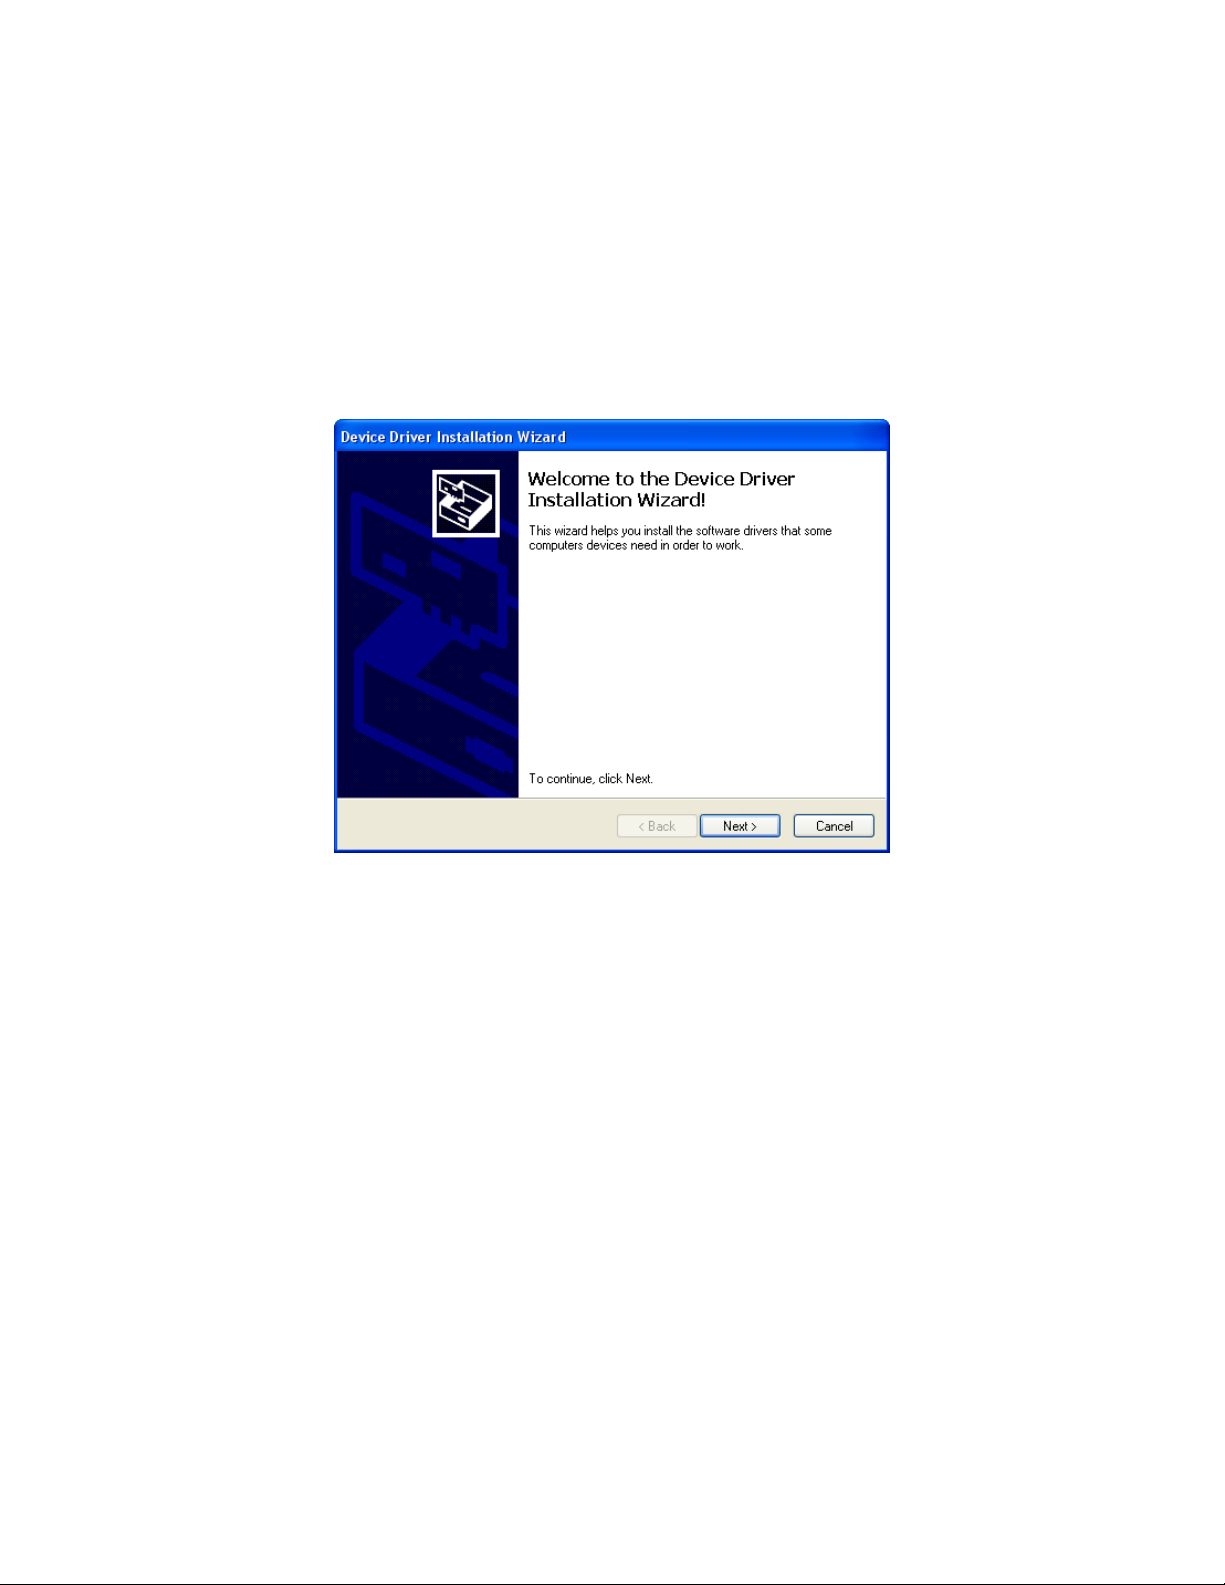
11. A Device Driver Window will appear prompting you to install necessary drivers.
You cannot continue the installation without installing the drivers.
Figure 14: Device Driver Installation
12. Click Next to install the drivers. The Wizard will find the appropriate drivers.
19 • Installing the SDM-GX Docking Station PC Controller Software
Page 25
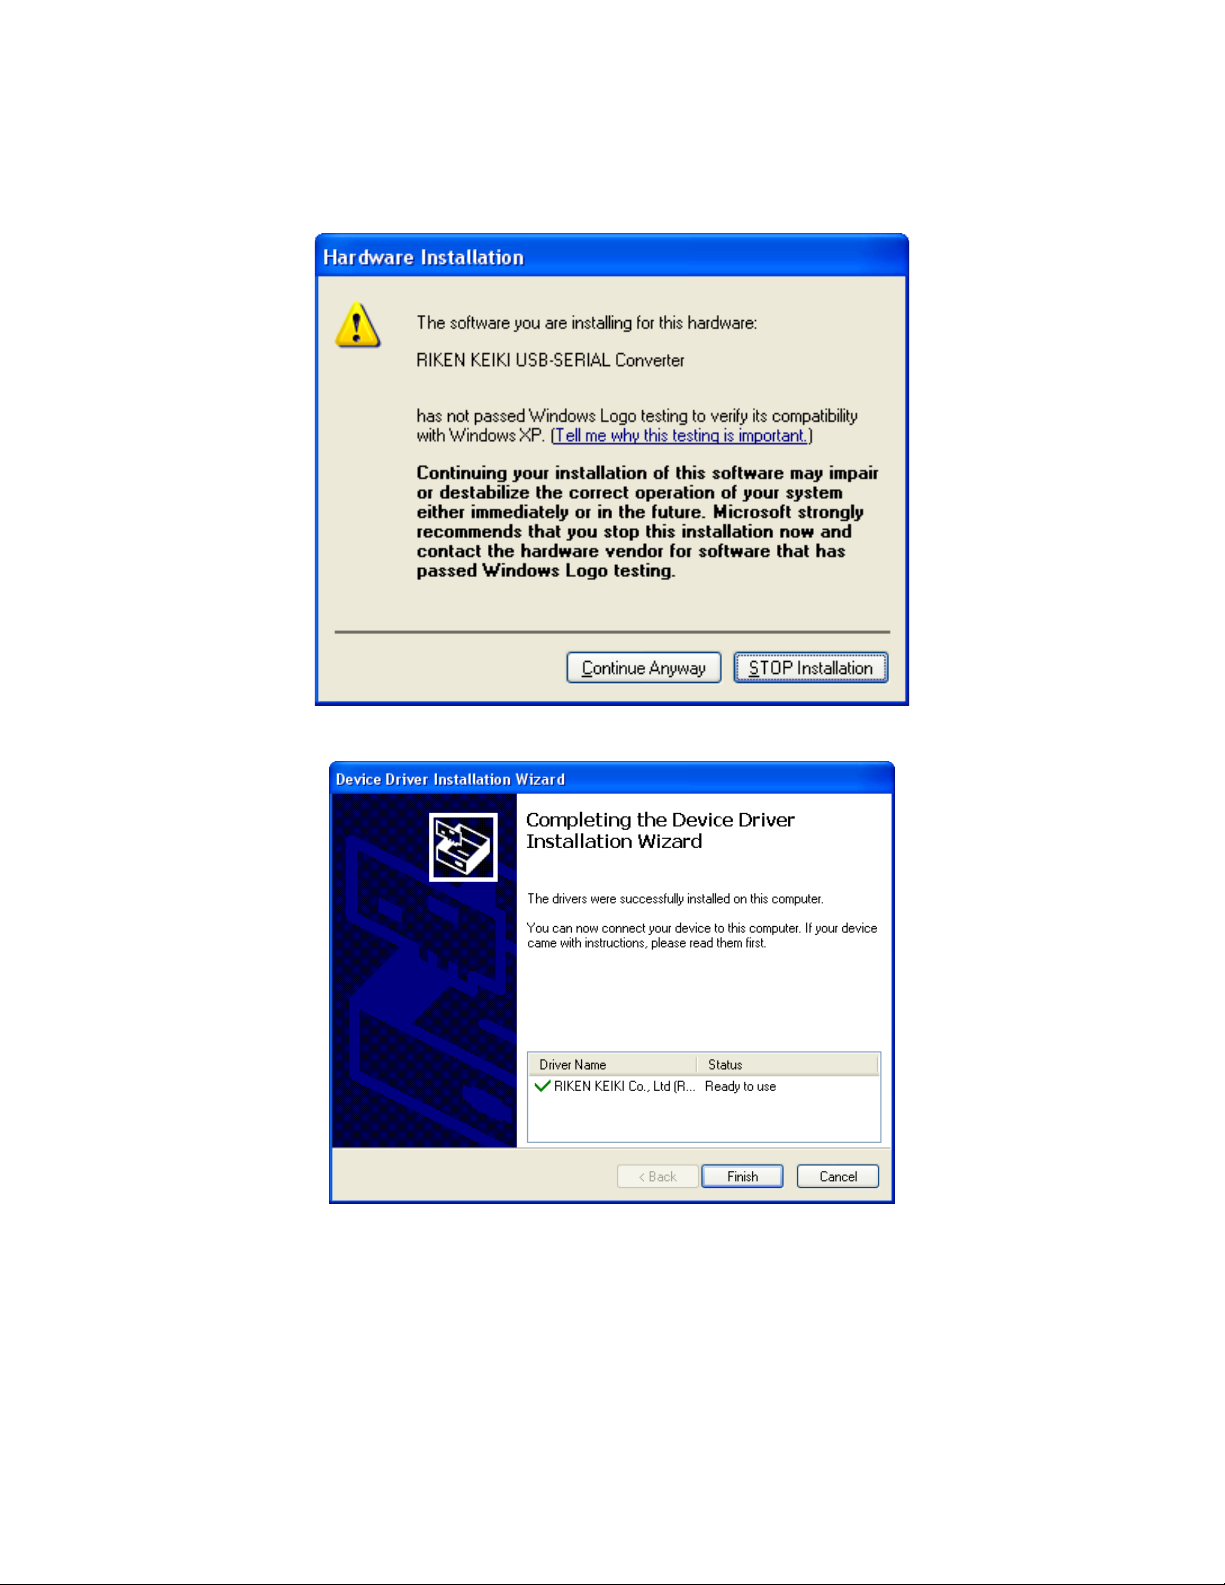
13. If this is the first time you are installing a PC Controller Program, a window will
appear saying that the file did not pass Windows logo testing. Click Continue
Anyway.
14. Click Finish once the drivers are successfully installed.
Figure 15: Finish Device Driver Installation
The installation will continue.
15. Follow the on-screen instructions to complete software installation.
16. To complete the driver installation, ensure that all of your docking stations are
connected to your computer.
Installing the SDM-GX Docking Station PC Controller Software • 20
Page 26
17. Turn on a docking station by pressing and holding the POWER button for at
least 1 second.
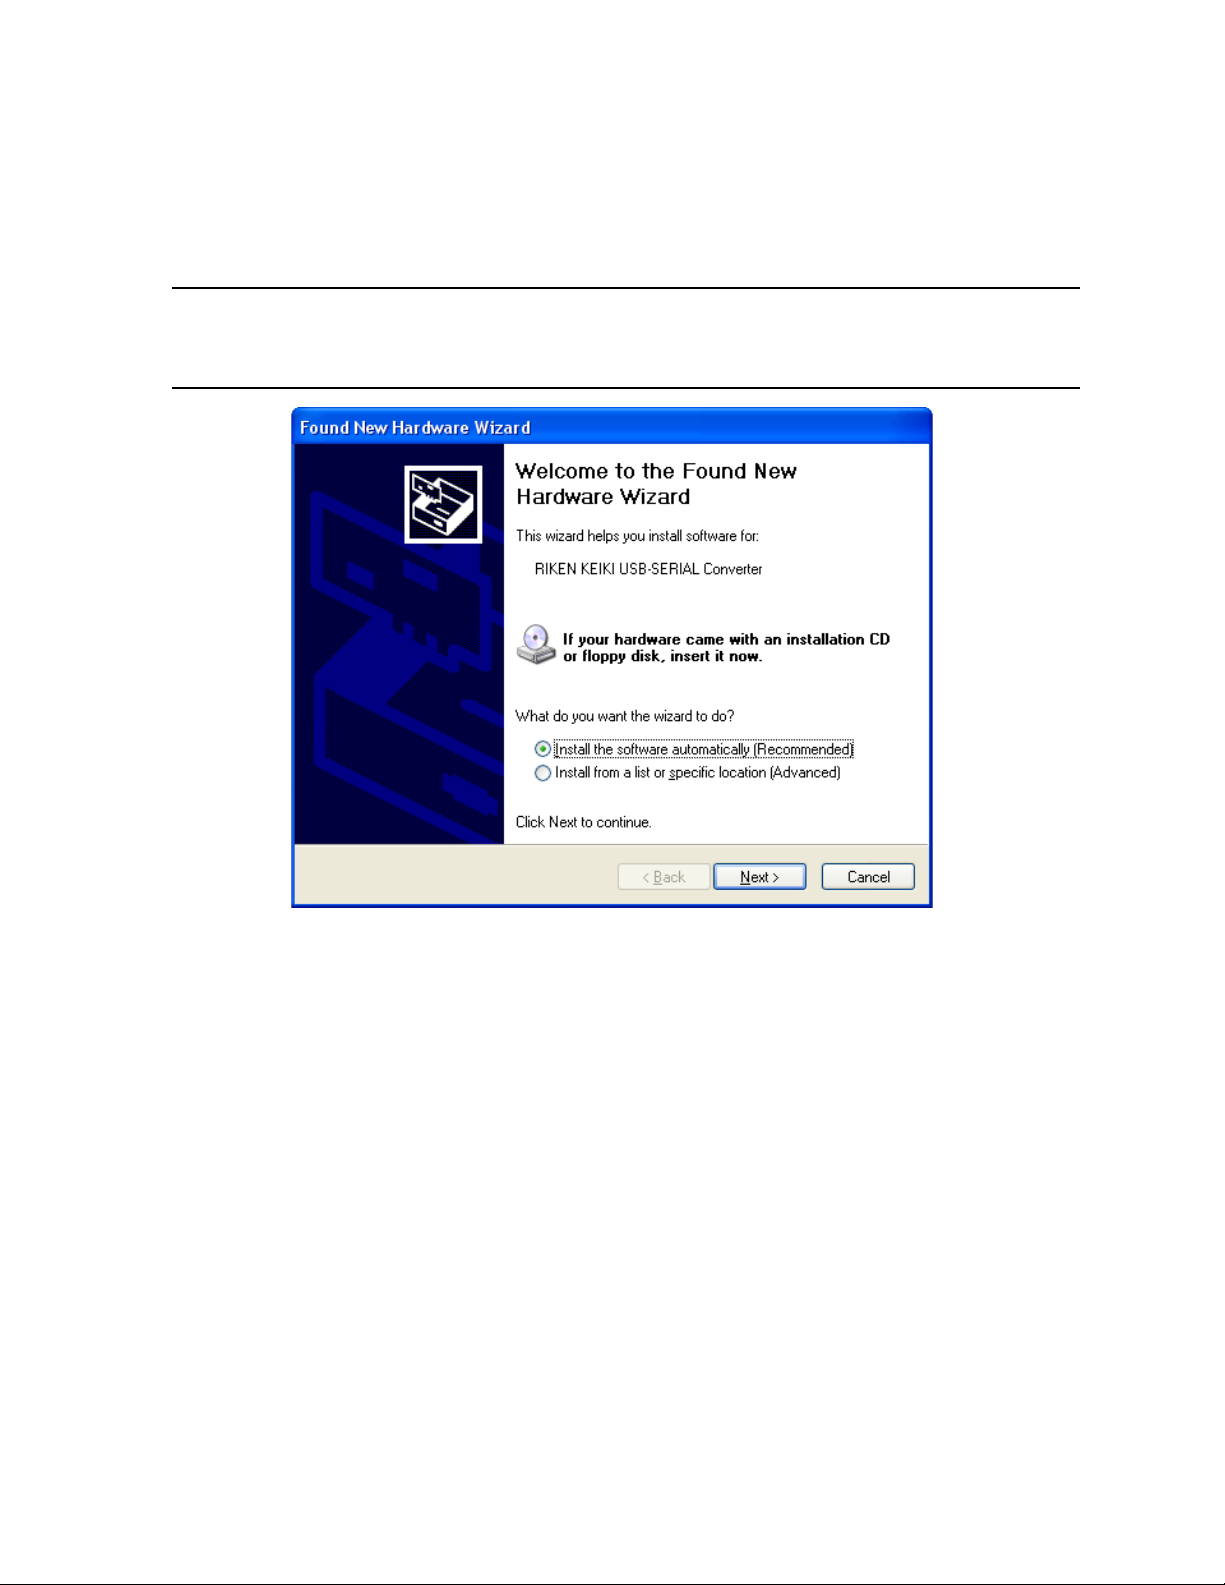
18. The first time an SDM-2009 is turned on after being connected to the
computer, a Found New Hardware window will appear.
NOTE: The following instructions do not apply to computers running Windows
Vista or Windows 7. The hardware driver will automatically in stall and
you will be notified that the USB device is ready for use.
Figure 16: Found New Hardware Wizard
19. Select the “Install the software automatically” option and click Next.
21 • Installing the SDM-GX Docking Station PC Controller Software
Page 27
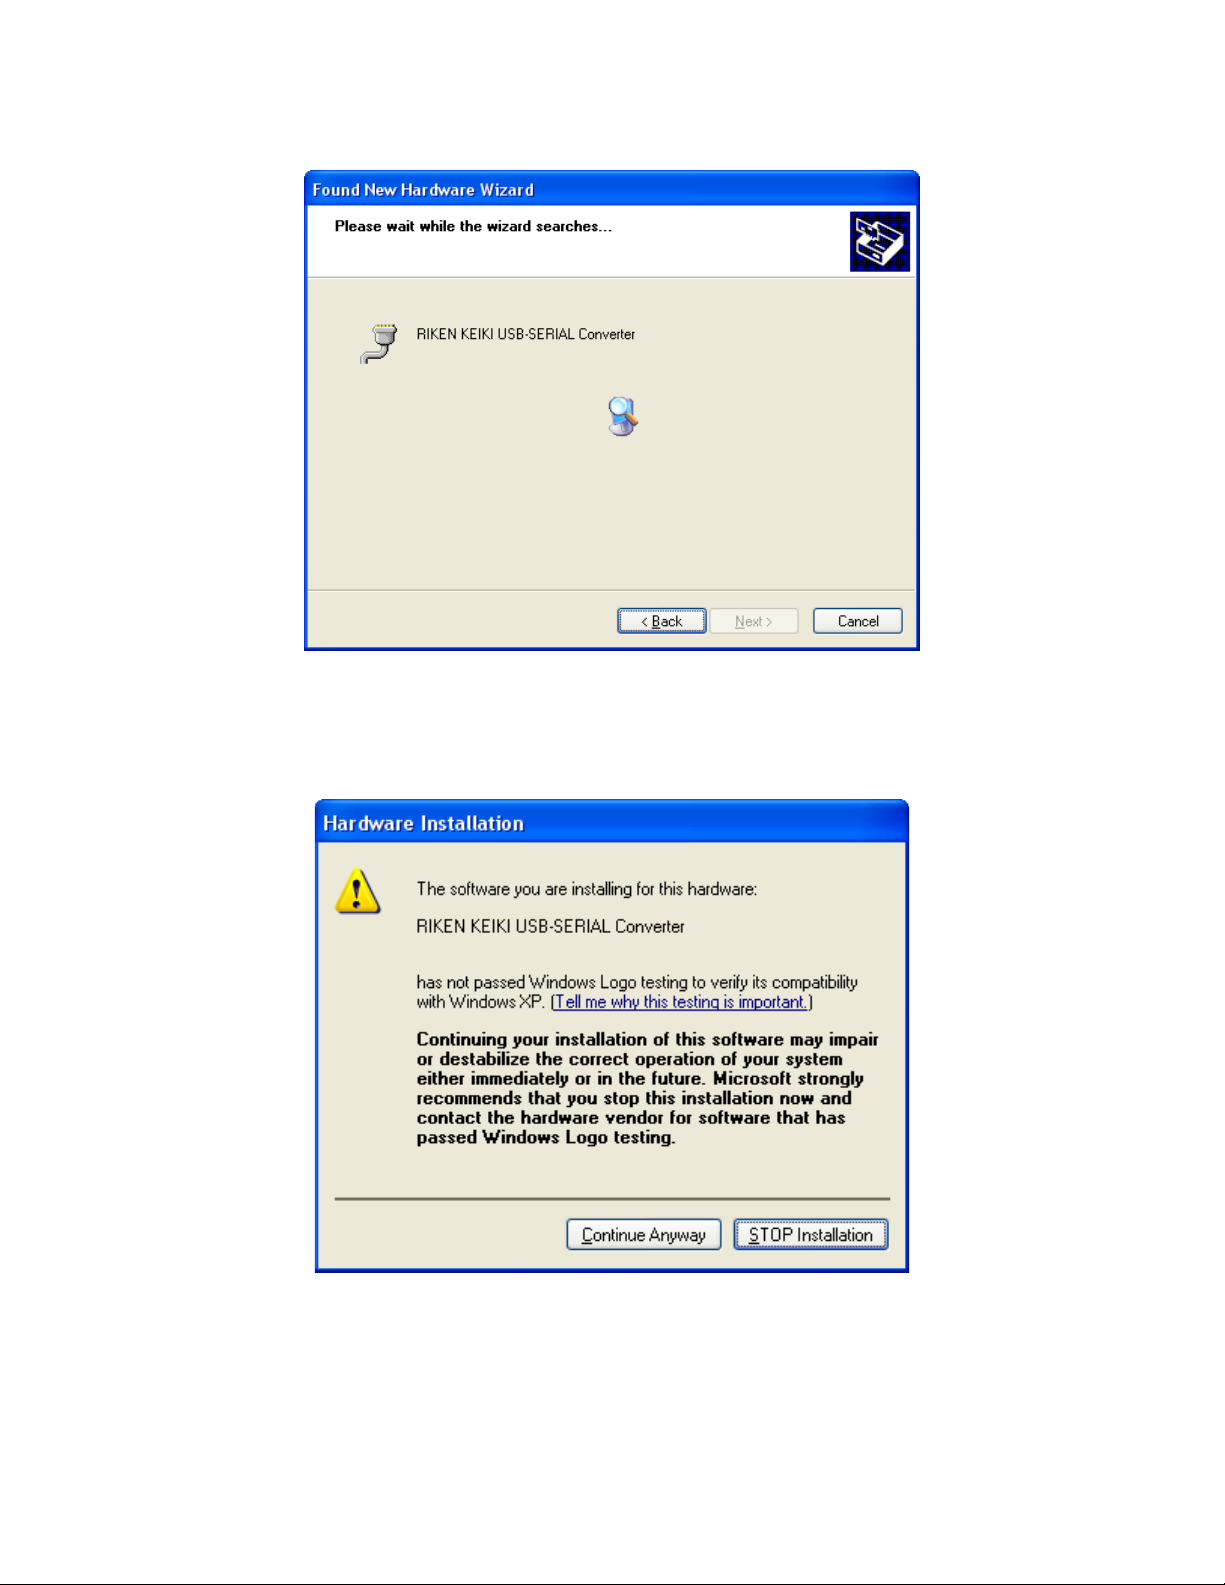
20. The wizard will search for the driver files.
Figure 17: Searching
21. Once the files have been found, a window will appear saying that the file did
not pass Windows logo testing. Click Continue Anyway.
Figure 18: Windows Logo Error
22. The installation will continue. Click Finish when the installation has comple ted.
23. Repeat steps 17 through 22 for every docking station in your system.
Installing the SDM-GX Docking Station PC Controller Software • 22
Page 28
Launching the SDM-GX Docking Station
PC Controller Program
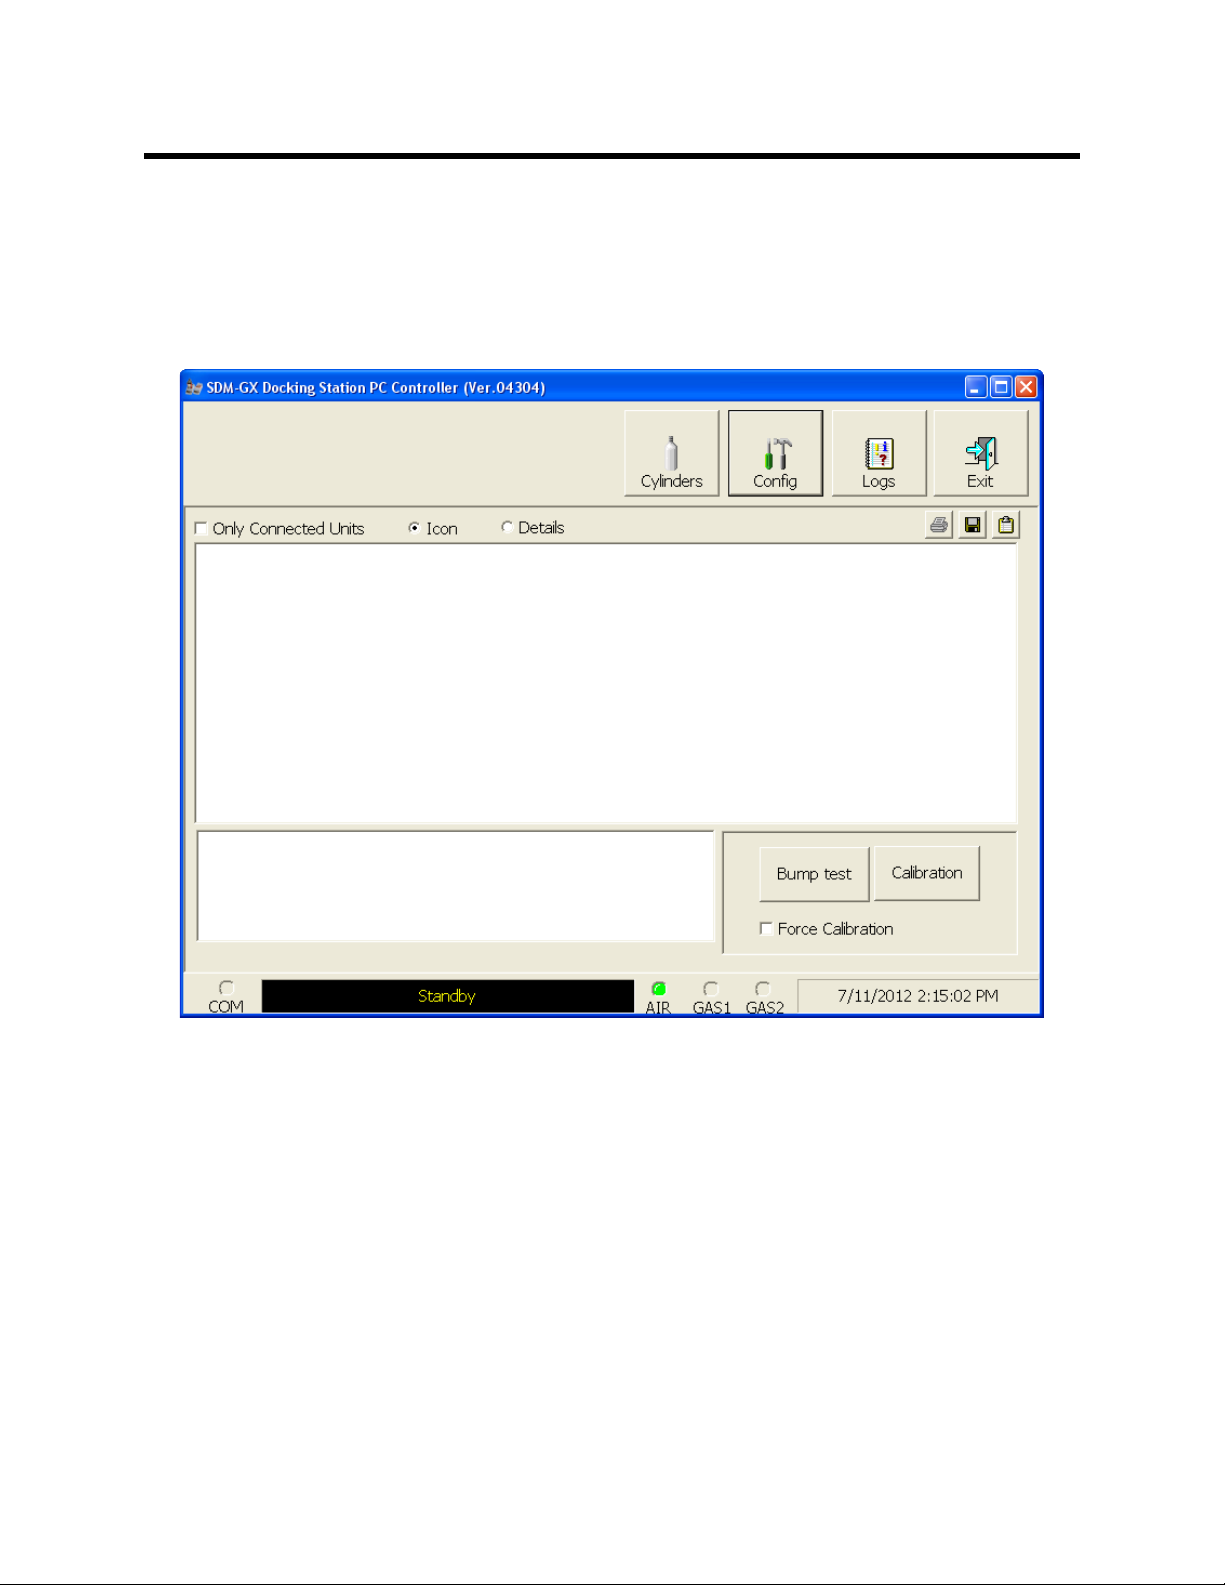
1. Click Start on the Windows Icon Tray, then select Programs/SDM-GX
Docking Station PC Controller. You may also double click the shortcut
created on yo ur desktop. The SDM-GX Docking Station PC Controller
Program is launched and the main program window appears.
Figure 19: Main Program Window
2. If you are starting the software for the first time, a message window appears
informing you that a database has been created. Click OK in that window.
When starting the software for the first time, or if you wish to change the
software setup, proceed to the next section, "Overview of the SDM-GX
Docking Station PC Controller Program".
If you have al ready performed the software setup, proceed to “Connecting
Instruments to the PC Controller Program” on page 36.
23 • Launching the SDM-GX Docking Station PC Controller Program
Page 29

Overview of the SDM-GX Docking Station PC
Controller Program
This section pr ovides a brief overview of the program and a description of the main
program window. Instructions for using the program are given in other parts of this
manual. Use this section to become familiar with the main program window, but
before attempting to use the program, make sure to perform the program setup as
described in “Setting Up the PC Controller Program” on page 26.
The PC Controller Program is designed to provide manual or automated data
downloading, bump testing, and calibration of the GX-2009. It also provides the
capability to update instrument parameters such as alarm points. The program
compiles a database of the instruments that have been connected to the program
which consists of calibration and bump test history, logged data (if a unit’s data is
downloaded), an d memos that record user entered information about an ins trument
at a particular time.
The GX-2009 is a gas monitoring device for combustible gas, O2, H2S, and CO. It
stores logged data and calibration information in its internal memory. See the GX-
2009 Operator’s Manual for a complete description of the GX-2009.
PC Controller Program Functions
The PC Controller Program has the following basic functions accessed or controlled
by buttons in the main program screen.
• Gas cylinder setup accessed by the Cylinders control button
• Program and system configuration accessed by the Config control button (this
function is password protected)
• Data viewing accessed by the Logs control bu tton
• Instrument bump testing controlled by the Bump test control button
• Instrument calibration controlled by th e Calibration control button
Overview of the SDM-G X Docking Station PC Controller Program • 24
Page 30
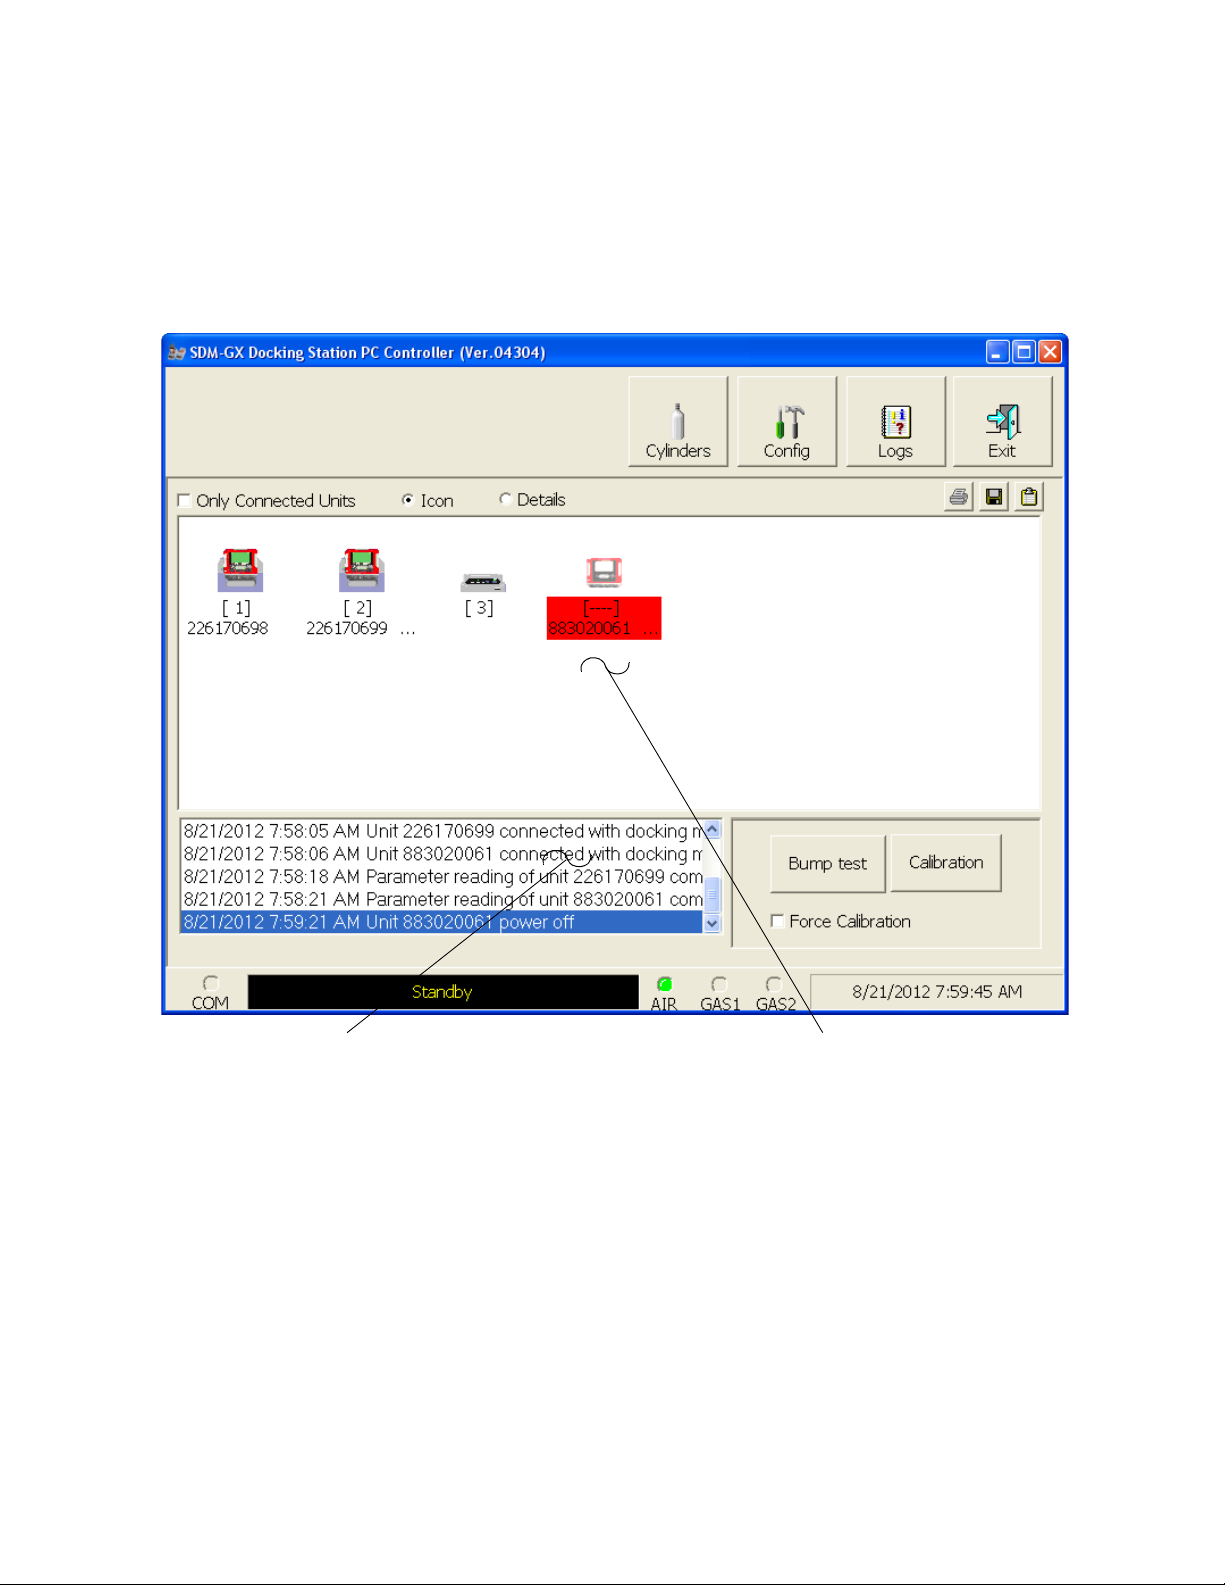
Main Program Window
Message Area
SDM-2009/Instrument
Display Area
The main program window is where the current status of the program operation is
shown. Any SDM-2009s and instruments that are currently connected to it and any
instruments that have previously been but are not currently connected to it are also
shown. The program’s various functions are initiated or accessed from this screen.
The current date and time are always displayed in the lower right corner of the main
program window.
Control Buttons
The Cylinders, Config, Logs, and Exit control buttons are located along the top
right of the window. The Bump test and Calibration control buttons are located in
the lower right of the window along with the Force Calibration selecti o n box. The use
of these control buttons and the Force Calibration selection box is described in other
parts of this manual.
SDM-2009/Instrument Displa y Are a
The large middle portion of the main program window displays SDM-2009s and
instruments that are currently connected to the PC Controller Program and
25 • Overview of the SDM-GX Docking Station PC Controller Program
Figure 20: Parts of the Main Program Window
Page 31

instruments t hat are i n the dat abase. The SDM-2009s are iden tified by a number. The
instruments are identified by their serial number. By selecting either the Icon radio
button or the Details radio button, the SDM-2009s and instruments can be displayed
either as icons or in a table format that shows various instrument parameter details
such as station ID, user ID, the next scheduled bump test date, and the next
scheduled calibration date among others. If the Only Connected Units box is
checked, then only instruments that are currently connected to the PC Controller
Program will be shown.
Program Status
Three areas of the main program window indicate the program status. The smaller
area in the lower left below the SDM-2009/instrument display area is the message
area. It displays messages that indicate actions and status of the program.
Below this area is t he com mu nic a ti ons por t in di cato r wh i ch sh ow s when the program
is communicating with the docking station(s).
To the right of the communications port indicator is the status field. It displays the
current status of the program. It can indicate if the software is in standby mode or if it
is downloading data among other indications.
Fitting Indicators
To the right of the status field are 3 round fitting indicators. They correspond to the
AIR and GAS fittings on the back of the SDM-2009. They indicate whether the
corresponding solenoid is activated so it can allow gas to flow through the fitting it
controls. When th e i ndicator is gree n, the fitt ing is act ive. When the i ndicat or i s bl ank,
the fitting is not active.
NOTE: The SDM-2009 does not have a GAS 2 fitting. The GAS 2 indicator will
never be green while the PC Controller program is connected to an
SDM-2009.
Setting Up the PC Controller Program
Once the program is installed, you must set up the program for your system. Setting
up the PC Controller Program consists of the following tasks:
• setting up the parameter configuration
NOTE: Only the Parameter tab of the Configuration Window is discussed in
this section. See “Config Window” on page 105 for a description of the
other tabs in the Configuration Window.
• setting up the SDM-2009 display order
• defining which calibration gas cylinders wil l be used
Setting Up the Configuration
1. Launch the program as described in “Launching the SDM-GX Docking Station
Setting Up the PC Controller Program • 26
Page 32

PC Controller Program” on page 23.
NOTE: It is not necessary to turn on the SDM-2009 docking st a ti on s i f you ar e
only performing confi guration setup.
2. The configuration parameters are located in the Configuration Window of the
SDM-GX Docking Station PC Controller program. To access the Configuration
Window, click the Config button along the top of the main program window.
3. You will be promp ted to enter a password. The factory set password is
ABCDE. Enter the password and click OK keeping in mind that the password
is case sensitive. You may change the passwor d using the Password Tab once
you have entered the Configuration Window. See “Password T ab” on page 107
for instructions to change the password.
4. The Parameter Tab of the Configura tion Window will be displayed.
Figure 21: Config Window Parameter Tab
27 • Setting Up the PC Controller Program
Page 33

5. Select the Instrument Information options.
• Change Parameter
If Change Parameter is selected (facto ry setting), the Edit function is a ctive
in the Instrument Function Menu allowing you to change various
parameters in conne cted in strument s. See “Edit Fun ction” on p age 95 for a
complete description of the Edit function. If it is not selected, the Edit
function is not active. Select or deselect the Change Parameter box.
• Auto Pow er OFF Time
This is the length of time that wi ll pass after the last operation is finished
before the program will automatica lly shut off the instrument. If a
successful bump test or calibration is performed, the program will
automatically shut off the instrument in 20 seconds regardless of the Auto
Power OFF Time setting. Use the arrows to the right of the current setti ng
to change the value or highlight the current setting and type in the desired
value. It is defined in seconds with a maxi mum setting of 3600 seconds (1
hour). The factory setting is 3600 second s.
6. Select the Data Logger options.
• Down Load Data Logg er
The Down Load Data Logger selection allows you to have saved data
automatically downloaded from the instrument once it is connected to the
PC Controller program. The data will automatically be downloaded based
on the frequency set in the Down Load Interval option. The factory setting
is deselected. Select or deselect the Down Load Data Logger box.
• Clear After Down Load
The Clear After Down Load selection allows you to automatically clear the
instrument data logger after an automatic download. The factory setting is
deselected. Select or deselect the Clear After Down Load box. If Down
Load Data Logger is not selected, selecting Clear After Download has no
effect.
• Down Load Interval
The Down Load Interval is the length of time, in days, that will pass before
the PC Controller program will automatically download data from an
instrument if Down Load Data Logger is selected. If the instrument is
connected to the program before the inter val h as p assed, a data download
will not automatically occur. The Down Load Interval can be set anywhere
from 1 to 60 days. The factory setting is 1 day. Use the arrows to the right
of the current setting to change the interval or highlight the current setting
and type in the desired value.
7. SDM Selection
If you select the Initialize Display Order selection box, the PC Controller
Setting Up the PC Controller Program • 28
Page 34

program will reset the numbers it has assigned to specific docking stations and
reassign them as you turn SDM-20 09 docking sta tions on and connect them to
the program. See “Setting Up the SDM-2009 Display Order” on page 31 for
instructions to use this feature.
8. Select the Calibration options.
In the Calibrati on section of the Parameter Ta b, you can select Manual
Calibration or Auto Calibration.
If Manual Calibration is selected, you have to manually select an instrument or
instruments in the main program window and click Calibration in the lower right
corner of the window in order to perform a calibration.
If Auto Calibration is selected, and an instrument is due for calibration, a
calibration will automatically begin 1 minute after that instrument successfully
connects to the program and its instrument parameters are retrieved by the
program. When you select Auto Calibration, a window pops up indicating that
only sensors tested with GAS 1 and one sensor tested with GAS 2 will be
calibrated in auto calibration.
This screen does not have any meaning for the GX-2009 and is only
applicable to the GX-2012 and Gas Tracer instruments.
If neither box is selected, you will not be able to perform a calibration. The
factory setting is Manual Calibration selected and Auto Calibration deselected.
Select the box for the desired operation.
The Auto Calibration selection also has a Standard GAS and an All GAS
selection. The GX-2009 does not have any non-standard sensors so this
setting does not have any effect on the automatic calibration of a GX-2009.
9. Select the Bump Test options.
The Bump Test section of the Parameters Tab allows you to make selections
related to the bump test functionality of the SDM-2009.
• Manual Bump Test/Auto Bump Test
You can select Manual Bump Test or Auto Bump Test.
If Manual Bump Test is selected, you have to manually select an instrument
or instruments in the main program window and click Bump Test in the
lower right corner of the window in order to perform a bump test.
If Auto Bump Test is selected, and an instrument is due for bump testing, a
bump test will automatically begin 1 minute after that instrument
29 • Setting Up the PC Controller Program
Page 35

successfully connects to the program and its instrument parameters are
retrieved by the program. When you select Auto Bump T est, a window pops
up indicating that only sensors tested with GAS 1 and one sensor tested
with GAS 2 will be bump tested in auto bump test.
This screen does not have any meaning for the GX-2009 and is only
applicable to the GX-2012 and Gas Tracer instruments.
If neither box is selected, you will not be able to perform a bump test. The
factory setting is Manual Bump Test selected and Auto Bump Test
deselected. Select the box for the desired operation.
The Auto Bump Test selection also has a Standard GAS and an All GAS
selection. The GX-2009 does not have any non-standard sensors so this
setting does not have any effect on the automatic bump testing of a
GX-2009.
• Interval
The Interval can be set an ywhe re be tween 1 and 30 days an d is th e lengt h
of time that can pass before the program will prompt you to perform a bump
test. The factory setting is 30 days.
Use the arrows to the right of the curren t interval or highlight t he current
setting and type in the desired value. The value you type in must be valid
(between 1 and 30 ).
• Gas Exposure Time
The Gas Exposure Time can be set to 30 (factory setting), 45, 60, 90, 120
seconds or Auto and is the length of time that gas is applied to the
instrument. If you select Auto, the PC Controller program will apply gas for
the appropriate amount of time based on your instrument sensor
configurations.
To change the Gas Exposure Time, click on the current setting. A drop
down menu will appear. Select the desired time.
• Tolerance
The Tolerance can be set between 10% and 50%. The factory setting is
50%. It determines how close the instrume nt gas reading must be to th e
calibration gas concentration for each channel during a bump test in order
to pass the bump test. It is defined as a percentage of the calibration gas
concentration.The amount that the instrument gas reading differs from the
calibration gas conce ntra tion mu st be equ al to or less th an thi s perce nt age
Setting Up the PC Controller Program • 30
Page 36

of the calibration gas concentration. For example, if the tolerance is set to
50%, and the %LEL calibration gas concentration is 50% LEL, then the
bump test gas reading for the LEL channel on the instrument must be 50
%LEL ± 25 %LEL.
To change the Tole rance, use the arrows to the right of the current setting
or highlight the curren t setting an d type in the de sired value . The valu e you
type in must be valid (between 10 and 50%).
10. When you are finished making changes, click OK. If you want to save the
changes, click Yes in the window that comes up. If you do not wa nt to save the
changes, click No in the window that comes up. To return to the Configuration
Window, click Cancel.
To exit the Configuration Window and return to the main program windo w
without savi ng any changes, click Cancel in the Configuration Wind ow and
click OK in the confirmation screen that comes up.
Setting Up the SDM-2009 Display Order
Setting up the display order for your SDM-2009s ensures that the docking stations
will appear in the PC Controller program in the same order that they are laid out in
your calibration area.
Before performing this operation, make sure your SDM-2009s are arranged on the
table top or other surface as desired and that they are connected to the computer.
See “Hardware Setup” on page 12. Also be sure that you have performed the driver
installations as described in “Installing the SDM-GX Docking Station PC Controller
Software” on page 18.
1. Click the Config button along the top of the screen to access the Configuration
Window.
2. You will be promp ted to enter a password. The factory set password is
ABCDE. Enter the password and click OK keeping in mind that the password
is case sensitive. You may change the passwor d using the Password Tab once
you have entered the Configuration Window. See “Password T ab” on page 107
for instructions to change the password.
31 • Setting Up the PC Controller Program
Page 37

3. The Parameter Tab of the Configura tion Window will be displayed.
Figure 22: Config Window Parameter Tab
4. Click the box next to Initialize Display Order in the SDM portion of the
Parameter tab.
5. Click OK.
6. The program will ask if you want to save the changes. Click Yes.
7. A window will appear infor ming you that you need to turn off all SDMs and
restart the program. Click OK.
8. Click the Exit button in the upper right corner of the main program window to
exit the program.
9. Turn off all of the SDM-2009s if they are on.
10. Open the SDM-GX Docking Station PC Controller program again.
11. Turn on your SDM-2009s in the order that you wis h for them to appear on the
main program window . T ypically the order in which the docking stations appear
on the screen corresponds to their left to right arrangement on the tabletop.
12. Your SDM-2009 docking stations should all appear on the scr ee n in nu m er ical
order. The program will remember each SDM-2009’s number. If fewer than all
of the docking stations are turned on, the stations will still ap pear in numerical
Setting Up the PC Controller Program • 32
Page 38
order on the Main Program Window, but the stations which are off will not be
shown.
13. If you need to reorder the docking stations, repeat steps 1 through 12.
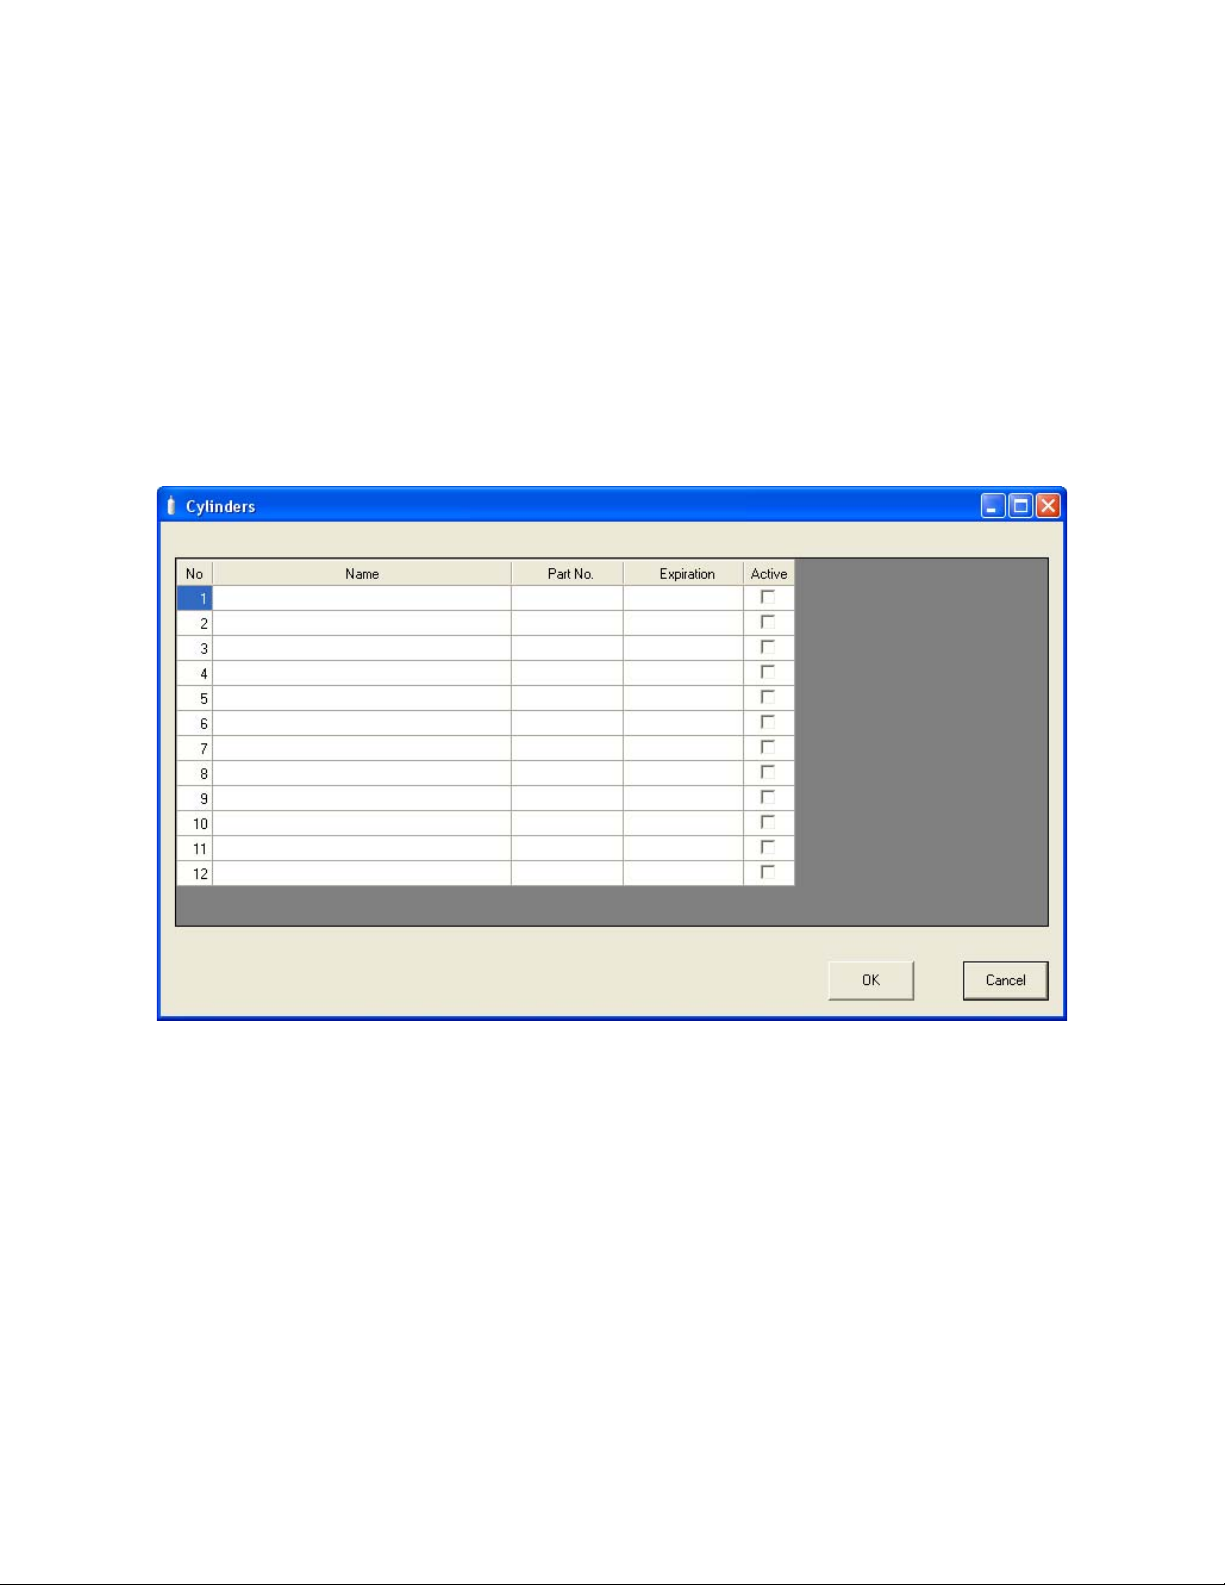
Cylinders Window
The Cylinders Window allows you to keep track of cylinders that are in use and the
expiration date for those cylinde rs. If a cylinder’s expiration date has passed, the PC
Controller program will alert you in the message area of the main program window as
soon as the progr am is st arte d. The Cyli nde rs win dow com es wi th a lis t of pre def ined
cylinders that are fair ly comm on. If a cyli nder th at you ne ed to u se is no t on thi s list, i t
can be added at the bottom of the cylinder list. You may add as many custom
cylinders as necessary.
Figure 23: Cylinders Window
The Cylinders window has the cylinder list number, the cylinder name, the part
number, the expiration date, and the status of the cylinder.
33 • Setting Up the PC Controller Program
Page 39

Selecting a Cylinder from the Predefined List
The Cylinders Window comes with several predefin ed cylinders that you can choo se
from.
1. To access the Cylinders Window, click the Cylinders button along the top of the
main program window.
2. Click in a Name field, click on the drop down menu that appears, and select a
predefined cylinder.
Figure 24: Predefined List of Cylinders
3. Set the expiration date by clicking in the Expiration field and clicking the drop
down menu that appears. Use the calendar to choose an expiration date. The
expiration date box will be h i ghlighted in orange if the expiration date of the
cylinder is less than 10 days away. The expiration date box will be highlighted
in red if the expiration date has passed.
4. Select or deselect the Active box for each cylinder. If the cylinder is active, the
PC Controller program will alert you at start up if the cylinder has passed its
expiration date. If it is not active, the program will not alert you.
5. To return to the main program window without saving any changes, click
Setting Up the PC Controller Program • 34
Page 40

Cancel in the Cylinders Window. A window will appear notifying you that
changes will not be saved. To continue to the main program window, click OK.
To return to the Cylinders Window to save your changes, click Cancel.
6. If you want to save any changes made, click OK. A window will appear asking
if you want to save the changes you made. To return to the main program
window and save your changes, click Yes. To return to the main program
window without saving changes, click No. To return to the Cylinders Window,
click Cancel.
Defining New Cylinders
If your instrument configuration requires the use of a cylinder that is not in the
predefined list, you can add that cylinder by either typing in the information for the
cylinder or by editing the information for an existing cylinder.
1. To access the Cylinders Window, click the Cylinders button along the top of the
main program window.
2. Click in any blank cylinder name field and click again to bring the cursor up or
use the drop down menu to sele ct a cylinde r name tha t is clo se to the one you
want and click the name to bring the cursor up.
Figure 25: New Cylinder
35 • Setting Up the PC Controller Program
Page 41

3. Type in the name of your new cylinder (ie. gas name and concentration).
4. Click in the Part No fiel d once to select it and once mo re to b ring the cursor up.
Type in the part number for your new cylinder (typically the RKI part number).
5. Click in the Expiration field and cli ck on the drop do wn menu that appears. Us e
the calendar to select an expiration date. The expiration date box will be
highlighted in orange if the expiration date of the cylinder is less than 10 days
away. The expiration date box will be highlighted in red if the expiration date
has passed.
6. Select the Active box if you want the PC Controller program to alert you when
the cylinder’s expiration date has passed. If you do not want the program to
alert you, leave the box deselected.
7. To enter any more cylinders, repeat step 3 through step 6.
8. To return to the main program window without saving any changes, click
Cancel in the Cylinders Window. A window will appear notifying you that
changes will not be saved. To continue to the main program window, click OK.
To return to the Cylinders Window to save your changes, click Cancel.
9. If you want to save any changes made, click OK. A window will appear asking
if you want to save the changes you made. To return to the main program
window and save your changes, click Yes. To return to the main program
window without saving changes, click No. To return to the Cylinders Window,
click Cancel.
Connecting Instruments to the
PC Controller Program
NOTE: Be sure to set up the display order for the SDM-2009s as described in
“Setting Up the SD M-2009 Display Order” on page 31, before
continuing.
Do the following to turn on the SDM-2009s and establish a connection with the
instruments in your system:
1. If necessary, verify that the SDM-20 09( s) a re a r ra ng ed on the work surface as
desired, all plumbing is installed, and all hardware and cables are installed.
See “Hardware Setup” on page 12.
2. Launch the SDM-GX Docking Station PC Controller Software as described in
“Launching the SD M -GX Do ckin g Station PC Co ntr ol ler P ro gr am” o n page 23.
Connecting Instruments to the PC Controller Program • 36
Page 42

3. Install a GX-2009 in the instrument cradle.
NOTE: If the GX-2009 is left in the SDM-2009 after bump testing or calibration,
the pump will run for 12 seconds every 2 minutes in order to keep
hydrogen gener ated from cha rging of t he NiMH ba tteries from aff ecting
the CO sensor.
4. Turn on each SDM-2009 by pressing and holding the SDM-2009’s POWER
button. When the control panel LEDs turn on, release the POWER button.
5. The BUMP T and CAL S LEDs will turn off and the COPY LED will be
steadily on or off. It will be on if the SDM-2009 was used in Standalone
Configuration and calibration and bump test records are still stored in the
SDM-2009’s memory (see the SDM-2009 Docking Station Standalone
Configuration Manual for more information). The CHARGE LED will be
blinking green if the SDM-2009 is operating properly or solid red if there is a
system failure.
6. When a connection has been established between the SDM-GX Docking
Station PC Controller Program and all of the SDM-2009s, the main program
window will appear as shown below.
Figure 26: SDM-2009 Connection
7. Press and hold the POWER MODE button on the instrument until you hear a
beep, then release it. The instrument will begin its power up sequence (see
37 • Connecting Instruments to the PC Controller Program
Page 43
exceptions below in step 8). If a successful connection betwee n the instrument
50 12.0
TRANSMIT
CO ppm H2S ppm
CH4 %LEL OXY vol%
50 25.0
FAIL
C-LIMIT
CAL
C--LIMIT
and the SDM-2009 occurs, the home screen will appear on the instrument
display at the end of the startup sequence. The auto calibration values for all
installed sensors will be displayed.
NOTE: The screen shown above applies to a 4-channel GX-2009. If your GX-
2009 has less than 4 channels, the inactive channels will not appear in
the above screen or in any screens where channels are display ed. All
screens in this manual assume a 4-channel GX-2009.
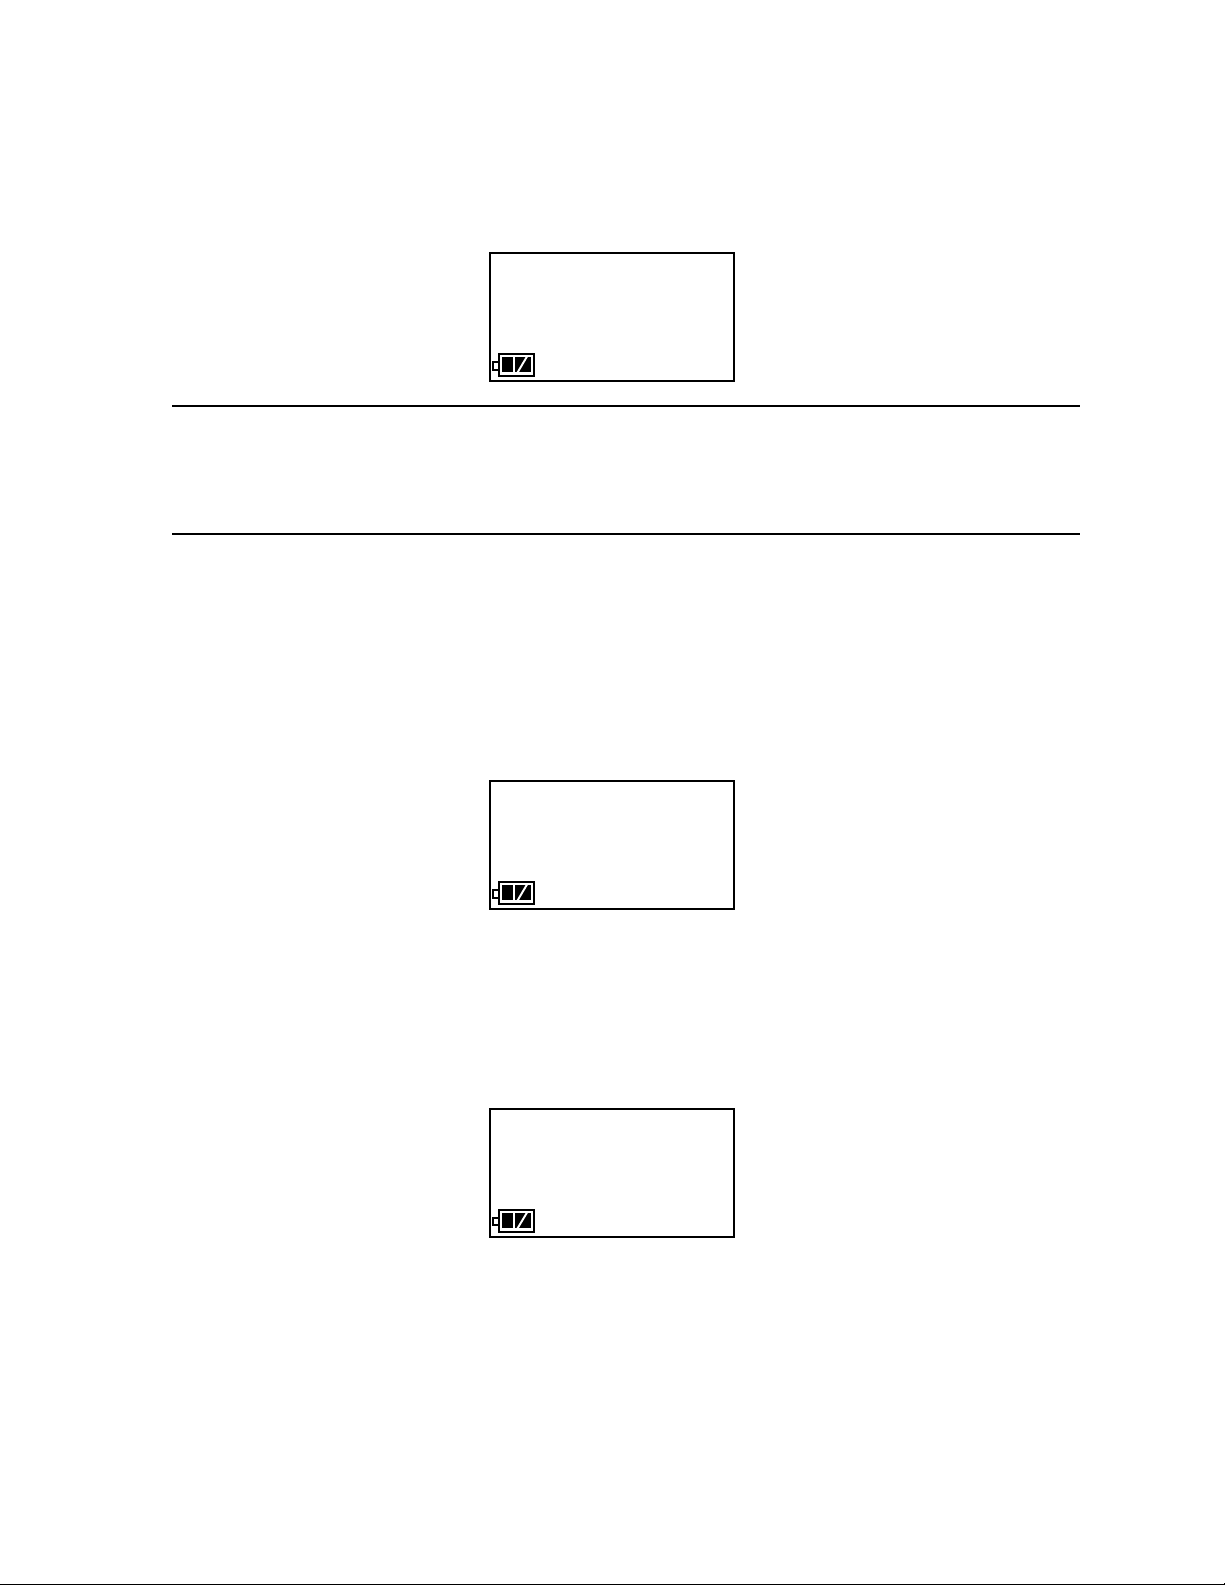
8. There are two exceptions to the seque nce de scri b ed in step 7 above. See the
GX-2009 User Setup Program Operator’s Manual for a description of the Cal
Limit Display and Cal Limit Check instrument parameters.
• When Cal Limit Display is set to On and Cal. Limit Check is set to Can’t
Use, if the GX-2009 is due for calibration the instrument will show a
calibration expired failure screen and the buzzer and LED arrays will pulse
for a few seconds.
The instrument will then connect to the SDM-2009 and display the home
screen shown above in step 7. The CHARGE LED will begin to blink green.
• When Cal Limit Display is set to On and Cal. Limit Check is set to
Confirm to use, if the GX-2009 is due for calibration the unit will show the
following scree n and beep and flash the LE D arrays for a few seconds
indicating that calibration is due.
When the beepi ng and flashing stops, press and release the POWER
MODE button on the GX-2009 to continue. The unit will now connect to the
SDM-2009, the home screen shown in step 7 above will be displ aye d, a nd
the CHARGE LED will begin to blink green.
9. For each instrument, the SDM-GX Docking St ation PC Controller Program will
indicate that an instrument was found and it will download the instrument’s
Connecting Instruments to the PC Controller Program • 38
Page 44

parameters. The BUM P T and CAL S LEDs will flash amber while the data is
being downloaded. Once the parameter download is complete, the BUMP T
and CAL S LEDs will be solid amber. When all instruments have been turned
on, connected, and downloade d, the main program window will appear as
shown below . Whe n the instrument i s connected to th e PC Controller Pr ogram,
the date and time of the instrument are automatically updated to the current
date and time on the PC Controller Program’s screen.
NOTE: Turn each instrument on 10-15 seconds after the previous instrument
to minimize the possibility of the instrument not connecting to the PC
Controller Program. If an instrument does not connect, use the
instrument’s POWER MODE button to turn it off and turn it back on
again.
Figure 27: Instruments Connected and Downloaded
If an instrument is due for calibration, the docking station number and
instrument serial number will be highlighted in red.
If an instrument is due for calibration in the next 10 days, the docking station
and instrument serial number will be highlighted in orange.
If an instrument’s parameters could not be downloaded properly, a red triangle
will appear over the instrument and SDM-2009 picture .
39 • Connecting Instruments to the PC Controller Program
Page 45

Icon View vs. Details View
Instruments that are currently connected or have been previously connected can be
viewed in either Icon View or Details View. Choose Icon or Details View by clicking
the Icon or Details radio button below the control buttons. Icon View allows you to
view connected instrumen t s and previousl y connected instruments in an icon
configuration. Connected instruments are shown as an instrument inserted in an
SDM-2009 icon. Previously connected instruments are shown as instrument icons.
Right clicking an instrument causes the Instrument Function Menu to appear.
Details View allows you to view connected instruments and previously connected
instruments in a table format. Scrolling to the right in Details View allows you to view
existing instrument parameters. For a description of these parameters and
instructions to change them, see “Edit Function” on page 95.
Figure 28: Main Program Window, Details View
Unless otherwise noted, all following figures that show the main program window in
this manual are shown in Icon View.
Connecting Instruments to the PC Controller Program • 40
Page 46

Printing and Exporting an Instrument List from the
Main Program Window
You can print, save, or add to clipboard the instrument list in the main program
window. You can only print the list if it is viewed in Details format. The list cannot be
printed when viewed in Icon format.
To print the instrument list:
1. Ensure that the main program wi n do w is be in g vie w ed in Details format.
Figure 29: Main Program Window, Details View
The print icon will not be active if the main program window is viewed in Icon
format.
2. Click the Print icon located just below the Exit button.
3. A print confirmation screen will appear.
41 • Connecting Instruments to the PC Controller Program
Page 47

To print the instrument list, click OK.
To cancel the print job, click Cancel.
To save the instrument list as a .csv file:
1. Click the Save icon located just below the Exit button.
2. Choose a file path and enter a file name and click Save.
To save the instrument list to the clipboard:
1. Click the Clipboard button located just below the Exit button. The serial
number, model, station ID, user ID, next bump test date, next calibration date,
the calibration interval, and the data logging interval time for each instrument
in the main program window will be saved to the clipbo ard in a table format.
2. Open a sp readsheet program such as Excel or a word processing program
such as Word and paste the clipboard data into it.
Automatic Bump Testing and Calibration
The PC Controller Program will automatically perform a bump test or calibration on a
connected instrument if Auto Bump Test or Auto Calibration is selected in the
Configuration Window and if the bump test or calibration is due. The use of these
features allows the user to launch the PC Controller Program, turn on the
instrument(s) and walk away. No oversight of the bump test or calibration is needed.
For this reason, the calibration cylinder needs to already be in place before an
instrument is connected to the program.
NOTE: The Standard GAS or All GAS settings in the Configuration Window do
not affect the au tomatic testing of a GX-2009.
Automatic Bump Testing and Calibration • 42
Page 48

To automatically bump test or calibrate an instrument or instruments:
1. Be sure that Auto Bump Test or Auto Calibration are selected in the
Configuration Window. See “Setting Up the PC Controller Program” on
page 26 for instructions.
2. Verify that all of the bump test and/or calibration parameters are set correctly.
See “Setting Up the Configuration” on page 26 for instructions.
3. Verify that the appropriate calibration gas cylin der is connected to each
SDM-2009 or to the manifold line.
4. Establish a connection between the SDM-2009, instrument, and the PC
Controller program as described in “Connecting Instruments to the P C
Controller Program” on page 36.
5. The bump t est or calibration will begin 1 minute after the last conn ected
instrument’s instrument information download is complete.
6. During an automatic bump test, if the bump test fails, a calibration is
immediately performed.
7. If Auto Bump Test and Auto Calibra tion are both selected, the calibration will
begin 1 minute after the bump test has finished.
Bump Testing a GX-2009
The following instructions illustrate a bump test on a 4-gas instrument. If your
instrument has less than 4 channels, the screens will look slightly different. A 3-gas or
4-gas cylinder, depending on your instrument configuration, must be used to fully
bump test the GX-2009 in the docking statio n.
The PC Controlle r Prog ram is capable of performing a bump test both manua lly and
automatically wh en a GX-20 09 is con nected to i t. When a bum p test is pe rformed, the
PC Controlle r Pr og ra m performs an air adjust operation on a GX-2009 and then
applies calibration gas to the instrument. The program analyzes the response results
based on predefined criteria and determ ines if the GX-2009 passed the bump test.
The criteria that the PC Controller Program uses to determine if the GX-2009 passes
a bump test, whether the Bump Test button is active, and whether or not the PC
Controller Program automatically performs a bump test if it is due on a connected
GX-2009 is defined in the Parameter tab of the Configuration Window. See "Setti ng
Up the Configuration" step 9 on page 29 for a description of the bump test
configuration setup.
To manually bump test an instrument or instruments:
1. Establish a connection between the SDM-2009, GX-2009, and the PC
Controller program as described in “Connecting Instruments to the P C
Controller Program” on page 36.
2. Verify that all of the bump test parameters are set correctly. See “Setting Up
the Configuration” on page 26 for instructions.
3. Verify that an approp riate cylinder is connected to the GAS fitting of each
SDM-2009 or to the GAS manifold line.
43 • Bump Testing a GX-2009
Page 49

4. Select the instrument or instruments you wish to bump test and click on them
to highlight them as shown below. To select multiple instruments for bump
testing, hold down the Control button on the keyboard as you click them.
Figure 30: Instrument Selection
5. If you would like an automatic calibration to occur after a failed bump test,
select the Force Calibration selection bo x.
6. Click the Bump test button in the lower right corner of the main program
window.
Bump Testing a GX-2009 • 44
Page 50

7. You will be asked to confirm which GX-2009 channels will use GAS 1 for the
bump test. The gas concentration shown next to each channel is the auto
calibration value for that channel. If it does not match the gas concentration in
the cylinder, change the aut o calibration value for that channel. See “Sensor
Tab” on page 103 for instructions. All channels in the instrument will be
selected. The selections are not user adjustable. If your instrument has fewer
than 4 channels, your screen will only display the active channels.
Figure 31: Gas Cylinder Confirmation Screen
Click OK. If you don’t want to proceed, click Cancel to abort the bump test.
45 • Bump Testing a GX-2009
Page 51

8. You will then be asked to confirm the auto calibration values and the
instruments that the calibration cylinder will be used for. Be sure the auto
calibration values match the values listed on the calibration cylinder . The serial
number and gas combination of all se lected instruments will appear
sequentially beneat h t he ga s cylind er conce ntrat ion. All ch annel s will be bump
tested using GAS 1.
Figure 32: Gas Order Confirmation Screen
9. Click OK. You will be asked if you want to bump test the instrument(s). Click
OK to proceed. If you don’t wan t to procee d with the bu mp test, click C ancel to
return to the main program window.
Bump Testing a GX-2009 • 46
Page 52

10. The pump(s) will start and the program will indicate that air is flowing. The AIR
indicator on the program screen will be on and air will be applied to the
instrument(s) for 45 seconds, then the PC Contro ller Program will perform a
zero adjustment on all the channels. The BUMP T LED on the SDM-2009
control panel will be flashing amber.
If at any point during the bump test you wis h to can cel the bump test, click the
Cancel button in the lower right corner of the screen. The bump test will be
aborted and the BUMP T LED will turn solid amber.
Figure 33: Air Flowing
The PC Controller Program will analyze the zero adjustment results. If any
sensors failed the zero adjustment, the bump test will be aborted for that
instrument.
47 • Bump Testing a GX-2009
Page 53

11. After air is applied, and if all the channels pas sed the zero adjustment,
calibration gas will be applied. The GAS 1 indicator on the program screen will
come on and calibration gas will be applied to the instrument(s) for the
duration specified in the Gas Exposure Time parameter in the Configuration
Window.
Figure 34: Calibration Gas Flowing
The PC Controller Program will analyze the results. If the bump test on the
standard 4 sensors fails and Force Calib ration is selected, a calibration will
automatically begin and calibration gas will continue to flow.
Bump Testing a GX-2009 • 48
Page 54

12. After calibration gas is app lied, the docking station will purge with fresh air for
45 seconds.
Figure 35: Fresh Air Purge
49 • Bump Testing a GX-2009
Page 55

13. After the fresh air purge is complete,
• If the bump test passes, the following window will op en in dicati ng that. The
BUMP T LED will be solid gr een. Click OK to return to the main program
window. The BUMP T LED will turn off.
Figure 36: Bump Test Passed
The GX-2009 will automatically be shut off 20 seconds after a successful
bump test.
Bump Testing a GX-2009 • 50
Page 56

• If the bump test fails and the Force Calibration box was not selected, the
following window will ope n in dicating which channels failed the bump test.
The BUMP T LED on the SDM-2009 control panel will be solid red. Click
OK to return to the main program window or double click the instrument
information line to view the bump test results in the Logs window. The
BUMP T LED on the SDM-2009 control panel will turn off.
Figure 37: Bump Test Failed
51 • Bump Testing a GX-2009
Page 57

• If the bump test fails and the Force Calibration box was selected, the
SDM-2009 automatically performs a calibration immediately after the failed
bump test. The results screen will indicate the results of both the bump test
and calibration. The BUMP T LED on the SDM-2009 control panel will be
solid red. The CAL S LED wil l be solid green if the calibration passed or
solid red if the calibration failed. Click OK to return to the main program
window or double click an instrument information line to view the bump test
or calibration results in the Logs window. The BUMP T LED and CAL S
LED on the SDM-2009 control panel will turn off.
Figure 38: Bump Test Failed/Calibration Failed
Bump Testing a GX-2009 • 52
Page 58
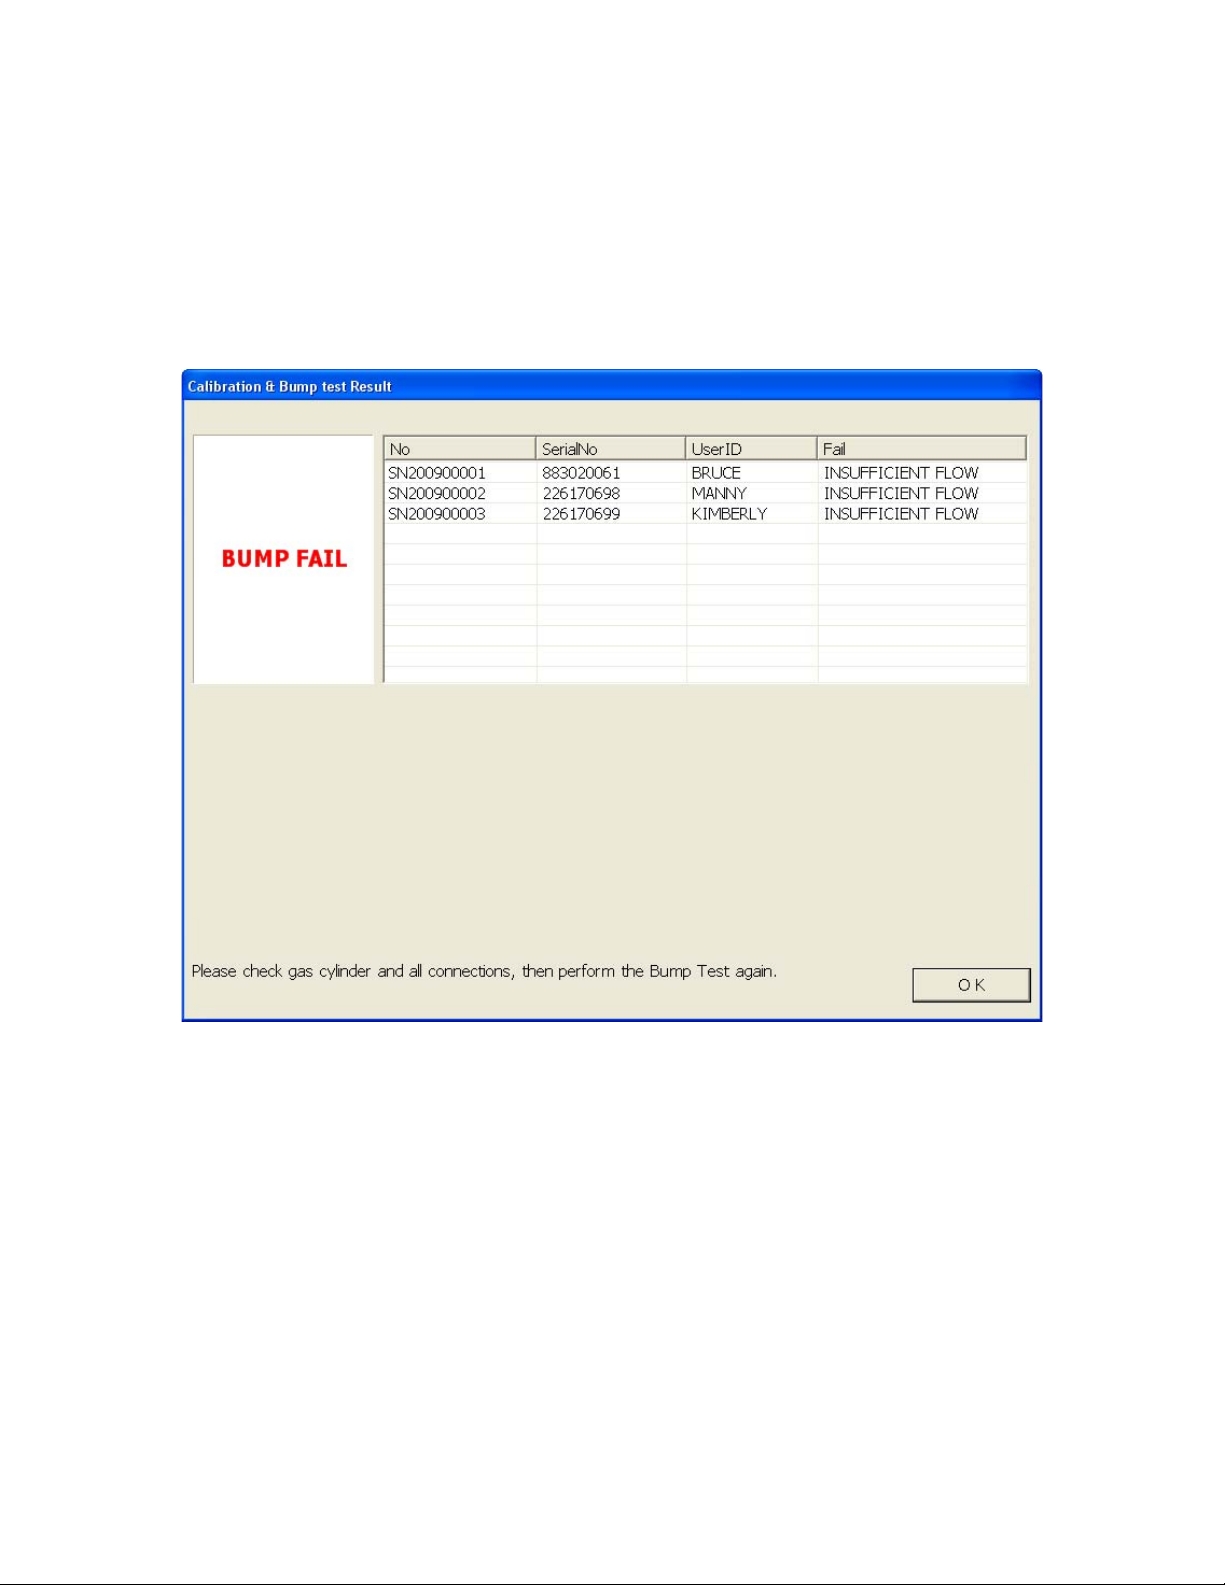
• If at any point during the bump test the f low rate to the i nstrument b ecomes
too low, the PC Controller Program will abort the bump test and display a
failed bump test screen. The BUMP T LED on the SDM-2009 control
panel will be solid red. Click OK to return to the main program window or
double click an instrument information line to vi ew the bump test or
calibration results in the Logs window. The BUMP T LED on the SDM2009 control panel will turn off. Confirm all tubing connections are correct
and that all lines are clear.
Figure 39: Low Flow Bump Test Failure
14. For all bump test result outcomes, the instruments will be displayed in the main
program window in Deta ils View. To return the main program window to Icons
View, click the Icons radio button.
15. All bump test results can be viewed in the Logs win dow . See “ Bump Test Data”
on page 89 f or instructions for viewin g bump test data.
If the bump test function in the GX-2009 is turned off or if the GX-2009 does
not have the bump test capability, the bump test results will only be stor ed in
the Logs window of the PC Controller Program. If the bump test function is
turned on the in GX-2009, the bump test results will also be stored in the GX-
2009.
53 • Bump Testing a GX-2009
Page 59

Calibrating a GX-2009
The following instructions illustrate a calibration on a 4-gas in strument. If your
instrument has less than 4 channels, the screens will look slightly different. A 3-gas or
4-gas cylinder, depending on your instrument configuration, must be used to fully
calibrate th e GX-2009 in the docking station.
The PC Controller Program is capable of performing a calibration both manually and
automatically on a GX-2009. When a calibration is performed, the PC Controller
Program performs an air adjust operati on on a GX-2009 and then applies calibration
gas to the GX-2009. The PC Controller Program analyzes the calibration results and
determines if the GX-2009 passed the calibration.
To manually calibrate an instrument or instruments:
1. Establish a connection between the SDM-2009, GX-2009, and the PC
Controller program as described in “Connecting Instruments to the P C
Controller Program” on page 36.
2. Verify that all of the calibration parameters are set correctly. See “Setting Up
the Configuration” on page 26 for instructions.
3. Verify that an approp riate cylinder is connected to the GAS fitting of each
SDM-2009 or to the GAS manifold line.
Calibrating a GX-2009 • 54
Page 60

4. Select the instrument or instruments you wish to calibrate and click on them to
highlight them as shown below. To select more than one instrument for
calibration, hold down the Control button on the keyboard as you click them.
Figure 40: Instrument Selection
5. Click the Calibration button in the lower right corner of the main program
window.
55 • Calibrating a GX-2009
Page 61

6. You will be asked to confirm which GX-2009 channels will use GAS 1 for the
calibration. The gas concentration shown next to each channel is the auto
calibration value for that channel. If it does not match the gas concentration in
the cylinder, change the aut o calibration value for that channel. See “Sensor
Tab” on page 103 for instructions. All channels in the instrument will be
selected. The selections are not user adjustable. If your instrument has fewer
than 4 channels, your screen will only display the active channels.
Figure 41: Gas Cylinder Confirmation Screen
Click OK. If you don’t want to proceed, click Cancel to abort the calibration.
Calibrating a GX-2009 • 56
Page 62
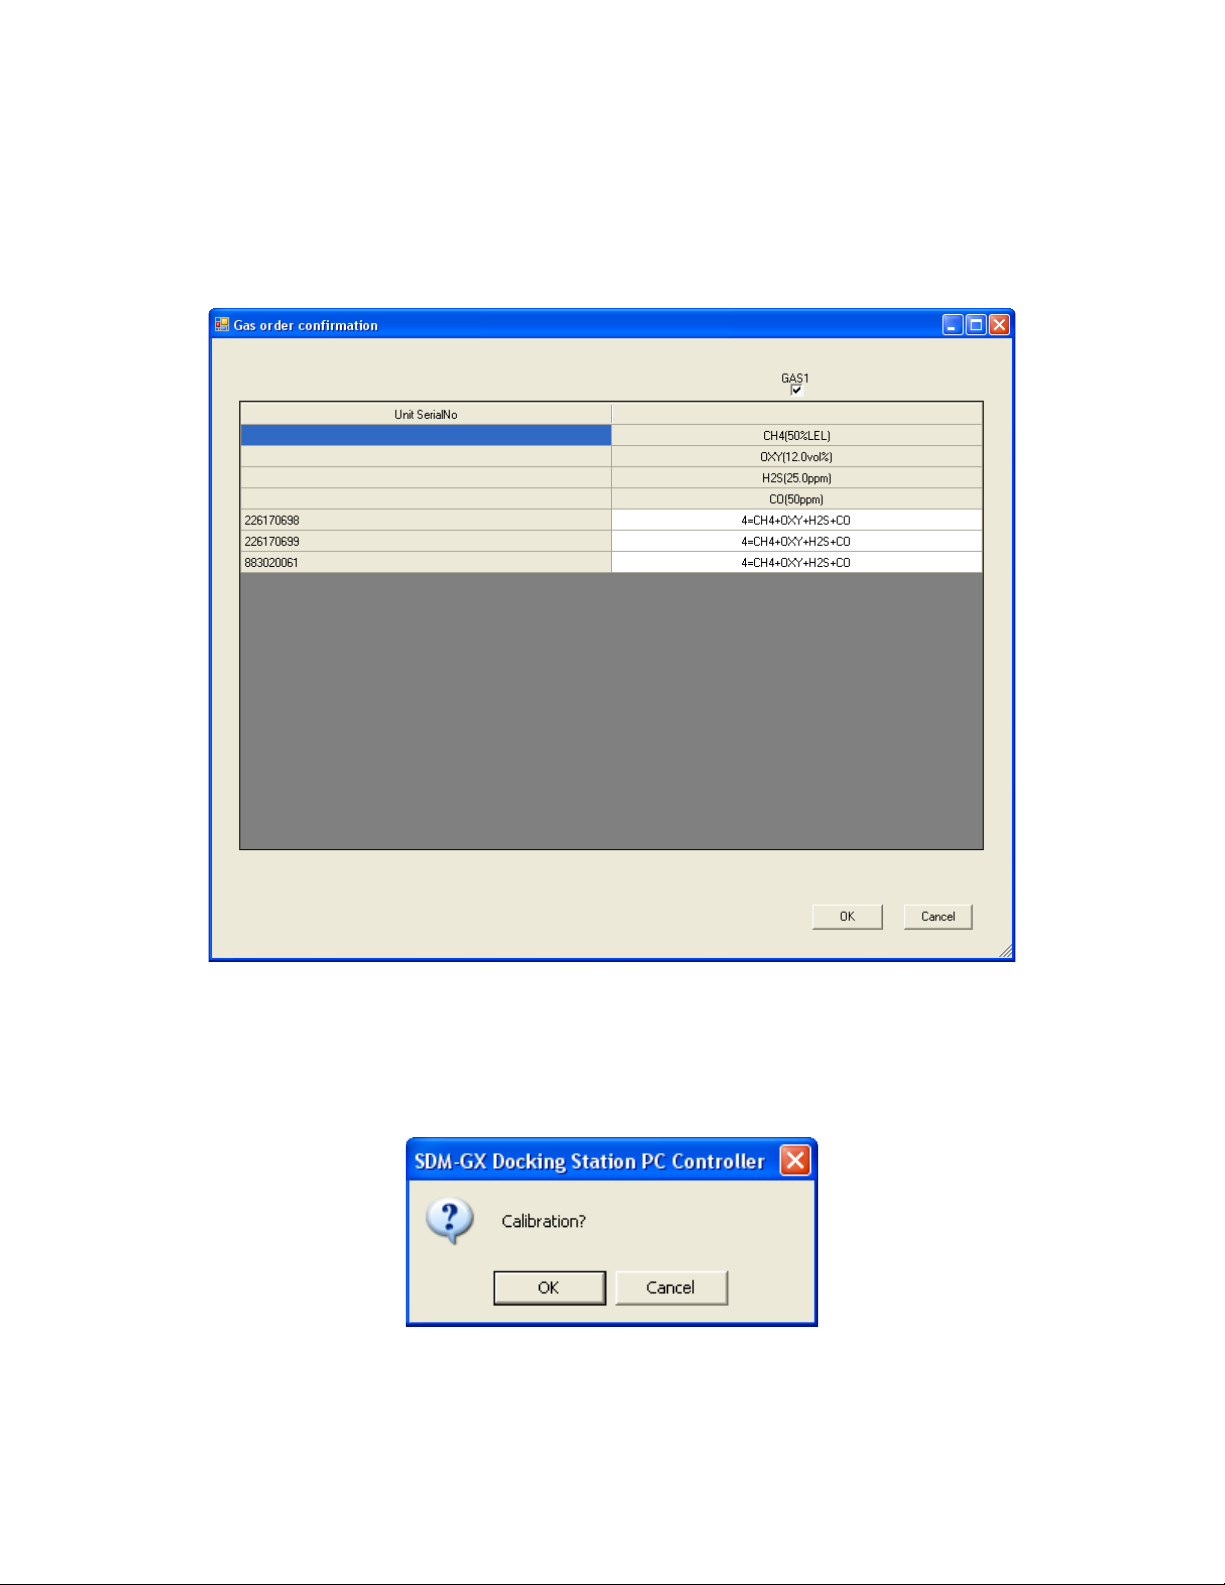
7. You will then be asked to confirm the auto calibration values and the
instruments that the calibration cylinder will be used for. Be sure the auto
calibration values match the values listed on the calibration cylinder . The serial
number and gas combination of all se lected instruments will appear
sequentially beneath the gas cylinder concentration. All channels will be
calibrated using GAS 1.
Figure 42: Gas Order Confirmation Screen
8. Click OK. You will be asked if you want to calibrate the instrument(s). Click OK
to proceed. If you don’t want to proceed with the calibration, click Cancel to
return to the main program window.
57 • Calibrating a GX-2009
Page 63

9. The pump(s) will start and the program will indicate that air is flowing. The CAL
S LED will begin to flash amber. Air will be applied to the instrument( s) fo r 45
seconds, then the PC Contr oller Progr am will p erform a zer o adj ustm ent o n all
the channels.
If at any point during the calibration you wish to cancel the calibration, click the
Cancel button in the lower right corner of the screen. The calibration will be
aborted and the CAL S LED will turn solid a mber.
Figure 43: Air Flowing
The PC Controller Program will analyze the zero adjustment results. If any
sensors failed the zero adjustment, the calibration will be abor ted for that
instrument.
Calibrating a GX-2009 • 58
Page 64

10. After air is applied, and if all the channels passed the zero adjustment,
calibration gas will be applied. The GAS 1 indicator on the program screen will
come on. Calibration gas will be applied to the in strument(s) for 90 seconds.
Figure 44: Calibration Gas Flowing
The PC Controller Program will analyze the results.
59 • Calibrating a GX-2009
Page 65

11. After calibration gas is applied, the docking station will purge with fresh air for
45 seconds.
Figure 45: Fresh Air Purge
Calibrating a GX-2009 • 60
Page 66

12. After the fresh air purge is complete,
• If the calibration passes, the following window will open indicating that. The
CAL S LED on t he SDM-2009 control p anel will b e solid gree n. Click OK to
return to the main program window. The CAL S LED will turn off.
Figure 46: Calibration Passed
The GX-2009 will automatically be shut off 20 seconds after a successful
calibration.
61 • Calibrating a GX-2009
Page 67

• If the calibration fails, the following window will ope n indicating which
channels failed to calibrate. The CAL S LED on the SDM-2009 control
panel will be solid red. Click OK to return to the main program window or
double click the instrument information line to view the calibration results in
the Logs window. The CAL S LED on the SDM-2009 cont rol p anel w ill turn
off.
Figure 47: Calibration Failed
Calibrating a GX-2009 • 62
Page 68

• If at any point during the calibration the flow rate to the instrume nt becomes
too low, the PC Controller will abort the calibration and display a failed
calibration screen. The CAL S LED on the SDM- 2009 contr ol p a nel will b e
solid red. Click OK to return to the main program window or double click the
instrument information line to view the calibration results in the Logs
window. The CAL S LED on the SDM-2009 control panel will turn off.
Confirm all tubin g connections are correct and that all lines are clear.
Figure 48: Low Flow Calibration Failure
13. For both calibration result outcomes, the instrument(s) will be di splayed in the
main program window in Details View. To return to Icons View, click the Icons
radio button.
14. When a calibration is performed, any bump test or calibration data that is being
stored in the instrument will be downloaded to the PC Controller Program. This
data can be viewed in th e Logs wind ow along w ith the resul ts of th e calibrat ion
just performed. See “Bump Test Data” on page 89 or “Calibration Data” on
page 76 for instructions for viewing bump test or calibration data.
The calibration results will also be stored in the GX-2009.
63 • Calibrating a GX-2009
Page 69

Troubleshooting
NOTE: This troubleshooting guide describes SDM-2009 problems only. See
the GX-2009 Operator’s Manual for problems you may encounter with
the GX-2009.
Table 3: Troubleshooting the SDM-2009
Symptoms Probable Causes Recommended Action
• Fresh air
adjustment fails
• Calibration fails • The auto calibration
• The SDM-2009 is not in a
fresh air environment or
the cylinder being used is
not a zero air cylinder.
• If a zero air cylinder is
used, the calibration
cylinder is out of gas.
• If a zero air cylinder is
used, the tubing from the
regulator to the AIR fitting
is not connected.
values do not match the
cylinder gas
concentrations.
• The calibration cylinder is
out of gas or is outdated.
• The calibration cylinder is
not connected to the GAS
fitting.
• The GX-2009 is not
properly inserted in the
instrument cradle.
• The tubing from the
regulator to the GAS fitting
or manifold is not
connected.
1. Confirm that the SDM-2009 is in
a fresh air environment or that a
zero air cylinder is attached to
the AIR fitting.
2. If a zero air cylinder is used,
verify that it contai ns an
adequate supply of test sample.
3. If a zero air cylinder is used,
check all calibration tubing for
leaks or for any bad connections.
4. If the fail condition continues,
replace the sensor(s) in the
instrument.
5. If the difficulti es continue, conta ct
RKI Instruments, Inc. for further
instruction.
1. Confirm that the auto calibration
values match the concentrations
listed on the gas cylinder.
2. Ver ify that t he calibra tion cylinder
contains an adequate supply of
fresh test sample.
3. Ver ify that t he calibra tion cylinder
is connected to the GAS fitting.
4. Check to make sure the GX-2009
is properly inserted in the
instrument cradle.
5. Check all calibration tubing for
leaks or for any bad connections.
6. If the fail condition continues,
replace the sensor(s) in the
instrument.
7. If the difficulti es continue, conta ct
RKI Instruments, Inc. for further
instruction.
Troubleshooting • 64
Page 70

• No connection
between
instrument and PC
Controller
Program
• The batteries in
the instrument are
not charging
• SDM-2009 is not turned
on.
• The instrument is not
correctly ins e rte d in to th e
instrument cradle.
• The IR window is dirty.
• The USB cable is not
properly plugged into the
SDM-2009 or the PC.
• The instrument is not
properly inserted in the
instrument cradle.
• The charger is
malfunctioning.
• The batteries are faulty.
1. Turn on the SDM-2009. If it does
not turn on, check that the AC
adapter is plugged into an AC
socket and to the jack on the
back of the SDM-2009.
2. Check to make sure the
instrument is inserted properly.
3. Clean the IR window on the
SDM-2009 and the GX-2009.
4. Check to make sure the USB
cable is plugged into the back of
the SDM-2009 and to a USB port
on your PC.
5. If the difficulti es continue, conta ct
RKI Instruments, Inc. for further
instruction.
1. Be sure that th e in s tru ment is
fully inserted in the instrument
cradle.
2. Try to charge the batteries in a
BC-2009 charger if one is
available to determine if the
SDM-2009 is at fault.
3. Try to charge the batteries using
a different SDM-2009 if one is
available to determine if the
SDM-2009 is at fault.
4. Replace the batteries and
attempt to charge them. See the
GX-2009 Operator’s Manual for
instructions to change the
batteries.
5. If the difficulti es continue, conta ct
RKI Instruments, Inc. for further
instruction.
Charging an Instrument in an SDM-2009
The SDM-2009 can be used to charge the rechargeable batteries in a GX-2009. To
maximize the instrument’s run time and the battery life, make sure the batteries’
charge is as low as possible before recharging them. You can use the GX-2009’s
REFRESH function to discharge the batteries. See the GX-2009 Operator’s Manual
for a complete description of the REFRESH button.
Recharging the Batteries After Perf orming a Bump Test
or Calibration
To recharge the batteries after performing a bump test or calibration:
1. Perform a bump test or calibration on an instrument as described in “Bump
65 • Charging an Instrument in an SDM-2009
Page 71

Testing a GX-2009” on page 43, “Calibrating a GX-2009” on page 54.
2. After the bump test or calibration has been completed, turn off the
instrument(s) by selecting the instrument(s), right clicking on them, and
selecting Power Off. The docking station will automatically turn off the
instrument(s) 20 seconds after a successful bump test or calibration or if there
is no activity for the time period defined by Auto Power OFF Time in the
Configuration Window.
3. While the instrument is on , the CHARG E LED will be blinki ng green . When the
instrument is turned off, the CHARGE LED will blink amber. The BUMP T and/
or CAL S LED will continue to be either green or red depending on the result
of the previous bump test or calibration. If the bump test or calibration was
cancelled, the BUMP T or CAL S LED will be solid amber.
NOTE: The SDM-2009 does not start charging the batteries until the
instrument is off. While the instrument is on, the CHARGE LED will
blink green. Once the instrument is shut off, the CHARGE LED will
begin to blink amber.
4. If the batteries are fully charged, then the CHARGE LED will turn solid green in
a few minutes.
If the batteries are drained enough for the docking station to charge them, the
CHARGE LED will continue to blink amber while charging is taking place. The
SDM-2009 will take approximately 3 hours to charge fully discharged batteries.
If the charging process encounters a fail condition, the CHARGE LED will turn
steadily red.
NOTE: If the GX-2009 is left in the SDM-2009 after bump testing or calibration,
the pump will run for 12 seconds every 2 minutes in order to keep
hydrogen gener ated from cha rging of t he NiMH ba tteries from aff ecting
the CO sensor.
5. When the charge is complete, the CHARGE status LED will turn solid green.
Recharging the Batteries Without Performing Any Operations
To recharge the batteries in an instrument without performing any other operations:
1. Confirm that the AC adapter is connected to the back panel of the SDM-2009
and to an AC wall socket.
2. Insert the instrument into the instrument cradle.
3. Press and hold the SDM-2009’s POWER button. The LEDs will turn amber.
4. When the BUMP T and CAL S LEDs turn off, release the POWER button.
5. The CHARGE LED will be blinking amber.
Charging an Instrument in an SDM-2009 • 66
Page 72

6. If the batteries are fully char ged, then the blinking amber LED will turn solid
04.59
CHARGING
green in a few minutes.
If the batteries are drained enough for the SDM-2009 to charge them, the
CHARGE LED will continue to blink amber while charging is taking place. The
SDM-2009 will take approximately 3 hours to charge a fully discharged GX-
2009.
If the charging process encounters a fail condition, the CHARGE LED will turn
steadily red.
7. When the charge is complete, the CHARGE status LED will turn solid green.
Batteries Too Drained for PC Controlled Operation
If the NiMH batteries do not have enough powe r to keep the instrument on, it will go
into a 5 minute charge cycle and the following screen will be displayed on the
instrument screen.
It will not connec t to the docking station. The instrument cannot be bump tested or
calibrated in the charge cycl e. Once the 5 minute charge cycle has ended, the unit
will automatically turn back on and connect to the docking station. The unit can now
be bump tested or calibrated.
Logs Window
The Logs Window contains saved data from instruments in addition to records of
bump tests and calibrations performed with the PC Controller Program. If you perform
a complete download by right clicking a selected instrument and clicking Download,
the Logs Window wi ll contain alarm trend data, calibration data, event data, interval
trend data, memo data, and bump test data. If you do not perform a complete
download or select Down Load Data Logger in the Configuration Window, the Logs
Window will only have memo files and files for any bump tests or calibrations
completed while the instrument was connected to the PC Controller Program.
The Logs Window i s d i vid ed i nt o f our frames. The upper left fr ame is the Data Frame
and displays all the data folders. If no data has been saved, then no folders will
appear in the Da ta Fr ame.
The upper right fr am e sho ws the con te nts of a data folder that is selected in the Data
Frame. The lower right frame shows the summary information for a data file that is
selected in the upper right frame.
67 • Logs Window
Page 73

The lower left frame contains three selection boxes for organizing data. When
viewing the data, it can be organized in two ways:
1. Base View For m at
If you do not select Serial No, Station ID, or User ID, the Base view box
appears next to the selection boxes. The dat a can be organi zed by ei ther dat a
type or by the year and month of the saved data.
Figure 49: Logs Window in Base View Format, Date
To view data in the Date Base View Format:
a. Select Date in the Base view box.
b. Click the exp anded view symbol (+) next to a da te fol der in the D at a
frame of the Lo gs window or double click the folder to view the
contents below it.
c. Single click on the data type folder (Alarm, Calibration, etc.). All of
the files in that dat a type folder will ap pear in the upper rig ht frame of
the Logs window.
d. If an item is expanded and you want to close it, click the (-) symbol
next to the item or double click it.
Logs Window • 6 8
Page 74
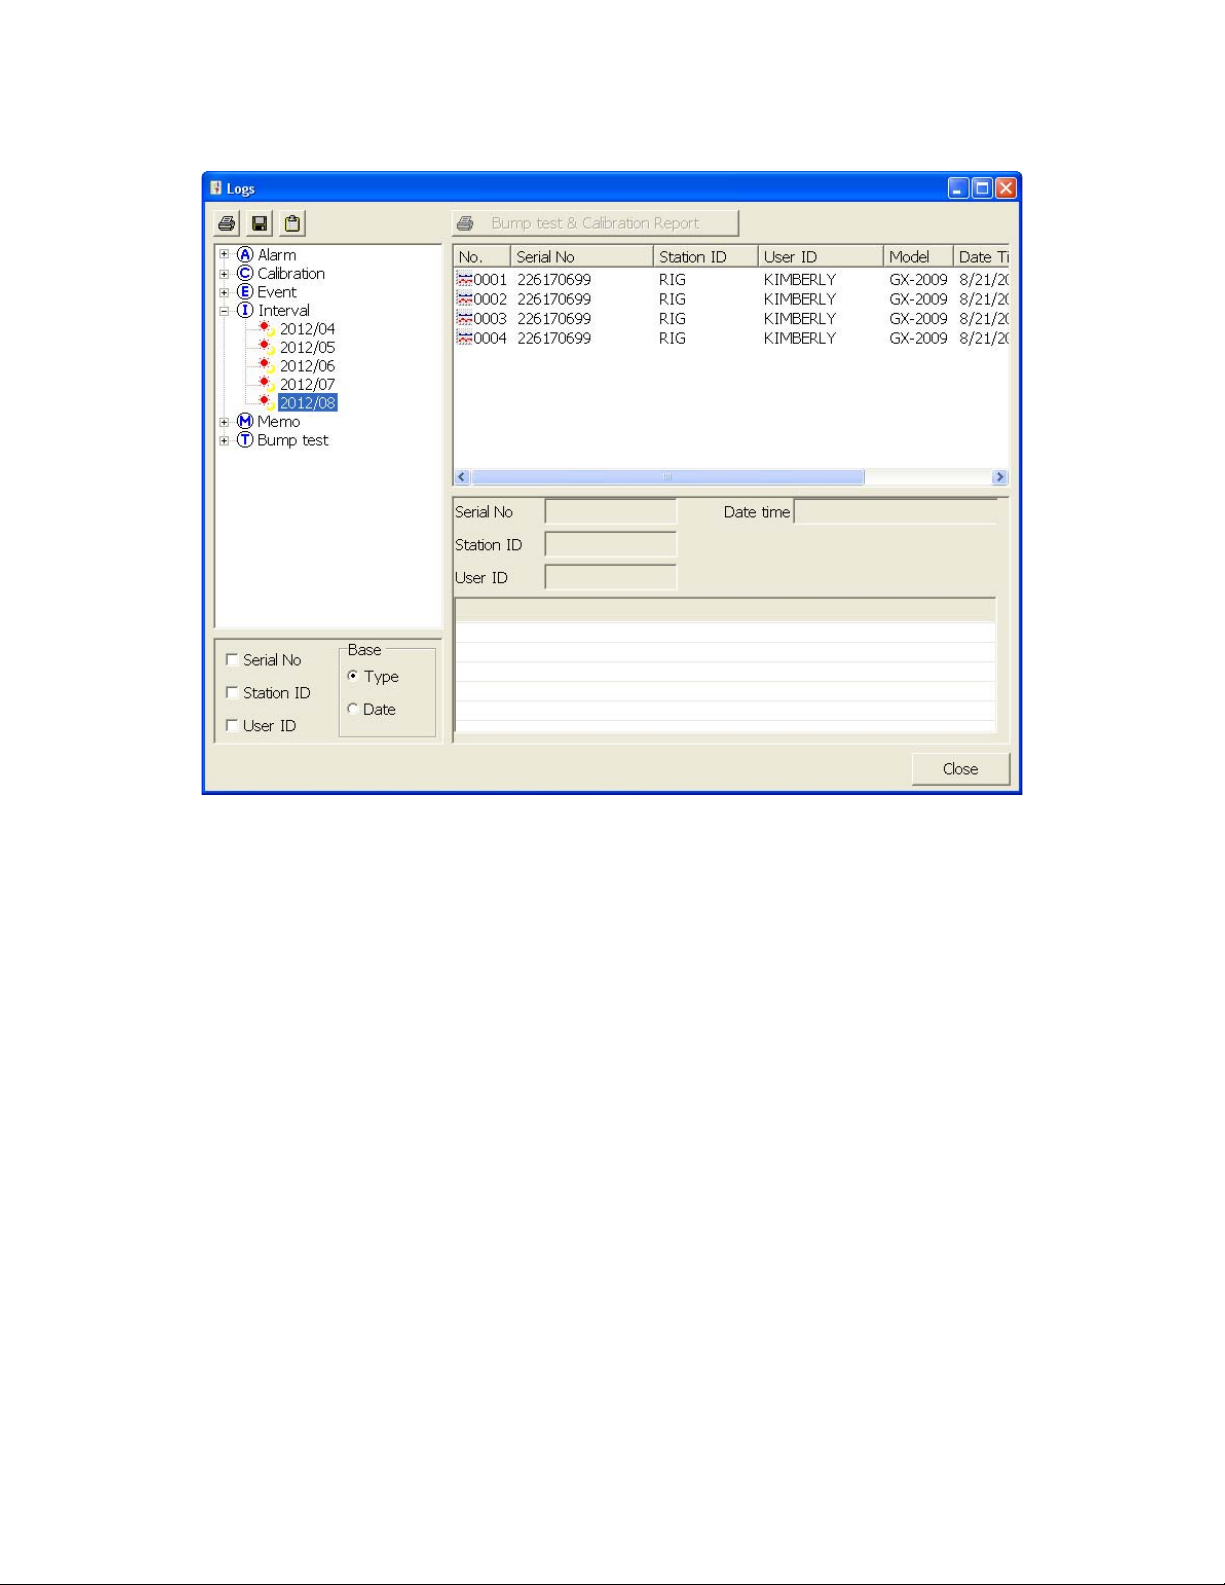
Figure 50: Logs Window in Base View Format, Type
To view data in the Type Base View Format:
a. Select Type in the Base view box.
b. Click the expanded v i ew symbol (+) next to a data type folder
(Alarm, Calibrat ion, etc.) in the Data frame of the Logs window or
double click the folder to view the contents below it.
c. Single click on a date folder. The dates are displayed in year/month
format. All of the files in that date folder will appear in the upper right
frame of the Logs window.
d. If an item is expanded and you want to close it, click the (-) symbol
next to the item or double click it.
2. ID View Format
The data may be organized by one or more of the following parameters:
• Serial Number
• Station ID
•User ID
69 • Logs Window
Page 75
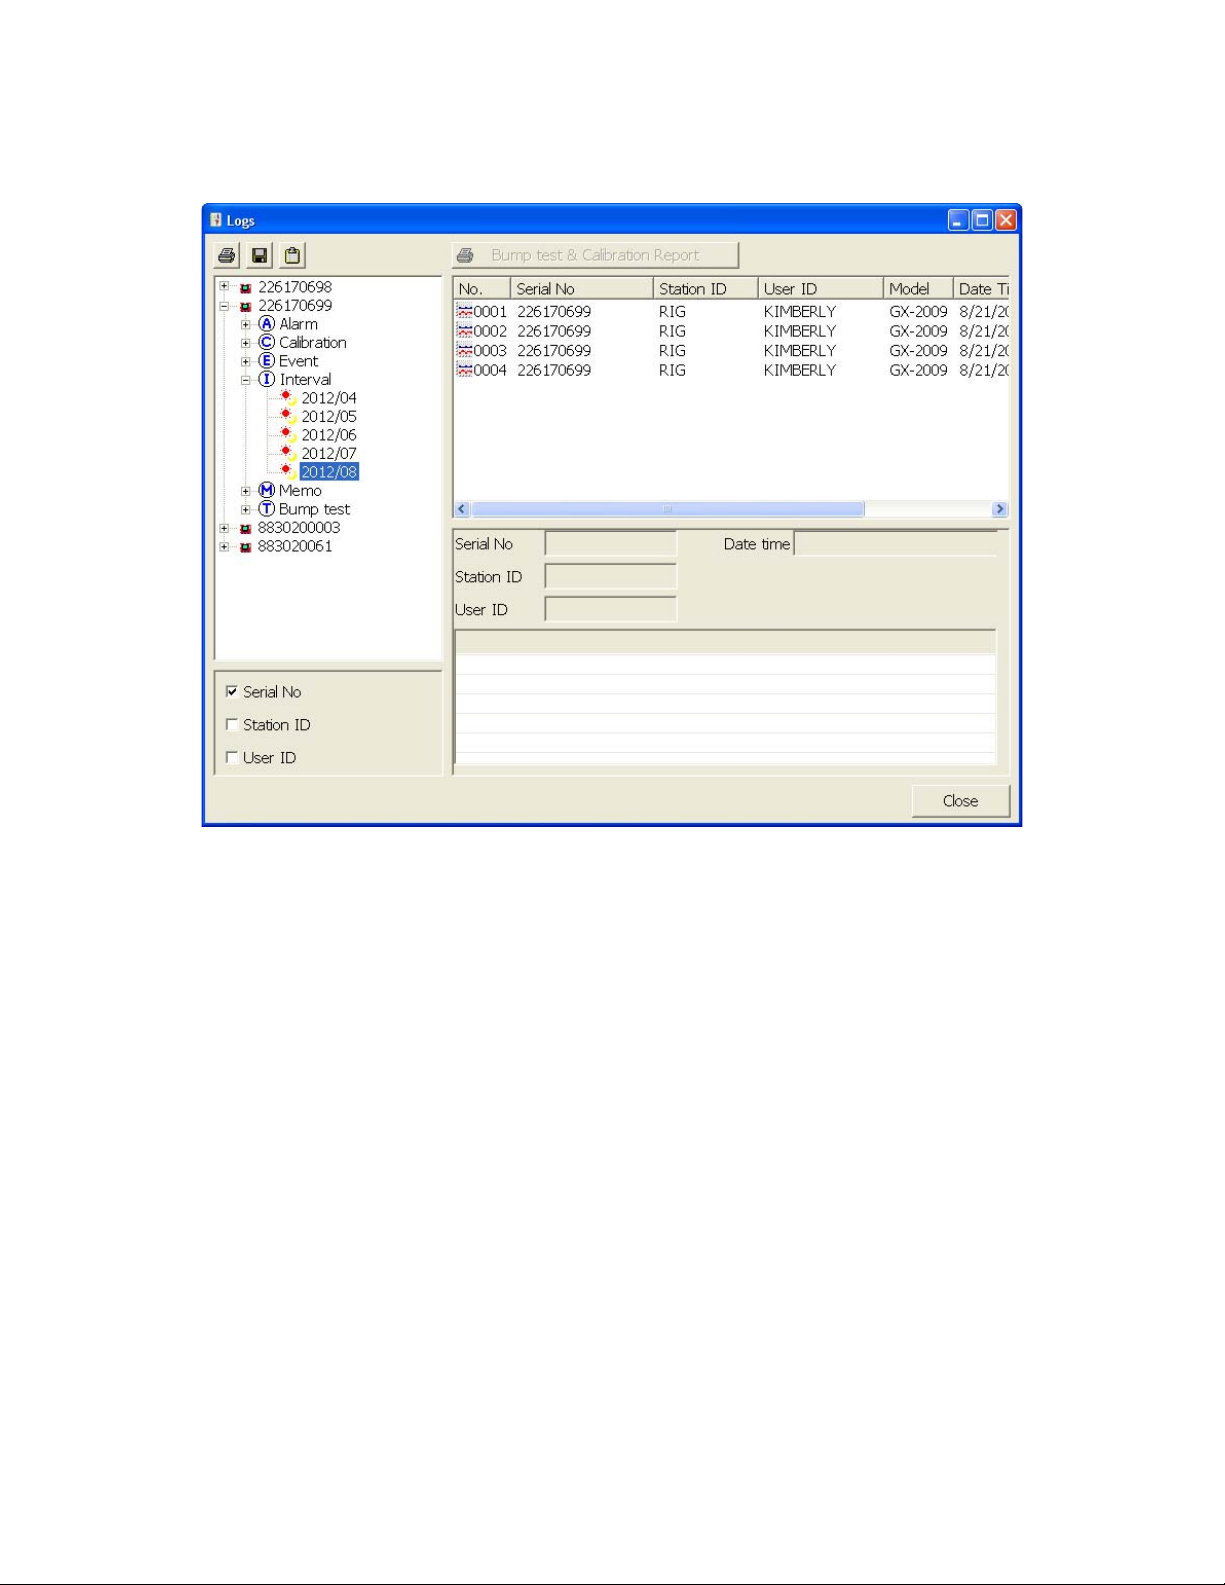
If any of these boxes are selected, the Base view box disappears. Click the
selection box or boxes in the lower left frame to organize the data as desired.
Figure 51: Logs Window in ID View Format
To view data in the ID View Format:
a. Select one or more of the ID view choices, Serial No., Station ID, or
User ID.
b. Click the expanded view symbol (+) next to an ID folder (Serial No.,
Station ID, or User ID) in the Data frame of the Logs window or
double click the folder to view the contents below it.
c. Click the expanded view symbol (+) next to the data type folder
(Alarm, Calibration, etc.) you wish to view or double click the folder
to view the contents below it.
d. Single click on a date folder. The dates are displayed in year/month
format. All of the files in that date folder will appear in the upper right
frame of the Logs window.
e. If an item is expanded and you want to close it, click the (-) symbol
next to the item or double click it.
When viewing data by Serial No., no two instruments should have the same
serial number. However, if two instruments do have the same serial number
Logs Window • 7 0
Page 76

and have data for the same year/month, they will be distinguished by their
different Station ID or User ID. When viewing data by Station ID or by User ID,
if two instruments have the same Station ID and/or User ID and have data for
the same year/month, they will be distinguished by their different serial
numbers.
NOTE: In the examples that follow, the data will be shown organized by seri al
number. If you do not select any of the organization boxes or select the
Station ID or User ID boxes instead of or in addition to the Serial No.
box, your Logs Window will look slightly different.
Alarm Trend Data
The instrument saves files that describe the most recent gas alarm events. If a gas
alarm event occurs, then an alarm trend file that is centered around the event is
saved. It shows the readings up to 30 minutes before and 30 minutes after the event,
with the log interva l time every 5 seconds. The readings that are saved are the peak
(minimum for oxygen) readings for the previous 5 seconds. If the instrument has not
been on for 30 minutes before the alarm event occurs, the data during this time is left
blank. If the instrument is turn ed off le ss than 30 minu tes af ter an alarm e vent occurs,
the data file will only have logged data until the unit was turne d o ff.
The instrument saves up to 8 alarm trend files. When an alarm event triggers an
alarm trend file to be saved, subsequent alarm events must occur 15 minutes after
the previous triggeri n g eve nt i n or de r to trigg er the savi n g of an oth er al arm tre nd fil e.
If 8 alarm trend files are already saved in the instrument’s memory, the oldest alarm
trend file is overwritten when a new alarm trend file is saved.
Alarm trend data is downloaded from an instrument when a complete download is
performed. To view and perform desired operations with the alarm trend files:
1. While in the Logs window, find your instrument by serial number , then click the
expanded view symbol (+) of or double-click the serial number folder to view
the conte nts.
2. Click the expanded view symbol (+) of or double-click the Alarm folder to view
the contents. Alarm trend data folders are arranged by year/month.
71 • Logs Window
Page 77
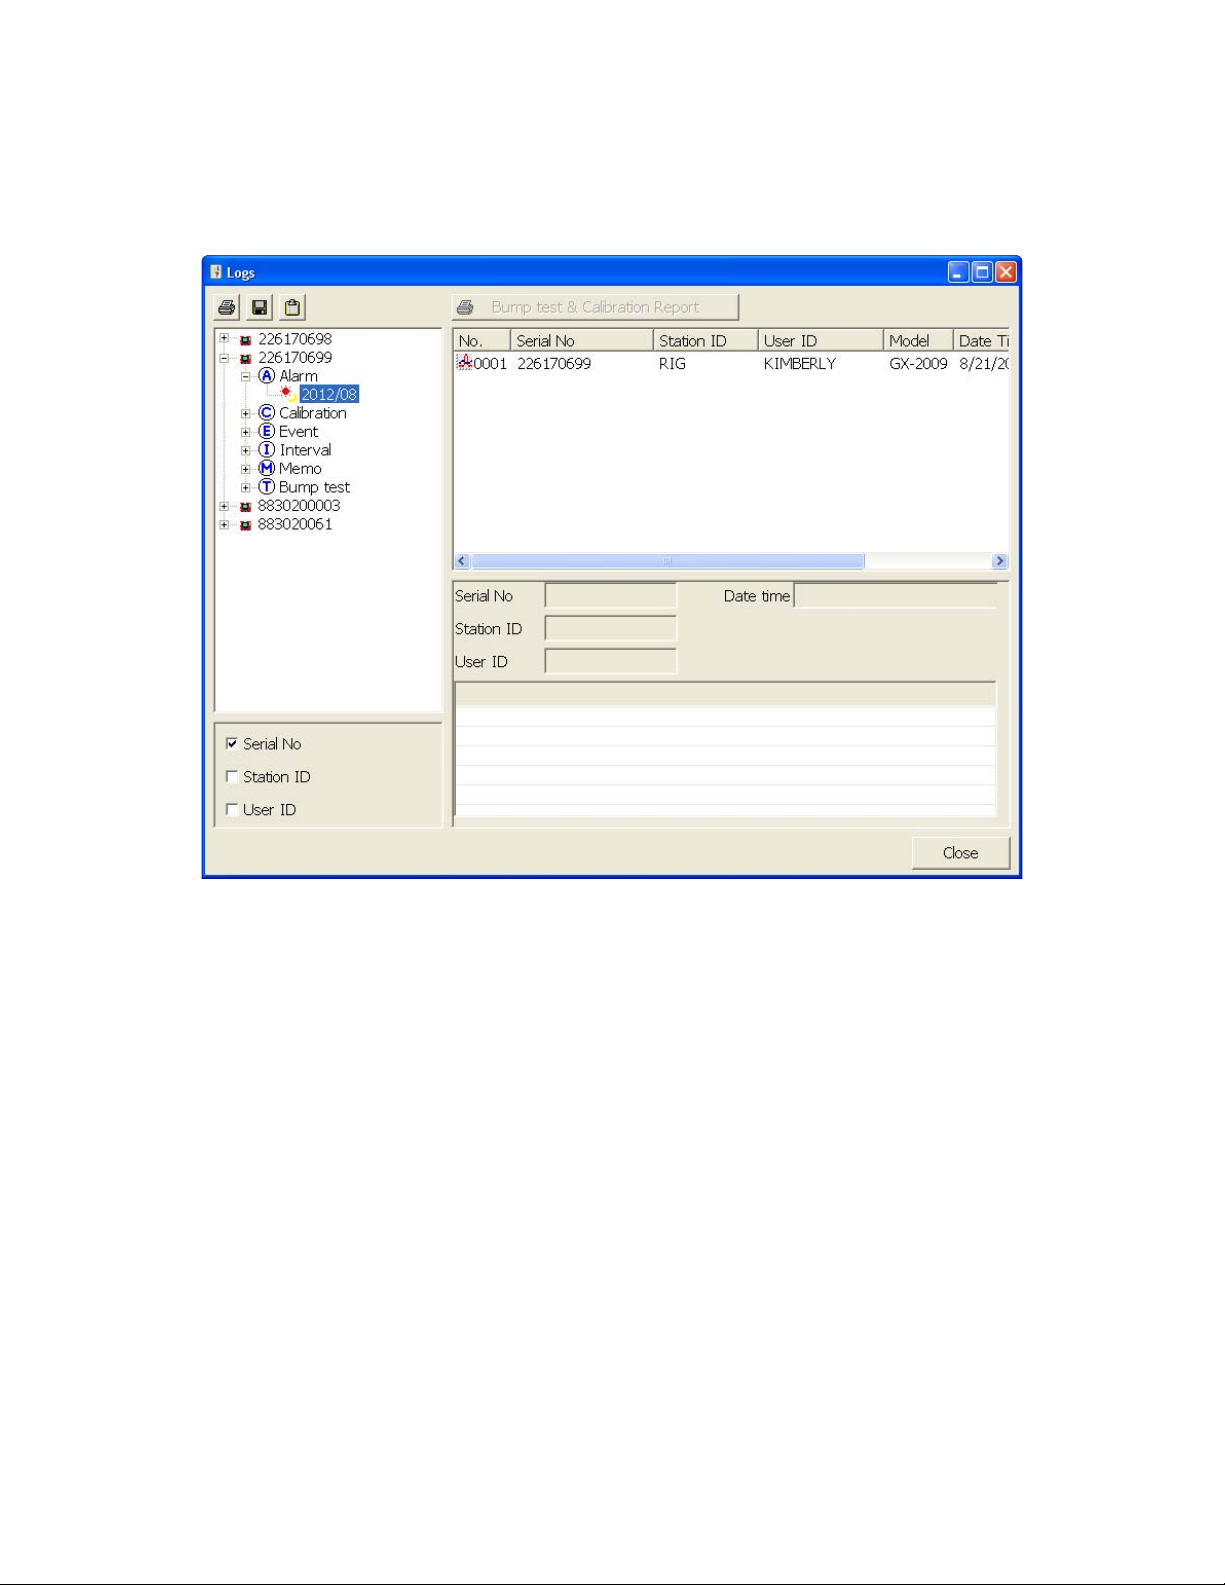
3. Click the year/month folder you wish to view. All alarm trend data files for that
instrument in th at particular year/month will appear in the upper right frame.
The file number, serial number, station ID, user ID, model, date/time, and
sample count of the alarm trend file appear in the same line.
Figure 52: Viewing Alarm Trend Files
Logs Window • 7 2
Page 78
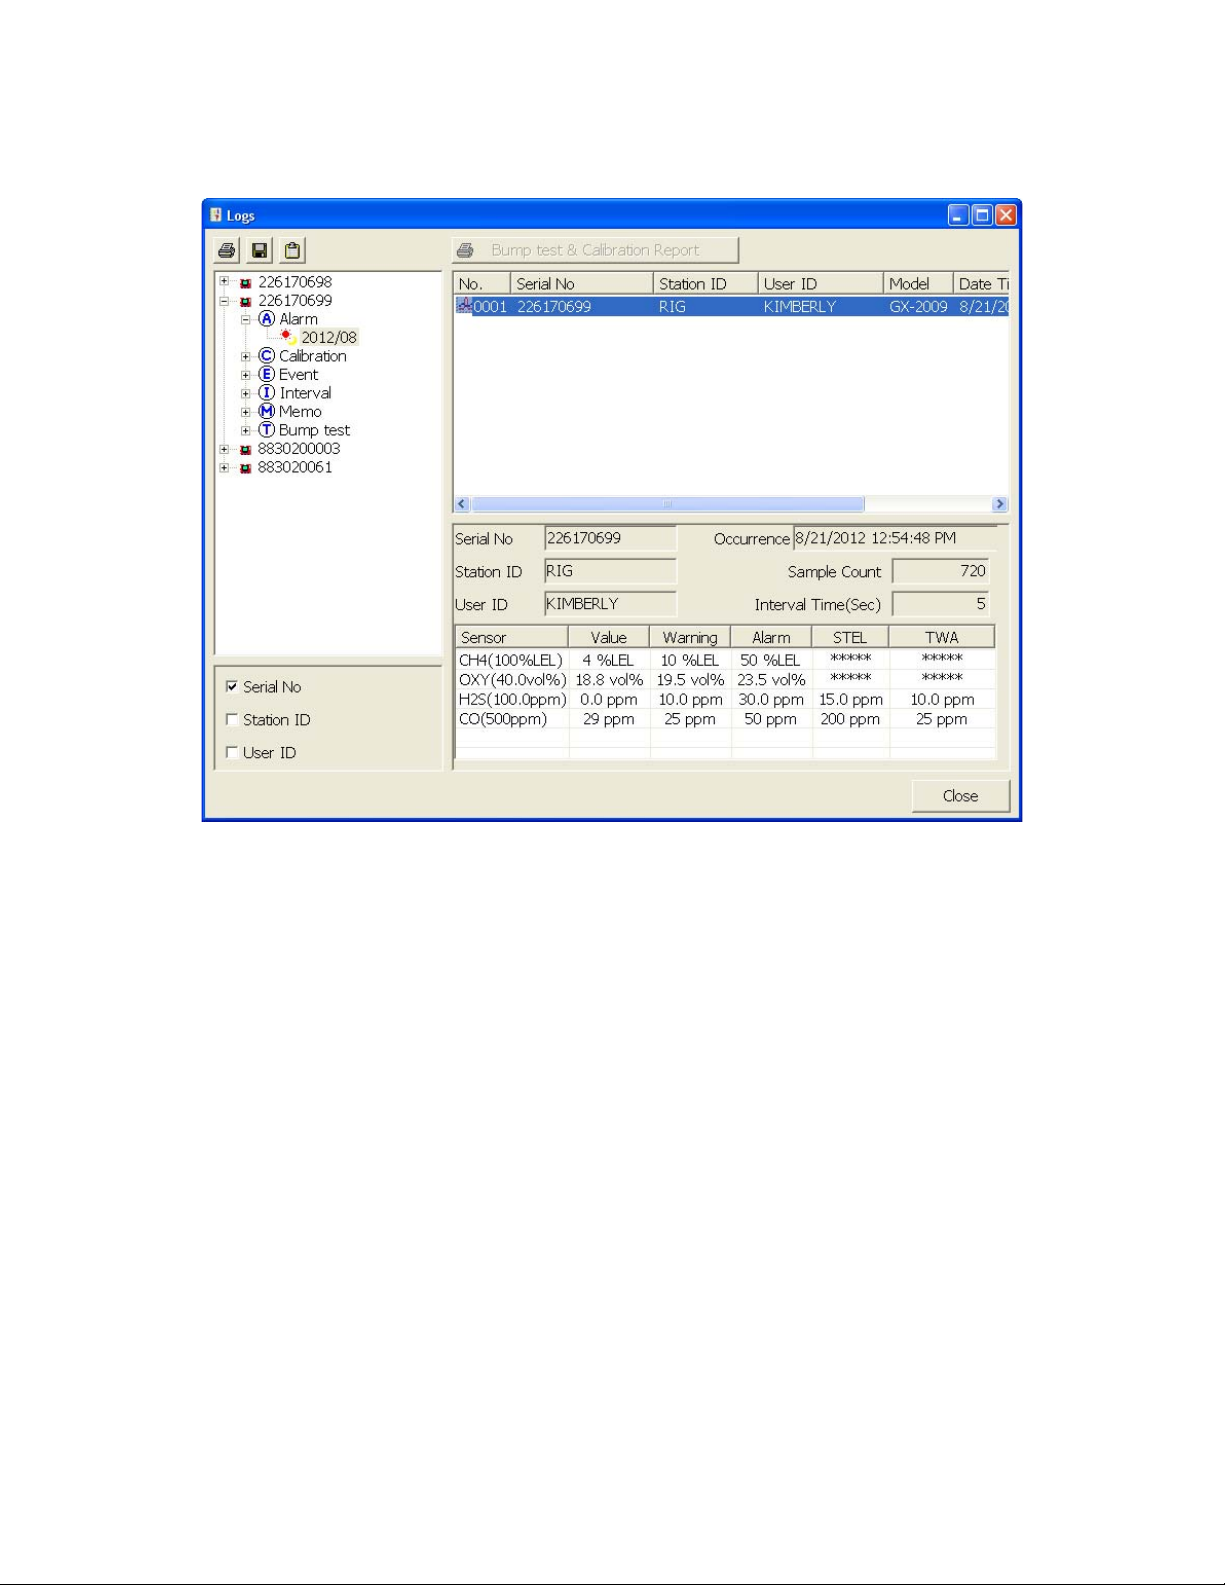
4. Click a file to see the instrument information, gas readings at the time of the
event, and the alarm setpoints in the lower right frame.
Figure 53: Alarm Trend Data
73 • Logs Window
Page 79
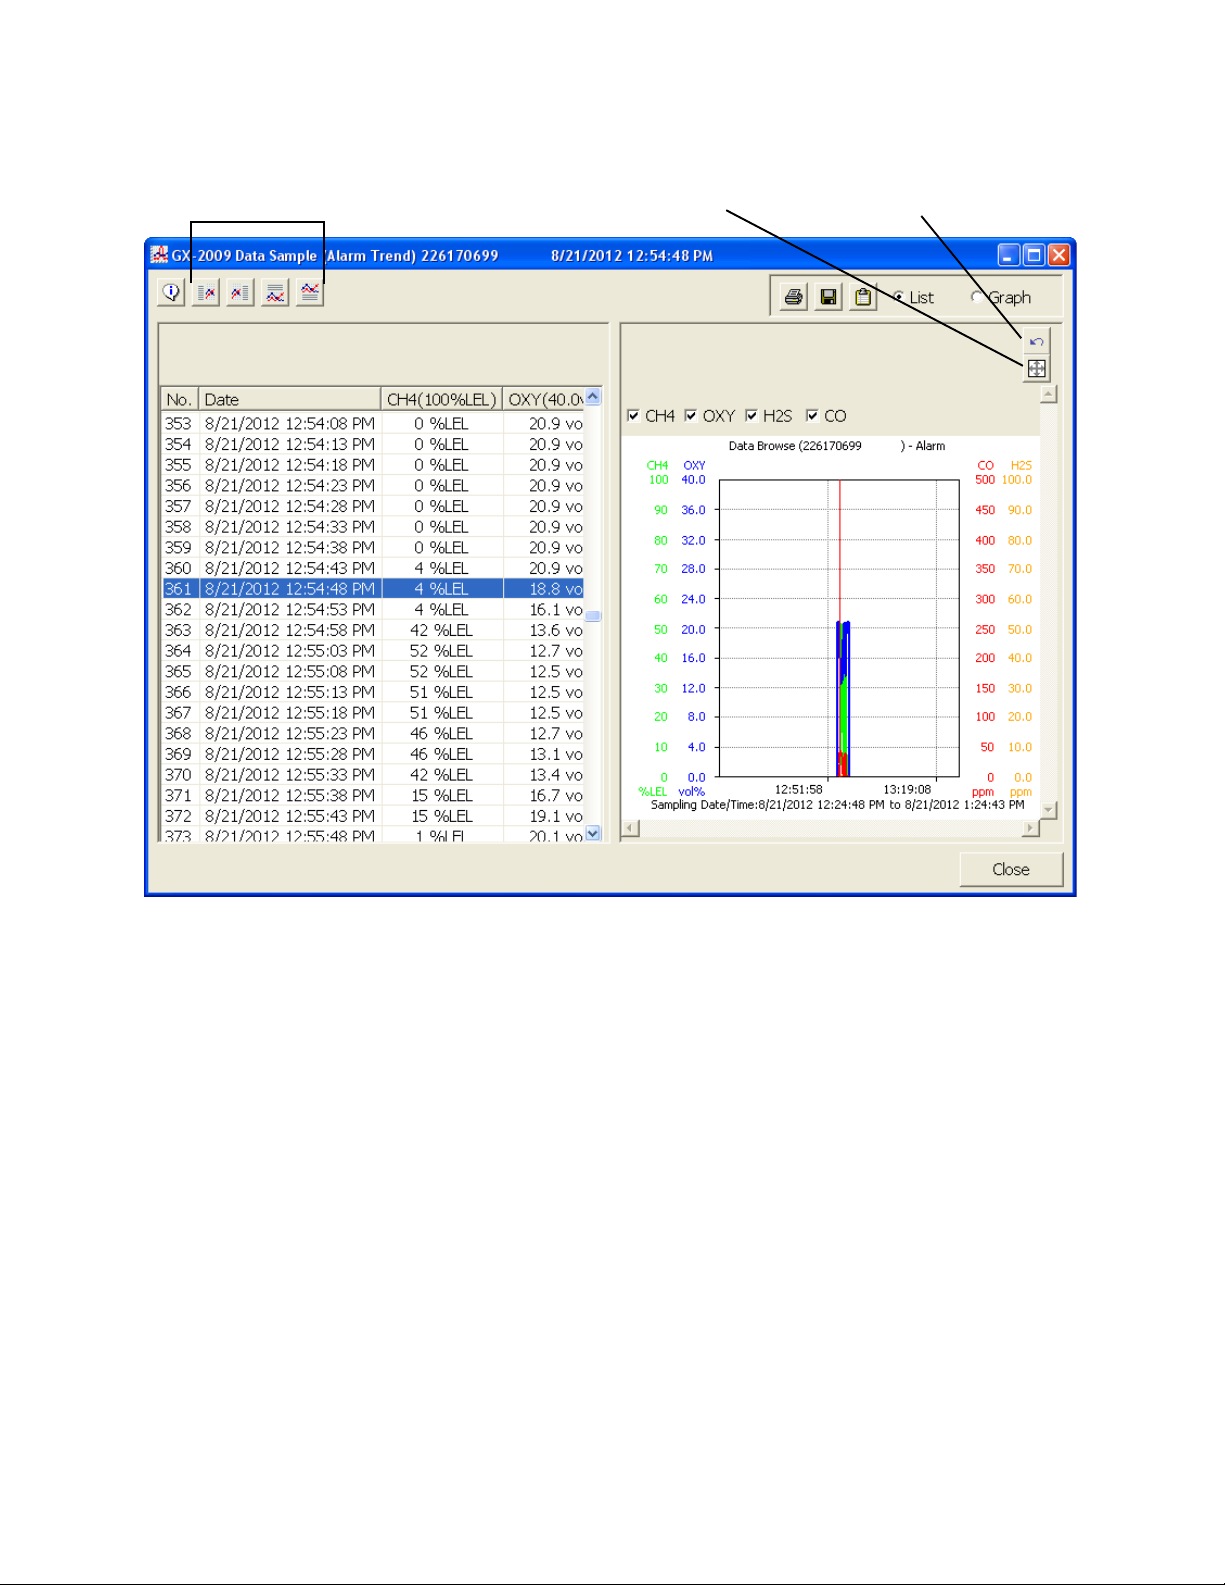
5. To view the alarm trend data, double click the desired file.
Restore Previous
Layout Control Buttons
6. In the table part of the screen,
Figure 54: Alarm Trend Data
Each data point will be displayed in the left half of the screen along with the
peak readings (minimum for oxygen) over the previous 5 seconds. A graph of
the data will appe ar on the right half of the screen.
To change the layout of the table and chart in relation to each other, click any
of the four layout control button s in the upp er le f t cor ne r of the scre en .
To change the proportions of the table to the graph, click the divider between
the two and move it.
To display instrum ent inform ation along wit h the da ta t able and graph , click the
“i” control button in the upper left corner.
• The gas readings at the time of the alarm event around which the lo gged
data is centered are highlighted in red and are the instantaneous readings
at that time.
Logs Window • 7 4
Page 80
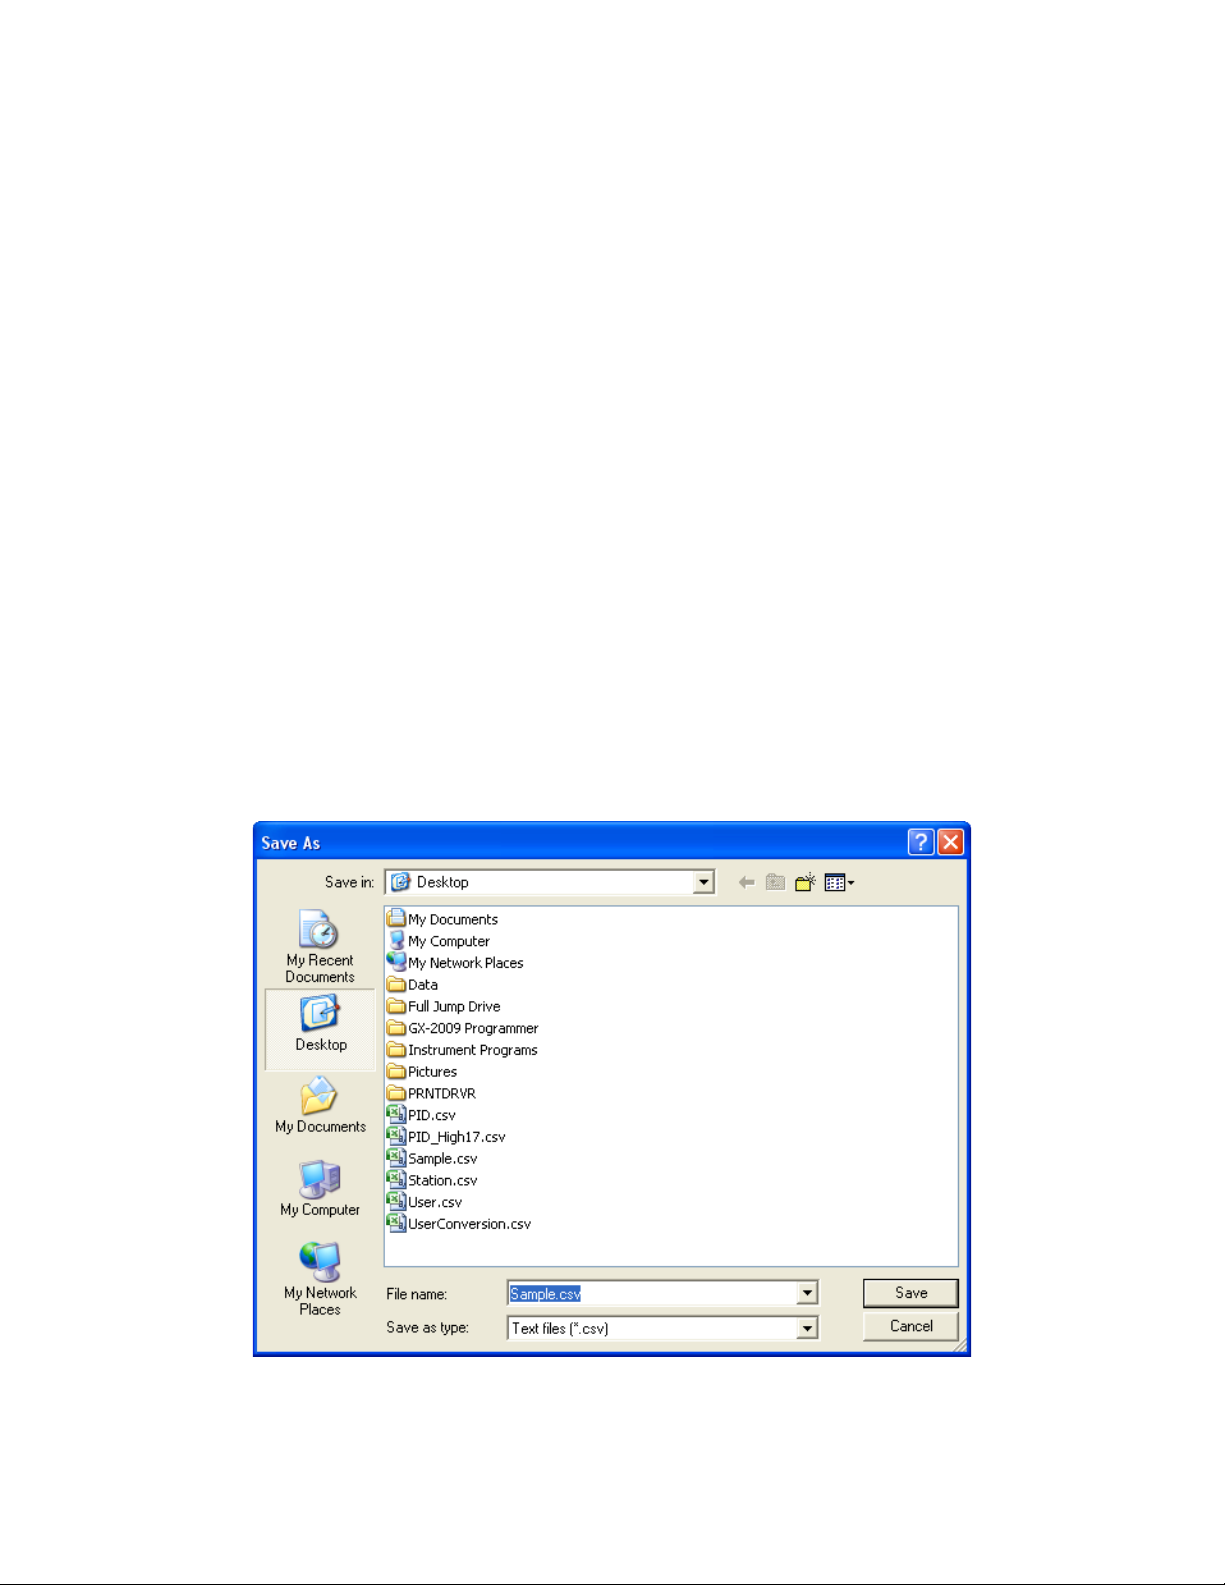
7. In the graph part of the screen,
• You can choose which gas(es) you want to graph by selecting or
deselecting the boxes next to each gas name.
• To zoom in on a particular part of the graph, drag a box around that area so
that it is highlighte d i n g ra y. The graph will zoom in. To return to a previous
zoom, click the Pre vious control button in the upper right corner of the
graph section. To return to the original zoom, click the Restore control
button in the upper right corner of the graph section.
• A vertical red line appears on the graph at the point that created the alarm
trend file. Clicking anywhere on the graph will move that red line and
highlight that data point in the table. Clicking a data point in the table will
move the red line in the graph to that data point.
8. To print the data, select either List or Graph in the upper right corner of the
window and then click the Print control button in the upper right corner of the
window. The Print control button has a printer icon on it. A dialog box will
appear confirming if you want to print. Click OK. If Graph is selected, the data
will print as a graph. If List is selected, the data will print as a table.
9. To save the data to a file which can be imported into another program, select
either List or Graph in the upper right corner of the window and then click the
Save to File control button. The Save to File control button has a floppy disk
icon on it. A dialog box will appear for you to specify the file name, file location,
and file type.
75 • Logs Window
Figure 55: Save As Dialog Box
Page 81

If List is selected, the file type is “.csv” (comma-separated values). If Graph is
selected, the file type is “.bmp” (Windows bitmap). After specifying the file
name and file location, click Save to save the file to the specified location.
10. To save the data to the clipboard, select either List or Graph in the upper right
corner of the windo w and then cli ck the Copy to Clipboard control button. The
Copy to Clipboard control button has a clipboard icon on it. The table or
graph will be saved to the clipboard. It can then be pasted into a document by
using the Paste command in an application.
11. To go back and view other data, click Close to return to the Logs window.
Calibration Data
The instrument is capable of saving calibration information for up to the 100 most
recent calibrations and bump tests combined. When the maximum number of
calibration files is reached, the oldest calibration file is overwritten when a new one is
saved. When an instrument is connected to the PC Controller Program and a
complete download occurs, the calibration files are retrieved and st ored by the
program. In addi tion, all calibrations performed by the PC Controller Program are
stored by the program. To view and perform desired operations with the calibration
files:
1. While in the Logs window, find your instrument by serial number , then click the
expanded view symbol (+) of or double-click the serial number folder to view
the conte nts.
2. Click the expanded view symbol (+) of or double-click the Calibration folder to
view the contents. Calibration data folders are arranged by year/month.
Logs Window • 7 6
Page 82

3. Click the year/month folder you wish to view. All calibration data files for that
instrument in th at particular year/month will appear in the upper right frame.
The file number, serial number, station ID, user ID, model, date/time, and
result of the calibratio n appe ar in the sam e line . If calibr atio ns were pe rfor med
prior to connecting the instrument with the SDM-GX Docking Station PC
Controller software, data for those calibrations will not appear until a complete
download is performed.
77 • Logs Window
Figure 56: Viewing Calibration Log Files
Page 83

4. Click one of the calibration data files. The fields in the bottom right frame will fill
in. The instrument information will be displayed along with the calibration
information. The tested sensors will be displayed along with the final gas
concentration, the calibration gas values, and the result of the calibration.
Figure 57: Viewing Calibration Data
5. Files that record a failed calibration on all channels are highlighted in red. Files
that record a calibration where not all channels passed are highlighted in
orange.
6. To print the calibration data (everything in the lower right frame of the screen),
click the Print control button located just above the cali bration ju dge column. A
dialog box will appear confirming if you want to print. Click OK.
7. To print the basic calibration results from a date folder (everything in the up per
right frame), be sur e tha t the desired date fold er is selected and cl ick t he Print
control button in the upper left corner of the Logs window. A dialog box will
appear confirming if you want to print. Click OK.
8. To print detailed calibration data for each calibration file in a date folder, be
sure that the desired date folder is selected and click the Bump Test &
Calibration Report control button along the top of the Logs window. A dialog
box will appear confirming if you want to print. Click OK.
9. To print d etailed calibration and bump test data (if available) for each
Logs Window • 7 8
Page 84

calibration and bump test file for a specific serial number, be sure that the
desired serial number is selected in the upper left frame and click the Bump
Test & Calibration Report control butt on a l on g th e to p o f the Lo gs wi nd ow. A
dialog box will appear confirming if you want to print. Click OK.
10. To save calibration data from a specific date folder, be sure the desired date
folder is highlighted an d click the Save con trol button in the upper lef t corner of
the Logs window. A “Save As” dialog box will appear for you to specify the file
name and file location.
Figure 58: Save As Dialog Box
The file type will be “.csv” (comma separated value).
Specify the file name and location and click Save.
11. To copy calibrat ion data in a date folder to the clipboard, be sure the desired
date folder is selected and click the Save to Clipboard control button. The
data will be saved to the clipboard. It can then be pasted into a document by
using the Paste command in an application.
Event Data
The instrument saves the 100 most recent alarm events and the 100 most recent
trouble events. When an instrume nt is co nnected to t he PC Contr oller Prog ram and a
complete download is performed, the alarm and trouble event files are retrieved and
saved in the program.
Alarm event files save the time, instrument channel, gas, and alarm type of every gas
alarm event that occurs on a particular instrument. Warning (low alarm), Alarm (high
alarm), STEL, TWA, and overscale events are saved.
79 • Logs Window
Page 85
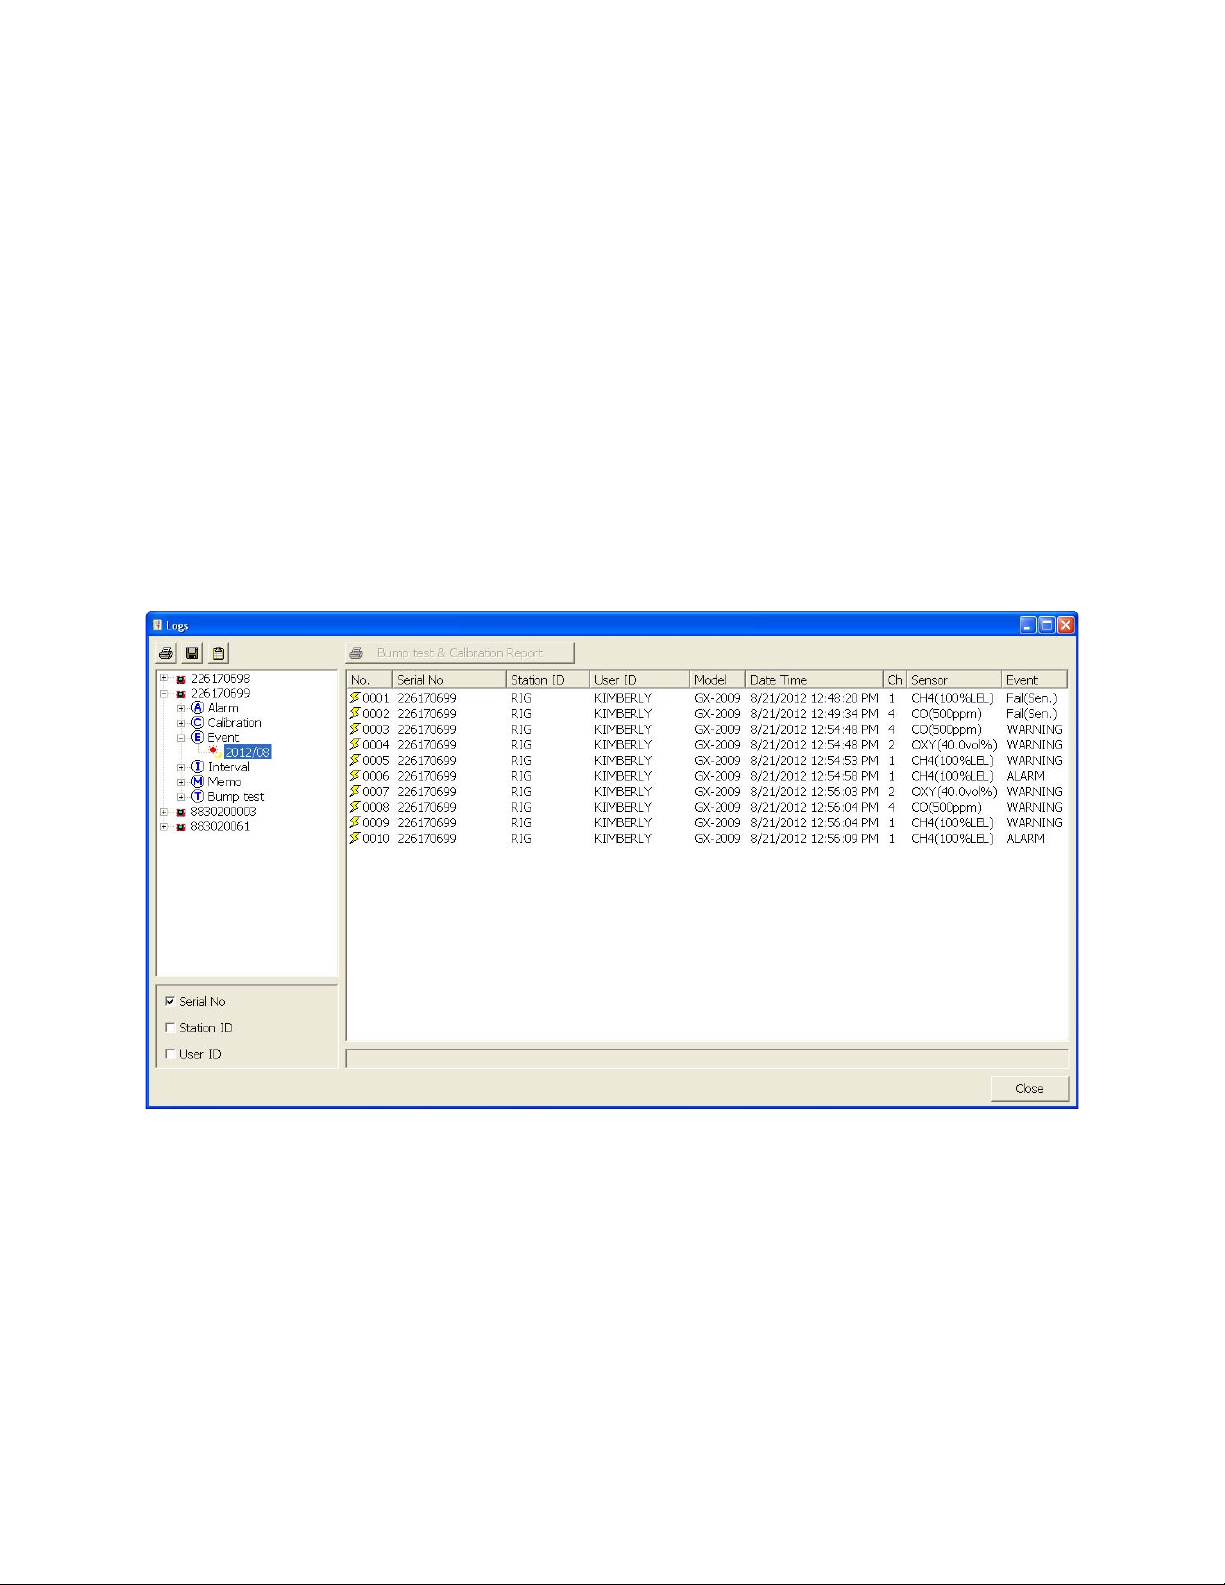
Trouble event files note the time, instrument channel, whether the event is an
instrument system failure or sensor failure, and the specific type of failure. Calibration
failures, dead battery alarms, and sensor failures are among the trouble events that
are saved.
Even though two types of files are saved, the PC Controller Program does not
distinguish between the two and shows them together and with the same lightning
bolt symbol. To view and perform desired operations with the event files:
1. While in the Logs window, find your instrument by serial number , then click the
expanded view symbol (+) of or double-click the serial number folder to view
the conte nts.
2. Click the expanded view symbol (+) of or double-click the Event folder to view
the contents. Event data folders are arranged by year/month.
3. Click the year/month folder you wish to view. All event data files for that
instrument in th at particular year/month will appear in the upper right frame.
The file number, serial number, station ID, user ID, model, date/time, channel
number, sensor, and event type appear in the same line.
Figure 59: Viewing Event Data
4. To print event data from a date folder, be sure the desired date folder is
selected and click the Print control button in the upper left corner of the Logs
window. A dialog box will appear confirming if you want to print. Click OK.
Logs Window • 8 0
Page 86

5. To save event data from a date folder, be sure the desired date folder is
selected and click the Save control button in the upper left corner of the Logs
window. A “Save As” dialog box will appear for you to specify the file name and
file location.
Figure 60: Save As Dialog Box
The file type will be a “.csv” (comma separated value).
Specify the file name and location and click Save.
6. T o copy eve nt data from a dat e folder to th e clipboard, be sure th e desired date
folder is selected and click the Save to Clipboard control button. The data will
be saved to the clipboard. It can then be pasted into a document by using the
Paste command in an application.
Interval Trend Data
Average gas concentrations over the user defined interval trend time are logged in
the interval trend data files. The interval trend time is set using either the Data Log
Interval menu item in the Edit Function Screen, the GX-2009 Data Logger
Management Program, or the GX-2009 User Setup Program. See “Edit Function” on
page 95, the GX-200 9 Data Logger Management Pro gram Oper ator’s Man ual, or th e
GX-2009 User Setup Program Operator’s Manual for instructions to set the interval
trend time. Events such as gas alarms or sensor failures are saved in the interval
trend data file when they occur.
An interval trend da t a fil e is cr eated a nd save d in th e instru ment when the in strum ent
is turned off. The serial number, user ID, and station ID that are entered in the
instrument when it is turned on are saved for the corresponding interval trend file . If
the instrument ’s seria l num ber, user ID, or statio n ID are change d usin g the GX -200 9
81 • Logs Window
Page 87

User Setup Program, any interval trend files that result from subsequent operating
sessions will have the new serial number, user ID, or station ID saved in them.
The data may be vi ewed i n both ta ble f ormat a nd gr aph fo rmat if at le ast 5 sche dule d
data points have been logged at the programmed interval trend time. This does not
include events. If an interval data file has fewer than five scheduled data points, the
graph controls are not functional and the data is shown only in table format.
Interval trend data will not appear unless a complete download is performed. To view
and perform desired operations with the interval trend files:
1. While in the Logs window, find your instrument by serial number , then click the
expanded view symbol (+) of or double-click the serial number folder to view
the conte nts.
2. Click the expanded view symbol (+) of or double-click the Interval folder to
view the contents. Interval data folders are arranged by year/month.
3. Click the year/month folder you wish to view. All interval trend data files for that
instrument in th at particular year/month will appear in the upper right frame.
The file number, serial number, station ID, user ID, model, date/time, and
sample count of the interval trend appear in the same line.
Figure 61: Viewing Interval Trend Files
Logs Window • 8 2
Page 88

4. Click one of the interval trend dat a file s. The fields in the bottom right frame will
fill in. The instrument informa tio n will be displayed along with the average,
minimum, and maximum gas readings for the operating session. Also
displayed are the minimum date, the maximum date, and the warning, alarm,
STEL, and TWA setpoints.
Figure 62: Interval Trend Data
83 • Logs Window
Page 89

5. To view the interval trend data, double click the desired file.
Layout Control Buttons Restore Previous
Figure 63: Interval Trend Data
In table format on the lef t half of the screen, the interval tr end dat a is shown as
the average gas readings over the user defined interval tr end time. So if the
data logging session started at 4:13:38 PM and the interval time is set to 1
minute, then t he readings logged at 4:14:38 PM are the average reading for
each channel over that one minute period. If a channel went into Warning or
Alarm, it will be indicated. A graph of the data will appear on the right half of
the screen.
Events are displaye d on the screen un der the chan nel in which th ey occur and
with the time of the event. Events are displayed whether they occurred at
scheduled log times or in between them. Events include gas alarms such as a
warning condit ion, trouble conditions s uch as a sensor failure, an d an
indication that the unit is returning to “normal” condition after an alarm has
been reset usin g the POWER MODE button on the in strument.
To change the layout of the table and chart, click any of the four layout control
buttons in the upper left corner of the screen.
Logs Window • 8 4
Page 90

To change the proportions of the table to the graph, click the divider between
the two and move it.
To display instrument information along with the data and graph, click the “i”
control button in the upper left corner.
6. In the table part of the screen,
• To view only events in the interval trend data file, click the Only Event
selection box.
7. In the graph part of the screen,
• You can choose which gas(es) you want to graph by selecting or
deselecting the boxes next to each gas name.
• Click the Event box to show event data on the grap h. Small indications will
appear at the top of the graph to show when an event occurred.
• To zoom in on a particular part of the graph, drag a box around that area so
that it is highlighte d i n g ra y. The graph will zoom in. To return to a previous
zoom, click the Pre vious control button in the upper right corner of the
graph section. To return to the original zoom, click the Restore control
button in the upper right corner of the graph section.
• Clicking anywhere on the graph will cause a vertical red line to appear and
the corresponding data point will be highli ghted i n the t able. Cl icking a dat a
point in the table will move the red line in the graph to that data point.
8. To print the data, select either List or Graph in the upper right corner of the
window and then click the Print control button in the upper right corner of the
window. The Print control button has a printer icon on it. A dialog box will
appear confirming if you want to print. Click OK. If Graph is selected, the data
will print as a graph. If List is selected, the data will print as a table.
85 • Logs Window
Page 91

9. To save the data to a file which can be imported into another program, select
either List or Graph in the upper right corner of the window and then click the
Save to File control button. The Save to File control button has a floppy disk
icon on it. A dialog box will appear for you to specify the file name, file location,
and file type.
Figure 64: Save As Dialog Box
If List is selected, the file type is “.csv” (comma-separated values). If Graph is
selected, the file type is “.bmp” (Windows bitmap). After specifying the file
name and file location, click Save to save the file to the specified location.
10. To save the data to the clipboard, select either List or Graph in the upper right
corner of the windo w and then cli ck the Copy to Clipboard control button. The
Copy to Clipboard control button has a clipboard icon on it. The table or
graph will be saved to the clipboard. It can then be pasted into a document by
using the Paste command in an application.
11. To go back and view other data, click Close to return to the Logs window.
Memo Data
Any information entered into the Memo field in the Edit windo w is saved in a file in the
Logs window. If there is text in the Memo field, a new file is created every time an
instrument is connected to the PC Controller Program. If a ch ange is made to the
Memo, the change is saved in the Memo file for that operating session. See
“Parameter Tab” on page 96 for instructions to use the Memo field. To view and
perform desired operations with the memo files:
1. While in the Logs window, find your instrument by serial number , then click the
Logs Window • 8 6
Page 92

expanded view symbol (+) of or double-click the serial number folder to view
the conte nts.
2. Click the expanded view symbol (+) of or double-click the Memo folder to view
the contents. Memo data folders are arranged by year/month.
3. Click the year/month folder you wish to view. All memo files for that instrument
in that particular year/month will appear in the upper right frame. The file
number, serial number, station ID, user ID, model, date/time, and the first few
words of the memo appear in the same line.
87 • Logs Window
Figure 65: Viewing Memo Files
Page 93

4. Click on one of the memo files. The fields in the bottom right screen will fill in.
The instrument information will be displayed along with the memo information.
Figure 66: Viewing Memo File Data
5. T o print memo dat a, click the Print control bu tton in the uppe r l ef t cor ner of t he
Logs window. A dialog box will appear confirming if you want to print. Click OK.
Logs Window • 8 8
Page 94
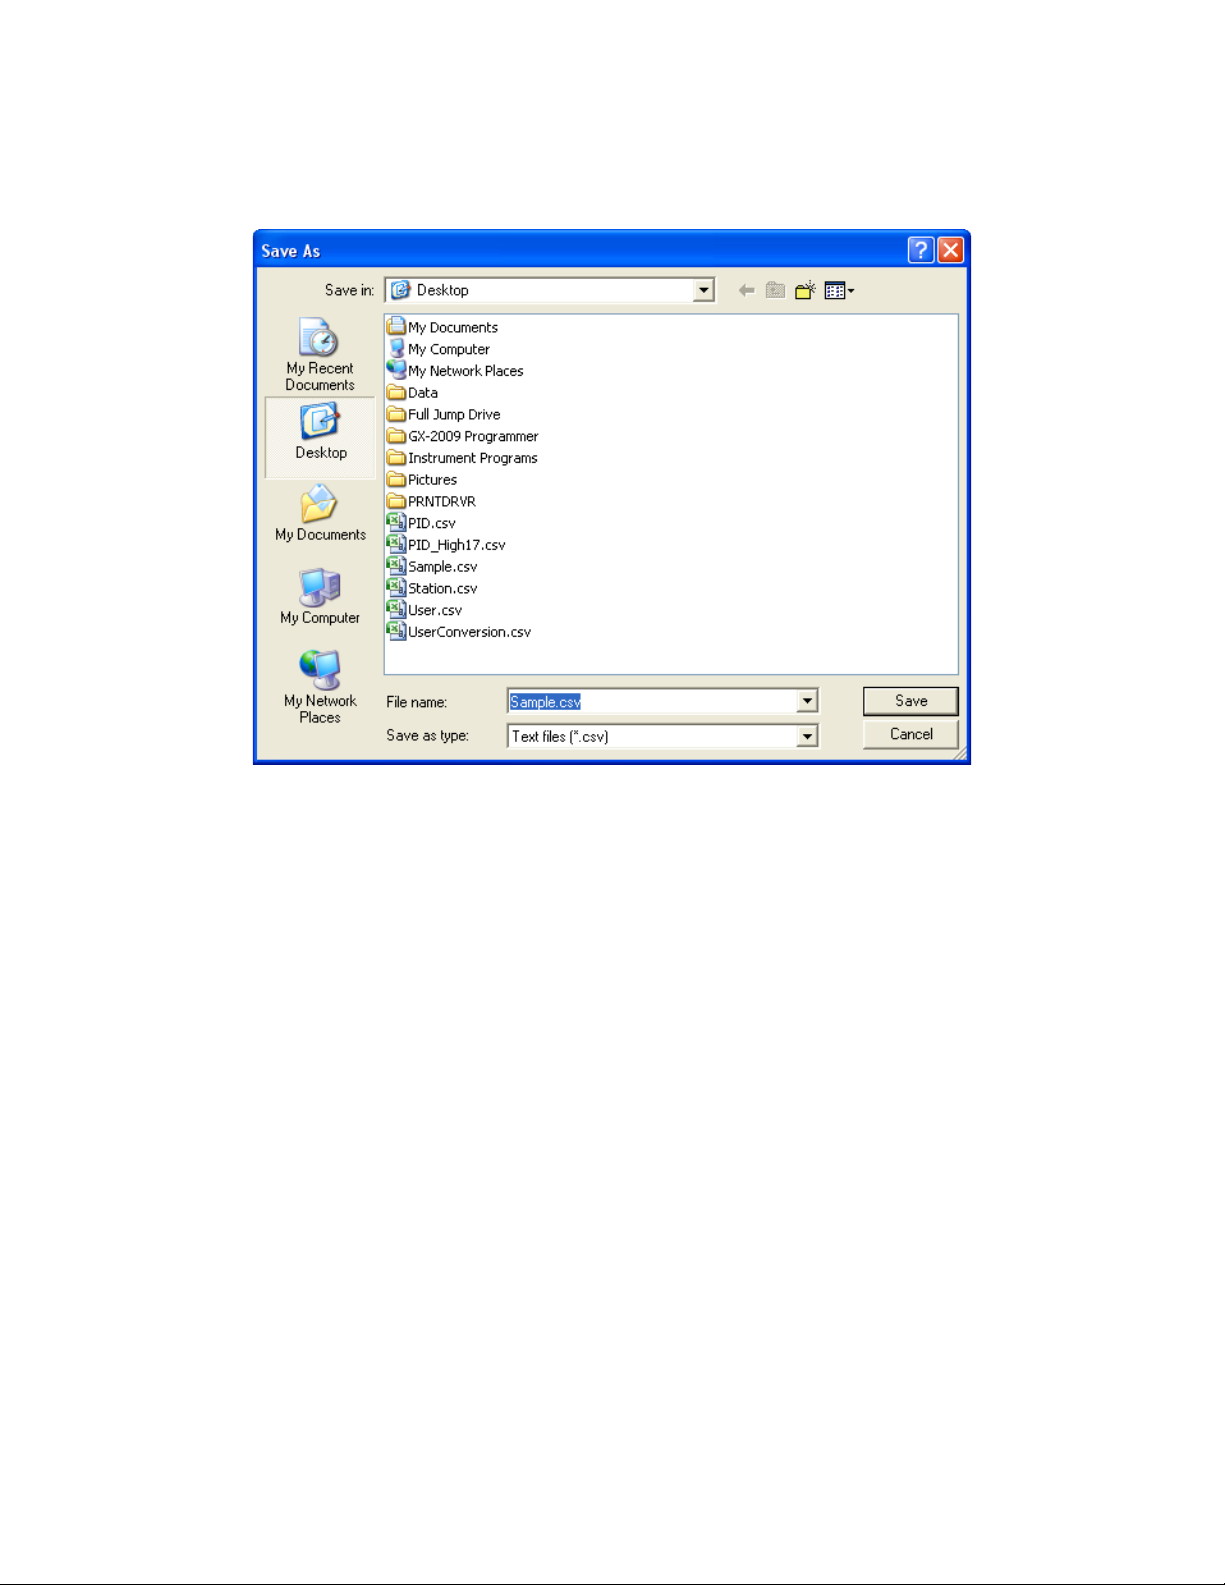
6. T o save memo dat a, click the Save control button in the upper left corner of the
Logs window. A “Save As” dialog box will appear for you to specify the file
name and file location.
Figure 67: Save As Dialog Box
The file type will be “.csv” (comma separated value).
Specify the file name and location and click Save.
7. To copy memo data to the clipboard, click the Save to Clipboard control
button. The data will be saved to the clipboard. It can then be pasted into a
document by using the Paste command in an application.
Bump Test Data
The instrument is capable of saving bump test information for up to the 100 most
recent calibrations and bump tests combined. When an instrument is connected to
the PC Controller Program and a complete download occurs, the bump test files are
retrieved and stored by the pr og r am . In add i tion, all bump tests performed by the PC
Controller Program are stored by the program. To view and perform desired
operations with the bump test files:
1. While in the Logs window, find your instrument by serial number , then click the
expanded view symbol (+) of or double-click the serial number folder to view
the conte nts.
2. Click the expanded view symbol (+) of or double-click the Bump Test folder to
view the contents. Bump test data folders are arranged by year/month.
89 • Logs Window
Page 95
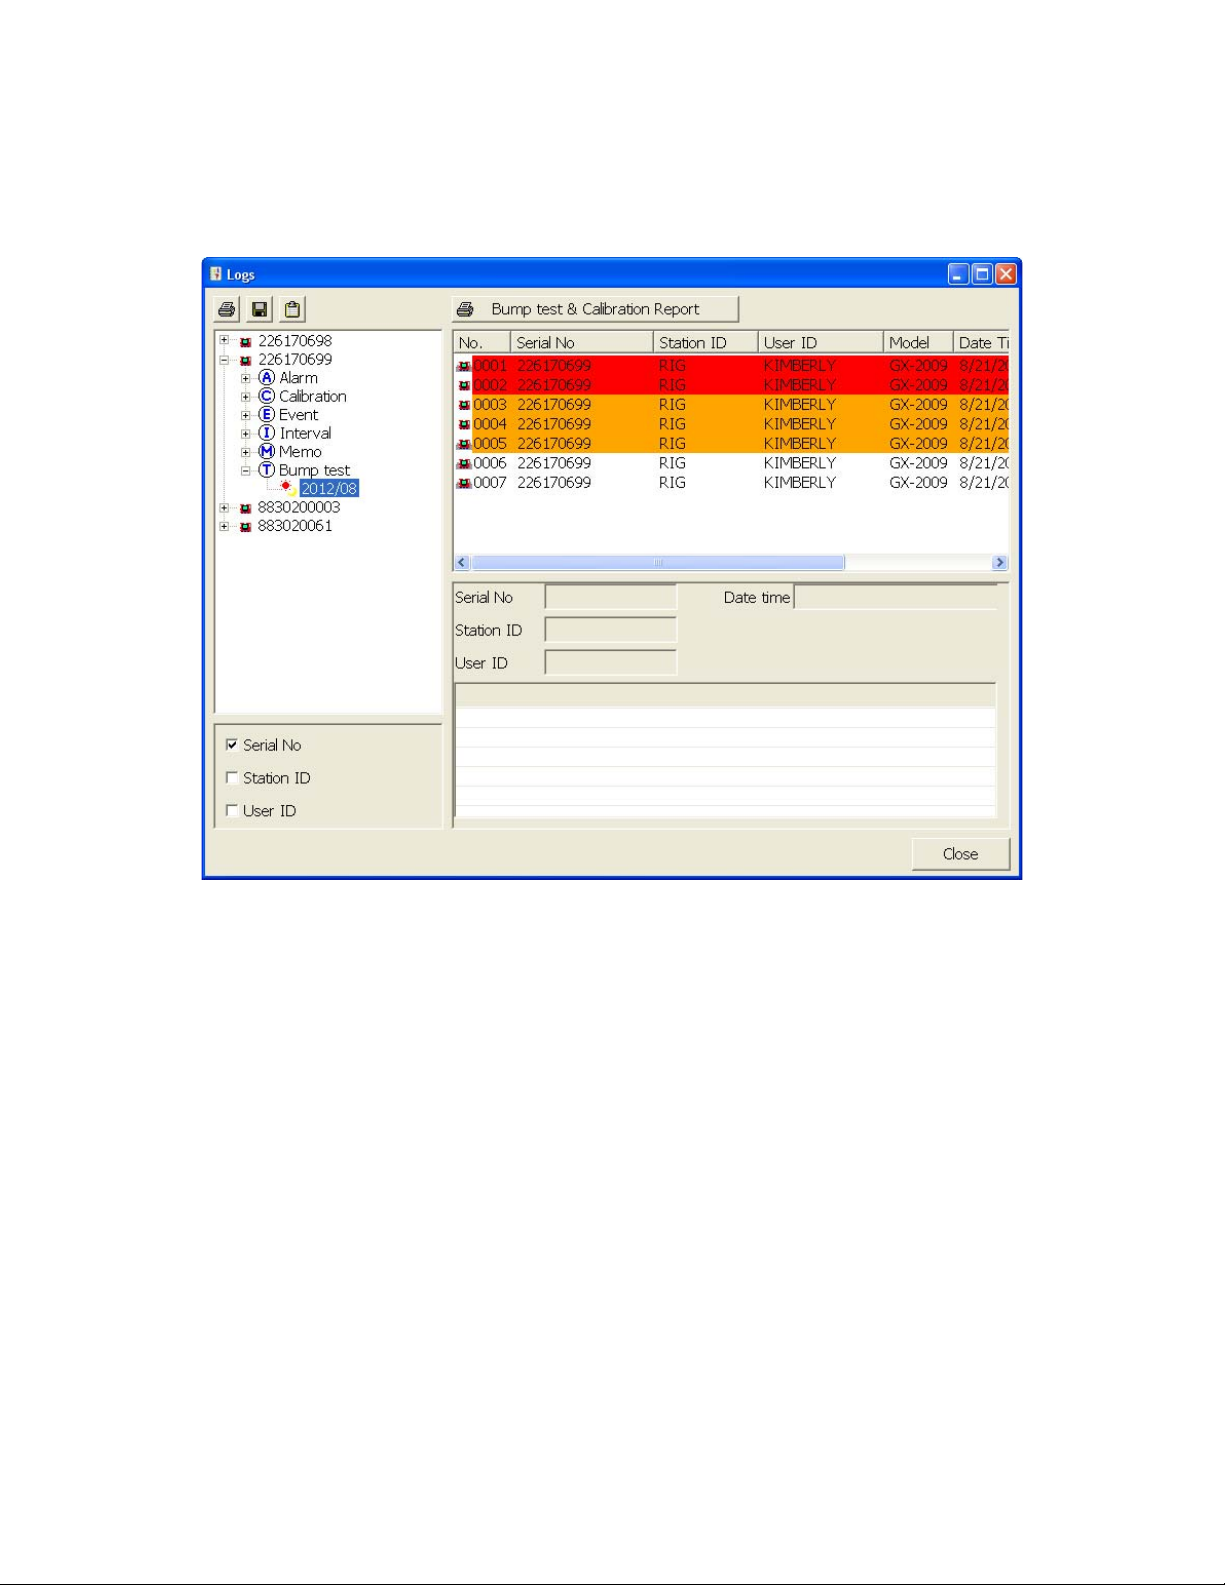
3. Click the year/month folder you wish to view. All bump test data files for that
instrument in th at particular year/month will appear in the upper right frame.
The file number, serial number, station ID, user ID, model, date/time of the
bump test, and the results appear in the same line.
Figure 68: Viewing Bump Test Log Files
Logs Window • 9 0
Page 96

4. Click on one of the bump test data files. The fields in the bo ttom right fram e will
fill in. The instrument information will be displayed along with the bump test
information. The te sted se nsors w ill be disp layed a lon g with the bump test gas
reading, the bump test gas values, and the result of the bump test.
Figure 69: Viewing Bump Test Data
5. Files that record a failed bump test on all channels are highlighted in red. Files
that record a bu m p test where not all channels passed are highlighted in
orange.
6. To print the bump test data (everything in the lower right frame of the screen),
click the Print control button located just above the bump test judge column. A
dialog box will appear confirming if you want to print. Click OK.
7. To print the basic bump test results from a date folder (everything in the up pe r
right frame), be sur e tha t the desired date fold er is selected and cl ick t he Print
control button in the upper left corner of the Logs window. A dialog box will
appear confirming if you want to print. Click OK.
8. T o print detailed bump test data for each bump test file in a date folder, be sure
that the desired date fold er is selected and click the Bump Test & Calibration
Report control button along the top of the Logs window. A dialog box will
appear confirming if you want to print. Click OK.
9. To print d etailed calibration (if available) and bump test data for each
91 • Logs Window
Page 97
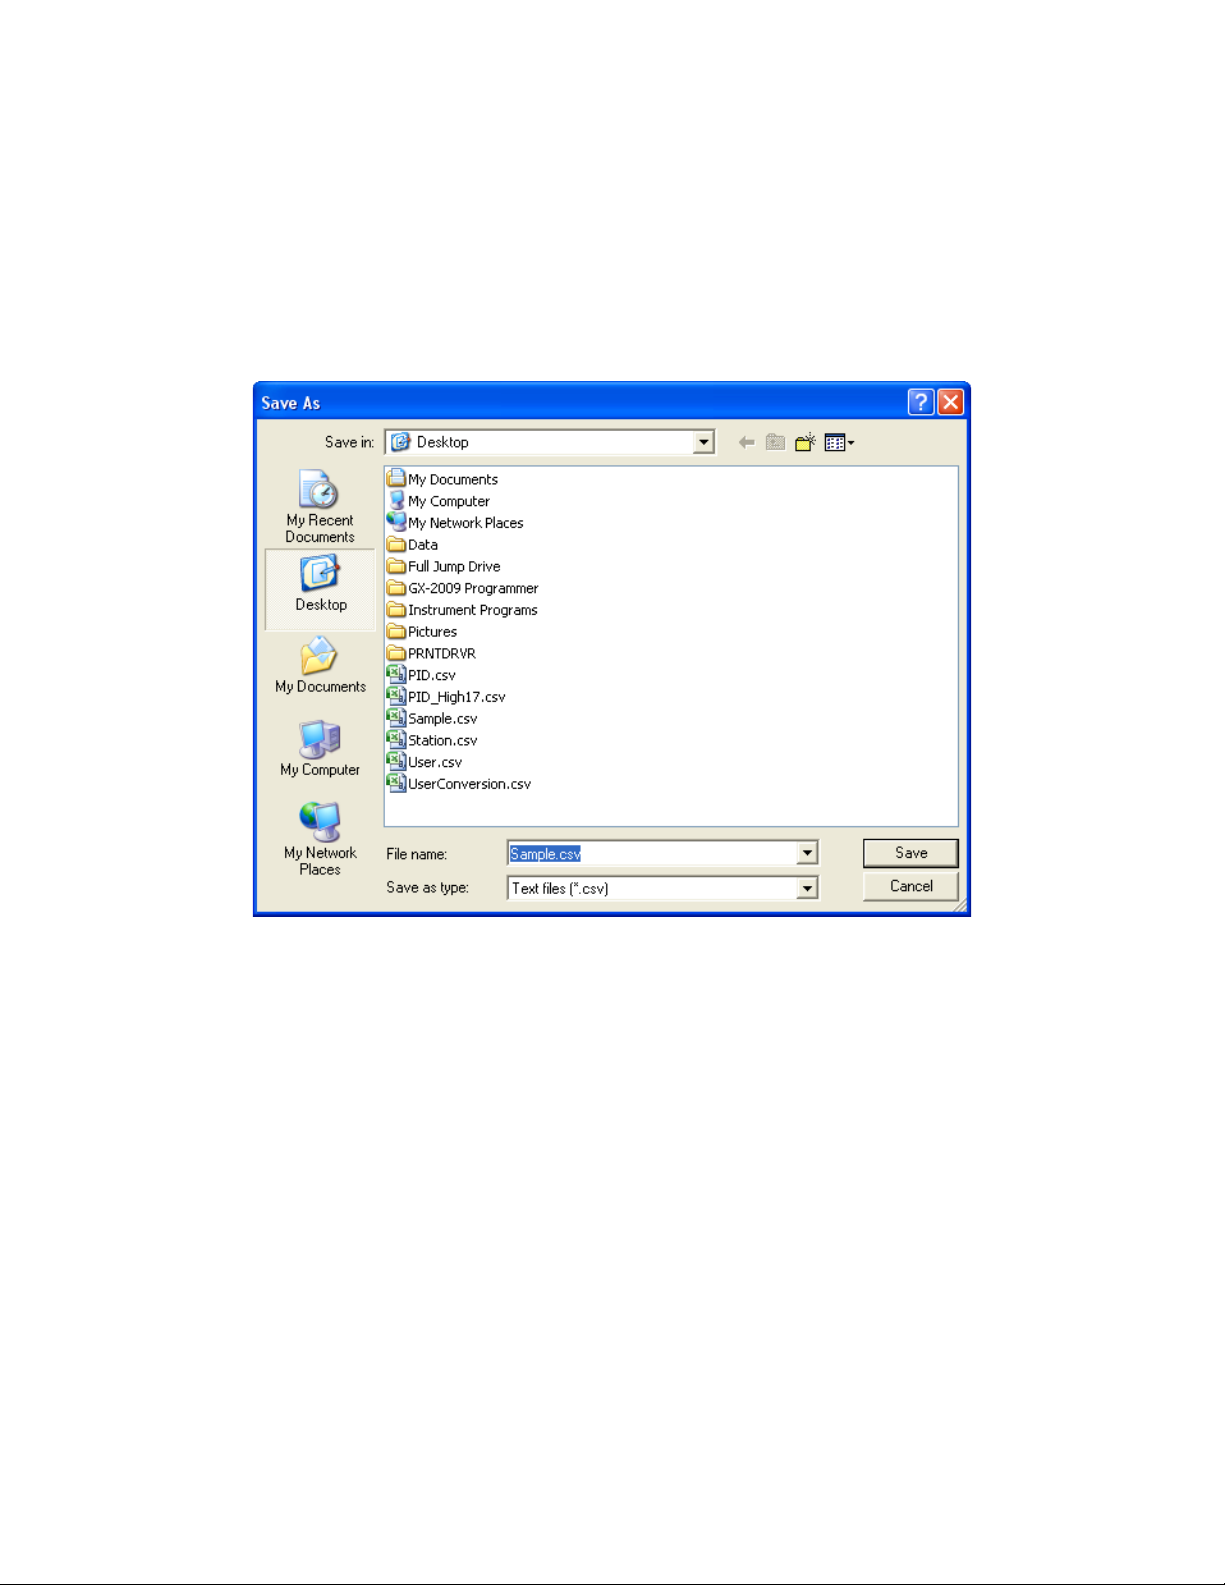
calibration and bump test file for a specific serial number, be sure that the
desired serial number is selected in the upper left frame and click the Bump
Test & Calibration Report control butt on a l on g th e to p o f the Lo gs wi nd ow. A
dialog box will appear confirming if you want to print. Click OK.
10. To save bump test data from a specific date folder, be sure the desired date
folder is highlighted an d click the Save con trol button in the upper lef t corner of
the Logs window. A “Save As” dialog box will appear for you to specify the file
name and file location.
Figure 70: Save As Dialog Box
The file type will be “.csv” (comma separated value).
Specify the file name and location and click Save.
11. To copy bump test data in a date folder to the clipboard, be sure the desired
date folder is selected and click the Save to Clipboard control button. The
data will be saved to the clipboard. It can then be pasted into a document by
using the Paste command in an application.
Logs Window • 9 2
Page 98

Deleting Data in the Logs Window
Data can be deleted from the Logs window by right clicking on the folder or file you
wish to delete. Any file or folder except for Memo data may be deleted.
Figure 71: Deleting Data in the Logs Window
1. Right click on the folder or file you wish to delete and click Delete.
2. You will be prompted for a password. The factory set password is ABCDE. It is
case sensitive. After you have entered the password, click OK.
3. To delete the folder or file, click OK in the confirmation window that comes up.
If you do not want to delete the data, click Cancel.
93 • Logs Window
Page 99

Instrument Function Menu
Figure 72: Instrument Function Menu
When you are in the main program window, if you right click on an i nstrument or a
docking station, the Instrument Function Menu appears.
The functions in the Instrument Function Menu are Open, Edit, Download, Clear
Logs, and Power Off. Edit is only selectable if the Change Parameter selection box in
the Parameter Tab of the Configuration Window is selected. If you right click on an
instrument that is cur rentl y connecte d to a docking st ation, all i tems in the Instrume nt
Function Menu are selectable as shown above in Figure 72. If you right click on an
instrument that is not currently connected to the SDM-GX PC Controller Program,
only the Open function is selectable. The other functions will be grayed out. If you
right click on an SDM-2009 that is connected to the SDM-GX PC Controller Progra m
but does not have an instrument in it, no functions will be selectable.
Open Function
This function can be activated by either right clicking an instrument and selecting
Open(O) when the pull down menu appears or by selecting an instrument and then
using the alt/O key combination. The Open function brings up the Instrument
Information window for viewing only. No changes can be made with the Open
function. The Instrument Informat ion Window consists of the Parameter Tab and the
Instrument F unction Menu • 9 4
Page 100

Sensor Tab. For further explanation of each tab, see the next section.
Figure 73: Instrument Information Window, Parameter Tab
To exit the Instrument Information Window and return to the main program window,
click Cancel.
Edit Function
This function can be activated by either right clicking an instrument and selecting
Edit(E) when the pull down menu appears or by selecting an instrument and then
using the alt/E key combination.
NOTE: The Edit function is not active and cannot be selected if the Change
Parameter selection box in the Instrument Information section of the
Parameter Tab in the Configuration Window is not selected.
95 • Instrument Function Menu
 Loading...