

Page 1

SDM-2009 Docking Station
PC Controlled Configuration
Operator’s Manual
Part Number: 71-0262RK
Revision: F
Released: 12/12/17
www.rkiinstruments.com
Page 2

Warranty
RKI Instruments, Inc. warrants gas alarm equipment sold by us to be free from
defects in materials and workmanship, and performance for a period of one year from
date of shipment from RKI Instruments, Inc. Any parts found defective within that
period will be repaired or replaced, at our option, free of charge. This warranty does
not apply to those items which by their nature are subject to deterioration or
consumption in normal service, and which must be cleaned, repaired, or replaced on
a routine basis. Examples of such items are:
Absorbent cartridges Batteries
Pump diaphragms and valves Filter elements
Fuses
Warranty is voided by abuse including mechanical damage, alteration, rough
handling, or repairs procedures not in accordance with the instruction manual. This
warranty indicates the full extent of our liability, and we are not responsible for
removal or replacement costs, local repair costs, transportation costs, or contingent
expenses incurred without our prior approval.
THIS WARRANTY IS EXPRESSLY IN LIEU OF ANY AND ALL OTHER
WARRANTIES AND REPRESENTATIONS, EXPRESSED OR IMPLIED, AND
ALL OTHER OBLIGATIONS OR LIABILITIES ON THE PART OF RKI
NSTRUMENTS, INC. INCLUDING BUT NOT LIMITED TO THE WARRANTY
I
OF MERCHANTABILITY OR FITNESS FOR A PARTIC ULAR PURPOSE. IN
NO EVENT SHALL RKI INSTRUMENTS, INC. BE LIABLE FOR INDIRECT,
INCIDENTAL, OR CONSEQUENTIAL LOSS OR DAMAGE OF ANY KIND
CONNECTED WITH THE USE OF ITS PRODUCTS OR FAILURE OF ITS
PRODUCTS TO FUNCTION OR OPERATE PROPERLY.
This warranty covers instruments and parts sold to users only by authorized
distributors, dealers, and representatives as appointed by RKI Instruments, Inc.
We do not assume indemnification for any accident or damage caused by the
operation of this gas monitor and our warranty is limited to replacement of parts or our
complete goods.
Warranty
Page 3

Table of Contents
Introduction . . . . . . . . . . . . . . . . . . . . . . . . . . . . . . . . . . . . . . . . . . . . . . . . . . . . . . . . . . 1
System Requirements . . . . . . . . . . . . . . . . . . . . . . . . . . . . . . . . . . . . . . . . . . . . . . . . . . 2
Specifications. . . . . . . . . . . . . . . . . . . . . . . . . . . . . . . . . . . . . . . . . . . . . . . . . . . . . . . . .3
About This Manual. . . . . . . . . . . . . . . . . . . . . . . . . . . . . . . . . . . . . . . . . . . . . . . . . . . . . 4
Cautions & Safety Information . . . . . . . . . . . . . . . . . . . . . . . . . . . . . . . . . . . . . . . . . . . 4
Description . . . . . . . . . . . . . . . . . . . . . . . . . . . . . . . . . . . . . . . . . . . . . . . . . . . . . . . . . . . 5
AC Adapter . . . . . . . . . . . . . . . . . . . . . . . . . . . . . . . . . . . . . . . . . . . . . . . . . . . . . . 5
Single-Port AC Adapter . . . . . . . . . . . . . . . . . . . . . . . . . . . . . . . . . . . . . . . . . . . . . . . . . . . 5
4-Port AC Adapter . . . . . . . . . . . . . . . . . . . . . . . . . . . . . . . . . . . . . . . . . . . . . . . . . . . . . . . 5
USB Cable . . . . . . . . . . . . . . . . . . . . . . . . . . . . . . . . . . . . . . . . . . . . . . . . . . . . . . 6
Air Filter, Sample Tubing, and Check Valve . . . . . . . . . . . . . . . . . . . . . . . . . . . . . 6
Instrument Panel. . . . . . . . . . . . . . . . . . . . . . . . . . . . . . . . . . . . . . . . . . . . . . . . . . 8
Back Panel . . . . . . . . . . . . . . . . . . . . . . . . . . . . . . . . . . . . . . . . . . . . . . . . . . . . . . 9
Power Jack. . . . . . . . . . . . . . . . . . . . . . . . . . . . . . . . . . . . . . . . . . . . . . . . . . . . . . . . . . . . . 9
Sample Fittings. . . . . . . . . . . . . . . . . . . . . . . . . . . . . . . . . . . . . . . . . . . . . . . . . . . . . . . . . . 9
PC Connection . . . . . . . . . . . . . . . . . . . . . . . . . . . . . . . . . . . . . . . . . . . . . . . . . . . . . . . . . . 9
Control Panel . . . . . . . . . . . . . . . . . . . . . . . . . . . . . . . . . . . . . . . . . . . . . . . . . . . 10
Front Panel . . . . . . . . . . . . . . . . . . . . . . . . . . . . . . . . . . . . . . . . . . . . . . . . . . . . . 11
USB Hub Requirements for Multiple Station Systems. . . . . . . . . . . . . . . . . . . . . . . 11
Hardware Setup . . . . . . . . . . . . . . . . . . . . . . . . . . . . . . . . . . . . . . . . . . . . . . . . . . . . . . 12
Hardware Assembly . . . . . . . . . . . . . . . . . . . . . . . . . . . . . . . . . . . . . . . . . . . . . . 12
Assembling a Manifold for Multiple SDM-2009 Units . . . . . . . . . . . . . . . . . . . . . 13
Exhaust Tubing. . . . . . . . . . . . . . . . . . . . . . . . . . . . . . . . . . . . . . . . . . . . . . . . . . . . . . . . . 13
GAS Tubing . . . . . . . . . . . . . . . . . . . . . . . . . . . . . . . . . . . . . . . . . . . . . . . . . . . . . . . . . . . 15
Connecting Calibration Gas . . . . . . . . . . . . . . . . . . . . . . . . . . . . . . . . . . . . . . . . 17
EAGLE 2 and GX Type Instrument Connection . . . . . . . . . . . . . . . . . . . . . . . . . . . . 18
Installing the SDM-GX Docking Station PC Controller Program . . . . . . . . . . . . . . . 18
Launching the SDM-GX Docking Station PC Controller Program. . . . . . . . . . . . . . 23
Table of Contents
Page 4

Overview of the SDM-GX Docking Station PC Controller Program . . . . . . . . . . . . 24
PC Controller Program Functions . . . . . . . . . . . . . . . . . . . . . . . . . . . . . . . . . . . . 24
Main Program Window . . . . . . . . . . . . . . . . . . . . . . . . . . . . . . . . . . . . . . . . . . . . 24
Control Buttons. . . . . . . . . . . . . . . . . . . . . . . . . . . . . . . . . . . . . . . . . . . . . . . . . . . . . . . . . 25
SDM-2009/Instrument Display Area. . . . . . . . . . . . . . . . . . . . . . . . . . . . . . . . . . . . . . . . . 25
Program Status. . . . . . . . . . . . . . . . . . . . . . . . . . . . . . . . . . . . . . . . . . . . . . . . . . . . . . . . . 26
Fitting Indicators. . . . . . . . . . . . . . . . . . . . . . . . . . . . . . . . . . . . . . . . . . . . . . . . . . . . . . . . 26
Setting Up the PC Controller Program. . . . . . . . . . . . . . . . . . . . . . . . . . . . . . . . . . . . 26
Setting Up the Configuration. . . . . . . . . . . . . . . . . . . . . . . . . . . . . . . . . . . . . . . . 26
Setting Up the SDM-2009 Display Order . . . . . . . . . . . . . . . . . . . . . . . . . . . . . . 33
Cylinders Window . . . . . . . . . . . . . . . . . . . . . . . . . . . . . . . . . . . . . . . . . . . . . . . . 35
Selecting a Cylinder from the Pre-Defined List. . . . . . . . . . . . . . . . . . . . . . . . . . . . . . . . . 36
Defining New Cylinders . . . . . . . . . . . . . . . . . . . . . . . . . . . . . . . . . . . . . . . . . . . . . . . . . . 37
Connecting Instruments to the PC Controller Program. . . . . . . . . . . . . . . . . . . . . . 38
Icon View vs. Details View . . . . . . . . . . . . . . . . . . . . . . . . . . . . . . . . . . . . . . . . . 42
Exporting an Instrument List from the Main Program Window . . . . . . . . . . . . . . 43
Automatic Bump Testing and Calibration . . . . . . . . . . . . . . . . . . . . . . . . . . . . . . . . . 44
Bump Testing a GX-2009. . . . . . . . . . . . . . . . . . . . . . . . . . . . . . . . . . . . . . . . . . . . . . . 45
Calibrating a GX-2009 . . . . . . . . . . . . . . . . . . . . . . . . . . . . . . . . . . . . . . . . . . . . . . . . . 56
Troubleshooting. . . . . . . . . . . . . . . . . . . . . . . . . . . . . . . . . . . . . . . . . . . . . . . . . . . . . . 66
Charging an Instrument in an SDM-2009. . . . . . . . . . . . . . . . . . . . . . . . . . . . . . . . . . 67
Recharging the Batteries After Performing a Bump Test or Calibration . . . . . . . 67
Recharging the Batteries Without Performing Any Operations . . . . . . . . . . . . . . 68
Batteries Too Drained for PC Controller Operation. . . . . . . . . . . . . . . . . . . . . . . 69
Logs Window . . . . . . . . . . . . . . . . . . . . . . . . . . . . . . . . . . . . . . . . . . . . . . . . . . . . . . . . 69
Alarm Trend Data . . . . . . . . . . . . . . . . . . . . . . . . . . . . . . . . . . . . . . . . . . . . . . . . 73
Calibration Data . . . . . . . . . . . . . . . . . . . . . . . . . . . . . . . . . . . . . . . . . . . . . . . . . 78
Event Data . . . . . . . . . . . . . . . . . . . . . . . . . . . . . . . . . . . . . . . . . . . . . . . . . . . . . 83
Interval Trend Data . . . . . . . . . . . . . . . . . . . . . . . . . . . . . . . . . . . . . . . . . . . . . . . 85
Memo Data . . . . . . . . . . . . . . . . . . . . . . . . . . . . . . . . . . . . . . . . . . . . . . . . . . . . . 90
Bump Test Data. . . . . . . . . . . . . . . . . . . . . . . . . . . . . . . . . . . . . . . . . . . . . . . . . . 93
Table of Contents
Page 5

Deleting Data in the Logs Window . . . . . . . . . . . . . . . . . . . . . . . . . . . . . . . . . . . 97
Instrument Function Menu . . . . . . . . . . . . . . . . . . . . . . . . . . . . . . . . . . . . . . . . . . . . . 98
Open Function. . . . . . . . . . . . . . . . . . . . . . . . . . . . . . . . . . . . . . . . . . . . . . . . . . . 98
Edit Function . . . . . . . . . . . . . . . . . . . . . . . . . . . . . . . . . . . . . . . . . . . . . . . . . . . . 99
Parameter Tab . . . . . . . . . . . . . . . . . . . . . . . . . . . . . . . . . . . . . . . . . . . . . . . . . . . . . . . . 100
Sensor Tab. . . . . . . . . . . . . . . . . . . . . . . . . . . . . . . . . . . . . . . . . . . . . . . . . . . . . . . . . . . 107
Download Function . . . . . . . . . . . . . . . . . . . . . . . . . . . . . . . . . . . . . . . . . . . . . . 108
Clear Logs Function . . . . . . . . . . . . . . . . . . . . . . . . . . . . . . . . . . . . . . . . . . . . . 108
Power Off Function . . . . . . . . . . . . . . . . . . . . . . . . . . . . . . . . . . . . . . . . . . . . . . 108
Config Window. . . . . . . . . . . . . . . . . . . . . . . . . . . . . . . . . . . . . . . . . . . . . . . . . . . . . . 109
Parameter Tab. . . . . . . . . . . . . . . . . . . . . . . . . . . . . . . . . . . . . . . . . . . . . . . . . . 109
Database Tab . . . . . . . . . . . . . . . . . . . . . . . . . . . . . . . . . . . . . . . . . . . . . . . . . . 109
Password Tab . . . . . . . . . . . . . . . . . . . . . . . . . . . . . . . . . . . . . . . . . . . . . . . . . . 111
Spare Parts List . . . . . . . . . . . . . . . . . . . . . . . . . . . . . . . . . . . . . . . . . . . . . . . . . . . . . 112
CAUTION: Read and understand this manual before using the SDM-2009. Also
read and understand the GX-2009 Operator’s Manual.
Table of Contents
Page 6

Introduction
This section briefly describes the SDM-2009 Docking Station, the Single Module Data
Viewer Program, and the SDM-GX Docking Station PC Controller Program. This
section also describes the SDM-2009 Docking Station PC Controlled Configuration
Operator’s Manual (this document). Table 1 at the end of this section lists the SDM-
2009’s specifications.
The SDM-2009 Docking Station is an advanced, reliable system that provides
charging, calibration, bump testing, and calibration and bump test records for the
GX-2009 portable gas monitor. It is designed to save the calibration and bump test
records to a USB flash drive (standalone functionality) or to be connected directly to a
computer (PC controlled functionality). If calibration and bump test records are stored
to a USB flash drive while operating in the standalone configuration, the Single
Module Data Viewer Program can then be used with a Windows-based personal
computer to retrieve calibration and bump test data files from the USB flash drive or
from the computer’s hard drive if the files have been transferred to the hard drive from
the flash drive. If you are using the PC Controller Program while operating in the PC
controlled configuration, you may retrieve instrument data, bump test, and calibrate
up to 10 units at once. Instrument information and data for each instrument can be
viewed directly using the PC Controller Program and can be printed from the PC
Controller Program. For instructions to use the SDM-2009 in the Standalone
configuration, see the SDM-2009 Docking Station Standalone Configuration
Operator’s Manual.
The purpose of this manual is to explain how to set up and use the SDM-2009 in PC
Controlled configuration. It also explains how to use the SDM-GX Docking Station PC
Controller Program. You will learn how to:
• install and launch the SDM-GX Docking Station PC Controller Program
• setup the SDM-GX Docking Station PC Controller Program for use with the
SDM-2009
• prepare the SDM-2009 for use
• bump test and calibrate up to 10 units using the PC controlled configuration
• use the SDM-2009 to charge a GX-2009
• view, print, and export calibration and bump test records
• view instrument information and data using the PC Controller Program
• update instrument parameters using the PC Controller Program
1 • Introduction
Page 7

CAUTION: The GX-2009 detect s oxygen deficien cy and elevated levels of oxygen,
combustible gases, carbon monoxide, and hydrogen sulfide, all of
which can be dange r ous or life threatening. When using the GX-2009,
you must follow the instructions and warnings in the GX-2009
Operator’s Manual to assure proper and safe operation of the unit and
to minimize the risk of personal injury.
CAUTION: The operator of this instr umen t is advised that if the equi pment is u sed
in a manner not specifie d in this manual, the protection pr ovided by the
equipment may be impaired.
System Requirements
To use the SDM-GX Docking Station PC Controller Software, your personal computer
must meet the following requirements:
• Operating Systems: Windows® XP, Windows® Vista, Windows® 7,
®
Windows
8, or Windows® 10.
• Processor: IBM
®
compatible PC running Pentium® 2 processor or equivalent
minimum
• Memory: 32 MB RAM minimum
• Hard Disk Space: 32 MB minimum
• One (for 4 or less SDM-2009s) or two (for 5 or more SDM-2009s) available
USB port(s), one or two USB hubs may also be needed depending on the
number of SDM-2009s in your system. See “USB Hub Requirements for
Multiple Station Systems” on page 11.
System Requirements • 2
Page 8
Specifications
Table 1: SDM-2009 Specifications
Input Power 12 VDC
NOTE: AC Adapter with 100 - 240 VAC, 50/60 Hz,
0.6A input and 12 VDC, 1.2A output provided as
standard.
Environmental Conditions • For Indoor Use Only
• -10° C to 40° C, below 80% Relative Humidity, NonCondensing
Applicable Instrument GX-2009
Memory Capacity 64 KB (Standalone configuration only)
Maximum Record Size 256 bytes (Standalone configuration only)
Maximum Number of
200 (Standalone configuration only)
Records Saved
Number of Calibration Gas
Cylinders
One calibration gas cylinder per bump test or
calibration
Standard Accessories • AC Adapter
• USB Flash Drive
• Single Module Data Viewer Program*
• SDM-GX Docking Station PC Controller
Program*
• Inlet Air Filter
• Instruction Manual
• 10 Foot Long 5/16 Inch Exhaust Tube
• One 3 Foot Long 3/16 Inch Tube for GAS
Fitting
• 10 Foot Long 3/16 Inch Tube for GAS Fitting
Manifolding
•2 T-Fittings
• Check Valve
• USB Cable, Type A to Type B
Not sent with SDM-2009. Download from www.rkiinstruments.com/sdm2009.
*
3 • Specifications
Page 9

NOTE: The bump test function of the GX-2009 is included in instruments with
firmware version 03955 or later installed. GX-2009 instruments
shipped after May 2011 include the bump test function. Instruments
that have a serial number starting with 04516 or later shipped from the
factory with the bump test function available. Instruments that have a
serial number starting with 04515 did not include the bump test
function when shipped from the factory. The factory setting for the
bump test function is off. Any GX-2009 can be bump tested using the
SDM-2009 and the PC Controller Program regardless of its firmware
version.
About this Manual
The SDM -2009 Docking Stati on PC Controlled Configuration Ope rator’s Manu al uses
the following conventions for notes, cautions, and warnings.
NOTE: Describes additional or critical information.
CAUTION: Describes potentia l dam a ge to equ i pm en t.
WARNING: Describes potential danger that can result in injury or death.
Cautions & Safety Information
• Use only polyurethane sample tubing with the SDM-2009. Consult RKI
Instruments, Inc. for other materials.
• Do not subject the SDM-2009 to infrared or intense light. This may cause
communication errors.
• Do not expose the SDM-2009 to water.
• Do not subject the SDM-2009 to any hard impact.
About this Manual • 4
Page 10
Description
To Power Jack
on SDM-2009
Back Panel
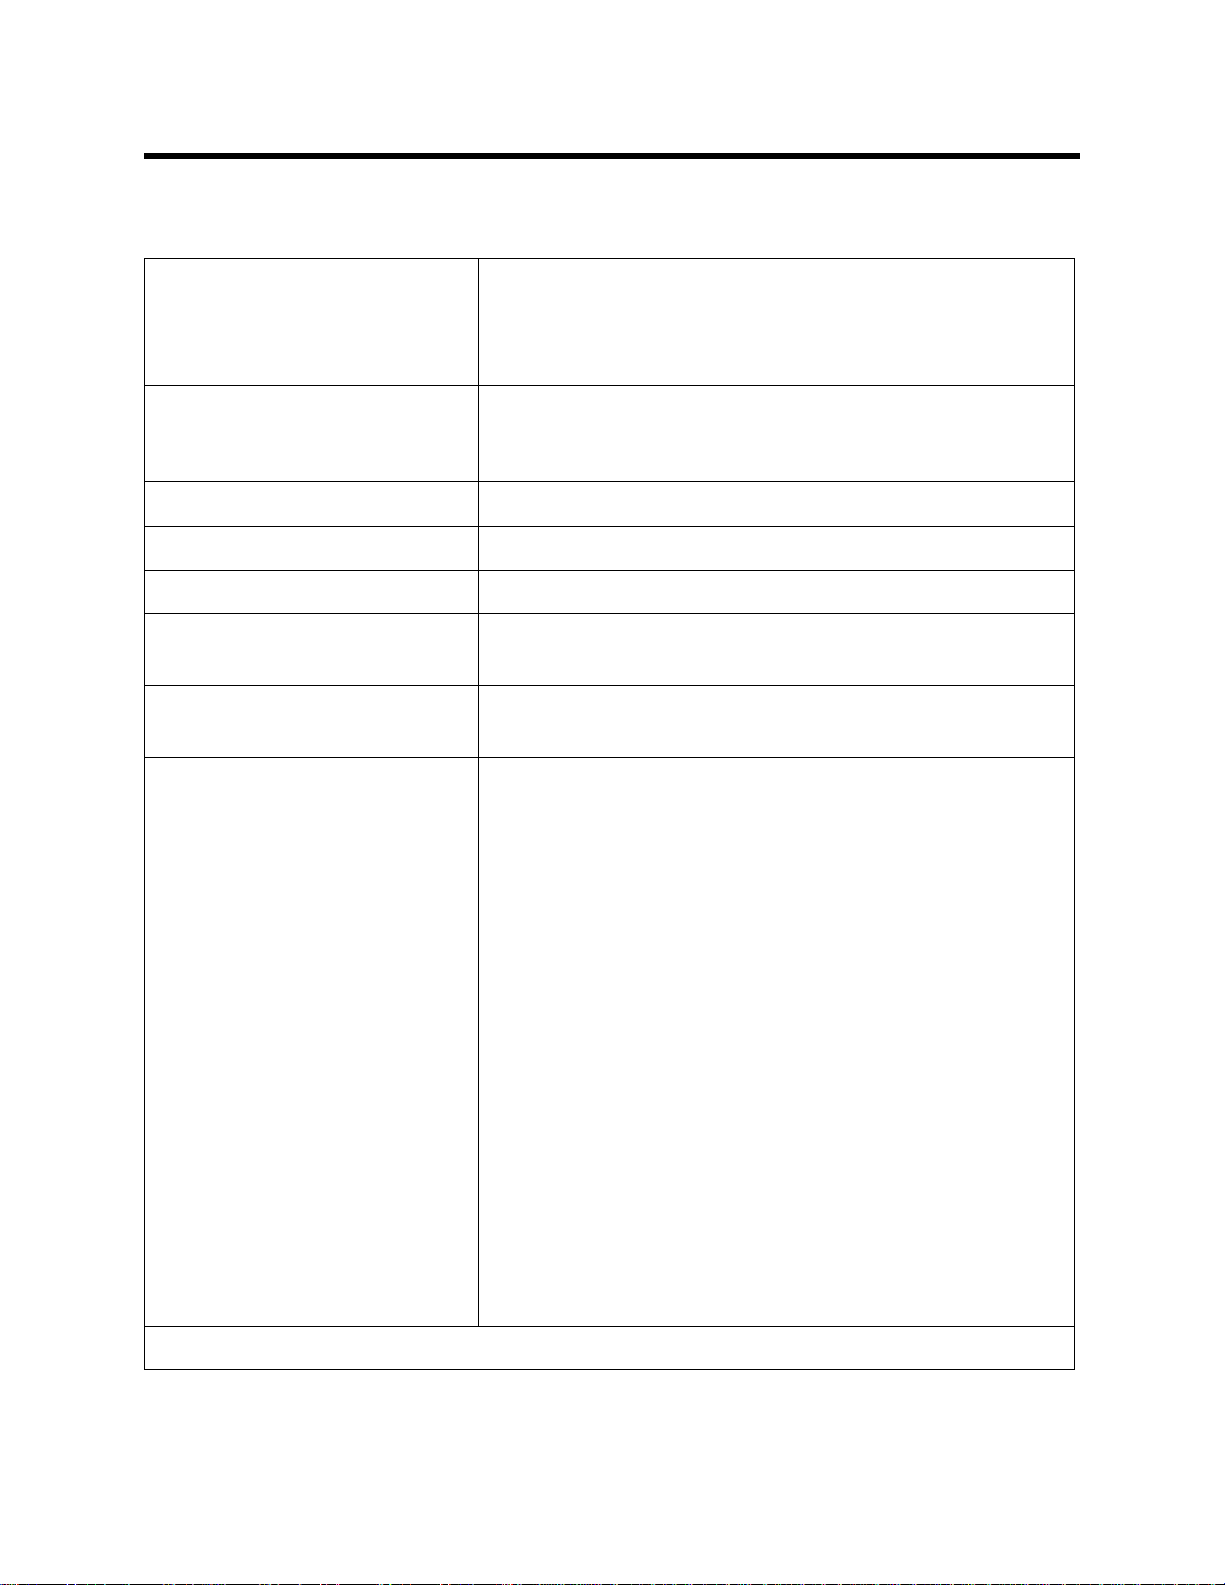
Figure 1: Single-Port AC Adapter
To Power Jack
on SDM-2009
Back Panels
Figure 2: 4-Port AC Adapter
This section describes the SDM-2009 docking station. It is designed to be used on a
table top and consists of the AC adaptor, Type A to Type B USB cable, air filter, check
valve, 3 plastic T-fittings, sample tubing, instrument panel, back panel, control panel,
status LEDs, and 2 USB ports.
AC Adapter
Single-Port AC Adapter
The single-port AC adapter is a wall plug style adapter with a 5 foot cable. The end of
the cable has a plug that connects to the power jack on the SDM-2009’s back panel.
The AC adapter is rated 100 - 240 VAC input, 12 VDC 1.2 A output.
4-Port AC Adapter
The 4-port AC adapter is a wall plug style adapter with four 5-foot cables. The end of
each cable has a plug that connects to the power jack on the SDM-2009’s back
panel. The AC adapter is rated 100 - 240 VAC input, 12 VDC 2.0 A output.
5 • Description
Page 11

USB Cable
Type A, for
connection to
PC USB port
Type B, for connection
to USB port on the
SDM-2009's back panel
Exhaust Tubing, 5/16 Inch
ID,10 feet
Calibration Gas Sample Tubing, 3/16
Inch ID, 3 feet
Particle Filterfor Air Inlet
Manifold Tubing, 3/16 Inch
ID,10 feet
Figure 4: Air Filter & Sample Tubing
A Type A to Type B USB cable is provided with the docking station. It is used to
connect the USB port on the back of the SDM-2009 to a computer.
Figure 3: USB Cable
Air Filter, Sample Tubing, and Check Valve
A cylindrical particle filter with a short length of tubing is supplied with the SDM-2009
for installation to the AIR fitting on the back panel. The filter keeps particulate
contamination out of the docking station.
Three types of sample tubes are included with the docking station. One 3 foot length
of 3/16 inch ID polyurethane tubing is provided to connect the regulator on a
calibration cylinder to the GAS fitting on the back panel. One 10 foot length of 3/16
inch ID polyurethane tubing is provided for GAS fitting manifold construction (if
desired). In addition, a 10 foot length of 5/16 inch ID polyurethane tubing is provided
for connection to the exhaust fitting on the back panel to allow routing of the exhaust
to a location such as an open window where the exhaust can disperse.
WARNING: Do not use an exhaust tube that is longer than 10 feet. The increased flow
restriction caused by a longer tube may affect gas response and cause
inaccurate calibration and bump test results.
Description • 6
Page 12
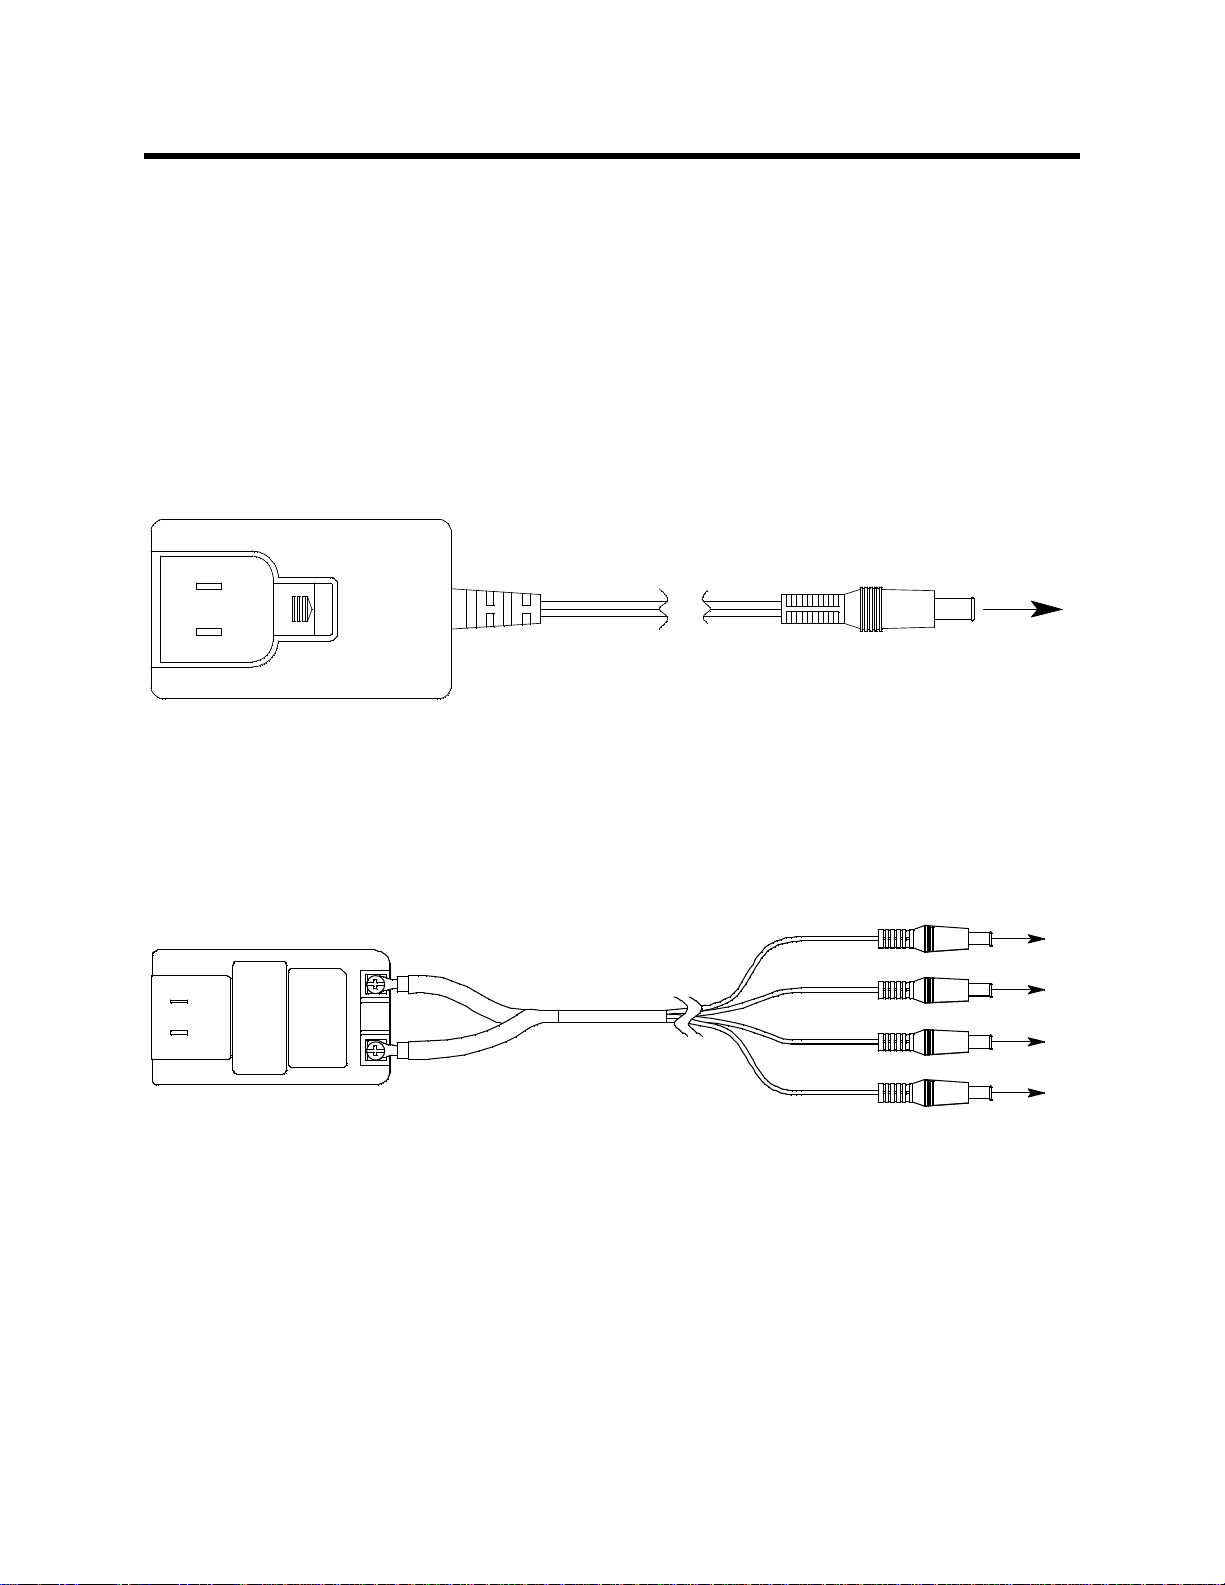
A check valve is included with the SDM-2009. It is intended for use on the exhaust
Figure 5: Check Valve
For Exhaust
Tubing
For GAS
Tubing
Figure 6: T-Fittings
fitting when manifolding multiple docking stations together. See “Assembling a
Manifold for Multiple SDM-2009 Units” on page 13 for manifolding instructions.
Two T-fittings are included with the SDM-2009. The larger fitting is for the exhaust
tubing manifold construction. The smaller fitting is for the GAS tubing manifold
construction.
7 • Description
Page 13
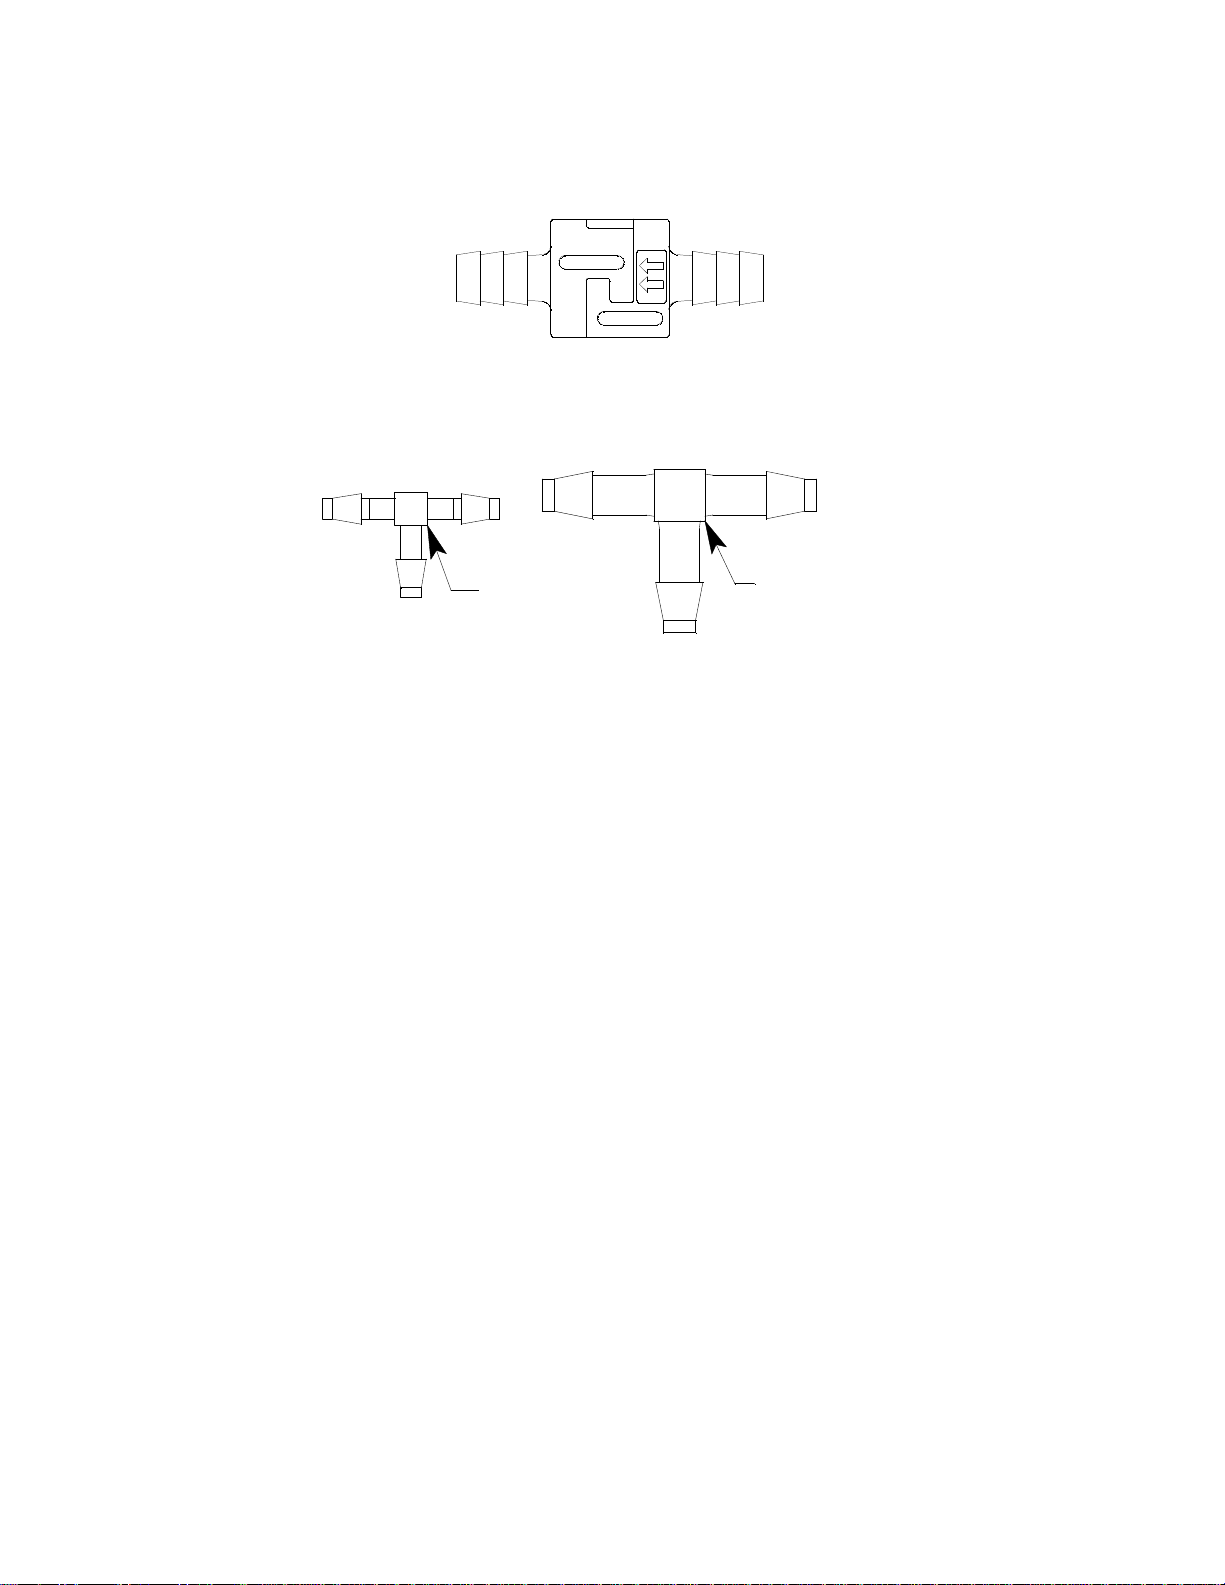
Instrument Cradle
EDIT
ENTER
CAL.
POWER
CHARGE
SDM-2009
1SEC ON
3SEC OFF
COPY
GX-200 9 OFF
BUMP
SDM-2009 Without GX-2009
H2SCO%LELO
2
RKI GX-2009
POWER
MODE
AIR
BUMP
GX-200 9 OFF
COPY
1SEC ON
3SEC OFF
SDM-2009
CHARGE
POWER
CAL.
EDIT
ENTER
Charging Contacts
SDM-2009 With GX-2009
IR Port
Inst rum ent Cradle
Instrument Retaining
Tab
Figure 7: Instrument Cradle
The instrument cradle is a recessed area on the top of the SM-2009 that is designed
to accept the GX-2009. Insert the GX-2009 in the instrument cradle when you
perform a bump test or calibration. The cradle has charging contacts on the bottom
that mate with the contacts on the back of the GX-2009. There are sample ports in
the front of the cradle that match up with the GX-2009’s sensors and route air and
calibration gas to the sensors during a bump test or calibration. An infrared (IR) port
at the back of the cradle lines up with the GX-2009’s IR port when it is inserted in the
cradle and is used to communicate with the GX-2009. A retaining tab that holds the
GX-2009 in the cradle is located to the right of the IR port.
Description • 8
Page 14
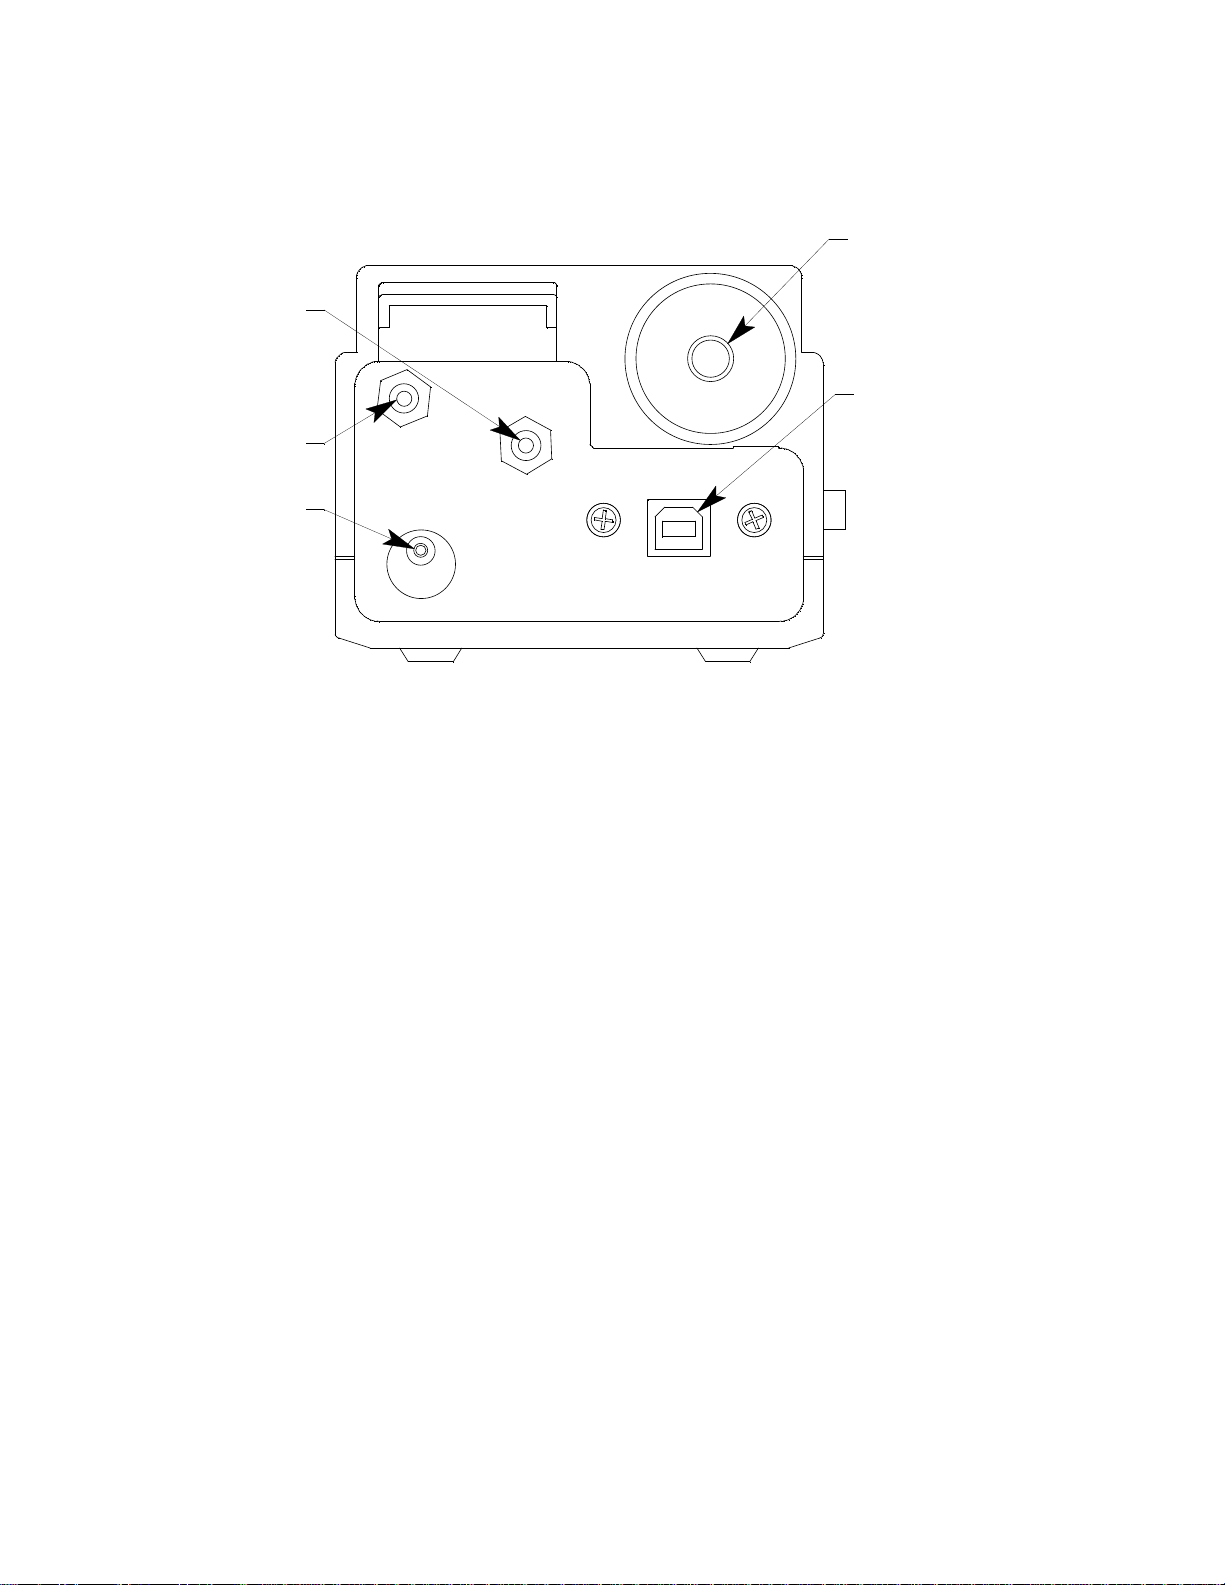
Back Panel
Gas Fitti ng
Exhaust Fitting
Back Panel USB
Port (Type B),
For Computer
Connection
Air Fitting
Power Jack
Figure 8: Back Panel
The back panel includes the power jack, sample fittings, and a USB PC connector.
Power Jack
The power jack is located in the bottom left corner of the back panel. The plug on the
end of the AC adapter cable mates to it.
Sample Fittings
Three sample fittings are located on the back of the SDM-2009. The AIR fitting is in
the upper left corner and draws air into the SDM-2009. The GAS fitting is to the right
of the AIR fitting and is used to connect the SDM-2009 to a calibration gas cylinder.
Both fittings accept 3/16 inch ID tubing.
An exhaust fitting is located in the upper right corner. It allows routing of the
exhausted calibration gas to a convenient location. This fitting accepts 5/16 inch ID
tubing. Even though the exhaust gas can be routed to an area to be safely dispersed,
the docking station should still be installed in a well ventilated area.
PC Connection
A type B USB connection is located beneath the exhaust fitting on the SDM-2009’s
back panel. It is used to connect the SDM-2009 to a PC.
9 • Description
Page 15
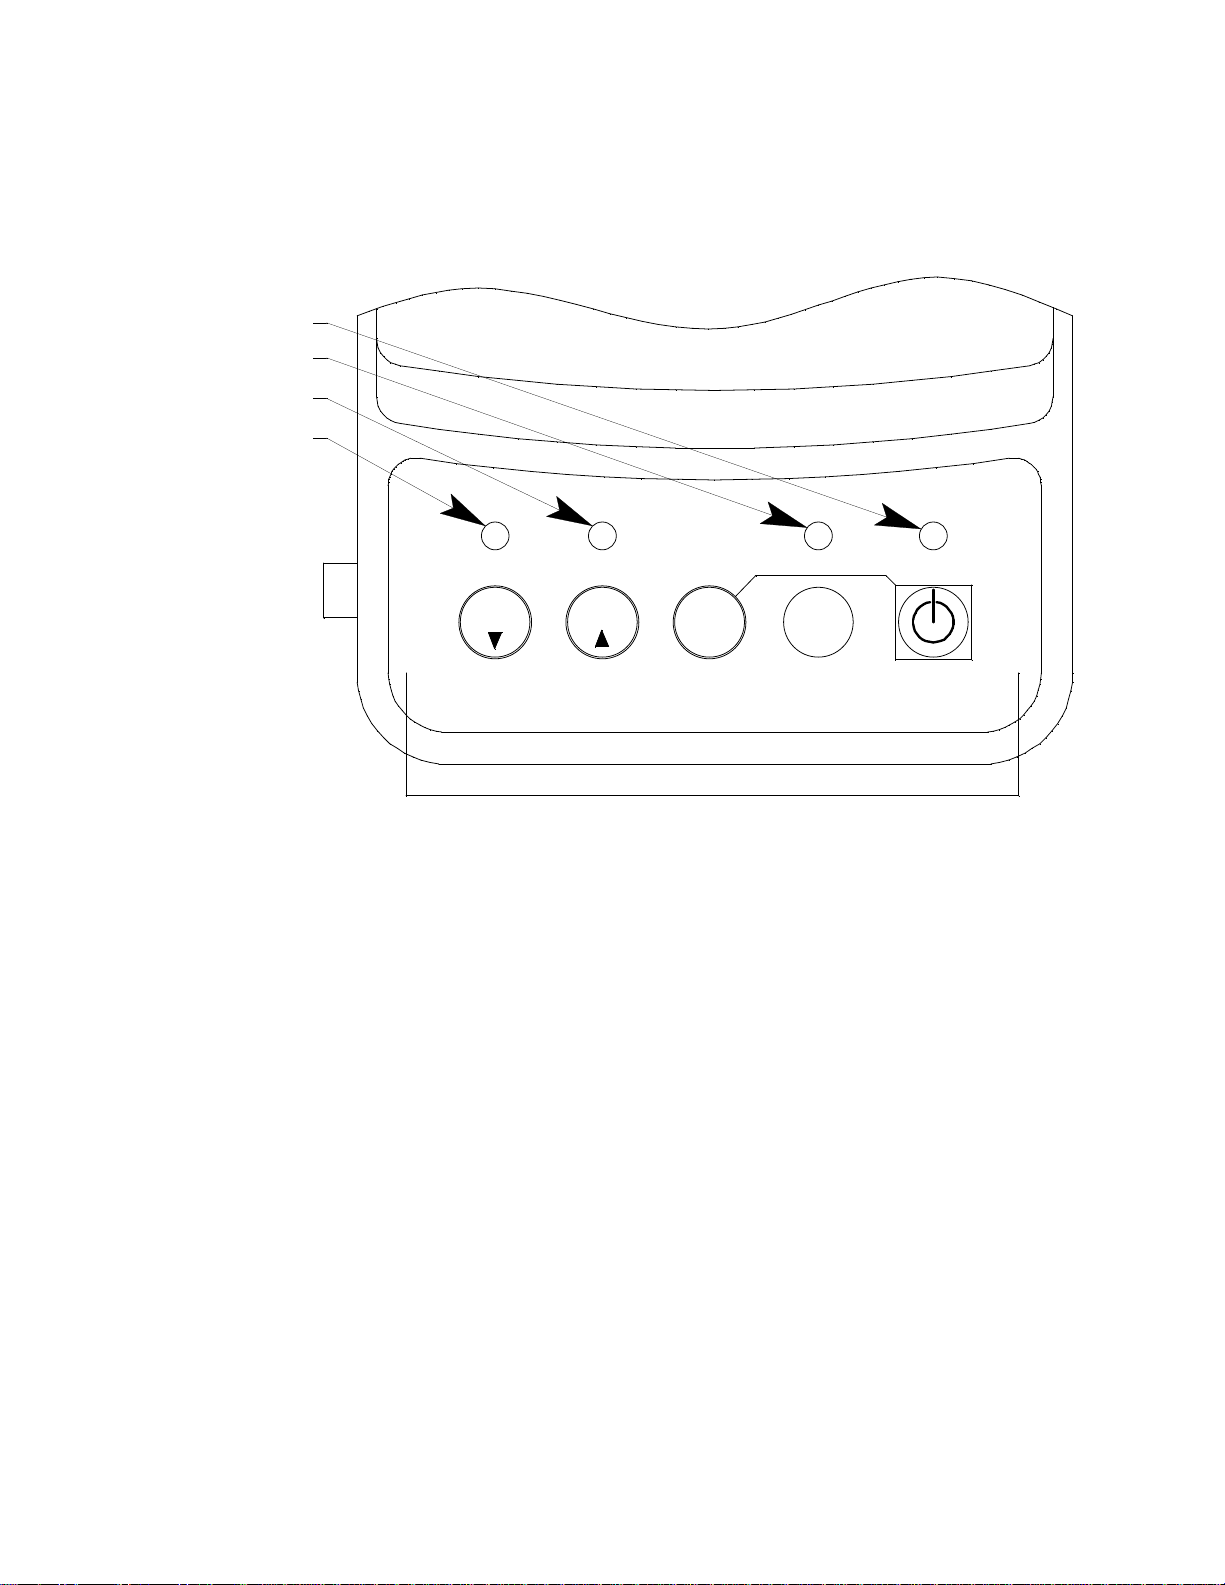
Control Panel
CHARGE
1SEC ON
3SEC OFF
COPY
GX-2009 OFF
POWER
SDM-2009
BUMP CAL.
Control Button s
EDIT
ENTER
BUMP LED
CHARGE LE D
COPY LED
CAL L ED
Figure 9: Control Panel
The control panel is used to setup and operate the docking station in the Standalone
configuration. It is located at the front of the docking station. It includes the control
buttons, the control button LEDs, and the CHARGE status LED.
Five control buttons are located on the control panel. From left to right they are BUMP
, CAL , EDIT ENTER, COPY, and POWER. The BUMP , CAL , EDIT
ENTER, and COPY control buttons are not used in the PC Controlled configuration of
the SDM-2009. The BUMP LED and CAL LEDs indicate the results of bump
tests and calibrations, respectively. The COPY LED does not indicate anything in the
PC Controlled configuration but will be on if the SDM-2009 was used in the
Standalone configuration and calibration and bump test records are still stored in the
SDM-2009’s memory. The CHARGE LED is located above the POWER button and
functions as a pilot LED, a system failure LED, and a charge indication LED.
The POWER button turns the SDM-2009 on and off.
Description • 10
Page 16
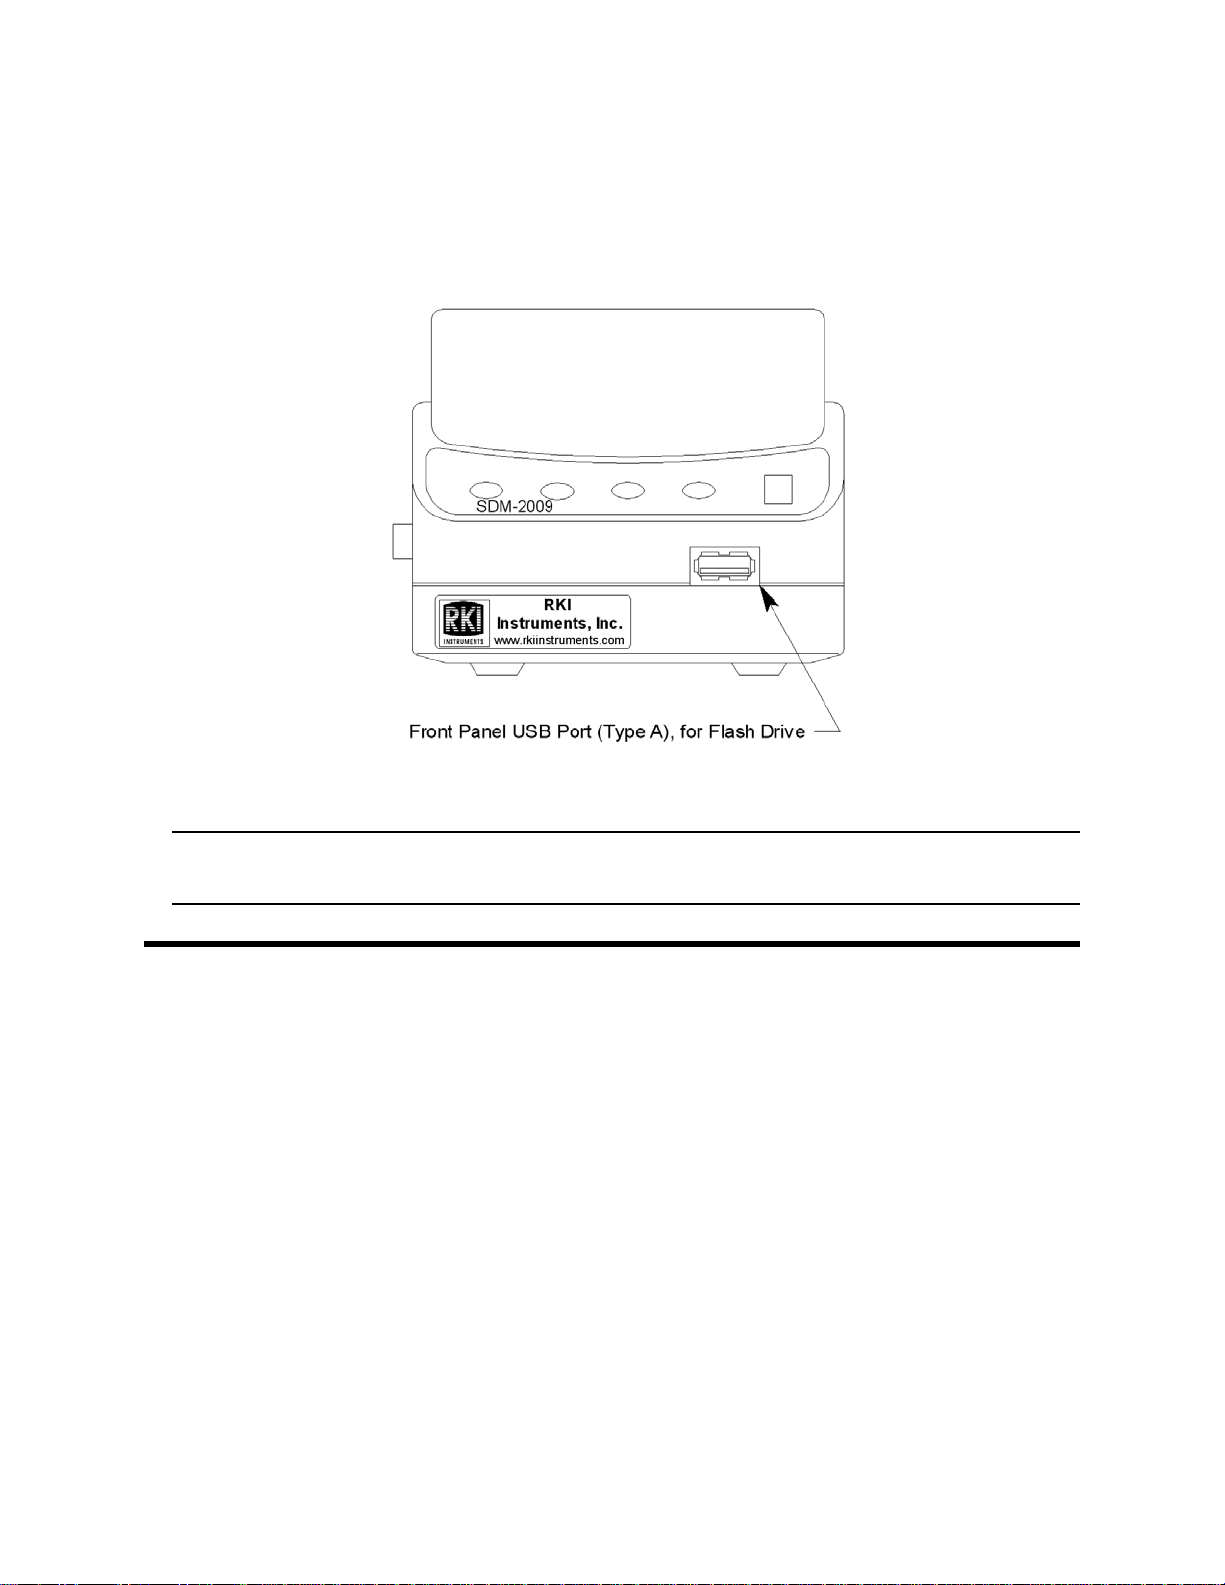
Front Panel
Figure 10: Front Panel
A type A USB port is located on the front of the docking station. This port can be used
to save calibration and bump test data to a USB flash drive. This USB port is for use
only in the Standalone configuration of the SDM-2009 and is not used in the PC
Controlled configuration.
NOTE: The SDM-2009 does not support connection of a computer to the front
USB port, only a USB flash drive.
USB Hub Requirements for Multiple Station Systems
If you have more docking stations than you have available USB ports, you will need a
USB hub. RKI provides both a 4-port hub and a 7-port hub. If you have more than 7
docking stations, you will need to purchase one of each hub. Do not connect one hub
to the other. Make sure that each USB hub has its own USB port on your computer.
You may also purchase your own USB hub of any port number from your local
electronics store but it must meet the following requirements:
•USB 2.0
®
• compatible with your Windows
An AC adapter comes with the USB hub(s) sold by RKI but does not need to be
plugged in for SDM-2009 operation. If the hub will be used to charge other devices,
the AC adapter needs to be plugged in.
operating system
11 • USB Hub Requirements for Multiple Station Systems
Page 17
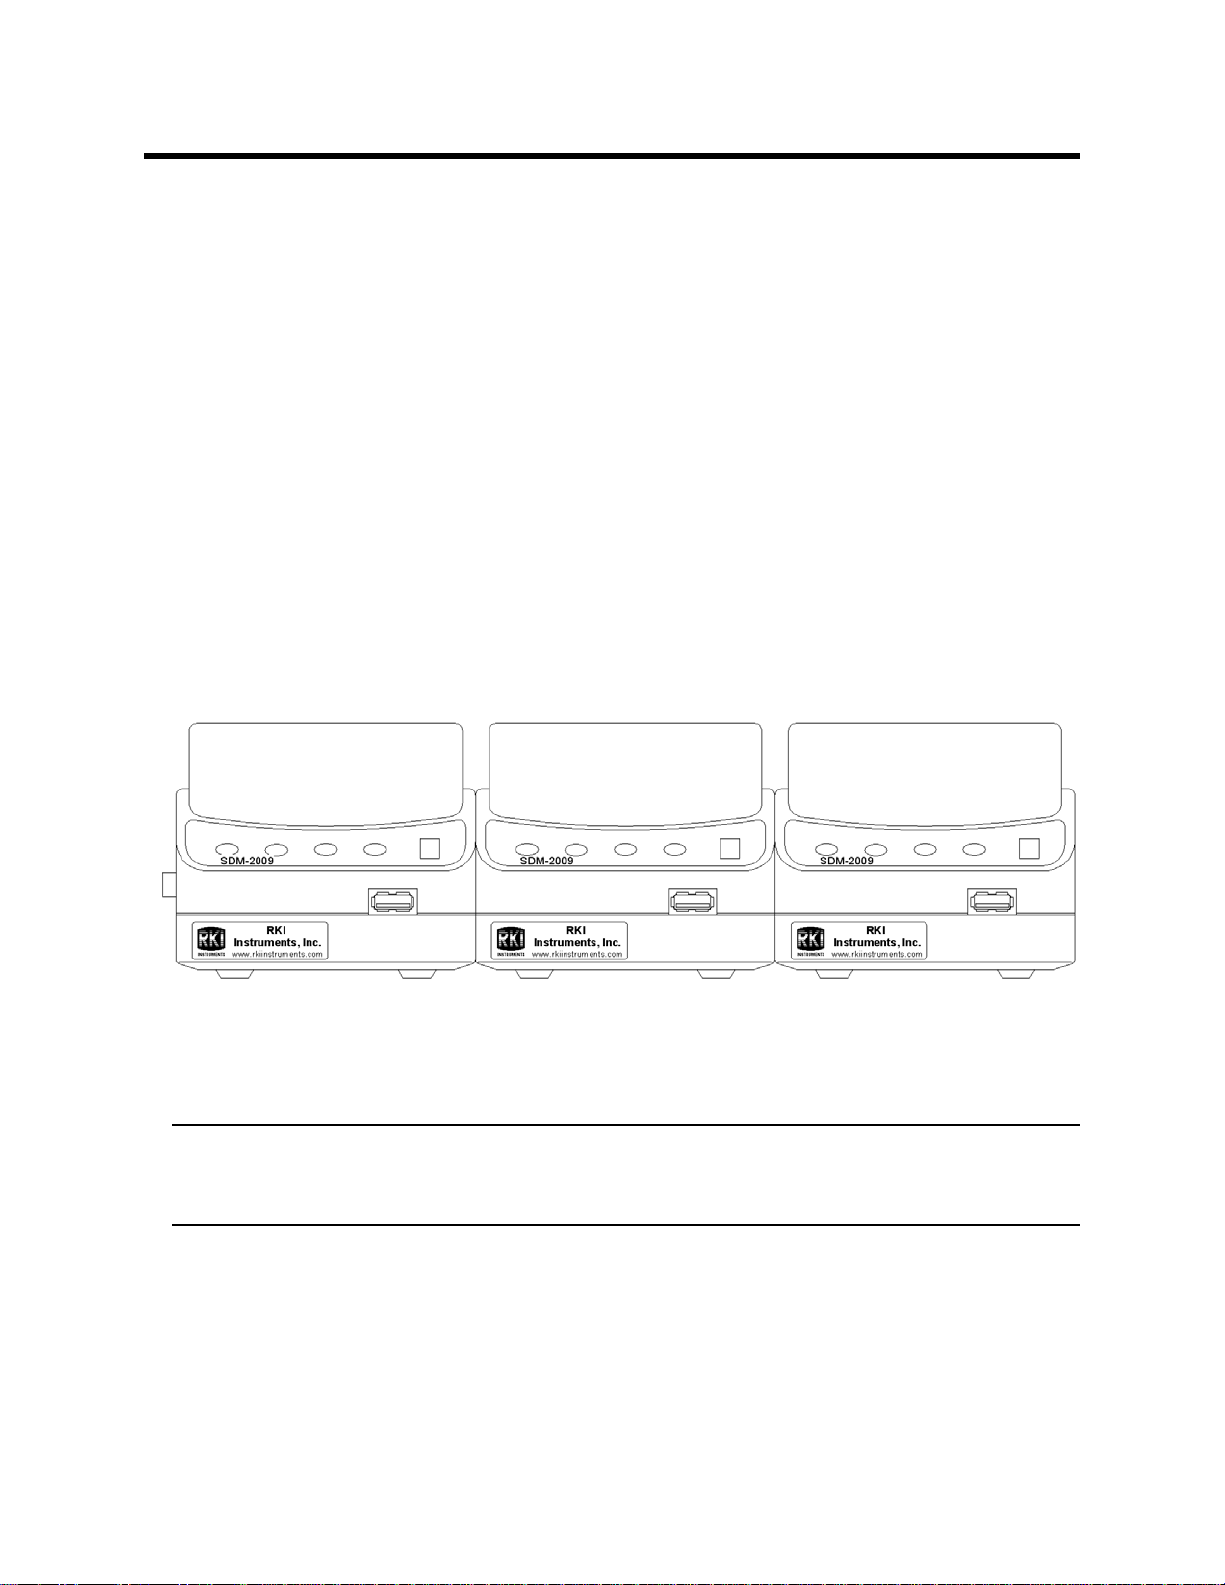
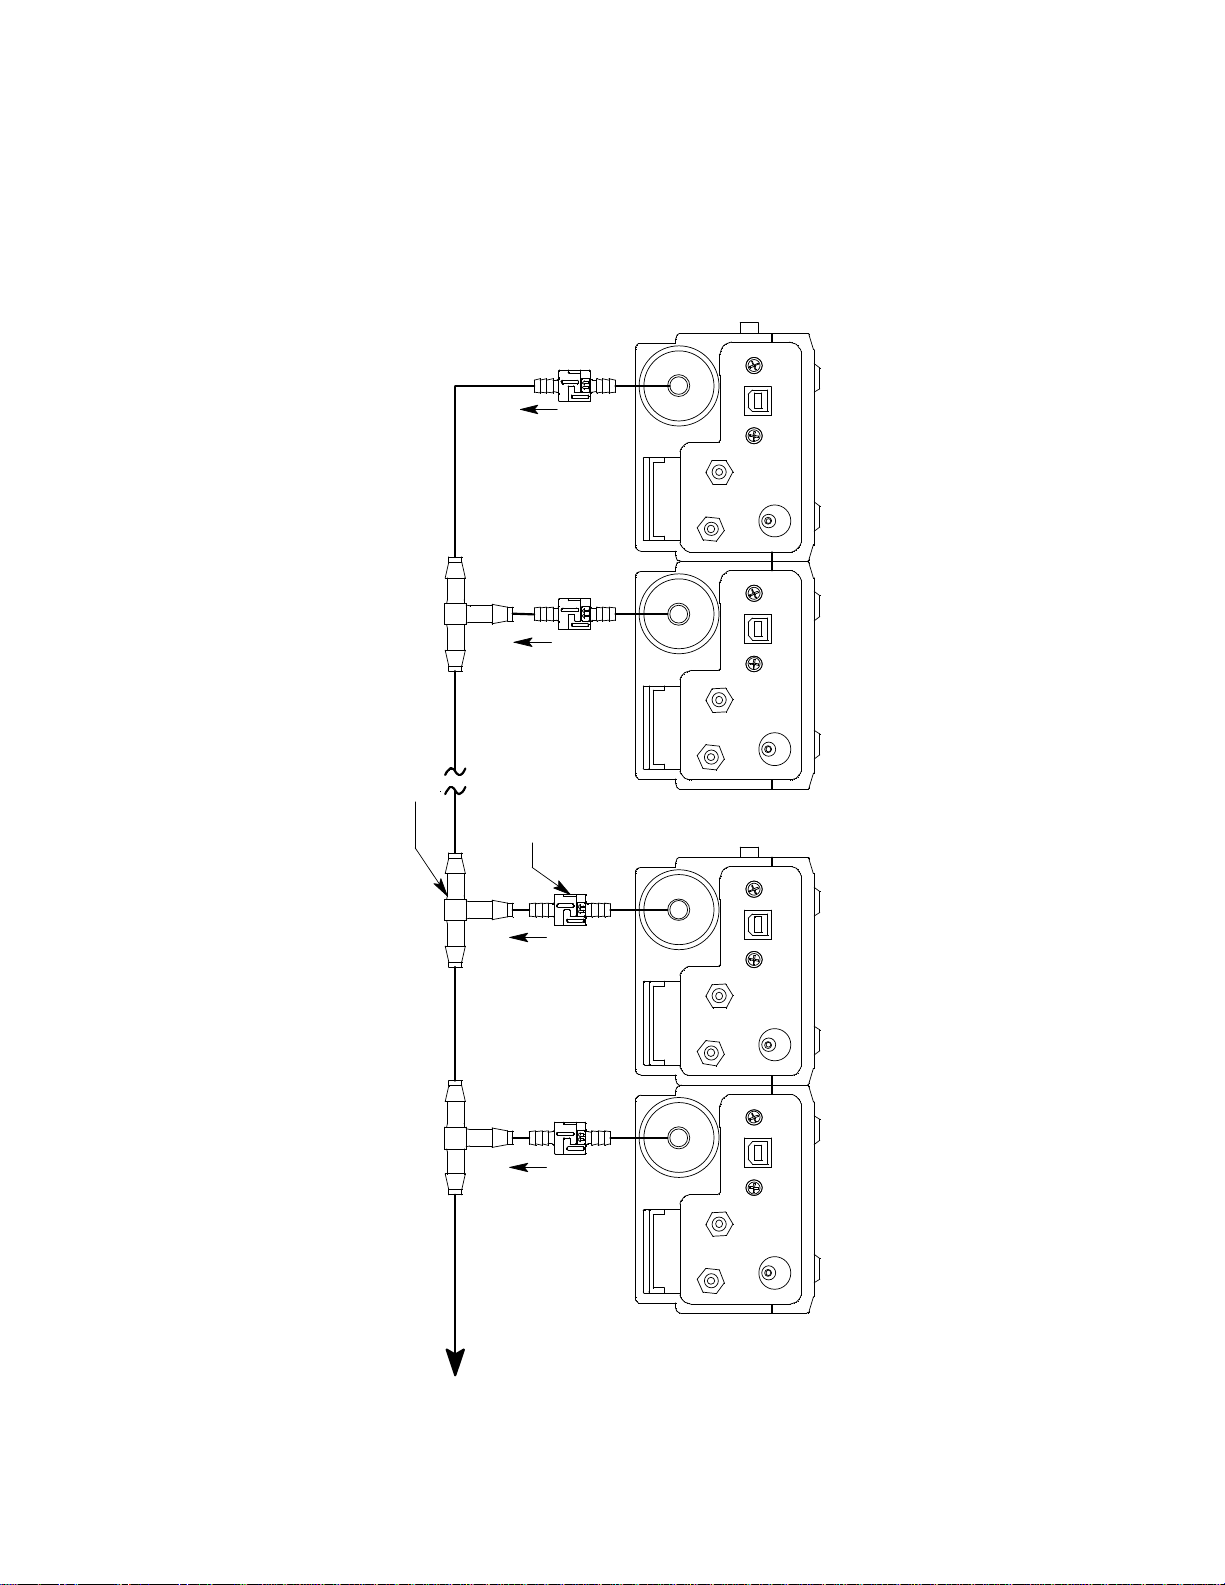
Hardware Setup
Figure 11: SDM-2009 Arrangement
This section describes how to assemble the hardware that came with the SDM-2009,
assemble a manifold, and connect calibration gas.
Hardware Assembly
The hardware assembly consists of connecting the AC adapter(s), installing the air
filter(s), installing the check valve(s), connecting the sample tubing and connecting
the USB cable(s). The SDM-GX Docking Station PC Controller software can support
1-10 SDM-2009 docking stations connected at the same time. Perform the following
steps to complete the hardware assembly for each SDM-2009:
1. Place the SDM-2009(s) on a convenient table top near an AC wall socket or
power strip in a well ventilated area. A location near a window that can be
opened is best so that the exhaust can be routed to the window.
2. If you have more than one SDM-2009, arrange them side by side as shown in
Figure 11 below. Each docking station has three connection tabs on the left
side near the bottom of the station and three connection recesses on the right
side near the bottom of the station. The tabs from one docking station can be
pushed into the recesses on another station to mechanically connect the
docking stations.
3. Insert the round plug on the end of each AC adapter’s cable into the power
jack on the back of each SDM-2009.
NOTE: If you have multiple SDM-2009s and are using a 4-port AC adapter,
plug each of the round plugs on the end of the AC adapter into the
power jack on the back of 4 separate SDM-2009s.
4. Connect the AC adapter’s wall plug into a wall AC socket or power strip.
5. Install the air filter to the AIR fitting of each SDM-2009 so that the arrow on the
filter that indicates direction of flow is pointing towards the AIR fitting. Push the
open end of the flexible tube that is on one end of the filter onto the AIR fitting
on the back of the SDM-2009.
6. Install the 10 foot long 5/16 inch ID flexible tube that is included with each
Hardware Setup • 12
Page 18

SDM-2009 on the exhaust fitting of each SDM-2009. Route the tube to an area
where the exhaust can be safely dispersed, such as an open window. Exhaust
tubing from multiple units can be daisy chained together in a manifold for more
convenient operation. In this case, the check valves that are provided with the
docking stations need to be used. See "Assembling a Manifold for Multiple
SDM-2009 Units" below for instructions.
CAUTION: The maximum recomme nded le ngth for th e exha ust tube i s 10 feet. Do
not use more than 10 feet of tubing or tubing with an ID of less than
5/16 inch for the exhaust tube or the bump test and calibration
accuracy will be adversely affected. The exhaust tube that is shipped
with the SDM-2009 has an ID of 5/16 inch and is 10 feet long.
7. Install the 3 foot long 3/16 inch ID tube that is included with the SDM-2009 on
the GAS fitting. GAS tubing from multiple units can be daisy chained together
in a manifold for more convenient operation. See "Assembling a Manifold for
Multiple SDM-2009 Units" below for instructions.
8. Connect the provided USB cord from the type B USB port on the back of the
SDM-2009 to an available USB port on your computer or to a USB hub that is
connected to your computer. See “USB Hub Requirements for Multiple Station
Systems” on page 11 for more information about USB hubs.
Assembling a Manifold for Multiple SDM-2009 Units
Up to 10 SDM-2009s can be manifolded together. The GAS fitting can be manifolded
to allow the stations to draw from one calibration cylinder. The exhaust lines can also
be manifolded together and be routed away from the docking stations with only one
10 foot long 5/16 inch piece of tubing.
Each SDM-2009 is shipped with exhaust tubing, GAS tubing, T-fittings in two different
sizes, and a check valve.
Exhaust Tubing
Reference Figure 12 for the instructions below.
1. Cut a 1-2” piece of 5/16 inch tubing for each SDM-2009 and connect it to each
unit’s exhaust fitting.
2. Connect the provided check valves to the short pieces of tubing already
installed at the exhaust fittings. Be sure that the arrows that appear on the
check valve are pointing away from the exhaust fitting.
3. Cut a 2-3” piece of 5/16 inch tubing for every SDM-2009 except the first one
and connect it to the other end of the check valve.
4. Insert the larger T-fittings into the tubing so that the remaining two ports on the
T-fitting are perpendicular to the exhaust tube and check valve.
5. For the first SDM-2009, cut a 9-10” piece of 5/16 inch tubing and connect it
from the check valve on the first SDM-2009 to the closest port on the second
SDM-2009’s exhaust T-fitting.
13 • Hardware Setup
Page 19
6. Use one of the provided 10 foot lengths of tubing and connect it to the T-fitting
7 inches
T-Fitting
10 Foot Max
Exhaust Tube
To Op en A rea
9 inc hes
AIR
GAS1
GAS1
Unit 2Unit 10
Check Valve
Unit 9
GAS1
AIR
AIR
GAS1
AIR
Unit 1
Figure 12: Exhaust Tubing Connections
on the last SDM-2009. The maximum recommended exhaust tube length is 10
feet.
7. For the remaining SDM-2009s, cut 6-7” pieces of 5/16 inch tubing and connect
the remaining T-fittings.
Hardware Setup • 14
Page 20

GAS Tubing
Reference Figure 13 for the instructions below.
1. Cut a 3-4” piece of 3/16 inch tubing for each GAS fitting on every SDM-2009
except the last one.
2. Connect the tubing to the GAS fitting on every SDM-2009 except the last one.
3. Insert the smaller T-fittings into the tubing so that the remaining two ports on
the T-fitting are perpendicular to the GAS fitting.
4. Cut 6-7” pieces of 3/16 inch tubing and connect the T-fittings.
5. Cut one more 6-7” piece of 3/16 inch tubing and connect the GAS fitting of the
last SDM-2009 to the T-fitting from the second to last SDM-2009.
6. Cut 1 piece of 3/16 inch tubing long enough for easy access to the calibration
cylinder and connect it to the T-fitting on the first SDM-2009.
15 • Hardware Setup
Page 21

Unit 1
Unit 10
Unit 2
Unit 9
GAS1
Unit 6
Unit 5
AIR
GAS1
GAS1
GAS1
AIR
GAS1
AIR AIR
GAS1
GAS1
AIR AIR
AIR
GAS1
GAS1
AIR
AIR
GAS1
AIR
Unit 7
Unit 4
Unit 8
Unit 3
Figure 13: Gas Manifold Connections
Hardware Setup • 16
Page 22

Connecting Calibration Gas
The GAS fitting on the back of the docking station is designed to be used with a
calibration gas cylinder that is fitted with a demand flow regulator. The AIR fitting may
be used with a demand flow regulator and a cylinder of zero emissions air, but this is
not normally necessary since the docking station will generally be in a fresh air area.
The type of calibration gas cylinder used depends on the gas sensors installed in the
instrument being used with the calibration station. A 4-gas mix, LEL/Oxygen/CO/H2S,
is used if the instrument being used with the calibration station is a 4-gas unit. If the
instrument does not have an H2S channel, then a 3-gas mix, LEL/Oxygen/CO, is
used. Although a 4-gas cylinder will work for an instrument of any gas combination, if
you have multiple instruments with various gas combinations, you may want to keep
a 4-gas cylinder and a 3-gas cylinder to help preserve the charcoal filter on the CO
sensor in instruments without an H2S channel. Use Table 2 below as a guide in
determining which calibration gas cylinder is appropriate for your system. See “Spare
Parts List” on page 112 for a list of available cylinder part numbers.
Table 2: Recommended Gas Cylinders
Typical Instrument Types
Recommended Calibration Gas
Cylinder(s)
LEL/Oxy/H2S/CO 4-gas mix with CH4/Oxy/H2S/CO
LEL/Oxy/CO 3-gas mix with CH4/Oxy/CO
LEL/Oxy/H2S 4-gas mix with CH4/Oxy/H2S/CO
LEL/Oxy 3-gas mix with LEL/Oxy/CO
Oxy/CO 3-gas mix with LEL/Oxy/CO
Oxy/H2S 4-gas mix with LEL/Oxy/H2S/CO
To connect calibration gas to the SDM-2009, do the following:
1. If the area around the docking station is not considered a fresh air area (an
area free of combustible and toxic gases and of normal oxygen content,
20.9%) install a tube not longer than 10 feet on the filter attached to the AIR
fitting on the back of the docking station and route it to a fresh air area or
connect a cylinder of zero air with a demand flow regulator to the AIR fitting.
2. Install the demand flow regulator on the calibration gas cylinder.
3. Connect the demand flow regulator to the GAS inlet fitting using the 3 foot
length of 3/16 inch ID sample tubing provided with the docking station.
17 • Hardware Setup
Page 23

EAGLE 2 and GX Type Instrument Connection
There are 2 different versions of the Docking Station PC Controller program. The
SDM-E2 Docking Station PC Controller program is intended for use with SDM-E2
docking stations and EAGLE 2 instruments. The SDM-GX Docking Station PC
Controller program is intended for use with GX type docking stations and GX type
instruments.
Bump tests and calibrations can be performed on multiple EAGLE 2s and GX type
instruments at the same time. The SDM-E2 Docking Station PC Controller program
controls the EAGLE 2 functions while the SDM-GX Docking Station PC Controller
program controls the GX type instrument functions. Both programs can be used
simultaneously on your PC. Follow all instructions in the SDM-E2 Docking Station PC
Controlled Configuration Operator’s Manual as well as the instructions in this manual.
Installing the SDM-GX Docking Station PC Controller Software
1. Launch Windows®.
2. Exit from all applications and open windows.
3. Go to www.rkiinstruments.com/sdm2009.
4. Click on the Download tab.
5. Click the PC Controlled Software link.
6. A .zip file will begin to download. Select whether you want to open or save the
.zip file.
7. Extract the contents of the .zip file.
8. Double click the setup.exe file.
9. The SDM-GX Docking Station PC Controller InstallShield Wizard comes up to
guide you through installation. Click Next to proceed to the License Agreement
window.
10. Read the license agreement and click the agreement acceptance selection
box, then click Next to proceed to the Customer Information window.
11. Enter a user name and organization and select if you want to install the
program for all users on the computer or just for your user account, then click
Next to proceed to the Destination Folder window.
12. The default installation folder (C:\Program Files\SDM-GX\) is displayed. If you
want to install the software in the default folder continue with step 13. If you
want to install the software in a different location, click Change and choose a
new installation folder and then continue with step 13.
13. Click Next to proceed to the Ready to Install the Program window.
EAGLE 2 and GX Type Instrument Connection • 18
Page 24
14. Review the installation settings. If they are OK, click Install and the installation
process will begin. If you want to change installation settings, click Back and
change them to the desired settings.
15. During software installation, the installation program may find newer versions
of Windows files on your computer than those in the downloaded .zip file. If
this happens, the installation software will ask you if you want to keep these
newer files. Click Yes to do so.
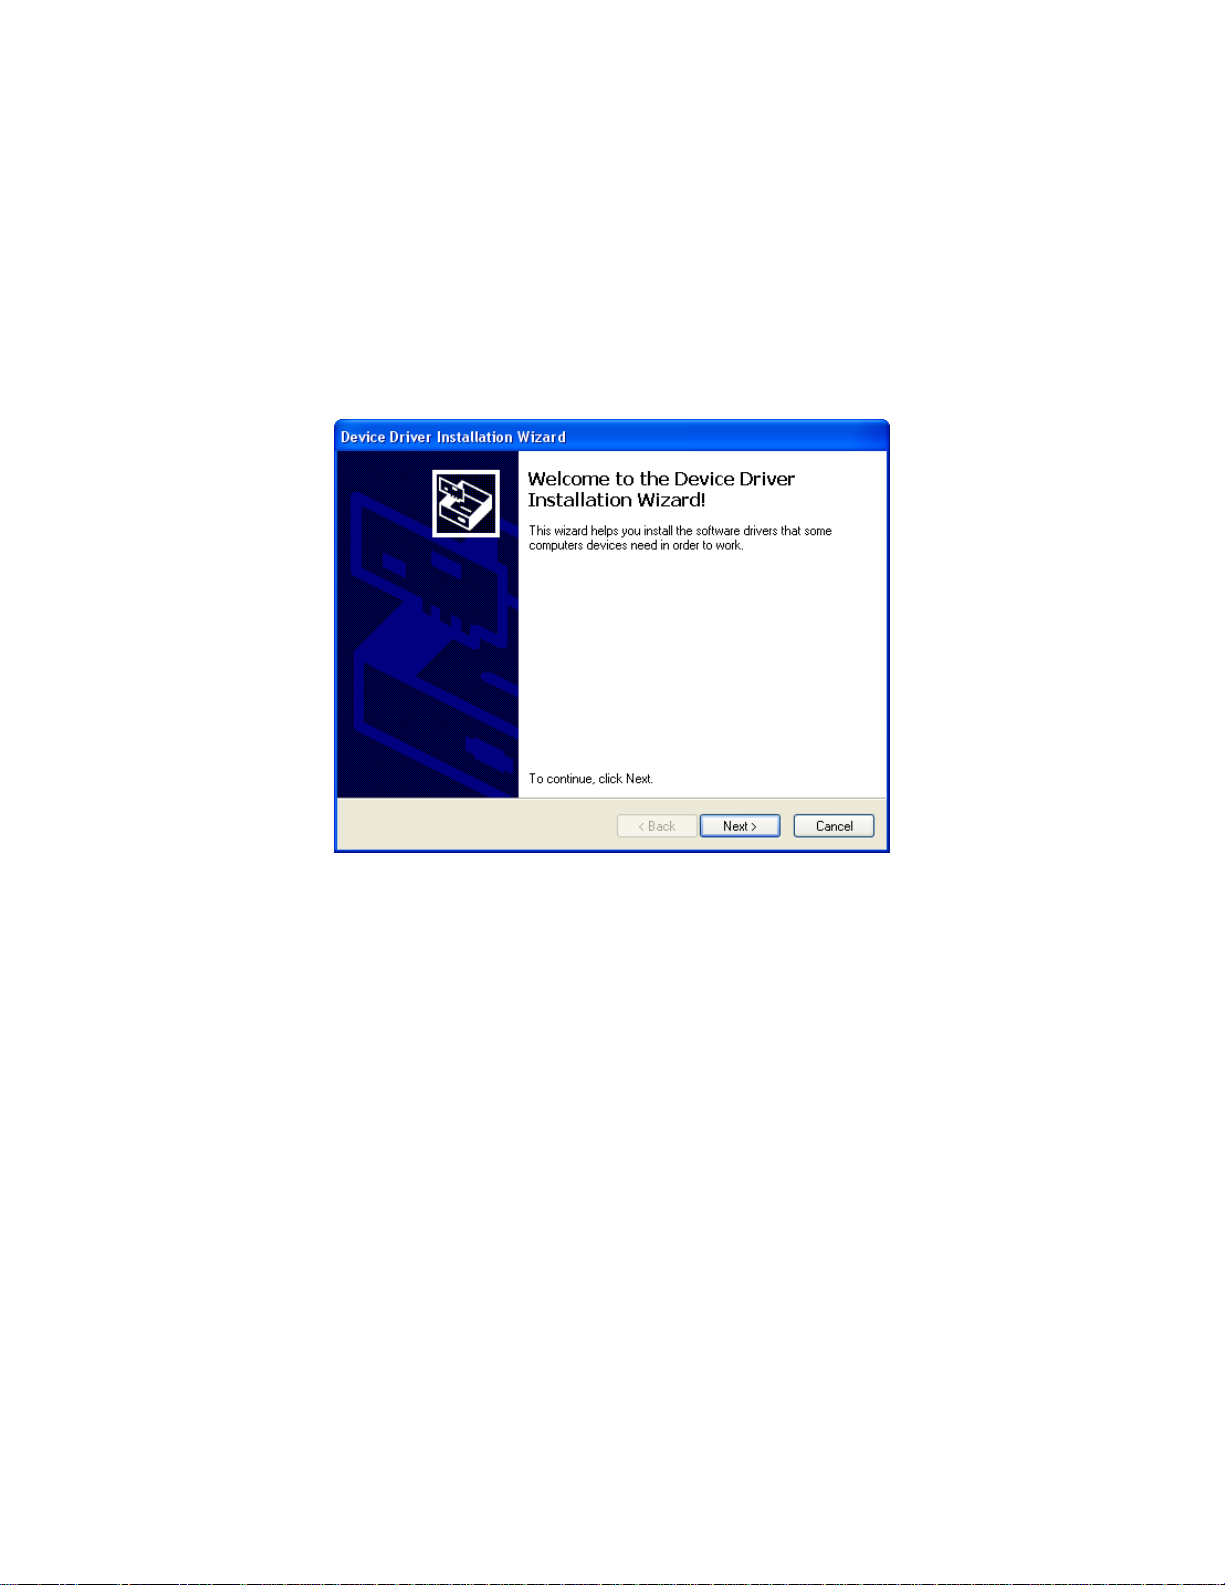
16. A Device Driver Window will appear prompting you to install necessary drivers.
You cannot continue the installation without installing the drivers.
Figure 14: Device Driver Installation
17. Click Next to install the drivers. The Wizard will find the appropriate drivers.
19 • Installing the SDM-GX Docking Station PC Controller Software
Page 25
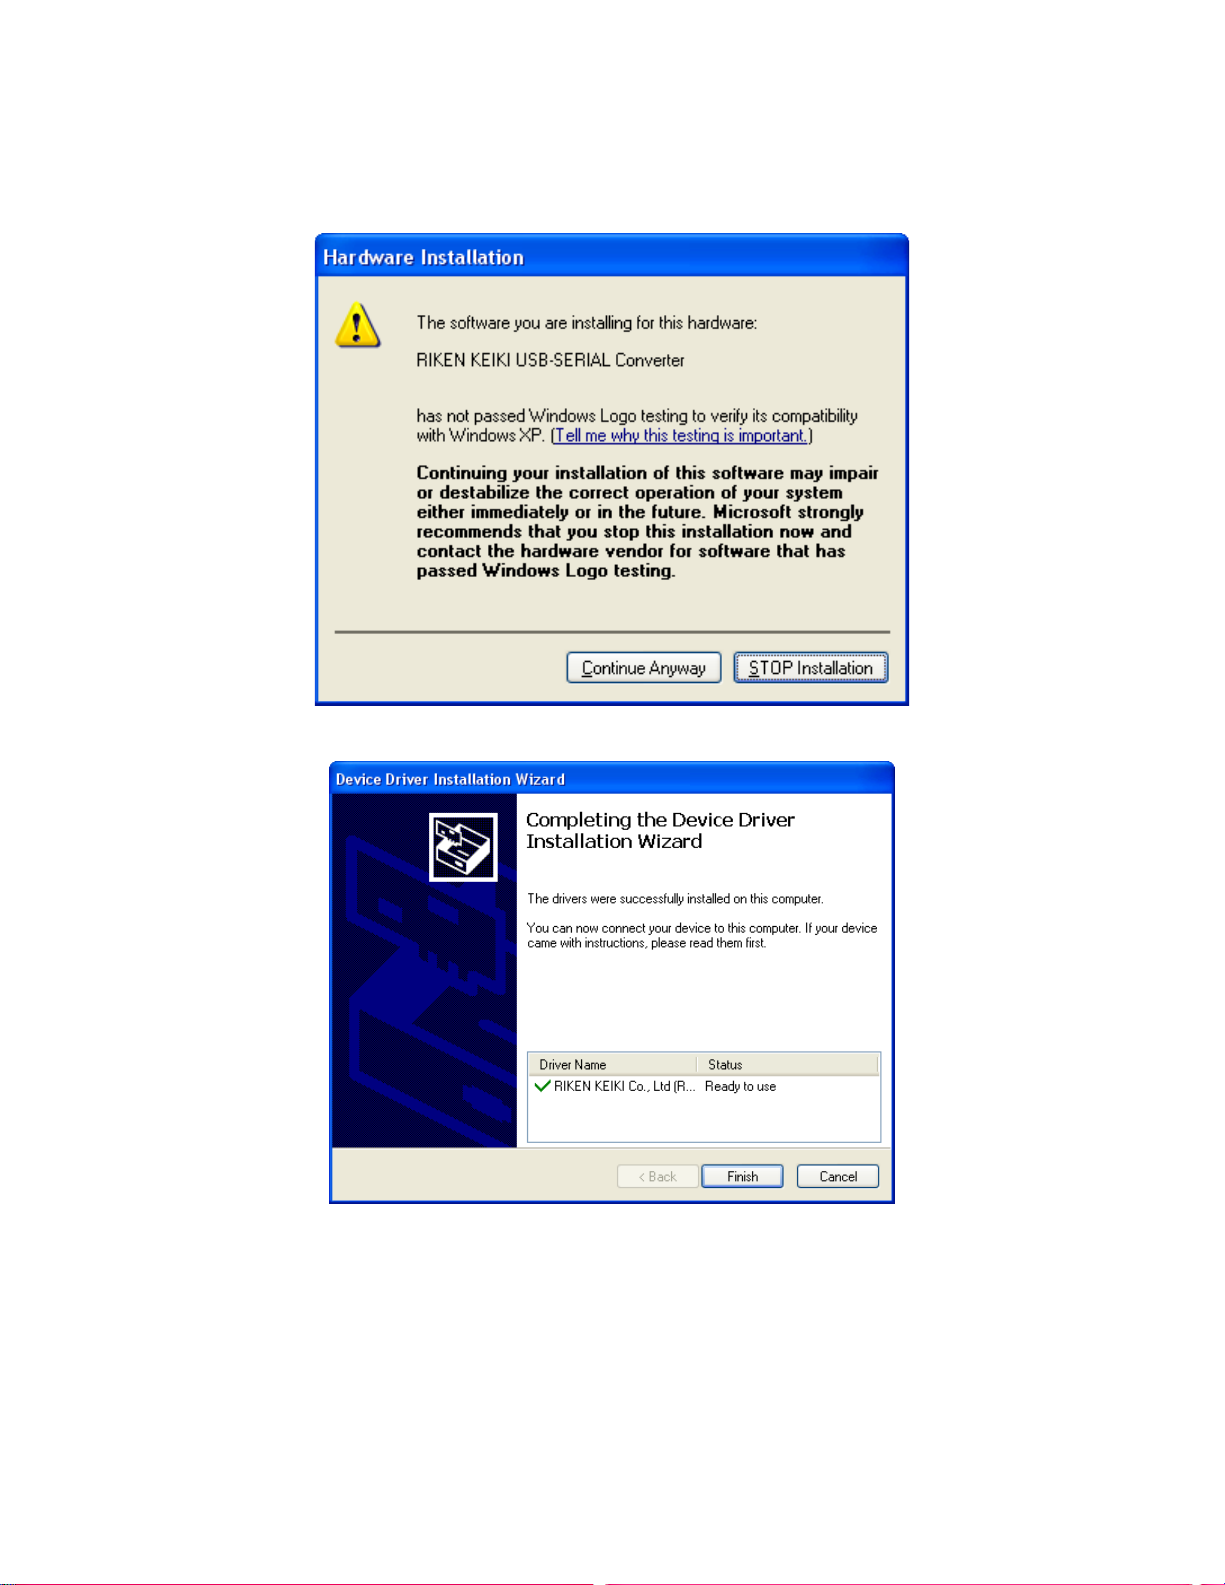
18. If this is the first time you are installing a PC Controller Program, a window will
appear saying that the file did not pass Windows logo testing. Click Continue
Anyway.
19. Click Finish once the drivers are successfully installed.
Figure 15: Finish Device Driver Installation
The installation will continue.
20. Follow the on-screen instructions to complete software installation.
21. To complete the driver installation, ensure that all of your docking stations are
connected to your computer.
Installing the SDM-GX Docking Station PC Controller Software • 20
Page 26
22. Turn on a docking station by pressing and holding the POWER button for at
least 1 second.
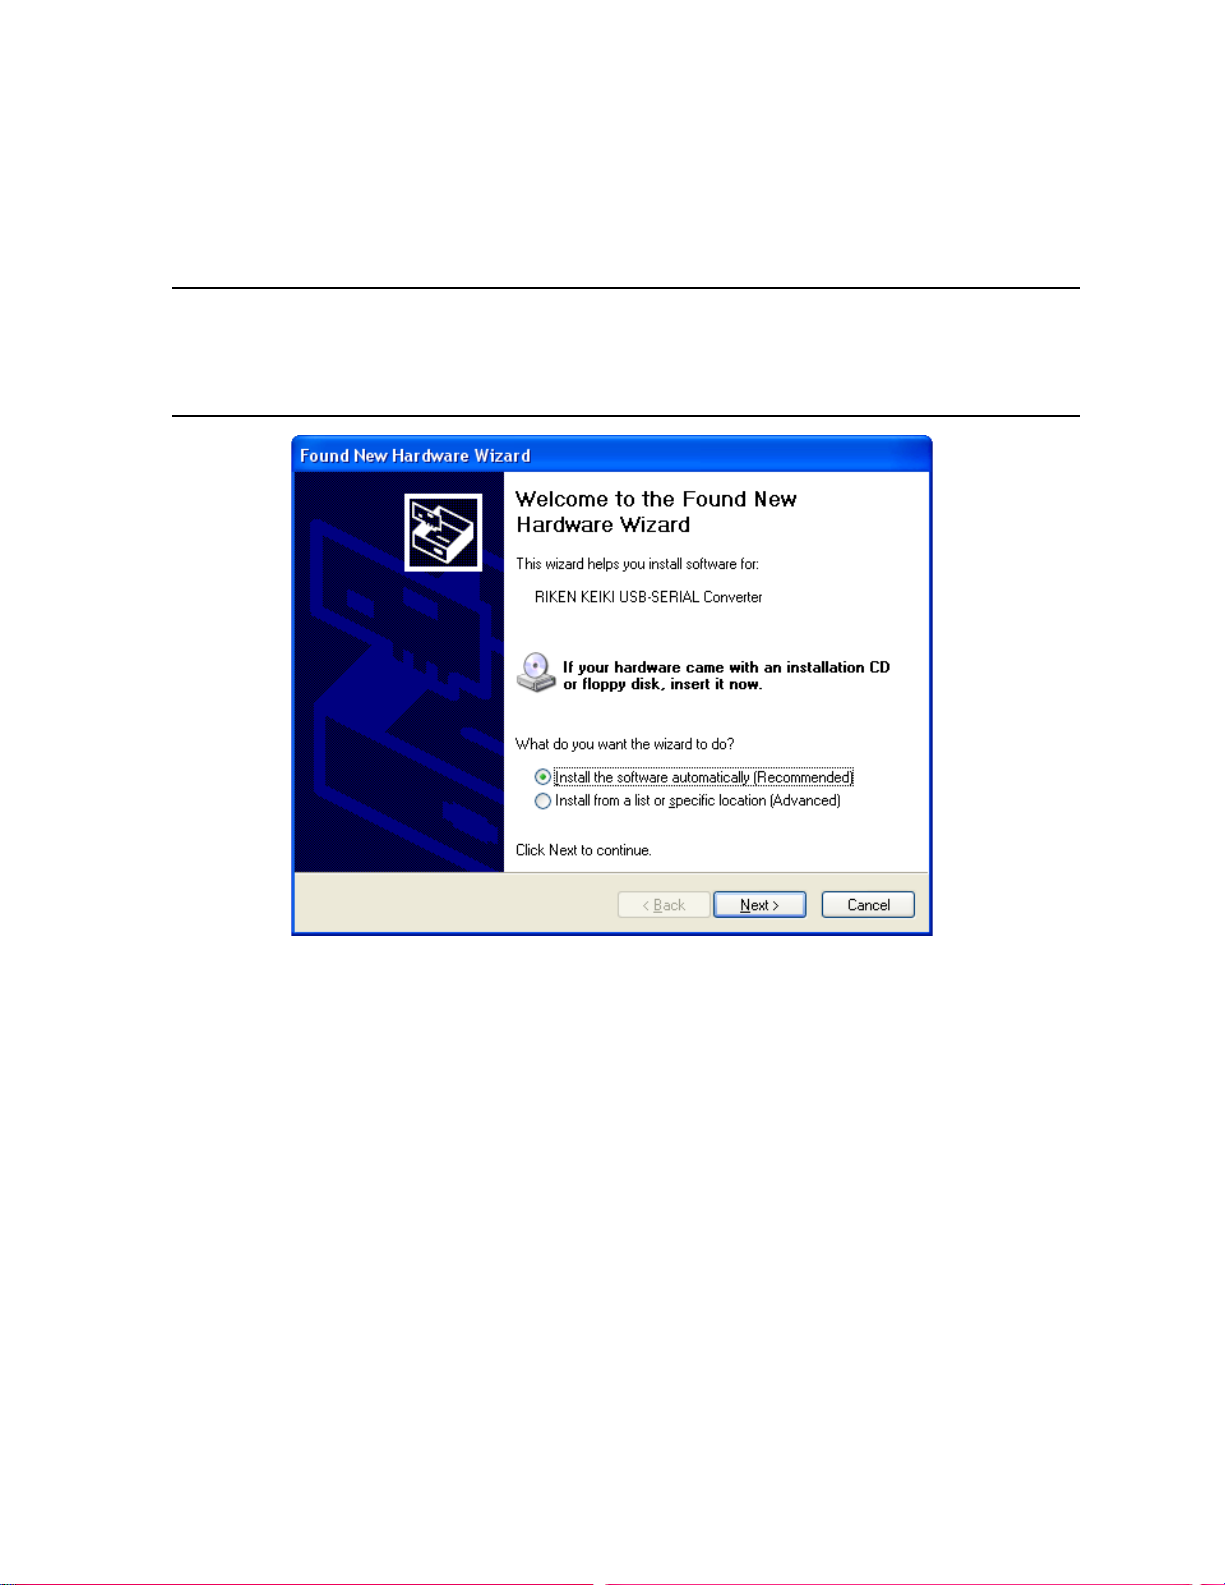
23. The first time an SDM-2009 is turned on after being connected to the
computer, a Found New Hardware window will appear.
NOTE: The following instructions apply only to computers running Windows
XP. If you have a newer operating system, the hardware driver will
automatically install and you will be notified that the USB device is
ready for use.
Figure 16: Found New Hardware Wizard
24. Select the “Install the software automatically” option and click Next.
21 • Installing the SDM-GX Docking Station PC Controller Software
Page 27
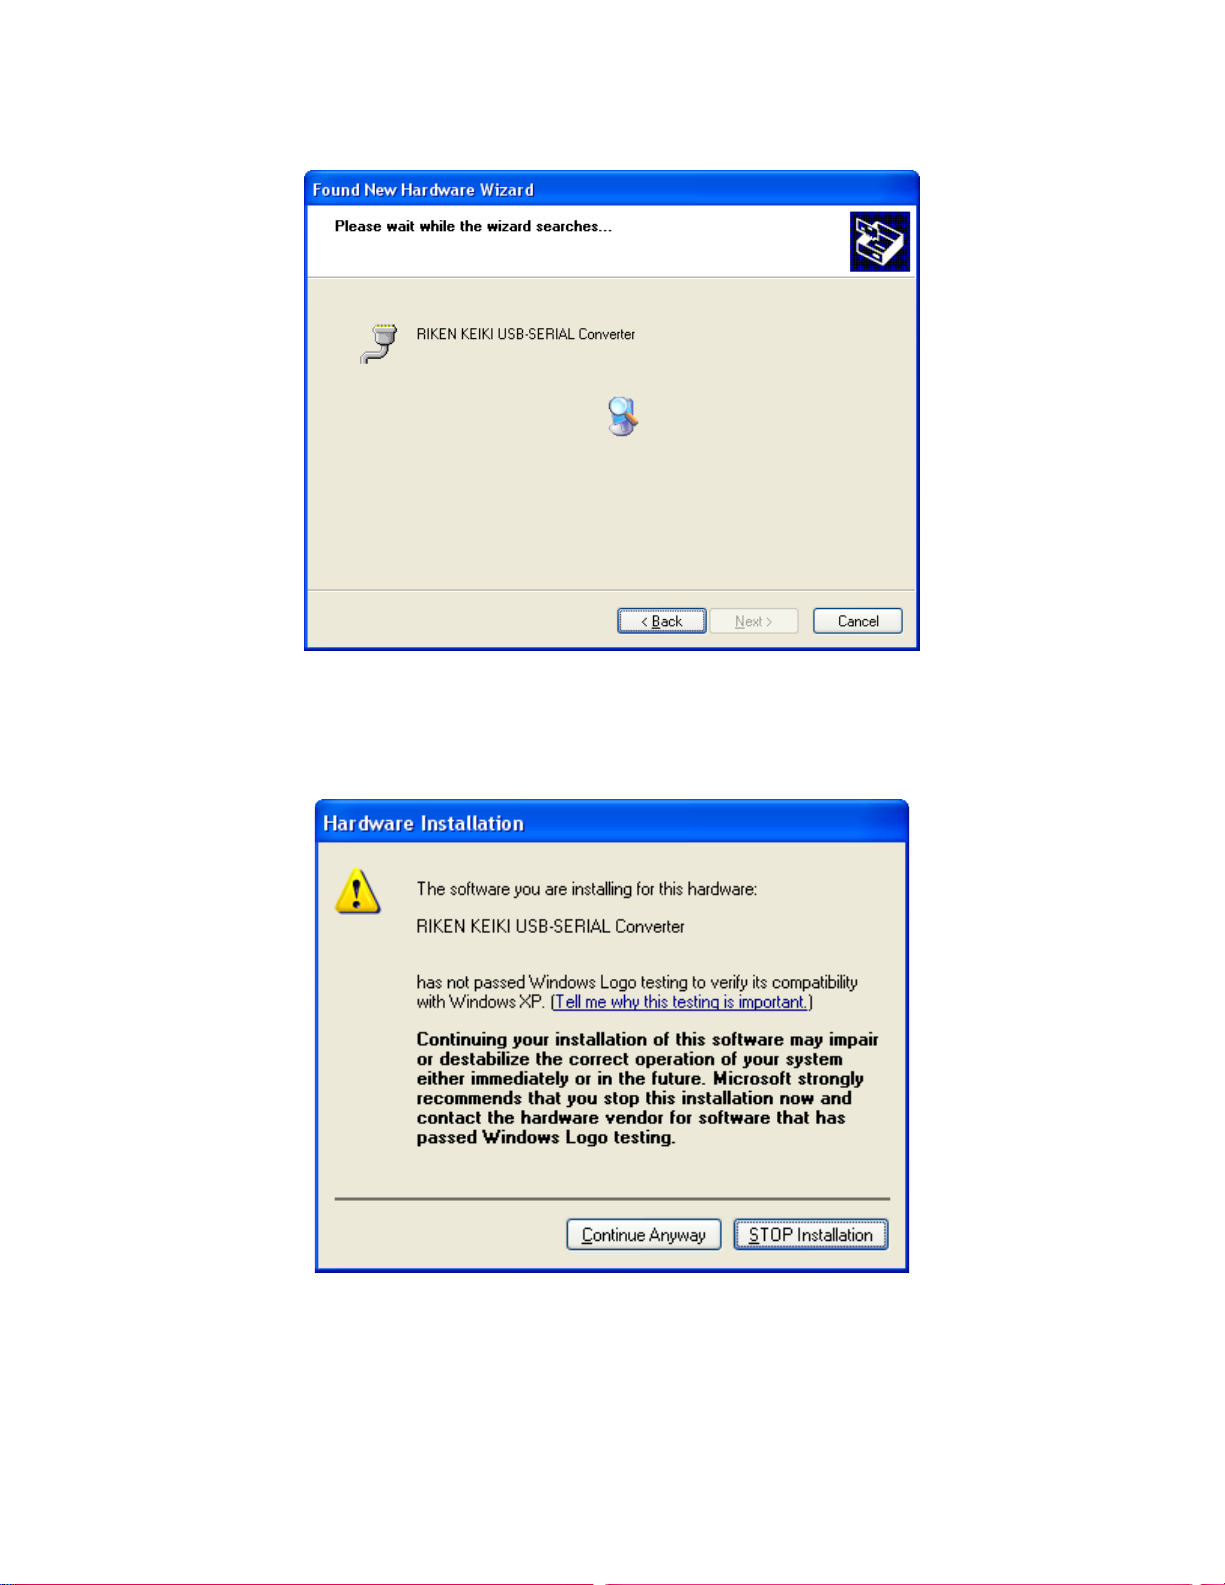
25. The wizard will search for the driver files.
Figure 17: Searching
26. Once the files have been found, a window will appear saying that the file did
not pass Windows logo testing. Click Continue Anyway.
Figure 18: Windows Logo Error
27. The installation will continue. Click Finish when the installation has completed.
28. Repeat steps 22 through 27 for every docking station in your system.
Installing the SDM-GX Docking Station PC Controller Software • 22
Page 28
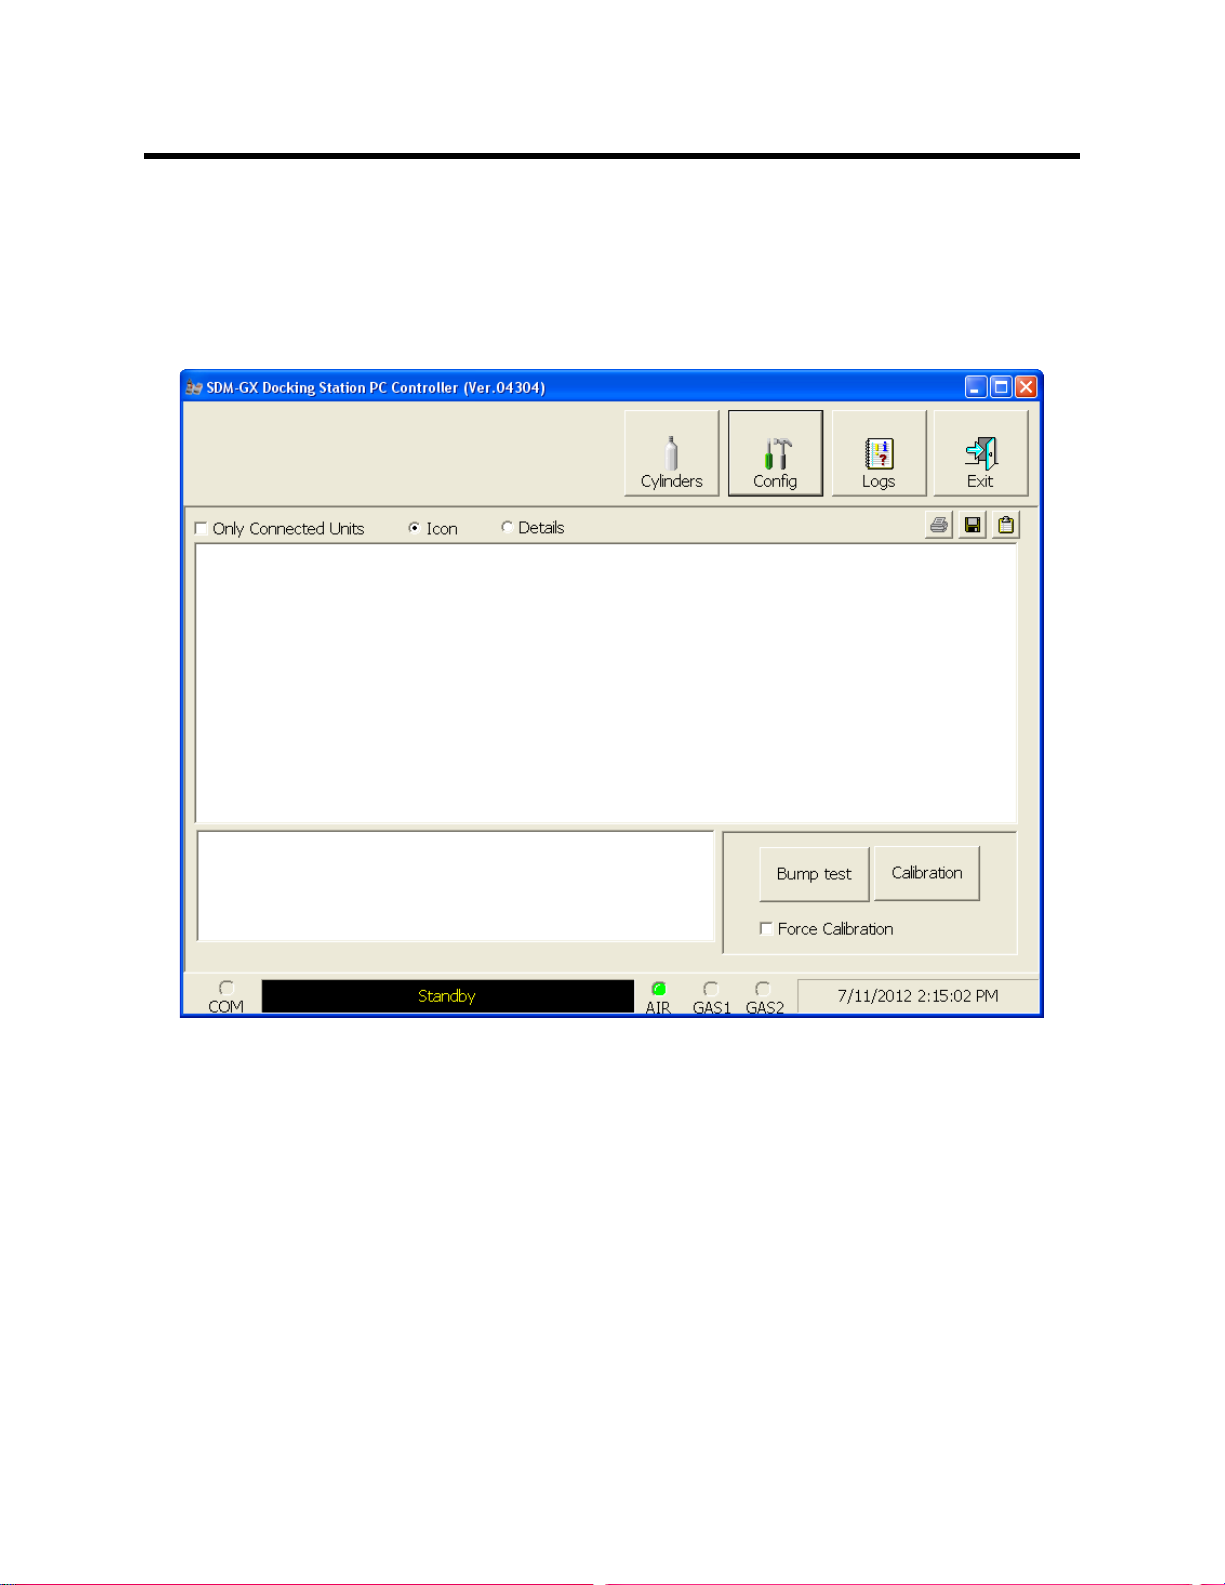
Launching the SDM-GX Docking Station PC Controller Program
1. Click Start on the Windows Icon Tray, then select Programs/SDM-GX
Docking Station PC Controller. You may also double click the shortcut
created on your desktop. The SDM-GX Docking Station PC Controller
Program is launched and the main program window appears.
Figure 19: Main Program Window
2. If you are starting the software for the first time, a message window appears
informing you that a database has been created. Click OK in that window.
When starting the software for the first time, or if you wish to change the
software setup, proceed to the next section, "Overview of the SDM-GX
Docking Station PC Controller Program".
If you have already performed the software setup, proceed to “Connecting
Instruments to the PC Controller Program” on page 38.
23 • Launching the SDM-GX Docking Station PC Controller Program
Page 29

Overview of the SDM-GX Docking Station PC Controller Program
This section provides a brief overview of the program and a description of the main
program window. Instructions for using the program are given in other parts of this
manual. Use this section to become familiar with the main program window, but
before attempting to use the program, make sure to perform the program setup as
described in “Setting Up the PC Controller Program” on page 26.
The PC Controller Program is designed to provide manual or automated data
downloading, bump testing, and calibration of the GX-2009. It also provides the
capability to update instrument parameters such as alarm points. The program
compiles a database of the instruments that have been connected to the program
which consists of calibration and bump test history, logged data (if a unit’s data is
downloaded), and memos that record user entered information about an instrument
at a particular time.
The GX-2009 is a gas monitoring device for combustible gas, O2, H2S, and CO. It
stores logged data and calibration information in its internal memory. See the GX-
2009 Operator’s Manual for a complete description of the GX-2009.
PC Controller Program Functions
The PC Controller Program has the following basic functions accessed or controlled
by buttons in the main program screen.
• Gas cylinder setup accessed by the Cylinders control button
• Program and system configuration accessed by the Config control button (this
function is password protected)
• Data viewing accessed by the Logs control button
• Instrument bump testing controlled by the Bump test control button
• Instrument calibration controlled by the Calibration control button
Main Program Window
The main program window is where the current status of the program operation is
shown. Any SDM-2009s and instruments that are currently connected to it and any
instruments that have previously been but are not currently connected to it are also
shown. The program’s various functions are initiated or accessed from this screen.
The current date and time are always displayed in the lower right corner of the main
program window.
Overview of the SDM-GX Docking Station PC Controller Program • 24
Page 30
Message Area
SDM-2009/Instrument Display Area
Control Buttons
The Cylinders, Config, Logs, and Exit control buttons are located along the top
right of the window. The Bump test and Calibration control buttons are located in
the lower right of the window along with the Force Calibration selection box. The use
of these control buttons and the Force Calibration selection box is described in other
parts of this manual.
SDM-2009/Instrument Di spla y Area
The large middle portion of the main program window displays SDM-2009s and
instruments that are currently connected to the PC Controller Program and
instruments that are in the database. The SDM-2009s are identified by a number. The
instruments are identified by their serial number. By selecting either the Icon radio
button or the Details radio button, the SDM-2009s and instruments can be displayed
either as icons or in a table format that shows various instrument parameter details
such as station ID, user ID, the next scheduled bump test date, and the next
scheduled calibration date among others. If the Only Connected Units box is
25 • Overview of the SDM-GX Docking Station PC Controller Program
Figure 20: Parts of the Main Program Window
Page 31

checked, then only instruments that are currently connected to the PC Controller
Program will be shown.
Program Status
Three areas of the main program window indicate the program status. The smaller
area in the lower left below the SDM-2009/instrument display area is the message
area. It displays messages that indicate actions and status of the program.
Below this area is the communications port indicator which shows when the program
is communicating with the docking station(s).
To the right of the communications port indicator is the status field. It displays the
current status of the program. It can indicate if the software is in standby mode or if it
is downloading data among other indications.
Fitting Indicators
To the right of the status field are 3 round fitting indicators. They correspond to the
AIR and GAS fittings on the back of the SDM-2009. They indicate whether the
corresponding solenoid is activated so it can allow gas to flow through the fitting it
controls. When the indicator is green, the fitting is active. When the indicator is blank,
the fitting is not active.
NOTE: The SDM-2009 does not have a GAS 2 fitting. The GAS 2 indicator will
never be green while the PC Controller program is connected to an
SDM-2009.
Setting Up the PC Controller Program
Once the program is installed, you must set up the program for your system. Setting
up the PC Controller Program consists of the following tasks:
• setting up the parameter configuration
NOTE: Only the Parameter tab of the Configuration Window is discussed in
this section. See “Config Window” on page 109 for a description of the
other tabs in the Configuration Window.
• setting up the SDM-2009 display order
• defining which calibration gas cylinders will be used
Setting Up the Configuration
1. Launch the program as described in “Launching the SDM-GX Docking Station
PC Controller Program” on page 23.
NOTE: It is not necessary to turn on the SDM-2009 docking stations if you are
only performing configuration setup.
Setting Up the PC Controller Program • 26
Page 32

2. The configuration parameters are located in the Configuration Window of the
SDM-GX Docking Station PC Controller program. To access the Configuration
Window, click the Config button along the top of the main program window.
3. You will be prompted to enter a password. The factory set password is
ABCDE. Enter the password and click OK keeping in mind that the password
is case sensitive. You may change the password using the Password Tab once
you have entered the Configuration Window. See “Password Tab” on page 111
for instructions to change the password.
4. The Parameter Tab of the Configuration Window will be displayed.
Figure 21: Config Window Parameter Tab
27 • Setting Up the PC Controller Program
Page 33

5. Select the Instrument Information options.
• Change Parameter
If Change Parameter is selected (factory setting), the Edit function is active
in the Instrument Function Menu allowing you to change various
parameters in connected instruments. See “Edit Function” on page 99 for a
complete description of the Edit function. If it is not selected, the Edit
function is not active. Select or deselect the Change Parameter box.
• Auto Power OFF Time
This is the length of time that will pass after the last operation is finished
before the program will automatically shut off the instrument. If a
successful bump test or calibration is performed, the program will
automatically shut off the instrument in 20 seconds regardless of the Auto
Power OFF Time setting. Use the arrows to the right of the current setting
to change the value or highlight the current setting and type in the desired
value. It is defined in seconds with a maximum setting of 3600 seconds (1
hour). The factory setting is 3600 seconds.
6. Select the Data Logger options.
• Down Load Data Logger
The Down Load Data Logger selection allows you to have saved data
automatically downloaded from the instrument once it is connected to the
PC Controller program. The data will automatically be downloaded based
on the frequency set in the Down Load Interval option. The factory setting
is deselected. Select or deselect the Down Load Data Logger box.
• Clear After Down Load
The Clear After Down Load selection allows you to automatically clear the
instrument data logger after an automatic download. The factory setting is
deselected. Select or deselect the Clear After Down Load box. If Down
Load Data Logger is not selected, selecting Clear After Download has no
effect.
• Down Load Interval
The Down Load Interval is the length of time, in days, that will pass before
the PC Controller program will automatically download data from an
instrument if Down Load Data Logger is selected. If the instrument is
connected to the program before the interval has passed, a data download
will not automatically occur. The Down Load Interval can be set anywhere
from 1 to 60 days. The factory setting is 1 day. Use the arrows to the right
of the current setting to change the interval or highlight the current setting
and type in the desired value.
7. SDM Selection
If you select the Initialize Display Order selection box, the PC Controller
Setting Up the PC Controller Program • 28
Page 34

program will reset the numbers it has assigned to specific docking stations and
reassign them as you turn SDM-2009 docking stations on and connect them to
the program. See “Setting Up the SDM-2009 Display Order” on page 33 for
instructions to use this feature.
8. Select the Waiting Time for Auto Process
The Waiting Time for Auto Process parameter defines the time delay of an
automatic calibration or automatic bump test after an instrument is connected
to the SDM-2009. You can set the delay from 0 seconds to 3600 seconds.
9. Select the Calibration options.
If Manual Calibration is selected, you are able to manually select an instrument
or instruments in the main program window and click Calibration in the lower
right corner of the window in order to perform a calibration.
If Auto Calibration is selected and Every Time is not, if an instrument is due for
calibration, a calibration will automatically begin in the time defined by the
Waiting Time for Auto Process parameter after that instrument successfully
connects to the program and its instrument parameters are retrieved by the
program. When you select Auto Calibration, a window pops up indicating that
only sensors tested with GAS 1 and one sensor tested with GAS 2 will be
calibrated in auto calibration.
This screen does not have any meaning for the GX-2009 and is only
applicable to the GX-2012 and Gas Tracer instruments.
If Auto Calibration and Every Time are selected, a calibration will automatically
begin in the time defined by the Waiting Time for Auto Process parameter after
that instrument successfully connects to the program and its instrument
parameters are retrieved by the program regardless of whether a calibration is
due.
If neither Manual Calibration nor Auto Calibration box is selected, you will not
be able to perform a calibration. The factory setting is Manual Calibration
selected and Auto Calibration deselected. Select the box for the desired
operation.
The Auto Calibration selection also has a Standard GAS and an All GAS
selection. The GX-2009 does not have any non-standard sensors so this
setting does not have any effect on the automatic calibration of a GX-2009.
The Interval (for CX-II) parameter sets the calibration interval but is only used
for CX-II instruments. It does not have any effect on the SDM-GX program
29 • Setting Up the PC Controller Program
Page 35

when used with GX-2009 instruments.
10. Select the Bump Test options.
The Bump Test section of the Parameters Tab allows you to make selections
related to the bump test functionality of the SDM-2009.
• Manual Bump Test/Auto Bump Test
You can select Manual Bump Test or Auto Bump Test.
If Manual Bump Test is selected, you have to manually select an instrument
or instruments in the main program window and click Bump Test in the
lower right corner of the window in order to perform a bump test.
If Auto Bump Test is selected, and an instrument is due for bump testing, a
bump test will automatically begin in the time defined by the Waiting Time
for Auto Process parameter after that instrument successfully connects to
the program and its instrument parameters are retrieved by the program.
NOTE: If the instrument’s Bump Test Function is set to On, the GX-2009’s
instrument information is used to determine if a bump test is needed.
If the instrument’s Bump Test Function is set to Off, the SDM-GX PC
Program’s Bump Test Interval parameter and last successful bump test
date are used to determine if a bump test is needed. If a bump test has
never been done using the SDM-GX Program, an auto bump will be
initiated.
When you select Auto Bump Test, a window pops up indicating that only
sensors tested with GAS 1 and one sensor tested with GAS 2 will be bump
tested in auto bump test.
This screen does not have any meaning for the GX-2009 and is only
applicable to the GX-2012 and Gas Tracer instruments.
If neither box is selected, you will not be able to perform a bump test. The
factory setting is Manual Bump Test selected and Auto Bump Test
deselected. Select the box for the desired operation.
The Auto Bump Test selection also has a Standard GAS and an All GAS
selection. The GX-2009 does not have any non-standard sensors so this
setting does not have any effect on the automatic bump testing of a
GX-2009.
Setting Up the PC Controller Program • 30
Page 36

• Fast Bump
If Fast Bump is not selected, the gas application during a bump test will
continue for the time period defined by the Gas Exposure Time bump test
parameter regardless of the sensor reading(s).
If Fast Bump is selected and the gas reading for the sensor(s) being tested
is above the lower tolerance and below the upper tolerance within 10
seconds, the sensor(s) pass bump testing, the gas application will be
stopped, and the test will move on to the next sensor(s) or to the fresh air
purge. If the gas reading on any of the tested channels is below the lower
tolerance or above the upper tolerance within 10 seconds, the gas
application will continue for the time period defined by the Gas Exposure
Time bump test parameter, and the pass/fail status of the sensor(s) will be
determined at that point. Turning Fast Bump on allows calibration gas to be
saved when the tested sensors respond quickly and accurately.
Consider the following scenario as an example.
•50% LEL methane used for bump testing the combustible gas channel
•GAS bump test parameter set to 20 seconds
•Tolera nce set to ± 50% LEL, which means that the acceptable reading
range is 25% LEL - 75% LEL
•Fast selected
The table below shows possible readings at 10 seconds and the effect on
the gas application.
Table 3: Example Fast Bump Scenarios
Gas Reading 10 Seconds
Into Fast Bump
Outcome
15% LEL (-70% of 50% LEL) • Gas application continues for the full 20 seconds
• Pass/fail determined at end of 20 seconds
30% LEL (-40% of 50% LEL) • Gas application stops
• Sensor passes bump testing
60% LEL (+20% of 50% LEL) • Gas application stops
• Sensor passes bump testing
80% LEL (+60% of 50% LEL) • Gas application continues for the full 20 seconds
• Pass/fail determined at end of 20 seconds
• Interval
The Interval can be set anywhere between 1 and 30 days and is the length
of time that can pass before the program will prompt you to perform a bump
test. The factory setting is 30 days.
31 • Setting Up the PC Controller Program
Page 37

Use the arrows to the right of the current interval or highlight the current
setting and type in the desired value. The value you type in must be valid
(between 1 and 30 days).
NOTE: This parameter only affects the operation of the SDM-GX PC Program
when used with GX-2009s whose Bump Test Function is set to Off. If
the GX-2009’s Bump Test Function is set to On, the instrument’s bump
test interval is used to determine if a bump test is due.
• Gas Exposure Time
The Gas Exposure Time can be set to 30 (factory setting), 45, 60, 90, 120
seconds or Auto and is the length of time that gas is applied to the
instrument. If you select Auto, the PC Controller program will apply gas for
the appropriate amount of time based on your instrument sensor
configurations.
To change the Gas Exposure Time, click on the current setting. A drop
down menu will appear. Select the desired time.
• Tolerance
The Tolerance can be set between 10% and 50%. The factory setting is
50%. It determines how close the instrument gas reading must be to the
calibration gas concentration for each channel during a bump test in order
to pass the bump test. It is defined as a percentage of the calibration gas
concentration.The amount that the instrument gas reading differs from the
calibration gas concentration must be equal to or less than this percentage
of the calibration gas concentration. For example, if the tolerance is set to
50%, and the %LEL calibration gas concentration is 50% LEL, then the
bump test gas reading for the LEL channel on the instrument must be 50
%LEL ± 25 %LEL.
To change the Tolerance, use the arrows to the right of the current setting
or highlight the current setting and type in the desired value. The value you
type in must be valid (between 10 and 50%).
11. When you are finished making changes, click OK. If you want to save the
changes, click Yes in the window that comes up. If you do not want to save the
changes, click No in the window that comes up. To return to the Configuration
Window, click Cancel.
To exit the Configuration Window and return to the main program window
without saving any changes, click Cancel in the Configuration Window and
click OK in the confirmation screen that comes up.
Setting Up the PC Controller Program • 32
Page 38

Setting Up the SDM-2009 Display Order
Setting up the display order for your SDM-2009s ensures that the docking stations
will appear in the PC Controller program in the same order that they are laid out in
your calibration area.
Before performing this operation, make sure your SDM-2009s are arranged on the
table top or other surface as desired and that they are connected to the computer.
See “Hardware Setup” on page 12. Also be sure that you have performed the driver
installations as described in “Installing the SDM-GX Docking Station PC Controller
Software” on page 18.
1. Click the Config button along the top of the screen to access the Configuration
Window.
2. You will be prompted to enter a password. The factory set password is
ABCDE. Enter the password and click OK keeping in mind that the password
is case sensitive. You may change the password using the Password Tab once
you have entered the Configuration Window. See “Password Tab” on page 111
for instructions to change the password.
3. The Parameter Tab of the Configuration Window will be displayed.
Figure 22: Config Window Parameter Tab
33 • Setting Up the PC Controller Program
Page 39

4. Click the box next to Initialize Display Order in the SDM portion of the
Parameter tab.
5. Click OK.
6. The program will ask if you want to save the changes. Click Yes .
7. A window will appear informing you that you need to turn off all SDMs and
restart the program. Click OK.
8. Click the Exit button in the upper right corner of the main program window to
exit the program.
9. Turn off all of the SDM-2009s if they are on.
10. Open the SDM-GX Docking Station PC Controller program again.
11. Turn on your SDM-2009s in the order that you wish for them to appear on the
main program window. Typically the order in which the docking stations appear
on the screen corresponds to their left to right arrangement on the tabletop.
12. Your SDM-2009 docking stations should all appear on the screen in numerical
order. The program will remember each SDM-2009’s number. If fewer than all
of the docking stations are turned on, the stations will still appear in numerical
order on the Main Program Window, but the stations which are off will not be
shown.
13. If you need to reorder the docking stations, repeat steps 1 through 12.
Setting Up the PC Controller Program • 34
Page 40

Cylinders Window
The Cylinders Window allows you to keep track of cylinders that are in use and the
expiration date for those cylinders. If a cylinder’s expiration date has passed, the PC
Controller program will alert you in the message area of the main program window as
soon as the program is started. The Cylinders window comes with a list of predefined
cylinders that are fairly common. If a cylinder that you need to use is not on this list, it
can be added at the bottom of the cylinder list. You may add as many custom
cylinders as necessary.
Figure 23: Cylinders Window
The Cylinders window has the cylinder list number, the cylinder name, the part
number, the expiration date, and the status of the cylinder.
35 • Setting Up the PC Controller Program
Page 41

Selecting a Cylinder from the Predefined List
The Cylinders Window comes with several predefined cylinders that you can choose
from.
1. To access the Cylinders Window, click the Cylinders button along the top of the
main program window.
2. Click in a Name field, click on the drop down menu that appears, and select a
predefined cylinder.
Figure 24: Predefined List of Cylinders
3. Set the expiration date by clicking in the Expiration field and clicking the drop
down menu that appears. Use the calendar to choose an expiration date. The
expiration date box will be highlighted in orange if the expiration date of the
cylinder is less than 10 days away. The expiration date box will be highlighted
in red if the expiration date has passed.
4. Select or deselect the Active box for each cylinder. If the cylinder is active, the
PC Controller program will alert you at start up if the cylinder has passed its
expiration date. If it is not active, the program will not alert you.
5. To return to the main program window without saving any changes, click
Setting Up the PC Controller Program • 36
Page 42

Cancel in the Cylinders Window. A window will appear notifying you that
changes will not be saved. To continue to the main program window, click OK.
To return to the Cylinders Window to save your changes, click Cancel.
6. If you want to save any changes made, click OK. A window will appear asking
if you want to save the changes you made. To return to the main program
window and save your changes, click Yes. To return to the main program
window without saving changes, click No. To return to the Cylinders Window,
click Cancel.
Defining New Cylinders
If your instrument configuration requires the use of a cylinder that is not in the
predefined list, you can add that cylinder by either typing in the information for the
cylinder or by editing the information for an existing cylinder.
1. To access the Cylinders Window, click the Cylinders button along the top of the
main program window.
2. Click in any blank cylinder name field and click again to bring the cursor up or
use the drop down menu to select a cylinder name that is close to the one you
want and click the name to bring the cursor up.
Figure 25: New Cylinder
37 • Setting Up the PC Controller Program
Page 43

3. Type in the name of your new cylinder (ie. gas name and concentration).
4. Click in the Part No field once to select it and once more to bring the cursor up.
Type in the part number for your new cylinder (typically the RKI part number).
5. Click in the Expiration field and click on the drop down menu that appears. Use
the calendar to select an expiration date. The expiration date box will be
highlighted in orange if the expiration date of the cylinder is less than 10 days
away. The expiration date box will be highlighted in red if the expiration date
has passed.
6. Select the Active box if you want the PC Controller program to alert you when
the cylinder’s expiration date has passed. If you do not want the program to
alert you, leave the box deselected.
7. To enter any more cylinders, repeat step 3 through step 6.
8. To return to the main program window without saving any changes, click
Cancel in the Cylinders Window. A window will appear notifying you that
changes will not be saved. To continue to the main program window, click OK.
To return to the Cylinders Window to save your changes, click Cancel.
9. If you want to save any changes made, click OK. A window will appear asking
if you want to save the changes you made. To return to the main program
window and save your changes, click Yes. To return to the main program
window without saving changes, click No. To return to the Cylinders Window,
click Cancel.
Connecting Instruments to the PC Controller Program
NOTE: Be sure to set up the display order for the SDM-2009s as described in
“Setting Up the SDM-2009 Display Order” on page 33, before
continuing.
Do the following to turn on the SDM-2009s and establish a connection with the
instruments in your system:
1. If necessary, verify that the SDM-2009(s) are arranged on the work surface as
desired, all plumbing is installed, and all hardware and cables are installed.
See “Hardware Setup” on page 12.
2. Launch the SDM-GX Docking Station PC Controller Software as described in
“Launching the SDM-GX Docking Station PC Controller Program” on page 23.
Connecting Instruments to the PC Controller Program • 38
Page 44

3. Install a GX-2009 in the instrument cradle.
NOTE: If the GX-2009 is left in the SDM-2009 after bump testing or calibration,
the pump will run for 12 seconds every 2 minutes in order to keep
hydrogen generated from charging of the NiMH batteries from affecting
the CO sensor.
4. Turn on each SDM-2009 by pressing and holding the SDM-2009’s POWER
button. When the control panel LEDs turn on, release the POWER button.
5. The BUMP and CAL LEDs will turn off and the COPY LED will be
steadily on or off. It will be on if the SDM-2009 was used in Standalone
Configuration and calibration and bump test records are still stored in the
SDM-2009’s memory (see the SDM-2009 Docking Station Standalone
Configuration Manual for more information). The CHARGE LED will be
blinking green if the SDM-2009 is operating properly or solid red if there is a
system failure.
6. When a connection has been established between the SDM-GX Docking
Station PC Controller Program and all of the SDM-2009s, the main program
window will appear as shown below.
Figure 26: SDM-2009 Connection
7. Press and hold the POWER MODE button on the instrument until you hear a
beep, then release it. The instrument will begin its power up sequence (see
39 • Connecting Instruments to the PC Controller Program
Page 45

exceptions below in step 8). If a successful connection between the instrument
50 12.0
TRANSMIT
CO ppm H2S ppm
CH4 %LEL OXY vol%
50 25.0
FAIL
C-LIMIT
CAL
C--LIMIT
and the SDM-2009 occurs, the home screen will appear on the instrument
display at the end of the startup sequence. The auto calibration values for all
installed sensors will be displayed.
NOTE: The screen shown above applies to a 4-channel GX-2009. If your GX-
2009 has less than 4 channels, the inactive channels will not appear in
the above screen or in any screens where channels are displayed. All
screens in this manual assume a 4-channel GX-2009.
8. There are two exceptions to the sequence described in step 7 above. See the
GX-2009 User Setup Program Operator’s Manual for a description of the Cal
Limit Display and Cal Limit Check instrument parameters.
• When Cal Limit Display is set to On and Cal. Limit Check is set to Can’t
Use, if the GX-2009 is due for calibration the instrument will show a
calibration expired failure screen and the buzzer and LED arrays will pulse
for a few seconds.
The instrument will then connect to the SDM-2009 and display the home
screen shown above in step 7. The CHARGE LED will begin to blink green.
• When Cal Limit Display is set to On and Cal. Limit Check is set to
Confirm to use, if the GX-2009 is due for calibration the unit will show the
following screen and beep and flash the LED arrays for a few seconds
indicating that calibration is due.
When the beeping and flashing stops, press and release the POWER
MODE button on the GX-2009 to continue. The unit will now connect to the
SDM-2009, the home screen shown in step 7 above will be displayed, and
the CHARGE LED will begin to blink green.
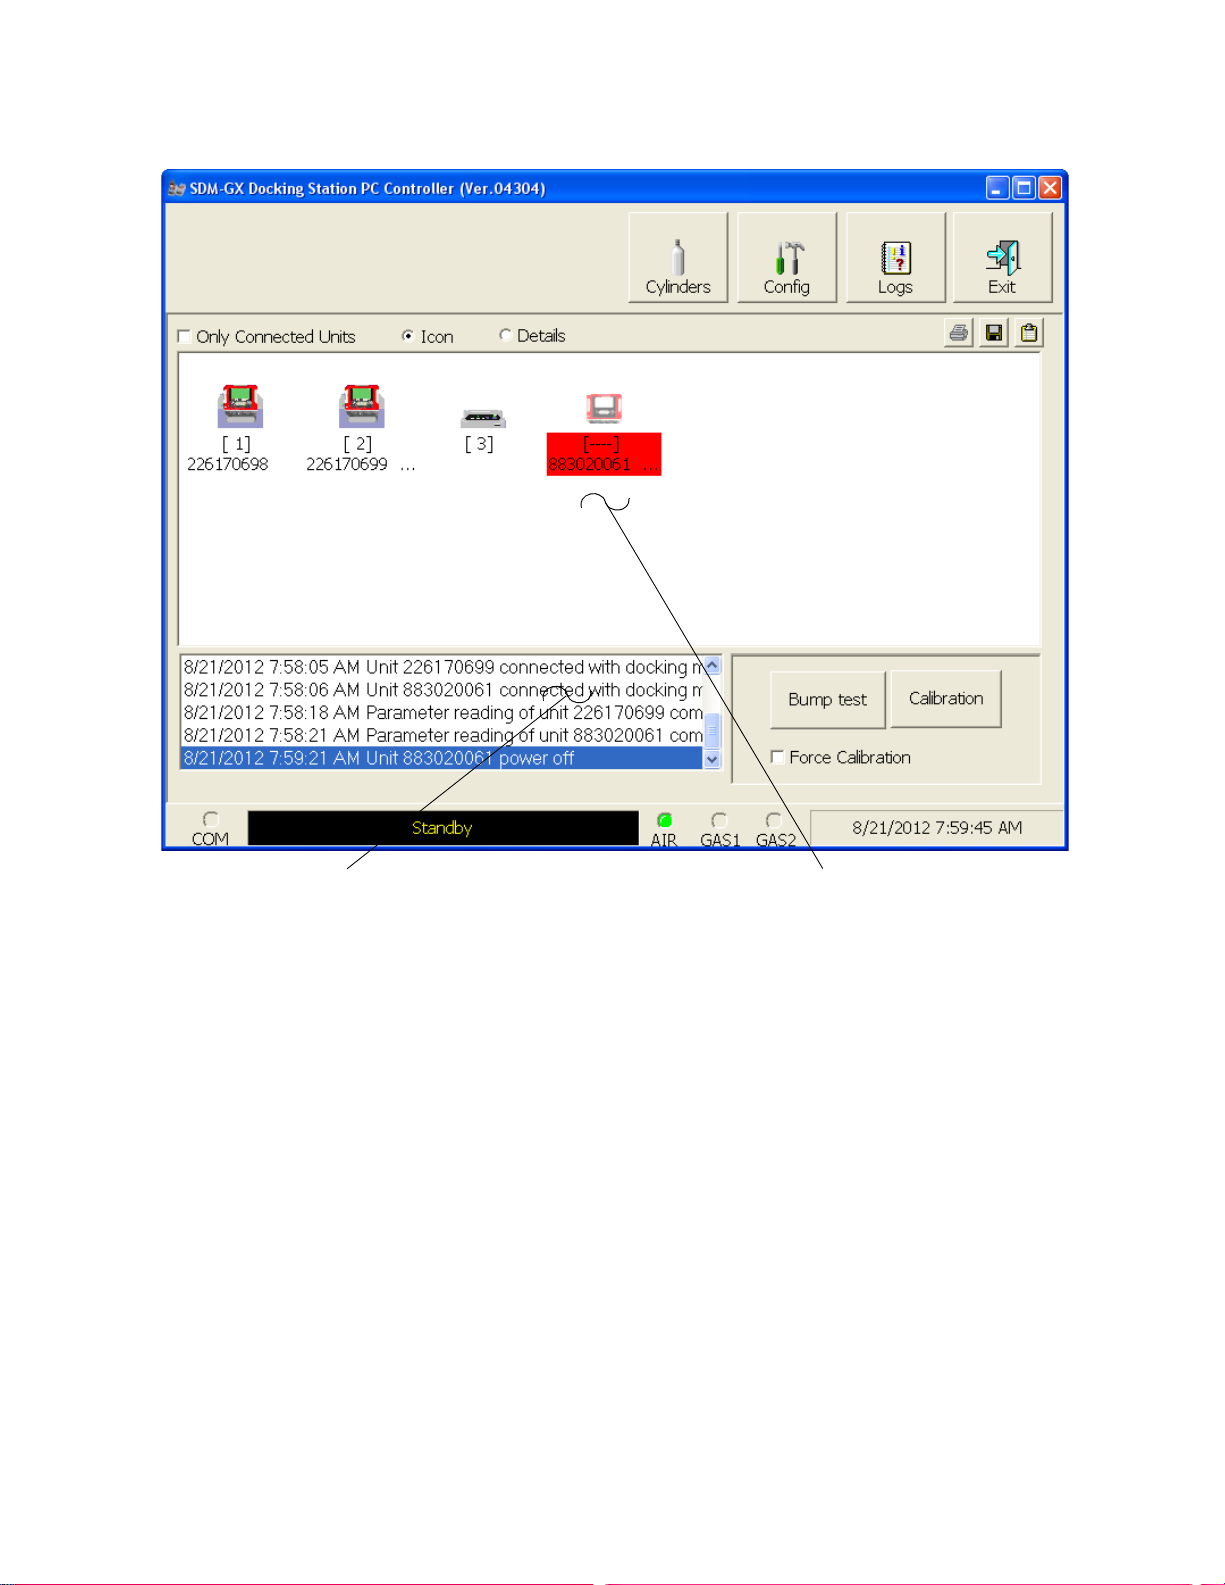
9. For each instrument, the SDM-GX Docking Station PC Controller Program will
indicate that an instrument was found and it will download the instrument’s
Connecting Instruments to the PC Controller Program • 40
Page 46

parameters. The BUMP and CAL LEDs will flash amber while the data is
being downloaded. Once the parameter download is complete, the BUMP
and CAL LEDs will be solid amber. When all instruments have been turned
on, connected, and downloaded, the main program window will appear as
shown below. When the instrument is connected to the PC Controller Program,
the date and time of the instrument are automatically updated to the current
date and time on the PC Controller Program’s screen.
NOTE: Turn each instrument on 10-15 seconds after the previous instrument
to minimize the possibility of the instrument not connecting to the PC
Controller Program. If an instrument does not connect, use the
instrument’s POWER MODE button to turn it off and turn it back on
again.
Figure 27: Instruments Connected and Downloaded
If an instrument is due for calibration, the docking station number and
instrument serial number will be highlighted in red.
If an instrument is due for calibration in the next 10 days, the docking station
and instrument serial number will be highlighted in orange.
If an instrument’s parameters could not be downloaded properly, a red triangle
will appear over the instrument and SDM-2009 picture.
41 • Connecting Instruments to the PC Controller Program
Page 47

Icon View vs. Details View
Instruments that are currently connected or have been previously connected can be
viewed in either Icon View or Details View. Choose Icon or Details View by clicking
the Icon or Details radio button below the control buttons. Icon View allows you to
view connected instruments and previously connected instruments in an icon
configuration. Connected instruments are shown as an instrument inserted in an
SDM-2009 icon. Previously connected instruments are shown as instrument icons.
Right clicking an instrument causes the Instrument Function Menu to appear.
Details View allows you to view connected instruments and previously connected
instruments in a table format. Scrolling to the right in Details View allows you to view
existing instrument parameters. For a description of these parameters and
instructions to change them, see “Edit Function” on page 99.
Figure 28: Main Program Window, Details View
Unless otherwise noted, all following figures that show the main program window in
this manual are shown in Icon View.
Connecting Instruments to the PC Controller Program • 42
Page 48

Printing and Exporting an Instrument List from the Main Program Window
You can print, save, or add to clipboard the instrument list in the main program
window. You can only print the list if it is viewed in Details format. The list cannot be
printed when viewed in Icon format.
To print the instrument list:
1. Ensure that the main program window is being viewed in Details format.
Figure 29: Main Program Window, Details View
The print icon will not be active if the main program window is viewed in Icon
format.
2. Click the Print icon located just below the Exit button.
3. A print confirmation screen will appear.
43 • Connecting Instruments to the PC Controller Program
Page 49

To print the instrument list, click OK.
To cancel the print job, click Cancel.
To save the instrument list as a .csv file:
1. Click the Save icon located just below the Exit button.
2. Choose a file path and enter a file name and click Save.
To save the instrument list to the clipboard:
1. Click the Clipboard button located just below the Exit button. The serial
number, model, station ID, user ID, next bump test date, next calibration date,
the calibration interval, and the data logging interval time for each instrument
in the main program window will be saved to the clipboard in a table format.
2. Open a spreadsheet program such as Excel or a word processing program
such as Word and paste the clipboard data into it.
Automatic Bump Testing and Calibration
The PC Controller Program will automatically perform a bump test or calibration on a
connected instrument if Auto Bump Test or Auto Calibration is selected in the
Configuration Window and if the bump test or calibration is due. The use of these
features allows the user to launch the PC Controller Program, turn on the
instrument(s) and walk away. No oversight of the bump test or calibration is needed.
For this reason, the calibration cylinder needs to already be in place before an
instrument is connected to the program.
NOTE: The Standard GAS or All GAS settings in the Configuration Window do
not affect the automatic testing of a GX-2009.
Automatic Bump Testing and Calibration • 44
Page 50

To automatically bump test or calibrate an instrument or instruments:
1. Be sure that Auto Bump Test or Auto Calibration are selected in the
Configuration Window. See “Setting Up the PC Controller Program” on
page 26 for instructions.
2. Verify that all of the bump test and/or calibration parameters are set correctly.
See “Setting Up the Configuration” on page 26 for instructions.
3. Verify that the appropriate calibration gas cylinder is connected to each
SDM-2009 or to the manifold line.
4. Establish a connection between the SDM-2009, instrument, and the PC
Controller program as described in “Connecting Instruments to the PC
Controller Program” on page 38.
5. The bump test or calibration will begin 1 minute after the last connected
instrument’s instrument information download is complete.
6. During an automatic bump test, if the bump test fails, a calibration is
immediately performed.
7. If Auto Bump Test and Auto Calibration are both selected, the calibration will
begin 1 minute after the bump test has finished.
Bump Testing a GX-2009
The following instructions illustrate a bump test on a 4-gas instrument. If your
instrument has less than 4 channels, the screens will look slightly different. A 3-gas or
4-gas cylinder, depending on your instrument configuration, must be used to fully
bump test the GX-2009 in the docking station.
The PC Controller Program is capable of performing a bump test both manually and
automatically when a GX-2009 is connected to it. When a bump test is performed, the
PC Controller Program performs an air adjust operation on a GX-2009 and then
applies calibration gas to the instrument. The program analyzes the response results
based on predefined criteria and determines if the GX-2009 passed the bump test.
The criteria that the PC Controller Program uses to determine if the GX-2009 passes
a bump test, whether the Bump Test button is active, and whether or not the PC
Controller Program automatically performs a bump test if it is due on a connected
GX-2009 is defined in the Parameter tab of the Configuration Window. See "Setting
Up the Configuration" step 10 on page 30 for a description of the bump test
configuration setup.
To manually bump test an instrument or instruments:
1. Establish a connection between the SDM-2009, GX-2009, and the PC
Controller program as described in “Connecting Instruments to the PC
Controller Program” on page 38.
2. Verify that all of the bump test parameters are set correctly. See “Setting Up
the Configuration” on page 26 for instructions.
3. Verify that an appropriate cylinder is connected to the GAS fitting of each
SDM-2009 or to the GAS manifold line.
45 • Bump Testing a GX-2009
Page 51

4. Select the instrument or instruments you wish to bump test and click on them
to highlight them as shown below. To select multiple instruments for bump
testing, hold down the Control button on the keyboard as you click them.
Figure 30: Instrument Selection
5. If you would like an automatic calibration to occur after a failed bump test,
select the Force Calibration selection box.
6. Click the Bump test button in the lower right corner of the main program
window.
Bump Testing a GX-2009 • 46
Page 52

7. You will be asked to confirm which GX-2009 channels will use GAS 1 for the
bump test. The gas concentration shown next to each channel is the auto
calibration value for that channel. If it does not match the gas concentration in
the cylinder, change the auto calibration value for that channel. See “Sensor
Tab” on page 107 for instructions. All channels in the instrument will be
selected. The selections are not user adjustable. If your instrument has fewer
than 4 channels, your screen will only display the active channels.
Figure 31: Gas Cylinder Confirmation Screen
Click OK. If you don’t want to proceed, click Cancel to abort the bump test.
47 • Bump Testing a GX-2009
Page 53

8. You will then be asked to confirm the auto calibration values and the
instruments that the calibration cylinder will be used for. Be sure the auto
calibration values match the values listed on the calibration cylinder. The serial
number and gas combination of all selected instruments will appear
sequentially beneath the gas cylinder concentration. All channels will be bump
tested using GAS 1.
Figure 32: Gas Order Confirmation Screen
9. Click OK. You will be asked if you want to bump test the instrument(s). Click
OK to proceed. If you don’t want to proceed with the bump test, click Cancel to
return to the main program window.
Bump Testing a GX-2009 • 48
Page 54

10. The pump(s) will start and the program will indicate that air is flowing. The AIR
indicator on the program screen will be on and air will be applied to the
instrument(s) for 15 seconds, then the PC Controller Program will perform a
zero adjustment on all the channels. The BUMP LED on the SDM-2009
control panel will be flashing amber.
If at any point during the bump test you wish to cancel the bump test, click the
Cancel button in the lower right corner of the screen. The bump test will be
aborted and the BUMP LED will turn solid amber.
Figure 33: Air Flowing
The PC Controller Program will analyze the zero adjustment results. If any
sensors failed the zero adjustment, the bump test will be aborted for that
instrument.
49 • Bump Testing a GX-2009
Page 55

11. After air is applied, and if all the channels passed the zero adjustment,
calibration gas will be applied. The GAS 1 indicator on the program screen will
come on and calibration gas will be applied to the instrument(s) for the
duration specified in the Gas Exposure Time parameter in the Configuration
Window.
Figure 34: Calibration Gas Flowing
The PC Controller Program will analyze the results. If the bump test on the
standard 4 sensors fails and Force Calibration is selected, a calibration will
automatically begin and calibration gas will continue to flow.
Bump Testing a GX-2009 • 50
Page 56

12. After calibration gas is applied, the docking station will purge with fresh air for 5
seconds.
Figure 35: Fresh Air Purge
51 • Bump Testing a GX-2009
Page 57

13. After the fresh air purge is complete,
• If the bump test passes, the following window will open indicating that. The
BUMP LED will be solid green. Click OK to return to the main program
window. The BUMP LED will turn off.
Figure 36: Bump Test Passed
The GX-2009 will automatically be shut off 20 seconds after a successful
bump test.
Bump Testing a GX-2009 • 52
Page 58

• If the bump test fails and the Force Calibration box was not selected, the
following window will open indicating which channels failed the bump test.
The BUMP LED on the SDM-2009 control panel will be solid red. Click
OK to return to the main program window or double click the instrument
information line to view the bump test results in the Logs window. The
BUMP LED on the SDM-2009 control panel will turn off.
Figure 37: Bump Test Failed
53 • Bump Testing a GX-2009
Page 59

• If the bump test fails and the Force Calibration box was selected, the
SDM-2009 automatically performs a calibration immediately after the failed
bump test. The results screen will indicate the results of both the bump test
and calibration. The BUMP LED on the SDM-2009 control panel will be
solid red. The CAL LED will be solid green if the calibration passed or
solid red if the calibration failed. Click OK to return to the main program
window or double click an instrument information line to view the bump test
or calibration results in the Logs window. The BUMP LED and CAL
LED on the SDM-2009 control panel will turn off.
Figure 38: Bump Test Failed/Calibration Failed
Bump Testing a GX-2009 • 54
Page 60

• If at any point during the bump test the flow rate to the instrument becomes
too low, the PC Controller Program will abort the bump test and display a
failed bump test screen. The BUMP LED on the SDM-2009 control
panel will be solid red. Click OK to return to the main program window or
double click an instrument information line to view the bump test or
calibration results in the Logs window. The BUMP LED on the SDM2009 control panel will turn off. Confirm all tubing connections are correct
and that all lines are clear.
Figure 39: Low Flow Bump Test Failure
14. For all bump test result outcomes, the instruments will be displayed in the main
program window in Details View. To return the main program window to Icons
View, click the Icons radio button.
15. All bump test results can be viewed in the Logs window. See “Bump Test Data”
on page 93 for instructions for viewing bump test data.
If the bump test function in the GX-2009 is turned off or if the GX-2009 does
not have the bump test capability, the bump test results will only be stored in
the Logs window of the PC Controller Program. If the bump test function is
turned on the in GX-2009, the bump test results will also be stored in the GX-
2009.
55 • Bump Testing a GX-2009
Page 61

Calibrating a GX-2009
The following instructions illustrate a calibration on a 4-gas instrument. If your
instrument has less than 4 channels, the screens will look slightly different. A 3-gas or
4-gas cylinder, depending on your instrument configuration, must be used to fully
calibrate the GX-2009 in the docking station.
The PC Controller Program is capable of performing a calibration both manually and
automatically on a GX-2009. When a calibration is performed, the PC Controller
Program performs an air adjust operation on a GX-2009 and then applies calibration
gas to the GX-2009. The PC Controller Program analyzes the calibration results and
determines if the GX-2009 passed the calibration.
To manually calibrate an instrument or instruments:
1. Establish a connection between the SDM-2009, GX-2009, and the PC
Controller program as described in “Connecting Instruments to the PC
Controller Program” on page 38.
2. Verify that all of the calibration parameters are set correctly. See “Setting Up
the Configuration” on page 26 for instructions.
3. Verify that an appropriate cylinder is connected to the GAS fitting of each
SDM-2009 or to the GAS manifold line.
Calibrating a GX-2009 • 56
Page 62

4. Select the instrument or instruments you wish to calibrate and click on them to
highlight them as shown below. To select more than one instrument for
calibration, hold down the Control button on the keyboard as you click them.
Figure 40: Instrument Selection
5. Click the Calibration button in the lower right corner of the main program
window.
57 • Calibrating a GX-2009
Page 63

6. You will be asked to confirm which GX-2009 channels will use GAS 1 for the
calibration. The gas concentration shown next to each channel is the auto
calibration value for that channel. If it does not match the gas concentration in
the cylinder, change the auto calibration value for that channel. See “Sensor
Tab” on page 107 for instructions. All channels in the instrument will be
selected. The selections are not user adjustable. If your instrument has fewer
than 4 channels, your screen will only display the active channels.
Figure 41: Gas Cylinder Confirmation Screen
Click OK. If you don’t want to proceed, click Cancel to abort the calibration.
Calibrating a GX-2009 • 58
Page 64

7. You will then be asked to confirm the auto calibration values and the
instruments that the calibration cylinder will be used for. Be sure the auto
calibration values match the values listed on the calibration cylinder. The serial
number and gas combination of all selected instruments will appear
sequentially beneath the gas cylinder concentration. All channels will be
calibrated using GAS 1.
Figure 42: Gas Order Confirmation Screen
8. Click OK. You will be asked if you want to calibrate the instrument(s). Click OK
to proceed. If you don’t want to proceed with the calibration, click Cancel to
return to the main program window.
59 • Calibrating a GX-2009
Page 65

9. The pump(s) will start and the program will indicate that air is flowing. The CAL
LED will begin to flash amber. Air will be applied to the instrument(s) for 15
seconds, then the PC Controller Program will perform a zero adjustment on all
the channels.
If at any point during the calibration you wish to cancel the calibration, click the
Cancel button in the lower right corner of the screen. The calibration will be
aborted and the CAL LED will turn solid amber.
Figure 43: Air Flowing
The PC Controller Program will analyze the zero adjustment results. If any
sensors failed the zero adjustment, the calibration will be aborted for that
instrument.
Calibrating a GX-2009 • 60
Page 66

10. After air is applied, and if all the channels passed the zero adjustment,
calibration gas will be applied. The GAS 1 indicator on the program screen will
come on. Calibration gas will be applied to the instrument(s) for 90 seconds.
Figure 44: Calibration Gas Flowing
The PC Controller Program will analyze the results.
61 • Calibrating a GX-2009
Page 67

11. After calibration gas is applied, the docking station will purge with fresh air for 5
seconds.
Figure 45: Fresh Air Purge
Calibrating a GX-2009 • 62
Page 68

12. After the fresh air purge is complete,
• If the calibration passes, the following window will open indicating that. The
CAL LED on the SDM-2009 control panel will be solid green. Click OK to
return to the main program window. The CAL LED will turn off.
Figure 46: Calibration Passed
The GX-2009 will automatically be shut off 20 seconds after a successful
calibration.
63 • Calibrating a GX-2009
Page 69

• If the calibration fails, the following window will open indicating which
channels failed to calibrate. The CAL LED on the SDM-2009 control
panel will be solid red. Click OK to return to the main program window or
double click the instrument information line to view the calibration results in
the Logs window. The CAL LED on the SDM-2009 control panel will turn
off.
Figure 47: Calibration Failed
Calibrating a GX-2009 • 64
Page 70

• If at any point during the calibration the flow rate to the instrument becomes
too low, the PC Controller will abort the calibration and display a failed
calibration screen. The CAL LED on the SDM-2009 control panel will be
solid red. Click OK to return to the main program window or double click the
instrument information line to view the calibration results in the Logs
window. The CAL LED on the SDM-2009 control panel will turn off.
Confirm all tubing connections are correct and that all lines are clear.
Figure 48: Low Flow Calibration Failure
13. For both calibration result outcomes, the instrument(s) will be displayed in the
main program window in Details View. To return to Icons View, click the Icons
radio button.
14. When a calibration is performed, any bump test or calibration data that is being
stored in the instrument will be downloaded to the PC Controller Program. This
data can be viewed in the Logs window along with the results of the calibration
just performed. See “Bump Test Data” on page 93 or “Calibration Data” on
page 78 for instructions for viewing bump test or calibration data.
The calibration results will also be stored in the GX-2009.
65 • Calibrating a GX-2009
Page 71

Troubleshooting
NOTE: This troubleshooting guide describes SDM-2009 problems only. See
the GX-2009 Operator’s Manual for problems you may encounter with
the GX-2009.
Table 4: Troubleshooting the SDM-2009
Symptoms Probable Causes Recommended Action
•Fresh air
adjustment fails
• Calibration fails • The auto calibration
• The SDM-2009 is not in a
fresh air environment or
the cylinder being used is
not a zero air cylinder.
• If a zero air cylinder is
used, the calibration
cylinder is out of gas.
• If a zero air cylinder is
used, the tubing from the
regulator to the AIR fitting
is not connected.
values do not match the
cylinder gas
concentrations.
• The calibration cylinder is
out of gas or is outdated.
• The calibration cylinder is
not connected to the GAS
fitting.
• The GX-2009 is not
properly inserted in the
instrument cradle.
• The tubing from the
regulator to the GAS fitting
or manifold is not
connected.
1. Confirm that the SDM-2009 is in
a fresh air environment or that a
zero air cylinder is attached to
the AIR fitting.
2. If a zero air cylinder is used,
verify that it contains an
adequate supply of test sample.
3. If a zero air cylinder is used,
check all calibration tubing for
leaks or for any bad connections.
4. If the fail condition continues,
replace the sensor(s) in the
instrument.
5. If the difficulties continue, contact
RKI Instruments, Inc. for further
instruction.
1. Confirm that the auto calibration
values match the concentrations
listed on the gas cylinder.
2. Verify that the calibration cylinder
contains an adequate supply of
fresh test sample.
3. Verify that the calibration cylinder
is connected to the GAS fitting.
4. Check to make sure the GX-2009
is properly inserted in the
instrument cradle.
5. Check all calibration tubing for
leaks or for any bad connections.
6. If the fail condition continues,
replace the sensor(s) in the
instrument.
7. If the difficulties continue, contact
RKI Instruments, Inc. for further
instruction.
Troubleshooting • 66
Page 72

• No connection
between
instrument and PC
Controller
Program
• The batteries in
the instrument are
not charging
• SDM-2009 is not turned
on.
• The instrument is not
correctly inserted into the
instrument cradle.
• The IR window is dirty.
• The USB cable is not
properly plugged into the
SDM-2009 or the PC.
• The instrument is not
properly inserted in the
instrument cradle.
• The charger is
malfunctioning.
• The batteries are faulty.
1. Turn on the SDM-2009. If it does
not turn on, check that the AC
adapter is plugged into an AC
socket and to the jack on the
back of the SDM-2009.
2. Check to make sure the
instrument is inserted properly.
3. Clean the IR window on the
SDM-2009 and the GX-2009.
4. Check to make sure the USB
cable is plugged into the back of
the SDM-2009 and to a USB port
on your PC.
5. If the difficulties continue, contact
RKI Instruments, Inc. for further
instruction.
1. Be sure that the instrument is
fully inserted in the instrument
cradle.
2. Try to charge the batteries in a
BC-2009 charger if one is
available to determine if the
SDM-2009 is at fault.
3. Try to charge the batteries using
a different SDM-2009 if one is
available to determine if the
SDM-2009 is at fault.
4. Replace the batteries and
attempt to charge them. See the
GX-2009 Operator’s Manual for
instructions to change the
batteries.
5. If the difficulties continue, contact
RKI Instruments, Inc. for further
instruction.
Charging an Instrument in an SDM-2009
The SDM-2009 can be used to charge the rechargeable batteries in a GX-2009. To
maximize the instrument’s run time and the battery life, make sure the batteries’
charge is as low as possible before recharging them. You can use the GX-2009’s
REFRESH function to discharge the batteries. See the GX-2009 Operator’s Manual
for a complete description of the REFRESH button.
Recharging the Batteries After Performing a Bump Test or Calibration
To recharge the batteries after performing a bump test or calibration:
1. Perform a bump test or calibration on an instrument as described in “Bump
67 • Charging an Instrument in an SDM-2009
Page 73

Testing a GX-2009” on page 45, “Calibrating a GX-2009” on page 56.
2. After the bump test or calibration has been completed, turn off the
instrument(s) by selecting the instrument(s), right clicking on them, and
selecting Power Off. The docking station will automatically turn off the
instrument(s) 20 seconds after a successful bump test or calibration or if there
is no activity for the time period defined by Auto Power OFF Time in the
Configuration Window.
3. While the instrument is on, the CHARGE LED will be blinking green. When the
instrument is turned off, the CHARGE LED will blink amber. The BUMP and/
or CAL LED will continue to be either green or red depending on the result
of the previous bump test or calibration. If the bump test or calibration was
cancelled, the BUMP or CAL LED will be solid amber.
NOTE: The SDM-2009 does not start charging the batteries until the
instrument is off. While the instrument is on, the CHARGE LED will
blink green. Once the instrument is shut off, the CHARGE LED will
begin to blink amber.
4. If the batteries are fully charged, then the CHARGE LED will turn solid green in
a few minutes.
If the batteries are drained enough for the docking station to charge them, the
CHARGE LED will continue to blink amber while charging is taking place. The
SDM-2009 will take approximately 3 hours to charge fully discharged batteries.
If the charging process encounters a fail condition, the CHARGE LED will turn
steadily red.
NOTE: If the GX-2009 is left in the SDM-2009 after bump testing or calibration,
the pump will run for 12 seconds every 2 minutes in order to keep
hydrogen generated from charging of the NiMH batteries from affecting
the CO sensor.
5. When the charge is complete, the CHARGE status LED will turn solid green.
Recharging the Batteries Without Performing Any Operations
To recharge the batteries in an instrument without performing any other operations:
1. Confirm that the AC adapter is connected to the back panel of the SDM-2009
and to an AC wall socket.
2. Insert the instrument into the instrument cradle.
3. Press and hold the SDM-2009’s POWER button. The LEDs will turn amber.
4. When the BUMP and CAL LEDs turn off, release the POWER button.
5. The CHARGE LED will be blinking amber.
Charging an Instrument in an SDM-2009 • 68
Page 74

6. If the batteries are fully charged, then the blinking amber LED will turn solid
04.59
CHARGING
green in a few minutes.
If the batteries are drained enough for the SDM-2009 to charge them, the
CHARGE LED will continue to blink amber while charging is taking place. The
SDM-2009 will take approximately 3 hours to charge a fully discharged GX-
2009.
If the charging process encounters a fail condition, the CHARGE LED will turn
steadily red.
7. When the charge is complete, the CHARGE status LED will turn solid green.
Batteries Too Drained for PC Controlled Operation
If the NiMH batteries do not have enough power to keep the instrument on, it will go
into a 5 minute charge cycle and the following screen will be displayed on the
instrument screen.
It will not connect to the docking station. The instrument cannot be bump tested or
calibrated in the charge cycle. Once the 5 minute charge cycle has ended, the unit
will automatically turn back on and connect to the docking station. The unit can now
be bump tested or calibrated.
Logs Window
The Logs Window contains saved data from instruments in addition to records of
bump tests and calibrations performed with the PC Controller Program. If you perform
a complete download by right clicking a selected instrument and clicking Download,
the Logs Window will contain alarm trend data, calibration data, event data, interval
trend data, memo data, and bump test data. If you do not perform a complete
download or select Down Load Data Logger in the Configuration Window, the Logs
Window will only have memo files and files for any bump tests or calibrations
completed while the instrument was connected to the PC Controller Program.
The Logs Window is divided into four frames. The upper left frame is the Data Frame
and displays all the data folders. If no data has been saved, then no folders will
appear in the Data Frame.
The upper right frame shows the contents of a data folder that is selected in the Data
Frame. The lower right frame shows the summary information for a data file that is
selected in the upper right frame.
69 • Logs Window
Page 75

The lower left frame contains three selection boxes for organizing data. When
viewing the data, it can be organized in two ways:
1. Base View Format
If you do not select Serial No, Station ID, or User ID, the Base view box
appears next to the selection boxes. The data can be organized by either data
type or by the year and month of the saved data.
Figure 49: Logs Window in Base View Format, Date
To view data in the Date Base View Format:
a. Select Date in the Base view box.
b. Click the expanded view symbol (+) next to a date folder in the Data
frame of the Logs window or double click the folder to view the
contents below it.
c. Single click on the data type folder (Alarm, Calibration, etc.). All of
the files in that data type folder will appear in the upper right frame of
the Logs window.
d. If an item is expanded and you want to close it, click the (-) symbol
next to the item or double click it.
Logs Window • 70
Page 76

Figure 50: Logs Window in Base View Format, Type
To view data in the Type Base View Format:
a. Select Type in the Base view box.
b. Click the expanded view symbol (+) next to a data type folder
(Alarm, Calibration, etc.) in the Data frame of the Logs window or
double click the folder to view the contents below it.
c. Single click on a date folder. The dates are displayed in year/month
format. All of the files in that date folder will appear in the upper right
frame of the Logs window.
d. If an item is expanded and you want to close it, click the (-) symbol
next to the item or double click it.
2. ID View Format
The data may be organized by one or more of the following parameters:
• Serial Number
• Station ID
•User ID
71 • Logs Window
Page 77

If any of these boxes are selected, the Base view box disappears. Click the
selection box or boxes in the lower left frame to organize the data as desired.
Figure 51: Logs Window in ID View Format
To view data in the ID View Format:
a. Select one or more of the ID view choices, Serial No., Station ID, or
User ID.
b. Click the expanded view symbol (+) next to an ID folder (Serial No.,
Station ID, or User ID) in the Data frame of the Logs window or
double click the folder to view the contents below it.
c. Click the expanded view symbol (+) next to the data type folder
(Alarm, Calibration, etc.) you wish to view or double click the folder
to view the contents below it.
d. Single click on a date folder. The dates are displayed in year/month
format. All of the files in that date folder will appear in the upper right
frame of the Logs window.
e. If an item is expanded and you want to close it, click the (-) symbol
next to the item or double click it.
When viewing data by Serial No., no two instruments should have the same
serial number. However, if two instruments do have the same serial number
Logs Window • 72
Page 78

and have data for the same year/month, they will be distinguished by their
different Station ID or User ID. When viewing data by Station ID or by User ID,
if two instruments have the same Station ID and/or User ID and have data for
the same year/month, they will be distinguished by their different serial
numbers.
NOTE: In the examples that follow, the data will be shown organized by serial
number. If you do not select any of the organization boxes or select the
Station ID or User ID boxes instead of or in addition to the Serial No.
box, your Logs Window will look slightly different.
Alarm Trend Data
The instrument saves files that describe the most recent gas alarm events. If a gas
alarm event occurs, then an alarm trend file that is centered around the event is
saved. It shows the readings up to 30 minutes before and 30 minutes after the event,
with the log interval time every 5 seconds. The readings that are saved are the peak
(minimum for oxygen) readings for the previous 5 seconds. If the instrument has not
been on for 30 minutes before the alarm event occurs, the data during this time is left
blank. If the instrument is turned off less than 30 minutes after an alarm event occurs,
the data file will only have logged data until the unit was turned off.
The instrument saves up to 8 alarm trend files. When an alarm event triggers an
alarm trend file to be saved, subsequent alarm events must occur 15 minutes after
the previous triggering event in order to trigger the saving of another alarm trend file.
If 8 alarm trend files are already saved in the instrument’s memory, the oldest alarm
trend file is overwritten when a new alarm trend file is saved.
Alarm trend data is downloaded from an instrument when a complete download is
performed. To view and perform desired operations with the alarm trend files:
1. While in the Logs window, find your instrument by serial number, then click the
expanded view symbol (+) of or double-click the serial number folder to view
the contents.
2. Click the expanded view symbol (+) of or double-click the Alarm folder to view
the contents. Alarm trend data folders are arranged by year/month.
73 • Logs Window
Page 79

3. Click the year/month folder you wish to view. All alarm trend data files for that
instrument in that particular year/month will appear in the upper right frame.
The file number, serial number, station ID, user ID, model, date/time, and
sample count of the alarm trend file appear in the same line.
Figure 52: Viewing Alarm Trend Files
Logs Window • 74
Page 80

4. Click a file to see the instrument information, gas readings at the time of the
event, and the alarm setpoints in the lower right frame.
Figure 53: Alarm Trend Data
75 • Logs Window
Page 81

5. To view the alarm trend data, double click the desired file.
Restore Previous
Layout Control Buttons
6. In the table part of the screen,
Figure 54: Alarm Trend Data
Each data point will be displayed in the left half of the screen along with the
peak readings (minimum for oxygen) over the previous 5 seconds. A graph of
the data will appear on the right half of the screen.
To change the layout of the table and chart in relation to each other, click any
of the four layout control buttons in the upper left corner of the screen.
To change the proportions of the table to the graph, click the divider between
the two and move it.
To display instrument information along with the data table and graph, click the
“i” control button in the upper left corner.
• The gas readings at the time of the alarm event around which the logged
data is centered are highlighted in red and are the instantaneous readings
at that time.
Logs Window • 76
Page 82

7. In the graph part of the screen,
• You can choose which gas(es) you want to graph by selecting or
deselecting the boxes next to each gas name.
• To zoom in on a particular part of the graph, drag a box around that area so
that it is highlighted in gray. The graph will zoom in. To return to a previous
zoom, click the Previous control button in the upper right corner of the
graph section. To return to the original zoom, click the Restore control
button in the upper right corner of the graph section.
• A vertical red line appears on the graph at the point that created the alarm
trend file. Clicking anywhere on the graph will move that red line and
highlight that data point in the table. Clicking a data point in the table will
move the red line in the graph to that data point.
8. To print the data, select either List or Graph in the upper right corner of the
window and then click the Print control button in the upper right corner of the
window. The Print control button has a printer icon on it. A dialog box will
appear confirming if you want to print. Click OK. If Graph is selected, the data
will print as a graph. If List is selected, the data will print as a table.
9. To save the data to a file which can be imported into another program, select
either List or Graph in the upper right corner of the window and then click the
Save to File control button. The Save to File control button has a floppy disk
icon on it. A dialog box will appear for you to specify the file name, file location,
and file type.
77 • Logs Window
Figure 55: Save As Dialog Box
Page 83

If List is selected, the file type is “.csv” (comma-separated values). If Graph is
selected, the file type is “.bmp” (Windows bitmap). After specifying the file
name and file location, click Save to save the file to the specified location.
10. To save the data to the clipboard, select either List or Graph in the upper right
corner of the window and then click the Copy to Clipboard control button. The
Copy to Clipboard control button has a clipboard icon on it. The table or
graph will be saved to the clipboard. It can then be pasted into a document by
using the Paste command in an application.
11. To go back and view other data, click Close to return to the Logs window.
Calibration Data
The instrument is capable of saving calibration information for up to the 100 most
recent calibrations and bump tests combined. When the maximum number of
calibration files is reached, the oldest calibration file is overwritten when a new one is
saved. When an instrument is connected to the PC Controller Program and a
complete download occurs, the calibration files are retrieved and stored by the
program. In addition, all calibrations performed by the PC Controller Program are
stored by the program. To view and perform desired operations with the calibration
files:
1. While in the Logs window, find your instrument by serial number, then click the
expanded view symbol (+) of or double-click the serial number folder to view
the contents.
2. Click the expanded view symbol (+) of or double-click the Calibration folder to
view the contents. Calibration data folders are arranged by year/month.
Logs Window • 78
Page 84

3. Click the year/month folder you wish to view. All calibration data files for that
instrument in that particular year/month will appear in the upper right frame.
The file number, serial number, station ID, user ID, model, date/time, and
result of the calibration appear in the same line. If calibrations were performed
prior to connecting the instrument with the SDM-GX Docking Station PC
Controller software, data for those calibrations will not appear until a complete
download is performed.
79 • Logs Window
Figure 56: Viewing Calibration Log Files
Page 85

4. Click one of the calibration data files. The fields in the bottom right frame will fill
in. The instrument information will be displayed along with the calibration
information. The tested sensors will be displayed along with the final gas
concentration, the calibration gas values, and the result of the calibration. A
Certificate button will also appear along the right side of the screen. This
button is only active if the selected calibration passed.
Figure 57: Viewing Calibration Data
5. Files that record a failed calibration on all channels are highlighted in red. Files
that record a calibration where not all channels passed are highlighted in
orange.
6. To print the calibration data (everything in the lower right frame of the screen),
click the Print control button located just above the calibration judge column. A
dialog box will appear confirming if you want to print. Click OK.
7. To print the basic calibration results from a date folder (everything in the upper
right frame), be sure that the desired date folder is selected and click the Print
control button in the upper left corner of the Logs window. A dialog box will
appear confirming if you want to print. Click OK.
8. To print detailed calibration data for each calibration file in a date folder, be
sure that the desired date folder is selected and click the Bump Test &
Calibration Report control button along the top of the Logs window. A dialog
box will appear confirming if you want to print. Click OK.
Logs Window • 80
Page 86

9. To print detailed calibration and bump test data (if available) for each
calibration and bump test file for a specific serial number, be sure that the
desired serial number is selected in the upper left frame and click the Bump
Test & Calibration Report control button along the top of the Logs window. A
dialog box will appear confirming if you want to print. Click OK.
10. To save calibration data from a specific date folder, be sure the desired date
folder is highlighted and click the Save control button in the upper left corner of
the Logs window. A “Save As” dialog box will appear for you to specify the file
name and file location.
Figure 58: Save As Dialog Box
The file type will be “.csv” (comma separated value).
Specify the file name and location and click Save.
11. To copy calibration data in a date folder to the clipboard, be sure the desired
date folder is selected and click the Save to Clipboard control button. The
data will be saved to the clipboard. It can then be pasted into a document by
using the Paste command in an application.
81 • Logs Window
Page 87

12. To view or print a calibration certificate for a passed calibration, click the
Certificate button along the right side of the window. The calibration certificate
will appear.
Figure 59: Calibration Certificate
The calibration date, instrument information, and calibration gas concentration
information will be displayed. Laboratory name, laboratory address, standard
or regulation used, traceability, environmental conditions, observations, and
executor fields are all available for user-entered information. If you would like
to enter information into any of these fields, click in the field, and type in the
desired information.
Use the English and Portuguese selection dots in the Language section at
the top of the screen to choose the language you want the information
displayed in.
Use the Left and Center selection dots in the Align section at the top of the
Logs Window • 82
Page 88

certificate to change the alignment of the information that’s manually typed in.
To print a certificate, enter the desired information and click the Print button in
the top right corner of the screen. Printing the certificate saves any information
that was added to the open fields.
Event Data
The instrument saves the 100 most recent alarm events and the 100 most recent
trouble events. When an instrument is connected to the PC Controller Program and a
complete download is performed, the alarm and trouble event files are retrieved and
saved in the program.
Alarm event files save the time, instrument channel, gas, and alarm type of every gas
alarm event that occurs on a particular instrument. Warning (low alarm), Alarm (high
alarm), STEL, TWA, and overscale events are saved.
Trouble event files note the time, instrument channel, whether the event is an
instrument system failure or sensor failure, and the specific type of failure. Calibration
failures, dead battery alarms, and sensor failures are among the trouble events that
are saved.
Even though two types of files are saved, the PC Controller Program does not
distinguish between the two and shows them together and with the same lightning
bolt symbol. To view and perform desired operations with the event files:
1. While in the Logs window, find your instrument by serial number, then click the
expanded view symbol (+) of or double-click the serial number folder to view
the contents.
2. Click the expanded view symbol (+) of or double-click the Event folder to view
the contents. Event data folders are arranged by year/month.
83 • Logs Window
Page 89

3. Click the year/month folder you wish to view. All event data files for that
instrument in that particular year/month will appear in the upper right frame.
The file number, serial number, station ID, user ID, model, date/time, channel
number, sensor, and event type appear in the same line.
Figure 60: Viewing Event Data
4. To print event data from a date folder, be sure the desired date folder is
selected and click the Print control button in the upper left corner of the Logs
window. A dialog box will appear confirming if you want to print. Click OK.
Logs Window • 84
Page 90

5. To save event data from a date folder, be sure the desired date folder is
selected and click the Save control button in the upper left corner of the Logs
window. A “Save As” dialog box will appear for you to specify the file name and
file location.
Figure 61: Save As Dialog Box
The file type will be a “.csv” (comma separated value).
Specify the file name and location and click Save.
6. To copy event data from a date folder to the clipboard, be sure the desired date
folder is selected and click the Save to Clipboard control button. The data will
be saved to the clipboard. It can then be pasted into a document by using the
Paste command in an application.
Interval Trend Data
Average gas concentrations over the user defined interval trend time are logged in
the interval trend data files. The interval trend time is set using either the Data Log
Interval menu item in the Edit Function Screen, the GX-2009 Data Logger
Management Program, or the GX-2009 User Setup Program. See “Edit Function” on
page 99, the GX-2009 Data Logger Management Program Operator’s Manual, or the
GX-2009 User Setup Program Operator’s Manual for instructions to set the interval
trend time. Events such as gas alarms or sensor failures are saved in the interval
trend data file when they occur.
An interval trend data file is created and saved in the instrument when the instrument
is turned off. The serial number, user ID, and station ID that are entered in the
instrument when it is turned on are saved for the corresponding interval trend file. If
the instrument’s serial number, user ID, or station ID are changed using the GX-2009
85 • Logs Window
Page 91

User Setup Program, any interval trend files that result from subsequent operating
sessions will have the new serial number, user ID, or station ID saved in them.
The data may be viewed in both table format and graph format if at least 5 scheduled
data points have been logged at the programmed interval trend time. This does not
include events. If an interval data file has fewer than five scheduled data points, the
graph controls are not functional and the data is shown only in table format.
Interval trend data will not appear unless a complete download is performed. To view
and perform desired operations with the interval trend files:
1. While in the Logs window, find your instrument by serial number, then click the
expanded view symbol (+) of or double-click the serial number folder to view
the contents.
2. Click the expanded view symbol (+) of or double-click the Interval folder to
view the contents. Interval data folders are arranged by year/month.
3. Click the year/month folder you wish to view. All interval trend data files for that
instrument in that particular year/month will appear in the upper right frame.
The file number, serial number, station ID, user ID, model, date/time, and
sample count of the interval trend appear in the same line.
Figure 62: Viewing Interval Trend Files
Logs Window • 86
Page 92

4. Click one of the interval trend data files. The fields in the bottom right frame will
fill in. The instrument information will be displayed along with the average,
minimum, and maximum gas readings for the operating session. Also
displayed are the minimum date, the maximum date, and the warning, alarm,
STEL, and TWA setpoints.
Figure 63: Interval Trend Data
87 • Logs Window
Page 93

5. To view the interval trend data, double click the desired file.
Layout Control Buttons Restore Previous
Figure 64: Interval Trend Data
In table format on the left half of the screen, the interval trend data is shown as
the average gas readings over the user defined interval trend time. So if the
data logging session started at 4:13:38 PM and the interval time is set to 1
minute, then the readings logged at 4:14:38 PM are the average reading for
each channel over that one minute period. If a channel went into Warning or
Alarm, it will be indicated. A graph of the data will appear on the right half of
the screen.
Events are displayed on the screen under the channel in which they occur and
with the time of the event. Events are displayed whether they occurred at
scheduled log times or in between them. Events include gas alarms such as a
warning condition, trouble conditions such as a sensor failure, and an
indication that the unit is returning to “normal” condition after an alarm has
been reset using the POWER MODE button on the instrument.
To change the layout of the table and chart, click any of the four layout control
buttons in the upper left corner of the screen.
Logs Window • 88
Page 94

To change the proportions of the table to the graph, click the divider between
the two and move it.
To display instrument information along with the data and graph, click the “i”
control button in the upper left corner.
6. In the table part of the screen,
• To view only events in the interval trend data file, click the Only Event
selection box.
7. In the graph part of the screen,
• You can choose which gas(es) you want to graph by selecting or
deselecting the boxes next to each gas name.
• Click the Event box to show event data on the graph. Small indications will
appear at the top of the graph to show when an event occurred.
• To zoom in on a particular part of the graph, drag a box around that area so
that it is highlighted in gray. The graph will zoom in. To return to a previous
zoom, click the Previous control button in the upper right corner of the
graph section. To return to the original zoom, click the Restore control
button in the upper right corner of the graph section.
• Clicking anywhere on the graph will cause a vertical red line to appear and
the corresponding data point will be highlighted in the table. Clicking a data
point in the table will move the red line in the graph to that data point.
8. To print the data, select either List or Graph in the upper right corner of the
window and then click the Print control button in the upper right corner of the
window. The Print control button has a printer icon on it. A dialog box will
appear confirming if you want to print. Click OK. If Graph is selected, the data
will print as a graph. If List is selected, the data will print as a table.
89 • Logs Window
Page 95

9. To save the data to a file which can be imported into another program, select
either List or Graph in the upper right corner of the window and then click the
Save to File control button. The Save to File control button has a floppy disk
icon on it. A dialog box will appear for you to specify the file name, file location,
and file type.
Figure 65: Save As Dialog Box
If List is selected, the file type is “.csv” (comma-separated values). If Graph is
selected, the file type is “.bmp” (Windows bitmap). After specifying the file
name and file location, click Save to save the file to the specified location.
10. To save the data to the clipboard, select either List or Graph in the upper right
corner of the window and then click the Copy to Clipboard control button. The
Copy to Clipboard control button has a clipboard icon on it. The table or
graph will be saved to the clipboard. It can then be pasted into a document by
using the Paste command in an application.
11. To go back and view other data, click Close to return to the Logs window.
Memo Data
Any information entered into the Memo field in the Edit window is saved in a file in the
Logs window. If there is text in the Memo field, a new file is created every time an
instrument is connected to the PC Controller Program. If a change is made to the
Memo, the change is saved in the Memo file for that operating session. See
“Parameter Tab” on page 100 for instructions to use the Memo field. To view and
perform desired operations with the memo files:
1. While in the Logs window, find your instrument by serial number, then click the
Logs Window • 90
Page 96

expanded view symbol (+) of or double-click the serial number folder to view
the contents.
2. Click the expanded view symbol (+) of or double-click the Memo folder to view
the contents. Memo data folders are arranged by year/month.
3. Click the year/month folder you wish to view. All memo files for that instrument
in that particular year/month will appear in the upper right frame. The file
number, serial number, station ID, user ID, model, date/time, and the first few
words of the memo appear in the same line.
91 • Logs Window
Figure 66: Viewing Memo Files
Page 97

4. Click on one of the memo files. The fields in the bottom right screen will fill in.
The instrument information will be displayed along with the memo information.
Figure 67: Viewing Memo File Data
5. To print memo data, click the Print control button in the upper left corner of the
Logs window. A dialog box will appear confirming if you want to print. Click OK.
Logs Window • 92
Page 98

6. To save memo data, click the Save control button in the upper left corner of the
Logs window. A “Save As” dialog box will appear for you to specify the file
name and file location.
Figure 68: Save As Dialog Box
The file type will be “.csv” (comma separated value).
Specify the file name and location and click Save.
7. To copy memo data to the clipboard, click the Save to Clipboard control
button. The data will be saved to the clipboard. It can then be pasted into a
document by using the Paste command in an application.
Bump Test Data
The instrument is capable of saving bump test information for up to the 100 most
recent calibrations and bump tests combined. When an instrument is connected to
the PC Controller Program and a complete download occurs, the bump test files are
retrieved and stored by the program. In addition, all bump tests performed by the PC
Controller Program are stored by the program. To view and perform desired
operations with the bump test files:
1. While in the Logs window, find your instrument by serial number, then click the
expanded view symbol (+) of or double-click the serial number folder to view
the contents.
2. Click the expanded view symbol (+) of or double-click the Bump Test folder to
view the contents. Bump test data folders are arranged by year/month.
93 • Logs Window
Page 99

3. Click the year/month folder you wish to view. All bump test data files for that
instrument in that particular year/month will appear in the upper right frame.
The file number, serial number, station ID, user ID, model, date/time of the
bump test, and the results appear in the same line.
Figure 69: Viewing Bump Test Log Files
Logs Window • 94
Page 100

4. Click on one of the bump test data files. The fields in the bottom right frame will
fill in. The instrument information will be displayed along with the bump test
information. The tested sensors will be displayed along with the bump test gas
reading, the bump test gas values, and the result of the bump test.
Figure 70: Viewing Bump Test Data
5. Files that record a failed bump test on all channels are highlighted in red. Files
that record a bump test where not all channels passed are highlighted in
orange.
6. To print the bump test data (everything in the lower right frame of the screen),
click the Print control button located just above the bump test judge column. A
dialog box will appear confirming if you want to print. Click OK.
7. To print the basic bump test results from a date folder (everything in the upper
right frame), be sure that the desired date folder is selected and click the Print
control button in the upper left corner of the Logs window. A dialog box will
appear confirming if you want to print. Click OK.
8. To print detailed bump test data for each bump test file in a date folder, be sure
that the desired date folder is selected and click the Bump Test & Calibration
Report control button along the top of the Logs window. A dialog box will
appear confirming if you want to print. Click OK.
9. To print detailed calibration (if available) and bump test data for each
95 • Logs Window
 Loading...