

Page 1

SC-01 Data Logger
Management Program
Operator’s Manual
Part Number: 71-0138RK
Revision: P1
Released: 9/12/07
www.rkiinstruments.com
Page 2

Warranty
RKI Instruments, Inc., warrant s gas alarm equipment sold by us
to be free from defects in materials and workmanship, and
performance for a period of one year fr om date of shipment from
RKI Instruments, Inc. Any parts found defective within that
period will be repaired or repla ced, at our op tion , free of charge.
This warranty does not apply to those items which by their
nature are subject to deterioration or consumption in normal
service, and which must be cleaned, repaired, or replaced on a
routine basis. Examples of such items are:
Absorbent cartridges Batteries
Pump diaphragms and
Filter elements
valves
Fuses
Warrant y is voi ded by abuse including mechanical damage,
alteration, rough handling, or repairs procedures not in
accordance with the instruction manual. This warranty indicates
the full extent of our liability, and we are not responsible for
removal or replacement costs, local repair costs, transportation
costs, or contingent expenses incurred without our prior
approval.
HIS WARRANTY IS EXPRESSLY IN LIEU OF ANY AND ALL OTHER
T
WARRANTIES AND REPRESENTATIONS, EXPRESSED OR IMPLIED, AND
ALL OTHER OBLIGATIONS OR LIABILITIES ON THE PART OF RKI
NSTRUMENTS, INC., INCLUDING BUT NOT LIMITED TO THE WARRANTY
I
OF MERCHANTABILITY OR FITNESS FOR A PARTICULAR PURPOSE. IN
NO EVENT SHALL RKI INSTRUMENTS, INC., BE LIABLE FOR INDIRECT,
INCIDENTAL, OR CONSEQUENTIAL LOSS OR DAMAGE OF ANY KIND
CONNECTED WITH THE USE OF ITS PRODUCTS OR FAILURE OF ITS
PRODUCTS TO FUNCTION OR OPERATE PROPERLY.
2 • Warranty
This warranty covers instruments and part s sold to users o nly by
authorized distributors, dealers, and representatives as
appointed by RKI Instruments, Inc.
We do not assume indemnification for any accident or damage
caused by the operation of this gas monitor and our warranty is
limited to replacement of parts or our complete goods.
Page 3

Table of Contents
Warranty . . . . . . . . . . . . . . . . . . . . . . . . . . . . . . . . . . . . . . . . . . . . . . . . . . 2
Table of Contents . . . . . . . . . . . . . . . . . . . . . . . . . . . . . . . . . . . . . . . . . . . 3
Introduction . . . . . . . . . . . . . . . . . . . . . . . . . . . . . . . . . . . . . . . . . . . . . . . 5
System Requirements . . . . . . . . . . . . . . . . . . . . . . . . . . . . . . . . . . . . . . . 6
Installing the SC-01 Data Logger Management Program . . . . . . . . . . . 7
IrDA Downloading Cable . . . . . . . . . . . . . . . . . . . . . . . . . . . . . . . . . . . . . 8
Installing an IrDA Adapter Cable . . . . . . . . . . . . . . . . . . . . . . . . . . . 9
Windows
®
Wireless Link Operation Note . . . . . . . . . . . . . . . . . . . . . 9
Using a USB or Serial Port With an IrDA Cable Installed . . . . . . . . 10
Launching the Program . . . . . . . . . . . . . . . . . . . . . . . . . . . . . . . . . . . . . 12
Control Buttons . . . . . . . . . . . . . . . . . . . . . . . . . . . . . . . . . . . . . . . . . . . 13
Download Button . . . . . . . . . . . . . . . . . . . . . . . . . . . . . . . . . . . . . . 14
Instrument Information Button . . . . . . . . . . . . . . . . . . . . . . . . . . . . 14
Data Button . . . . . . . . . . . . . . . . . . . . . . . . . . . . . . . . . . . . . . . . . . . 15
Last Calibration Button . . . . . . . . . . . . . . . . . . . . . . . . . . . . . . . . . . 17
Set Button . . . . . . . . . . . . . . . . . . . . . . . . . . . . . . . . . . . . . . . . . . . . 18
Downloading Data from the SC-01 . . . . . . . . . . . . . . . . . . . . . . . . . . . . 19
SC-01 Data Logging Capacity . . . . . . . . . . . . . . . . . . . . . . . . . . . . . . . . 25
Viewing, Printing, & Deleting Data in the Last Calibration Window. . 26
Viewing and Printing Last Calibration Data . . . . . . . . . . . . . . . . . . . 26
Deleting Last Calibration Data. . . . . . . . . . . . . . . . . . . . . . . . . . . . . 31
Viewing, Printing, Exporting, & Deleting Data in the Data Window . . 33
Data Window . . . . . . . . . . . . . . . . . . . . . . . . . . . . . . . . . . . . . . . . . 33
Calibration History . . . . . . . . . . . . . . . . . . . . . . . . . . . . . . . . . . . . . 34
Table of Contents • 3
Page 4

Event Data . . . . . . . . . . . . . . . . . . . . . . . . . . . . . . . . . . . . . . . . . . . 38
Sensor Change History . . . . . . . . . . . . . . . . . . . . . . . . . . . . . . . . . . 42
Interval Trend Data . . . . . . . . . . . . . . . . . . . . . . . . . . . . . . . . . . . . 46
Alarm Trend Data . . . . . . . . . . . . . . . . . . . . . . . . . . . . . . . . . . . . . . 54
Deleting Data in the Data Window. . . . . . . . . . . . . . . . . . . . . . . . . . 60
Changing the Password . . . . . . . . . . . . . . . . . . . . . . . . . . . . . . . . . 61
Changing SC-01 Instrument Pa rameters . . . . . . . . . . . . . . . . . . . . . . . 63
Changing the Appearance of the Program Screens . . . . . . . . . . . . . . 66
Spare Parts List . . . . . . . . . . . . . . . . . . . . . . . . . . . . . . . . . . . . . . . . . . . 68
CAUTION: Read and understand this manual before using the
SC-01 Data Logger Management Program. Also
read and understand the SC-01 Operator’s Manual
included with the SC-01 portable gas detectio n unit.
4 • Table of Contents
Page 5

Introduction
Using an advanced microprocesso r controlled detection system,
the SC-01 Personal Single Gas Monit or detects the presence of
one of a variety of toxic gasses depending on the sensor
installed. The SC-01’ s compact size and easy-to-use design
makes it ideally suited for a wide range of applications as
described in the SC-01 Operator’s Manual, which you should
read first before using the SC-01 Data Logger Management
Program.
The SC-01 Data Logger Management Program do wnloads dat a
stored in the SC-01 to a Windows-based PC. After the data has
been downloaded, you can view, save, or print it using your
computer and the SC-01 Data Logger Management Program.
The purpose of this manual is to explain how to use and set up
the SC-01 Data Logger Management Program. You will learn
how to:
• install and launch the program
• install the downloading cable (if needed)
• download data from the SC-01
• view, print, and export, and delete data
• change data logging parameters
• change the appearance of the program screens
• change the color of graphed readings for a particular gas
Before you get started, be sure to review the system
requirements in the next section.
WARNING: The SC-01 detects toxic gases which can be
dangerous or life threatening. When using the
SC-01, you must follow the instructions and
warnings in the SC-01 Operator’s Manual to
assure proper and safe operation of the unit
and to minimize the risk of personal injury.
Introduction • 5
Page 6

CAUTION: The operator of this instrument is advised that if t he
equipment is used in a manner not specified in this
manual, the protection provided by th e equipment
may be impaired.
System Requirements
To use the GX-2003 Data Logger Management Program, your
personal computer must meet the following requirements:
• Operating Systems: Windows® 98, Windows® 2000, or
®
Windows
XP
• Processor: IBM
®
compatible PC running Pentium® 2 or
higher.
• Memory: 32 MB RAM minimum
• Available Har d Disk Space: 32 MB minimum
• CD-ROM Drive
• Infrared port or
Serial port and a serial/IrDA adapter cable or
USB port and a USB/IrDA adapter cable
6 • System Requirements
Page 7
Installing the SC-01 Data Logger
Management Program
1. Launch Windows®.
2. Exit from all applications and open windows.
3. Insert the SC-01 Data Logger Management Program
Installation CD in your computer’s CD-ROM drive.
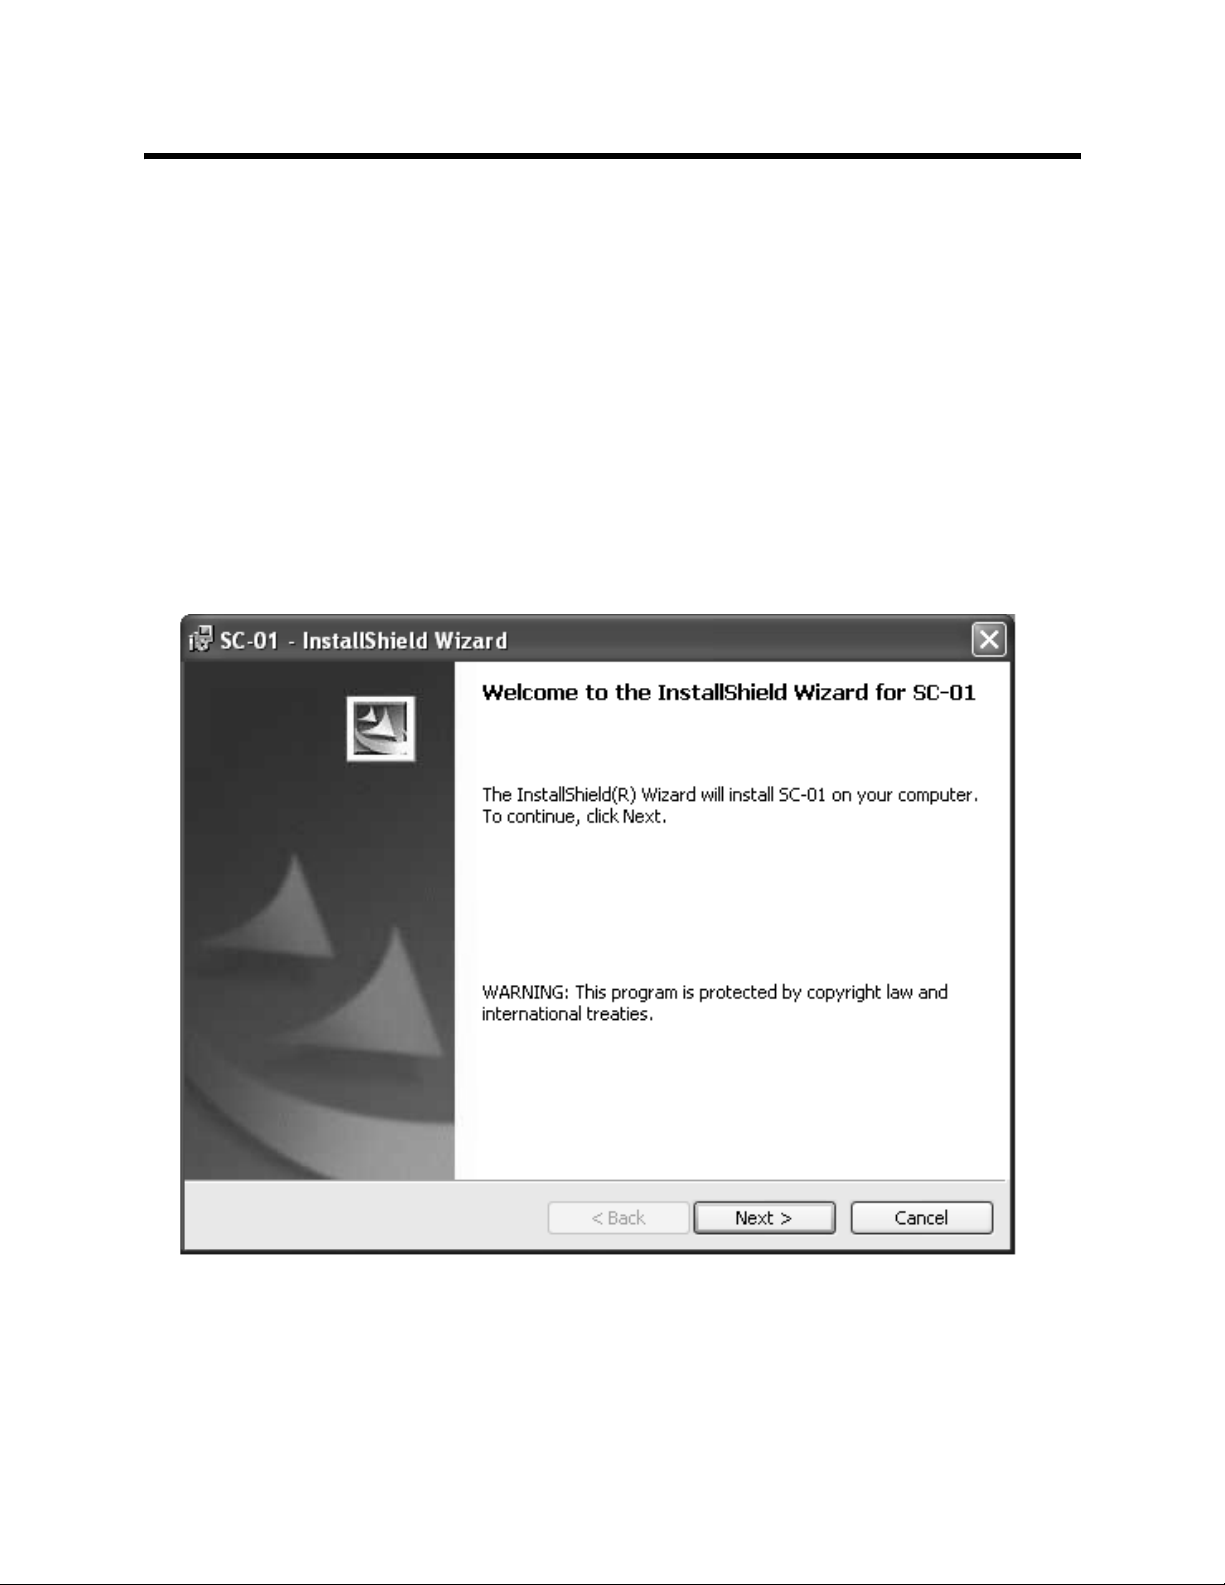
4. After a few seconds, a screen appears indicating that the
SC-01 InstallShiel d Wiza r d is pr epar in g to in stall th e da ta
logging program, then the SC-01 InstallShield Wizard
window appears to guide you through installation.
Figure 1: SC-01 InstallShield Wizard
5. Follow the on-screen instructions in the Installation Wizard
window to install the program.
Installing the SC-01 Data Logger Management Program • 7
Page 8

6. If the InstallShield Wizard finds versions of Windows® files
on your computer newer than those in the installation CD, it
will ask you if you want to keep these newer files. Click “Y e s”.
7. When the InstallShield Wizard indicates that installation is
complete, click the “Finish” button.
8. Eject the installation CD from the CD-ROM drive a nd store it
in a safe place.
IrDA Downloading Cable
The SC-01 communicates with a computer via an on-board
infrared data port that complies with IrDA protocol standards.
NOTE: If your computer has a built -in infrared port, you do not
need an adapter cable to download data.
If your computer does not have an infrar ed port, you will need to
install an IrDA/serial adapter cable or an IrDA/USB adapter
cable on your computer to download data to the PC from your
SC-01. Both types of cables are availab le from RKI In strument s,
Inc. See the Spare Parts List at the end of this manual for the
RKI part numbers. These cables can also be found in many
electronic supply stores and computer stores.
®
Some versions of Windows
device drivers loaded in Windows
already have several infrared
®
and will automatically
recognize a cable during the installation process and guide you
in installing the drivers. Other versions of Windows
®
will require
you to load device drivers provided by the manufacturer of the
cable during the install ation pr ocess. RKI makes n o warranty for
the operation or compatibility of the drivers with any particular
device.
8 • IrDA Downloading Cable
Page 9

Installing an IrDA Adapter Cable
After instal ling the Data Logger Management Program, connect
an IrDA/serial or IrDA/USB cable to your computer and follow
the manufacturer’s instructions for installing the cable on your
computer. Make sure the cable is compatible with your
®
Windows
If you do not have instructions from the cable manufacturer for
installing your cable, see your Windows® documentation. In
general, you must go to the Control Panel and use the Add
Hardware Wizard to install the cable drivers.
operating system.
Windows
®
Wireless Link Operation Note
When using an IrDA adapter cable and the SC-01 Data Logging
Software on a Windows
®
computer, it is necessary to make a
special setting in the Wireless Link Configuration window for
proper communication between the SC-01 and the Dat a Logger
Management Program. This must be done before attempting to
use the program. To make this setting, perform the following
steps:
®
1. Click Start in the Windows
Icon Tray.
2. If Control Panel is available to select in the Start menu,
select it. The Control Panel will appear.
If Control Panel is not selectable in the Start menu but
Settings is, select Settings, then select Control Panel. The
Control Panel will appear.
3. Double click on Wireless Link. The Wireless Link
Configuration window will appear.
4. Click on the Image Transfer tab.
IrDA Downloading Cable • 9
Page 10
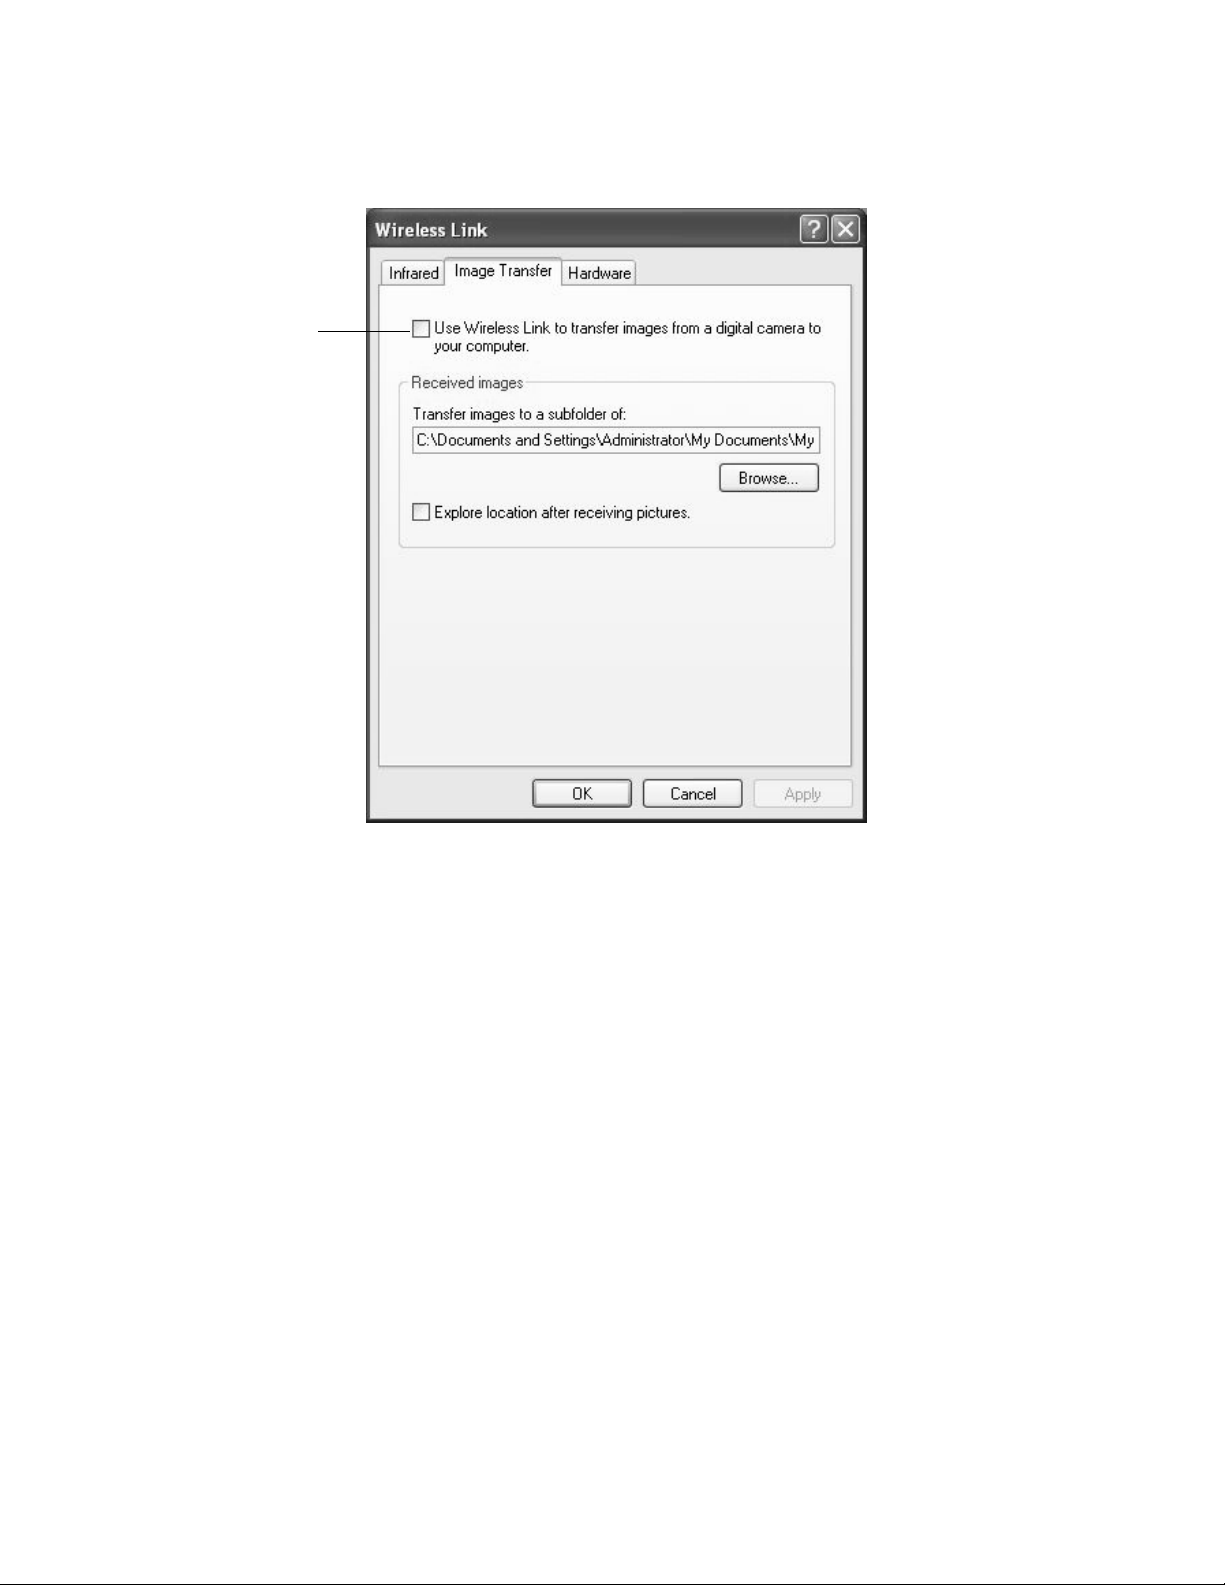
5. Deselect the selection box for “Use Wireless Link to transfer
Deselect
this box
images from a digital camera to your computer.”
Figure 2: Image Transfer Tab
6. Click OK.
7. Close the Control Panel window.
Using a USB or Serial Port With an IrDA Cable
Installed
When an IrDA cable is inst alled on a USB or serial port, that port
is always being used by the cable. If you need to use that port
for another device, you must disable the IrDA/serial cable or
IrDA/USB cable using Windows® and then shut down your
computer before disconnecting it, starting your computer up
again, and then using the port with another device or cable. For
example, if you have an IrDA/Serial cable installed in a serial
port and want to download a different device using a standard
straight through serial cable, you will need to disable the IrDA
cable, remove it and inst all the straight throug h serial cable, then
restart your computer. When you wish to download the SC-01
10 • IrDA Downloading Cable
Page 11

again, remove the straight through cable and reconnect the IrDA
cable, enable the IrDA cable using Windows
your computer. See your IrDA cable and Windows
®
, and then restart
®
documentation for instructions to enable and disable an IrDA
device. In general, you can enable or disable a device by going
to the Control Panel, double clicking System, selecting the
Hardware Tab, clicking Device Manager, double clicking the
IrDa cable under Infrared Devices, and making the appropriate
selection in the Device usage field. The process may differ
®
slightly in your particular Windows
system.
IrDA Downloading Cable • 11
Page 12
Launching the Program
1. Click Start on the Windows® Icon Tray, then select
Programs, then select the SC-01 icon. Your operating
system may also have a shortcut installed in the Start menu.
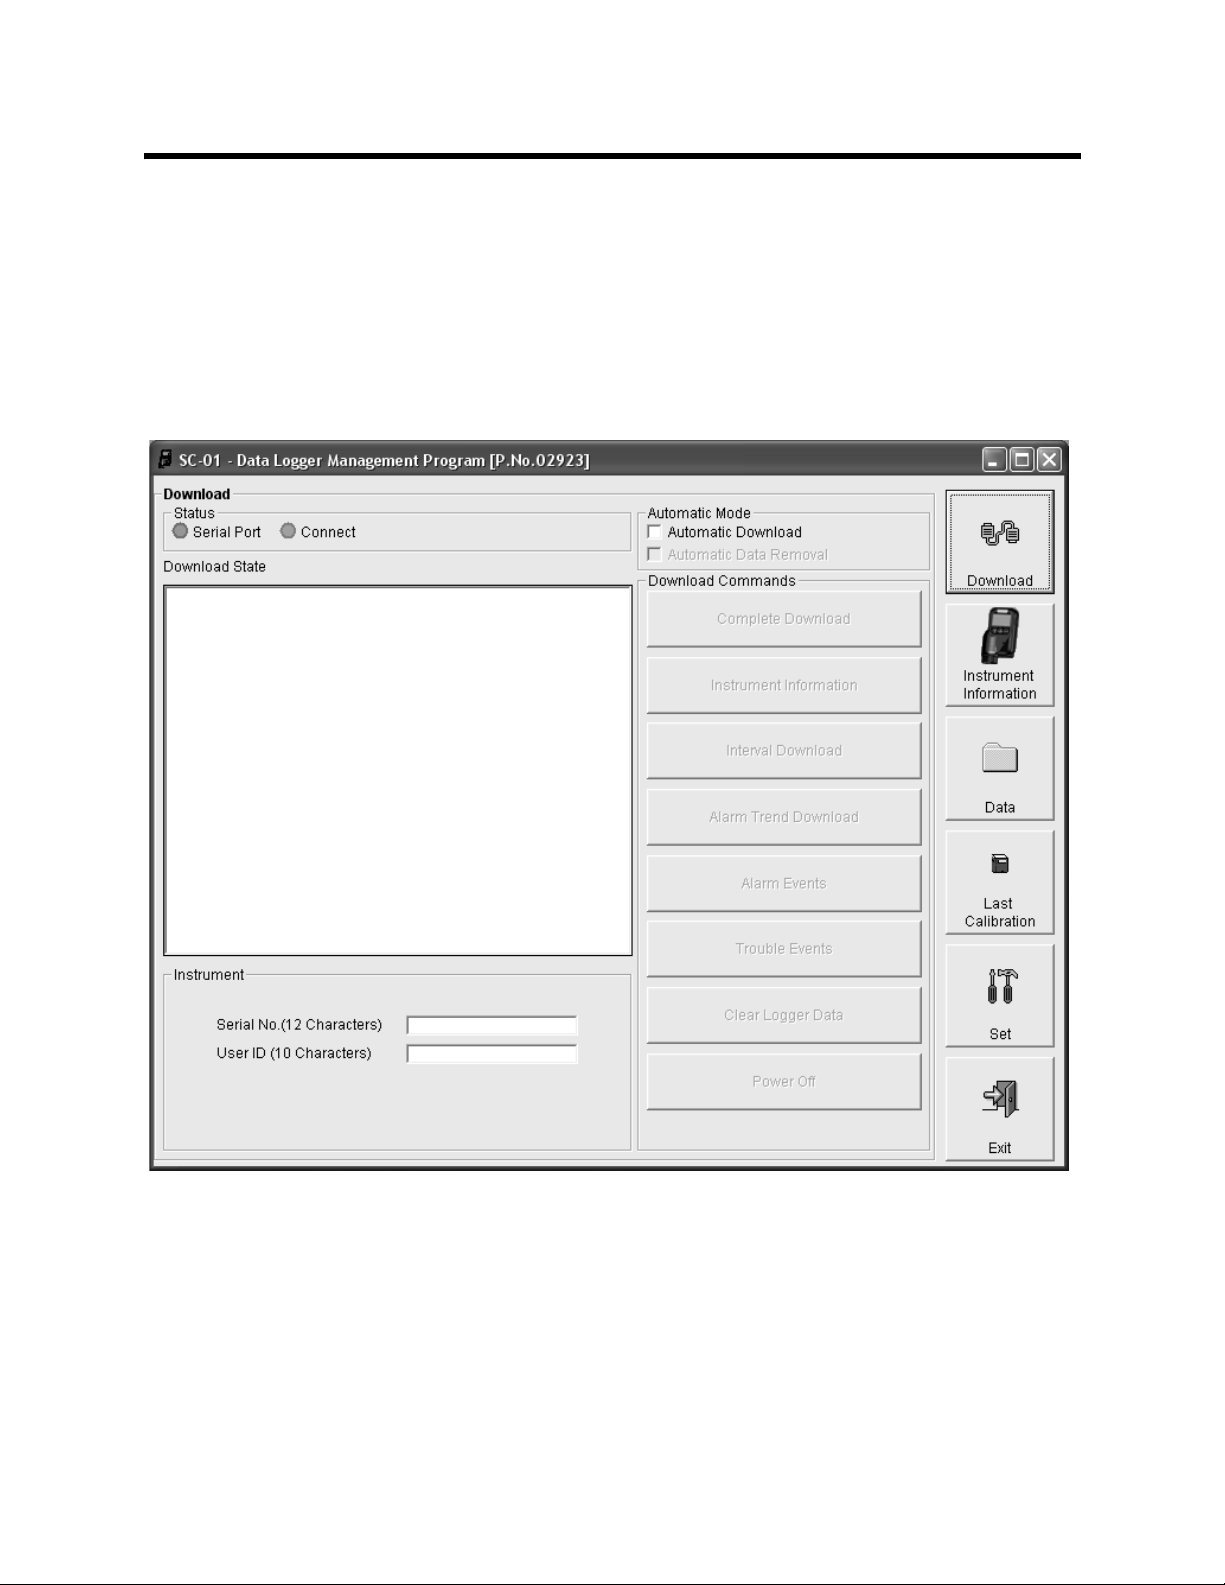
2. The program will launch and the Download window will
appear.
Figure 3: The Download Window
3. For convenience, make a shortcut of the SC-01 Data Logger
Management Program and place it on the Windows
desktop. See your Windows
about making shortcuts.
12 • Launching the Program
®
®
documentation for information
Page 13
Control Buttons
This section describes the control buttons. Instructions for using
each control button are given in other parts of this manual.
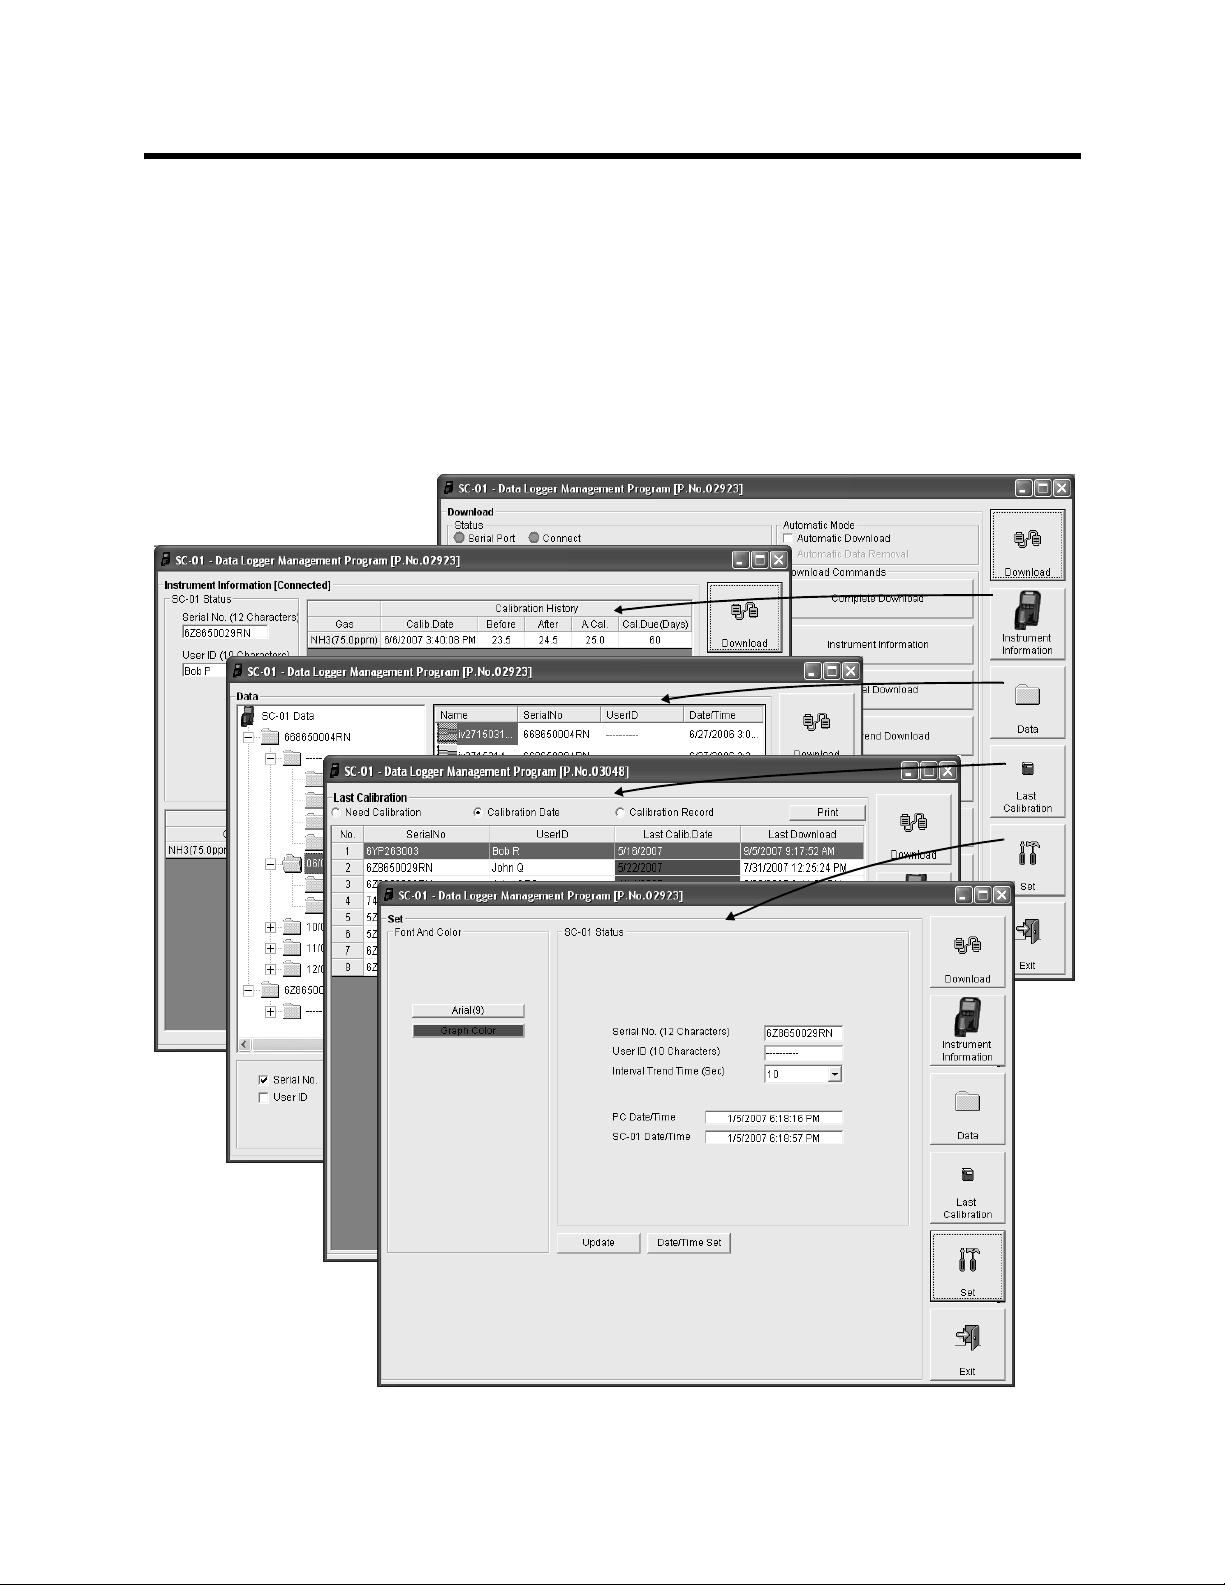
When the program is launched, it opens in the Download
window. Along the right side of the Download window are six
control buttons that access other windows in the program.
Figure 4 below shows the various windows that you can access
when you click these control buttons
Figure 4: Windows Accessed by Control Buttons
Control Buttons • 1 3
Page 14
Download Button
If you are in another program window, clicking the Download
button opens the Download window (see Figure 3 on page 12).
The Download window has several download commands that
allow you to perform various data retrieval functions with an
instrument that is connected to the program. Data can be
retrieved from the instrument, data can be cleared from the
instrument, and the instrument can be turned of f. The Download
State area on the left side of the window displays various
messages about operations in progress or completed and the
condition of the program’s connection to the instrument. See
“Downloading Data from the SC-01” on page 19 for a complete
description of downloading data from a SC-01.
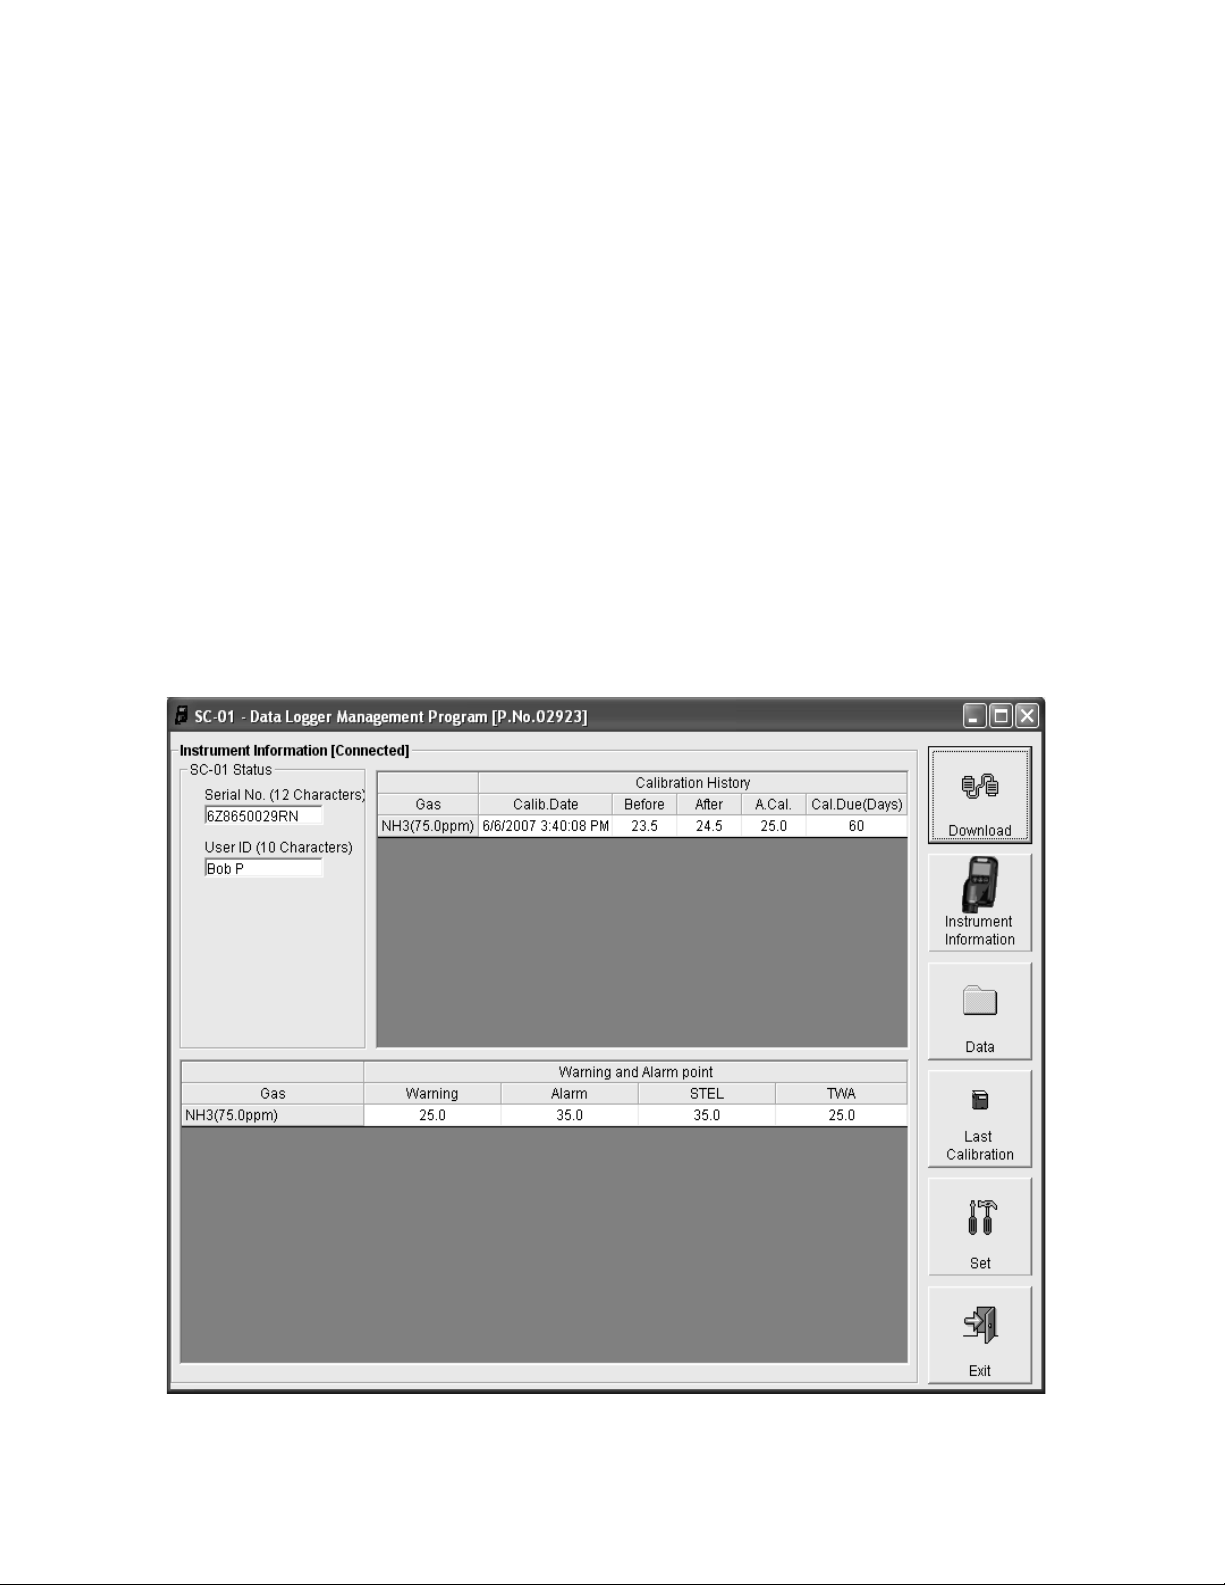
Instrument Information Button
Clicking the Instrumen t Information button opens the
Instrument Information window.
Figure 5: Instrument Information Window
14 • Control Buttons
Page 15
The Instrument Information window displays various instrument
parameters for an instrument that has been downloaded using
the Complete Download or Inst rument Informati on download
commands in the Download window and is currently connected
to the program. If an instrument is turned off after being
connected to the program, then the program will lose the
connection with the instrument and the fields in th e Instrument
Information window will become blank.
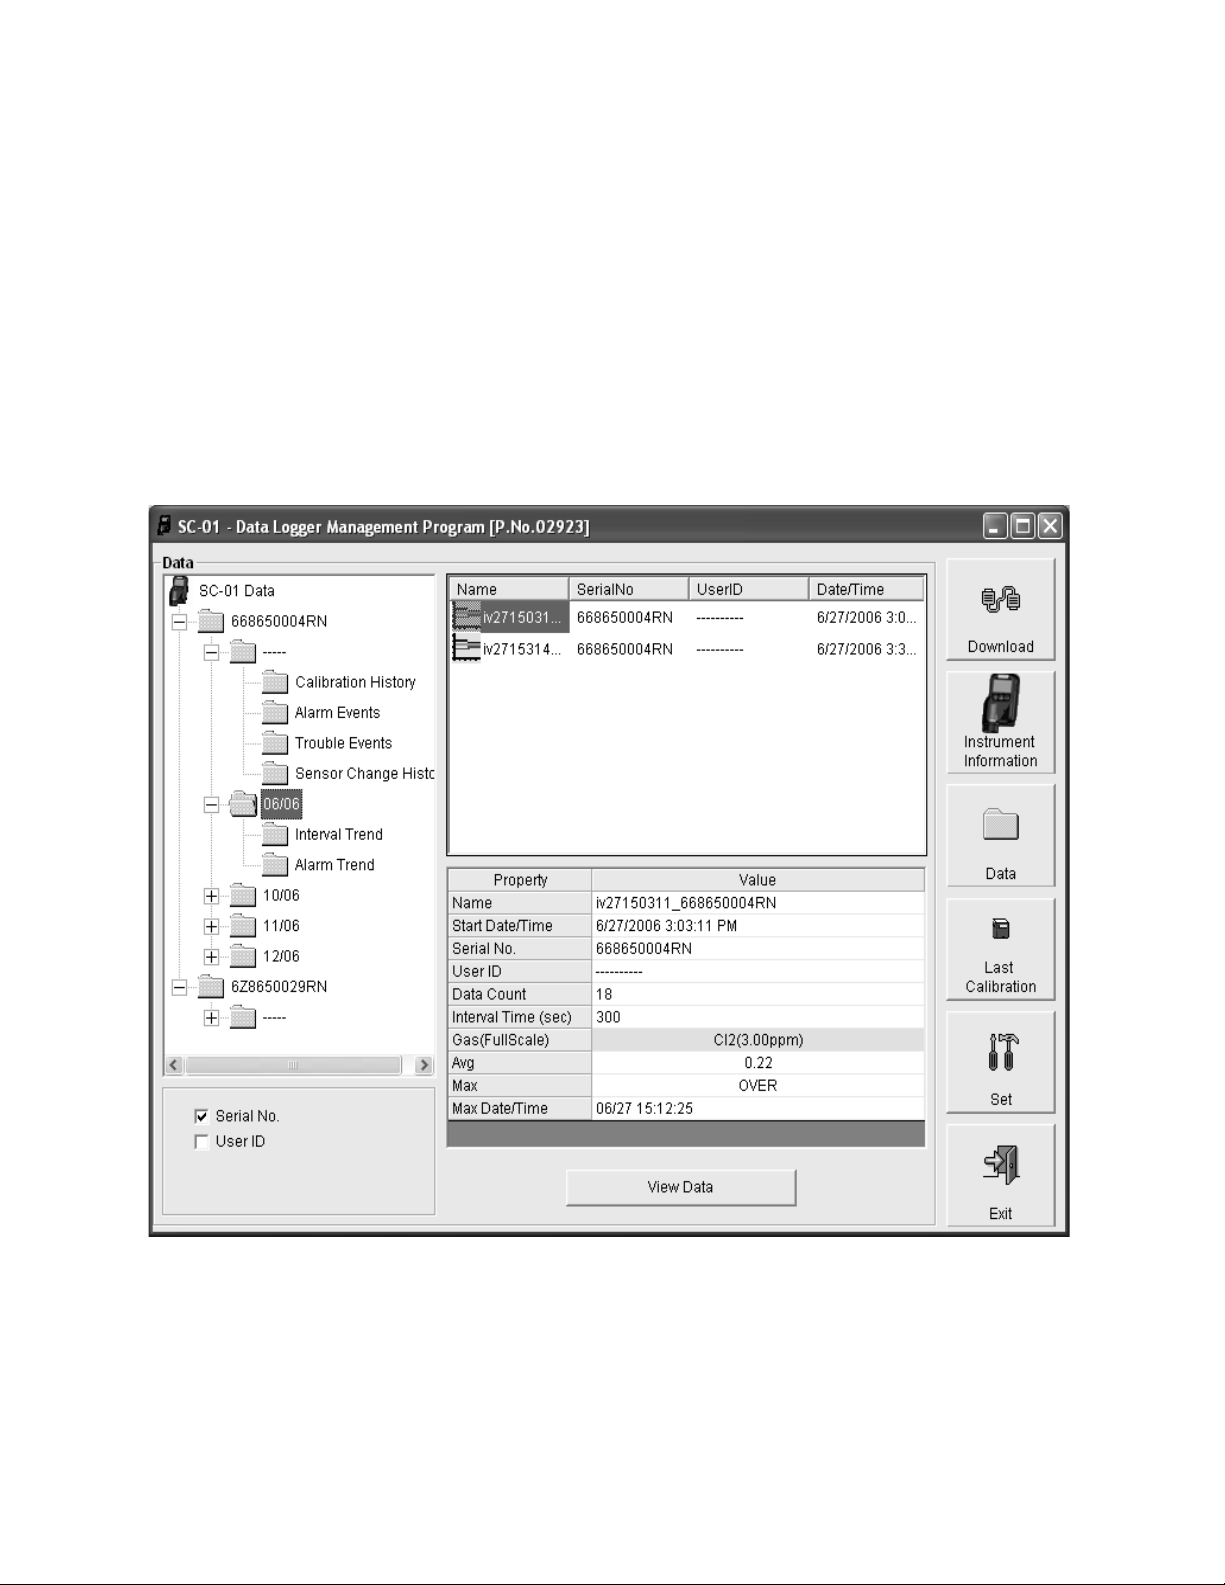
Data Button
Clicking the Data button opens the Data window.
Figure 6: Data Window
In the Data window, you can view, print, export, and delete data
that has been downloaded from instruments. The following
types of data files are accessible in the Data window:
Control Buttons • 1 5
Page 16

• Calibration History Files
A calibration history file is sa ved for each instr ument that has
been downloaded. It records the calibration information for
every calibration that was downloaded. The SC-01 can save
information for up to the 20 most recent calibrations in its
memory.
• Alarm Event Files
Alarm event files record gas alarm events that have been
downloaded from instruments. The SC-01 can save up to 100
alarm events in it’s memory.
• Trouble Event Files
Trouble event files record sensor failure and system failure
events that have been downloaded from instruments. The
SC-01 can save up to 100 trouble events in it’s memory.
• Sensor Change History Files
A sensor change history file is created for every downloaded
instrument whose downloaded data indicates that the sensor
has been replaced or changed to a different ty pe (gas). The
sensor replacements /changes a re logged to pr ovi de a reco rd
of the instruments’ sensor histor y.
• Interval Trend Data Files
Interval trend data is lo gged at the interval trend ti me saved in
the SC-01. Each logged point is an average reading over the
previous time interval.
• Alarm Trend Data Files
Data in an alarm trend data file is logged every five seconds
and is logged around an al arm e vent. Each lo gged read ing is
the peak reading during the previous f ive seco nd per iod. The
SC-01 can save up to 8 alarm trend data files in its memory.
16 • Control Buttons
Page 17
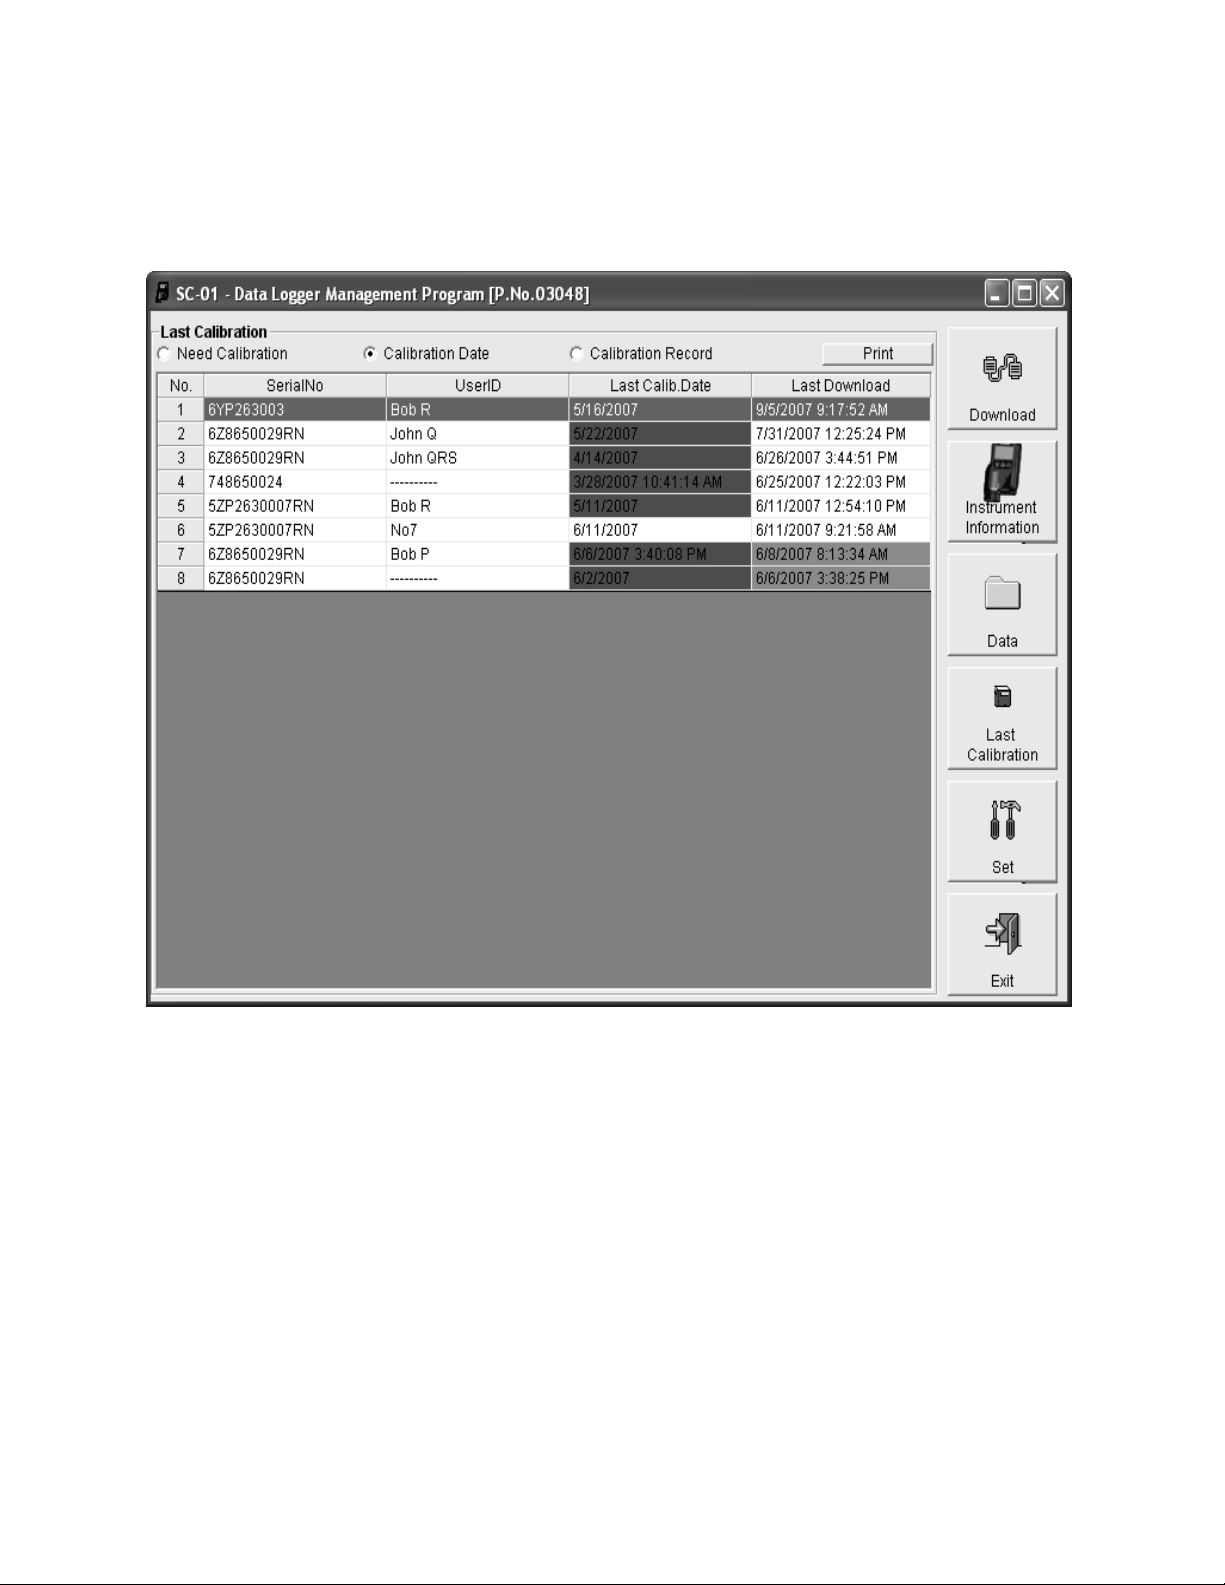
Last Calibration Button
Figure 7: Last Calibration Window
Clicking the Last Calibration button opens the Last Calibration
window.
The Last Calibration window stores the information for the most
recent successful calibration for each SC-01 that has been
downloaded. You can display the information three ways by
using the Need Calibration, Calibration Date, or Calibration
Record selection buttons. You can also print the information if
you select the Need Calibration or Calibration Date display
options.
Control Buttons • 1 7
Page 18
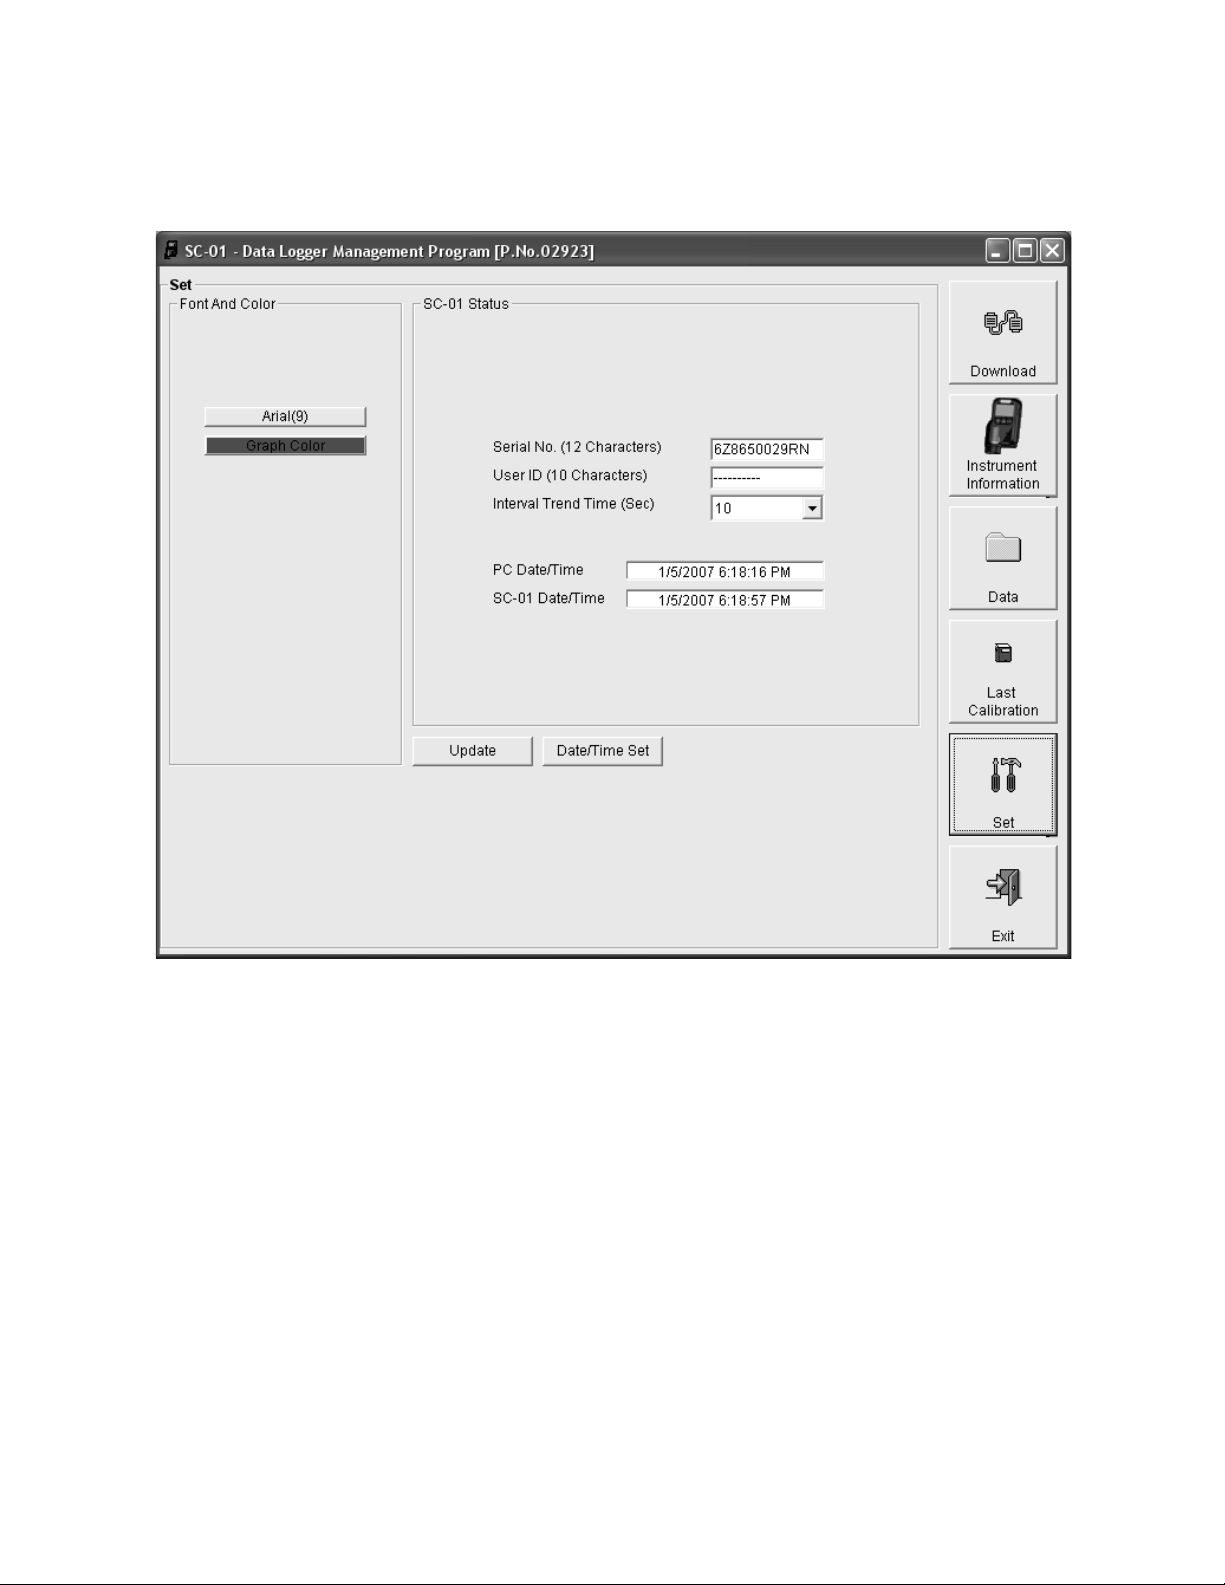
Set Button
Clicking the Set button opens the Set window.
In the Set window, you can perform the following function s:
• Alter the appearance of the program windows with the font
and color buttons
• Change the instrument serial number, user ID, or interval
trend time of a connected instrument by editing the fields in
the SC-01 Status frame and then clicking the Update button
• Update the date and t ime in a con nected instrument t o be the
same as the computer’s by using the Date/Time Set button
18 • Control Buttons
Figure 8: Set Window
Page 19
Downloading Data from the SC-01
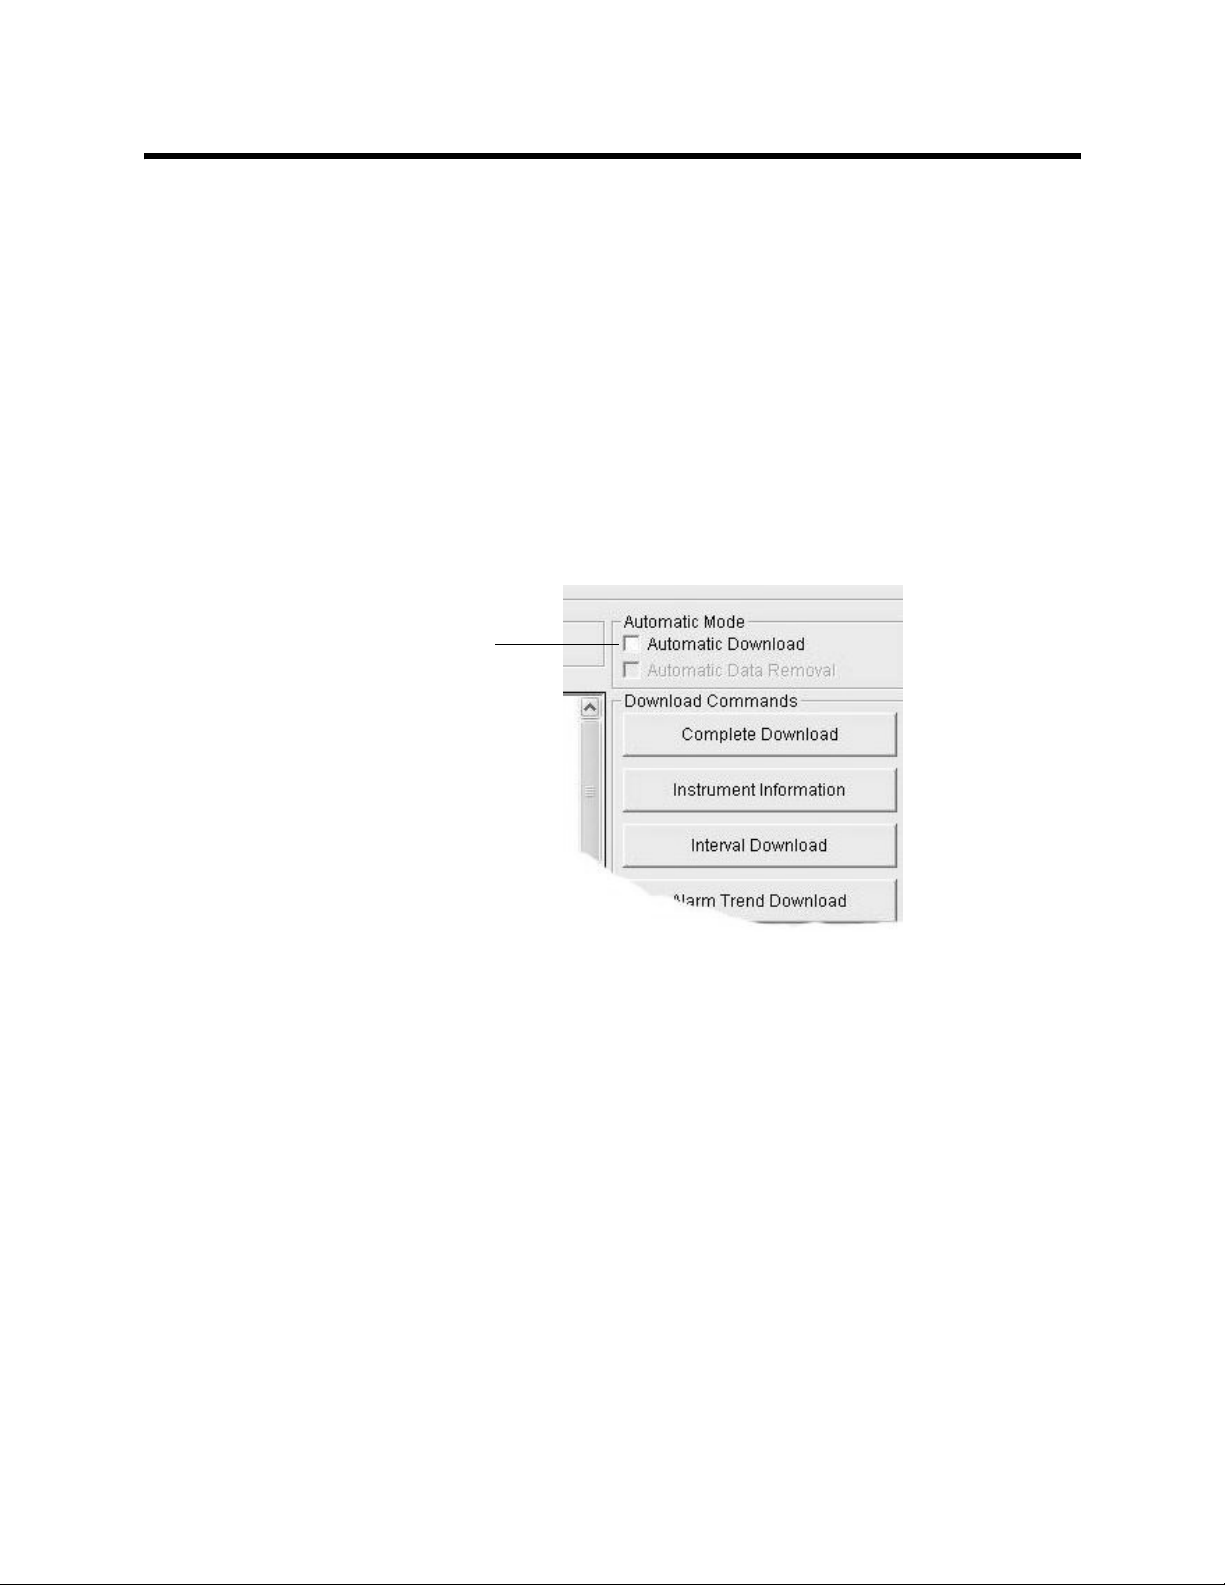
You have the option of downloading data manually or
automatically. If you want to download data using the automatic
download feature, click the Aut omatic Download selection box in
the Download window before attempting to download data from
the SC-01. Remember that if Automatic Download is selected,
the Instrument Information window will remain blank and the
SC-01 will turn off automatically after the data is downloaded. If
you want the data in the SC-01 to be cleared auto matically af t er
an automatic download, select the Automatic Data Removal
box. The Automatic Data Removal box is only available for
selection if the Automatic Download box is selected.
Click here for
automatic
downloads
Figure 9: Automatic Download Selection Box
To download data from a SC-01:
1. Launch the SC-01 Data Logger Management Program (see
“Launching the Program” on page 12). The Download
window displays.
2. Place the SC-01 within an inch or two of the infrared port on
your computer aligning the infrared port on the side of the
SC-01 with the infrared port on your computer.
If your computer does not have a built in infrared port, place
the SC-01 within an inch or two of the infrared port on the
IrDA adapter cable a s shown in Figure 10 below , aligning the
infrared port on the side of the SC-01 with the infrared port
on the cable.
Downloading Data from the SC-01 • 19
Page 20
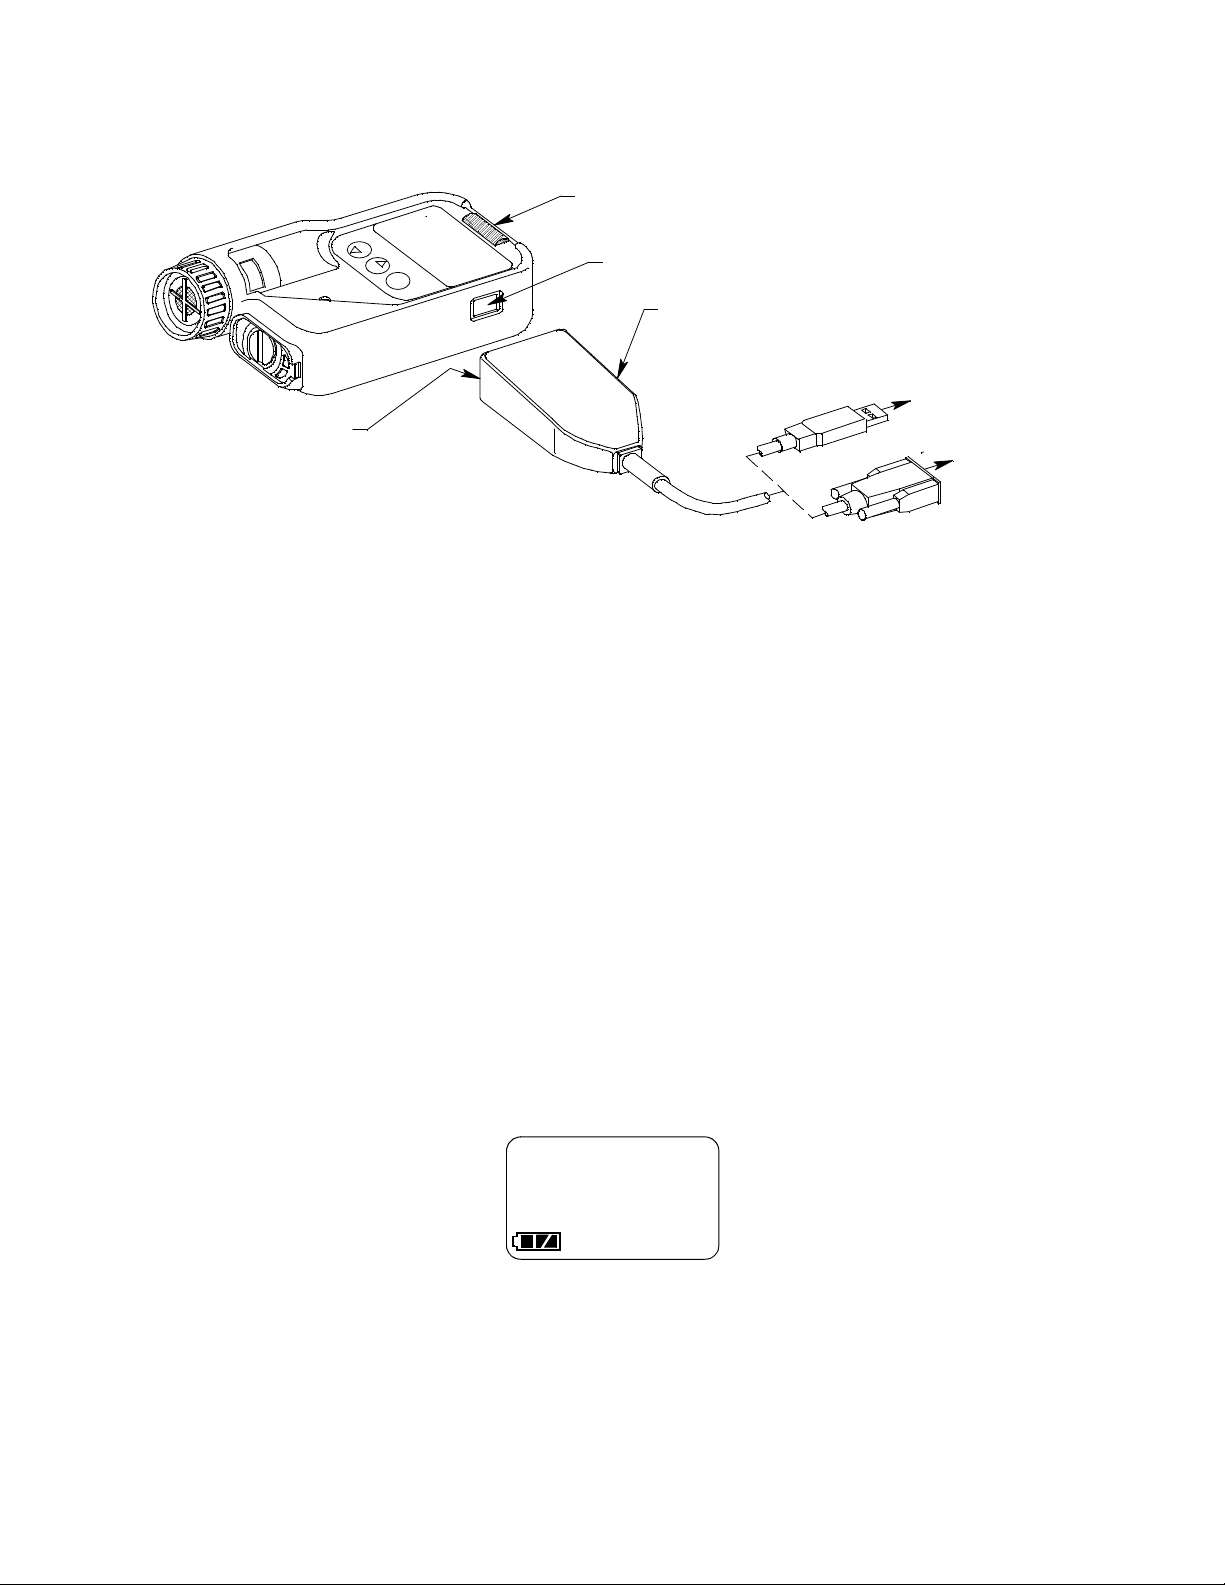
r
SC-01
Infrared Port
IrDA/USB or
IrDA/Ser ial C able
USB Connector
Cable 'sInfrare d Port
Serial Connector
To Computer
USB Port
To Compute
Serial Port
Figure 10: Aligning the SC-01 With the Cable Infrared Receiver
3. Press and hold the POWER button on the SC-01 until you
hear a beep, then release it. The SC-01 will begin it’s power
up sequence.
4. If the CAL. LIMIT menu item in the SC-01’s Setup Mode is
on, then one of the two following startup sequences takes
place. If CAL. LIMIT is turned off, the startup sequence in
S tep 5 below takes place. See the SC-01 Operat or’s Manual
for a description of the CAL. LIMIT Setup Mode menu item.
• If calibration is past due, t he following screen appears wit h
“CAL.” flashing and the LEDs and buzzer pulsing several
times alerting you that the SC-01 is due for calibration. If
this screen appears, wait for the buzzer and LED pulsing
to stop, then press and release the POWER button to
continue in the startup sequence.
CAL. LIMIT
CAL.
The SC-01 will then show the current date for a few
seconds before attempting to connect to the computer.
• If the calibration is up to d ate , the SC-01 t hen displays th e
calibration due date, how many days until the next
20 • Downloading Data from the SC-01
Page 21
calibration, and the current date bef ore attempting to
connect to the computer.
5. If the CAL. LIMIT menu item in Set up Mod e is turned off, the
SC-01 shows “WARMUP” in the upper left of the LCD for a
few seconds, then displays the current date for a few
seconds before attempting to connect to the computer.
CAUTION: If the instrument gives a low battery warning or
dead battery alarm, change the alkaline batteries
before attempting to download data. Se e the SC-01
Operator’s Manual for the battery alarm indications.
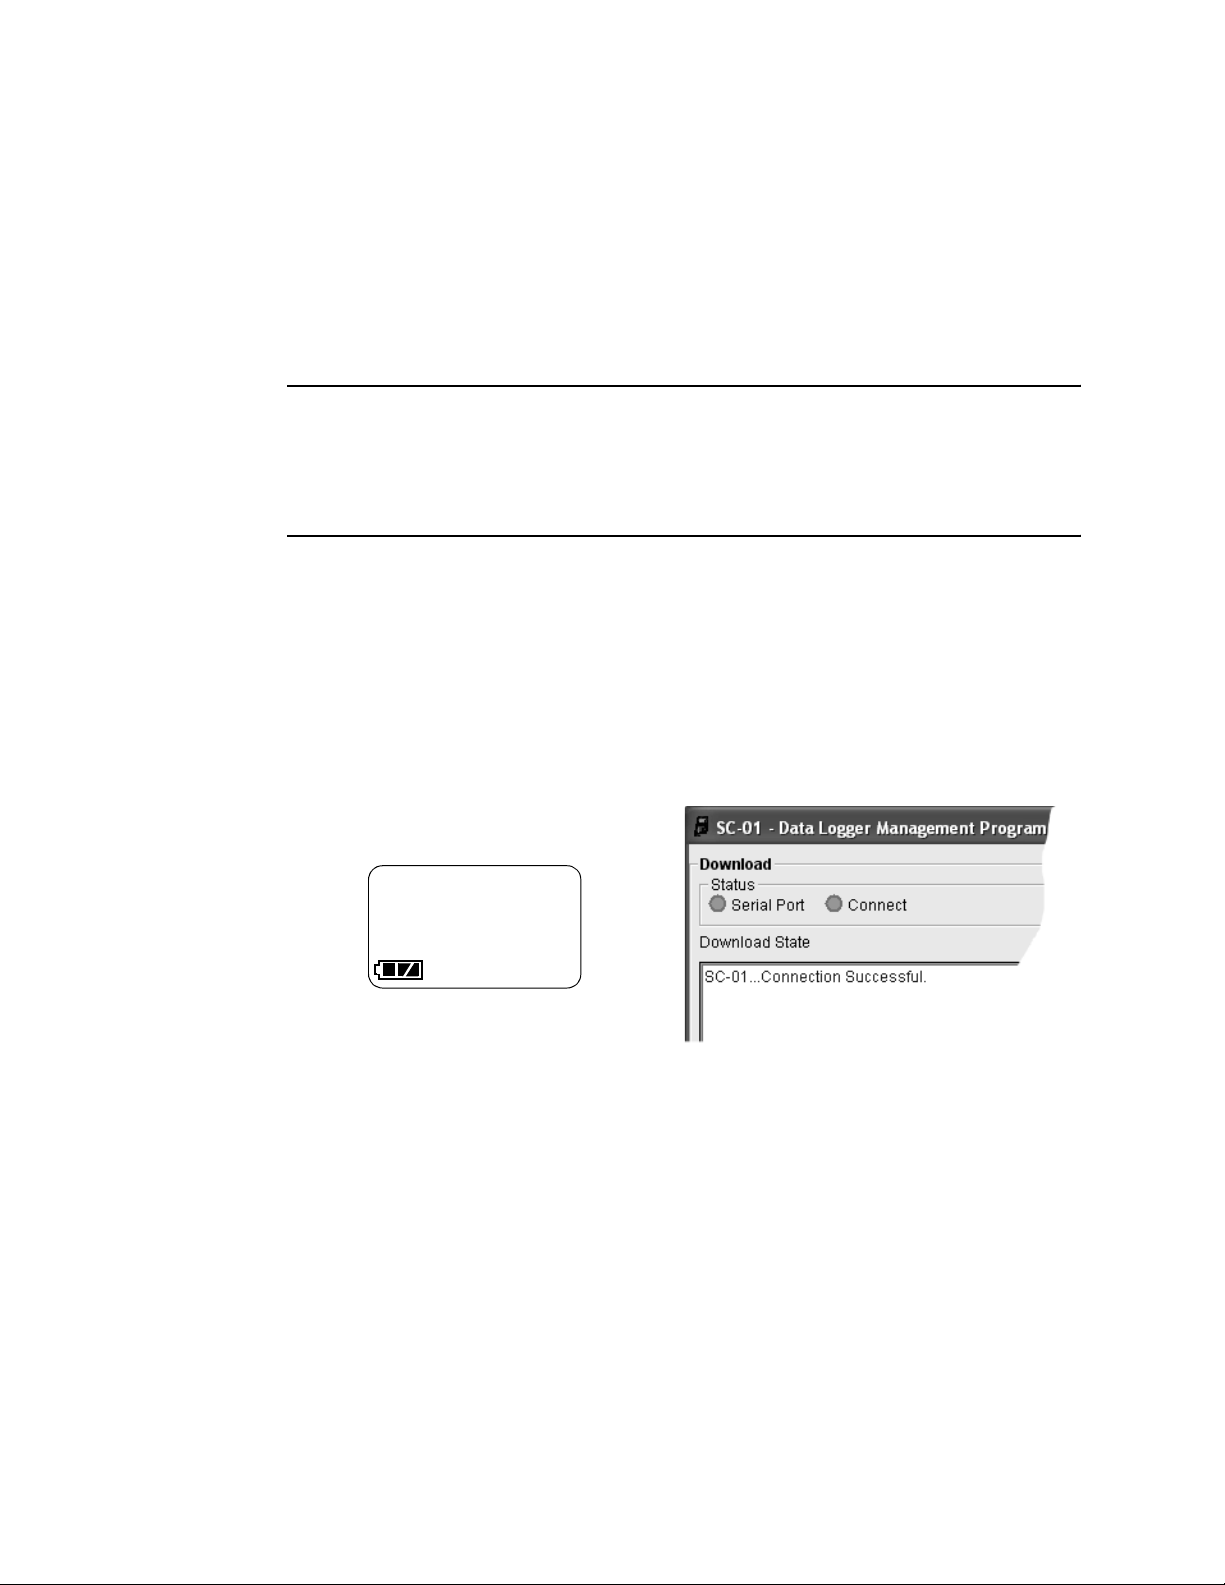
6. If a successful connection between the SC-01 and the
computer occurs, the SC-01 displays the screen shown on
the left in Figure 1 1 below, the Connect light in the program’s
Download window turns green after a few seconds and “SC01 Connection Successful.” displays in the Download State
area of the Download window as shown on the right in
Figure 11 below.
TRANSMIT
SC-01 Display
Figure 11: SC-01 and Program Connection Message
In addition, the Windows
®
icon tray will indicate that a
wireless connection is in effect.
7. If you selected Automatic Download, the downloading
process begins automatically after a successful connectio n
Program Indication
is made.
If Automatic Download is not selected, the Complete
Download, Instrument Information, and Power Off
download command buttons become active.
Downloading Data from the SC-01 • 21
Page 22

8. If you are going to download data manually, you can
download all the information at once, or you can download
only the information you want by using the appropriate
download command in the Download Commands area.
• To download all data and
instrument information from
the instrument, click
Complete Download.
• To download instrument
information only, click
Instrument Information.
Downloading instrument
information activates the rest
of the download commands
that are described below.
• To download interval trend
data only, click Interval
Download.
• To download alarm trend
data only, click Alarm Trend
Download.
Figure 12: Download
Commands
• To download alarm events
only, click Alarm Events.
• To download trouble events only, click Trouble Events.
9. While the data is being downloaded, messages in the
Download S tate message area of the Download window
indicate what actions the program is performing. These
messages also tell you what type of information has been
downloaded and if there are any communication or
downloading problems.
22 • Downloading Data from the SC-01
Page 23

Download messages
Use to download subsets of data
Use to download all data
Instrument ID
Clear data button
Figure 13: Download Messages in the Download Window
10.If the unit has been downloaded manually (Automatic
Download not selected) using the Complete Download or
Instrument Information commands, the unit’s instrument
information may be viewed after downloading by using the
Instrument Information button if the unit is still turned on
and connected to the computer. The instrument information
includes instrument parameters such as serial number and
alarm points, an d also incl udes the result s of the most r ecent
successful calibration. To view instrument information for a
unit, click the Instrument In fo rmation control button along
the right side of the Download window. The Instrument
Information window displays. This screen cannot be printed
from the program. If the unit is turned off, the Instrument
Information window will be blank.
Downloading Data from the SC-01 • 23
Page 24

Figure 14: Instrument Information Window
11.You can view, print (calibration dates only), or delete
downloaded calibration information for the most recent
successful calibration of a downloaded instrument by
entering the Last Calibration window. This window is
accessed by clicking the Last Calibration control button
along the right side of the Download window. See “Viewing,
Printing, and Deleting Data in the Last Calibration Window”
on page 26.
12.You can view, print , export , or delete downloaded data by
entering the Data window. This window is accessed by
clicking the Data control button along the right side of the
Download window. See “Viewing, Printing, Exporting, and
Deleting Data in the Data Window” on page 33.
13.After downloading data from an instrument, you can delete
all the data in the SC-01 by clicking the Clear Logger Data
24 • Downloading Data from the SC-01
Page 25

button if desired. This will not delete any data that has been
saved in the Data Management Program’ s database or SC01 instrument parameters such as serial number, alarm
settings, or autocalibration settings.
WARNING: If you click the Clear Logger Data button, all
data is erased in the SC-01, but not in the SC-01
Data Management Program’s database. So it is
advisable that you download the data from the
SC-01 first before clearing the data.
SC-01 Data Logging Capacity
Table 1: SC-01 Data Logging Capacity
Interval Trend Time
Data Logging Hours
1
10 seconds 150 hours
30 seconds 450 hours
60 seconds 900 hours
180 seconds (3 minutes) 2,700 hours
300 seconds (5 minutes) 4,500 hours
600 seconds (10 minutes) 9,000 hours
1
Logging hours assume that no alarms or other events occur.
Table 1 above lists the SC-01’s data logging capacity for each
interval trend time setting. The int erval trend time set ting can be
set using the Set window (see “Changing SC-01 Instrument
Parameters” on page 63). When the SC-01’s memory is full, it
overwrites the oldest saved dat a as n ew data is saved. To avoid
overwriting data in the SC-01 before it can be downloaded, turn
on the SC-01 and enter its Display Mode to note how much log
time remains in the SC-01 when beginning a data logging
session. If the SC-01’s memory is full, it will indicate “0” as the
amount of log time re maining. See the SC-01 Ope rator’s Manual
for instructions to use the SC-01’s Display Mode.
SC-01 Data Logging Capacity • 25
Page 26

Viewing, Printing, and Deleting Data in the
Last Calibration Window
You can access data on the most recent successful calibration
for each instrument that has been downloaded in the Last
Calibration window. You can view, print (calibration date only),
and delete this data in the Last Calibration window.
Viewing and Printing Last Calibration Data
Open the Last Calibration window by clicking the Last
Calibration button along the right side of the program window.
When you open the Last Calibration window the first time afte r
launching the program, it will open with the Need Calibration
view option selected. There are three view options in the Last
Calibration window: Need Calibration, Calibration Date, and
Calibration Record.
Need Calibration Option
Selecting this option shows the last calibration date and last
download date for the SC-01s that are due for calibration.
NOTE: The calibration interval value, the number of days af ter a
calibration that a new calibration is due, is saved in the
SC-01. If the calibration interval is changed in the SC01, the new calibration interval value will not be known
by the program until the SC-01 is downloaded using the
Complete Download button or the Instrument
Information button.
NOTE: If an instrument’s calibration interval is turned off in the
CAL. LIMIT menu item of the SC-01’s Setup Mode (see
the SC-01 Operator’s Manual), the SC-01 Data Logger
Management Program will always show that calibration
is due for that instrument.
26 • Viewing, Printing, and Deleting Data in the Last Calibration Window
Page 27

Figure 15: Last Calibration Information: Need Calibration Option
The Need Calibration view option shows the following fields:
• No. — lists, in numerical order, the sequence of units
whose data has been downloaded to the computer. The
most recently downloaded unit will be No. 1.
• SerialNo — shows the serial number of the unit that was
downloaded.
• UserID — shows the user ID of the of the unit that was
downloaded. If an instrument has calibration data stored
under two different user IDs, information for the most
recent successful calibration will appear for that
instrument for each user ID.
Viewing, Printing, and Deleting Data in the Last Calibration Window • 2 7
Page 28

• Last Calib. Date — shows date and time when the most
recent successful calibration took place. If a sensor in an
instrument was changed and the instrument was not
calibrated before downloading, only the date will appear
because in this case the information in the Last Calib.
Date field will come from the sensor which only stores the
date of the last successful calibration.
• Last Download — shows the date and time when t he most
recent download took place for a unit using the MM/DD/YY
format for the dat e .
The SC-01s that are due for calibration (in the case of the Need
Calibration view option, that will be all of them), will have their
last calibration date highlighted in red. The SC-01s that have not
been downloaded for more than 90 days will have their last
calibration date highlighted in purple.
To print a list of the instruments shown in the Need Calibration
view option along with their user ID and last calibration date,
click the Print button. A Printer List dialog box will appear.
Figure 16: Printer List Dialog Box, Need Calibration View Option
Select a printer and click the OK button to print the instrument
list.
Calibration Date View Option
Selecting this option shows the last calibration date and last
download date for all the SC-01s that are in the program’s
database. The fields for t he Calibra tion Date vi ew op tion ar e the
same as for the Need Calibration view option.
28 • Viewing, Printing, and Deleting Data in the Last Calibration Window
Page 29

Figure 17: Last Calibration Window: Calibration Date View Option
To print a list of the instruments shown in the Calibration Date
view option along with their user ID and last calibration date,
click the Print button. A Printer List dialog box will appear.
Figure 18: Printer List Dialog Box
Select a printer and click the OK button to print the instrument
list.
Viewing, Printing, and Deleting Data in the Last Calibration Window • 2 9
Page 30

Calibration Record View Opti on
Selecting the Calibration Record view option shows detailed
calibrati on informatio n fo r ea c h SC -01’s most recent successful
calibration.
Figure 19: Last Calibration Information: Calibration Record Option
The fields on this screen include SerialNo and UserID just as in
the Need Calibration and Calibration Date screens. The fields
also include the following:
• Gas — Shows the instrument’s target gas.
NOTE: If a sensor in an instrument was changed and the
instrument was not calibrated before downloading,
dashes will appear in the Before and After fields
because in this case the only information available fo r
the last successful calibration comes from the sensor
which only stores the date of the last successful
calibration.
• Before — shows the gas reading prior to performing the
calibration adjustment.
30 • Viewing, Printing, and Deleting Data in the Last Calibration Window
Page 31

• After — shows the gas reading after performing the
calibration adjustment.
• A. Cal. — lists the auto-calibrat ion setting for ea ch SC-01.
If a unit passes its calibration, the “After” column should
match the “A. Cal.” column. If a unit fails calibration it will
retain the previous calibration information.
• Cal. Due (Days) — shows when calibration is due in days
(e.g., “Remaining 25 days” means t hat calibration is due in
25 days, and “Now” means that calibration is past due).
It is not possible to print any information when the Calibration
Record view option is selected.
To view and print all past calibrations for an instrument, see
“Calibration History” on page 34.
Deleting Last Calibration Data
To delete in instrument and its calibration data from the Last
Calibration window:
1. With the program launched, click the Last Calibration
control button on the right side of the program window. The
Last Calibration window will appear.
2. Select the Need Calibration or Calibration Date option.
3. Click the row for the instrument whose calibration
information you want to delete to select it. It will be
highlighted to show that it is selected.
4. Click the row with the right mouse button. The Delete box
appears.
5. Click Delete with the left mouse button. The Password
window appears.
Figure 20: Password Window, Deleting Last Calibration Data
Viewing, Printing, and Deleting Data in the Last Calibration Window • 3 1
Page 32

6. Enter the password and click the Continue button. The
password when the software is first installed is “rki”. The
password is case sensitive. See “Changing the Password”
on page 61 for instructions to change the password if
desired.
7. When the password has been entered and the Continue
button clicked, the Delete History window will appear asking
you to confirm that you want to delete the most recent
calibration information for the selected instrument.
Figure 21: Delete History Window
8. If you want to delete the calibration inf ormation, click the Yes
button. The information will be deleted by the software.
If you do not want to delete the calibration information, click
the No button and the operation will be cancelled.
32 • Viewing, Printing, and Deleting Data in the Last Calibration Window
Page 33

Viewing, Printing, Exporting, and
Deleting Data in the Data Window
The SC-01 logs five types of data files: calibration history, event
data, sensor change history data, interval trend data, and alarm
trend data.
You can view, print, and export (save to a file) each of these
types of data files. All of these types of data files can also be
deleted. The deleting of files is password protected and is
described in “Deleting Data in the Data Window” on page 60.
Data Window
All the data, other than the most recent calibration information
accessible in the Last Calibration window, can be accessed in
the Data window. The Data window is accessed by clicking the
Data button along the right side of the program window.
Double-click
to show
data folders
Click to
expand
folder
Click to show
interval trend
files
Interval trend
files
Figure 22: Data Window, Basic Data Organization
The Data window is divided into four frames. The upper left
frame is the Data frame and displays all the data folders. They
Viewing, Printing, Exporting, and Deleting Data in the Data Window • 33
Page 34

are grouped under the SC-01 icon in the upper left corner of the
frame. If the data folders are not visible, double click the icon to
make them visible. If no data has been saved, then no folders
will appear when the SC-01 icon is double clicked.
The lower left frame cont ains t wo selecti on boxes f or organizing
data. If neither of the boxes are selected, then the data is
organized as shown in Figure 22. The data may be organized by
either serial number, user ID, or both serial number and user ID.
Click the selection box or boxes in the lower left frame to
organize the data as desired.
NOTE: In the examples that follow, the data will be shown
organized by serial number. If you do not select any of
the organization boxes or select the Station ID box
instead of or in addition to the Seri al No. box, yo ur Dat a
window will look slightly different.
The upper right frame shows the content s of a data folder t hat is
selected in the Data frame. The lower right frame shows the
summary information for a data file that is selected in the upper
right frame.
The View Data control button is located at the bottom of the
lower right frame. The View Data button becomes active when a
data file is selected in the upper right frame. Clicking the View
Data button opens the selected data file and displays the data.
NOTE: If data is being viewed and the d ata fold ers are left open
before instrument downloading is done, close all fold ers
after downloading and re-open th em to be able to view
newly downloaded files.
Calibration History
The SC-01 is capable of saving calibration information for up to
the 20 most recent calibrations. This calibration history is
retrieved by the Data Logger Managemen t Program when a
complete download is performed. Instrument calibration history
is available in two separate locat ions. The informat ion regardi ng
the most recent successful calibration for each downloaded
34 • Viewing, Printing, Exporting, and Deleting Data in the Data Window
Page 35

instrument along with whether or not an instrument is due for
D
calibration can be accessed using the Last Calibration button
on the right side of the program window. See “Viewing, Printing,
and Deleting Data in the Last Calibration Window” on page 26
for a complete description of the information that can be
accessed by the Last Calibration button.
All downloaded calibration information for all downloaded
instruments is available in the Calibration History folders in the
Data window. This information is saved in a Calibration History
folder that is located in an untitled folder for each instrument.
The calibration history files are dif ferentia ted by instrument. The
calibration information available here is more comprehensive
than that in the Last Calibration window. The calibration
information for all calibrations downloaded, whet her successful
or not, is saved instead of just the most recent successful
calibration for each instrument.
To view the calibration history for an instrument in the database:
1. With the program already launched, click the Data control
button along the right side of the program window. The Data
window will appear.
ouble-click
to show
data folders
Click to
expand
folder
Click to
show Cal.
Histories
file
Cal.
Histories
file
Figure 23: Data Window - Selecting Calibration History Files
Viewing, Printing, Exporting, and Deleting Data in the Data Window • 35
Page 36

2. If necessary, double-click the SC-01 icon in the top of the
Data window’s upper left frame to see the folders of
downloaded data.
3. Find your instrument by serial number, then click the
Instrument folder’s expanded view symbo l (+) or double-click
the folder to view the contents.The t op folder is untitled and
contains the Calibration History folder along with folders for
alarm events, trouble events, and sensor change history.
The rest of the folders contain folders for the i nterval trend
files and alarm trend files and are named and organized by
date (month/year).
4. Click the expanded view symbol (+) of or double-click the
untitled folder. The Calibration History folder will appear
along with the Alarm Events, Trouble Events, and Sensor
Change History folders below the untitled folder.
5. Click the Calibration History folder. The Calibration Histories
file or files for that instrument will appear in the top right
frame. If multiple User ID’s are used for an instrument, then
more than one Calibration Histories file will appear.
6. Click the desired Calibration Histories file to select it. The
first nine calibrations saved will be listed in the bottom right
frame. If more than nine calibrations are saved, the total
number of calibrations is shown at the bottom of the list.
36 • Viewing, Printing, Exporting, and Deleting Data in the Data Window
Page 37

7. To view the Calibration Histories file, double click the
Calibration Histories file or click the View Data button.
Calibration Histories files can only be viewed in table format.
Figure 24: Data View - Calibration History
8. If you want to print the data, click the Print but ton. A Printer
List dialog box will appear for you to select a printer.
Figure 25: Printer List Dialog Box, Calibration History
9. Select a printer and click the OK button to print the data.
10.T o export the dat a for use in another application, for example
a spreadsheet, click the Export button. A “Save As” dialog
box will appear for you to specify the filename and file
location. The default file type is comma-separated values
(.csv).
Viewing, Printing, Exporting, and Deleting Data in the Data Window • 37
Page 38

Figure 26: Save as Dialog Box, Calibration History
11.A fter specifying t he file name, file location, and file type, click
the Save button to save the file to the specified location.
12.To go back and view other data, click the Return button on
the right side of the program window and select the data you
want to view.
Event Data
The SC-01 saves the 100 most recent alarm event s and the 100
most recent trouble event s. When an in strument is downl oaded,
the SC-01 Data Logger Management Program will ret rieve these
events from the instrument and save them in alarm event files
and trouble event files for each instrument that is downloaded.
Alarm event files save the date and time, gas, and alarm type of
every gas alarm event that occurs on a particular instrument.
Warn (alarm 1), al arm (alarm 2), STEL, TWA, and overscale
events are saved.
Trouble event files note the date and time, whether the event is
an instrument system failure or sensor failure and the specific
type of failure. Calibration failures and sensor failures are
38 • Viewing, Printing, Exporting, and Deleting Data in the Data Window
Page 39

D
ouble-click
to show
data folders
Click to
expand
folder
Click to
show
alarm
event files
among the trouble events that are saved.
To view the event data for any instrument in the database:
1. With the software already launched, click the Data control
button along the right side of the program window. The Data
window will appear.
Alarm event
file
Figure 27: Data Window - Selecting Event Data Files
2. If necessary, double-click the SC-01 icon in the top of the
Data window’s upper left frame to see the folders of
downloaded data.
3. Find your instrument by serial number, then click the
expanded view symbol (+) of or double-click the folder to
view the contents.The top folder is untit led and contains the
alarm event and trouble event folders along with folders for
calibration history and sensor change history. The rest of the
folders for each ser ial numbe r cont ain fol ders for th e int erval
trend files and the alarm trend files and are named and
organized by date (month/year).
4. Click the expanded view symbol (+) of or double-click the
untitled folder. The Alarm Events and Trouble Events folder
Viewing, Printing, Exporting, and Deleting Data in the Data Window • 39
Page 40

will appear below the untitled folder along with the
Calibration History and Sensor Change History folders.
5. Click the Alarm Events or T rouble Events folder. One or
more alarm or trouble event files will appear in the top right
frame. An Alarm Events folder has been opened in the
example in Figure 27. If multiple User ID’s are used for an
instrument, then more than one event file will appear.
6. Click the desired event file to select it. An event list will
appear in the bottom right frame with the date, time, gas
type, and specific event for the first nine events saved in the
selected file. If more than nine events are saved, the first
eight events are shown and the total number of events in the
file is shown at the bottom of the list.
7. Double-click the event file name to open the file and view it in
table format. Event fil es can only be viewed in table format.
Figure 28: Data View - Alarm Events
40 • Viewing, Printing, Exporting, and Deleting Data in the Data Window
Page 41

Figure 29: Data View - Trouble Events
8. If you want to print the data, click the Print but ton. A Print
dialog box will appear for you to select a printer.
Figure 30: Printer List Dialog Box, Event Data
9. Select a printer and click the OK button to print the data.
10. To export the data for use in another application, for
example a spreadsheet, click the Export button. A “Save As”
dialog box will appear for you to specify the filename and file
location. The default file type is comma-separated values
(.csv).
Viewing, Printing, Exporting, and Deleting Data in the Data Window • 41
Page 42

Figure 31: Save as Dialog Box, Event Data
11.A fter specifying t he file name, file location, and file type, click
the Save button to save the file to the specified location.
12.To go back and view other data, click the Return button on
the right side of the program window and select the data you
want to view.
Sensor Change History
The Data Logger Management Program constructs a sensor
history for each downloaded instrument by analyzing the
downloaded data from each instrumen t when it is downloaded.
All downloaded sensor change history information for all
downloaded instruments is available in the Sensor Change
History folders in the Data wi ndow . This information is saved in a
Sensor Change History folder that is located in an untitl ed folder
for each instrument. The sensor change history files are
differentiated by inst rument.
The sensor change history files save the date and time the
instrument was first turned on with a new sensor, the sensor
serial number, the gas type, and the full scale for each sensor
that has been used in the instrument.
42 • Viewing, Printing, Exporting, and Deleting Data in the Data Window
Page 43

D
ouble-click
to show
data folders
Click to
expand
folder
Click to
show
Sensor
Change
Histories
File
To view the sensor change history files for any instrument in the
database:
1. With the program already launched, click the Data control
button along the right side of the program window. The Data
window will appear.
Sensor
Change
Histories
File
Figure 32: Data Window - Selecting Calibration History Files
2. If necessary, double-click the SC-01 icon in the top of the
Data window’s upper left frame to see the folders of
downloaded data.
3. Find your instrument by serial number, then click the
expanded view symbol (+) of or double-click the folder to
view the contents.The top folder is untit led and contains the
Sensor Change History folder along with folders for
calibration history , al arm events, and trouble events. The rest
of the folders contain folders for the interval trend files and
alarm trend files and are named and organized by date
(month/year).
4. Click the expanded view symbol (+) of or double-click the
untitled folder. The Sensor Change History folder will appear
Viewing, Printing, Exporting, and Deleting Data in the Data Window • 43
Page 44

along with the Calibration History, Alarm Events, and T rouble
Events folders below the untitled folder .
5. Click the Sensor Change History folder. The Sensor Change
Histories file or files for that instrument will appear in the top
right frame. If multiple User ID’s are used for an instrument,
then more than one Sensor Change Histori es file wil l app ear.
6. Click the desired Sensor Change Histories file to select it.
The first ten sensor changes saved will be listed in the
bottom right frame. If more than ten sensor changes are
saved, then the first eight sensor changes are shown and the
total number of sensor ch anges is shown at the bottom of the
list.
7. To view the Sensor Change Histories file, double click the
Sensor Change Histories file or click the View Data button.
Sensor Change Histories files can only be viewed in table
format.
Figure 33: Data View - Sensor Change History
44 • Viewing, Printing, Exporting, and Deleting Data in the Data Window
Page 45

8. If you want to print the data, click the Print but ton. A Printer
List dialog box will appear for you to select a printer.
Figure 34: Printer List Dialog Box, Sensor History
9. Select a printer and click the OK button to print the data.
10. To export the data for use in another application, for
example a spreadsheet, click the Export button. A “Save As”
dialog box will appear for you to specify the filename and file
location. The default file type is comma-separated values
(csv.).
Figure 35: Save as Dialog Box, Sensor History
11.A fter specifying t he file name, file location, and file type, click
the Save button to save the file to the specified location.
12.To go back and view other data, click the Return button on
the upper right side of the Data window or click the Data
control button along the right side of the program window
and select the data you want to view.
Viewing, Printing, Exporting, and Deleting Data in the Data Window • 45
Page 46

Interval Trend Data
Average gas concentrations over the user defined interval trend
time are logged in the interval trend d at a files. The inte rval tr end
time is saved in the SC-01 and is set using the Set window (see
“Changing SC-01 Instrument Parameters” on p age 63). Events,
such as gas alarms or sensor failures, are saved in the data file
when they occur.
An interval trend file is created and saved in the SC-01 for an
operating session when the instrument is turned off. The serial
number and user ID that are saved in the instrument during an
operating session are saved for the corresp onding interva l trend
file. If the instrument’s serial number or user ID are changed,
any interval trend files that result from subsequent operating
sessions will have the new serial number or user ID saved in
them.
The data may be viewed either in table format or graph format.
Viewing data in graph format can only be done if at least 5
scheduled data points have been logged at the pro grammed
interval. This does not include events. If an interval data file has
fewer than five scheduled data points, the data cannot be
graphed.
46 • Viewing, Printing, Exporting, and Deleting Data in the Data Window
Page 47

Double-click
to show data
files
Click to
expand
folder
Click to show
interval trend
files
To view and perform desired operations with the interval trend
data files:
1. With the program already launched, click the Data control
button along the right side of the program window. The Data
window will appear.
Interval trend
files
Figure 36: Data Window - Selecting Interval Trend Data File s
2. If necessary, double-click the SC-01 icon in the top of the
Data window’s upper left frame to see the folders of
downloaded data.
3. Find your instrument by serial number, then click the
expanded view symbol (+) of or double-click the folder to
view the contents.The top folder is untit led and contains the
Calibration History, Alarm Event, Trouble Event, and Sensor
Change History folders. The rest of the folders contain
folders for the interval trend files and alarm trend files and
are named and organized by date (month/year).
4. Click the expanded view symbol (+) of or double-click the
dated folder whose contents you want to see.
5. Click on the Interval Trend folder. In the upper right frame of
the Data window, a list of file names will appear in the Name
Viewing, Printing, Exporting, and Deleting Data in the Data Window • 47
Page 48

column. A prefix of “iv” indicates an interval trend data file.
Click to save data to a file
w
Click to see events only
6. Click one of the interval trend data file names. A summary
will appear in the bottom right frame with instrument and
data file information. If you want to view, graph, print, or
export the interval trend data, double-click the filename or
click the View Data button at the bottom of the window.
7. Interval trend data can be viewed in either table or graph
format by selecting the Table or Graph selection but tons.The
example below shows the data in table format.
Select Table or
Graph view
Click to condense data
Click to print data
Click to show session
summary
Click to return
to Data windo
Figure 37: Interval Trend Data in Table Format
• In table format, the interval trend data is shown as the
average gas reading over the user defined interval. So if
the data logging session started at 4:13:38 PM and the
interval trend time is set to 1 minute, then the reading
48 • Viewing, Printing, Exporting, and Deleting Data in the Data Window
Page 49

logged at 4:14:38 PM is the averag e reading over tha t one
minute period.
• Events are displayed on the screen with the time of the
event. Events are displayed whether they occurred at
scheduled log times or in between them. Events include
gas alarms such as a warning conditio n, trouble conditions
such as a failed sensor or failed calibration, and an
indication that the unit is returning to “normal” condition
after an alarm has be en reset using the POWER butt on on
the SC-01.
• If you click the Summary button, the data window will split
into two frames, one above the other, with the data table in
the lower frame and the session summary information
shown in the upper frame. The session summary frame is
the same as the one shown in the lower right frame in
8. When the data is viewed in table format, if you move the
Alarm Trend
Cursor Symbol
Figure 36.
cursor over an alarm event, it will change i nto a small symbol
that looks like an alarm trend data file while it is kept over the
alarm event.
Figure 38: Alarm Trend Cur sor Sym bol
If you click on the event, the corresponding alarm trend data
file will be opened and displaye d in place of the interval tre nd
data file. No control buttons will be visible along the right side
Viewing, Printing, Exporting, and Deleting Data in the Data Window • 49
Page 50

of the window when alarm trend data is displayed in this way.
To return to the interval trend data file, click the Return
button.
Click to return to interval trend data
Figure 39: Data Displayed by Alarm Trend Cursor Symbol
9. To view only events in the interval trend data file, click the
Events On ly selection box to select it.
10.To view the interval trend data in condensed form, click the
Condensed selection box to select it. When the data is
condensed, the software shows only important and eventful
data as follows:
• The first and last scheduled data points in the session are
shown.
• All data point s that have a gas rea ding above 0 are sho wn.
• If there are more than two consecutive data points with a
gas reading of 0, only the first and last of these
consecutive data points are shown.
50 • Viewing, Printing, Exporting, and Deleting Data in the Data Window
Page 51

• All events, such as gas alarms or sensor failures, are
shown.
• For any event, the data point before and after the event is
always shown.
11.To view the data in graph format, click the Graph selection
button. Five or more scheduled data points are required in
an interval trend file to be able to display it in graph format.
NOTE: The data count shown when you have selected an
interval trend data file, as in Figure 36 above, can be
more than five if you have events, such as the GX-2003
going into and out of alarm, but you may not have five
scheduled data points.
Zoom level
Event select
Cursor select
Figure 40: Interval Trend Data in Graph Format
Viewing, Printing, Exporting, and Deleting Data in the Data Window • 51
Page 52

When viewing interval trend data in graph format, you have
several options:
• You can choose the zoom level, or displayed time period,
on the graph. The zoom feature shows greater detail
relative to time. Thus, the length of a time division on the
graph will depend on both the length of the datalogging
session and on the zoom factor.
• When the Event box is selected, the software displays the
events that occurred during the logg ing session on the
graph.
• When the Cursor box is selected, the software allows you
to display the gas reading and log time for each data point
one at a time. A vertical line on t he graph indicat es the left right position of the reading (the time). As you use the left
and right arrow buttons on your keyboard to move the line
across the graph horizontally, readings at specific log
times are displayed. You may also click on the graph and
the vertical line will move to the closest log time and the
reading for this log time will be shown on the graph. Use
the up and down arrows on the keyboard to move the
readings up or down on the screen.
• If you click the Summary button, the data window will split
into two frames one above the other with the graph in the
lower frame and the session summary information shown
in the upper frame. The session summary frame is the
same as the information shown in the lower right frame in
Figure 36.
12.To print the data, whether it is viewed in table or graph
format, click the Print button. A Print dialog box will appear
for you to select a printer.
Figure 41: Printer List Dialog Box, Interval Trend Data
52 • Viewing, Printing, Exporting, and Deleting Data in the Data Window
Page 53

13.Select a printer and click the OK button to print the data.
Data displayed in Graph view will print as a graph and data
displayed in Table view will print as a table.
14. To export the table or graph data to a fi le so it can be used
by another application, for example a spr ead sheet program,
click the Export button. A “Save As” dialog box will appear
for you to specify the filename, fil e location, and file t ype. For
Graph view the export file type is Windows bitmap (.bmp).
For Table view the default file type is comma-separated
values (.csv).
Figure 42: Save as Dialog Box, Interval Trend Data
15.After specifying the file name, file location, and file type, click
the Save button to save the file to the specified location.
16.To go back and view other data, click the Return button in
the upper right side of the data window or click the Data
control button along the middle right side of the program
window and select the data you want to view.
Viewing, Printing, Exporting, and Deleting Data in the Data Window • 53
Page 54

Alarm Trend Data
In addition to the interval trend data, the SC-01 also saves files
that describe the most recent gas alarm events. If a gas alarm
event occurs, then an alarm trend data file that is centered
around the event is saved separately fr om the interval trend data
files. It shows the gas reading up to 30 minutes before and 30
minutes after the event, with the log interval time every five
seconds. The gas reading logged at the time of the alarm event
is highlighted in red and the gas reading logged every 5 seconds
around the alarm event is the peak reading for the previous five
seconds. If the SC-01 has not been on for 30 minute s before the
alarm event occurs, the data during thi s time is left blank. If the
SC-01 is turned off less than 30 minute s after an alarm event
occurs, the data fil e will only have logged data until the unit was
turned off.
The SC-01 saves up to 8 alarm trend files. When an alarm event
triggers an alarm trend file to be sa ved, subsequent alarm
events must occur 15 minut es after the previous tri ggering event
in order to trigger the saving of another alarm trend file. If 8
alarm trend files are already saved in the SC-01’s memory, the
oldest alarm trend file is overwritten when a new alarm trend file
is saved. Alarm trend data can always be displayed in either
table or graph format.
54 • Viewing, Printing, Exporting, and Deleting Data in the Data Window
Page 55

Double-click
e
to show data
folders
Click to
xpand folder
Click to show
alarm trend
files
To view and perform desired operations with the alarm trend
files:
1. With the software already launched, click the Data control
button along the right side of the program window. The Data
window will appear.
Alarm trend
files
Figure 43: Data Window - Selecting Alarm Trend Data Files
2. If necessary, double-click the SC-01 icon in the top of the
Data window’s upper left frame to see the folders of
downloaded data.
3. Find your instrument by serial number, then click the
expanded view symbol (+) of or double-click the folder to
view the contents.The top folder is untit led and contains the
Calibration History, Alarm Event, Trouble Event, and Sensor
Change History folders. The rest of the folders contain
folders for the interval trend files and alarm trend files and
are named and organized by date (month/year).
4. Click the expanded view symbol (+) of or double-click the
dated folder whose contents you want to see.
5. Click on the Alarm Tren d folder in the uppe r lef t fra me. In the
Viewing, Printing, Exporting, and Deleting Data in the Data Window • 55
Page 56

upper right frame of the Data window, a list of file names will
o
appear in the Name column. A prefix of “al” indicates an
alarm trend data file.
6. Click one of the alarm trend data file names. A summary will
appear in the bottom righ t frame with instrument and data file
information. If you want to view, graph, print, or export the
alarm trend data, double-click the filename or click the View
Data button at the bottom of the window.
7. Alarm trend data can be viewed in either table or graph
format by selecting the Table or Graph selection buttons.
Select table or
graph view
Click to show session summary
Click to save data to a file
Click to print data
Click to return t
Data window
Alarm Event
Figure 44: Alarm Trend Data in Table Format
• In Table format, the gas reading at the time of the alarm
event around which the logged data are centered is
56 • Viewing, Printing, Exporting, and Deleting Data in the Data Window
Page 57

highlighted in red and is the instant aneous reading at that
time.
• The log times are shown along with the peak gas reading
for the previous five seconds.
• If you click the Summary button, the data window will split
into two frames, one above the other, with the data table in
the lower frame and the session summary information
shown in the upper frame. The session summary frame is
the same as the one shown in the lower right frame in
Figure 43.
8. To view the data in graph format, click the Graph button. An
alarm trend file can always be graphed regardless of the
number of logged points.
Zoom level
Event select
Cursor select
Figure 45: Alarm Trend Data in Graph Format
Viewing, Printing, Exporting, and Deleting Data in the Data Window • 57
Page 58

When viewing alarm trend data in graph format, you have
several options:
• You can choose the zoom level, or displayed time period,
on the graph. The zoom feature allows you to show
greater detail relative to ti me. Thus, the length of a time
division on the graph will depend on the zoom factor.
• When the Event box is selected, the program points out
on the graph the event that triggered the saving of the
alarm trend data file.
• When the Cursor box is selected, the program allows you
to display the gas reading and log time for each data point
one at a time. A vertical line on t he graph indicat es the left right position of the reading (the time). As you use the left
and right arrow buttons on your keyboard to move the line
across the graph horizontally, readings at specific log
times are displayed. You may also click on the graph and
the vertical line will move to the closest log time and the
reading for this log time will be shown on the graph. Use
the up and down arrows on the keyboard to move the
readings up or down on the screen.
• If you click the Summary button, the data window will split
into two frames one above the other with the graph in the
lower frame and the session summary information shown
in the upper frame. The session summary information is
the same as the information shown in th e lower right frame
in Figure 43.
9. To print the data, whether it is viewed in table or graph
format, click the Print button. A Print dialog box will appear
for you to select a printer.
Figure 46: Printer List Dialog Box, Alarm Trend Data
58 • Viewing, Printing, Exporting, and Deleting Data in the Data Window
Page 59

10.Select a printer and click the OK button to print the data.
Data displayed in Graph view will print as a graph and data
displayed in Table view will print as a table.
11.To export the t able or graph data to a file so it can be used by
another application, for example a spread sheet program,
click the Export button. A “Save As” dialog box will appear
for you to specify the filename, fil e location, and file t ype. For
Graph view the export file type is Windows bitmap (.bmp).
For Table view the default file type is comma-separated
values (.csv).
Figure 47: Save as Dialog Box, Alarm Trend Data
12.After specifying the file name, file location, and file type, click
the Save button to save the file to the specified location.
13.To go back and view other data, click the Return button in
the upper right side of the data window or click the Data
button along the right side of the program window and select
the data you want to view.
Viewing, Printing, Exporting, and Deleting Data in the Data Window • 59
Page 60

Deleting Data in the Data Window
The following items can be deleted in the Data window:
• Data folders
• Calibration History files
• Alarm and Trouble Event files
• Sensor Change History files
• Interval Tr end and Alarm Trend data files
To delete any of the above items in the Data Window:
1. With the program launched, click the Data control button on
the right side of the program window.
2. Find the data folder or data f ile you want to delet e.
3. Place the cursor on the data folder or data file you want to
delete and click it with the right mouse button. The Delete
box will appear.
4. Click Delete with the left mouse button. The Password
window appears.
Figure 48: Password Window
5. Enter the password and click the Continue button. The
password when the program is first installed in “rki”. The
password is case sensitive. See “Changing the Password”
on page 61 for instructions to change the password if
desired.
6. When the password has been entered and the Continue
button clicked, the Delete Data window (if a folder is selected
for deletion) or Delete Sample window (if a file is selected for
deletion) will appear asking you to confirm that you want to
delete the selected data folder or data file. In the example
60 • Viewing, Printing, Exporting, and Deleting Data in the Data Window
Page 61

below, the Delete Data window appears because an In terval
Tre nd data folder has been selected for deletion.
Figure 49: Delete Data Window
7. If you want to delete the selected item, click the Yes button.
The item will be deleted by the program.
If you do not want to delete the selected item, click the No
button and the operation will be cancelled.
Changing the Password
CAUTION: Changing the password requires use of the Delete
box. Take care to avoid accidentally delet ing dat a if
you decide to change the password.
It is possible to change the password as follows:
1. Right-click a data folder, data file, or event file. The Delete
box will appear.
2. Click Delete with the left mouse button. The Password
window appears.
Figure 50: Password Window
Viewing, Printing, Exporting, and Deleting Data in the Data Window • 61
Page 62

3. Click the Change Password button. The Password window
asks you to input the current password.
Figure 51: Inputting Current Password
4. T ype the current p assword, then click the Current password
button. The Password window asks you to input the new
password.
Figure 52: Inputting New Password
5. T ype the new password and click th e New Password button.
The Password window asks you to input new password
again to confirm it.
Figure 53: Confirming New Password
6. Type the new password again, then click the Confirm New
Password button.
7. Click OK when the pro gram confirms that you have changed
the password.
8. Close the Password window by clicking the red “X” in the
upper right corner of the window.
62 • Viewing, Printing, Exporting, and Deleting Data in the Data Window
Page 63

Changing SC-01 Instrument Parameters
To make changes to parameters stored in the SC-01, use the
SC-01 Data Logger Management Program’ s Set window. Follow
the steps below to make these changes.
1. Launch the SC-01 Data Logger Management Program.
2. If the Automatic Download selection box is selected,
deselect it.
Automatic Download Box, Deselected
Figure 54: Automatic Download Selection Box
3. Connect an SC-01 to the program. See “Downloading Data
from the SC-01” on page 19, instruction 1 through in struction
6, to connect an instrument to the program.
4. Once the connection is made, the Complete Download,
Instrument Information, and Power Off download
commands will be selectable. Click the Instrument
Information download command to retrieve the inst rument
information from the SC-01. If you wish to download data
before making changes, click Complete Download instead
of Instrument Information.
Changing SC-01 Instrument Parameters • 63
Page 64

5. Click the Set button to display the Set window. Use the SC01 Status frame to change parameters stored in the SC-01.
Click to
upload
changes to
GX-2003
6. To change the serial number or user ID stored in the SC-01,
7. To change the datalogging interval trend time, click on the
Figure 55: Set Window
click the field you wish to change (e.g., user ID), use the
backspace key to remove the current entry, then type the
new information.
down arrow in the Interval Trend Time field and se lect the
desired interval trend time i n seconds. The available choices
are 10, 20, 30, 60, 180, 300, and 600 seconds.
64 • Changing SC-01 Instrument Parameters
Page 65

8. After you have finished entering new parameters, you must
upload this information to the SC-01 by clicking the Update
button, then confirm that you want to update the informati on
by clicking the Yes button when the Update window appears.
Figure 56: Update Window
9. To update the SC-01’s date and time to match the
computer’s, click the Date/Time Set button and then click
the Yes button when the Update window appears.
10.If you wish to use other functions in the software, click the
appropriate control button along the right side of the program
window.
11.If you wish to exit the software, click the Download control
button to return to the Download window. Turn off the SC-01
by using the POWER button on the SC-01 or by clicking the
program’s Power Off control button and confirming that you
want to turn off the SC-01 when the Power Off window
appears. Then click the Exit button to exit the program.
Changing SC-01 Instrument Parameters • 65
Page 66

Changing the Appearance
Click to change font type
of the Program Screens
To change how information is displayed in the software (e.g.,
text font and graph color), use the pro gram’s Set window. Follow
the steps below to make changes.
1. Launch the SC-01 Data Logger Management Program.
2. Click the Set button to display the Set window. Use the Font
And Color frame in the left side of the window to change
fonts and graph colors.
Choose the Graph Color option to change the
graph color for graph format of data
Figure 57: Set Window, Changing Fonts and Graph Colors
3. Specify new fonts by clicking the button with the name of a
font inscribed on it. This action will display the Font window.
Choose the font type, style, and size, then click OK.
66 • Changing the Appearance of the Program Screens
Page 67

Figure 58: Font Window
4. Select the color used to graph the data in the interval trend
and alarm trend data files by clicki ng the Graph Col or button
on the left side of the Set window in the Font and Color
frame.
Figure 59: Color and Custom Color Windows
Changing the Appearance of the Program Screens • 67
Page 68

• The Color window shown on the left above appears when
the Graph Color button is clicked.
• If you want to define a custom color, click the Define
Custom Colors button and the Custom Color window
shown on the right above replaces the Color window.
5. After making the desired changes, click OK.
6. The changes you have made will take effect after you exit
and restart the SC-01 Data Logger Management Program.
Spare Parts List
Table 2: Spare Parts List
Part Number Description
47-5026RK Cable, serial/IrDA adapter
49-5027RK Cable, USB/IrDA adapter
71-0136RK SC-01 Operator’s Manual
71-0138RK SC-01 Data Logger Management Program Operator’s
Manual (this document)
82-5011RK-SER Data Logging Package for SC-01, installation CD and
IrDA/Serial cable
82-5011RK-USB Data Logging Package for SC-01, installation CD and
IrDA/USB cable
83-0010RK SC-01 Data Logger Management Program Installation
CD (includes Data Logger Management Program Operator’s Manual and SC-01 Operator’s Manual)
68 • Spare Parts Li st
 Loading...