

Page 1

Model GX-2001
Data Logging Software
User’s Guide
Part Number: 71-0056RK
Edition: First
Released: 6/29/2001
Page 2

Warranty
RKI Instruments, Inc., warrants gas alarm equipment sold by us to be free
from defects in materials and workmanship, and performance for a period
of one year from date of shipment from RKI Instruments, Inc. Any parts
found def ective within that period will be repaired or replaced, at our option,
free of charge. This warranty does not apply to those items which by their
nature are subject to deterioration or consumption in normal service, and
which must be cleaned, repaired, or replaced on a routine basis. Examples
of such items are:
Absorbent cartridges Batteries
Pump diaphragms and valves Filter elements
Fuses
Warranty is voided by abuse including mechanical damage, alteration,
rough handling, or repairs procedures not in accordance with the
instruction manual. This warranty indicates the full extent of our liability, and
we are not responsible f or remov al or replacement costs, local repair costs ,
transportation costs, or contingent expenses incurred without our prior
approval.
T
HIS WARRANTY IS EXPRESSLY IN LIEU OF ANY AND ALL
AND
REPRESENTATIONS
OR
LIABILITIES
LIMITED
PARTICULAR
FOR
CONNECTED
FUNCTION
TO
INDIRECT
OR
THE
ON
WARRANTY
PURPOSE
,
INCIDENTAL
WITH
OPERATE
THE
THE
,
EXPRESSED
PART
OF
OF
. I
N
NO
,
OR
USE
OF
PROPERLY
OR
IMPLIED
RKI I
MERCHANTABILITY
EVENT
CONSEQUENTIAL
ITS
NSTRUMENTS
SHALL
PRODUCTS
RKI I
.
,
NSTRUMENTS
LOSS
OR
FAILURE
AND
, I
OR
OTHER
ALL
OTHER
NC
.,
INCLUDING
FITNESS
OR
DAMAGE
OF
WARRANTIES
OBLIGATIONS
BUT
FOR
A
, I
NC
.,
OF
ITS
PRODUCTS
BE
ANY
NOT
LIABLE
KIND
TO
This warranty covers instruments and parts sold to users only by
authorized distributors, dealers, and representatives as appointed by RKI
Instruments, Inc.
We do not assume indemnification for any accident or damage caused by
the operation of this gas monitor and our warranty is limited to replacement
of parts or our complete goods.
2 • Warranty Data Logging Software User’s Guide
Page 3

Table of Contents
Introduction . . . . . . . . . . . . . . . . . . . . . . . . . . . . . . . . . . . . . . . . . . . . . . . . . . . . . . . . . .4
System Requirements. . . . . . . . . . . . . . . . . . . . . . . . . . . . . . . . . . . . . . . . . . . . . . . . . . 5
Overview of the Data Logging Software . . . . . . . . . . . . . . . . . . . . . . . . . . . . . . . . . . . 5
Types of Information Provided. . . . . . . . . . . . . . . . . . . . . . . . . . . . . . . . . . . . . . . . 5
A Road Map of the Software. . . . . . . . . . . . . . . . . . . . . . . . . . . . . . . . . . . . . . . . 10
Installing the Software. . . . . . . . . . . . . . . . . . . . . . . . . . . . . . . . . . . . . . . . . . . . . . . . . 11
Launching the Software . . . . . . . . . . . . . . . . . . . . . . . . . . . . . . . . . . . . . . . . . . . . . . . 11
Installing the Hardware . . . . . . . . . . . . . . . . . . . . . . . . . . . . . . . . . . . . . . . . . . . . . . . . 12
Down Loading Data from the Model GX-2001. . . . . . . . . . . . . . . . . . . . . . . . . . . . . . 13
Viewing, Printing, Exporting, and Deleting Data. . . . . . . . . . . . . . . . . . . . . . . . . . . . 16
Viewing Instrument Information. . . . . . . . . . . . . . . . . . . . . . . . . . . . . . . . . . . . . . 16
Viewing Interval and Alarm Data. . . . . . . . . . . . . . . . . . . . . . . . . . . . . . . . . . . . . 17
Viewing Calibration History. . . . . . . . . . . . . . . . . . . . . . . . . . . . . . . . . . . . . . . . . 20
Printing and Exporting Data . . . . . . . . . . . . . . . . . . . . . . . . . . . . . . . . . . . . . . . . 21
Deleting Data . . . . . . . . . . . . . . . . . . . . . . . . . . . . . . . . . . . . . . . . . . . . . . . . . . . 23
Changing Data Logging Parameters . . . . . . . . . . . . . . . . . . . . . . . . . . . . . . . . . . . . . 24
Calibrating the Model GX-2001. . . . . . . . . . . . . . . . . . . . . . . . . . . . . . . . . . . . . . . . . . 27
Parts List. . . . . . . . . . . . . . . . . . . . . . . . . . . . . . . . . . . . . . . . . . . . . . . . . . . . . . . . . . . .27
WARNING: Understand this manual before using the GX-2001 Data
Logging Software. Also read and understand the Model
GX-2001 Operator’s Manual included with the Model GX2001 portable gas detection unit.
Data Logging Software User’s Guide Table of Contents • 3
Page 4

Introduction
Using an advanced detection system consisting of four gas sensors, the
Model GX-2001 Personal Four-Gas Monitor detects the presence of
combustible gases, oxygen (O
sulfide (H
easy-to-use design makes it ideally suited for a wide r ange of applications,
as described in the Model GX-2001 Operator’s Manual, which you should
read first before using the GX-2001 Data Logging/Charger Station and
Software.
The Data Logging/Charger Station and Software (RKI part number 492156RK) down loads stored data in the Model GX-2001 to a Windowsbased PC. After the data has been downloaded, you can view, save, or
print it using your computer and the Data Logging Software. The Data
Logging/Charger Station and Software also calibrates the Model GX-2001
by setting the zero and the span. To set the span, you will also need to use
a calibration kit, as described in the Model GX-2001 Operator’s Manual.
And while the Model GX-2001 is placed in the Data Logging/Charger
Station, its battery is recharged, provided the Model GX-2001 has been
turn on.
), carbon monoxide (CO), and hydrogen
2
S) simultaneously. The Model GX-2001’s compact size and
2
The purpose of this manual is to explain how to use and set up the Data
Logging/Charger Station and Software. You will learn how to
• install and launch the software
• install the hardware
• down load data from the Model GX-2001
• view, print, and save data
• change data logging parameters
• calibrate the Model GX-2001
Before you get started, be sure to review system requirements in the next
section and to read “Overview of the Data Logging Software,” which tells
you what information the software provides and how it works.
WARNING: The Model GX-2001 detects oxygen deficiency and
elevated levels of oxygen, combustible gases, carbon
monoxide, and hydrogen sulfide, all of which can be
dangerous or life threatening. When using the Model GX2001, you must follow the instructions and warnings in
the Model GX-2001 Operator’s Manual to assure proper
and safe operation of the unit and to minimize the risk of
personal injury.
4 • Introduction Data Logging Software User’s Guide
Page 5

System Requirements
•
To use the Data Logging/Charger Station and Software, your personal computer
must meet the following requirements:
Operating Systems: Windows
Windows
Processor: IBM
•
Pentium
®
2000, or Windows NT
®
compatible PC running Pentium
®
4 processor, or equivalent processor.
• Memory: 8 MB RAM minimum
• Hard Disk Space: 20 MB minimum
• CD-ROM Drive
Overview of the Data Logging
Software
The Model GX-2001 is a gas monitoring device for combustible gases, O
CO, and H
explosive limit (% LEL), O
as parts per million (ppm). The Model GX-2001 also records STEL and
TWA readings for H2S and CO.
S. It measures combustible gases as a percentage of the lower
2
as a straight percentage (%), and H2S and CO
2
®
95, Windows
®
4.0
®
98 SE, Windows
®
2, Pentium
®
ME,
®
3, or
,
2
STEL is an acronym for short-term exposure limit, and it shows the av erage
reading for H
time-weighted average, and it shows the average reading for H
S and CO during the last 15 minutes. TWA is an acronym for
2
S and CO
2
during the last eight (8) hours.
This, and other information (e.g., calibration history), is recorded by the
Model GX-2001 and is stored in the unit’s on-board memory. The GX-2001
Data Logging/Charger Station and Software down loads this information to
your computer for viewing, printing, and saving.
Types of Information Provided
The Data Logging Software provides inf ormation about gas concentrations,
alarm trends, calibration history, and instrument data. This section of the
manual has sample data screens along with a “road map” of the Data
Logging software to help you become better acquainted with how the Data
Logging Software works.
Data Logging Software User’s Guide System Requirements • 5
Page 6
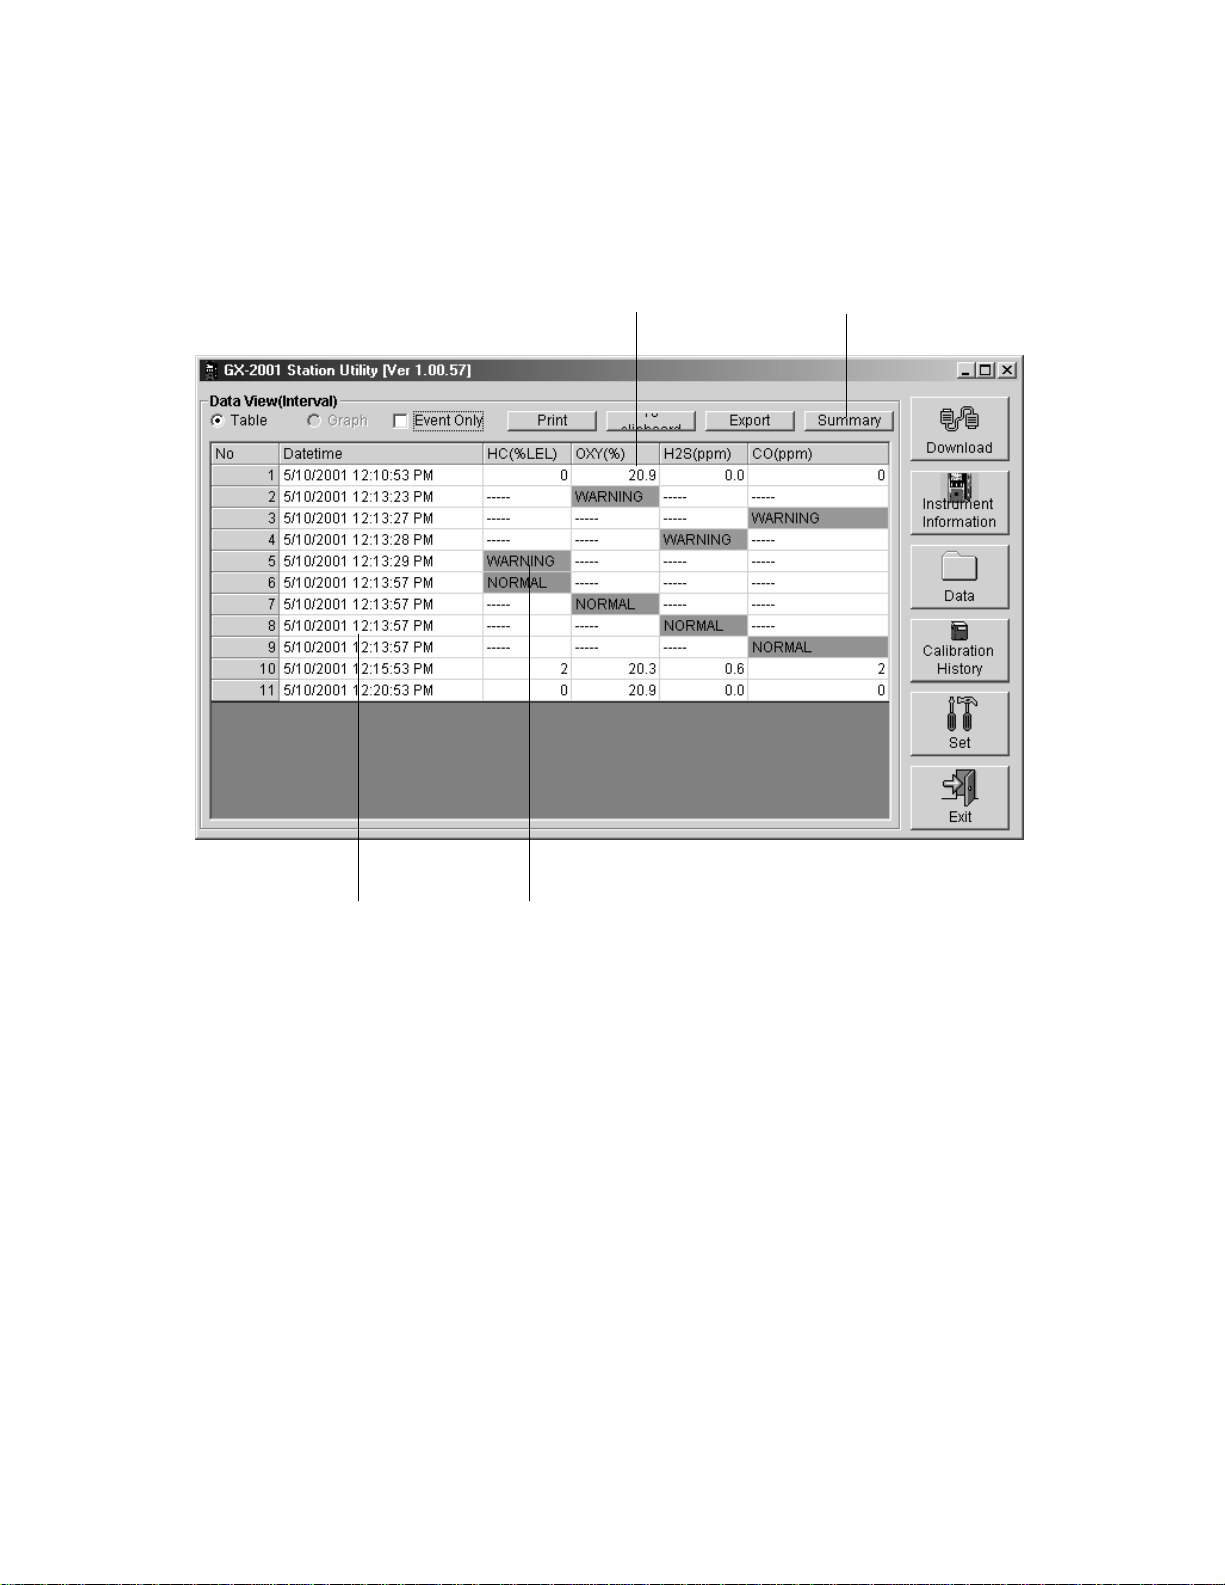
Interval T rend Data
Gas concentrations are logged over fiv e minute time intervals in the interval
trend data files. Events are saved when they occur. The data may be
viewed in table format, as seen in the following figure, or graph format.
Time log
(date and time)
Gas concentrations
Warning levels
Provides summary data
Figure 1. Data View (Interval) Window Showing Gas Concentrations
The above information was obtained after the Model GX-2001 recorded
gas concentration lev els in the monitoring area. The unit w as then placed in
the Data Logging/Charger Station and the information stored in the unit’s
memory was down loaded to the computer. From the main window of the
Data Logging Software, the Data Icon was “clicked” (using the computer
mouse) to display the main Data window, from which this screen was
displayed.
For a given data session (interval data), there must be at least five
scheduled logs (every five minutes) for the data to be seen in graphical
form. If an interval data session has fewer than five scheduled logs, as in
Figure 1 above, the graph button is not available for selection.
Note that the data count shown when you have selected an interval data
file, as in Figure 1abov e , can be more than five if you have events, such as
6 • Overview of the Data Logging Software Data Logging Software User’s
Page 7
the Model GX-2001 going into and out of alarm, but you may not have five
scheduled log times.
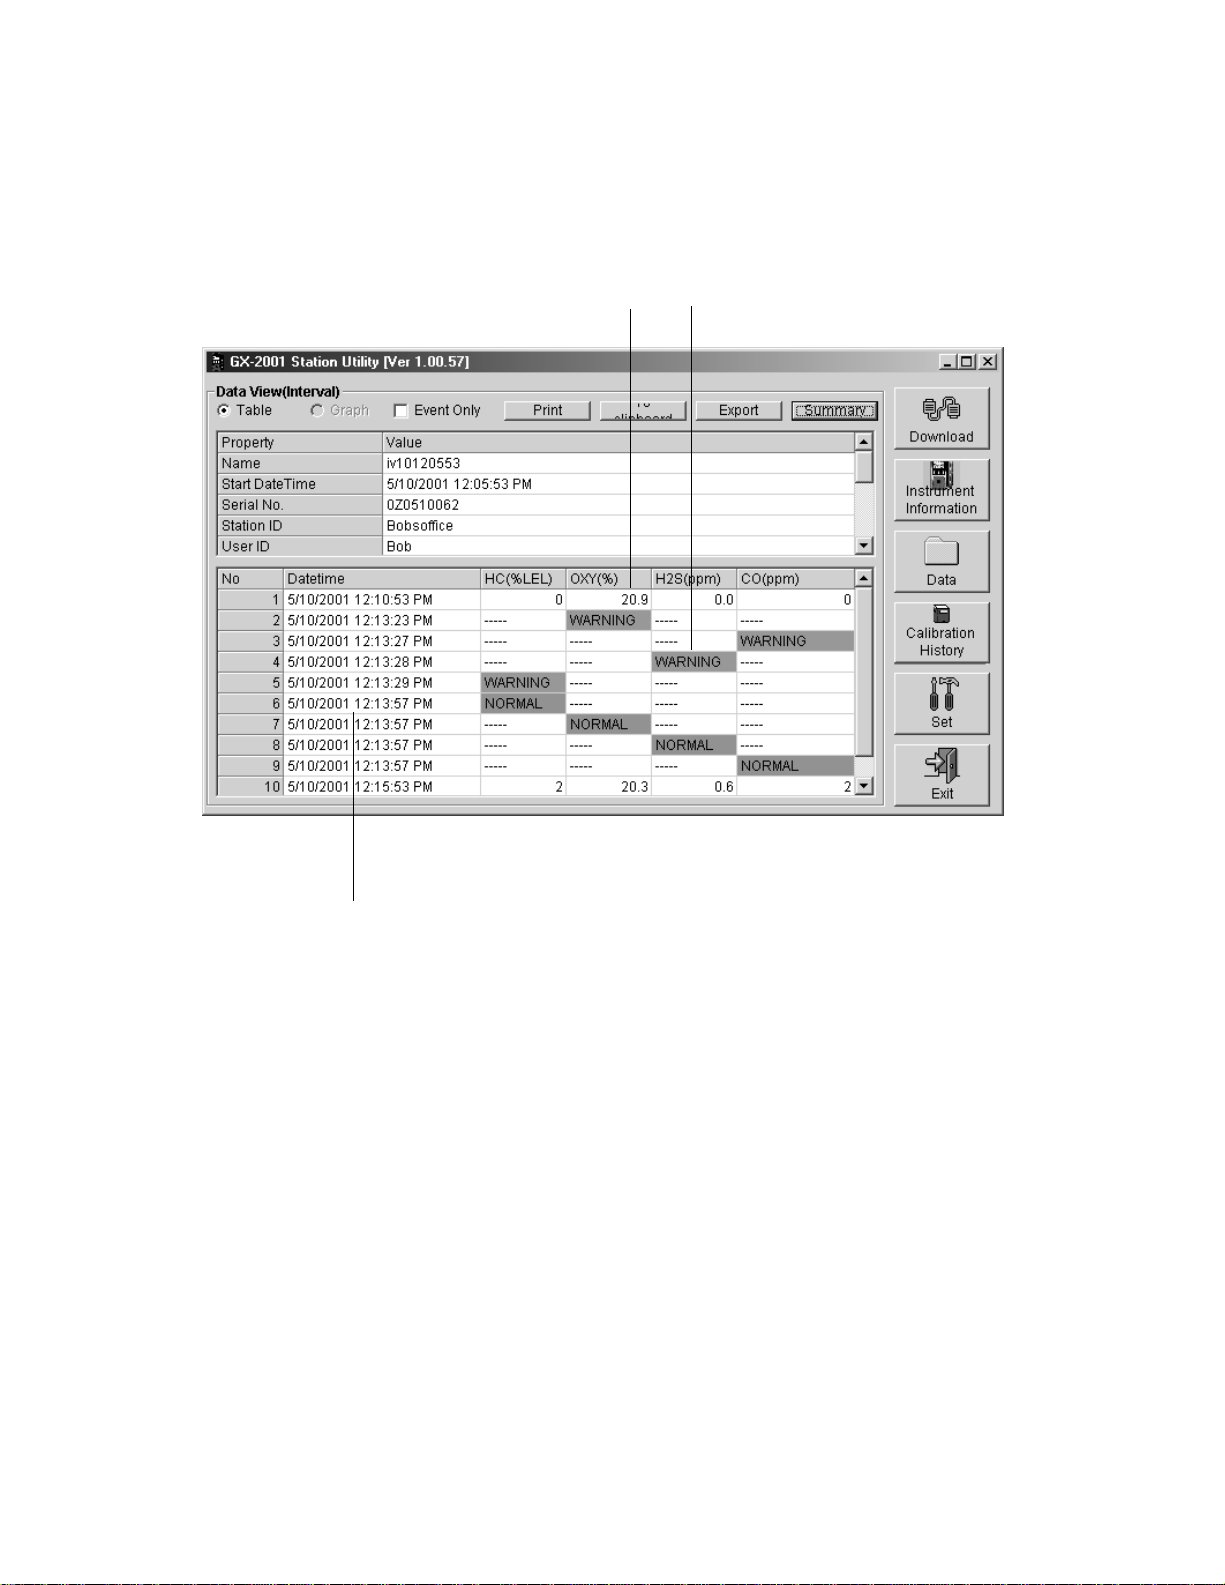
The information on the previous page can also be displayed in summary
form by clicking the Summary button.
Time log
(date and time)
Gas concentrations
Warning levels
Figure 2. Data View (Interval) Summary Window
Alarm T rend Data
In addition to the interval trend data the GX-2001 also saves a file which
describes the most recent event during a particular session.If an event
occurs, then an alarm trend file is saved separately from the data file , which
shows the reading 15 minutes before and 15 minutes after the event, with
the log time every five seconds.
When an event occurs and an alarm trend data file is saved in the GX2001, this file remains in the unit’s memory until another event occurs.
When another event occurs , the alarm trend data file is ov erwritten with the
new event’s information.
Alarm trend data can always be displayed in either table and graph format.
Data Logging Software User’s Guide Overview of the Data Logging Software • 7
Page 8
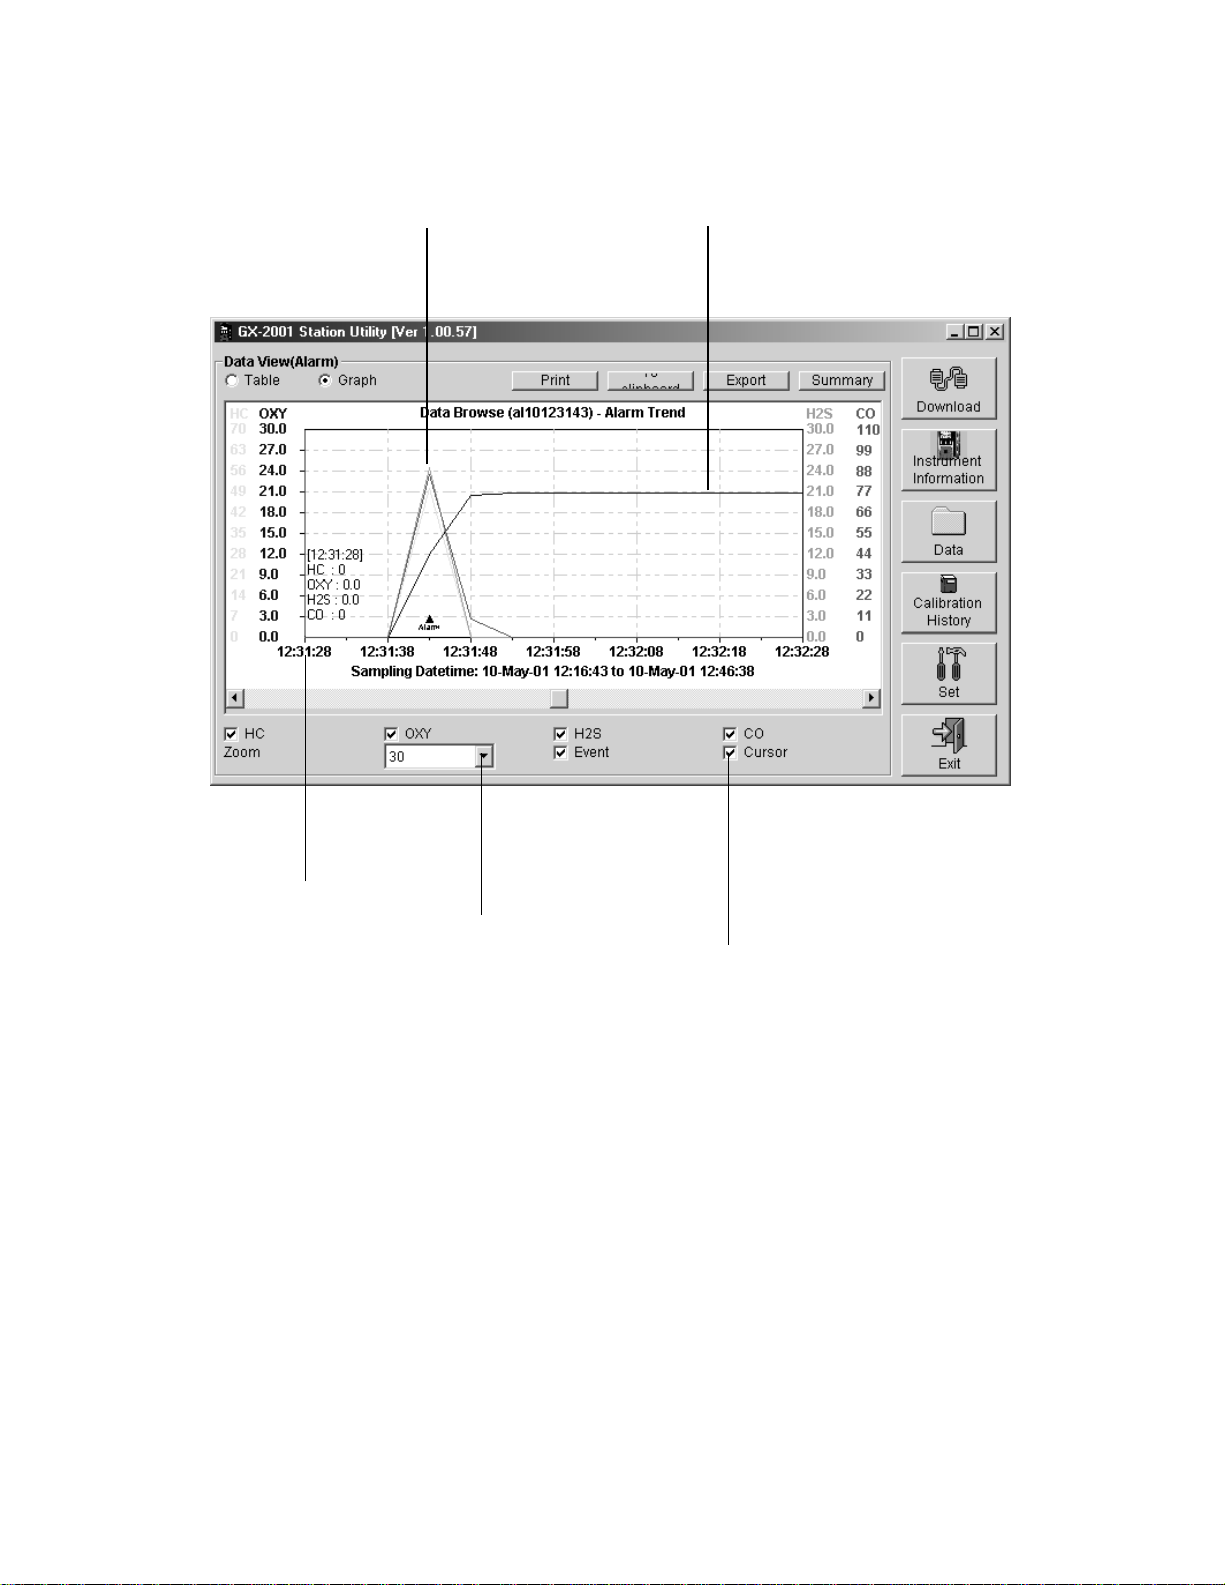
The following figure shows a sample graph of the four target gases, an
alarm event, and the concentrations of two target gases during the alarm
event.
Alarm event
and gas
concentration
Gas concentration
data
For interval data,
zoom shows greater
detail of information
relative to time
Cursor function activated;
move scroll bar to see
gas concentrations over
time
Time log
Time intervals
for alarm trend
Figure 3. Data View (Alarm) Showing Gas Concentrations at the Alarm Event
Instrument Information and Calibration History
Calibration History on the most recent successful calibration for the GX2001 is available on two screens: the Calibration History and the
Instrument Information windows. The Instrument Information window also
shows warning lev els and alarm lev els along with STEL and TW A readings .
Both windows, with sample data, are shown on the next page.
8 • Overview of the Data Logging Software Data Logging Software User’s
Page 9
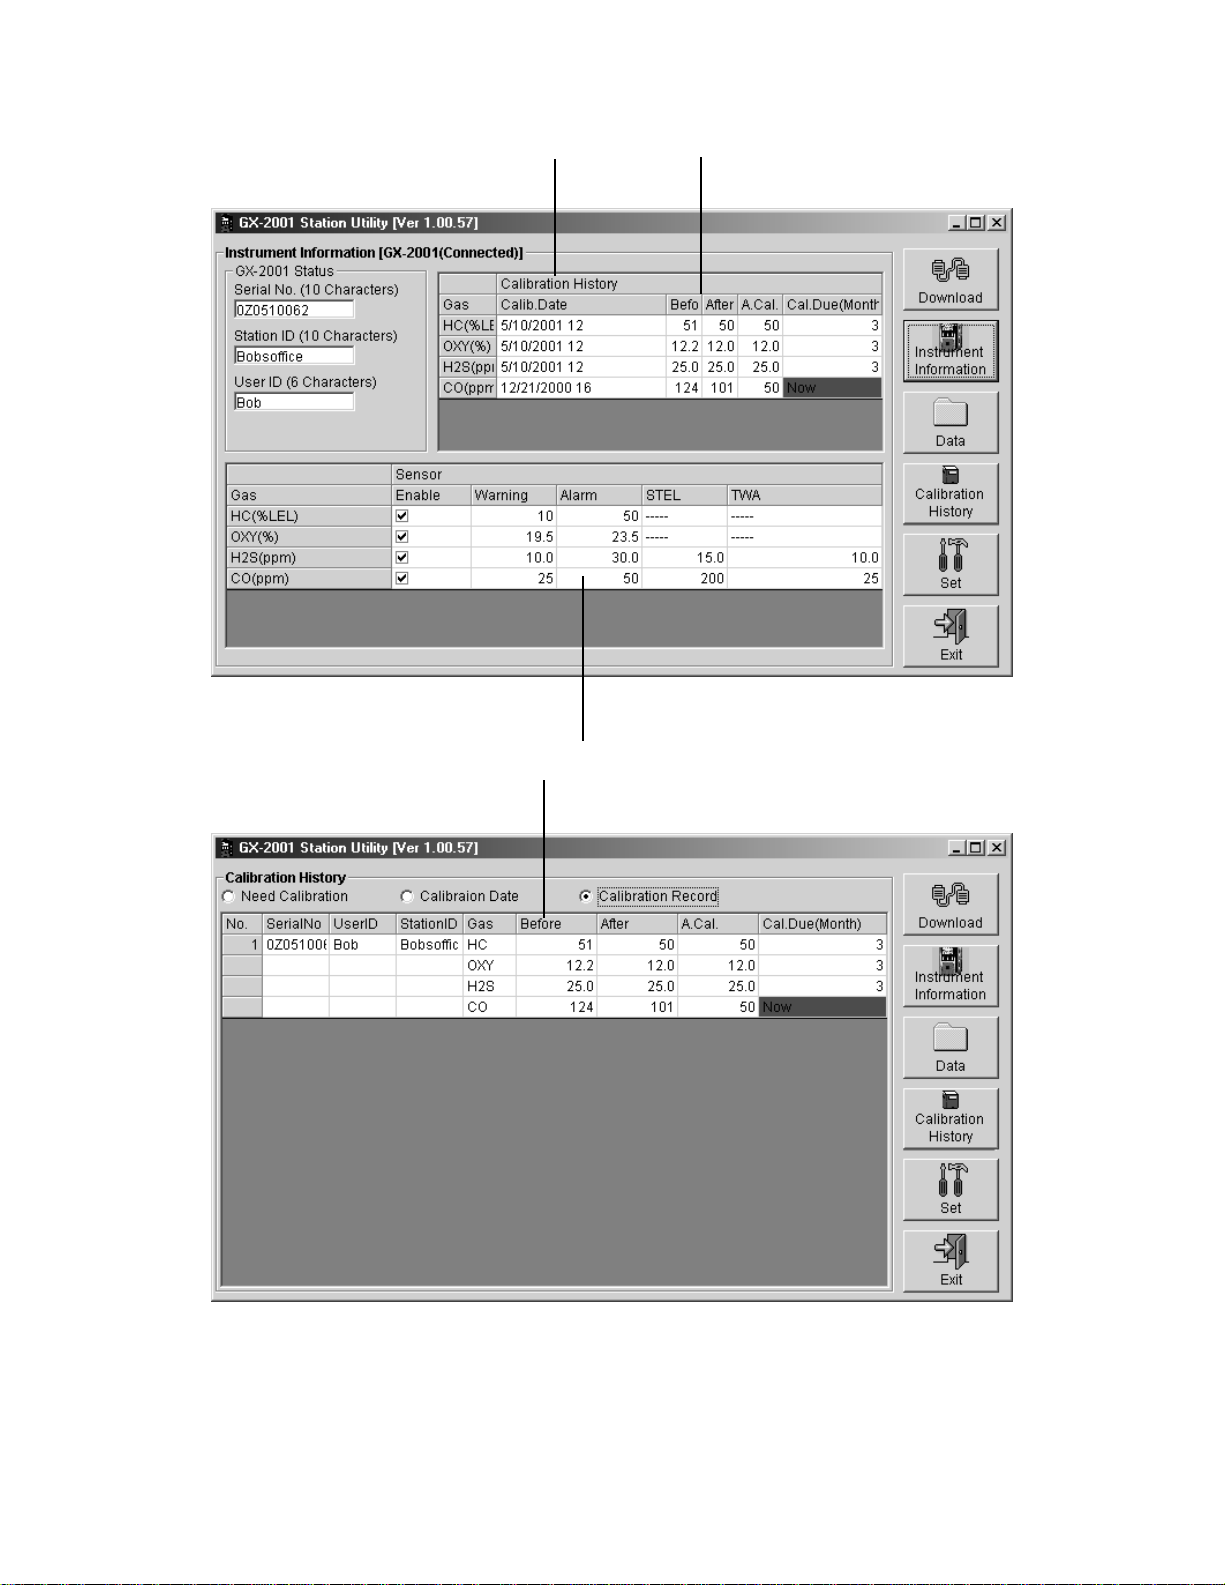
Calibration history data
Warning, alarm, STEL,
and TWA settings
Before and after calibration settings
Before and after calibration settings
Figure 4. Instrument Information and Calibration History Windows
Data Logging Software User’s Guide Overview of the Data Logging Software • 9
Page 10

A Road Map of the Software
The windows on the previous pages are accessed through the Download
window of the GX-2001 Data Logging Software. The Download window is
the starting point for all Data Logging Software functions, and it is the first
screen displayed when you launch the software. The figure below shows
the various screens that you can access when you clic k the icon b uttons on
the right of the Download window.
Figure 5. The Software Screens That Are Displayed from the Download Window
10 • Overview of the Data Logging Software Data Logging Software User’s
Page 11

Installing the Software
1. Launch Windows®.
2. Exit from all applications and open windows.
3. Insert the GX-2001 Data Logging Software CD into your computer’s
CD-ROM drive. A dialog box displays confirming that you have quit all
running applications. Click “OK” to continue.
4. Read and accept the software license agreement, then Click “Next.”
5. To install the GX-2001 Data Logging Software in the default directory
(C:/Programs/GX-2001), click the Computer Icon. Otherwise, choose a
new installation directory now.
6. If during software installation the Setup program finds newer versions of
Windows files on your computer, it will ask you to keep these newer
files. Click “Yes” to do so.
7. Follow the on-screen instructions to complete software installation.
Launching the Software
1. Click Start on the Windows Icon Tray, then select “Programs/GX-2001.”
2. Click “GX-2001.” The Download window displays.
Figure 6. The Download Window
3. For convenience, make a shortcut of the GX-2001 Data Logging
Software program and place it on the Windows desktop. See your
Windows documentation for information about making shortcuts.
Data Logging Software User’s Guide Installing the Software • 11
Page 12

Installing the Hardware
1. Launch Windows.
2. Connect one end of the GX-2001 serial cable to the serial (COM1) port
of your computer. You can use any active COM port, COM1 through
COM 4.
3. Connect the other end of the serial cable to the GX-2001 Data Logging/
Charger Station.
GX-2001
Serial Port
Charger/
downloading station
Figure 7. Connecting to the Serial Port on the Data Logging Station
4. Plug the GX-2001 Data Logging/Charger Station. Power cord into an
AC wall socket.
12 • Installing the Hardware Data Logging Software User’s Guide
Page 13

Down Loading Data from the
GX- 2001
You have the option of down loading data manually or automatically.
If you down load information using the automatic feature, click the
checkbox, “Automatic Download,” in the Download Window before placing
the Model GX-2001 in the Data Logging Station. Remember that the
Instrument Information screen will remain blank after Automatic
Downloading is selected.
Click here for
automatic
downloads
Figure 8. Automatic Download Checkbox
NOTE: Before you attempt to down load data, make sure you have
installed the GX-2001 Data Logging Software and hav e connected
the serial data cable between the Data Logging Station and the
computer.
1. Launch the GX-2001 Data Logging Software. The Download Window
displays.
2. Place the GX-2001 into the Data Logging Station.
3. Choose the COM port on the computer to which you have connected
the Data Logging Station.
NOTE: The software includes a Cal.Unit Calibration button between the
Clear Data button and the P ower Off b utton which is not shown in
this manual. This button is for use with the RKI Automatic
Calibration Station which is under development. If this button is
accidentally clicked, click the Cancel button which appears in
Automatic Calibration Mode screen.
Data Logging Software User’s Guide Down Loading Data from the • 13
Page 14

4. Press the Mode/Power button on
the Model GX-2001. “Conn”
displays on the Model GX-2001
LCD and “GX-2001...Connected
Successful.” displays in the
Download area of the Download
window.
5. If you have selected “Automatic
Download,” the downloading
process begins automatically
after you have placed the Model
GX-2001 in the Data Logging
Station and after you hav e turned
on the unit by pressing the Mode/
Power button.
6. If you are going to down load data
manually, you can down load all
information at once, or you can
load only the information you
want.
Figure 9. Connection Message
• To download instrument
information only, click
“Instrument Information.”
• To download interval
information, click “Interval
Download.”
• To download alarm trend data
only, click “Alarm Trend.”
7. After the data has been down
loaded successfully, messages
are displayed in the Download
area of the Download window.
(See the figure on the following
page.) These messages tell you
what type of information has been
down loaded.
Figure 10. Download Options
14 • Down Loading Data from the Data Logging Software User’s Guide
Page 15

Download
messages
Use to
download
all data
Instrument
data
Use to
download
subsets of
the data
Clear data
button
Figure 11. Download Messages in the Download Window
8. You can view, print, or save the downloaded information. Or you can
delete all the data in the Model GX-2001 by clicking the “Clear Data”
button.
WARNING: If you click the Clear Data button, all data is erased in the
Model GX-2001, but not in your computer’s memory. So
it’s advisable that you save the data to your hard drive
first before deleting the data.
Data Logging Software User’s Guide Down Loading Data from the • 15
Page 16

Viewing, Printing, and Saving
Data
You can view instrument information, interval data, alarm data, and
calibration history. Note that you can only print and save interval and alarm
data.
Viewing Instrument Information
To view instrument information, click the Instrument Information button on
the Download window. The Instrument Information window displays.
Remember that you cannot save or print this information.
Figure 12. Instrument Information Window
16 • Viewing, Printing, and Saving Data Data Logging Software User’s Guide
Page 17

Double-click
to see the
data files
Check to
organize
files
Viewing Interval and Alarm Data
To view interval and alarm data, click the Data button on the Download
window. The Data window displays.
Click to
expand
folder
Click to
display
files
Figure 13. Data Window
To see the data, do the following:
1. Double-click the GX-2001 icon in the Data area of the Data window to
see the files holding the interval and alarm data.
2. To view interval or alarm data files (not the actual data), click the
interval folder or the alarm folder, respectively.
Double
click
to display
data
Session
Information
Click to
display
files
Figure 14. Viewing Expanded Files
Data Logging Software User’s Guide Viewing, Printing, and Saving Data • 17
Page 18

3. Next double-click a file to view its contents, or click the View Data
button.
4. When viewing interval data, you can see the information in a table
format, graph the data if there are more than five scheduled data points ,
view the data in summary form, or view the events only. Data that has
been graphed shows log time, gas concentration levels, and alarm
events.
Interval Data
Interval Data with Summary
Figure 15. Interval Data Displayed
18 • Viewing, Printing, and Saving Data Data Logging Software User’s Guide
Page 19

5. When viewing alarm data, you can see it either in table or graph form.
Zoom level
Click to print
data
Click to transfer data
to a file
Click for a summary
of the data
Cursor feature
Figure 16. Alarm Data in Graph Form
6. In graph form, five or more events are required. When viewing interval
trend or alarm trend information in graph form, you have several
options:
• You can choose which gas you want to graph
• You can choose the zoom level, or time interval, on the graph. For
alarm trend data, the zoom will always correspond to a particular
time division because alarm data files have the same number of
data points over the same period of time (every five seconds for 15
minutes before and 15 minutes after an event). For interval data, the
zoom feature shows greater detail relative to time. Thus, an interval
on the graph will depend on both the length of the datalogging
session and on the zoom factor.
Data Logging Software User’s Guide Viewing, Printing, and Saving Data • 19
Page 20

• Note that the Cursor feature (applies to both interval and alarm data
files) allows you to display the log time. As you use the scroll arrow
to move across the graph from left to right, readings at specific log
times are displayed.
7. To go back and view other data, click the Data button on the Download
window.
Viewing Calibration History
To view calibration data, click the Calibration History Button on the
Download window. The Calibration History window displays.
Figure 17. Calibration History Information
20 • Viewing, Printing, and Saving Data Data Logging Software User’s Guide
Page 21

Printing and Exporting Data
To print your interval and alarm data, do the following:
1. From the Display window, double-click the data file you want to print.
(You can also click (select) the file you want to print, then click the View
Data button.) You can only print one file at a time. The Data View
window displays.
Figure 18. Printing and Saving Data Through the Data View Window
2. Click the Print button.
3. In the Printer dialog box, choose the printer to which you would like to
print, then click the Print button.
To export interval and alarm data, do the following:
1. From the Display window, double-click the data file you want to export.
(You can also click (select) the file you want to export, then click the
View Data button.) You can only e xport one file at a time. The Data Vie w
window displays
2. There are two ways to export.
If you click the To Clipboard button, the table or graph displayed is
copied to the clipboard. The clipboard file can then be pasted into a
word processing or spreadsheet program.
If you click the Export button, you can sa v e the file to the hard drive or a
floppy by following steps 3 and 4 below.
Data Logging Software User’s Guide Viewing, Printing, and Saving Data • 21
Page 22

3. If you press the Export button, the Save As dialog box displays. In this
window, you can choose the file type and its destination.
Your choices for file type depend on whether you have selected either
the table or graph feature. If you have the data in graph form, you can
only export the data as a bitmap file. If you have the data in table format, you can sav e it as either a te xt file , or as two types of spreadsheet,
importable files.
4. Click “Save” after you have finished specifying all the required
information.
Figure 19. Save as Dialog Box
22 • Viewing, Printing, and Saving Data Data Logging Software User’s Guide
Page 23

Deleting Data/Changing Delete Password
To delete data files and Calibration History files, place the cursor on the file
and click with the right mouse button.
When you delete Calibration History files, the Data Logging software asks
you for a password. The password is when the software is first installed is
rki.
It is possible to change that password, as follows:
1. Right-click a file you want to delete. The “Please Input Password”
screen displays.
2. Click Change Password.
3. Type the current password, then click the Current Password button.
4. Type the new password and click the New Password button.
5. Type the new password again, then click the confirm New Password
button.
6. Click “OK” when the program asks if you want to change the password.
7. Close the password window.
Data Logging Software User’s Guide Viewing, Printing, and Saving Data • 23
Page 24

Changing Data Logging
Parameters
To change how data is displayed in reports and to make settings changes
to the Model GX-2001, click the Set Button on the Download window to
display the Set window. After you have entered your changes, click the
Update button to upload the new information to the Model GX-2001. To
upload new time and date information, click the Date Time Set button.
Click to upload changes
to the Model GX-2001
Click to change
font type
Choose these options
to change the graph
colors for the target
gases
Click to calibrate the
Model GX-2001
Click to set date
and time
Figure 20. Set Window
24 • Changing Data Logging Parameters Data Logging Software User’s Guide
Page 25

Using the Set window, you can specify the following parameters f or the GX2001:
• Choose the font type, style , and siz e for data reports in the Font window
Figure 21. Font Window
• Select the colors used to graph the various target gases in the alarm
data report
Figure 22. Color and Custom Color Windows
Data Logging Software User’s Guide Changing Data Logging Parameters • 25
Page 26

• Make settings for the GX-2001 that aff ect at which gas concentr ations a
warning or an alarm is activated
• Select STEL and TWA levels for the GX-2001
• Specify calibration intervals, in months, and change auto-calibration
levels
Figure 23. Calibration Window
• Specify serial number, station ID, and user ID information for the Model
GX-2001
26 • Changing Data Logging Parameters Data Logging Software User’s Guide
Page 27

Calibrating the GX-2001
The Data Logging Software allows you to set the zero and the span
readings for the Model GX-2001 as part of the Set screen.These features
require that a calibration adapter be installed on the downloading station.
This adapter is under development. See the GX-2001 manual for
calibration instructions.
In the Download Screen, see Figure 6, there is a selection box called
Automatic Calibration. Do not select this box. It is for use with the RKI
Automatic Calibration Station which is under development.
Spare Parts List
Table 1: Spare Parts List
Part Number Description
47-5006RK Downloading cable, DB-9 female to DB-9 female, straight through, 6 foot
49-2156RK Downloading charger w/ cable and software
83-0006RK Downloading software, GX-2001
Data Logging Software User’s Guide Calibrating the GX-2001 • 27
 Loading...