

Page 1

Distributed by
Any reference to Raytheon or
RTN in this manual should be
interpreted as Raymarine.
The names Raytheon and RTN
are owned by the
Raytheon Company.
Page 2

Raychart 425
Chartplotter
Owner’s Handbook
Document # 81172_3
Date: March 2002
Page 3

Page 4
Raychart 425 Chartplotter iii
Raychart 425 Chartplotter
Owner’s Handbook
SAFETY NOTICES
CAUTION: HIGH VOLTAGE
The display unit contains high voltages. Adjustments require
specialized service procedures and tools available only to qualified
service technicians – there are no user serviceable parts or
adjustments. The operator should never remove the display unit
cover or attempt to service the equipment.
CAUTION: NAVIGATIONAL AID
This device is only an aid to navigation. Its accuracy can be affected
by many factors, including equipment failure or defects,
environmental conditions and improper handling or use.
Note: It is the user’s responsibility to exercise common prudence and
navigational judgement. This device, therefore, should not be relied upon
as a substitute for such prudence and judgement.
THE LEADER IN ELECTRONIC CHARTS
The Raychart 425 Chartplotter is designed to use Navionics Nav-Chart
chart cards which provide cartography in seamless vector format.
Page 5

iv
Preface
This handbook covers the Raychart 425 manufactured by Raymarine.
It contains important information on the installation and operation of
your new equipment. In order to obtain the best results in operation and
performance, please read this handbook thoroughly.
Raymarine’s Product Support representatives, or your authorized dealer,
will be available to answer any questions you may have.
Warranty
To register your Raychart 425 ownership, please take a few minutes to
fill out the Warranty registration card. It is very important that you
complete the owner information and return the card to the factory in order
to receive full warranty benefits.
EMC Conformance
All Raymarine equipment and accessories are designed to the best
industry standards for use in the recreational marine environment.
The design and manufacture of Raymarine equipment and accessories
conform to the appropriate Electromagnetic Compatibility (EMC)
standards, but correct installation is required to ensure that performance
is not compromised.
Technical Accuracy
The technical and graphical information contained in this handbook, to
the best of our knowledge, was correct as it went to press. However, the
Raymarine policy of continuous product improvement may change
product specifications without prior notice. As a result, unavoidable
differences between the product and handbook may occur from time to
time, for which liability cannot be accepted by Raymarine.
Raymarine is a registered trademark of Raymarine Limited.
Copyright © Raymarine Limited 2002
Page 6

v
Contents - Raychart 425 Chartplotter
SAFETY NOTICES................................................................. iii
Warranty................................................................................... iv
EMC Conformance .................................................................. iv
Technical Accuracy.................................................................. iv
Chapter 1: Overview .................................................................................. 1-1
1.1 Introduction..............................................................................1-1
How this Handbook is Organized ............................................1-1
1.2 Satellite Differential System ....................................................1-2
How it Works ........................................................................... 1-3
Availability of the WAAS and EGNOS ...................................1-4
Broadcast Continuation and Accuracy .................................... 1-4
1.3 The Chartplotter .......................................................................1-5
Display Features and Functions ..............................................1-5
Operating Controls ..................................................................1-6
Chapter 2: Getting Started ....................................................................... 2-1
2.1 Introduction..............................................................................2-1
Conventions Used ...................................................................2-1
Simulator .................................................................................2-1
2.2 Switching On/Off.....................................................................2-2
Changing the Lighting and Contrast ........................................2-2
2.3 Chart Simulator........................................................................2-3
2.4 Controlling the Display............................................................2-4
Selecting the Display Mode .................................................... 2-4
Moving Around the Chart .......................................................2-6
2.5 Using Navionics Nav-Chart Cards...........................................2-9
Inserting a Nav-Chart Card .....................................................2-9
Removing a Nav-Chart card ..................................................2-10
Displaying the Chart Data .....................................................2-10
Chapter 3: Operation ................................................................................. 3-1
3.1 Introduction..............................................................................3-1
Safety .......................................................................................3-1
3.2 Working with Waypoints..........................................................3-1
Introduction .............................................................................3-1
Placing a Waypoint ..................................................................3-2
Selecting a Waypoint ...............................................................3-4
Waypoint Data Display ...........................................................3-5
Editing Waypoint Details ........................................................3-5
Erasing Waypoints ...................................................................3-7
Moving Waypoints ..................................................................3-8
Page 7

vi
3.3 Working with Routes................................................................3-9
Creating a New Route ............................................................3-10
Saving the Current Route ...................................................... 3-11
Clearing the Current Route from the Screen ..........................3-12
Retrieving a Route from the Database ...................................3-12
Displaying Route Leg and Waypoint Information ................3-13
Erasing or (re)Naming a Route ..............................................3-14
Editing a Route ......................................................................3-14
3.4 Following Routes and Going to Target Points........................3-16
Follow a Route .......................................................................3-17
Reverse a Route .....................................................................3-17
Target Point Arrival ...............................................................3-18
Alter a Route ..........................................................................3-18
Going to an Individual Target ................................................3-20
Stop Follow or Stop Goto ......................................................3-23
3.5 Changing the Display Mode...................................................3-23
CDI Display ...........................................................................3-24
BDI Display ...........................................................................3-25
Waypoint Data .......................................................................3-26
Navigation Data .....................................................................3-27
Time/Date Data .....................................................................3-28
3.6 Transferring Waypoints and Routes.......................................3-30
Displayed Waypoints .............................................................3-30
3.7 Using Tracks ..........................................................................3-31
Setting up a Track ..................................................................3-32
Clearing the Current Track ....................................................3-33
SmartRoute ............................................................................3-34
3.8 Displaying Chart Information................................................3-34
Port Services ..........................................................................3-34
Tide Information ....................................................................3-36
3.9 Man Overboard (MOB) .........................................................3-41
3.10Alarms....................................................................................3-42
Chapter 4: Setting Up .................................................................................4-1
4.1 Introduction..............................................................................4-1
4.2 System Set Up Parameters .......................................................4-1
Bearing Mode ..........................................................................4-3
Key Beep .................................................................................4-3
Units ........................................................................................4-3
Variation ..................................................................................4-3
Date Format .............................................................................4-4
Time Offset ..............................................................................4-4
Language .................................................................................4-4
Simulator .................................................................................4-4
Page 8

vii
Simulated SOG ........................................................................4-4
Simulated COG .......................................................................4-5
4.3 Chart Set Up Parameters ..........................................................4-5
Orientation ...............................................................................4-7
Plotter Mode ............................................................................4-7
Show Waypoints ......................................................................4-7
Waypoint Symbol ....................................................................4-8
Autozoom ................................................................................4-8
Screen Amplifier .....................................................................4-8
COG Vector .............................................................................4-8
Arrival Circle ...........................................................................4-8
Anchor Alarm ..........................................................................4-8
XTE Alarm ..............................................................................4-9
Chart Text ................................................................................4-9
Chart Boundaries .....................................................................4-9
Depth Contours <5M ...............................................................4-9
Depth Contours 10M ...............................................................4-9
Depth Contours >20M .............................................................4-9
Position Calibration .................................................................4-9
4.4 GPS Setup ..............................................................................4-10
Chapter 5: Installation .............................................................................. 5-1
5.1 Introduction..............................................................................5-1
EMC Installation Guidelines ...................................................5-1
5.2 Unpacking and Inspecting the Components ............................5-3
Items Missing? ........................................................................5-3
Registering this Product ..........................................................5-3
5.3 Installing the GPS Receiver .....................................................5-4
Surface Mounting .................................................................... 5-4
Pole Mounting .........................................................................5-5
5.4 Installing the Chartplotter ........................................................5-7
Trunnion (yoke) Mounting ......................................................5-9
Panel Mounting .......................................................................5-9
5.5 Cable Running .......................................................................5-10
Introduction ...........................................................................5-10
Connectors .............................................................................5-11
5.6 System Check and Initial Switch On......................................5-13
EMC Conformance ...............................................................5-13
System Check ........................................................................5-13
Initial Switch On ....................................................................5-13
Checking Chartplotter Operation ..........................................5-14
Page 9

viii
Chapter 6: Maintenance & Fault Finding .................................................6-1
6.1 Maintenance.............................................................................6-1
Routine Checks .......................................................................6-1
Servicing and Safety ................................................................6-1
6.2 Resetting the System ................................................................6-2
6.3 Problem Solving.......................................................................6-2
Fault Finding ...........................................................................6-3
6.4 Technical Support ....................................................................6-3
Appendix A: Raychart 425 Specification ................................................ A-1
Appendix B: Raystar 120 Specification ...................................................B-1
Appendix C: NMEA Data ............................................................................C-1
Appendix D: List of Abbreviations ......................................................... D-1
Raychart 425 Mounting Template ...........................................................1-iii
GPS Receiver Mounting Template ............................................................ T-1
Page 10

Chapter 1: Overview 1-1
Chapter 1: Overview
1.1 Introduction
This handbook describes the Raychart 425 Chartplotter and its
associated Raystar 120 GPS Receiver. The Raystar 120 utilizes Satellite
Differential (SD) signals for enhanced navigational accuracy over
conventional shore based differential GPS systems (dGPS).
The Raychart 425 Chartplotter is waterproof and can be installed either
above or below deck. The equipment comprises:
• 6 in LCD display with Chart holder compartment for a Navionics
Nav-Chart electronic chart card
• Raystar 120 GPS Receiver
The Raychart 425 Chartplotter can output GPS and Waypoint data to
operate with other equipment, eg. an autopilot or repeater instrument
connected via the NMEA 0183 interface
How this Handbook is Organized
The handbook is organized as follows:
Chapter 1: Overview (this chapter) provides an overview of the features
and functions of the Raychart 425 and associated Raystar 120. Please
read this chapter to familiarize yourself with the Chartplotter and
Satellite Differential system.
Chapter 2: Getting Started provides an overview of the controls and how
to start using the chartplotter.
Chapter 3: Operation provides detailed operating procedures for the
main chartplotter functions - plotting waypoints and routes, navigation
functions, Track handling, Port and Tide information, Man Overboard
and Alarm functions.
Chapter 4: Setting Up provides instructions for setting up the
chartplotter system and charting preferences.
Chapter 5: Installation provides planning considerations and detailed
instructions for installing the Chartplotter and GPS Receiver on your
vessel.
Chapter 6: Maintenance & Fault Finding provides information on user
maintenance and what to do if you experience problems.
1
.
®
1. National Marine Electronics Association (NMEA) 0183 interconnection standard, Version 2.3
April 1998.
Page 11
1-2 Raychart 425 Chartplotter
Appendix A details the Technical Specification for the Chartplotter.
Appendix B details the Technical Specification for the GPS Receiver.
Appendix C defines the NMEA data received/transmitted by the
Chartplotter.
Appendix D provides a list of abbreviations used in this handbook.
Installation Templates for the Raychart 425 and its associated
Raystar 120 GPS Receiver are included at the end of this handbook.
1.2 Satellite Differential System
The Raystar 120 GPS Receiver utilizes a new satellite differential
correction system to improve the accuracy and integrity of the basic GPS
signals. Three separate compatible systems currently exist or are being
developed:
1. Wide Area Augmentation System (WAAS). Developed by the Federal Aviation Administration (FAA) in the USA.
2. European Geostationary Navigation Overlay System
(EGNOS). This system is being developed by a European consortium.
3. The MTSAT Satellite-Based Augmentation System (MSAS). Being
developed by the Japan Civil Aviation Bureau (JCAB) for civil aviation use.
The area coverage of the WAAS system is the furthest advanced so far
and includes the entire United States of America but also covers large
areas outside of this as shown in Figure 1-1.
0˚15˚W30˚W45˚W60˚W90˚W 75˚W105˚W120˚W135˚W150˚W165˚W 15˚E135˚E 150˚E 165˚E 180˚
75˚N
60˚N
45˚N
30˚N
15˚N
0˚
15˚S
D4910-1
Figure 1-1: WAAS Coverage Map
Page 12
Chapter 1: Overview 1-3
The combination of the WAAS, EGNOS and MSAS systems will
provide global satellite based differential GPS augmentation into the
future.
How it Works
The following description is based on WAAS, but the principles apply
equally to the EGNOS and MSAS systems.
WAAS comprises the following components:
• Ground Reference Stations across the USA
• Master Stations located at East Coast and West Coast
• Geostationary Satellites located above the equator
The Ground Reference Stations are located at known positions and
receive data continuously from GPS. The Ground Reference Stations
send their data to the Master Stations which calculate the error of the
GPS-received positions and generate correctional data.
The corrected ‘differential’ signals are then sent to the two
Geostationary Satellites which broadcast the corrected data on the
standard GPS frequency, making it available to the user’s Raystar 120
GPS Receiver.
The Raystar 120 GPS Receiver uses the correctional data transmitted by
the Geostationary Satellites to refine the GPS positional data for greater
accuracy.
WAAS is shown pictorially in Figure 1-2.
Figure 1-2: The WAAS System
D4903-1
Page 13

1-4 Raychart 425 Chartplotter
Availability of the WAAS and EGNOS
The WAAS system is presently broadcasting in North America.
The Raychart 425 Chartplotter is EGNOS compatible. However, at the
time of going to print the EGNOS was still under test.
Further information is available on the Raytheon (WAAS), and the
European Space Agency (EGNOS) websites. Links to these sites can be
found at:
http://www.raymarine.com
Broadcast Continuation and Accuracy
The continuation of the broadcast SD signals is not the responsibility of
Raymarine. The navigational accuracy of equipment using these satellite
broadcast SD signals is not guaranteed.
Page 14

Chapter 1: Overview 1-5
1.3 The Chartplotter
Display Features and Functions
The Raychart 425 Chartplotter includes the following :
• Detailed navigation information is displayed when a Navionics
Nav-Chart card is installed.
• Uses positional information from Satellite Differential GPS to display vessel’s position.
• Satellite acquisition data.
• Create, Place, Move, Edit or Erase a Waypoint.
• GoTo Waypoint, Port, Facility or Cursor.
• Display Tide Heights, Tide Currents, Sun and Moon data.
• Create, Save, Name, Edit or Follow a Route.
• Review Route and Waypoint Lists.
• Display vessel’s track on-screen.
• Convert a track to a route (SmartRoute).
• Set Up Alarms and Timers.
• Man OverBoard (MOB) to navigate back to a missing person or object.
• The display and keys can be illuminated for night-time use.
• The vessel’s position is shown as a boat symbol pointing in its current
direction.
At the top of the chartplotter screen a status bar displays chart scale,
cursor position plus range and bearing or the vessel’s position, Speed
Over Ground (SOG) and Course Over Ground (COG). When in
Simulator mode, a flashing
the top left hand corner. Heading information is shown as North Up (
Head Up (
is indicated by
Waypoints previously placed are displayed and the current route is
shown. Data can be viewed for current route or chart object.
The chartplotter screen can also show additional information, depending
on your currently selected options, set up selections and data available
from other equipment.
An example chart display in its default configuration, with a chart card
installed, is shown in Figure 1-3.
Several functions are available to control the display as follows:
• Zoom in/out.
• Pan the Display.
• Centre the Chart around the Vessel.
Operation of these functions is described in Chapter 2.
HU) or Course Up (CU) information. If in Overzoom mode, this
OV.
SIM indication is displayed in inverse video in
®
NU),
Page 15
1-6 Raychart 425 Chartplotter
Display Options
Display options are selected in System Set Up and Chart Set Up as
described in Chapter 4.
Operating Controls
The chartplotter is operated by means of the following controls:
• A trackpad.
• Six dedicated push-button (labelled) keys.
• Function bar which changes according to the selected operation.
• On-screen pop-up menus from which options are selected.
• On-screen database lists which enable the editing of items.
The controls are shown in Figure 1-3; they are back-lit for night-time use.
MOB
GOTO
SIM NU
128 nm
TEIGNMOUTH
ENPORT
FIND SHIP ROUTES WAYPOINTS
EXETER
PLYMOUTH
SALCOMBE
CSR 48°30.367'N
POS 1°35.636'W
TOPSHAM
EXMOUTH
TORQUAY
DARTMOUTH
GUERNSEY
BRG 231°T
RNG 40.91nm
PORTLAND
HARBOUR
CAP DE
LA HAGUE
ALDERNEY
JERSEY
ISLE O
PORTB
PAG E
CLEAR
ENTER
D4982_3
Figure 1-3: Raychart 425 Chartplotter Operating Controls
Status Bar
GOTO key
PAGE key
CLEAR key
RANGE key
ENTER key
Trackpad
POWER key
®
Navionics
Nav-Chart
compartment
Cursor
Primary
Function Bar
Page 16

Chapter 1: Overview 1-7
Trackpad and Cursor
The trackpad is used to move the cursor horizontally, vertically or
diagonally. The cursor is the cross-hair symbol (+) which is used to select
a position or item on the chart.
The longer that the edge of the trackpad is pressed, the faster the cursor
moves. The current cursor position is shown in the status bar at the top of
the screen.
The cursor is context-sensitive. Some items on the screen, such as
waypoints and chart objects have information associated with them.
When the cursor is placed over such objects, their information is
displayed in the status bar. In addition, a function bar is displayed for
certain items. For example, when the cursor is placed over a waypoint,
the waypoint data is displayed in the status bar and the waypoint options
function is displayed.
Note: During many operations the cursor cannot be moved around the
screen, eg. whilst a function bar is displayed, the cursor is used exclusively for selection. In such cases, three rapid beeps indicate invalid action.
Dedicated Keys
These keys have fixed functions. Some keys can be used in either of two
ways:
• Press: Press the key momentarily and then release it. This method is
used for most key operations.
• Press and hold: Press the key, keep it pressed for the period of time
stated (eg. 3 seconds), then release it.
When a dedicated key is pressed, one of the following occurs:
1. The associated operation is actioned, eg. change chart scale (
key).
2. A pop-up menu is displayed, providing further options.
3. A set of functions is displayed.
As a key is pressed, a single audio beep confirms the key action. If the
key-press is not valid for the current screen or mode, three rapid beeps
sound to indicate that no response is available. If required, the key beeps
can be turned off as part of your set up procedure (see Chapter 4).
RANGE
Page 17

1-8 Raychart 425 Chartplotter
Function Bar
The Function Bar at the bottom of the screen contains a number of
functions which change according to the current operation. The functions
are grouped into related sets and subsets providing access to the various
functions. The primary function bar is displayed when the
pressed.
The currently selected function is highlighted by means of a gray
background.
When a function is invoked, one of the following occurs:
1. The associated operation is actioned, eg.
2. A sub-set of functions is displayed.
3. A pop-up menu is displayed, providing further options.
4. The appropriate database list (Route or Waypoint) is displayed.
As with dedicated keys, when the action is invoked, a single audio beep
confirms the action. If the selection is not valid, three rapid beeps indicate
invalid action. Key beeps can be deactivated as part of the set up
parameters (see Chapter 4).
GOTO WAYPOINT.
ENTER key is
Pop-Up Menus
Pop-up menus usually provide various options. When a pop-up menu is
on-screen, a set of associated functions is also displayed.
Use the trackpad to select an option from the menu, then use the
appropriate function to set the option, eg. the radius of the waypoint
arrival alarm can be specified and the selected navigation data can be set
on/off.
Database Lists
The waypoints and routes created on the chartplotter are stored in
database lists. These lists can be viewed and items selected for editing.
As with pop-up menus, when a database list is on-screen, a set of
associated soft keys is also displayed; use the trackpad to select an item
from the list, then use the appropriate function to edit the item, eg. a
Waypoint or a Route can be erased.
Page 18

Chapter 2: Getting Started 2-1
Chapter 2: Getting Started
2.1 Introduction
This chapter provides information and instructions to allow you to
practice using the Raychart 425 Chartplotter. It is intended to help you
become familiar with the controls before you start using the chartplotter
for routine navigation.
Note: There is often more than one method of performing a particular
task. Normal operating procedures are detailed in Chapter 3. When you
become familiar with the system you can adapt these procedures to suit
your method of operation.
Conventions Used
Throughout this handbook, the dedicated (labelled) keys are shown in
bold capitals; for example,
in normal capitals, eg.
Operating procedures, which may consist of a single key-press, or a
sequence of numbered steps, are indicated by a
When textual data is displayed on screen, any unavailable data is shown
as dashes, one per character.
Where procedures refer to Select, this implies using the trackpad to
highlight a function, then pressing the
ENTER. The functions and options are shown
LIGHT.
➤ symbol in the margin.
ENTER key to action that function.
Simulator
The Chartplotter display unit includes a Simulator mode, which allows
you to practice operating your chartplotter without data from a GPS
system. You will need to use the set up options to switch the display to
Simulator mode, as described in Section 2.2, Switching On/Off. You can
use it in either of two ways:
• Before the chartplotter has been installed on your vessel. In this case,
you only need to connect the Chartplotter display unit to a 12VDC
power supply, fused at 1A, connecting the red core from the power
lead to positive (+) and the black core to negative (-); see Chapter 5 for
full details.
• After the chartplotter has been installed on your vessel and while in a
marina or otherwise at anchor.
Page 19

2-2 Raychart 425 Chartplotter
2.2 Switching On/Off
➤ To turn the chartplotter display unit on, press the POWER key. The keys
illuminate, the display unit beeps and the Raychart logo is displayed,
followed by the following warning:
WARNING
THE ELECTRONIC CHART IS AN AID TO
NAVIGATION DESIGNED TO FACILITATE
THE USE OF AUTHORISED GOVERNMENT
CHARTS, NOT TO REPLACE THEM. ONLY
OFFICIAL GOVERNMENT CHARTS AND
NOTICES TO MARINERS CONTAIN ALL
INFORMATION NEEDED FOR THE SAFETY
OF NAVIGATION AND, AS ALWAYS, THE
CAPTAIN IS RESPONSIBLE FOR THEIR
PROPER USE.
Press “ENTER” to continue.
When you have read and understood the warning, press the ENTER key.
The chart is displayed.
If this is the first time that the chartplotter has been switched on, and no
chart card is installed, the display shows the background world map at
Lat 0°/Lon 0°. Otherwise, the display shows the selected chart area and
any data that were displayed when the unit was last used.
➤ To turn the display unit off, press and hold the POWER key for at least
3 seconds. A countdown timer is displayed; when it reaches zero the
display and key back-lights extinguish.
Changing the Lighting and Contrast
You can change the level of backlighting and contrast for the screen. The
key backlighting remains on to enable the keys to be seen at all times.
➤ To change the lighting and contrast:
1. Press the
POWER key to display the lighting controls (Figure 2-1).
Page 20
Chapter 2: Getting Started 2-3
Figure 2-1: Lighting Controls
The last-used control is highlighted in inverse video.
2. Press the trackpad left/right to select the LIGHTS function.
3. Press the trackpad top/bottom to increase or decrease the lighting to
one of four levels. You can press and hold the trackpad to change the
setting more rapidly. The lighting level is adjusted as you change the
setting.
4. Press the trackpad right to select the contrast control. There are 16 con-
trast levels. Adjust the setting as for lighting to select the best viewing
level.
5. Press
When the display unit is switched on, screen lighting is restored to
it was
level is retained until you reset it. The new contrast level is retained until
you reset it, even after power-off, unless you set the control very low or
very high; in this case, the contrast will be restored on power-up as
follows:
• Contrast set < 30% restored to 30%
• Contrast set > 70% restored to 70%
CLEAR to return to the chart screen, with the new lighting and
contrast levels retained.
ON if
ON previously. Whilst the unit is switched on, the chosen lighting
2.3 Chart Simulator
When simulator mode is started, your initial simulated position is
wherever the cursor was last positioned. To practice using the
chartplotter in a particular chart area, use the trackpad to pan to that area,
then switch simulator
Note: If real position data is available and the simulator is active, simulated data takes precedence. On power-up the simulator defaults to its
previous setting on power-down. Care should be taken to determine de-
ON.
Page 21

2-4 Raychart 425 Chartplotter
sired mode on power-up. Simulated data should never be used for navigational purposes.
➤ To view a chart image using simulated data:
1. Press the
PAGE key to display the SET UP function bar (Figure 2-2):
Figure 2-2: Set Up Function Bar
2. Press trackpad left/right to highlight SYSTEM SET UP and press ENTER
to display the System Set Up menu.
3. Use trackpad up/down to highlight the
4. Use trackpad left/right to select
5. If necessary, use trackpad up/down to highlight, in turn, the
LATED SOG
These set Speed in 1Kt intervals and Course in 1° intervals, respectively.
6. Press
7. A flashing
the top of the chart screen.
and COG options and trackpad left/right to set as required.
CLEAR twice to return to the chart screen.
SIM indicator appears in inverse video in the status bar at
2.4 Controlling the Display
This section describes how to:
• Change the display mode.
• Move around the chart by panning the display, changing the chart centre and changing the chart scale.
Selecting the Display Mode
Use the PAGE key to select the display mode. Select the following modes
by repeat presses of the
Figure 2-3:
• Set Up functions (see Chapter 4)
• Course Deviation Indicator (CDI)
• Bearing & Distance Indication (BDI)
• Waypoint data
• Navigation data
• Time/Date data
• Return to Set Up functions
Note: Press
GOTO to return to normal Chart display at any time.
PAGE key as listed below and shown in
D4694_1
SIMULATOR option.
ON.
SIMU-
Page 22
Chapter 2: Getting Started 2-5
From Chart Display
Press PAGE to display Set Up functions
PAGE
SIM OV NU
Press
PAGE
to return to
Chart display
SUNRISE 06.23
SUNSET 21.34 TODAY
AT POSITION (USER SELECTED)
50°45 .000 N
001°06 .000 W (c)
128 nm
EXETER
TEIGNMOUTH
ENPORT
PLYMOUTH
SALCOMBE
SYSTEM
SETUP
CSR 48°30.367'N
POS 1°35.636'W
TOPSHAM
EXMOUTH
TORQUAY
DARTMOUTH
CHART
SETUP
ALDERNEY
GUERNSEY
TRACK
SETUP
BRG 231°T
RNG 40.91nm
PORTLAND
HARBOUR
CAP DE
LA HAGUE
JERSEY
ISLE O
GPS
SETUP
Press
PAGE
to display CDI
PORTB
TIME 12:34
DATE 26/01/99
ETA (WAYPOINT) 13:37 26/01/99
TTG (WAYPOINT) 01:03
ETA (ROUTE) 14:32 27/01/99
TTG (ROUTE) 34:03
STEER STARBOARD
PAGE
Press to display
Time/Date
information
POSITION
50°45.000 N
001°06.000 W(c)
COG 230° T
SOG 6.8 Kts
WAYPOINT 001
BRG 234° T GPS FIX
RNG 2.4 nm TIME 14:32 12/12/99
STEER STARBOARD
Press
to display
Navigation Data
Note: In any display mode,
press GOTO to return
to chart display
ROUTE
WAYPOINT
ROUTE 01
WPT 001 TO WPT 002
BRG 234° T
RNG 12.4 nm
COG 230° T TIME 13:29 12/12/99
SOG 6.8 Kts TTG 01:03
XTE 0.5 nm ETA 14:32 12/12/99
STEER STARBOARD
Figure 2-3: Display Modes
Press to display
BDI
Press
PAGEPAGE
to display
Waypoint Data
PAGE
D4989_1
Page 23
2-6 Raychart 425 Chartplotter
Moving Around the Chart
You will normally operate the chartplotter with the chart showing your
vessel’s current location.
In the default North-Up orientation (shown in the status box at the top of
the display), the vessel moves in relation to the screen. You will need to
reposition the chart if your vessel moves out of the area currently
displayed, or if you wish to examine or place waypoints in another area.
Alternatively, you can home the cursor onto the vessel using the
function. ‘homing’ locks the vessel to the cursor and updates the
SHIP
display such that the chart is re-drawn so as to ensure that the vessel is
always on screen, see Using
There are three ways in which you can reposition the chart:
• Use the trackpad to move the cursor to the edge of the chart; the chart
pans across. This method is useful if the area you wish to see is just off
screen.
• Automatically re-centre the vessel using the
• Change the chart scale using the
new area. This method is useful if the area you wish to see is some distance away.
FIND SHIP below.
FIND SHIP function.
RANGE key to zoom out and in to a
Using FIND SHIP
FIND SHIP is used to re-draw the chart with the vessel normally at its
centre and the cursor homed on the vessel.
FIND
➤ To centre the vessel:
1. From chart mode, press
(Figure 2-4):
Figure 2-4: Primary Function Bar
2. Select FIND SHIP; the following actions are performed:
• The chart is re-drawn with the vessel’s position in the centre.
• The cursor is homed onto the vessel position and moves with it.
• When the vessel moves near the edge of the chart window, the chart
is redrawn with the vessel at the centre and the cursor homed on the
vessel.
• Whilst homed, the status bar indicates vessel position,
COG.
ENTER; the primary function bar is displayed
SOG and
Page 24

Chapter 2: Getting Started 2-7
• If Screen Amplifier is enabled, the vessel is positioned so as to
increase screen forward visibility, see Chapter 4: Setting Up.
3. To release the cursor from homed mode press the trackpad to move the
cursor away from the vessel’s current position. The status bar shows
the cursor position, range and bearing.
Changing the Chart Scale
The RANGE key changes the chart scale so that a smaller or larger area is
shown on the available cartography.
Plotter mode is available to allow you to zoom into a smaller area, even
when no chart data is available for that scale. To enable plotter mode, see
Chapter 4: Setting Up.
You can change the chart scale for two purposes:
• To see either more detail (of a smaller area) or a larger area (in less
detail).
• To move the display to another area of the chart, by zooming out to a
small scale chart, then zooming in on another position.
Each time you press the
available setting. The Status Bar at the top of the screen indicates the
distance, from top to bottom of the display, in nautical miles (Figure 2-5).
RANGE key, the chart scale changes to the next
Increases the
chart range
SIM NU
128nm
Vertical distance
displayed on chart
CSR 48°30.367'N
POS 1°35.636'W
BRG 231°T
RNG 40.91nm
Decreases the
chart range
RANGE
Figure 2-5: Status Bar Indication
➤ For rapid scale change, press and hold the required arrow on the RANGE
key.
The distance indicator at the left-hand end of the status bar is updated
whenever you change the chart scale.
➤ To zoom in to a more detailed chart:
1. Use the trackpad to position the cursor in the area you wish to see in
more detail and press the bottom of the
The section of the chart around the cursor is enlarged to fill the screen
with the chart showing more detail. The cursor is now positioned in
the centre of the screen.
The distance indicated at the top left of the screen is updated.
RANGE key to zoom in.
Page 25
2-8 Raychart 425 Chartplotter
2. If further chart enlargement is available using the current chart card
you can press the bottom of the
RANGE key to zoom in again, reposi-
tioning the cursor first if required.
An area of further chart detail is indicated by a box around the area as
shown in Figure 2-6.
Chart Boundary -
Indicates further
detail is available inside.
Shown when using
®
Navionics
card.
Nav-Chart
SIM NU
128 nm
TEIGNMOUTH
ENPORT
PLYMOUTH
FIND SHIP ROUTES WAYPOINTS
CSR 48°30.367'N
POS 1°35.636'W
EXETER
TOPSHAM
TORQUAY
DARTMOUTH
SALCOMBE
EXMOUTH
GUERNSEY
BRG 231°T
RNG 40.91nm
PORTLAND
HARBOUR
CAP DE
LA HAGUE
ALDERNEY
JERSEY
Figure 2-6: Chart Detail Boundaries
3. If no further chart detail is available then, when the bottom of the
RANGE key is pressed, the result depends upon whether Plotter Mode
is on or off:
• If Plotter Mode is Off, the chart scale remains unchanged, indicat-
ing that the greatest detail is displayed.
• If Plotter Mode is On, the scale is decreased but, as there is no fur-
ther detail, the vessel, waypoints, routes and tracklines are displayed without cartography.
The chart information is restored when you return to a chart scale for
which the information is available.
ISLE O
PORTB
D4988_2
➤ To zoom out to a less detailed chart, press the top of the RANGE key as
many times as required.
Page 26

Chapter 2: Getting Started 2-9
2.5 Using Navionics Nav-Chart Cards
The chartplotter has a built-in world map that can be used for route
planning. Most areas (these are shown with chart box boundaries) are
covered at a range of approximately 512nm as shown on the Status Bar at
the top of the screen.
To use the chartplotter as a navigation aid, charts with detailed
information for the area you wish to navigate are required. The charts are
available on Navionics Nav-Chart cards, each of which can store up to 20
charts in an electronic format, depending upon its memory storage
capacity.
A Nav-Chart card provides an appropriate level of detail for a given
geographic area and scale; this data can be displayed down to a range of
1
/8 nm on the screen (height) if the data is available.
To obtain Navionics Nav-Chart cards, contact your local dealer or visit
www.navionics.com
Call Navionics toll-free from anywhere in North America on:
1-800-848-5896.
Outside of North America, contact your local dealer or:
Navionics S.p.A.
Tel: (+39) 0584 961696
Fax: (+39) 0584 961309
or www.navionics.it to find the dealer nearest you.
Inserting a Nav-Chart Card
CAUTION:
To prevent the ingress of water and consequent damage to the unit,
always ensure that the cartridge cover is fully and properly inserted,
whether or not a Nav-Chart card is inserted.
➤ To insert a Nav-Chart card, refer to Figure 2-7:
1. Check that you are using the correct Nav-Chart card for the required
area.
2. Pull out the cartridge cover at the right hand side of the unit.
3. Hold the card with the title label and keyway slot towards you and the
two circular holes outermost, as shown below. Gently push the card
into its slot until it clicks into position. It will only fit in the correct orientation.
4. To prevent the ingress of water, replace the cartridge cover.
Page 27
2-10 Raychart 425 Chartplotter
D4706_2
Figure 2-7: Nav-Chart Card Insertion/Removal
Removing a Nav-Chart card
CAUTION:
DO NOT use a metallic instrument, eg. a screwdriver or pliers, to aid
removal, as doing so can cause irreparable damage.
➤ To remove a Nav-Chart card, refer to Figure 2-7:
1. Pull out the cartridge cover at the right hand side of the unit.
2. Grip the card firmly and pull to remove it from its slot.
3. To prevent the ingress of water, replace the cartridge cover.
Note: If difficulty is experienced in removing the card, a short length of
cord can be secured between the two circular holes in the card to ease its
removal, making sure that fitting of the cartridge cover is not impeded.
Displaying the Chart Data
The new chart data will be displayed when you move the cursor into an
area covered by the new chart When a chart cartridge is inserted, the chart
is automatically redrawn.
The boundary of each chart digitized in the current card is defined by a
box or rectangle. (You can switch off the chart boundaries display as part
of the chartplotter set up described in Chapter 4).
Page 28

Chapter 3: Operation 3-1
Chapter 3: Operation
3.1 Introduction
This chapter explains how to use the chart functions to navigate with the
Raychart 425.
Safety
The Raychart 425 makes it very easy to mark a waypoint and travel
towards it. However, always check first that the route is safe. If using the
chartplotter in combination with an autopilot connected via NMEA, the
autopilot will normally prompt for confirmation before it steers the vessel
towards the waypoint.
If a route has been entered using a less detailed chart, zoom in for more
detail to check for hazards, such as small shoals, that may not be shown
on the less detailed charts.
Note: Until you are familiar with interpreting the chart display, you
should take every opportunity to compare the displayed objects with visual targets, such as buoys and coastal structures. You should practice
harbour and coastal navigation during daylight and in clear weather
conditions. The equipment should not be used as a substitute for good
navigational practice.
3.2 Working with Waypoints
Introduction
The Raychart 425 enables up to 500 waypoints to be placed. A waypoint
is a position entered on a chart as a reference or destination point. All
waypoints placed on the chartplotter are stored in a waypoint database list
which includes symbol, position, bearing, range, date and time.
All waypoints in the database are displayed on screen, unless the
WAYPOINTS
Chapter 4. A waypoint can be selected, either on-screen or from the list,
for editing.
The waypoint is usually placed at the cursor position and can be part of a
route; A waypoint can also be placed at the vessel’s current position.
Waypoints can be placed before the chartplotter is installed on your
vessel.
When a new waypoint is placed, it is displayed using either the default
symbol of a cross or an alternative symbol available from the Chart Set
is set to OFF in the Chart Set Up menu, as described in
SHOW
Page 29
3-2 Raychart 425 Chartplotter
Up menu, as described in Chapter 4. The waypoint is added to the
waypoint list and named with the next available number. The edit
functions can be used to change the symbol and name. When the cursor is
positioned over a waypoint, the waypoint bearing and range are
displayed.
Waypoints can also be transferred between the chartplotter, other NMEA
connected instruments or a PC, using the Waypoint Transfer functions.
This section explains how to perform the following tasks using the
on-screen cursor and the waypoint list:
• Placing a Waypoint
• Selecting a Waypoint
• Displaying Waypoint data
• Editing a Waypoint (symbol, name & position)
• Erasing a Waypoint
• Moving a Waypoint
Placing a Waypoint
Note: It is not possible to place multiple waypoints at the same position.
➤ To place a new waypoint:
1. From chart mode, press
(Figure 3-1):
ENTER; the primary function bar is displayed
Figure 3-1: Primary Function Bar
2. Using trackpad left/right, select WAYPOINTS (Figure 3-2).
Figure 3-2: Waypoints Soft Keys
3. To place a waypoint at the cursor position:
i. Select
PLACE WPT AT CURSOR. The selected function now has help
text appended to it (Figure 3-3):
PLACE
WAYPOINT
MOVE CURSOR, "ENTER"TO PLACE
WAYPOINT, "CLEAR" TO QUIT
Figure 3-3: Place Waypoint Function
Page 30
Chapter 3: Operation 3-3
ii. Place the cursor in the required position on the chart and press
ENTER to place the waypoint. The waypoint is added to the way-
point list and named using the next available number.
The waypoint functions remain displayed so that further waypoints can be placed.
If required, use
EDIT WAYPOINT to name the waypoint as described
in Editing Waypoint Details on page 3-5.
iii.When finished placing waypoints, press
CLEAR.
4. To place a waypoint at the vessel’s position:
Select
PLACE WPT AT VESSEL. A new waypoint is placed at the ves-
sel’s current position.
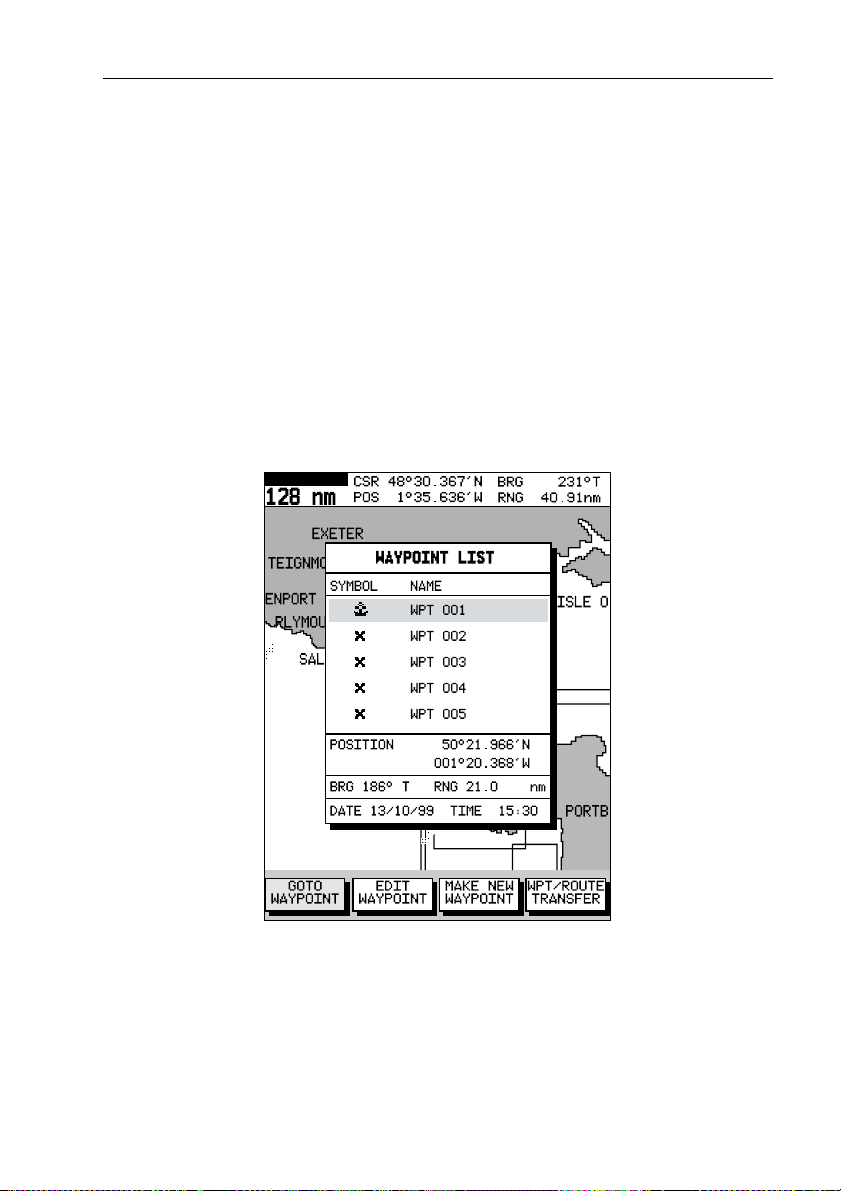
5. To place a waypoint using the Waypoint List:
Select
WAYPOINT LIST. The Waypoint List and associated function
Soft Keys are displayed (Figure 3-4):
SIM NU
Figure 3-4: Waypoint List Display
D4991_2
6. Select MAKE NEW WAYPOINT.
The waypoint is placed at the current vessel position or, if a GPS fix is
not available, the cursor position. The new waypoint is added to the
Waypoint List and named with the next available number.
To return to chart mode, press
CLEAR twice.
Page 31

3-4 Raychart 425 Chartplotter
Selecting a Waypoint
Positioning the cursor over a waypoint selects that waypoint and accesses
the
WAYPOINT OPTIONS function bar. This enables you to GOTO
(described in Section 3.4), edit (symbol, name, position), erase or move
the waypoint.
Selecting a waypoint from the Waypoint List allows you to
(symbol, name, position, erase) the waypoint. The Waypoint List also
provides options to make a new waypoint and transfer waypoints.
➤ To select a waypoint using the cursor:
1. Move the cursor over the waypoint; the
bar, together with help text, is displayed (Figure 3-5):
Figure 3-5: Waypoint Options
2. Press ENTER to select the waypoint function bar (Figure 3-6):
WAYPOINT OPTIONS function
GOTO and edit
Figure 3-6: Waypoint Function Bar
The selected waypoint can be edited via these functions.
➤ To select a waypoint using the Waypoint List:
1. Press
2. Select WAYPOINTS and press ENTER to display the waypoint function
3. Select WAYPOINT LIST and press ENTER to display the Waypoint List.
ENTER to display the primary function bar (Figure 3-7):
Figure 3-7: Primary Function Bar
bar (Figure 3-8):
Figure 3-8: Waypoint Function Bar
The Waypoint List and associated function bar are displayed (see
Figure 3-4).
Page 32

Chapter 3: Operation 3-5
The list details all waypoints. The selected waypoint is indicated by
the highlight bar with its position; bearing and range are provided (if
GPS fix available).
4. Use trackpad up/down to move through the list to highlight the
required waypoint.
The selected waypoint can be edited using the
EDIT WAYPOINT function.
Waypoint Data Display
Waypoint data can be viewed in two ways: the cursor can be used to select
the waypoint to display the waypoint data in the status bar at the top of the
screen, or the waypoint details can be viewed on the waypoint list.
➤ To display waypoint data:
Move the cursor over the waypoint. The waypoint data is displayed in the
status bar, indicating waypoint number/name, bearing and range from
vessel (dashes are shown if no fix is available).
Whilst the cursor is over the waypoint, the
bar is displayed.
➤ To remove the waypoint data:
Move the cursor away from the waypoint or press
➤ To display the waypoint details from the waypoint list:
Select the waypoint in the list as described above.
The details for the selected waypoint are displayed in the lower half of the
window. Date and time are included for all waypoints.
To remove the Waypoint List and return to chart mode, press
three times.
WAYPOINT OPTIONS function
CLEAR.
CLEAR
Editing Waypoint Details
The name, symbol and position of a waypoint can be changed, either by
means of the cursor or via the Waypoint List.
Note: The target waypoint cannot be edited.
➤ To edit a waypoint using the cursor:
1. Place the cursor over the waypoint, see Selecting a Waypoint on
page 3-4.
2. Select
3. Select
WAYPOINT OPTIONS and press ENTER to display the Edit Way-
point function bar.
EDIT WAYPOINT. The Edit Waypoint function bar is displayed
(Figure 3-9):
Page 33

3-6 Raychart 425 Chartplotter
Figure 3-9: Edit Waypoint Function
4. To edit the waypoint name, select EDIT NAME.
The
NAME WAYPOINT window is displayed.
5. Use the trackpad to enter or edit the name as follows:
• Use trackpad left/right to move the cursor to the character to be
changed. Up to eight characters can be used.
• Use trackpad up/down to scroll through the characters.
• When editing is complete, press
ENTER; the waypoint name is
updated and the window is removed
6. To edit the symbol, select
SELECT SYMBOL options are displayed (Figure 3-10).
The
EDIT SYMBOL.
Figure 3-10: Edit Symbol Options
D4674_1
7. Use trackpad left/right to highlight the required symbol, then press
ENTER.
➤ To edit a waypoint using the Waypoint List:
1. From chart mode, press
(Figure 3-11).
Figure 3-11: Primary Function Bar
2. Using trackpad left/right, select WAYPOINTS (Figure 3-12).
Figure 3-12: Waypoint Function Bar
3. Select WAYPOINT LIST; the Waypoint List is displayed, with its associ-
ated function bar (Figure 3-13):
ENTER; the primary function bar is displayed
Page 34

Chapter 3: Operation 3-7
Figure 3-13: Waypoint List Function Bar
4. Select EDIT WAYPOINT; the waypoint edit functions are displayed
(Figure 3-14):
Figure 3-14: Waypoint Edit Functions
5. To edit the waypoint name, select EDIT NAME; the cursor is placed in
the name field of the selected waypoint.
i. Edit the name as previously described (up to eight characters).
6. To edit the waypoint symbol, select
EDIT SYMBOL.
i. Use trackpad left/right to highlight the required symbol.
ii. Press
7. To change the waypoint’s position, select
ENTER to accept the choice or CLEAR to abort the operation.
EDIT POSITION. The cursor
is placed in the Position field in the Waypoint List.
i. Use trackpad left/right to select the latitude/longitude fields.
ii. Use trackpad up/down to scroll through and edit the values.
iii.When editing is complete, press
ENTER to save the new position.
Erasing Waypoints
Note: A waypoint that is the target waypoint or waypoints that are also
used in any saved route(s) cannot be erased. If an attempt is made to
erase a waypoint that is used in a saved route, the warning “
USED IN ROUTE(S) AND CANNOT BE ERASED
➤ To delete a waypoint using the cursor:
1. Place the cursor over the waypoint; see Selecting a Waypoint on
page 3-4.
2. Select
3. Select
WAYPOINT OPTIONS and press ENTER to display the Edit Way-
point function bar.
ERASE WAYPOINT. A warning box appears. Press ENTER to
erase or
CLEAR to retain. If erased, the waypoint list is updated and
the screen is cleared.
WAYPOINT I S
” is displayed.
Page 35

3-8 Raychart 425 Chartplotter
➤ To delete a waypoint using the waypoint list:
1. Select the waypoint from the waypoint list as previously described.
The waypoint list function bar is displayed.
2. Use trackpad up/down to move through the list to highlight the
required waypoint.
3. Select
ERASE WAYPOINT. Press ENTER to erase the waypoint.
To return to chart mode, press CLEAR three times.
Moving Waypoints
Any waypoint, except the target waypoint, can be moved. The Waypoint
function bar and cursor are used to move the selected waypoint, or the
waypoint position can be edited.
Note: Take care when editing waypoints as it is possible to move waypoints that are used in routes stored in the Route Database List.
➤ To move a waypoint using the cursor:
1. Place the cursor over the waypoint; see Selecting a Waypoint on
page 3-4.
2. Select
3. Select
WAYPOINT OPTIONS and press ENTER to display the Edit Way-
point function bar.
MOVE WAYPOINT. The selected (highlighted) function now has
help text appended to it (Figure 3-15):
CURSOR SELECT POS, "ENTER"
MOVES WPT, "CLEAR" TO QUIT
Figure 3-15: Move Waypoint Function
4. Move the cursor to the required waypoint position.
5. When the cursor is in the correct position, press
ENTER to set the new
position and return to normal cursor control.
To return to chart mode, press CLEAR.
➤ To move a waypoint using the Waypoint List:
1. Select the waypoint using the Waypoint List as described above. The
waypoint functions are displayed.
2. To edit the waypoint position proceed as previously described in
Editing Waypoint Details on page 3-5.
Page 36

Chapter 3: Operation 3-9
3.3 Working with Routes
A route is made up of a series of waypoints (maximum 50). A route is
made by placing a series of waypoints on the chart.
When a route is created it becomes the current route and is displayed
on-screen. The current route is maintained after power-off. Only one
route can be current and is displayed (if it is in the field-of-view) as solid
lines connecting waypoints. If following the route, the current leg is
shown as a dotted line.
After a route has been created, the
route. The
GOTO key provides various other options as described in
Section 3.4.
Up to 20 routes can be saved in the route database. Any one of these can
be selected from the database to be used as the current route.
The current route can be edited by adding and/or moving waypoints.
When a route has been saved, options are also provided to name or erase
a route.
This section explains how to perform the following tasks:
• Create a new route.
• Save the current route in the database.
• Clear the current route.
• Retrieve a route from the database list as the current route.
• Display route information, including route leg data and waypoint
details.
• Use the database list to erase and name existing routes.
• Edit a route by adding, removing and moving waypoints.
GOTO key can be used to follow the
➤ To access the route function bar:
1. Press
2. Select ROUTES to display the first level functions (Figure 3-17):
ENTER to display the primary function bar (Figure 3-16):
Figure 3-16: Primary Function Bar
Figure 3-17: First Level Functions
Page 37

3-10 Raychart 425 Chartplotter
3. Select MORE to see more functions (Figure 3-18):
Figure 3-18: Second Level Functions
4. Select MORE again to return to the first level functions.
5. Press
CLEAR to return to chart mode.
Creating a New Route
Note: If there is a current route on screen, it is cleared when MAKE
is selected. If following the current route you are prompted to
ROUTE
STOP FOLLOW. Press ENTER to continue or CLEAR to abandon route
creation. If the route has not been saved you are prompted to save it.
Waypoints in a route can be added/removed after it has been created,
either via the
following sections).
➤ To make a new route by placing waypoints:
Note: You can pan the chart and change the scale whilst placing waypoints.
ROUTES function or via the cursor (see Editing a Route in the
1. If necessary, move the cursor to the required area in which to make the
route and select a suitable chart scale.
2. Select
ROUTES then MAKE ROUTE. The MAKE ROUTE function is
replaced with
PLACE WAYPOINT, together with help text
(Figure 3-19):
Figure 3-19: Place Waypoint Function
3. Move the cursor to the position on the chart where the first waypoint
is to be placed and press
ENTER.
Note: The cursor can be placed on an existing waypoint, if required; the
PLACE WAYPOINT function changes to USE THIS WAYPOINT. Press ENTER
to use the waypoint.
The waypoint appears on the screen at the cursor position. The number
displayed alongside the waypoint identifies its position in the route.
Note: If the route is Cleared before it is saved, the waypoint is removed.
Page 38

Chapter 3: Operation 3-11
4. Move the cursor to the next waypoint position; a dotted line connects
the cursor to the last placed waypoint.
5. Press
ENTER again. The next waypoint is placed and the dotted line
changes to a solid line.
Note: If the waypoint was placed incorrectly, it can be deleted by pressing
CLEAR. Successive waypoints can be deleted in this way.
6. Repeat Step 4. and Step 5. until all waypoints have been placed. Up to
50 waypoints can be included in a route. Any existing waypoint(s)
can be included by placing the cursor on the waypoint(s).
7. When all your waypoints have been entered, press
GOTO to complete
the route. The route is displayed on screen and is the current route, but
is not active, ie. not being followed.
8. Select
MORE to access the SAVE ROUTE function, or ENTER to return
to chart mode.
Note: The completed route is stored in the unit’s memory and will be
re-displayed if the unit is switched off and on again. However, it is recommended that the route is saved as described below. The current route
waypoints do not appear in the waypoint list until the route is saved.
Saving the Current Route
Up to 20 named routes can be saved in the route database. These routes
can then be re-displayed and followed subsequently.
Note: If an operation is attempted that affects this route (eg.
) before the current route is saved, you are prompted to save it.
ROUTE
CLEAR
➤ To save and name the current route:
1. Select
2. Select
3. The next available entry on the list is highlighted. If required, use
ROUTES, followed by MORE.
SAVE ROUTE. The Save Route list is displayed.
trackpad up/down to select another position in the list; this can be a
blank slot, or an existing route no longer required. (Figure 3-20).
D4680_1
Figure 3-20: Save Route List
Page 39

3-12 Raychart 425 Chartplotter
4. Press ENTER to save the route. Press ENTER again (in response to the
prompt) to name the route or
where
XX is the next available number.
When naming a route, use the trackpad to move the cursor right or left to
the character to be edited. Use trackpad up/down to scroll through the
characters or numerals. The name can contain up to eight alphanumeric
characters, including spaces.
5. Press
ENTER to finish and clear the Route List, then press CLEAR to
return to the chart mode.
CLEAR to save as the default ROUTE XX,
Clearing the Current Route from the Screen
To clear the current route from the screen, select CLEAR ROUTE. If the
current route has not been saved, you are prompted to save it.
➤ To clear the current route from the screen:
1. Select
2. Select
3. If the route has not been saved, a prompt gives the options
4. To save the route in the database, press
ROUTES or place the cursor over a route leg until the leg data is
displayed in the Status Bar.
CLEAR ROUTE and press ENTER to clear the route or press
CLEAR to cancel the operation.
ENTER to
save or
CLEAR to remove the route from the screen.
ENTER. The Name Route
functions are displayed, see Saving the Current Route on page 3-11.
Retrieving a Route from the Database
A route from the database list can be selected as the current route. The list
is accessed from the second set of
➤ To select a route as the current route:
1. Select
2. Select
ROUTES, followed by MORE, then ROUTE LIST. The route list is
displayed with the currently selected route highlighted (Figure 3-21.
SHOW ROUTE. The route list is removed and the selected route
is shown on screen as the current route.
ROUTES functions.
Page 40

Chapter 3: Operation 3-13
SIM NU
Figure 3-21: Route List Display
D4681_2
Displaying Route Leg and Waypoint Information
➤ To display information about a route leg, move the cursor over the leg
until its data is displayed in the status bar at the top of the screen
(Figure 3-22).
Figure 3-22: Status Bar showing Current Route
To remove the data, move the cursor away from the route leg or press
CLEAR.
➤ To display information about a route waypoint, move the cursor over the
waypoint until its pop-up data box is displayed (Figure 3-23).
Figure 3-23: Waypoint Pop-Up Box
To remove the data, move the cursor away from the waypoint or press
CLEAR.
Page 41

3-14 Raychart 425 Chartplotter
Erasing or (re)Naming a Route
A route or can be deleted or re-named via the Route List. When deleting a
route, you are prompted to confirm.
➤ To select a route to delete:
1. Select
2. Select
3. Press
4. Press
➤ To select a route to (re)name:
1. Select
2. Select
3. To name or rename a route, use trackpad left/right to select each char-
4. Press
5. Press
ROUTES, followed by MORE, then ROUTE LIST. The route list is
displayed with the selected route highlighted.
ERASE ROUTE.
ENTER to erase the route from the list. A warning box appears,
prompting you to press
operation.
CLEAR three times to remove the route list and return to chart
mode.
ROUTES, followed by MORE, then ROUTE LIST. The route list is
displayed with the selected route highlighted.
NAME ROUTE. and press ENTER.
acter to be edited. Use trackpad up/down to scroll through the characters or numerals.
ENTER to accept the new name or CLEAR to cancel the opera-
tion.
CLEAR three times to clear the Route List and return to chart
mode.
ENTER to confirm or CLEAR to cancel the
Editing a Route
A route may be edited in order to:
• Add a Waypoint into a route
• Remove a Waypoint from a route
• Move a Waypoint (as described in Section 3.2)
• Reverse a Route
Any changes made to the route affect only the current route, so the route
must be saved in order to keep the changes.
Inserting/Deleting Waypoints in a Route
➤ To add waypoint(s) to the end of a route:
Note: If no current route is displayed, select a route from the Route List
and use the
route from the database.
SHOW ROUTE function to make it active, see Retrieving a
Page 42

Chapter 3: Operation 3-15
1. Select EDIT ROUTE and press ENTER; the PLACE WAYPOINT function
is shown as above (see Figure 3-19).
2. Add waypoint(s) to the route by moving the cursor and pressing
ENTER in the same way as the route was first created.
3. Remove waypoints from a route by pressing
CLEAR in the same way
as the route was first created.
Note: When deleting waypoints, if the route has not been saved, the waypoint is erased. If the route has been saved, the waypoint remains on the
screen.
➤ To insert a waypoint into a route:
1. Move the cursor over the route leg where a waypoint is to be inserted.
The route leg data is shown in the status bar (Figure 3-24)and the
ROUTE OPTIONS function, with help text, is displayed (Figure 3-25):
Figure 3-25: Route Options Function
2. Press ENTER; the Route Leg functions are displayed (Figure 3-26):
Figure 3-24: Route Leg Data
Figure 3-26: Route Leg Functions
3. Select INSERT WAYPOINT.
The cursor now controls the route leg which is connected to the existing waypoints on either side of the cursor by a dotted line.
4. Using the trackpad, move the cursor to the required position and press
ENTER to place the new waypoint and return to normal cursor opera-
tion or
CLEAR to cancel the operation.
Note: If you move the cursor over an existing waypoint, the option to use
this waypoint appears.
5. Press
CLEAR again to remove the function bar and route leg data.
The waypoints in the current route are re-numbered to identify the
new positions.
Page 43

3-16 Raychart 425 Chartplotter
➤ To remove a waypoint from the route using the cursor:
1. Place the cursor over the waypoint; see Selecting a Waypoint on
page 3-4.
2. Select
3. Select
WAYPOINT OPTIONS; the Waypoint functions are displayed.
REMOVE WAYPOINT; the waypoint is removed from the route
and the remaining waypoints in the current route are renumbered
accordingly.
3.4 Following Routes and Going to Target Points
The GOTO key accesses the functions to follow a route or go to a
waypoint, port, nearest facility or current cursor position. When the target
destination is selected, the chartplotter calculates bearing, distance and
cross track error; this information can be repeated on other
instrumentation and passed to an autopilot via NMEA. Cross Track Error
(XTE) can be reset to zero from the actual vessel position.
When the chartplotter is following a route, the target destination is
indicated by a square around the waypoint (or cursor marker) and a dotted
line shows the intended track, from the start point or previous waypoint,
to the target waypoint.
This section explains how to perform the following tasks:
• Follow a route.
• Reverse a route.
• Target Point Arrival.
• Altering the route, including joining at a selected waypoint, advancing waypoints and restarting XTE.
• Go to an individual point, either an existing waypoint or the cursor.
• Go to the nearest facility or a selected port.
• Stop and Restart Follow/Goto.
An alarm is triggered when approaching a waypoint. Chapter 4 describes
how to set the alarm.
➤ To access the follow and goto functions:
1. Press
2. Select MORE to display the second level GOTO functions
GOTO to display the first level GOTO functions (Figure 3-27):
Figure 3-27: First Level GOTO Functions
(Figure 3-28):
Page 44

Chapter 3: Operation 3-17
Figure 3-28: Second Level GOTO Functions
3. Select MORE to return to the first level functions.
4. Press
Note: The functions differ if a
CLEAR to return to the chart screen.
FOLLOW or GOTO is already in progress
(see Stop Follow or Stop Goto on page 3-23).
Follow a Route
Note: If a route has been reversed or if a route on screen was being followed, but stopped before completion, the target waypoint (outlined by a
square box) may be different to when the route was created. The target
waypoint should always be checked before initiating a
➤ To follow the current route:
1. Press the
natively, place the cursor over a route leg until the Route functions are
displayed.
2. Select
The vessel’s current position becomes the origin and the first waypoint in
the current route becomes the target waypoint. A dotted line connects the
vessel’s current position to the target waypoint. This line remains fixed
on screen as the vessel moves. The function bar is removed.
GOTO key. The Goto/Follow functions are displayed. Alter-
FOLLOW ROUTE.
FOLLOW ROUTE.
Reverse a Route
This option enables a return route to be generated from an existing route
which is then followed in reverse order, with waypoints renumbered
accordingly.
➤ To reverse the current route:
From the normal chart display either:
1. Press
or
2. Move the cursor over a route leg or waypoint until the
The current route is reversed on the screen and the waypoints are
renumbered.
ENTER to display the primary function bar, then select ROUTES,
followed by
OPTIONS
and select
function is displayed. Press ENTER to display the options
REVERSE ROUTE.
MORE, then REVERSE ROUTE.
ROUTE
Page 45

3-18 Raychart 425 Chartplotter
➤ To follow the reversed route:
3. Press the
4. Press
The vessel’s current position becomes the origin and the first waypoint in
the reversed route becomes the target waypoint. The function bar is
removed.
GOTO key. The Goto/Follow functions are displayed.
FOLLOW ROUTE.
Target Point Arrival
Target alarms (see Chapter 4) can be set up to sound when the vessel is
approaching the target point. The arrival alarm is defined as a circle (not
visible on the screen), with a specified radius around the target.
The alarm is triggered when either of the following conditions is met:
• The distance to the target point is less than that specified for the
Arrival alarm.
• The vessel reaches the closest point of approach to the target (ie. it
crosses a line passing through the waypoint and perpendicular to the
track).
➤ To cancel the Arrival alarm and go towards the next waypoint in the
route, press any key.
The target becomes the origin, the next waypoint becomes the target
point and the two are connected by a dotted line indicating the current leg.
If the target waypoint was the subject of a
in a route, the pop-up alarm is cleared and any temporary waypoint is
removed.
GOTO, or was the last waypoint
Alter a Route
A route can be followed from a selected waypoint (Join a route) or, if
already following, advanced to the next waypoint. Also the XTE can be
restarted, setting the current vessel position as the new origin.
In addition, a selected waypoint can be moved as described in
Section 3.2, or removed from the route as described in Section 3.3.
Page 46

Chapter 3: Operation 3-19
Join a Route
➤ To start following the current route from a selected waypoint:
1. Move the cursor over a route waypoint until the
function is displayed (Figure 3-29):
Figure 3-29: Route Options Function
2. Press ENTER and select FOLLOW FROM HERE(Figure 3-30).
WAYPOINT OPTIONS
FOLLOW
FROM HERE
EDIT
WAYPOINT
REMOVE
WAYPOINT
MOVE
WAYPOINT
D4687_1
Figure 3-30: Waypoint Function
The vessel follows the route, using the selected waypoint as the target.
3. To return to chart mode, move the cursor away from the waypoint or
press
CLEAR.
Advance to a Waypoint
When following a route it is possible to advance to the next waypoint,
even if the current target waypoint has not been reached.
➤ To advance to a waypoint:
1. Press the
(Figure 3-31):
STOP
FOLLOW
2. Select WAYPOINT ADVANCE. The current leg of the route is aban-
doned and the next waypoint becomes the target. The display is
updated to show the new route leg.
GOTO key to display the Goto/Follow functions
RESTART
XTE
WAYPOINT
ADVANCE
D4688_1
Figure 3-31: GOTO/Follow Functions
Restart Cross Track Error (XTE)
Reset XTE is useful if you find yourself off track and prefer to go directly
to your target, rather than get back onto the original track.
Whilst following a route, or going to a target point, you can restart the
XTE. This sets the XTE to zero and moves the origin to the vessel’s actual
position.
Page 47

3-20 Raychart 425 Chartplotter
➤ To restart XTE:
1. Press the
If following a route, the following functions are displayed
(Figure 3-32):
GOTO key.
STOP
FOLLOW
RESTART
XTE
WAYPOINT
ADVANCE
Figure 3-32: GOTO Options (1)
If a GOTO is in progress, the following functions are displayed
(Figure 3-33):
STOP
GOTO
RESTART
XTE
Figure 3-33: GOTO Options (2)
2. Select RESTART XTE. The dotted line between the original origin and
the target waypoint is redrawn from the vessel’s current position to
the target waypoint and the XTE is reset to zero
Going to an Individual Target
Rather than following a route, you can go directly to a selected target.
This can be an existing waypoint, a port or nearest facility or the current
cursor position.
Go to a Waypoint
➤ To navigate directly to an existing waypoint:
1. From the normal chart display either:
i. Use the trackpad to position the cursor over the required waypoint
until the waypoint options function is displayed (Figure 3-34):
D4688_1
D4689_1
Figure 3-34: Waypoint Options
...then press ENTER to display the waypoint functions (Figure 3-35):
Figure 3-35: Waypoint Functions
Page 48

Chapter 3: Operation 3-21
or
ii. Press the
GOTO key to display the waypoint options and select
GOTO WAYPOINT; the waypoint list appears. Use the cursor to
select the required waypoint (Figure 3-36):
SIM NU
Figure 3-36: Waypoint List
D4991_2
Alternatively, a waypoint can be selected from the Waypoint List as
described in Section 3.2.
2. Select
GOTO WAYPOINT.
A dotted line is drawn from the vessel’s current position to the
selected waypoint and navigation to the selected waypoint begins.
Go to Cursor
Note: If navigation is currently in progress or if the cursor is homed
(Find Ship) it is not possible to go to cursor.
➤ To navigate directly to the current cursor position:
1. Press the
function now has help text appended to it (Figure 3-37):
GOTO
CURSOR
GOTO key and select GOTO CURSOR. The GOTO CURSOR
MOVE CURSOR, "ENTER" TO START
GOTO CURSOR, "CLEAR" TO QUIT
D4691_1
Figure 3-37: GOTO Cursor Function
Page 49

3-22 Raychart 425 Chartplotter
2. Use the trackpad to position the cursor as required.
3. Press
A temporary waypoint is placed at the cursor position and navigation
proceeds towards it. The temporary waypoint is shown as a square with a
dot in it’s centre and is connected to the vessel’s starting position by a
dotted line.
On arrival, the arrival alarm is sounded and the arrival pop-up box is
displayed.
Note: The temporary waypo int is not added to the waypoi nt list; when the
GoTo is complete, or is stopped, the temporary waypoint is erased.
ENTER to start the GoTo, or CLEAR to cancel the operation.
Go to a Port
You can navigate directly to the nearest port or to a selected port or
facility.
➤ To navigate directly to selected port:
1. Press the
2. Use trackpad up/down to select the required port and press
start the GoTo, or
A dotted line is drawn between the current vessel position and the target
waypoint which is placed at the port. The line remains fixed on the screen
as the vessel moves.
Bearing, Range and Cross Track Error are calculated for the target
waypoint in the same manner as for any other Goto or Follow function.
On arrival, the arrival alarm is sounded and the arrival pop-up box is
displayed.
GOTO key and select GOTO PORT to display the Port List.
ENTER to
CLEAR to cancel the operation.
➤ To navigate directly to the nearest port or facility:
1. Press the
The list shows the eight nearest places where the selected facility
exists, in order of distance. The bearing and range (in selected units)
for each one is shown.
2. Use trackpad up/down to select the required destination and press
ENTER to start the GoTo, or CLEAR to cancel the operation.
The operation is conducted in the same manner as for
GOTO key and select GOTO NEAREST to display the list.
GOTO PORT above.
Page 50

Chapter 3: Operation 3-23
Stop Follow or Stop Goto
➤ To stop following the route or target point:
1. Either press the
point.
2. Select the
GOTO key or move the cursor over the target way-
STOP GOTO or STOP FOLLOW function (Figure 3-38):
STOP
GOTO
STOP
FOLLOW
RESTART
XTE
RESTART
XTE
WAYPOINT
ADVANCE
Figure 3-38: Stop Follow/Stop Goto Soft Keys
The dotted line from the vessel to the target waypoint disappears.
3.5 Changing the Display Mode
Use the PAGE key to select the required display mode. Repeat presses of
the
PAGE key provide the following display modes:
• Set Up functions (see Chapter 4)
• Course Deviation Indicator (CDI)
• Bearing & Distance Indication (BDI)
• Waypoint data
• Navigation data
• Time/Date data
• Return to Chart display
Note: Press
play.
➤ To change the display mode:
1. Press the
highlighted (Figure 3-39):
GOTO in any display mode to return to normal Chart dis-
PAGE key to show the SET UP functions with SYSTEM SET UP
D4689_1
D4688_1
SYSTEM
SETUP
CHART
SETUP
TRACK
SETUP
GPS
SETUP
D4699_1
Figure 3-39: Setup Function Bar
2. Repeat Step 1 to cycle through each of the available display modes.
Note: The Set Up Function Bar remains displayed in each display mode.
To remove the Set Up Function Bar, press
CLEAR.
Page 51

3-24 Raychart 425 Chartplotter
CDI Display
The CDI display shows Cross Track Error (XTE) and distance to
waypoint presented in a ‘runway’ format (Figure 3-40):
Figure 3-40: CDI Display
D4700_1
The ‘runway’ represents a 0.3nm width with the vessel symbol shown at
the bottom. Bearing to Waypoint, Distance to Waypoint, Time to Go
(TTG), Course Over Ground (COG) and Speed Over Ground (SOG) are
also shown. Time to Go is calculated on the basis of distance to
destination and Speed Over Ground (SOG) towards the destination.
At waypoint ranges greater than 4nm, the symbol remains at the top of
the screen. As the waypoint range falls below 4nm, the symbol moves
down the centre line.
The checkered pattern moves down the screen to simulate movement
when SOG is greater than 2 knots.
The steering instruction is
more to port,
COURSE
STEER PORT if the XTE is 0.01nm or more to starboard or ON
if the XTE is less than 0.01 on either side. If no GOTO or follow
is in progress, the steering instruction is
STEER STARBOARD if the XTE is 0.01nm or
NO TARGET.
The graphical XTE indication places arrows either side of the steering
instruction and pointing towards it, dependent on the value of XTE.
Page 52

Chapter 3: Operation 3-25
The first arrow is shown when the XTE reaches 0.01nm, the second
at.05nm and subsequently at 0.1nm intervals.
BDI Display
The BDI display shows deviation from the bearing to waypoint and
distance to waypoint. Cross track Error, Bearing to Waypoint, Distance to
Waypoint, Time to Go, COG and SOG are also shown. Time To Go is
calculated on the basis of distance to destination and velocity made good
towards destination (Figure 3-41).
Figure 3-41: BDI Display
D4701_1
The line to the waypoint symbol is shown at an angle equal to the
difference between the COG and the Bearing to Waypoint.
The range scale automatically scales for distance. The ranges shown are
1nm, 4nm, 20nm, 40nm, 100nm, 200nm, 400nm, 1000nm, 2000nm,
4000nm. In each case the range scale has graduations at ¼, ½ and ¾ of the
current scale.
The steering instruction is
more to port,
STEER PORT if the waypoint line is 1° or more to starboard or
STEER STARBOARD if the waypoint line is 1° or
ON COURSE if the waypoint line is dead ahead. If no GOTO or follow is in
progress, the steering instruction is
NO TARGET, no steering arrows are
shown, but the rhumb line indicator is shown.
Page 53

3-26 Raychart 425 Chartplotter
The graphical XTE indication will place arrows either side of the steering
instruction and pointing towards it dependent on the difference between
COG and bearing to Waypoint. The first arrow is shown when the
difference reaches 5° and thereafter at 5° intervals.
Waypoint Data
The Waypoint Data display comprises text data occupying the whole
screen (Figure 3-42).
ROUTE
ROUTE 01
WAYPOINT
WPT 001
BRG 234° T
RNG 12.4 nm
COG 230° T TIME 13:29 12/12/99
SOG 6.8 Kts TTG 01:03
XTE 0.5 nm ETA 14:32 12/12/99
STEER STARBOARD
Figure 3-42: Waypoint Data Display
D4702_1
If a route is not selected, the ROUTE field displays NO ROUTE.
The
WAYPOINT field shows the name of the waypoint. If the waypoint is
part of a route then the title field includes the waypoint index in the route.
If there is no target waypoint the text indicates
NO WAYPOINT and all
waypoint data is shown as dashes, one per character. If a route is being
followed and the waypoint is not named, the text shows the waypoint
number within the route (as displayed on screen). If a
Port is in progress, the text indicates
GOTO CU RSOR or GOTO ‘Port Name’.
GOTO Cursor or
BRG, RNG and XTE data relate to the target waypoint.
Time refers to time data which is acquired from GPS information. Any
local time offset is set in the System Set Up menu, see Chapter 4.
Page 54

Chapter 3: Operation 3-27
The Time To Go (TTG) and Estimated Time of Arrival (ETA) data relate
to the target waypoint (not the whole route) and are based on the Speed
Over Ground (SOG) towards the target. If the VMG is negative, or data is
not available, these fields are replaced by dashes, one per character.
The steering instruction is
more to port,
COURSE
If no
GOTO or follow is in progress, the steering instruction is NO TARGET,
no steering arrows are shown, but the rhumb line indicator is shown.
The graphical XTE indication places arrows either side of the rhumb line
indicator and pointing towards it, dependent on the value of XTE. The
first arrow is shown when the XTE reaches 0.01nm, the second at.05nm
and subsequently at 0.1nm intervals.
Note: The steering instruction and graphical XTE indication are repeated on all text-only displays.
STEER PORT if the XTE is 0.01nm or more to starboard or ON
if XTE is less than 0.01 on either side.
STEER STARBOARD if the XTE is 0.01nm or
Navigation Data
The Navigation Data display comprises text data occupying the whole
screen (Figure 3-43):
POSITION
50°45.252 N
1°06.000 W (c)
COG 230° T
SOG 6.8 Kts
WAYPOINT 001
BRG 234° T GPS FIX OK
RNG 2.4 nm TIME 14:32 12/12/99
STEER STARBOARD
Figure 3-43: Navigation Data Display
D4703_3
Page 55

3-28 Raychart 425 Chartplotter
Textual data provides Position, SOG, COG, Bearing and Range to
waypoint, Time, Fix status and the XTE indicator. Any unavailable data
is replaced by dashes, one per character. When there is no GPS fix but
there is a value for the last fix, this is shown instead;
with
LAST POSITION.
POSITION is replaced
The (c) indicator only appears when the position has been user calibrated.
The Fix indicator shows the GPS Fix status and indicates either
or NO FIX.
SD FIX
FIX OK,
Note: Graphical XTE indicator is as per Waypoint Data on page 3-26.
Time/Date Data
The Time/Date display comprises text data occupying the whole screen
(Figure 3-44):
SUNRISE 06.23
SUNSET 21.34 TODAY
AT POSITION (USER SELECTED)
50°45 .000 N
001°06 .000 W (c)
TIME 12:34
DATE 26/01/99
ETA (WAYPOINT) 13:37 26/01/99
TTG (WAYPOINT) 01:03
ETA (ROUTE) 14:32 27/01/99
TTG (ROUTE) 34:03
STEER STARBOARD
Figure 3-44: Time/Date Data Display
Textual data provides Sunrise and Sunset time, Current Time/ Date,
Waypoint and Route arrival times plus the XTE indicator.
Sunrise and Sunset times are for the selected day and at the selected
position. The
TODAY indicator emphasizes that the sunrise and sunset
times relate to the current day. If another day is selected, the
replaced with
ON XX/XX/XX where XX/XX/XX is the selected date in the
current format.
D4704-1
TODAY text is
Page 56

Chapter 3: Operation 3-29
When the Time/Date screen is first opened, the data relates to the current
day, unless there is no date information available. In this case the last date
is used. The vessel’s current position is used unless there is no GPS fix in
which case the cursor position is used and shown as a
USER SELECTED
position.
The position data can be either as selected by you, in which case the text
relating to the position is
case the text is
VESSEL.
USER SELECTED, or the current position in which
The (c) indicator only appears when the position has been user calibrated.
The Time and Date fields show the local current time and date.
The
TTG and ETA (WAYPOINT) data relates to the target waypoint. The TTG
and
ETA (ROUTE) data relates to the end of the route.
All data is based on the SOG towards the current target. If the SOG is
negative, or data is not available, these fields are replaced with dashes,
one per character.
➤ To display Sunrise/Sunset information for a different date:
1. If the Set Up functions are displayed, press
press
ENTER to display the position functions (Figure 3-45).
CLEAR to remove them;
SET
POSITION
PREVIOUS
DAY
TODAY
NEXT
DAY
D4992_1
Figure 3-45: Position Functions
2. Select PREVIOUS DAY or NEXT DAY as required to display Sun-
rise/Sunset information for a particular date.
3. Select
TODAY to return the display to current date.
➤ To set the position data manually:
1. Display the Position functions as described for Sunrise/Sunset display above (Figure 3-45).
2. Select
SET POSITION then either:
VESSEL POSITION which sets the position to the current position of
i.
the vessel, or
ii.
SELECT POSITION which enables specific Latitude/Longitude data
to be entered.
Use cursor left/right to select individual characters to edit.
Use cursor up/down to select the required character.
iii.Press
ENTER to complete, or CLEAR to abort, the change(s).
Page 57

3-30 Raychart 425 Chartplotter
3.6 Transferring Waypoints and Routes
Displayed Waypoints
Waypoints and routes can be received and transmitted via NMEA, see
also Chapter 5, Section 5.4, Installing the Chartplotter. The NMEA link
could be to a PC, typically via a spare RS232 COM port.
Managing Database Lists
The SEND WAYPOINTS function sends all waypoints in the Waypoint List
and all routes in the Route List. Sending the Waypoint List does not affect
current routes.
Note: Sending the Waypoint List includes waypoints in an unsaved route.
The
RECEIVE WAYPOINTS function adds waypoints and routes received
via NMEA to the Waypoint List and Route List.
Note: Where multiple waypoints have the same position, the last waypoint sent is the only one included in the Waypoint List.
➤ To send waypoints (and route lists):
1. From chart mode, press
(Figure 3-46):
ENTER; the primary function bar is displayed
Figure 3-46: Primary Function Bar
2. Using trackpad left/right, select WAYPOINTS (Figure 3-47).
Figure 3-47: Waypoint Function Bar
3. Select WAYPOINT LIST.
The Waypoint List is displayed, with its associated function bar
(Figure 3-48):
Figure 3-48: Waypoint List Function Bar
4. Initiate receiving of waypoints on the NMEA compatible equipment.
5. Select
WPT/ROUTE TRANSFER.
Page 58

Chapter 3: Operation 3-31
The waypoint transfer functions are displayed (Figure 3-49):
Figure 3-49: Waypoint Functions
6. Select SEND WAYPOINTS and press ENTER; the text changes to
STOP SENDING.
7. To stop waypoint transfer, press
ENTER.
➤ To receive waypoints and route lists:
1. Display the Waypoint List as previously described, then select
WPT/ROUTE TRANSFER.
2. Select
RECEIVE WAYPOINTS and press ENTER; the text changes to
STOP RECEIVING and remains selected.
3. Initiate sending waypoints on the NMEA compatible equipment.
4. To stop waypoint transfer, press
ENTER.
Note: If either the Waypoint List or Route List becomes full, a warning is
displayed and the operation is terminated.
3.7 Using Tracks
The Track function is used to mark an on-screen trail that the vessel has
followed, as if it had left a visible fixed wake.
While the track is turned on, it is recorded in the display unit’s memory.
You specify the interval at which track points are made and a line is drawn
on-screen between each point. Up to 2000 track points can be saved in
total.
The track remains on-screen, even following a Power off/on, until the
track is cleared.
Using the SmartRoute function, a track can also be converted to and
saved as a route which is automatically reversed, ready for use as a return
voyage.
This section describes how to:
• Set up a track and specify the interval between track points.
• Clear the current track.
• Convert the track to a route (SmartRoute).
Page 59

3-32 Raychart 425 Chartplotter
➤ To access the track controls:
1. From chart mode, press the
tion bar (Figure 3-50):
PAGE key to display the chart set up func-
Figure 3-50: Set Up Function Bar
2. Select TRACK SET UP to display the Track function bar (Figure 3-51):
Figure 3-51: Track Set Up Options
The following instructions assume that the track functions are displayed.
Setting up a Track
Use the track functions to switch the track on and to specify the interval at
which track points are placed. The time interval between track points can
be set to 1s, 10s, 30s, 1min, 10min or 30 minutes. The distance spacing
between track points can be set to 0.05nm, 0.1nm, 0.5nm or 1nm. The
maximum track length is 2000 points. When this limit has been reached,
track points continue to be placed, but the oldest points start to be deleted.
Track points continue to be placed until the track is switched off. The
current track is retained even when the unit is powered off.
Setting a short time interval between track points is best suited to
navigation within a close or complex environment, eg. an estuary or
marina whereas, in contrast, a greater distance interval is best suited to a
long haul voyage.
When complete, a track can be converted to and saved as a route
(SmartRoute).
Refer to the track interval setting guide (Figure 3-52) to determine the
best setting for your planned voyage; this is particularly important if you
wish to use SmartRoute to convert the track to a route.
D4694_1
Page 60

Chapter 3: Operation 3-33
1 s
10 s
33 min
5 hrs, 30 min
30 s
1 min
10 min
30 min
0.05 nm
0.1 nm
TRACK INTERVAL SETTING
0.5 nm
1.0 nm
16 hrs, 40 min
33 hrs, 20 min
13 days, 21 hrs, 20 min
41 days, 16 hrs
TRACK TIME
100 nm
200 nm
1000 nm
2000 nm
TRACK DISTANCE
D4971_1
Figure 3-52: Track Interval Setting Guide
➤ To set up a track:
1. Select the
Use trackpad up/down to select the appropriate options to set either a
time interval or a distance interval; press up to increase the interval or
down to decrease the interval.
2. Use trackpad left/right to select
The
The vessel’s track is displayed on-screen with a line joining the points at
the selected interval.
INTERVAL function.
TRACK ON and press ENTER.
TRACK ON text changes to indicate TRACK OFF.
Clearing the Current Track
The current track can be cleared from the screen.
➤ To clear the current track:
1. Select
2. If no further track points are to be placed, select
CLEAR TRACK.
The current track is cleared from the screen and memory.
ENTER; the TRACK OFF text changes to indicate TRACK ON.
TRACK OFF and press
Page 61

3-34 Raychart 425 Chartplotter
SmartRoute
SmartRoute enables the latest track to be converted to a route.
➤ To convert a track to a route:
1. Select
If there is an unsaved current route on screen, the option to save the route
is given, see Section 3.3, Working with Routes.
2. Check the calculated route and, in particular, that the route deviation
MAKE INTO ROUTE and press ENTER.
The current track is converted to a new route, with the most recently
placed track point as the start of the route, ie. the track is reversed.
from the original, given in the warning box, is within navigable limits.
3.8 Displaying Chart Information
Nav-Chart cards include a number of displayed objects for which data is
available, eg. lights, buoys, ports or tidal data. Placing the cursor over an
object displays its associated data in a pop-up box. Typical examples for
Port Services and Tide Information are given below.
Port Services
At detailed chart scales, placing the cursor over a port symbol enables
detailed information to be displayed. Port information is indicated by the
symbol. The port facilities are listed in the object information pop-up
and, where available, details for each facility can be displayed.
In some areas the chart shows symbols for individual facilities. These
facilities and symbols are dependent upon the particular area Nav-Chart
card used.
➤ To obtain port services information:
1. Place the cursor over the port symbol for which information is
required. The
played (Figure 3-53):
2. To view the port services available, press ENTER. The available services are listed on-screen in an object information pop-up
(Figure 3-54):
PORT SERVICES function, together with help text, is dis-
D4707_1
Figure 3-53: Port Services Function
Page 62

Chapter 3: Operation 3-35
OTHER INFORMATION
FUEL
GENERAL SERVICES
FIRST AID
OTHER UTILITIES ON THE PIER
WATER
REPAIR SERVICES
D4993_1
Figure 3-54: Available Port Services
3. Use the trackpad to select the required service and press ENTER to
display further details (Figure 3-55):
HOTELS
RESTAURANTS
BANKS
LAUNDRIES
CAR RENTAL
FISHING/DIVING
ICE
D4709_1
Figure 3-55: Port Service Details
4. To see more options (if available), select the.......More....... option
and press
5. Press
ENTER.
CLEAR to remove the pop-up from the screen.
Page 63

3-36 Raychart 425 Chartplotter
Tide Information
At detailed chart scales, placing the cursor over a Tide Height or Current
symbol for more than 0.5 seconds enables detailed tide information to be
displayed in an object information pop-up box. Soft keys enable
Sun/Moon Data and Previous/Next Day information to be displayed.
Tidal Height
➤ To obtain Tide Height Data:
1. Place the cursor over a Tide Height symbol
The Tidal Heights soft key and help text appear (Figure 3-56).
TIDAL
HEIGHTS
2. Press ENTER to show the Tidal Heights information (Figure 3-57) or
CLEAR to cancel the operation. If no Fix is available (to provide date
information), a warning box appears.
The ‘Port Name’ is that supplied by the Nav-Chart cartridge. The Tidal
Height graph is automatically scaled. The cursor, represented by a dashed
line, can be moved along the horizontal axis by means of the Trackpad. A
CURSOR data box below the graph shows corresponding TIME and
HEIGHT.
Times and heights of
individual boxes.
DATE and TIME for TODAY (default) are shown with PREVIOUS/NEXT DAY
information available via the
of these two soft keys moves the date back/forward one day at a time.
3. To return to chart display, press
"ENTER"FOR TIDAL INFORMATION,
"CLEAR" OR MOVE CURSOR QUITS
D4972_1
Figure 3-56: Tidal Heights Soft Key
HIGH WATER and LOW WATER are shown in their
MORE OPTIONS soft key; repeated presses
CLEAR.
Page 64

Chapter 3: Operation 3-37
NANTUCKET
M
1.30
1.06
0.81
0.57
0.33
0.08
-0.15
0
2
TIDAL HEIGHT
4 6 8 10121416182022
TIME
24
CURSOR
TIME 4:18
HEIGHT 1.28 m
HIGH WATER
12:17 0.97 m
--:-- ---.-- m
MORE
OPTIONS
"ENTER" TO SELECT MOON DATA
AND DATE, "CLEAR" QUITS
TODAY
DATE:13/ 7/99
TIME:04:13:56
LOW WATER
5:37 -0.16 m
17:37 -0.00 m
D4973_2
Figure 3-57: Tidal Height Display
➤ To display the Tide Height at a particular Date/Time:
1. Press
SUN/MOON
2. Using trackpad left/right, select PREVIOUS DAY or NEXT DAY soft key;
3. Using trackpad left/right, move the cursor to the required time of day.
4. Select
ENTER to select MORE OPTIONS; the SUN/MOON DATA soft
keys are shown (Figure 3-58).
DATA
PREVIOUS
DAY
TODAY NEXT
DAY
D4975_1
Figure 3-58: Sun/Moon Data Soft Keys
press
ENTER the appropriate number of times to select the required
Date.
The Cursor box shows the Tide Height for that particular Date/Time.
TODAY to return to current Date/Time.
Page 65

3-38 Raychart 425 Chartplotter
➤ To display Sun/Moon data:
1. Select
SUN/MOON DATA.
The
SUN rise/set and MOON rise/set times are shown in individual
boxes.
The
MOON PHASE box indicates the number of days referred to full
moon, together with a pictorial representation (Figure 3-59).
NANTUCKET
M
1.30
1.06
0.81
0.57
0.33
0.08
-0.15
2 4 6 8 10 12 14 16 18 20 220
TIDAL HEIGHT
24
TIME
SUN
RISES 4:18
SETS 19:13
MOON
RISES 4:50
SETS 19:45
TIDAL
HEIGHTS
PREVIOUS
DAY
TODAY
DATE:13/ 7/99
TIME:04:13:56
MOON PHASE
FIRST QRT
IN 7 DAYS
TODAY
NEXT
DAY
D4976_2
Figure 3-59: Tidal Heights & Sun/Moon Data Display
2. Select TIDAL HEIGHTS or press CLEAR to return to the Tidal Heights
data.
Page 66

Chapter 3: Operation 3-39
Tidal Current
➤ To obtain Tidal Current Data:
1. Place the cursor over a Tide Current symbol
The Tidal Current soft key and help text appear (Figure 3-60).
TIDAL
CURRENT
2. Press ENTER to show the Tidal Current information and soft keys
(Figure 3-61) or
"ENTER"FOR TIDAL INFORMATION,
"CLEAR" OR MOVE CURSOR QUITS
D4978_1
Figure 3-60: Tidal Current Soft Key
CLEAR to cancel the operation.
NANTUCKET HARBOR
kts
1.75
1.46
1.18
0.89
0.60
0.32
0.03
0
2
CURSOR
TIME 4:30
SET 350°
DRIFT 1.1Kts
TIDAL CURRENT
4 6 8 10121416182022
TIME
TODAY
DATE: 13/ 7/99
TIME: 01:15:10
24
MAX
EBB
FLOOD
EBB
FLOOD
MORE
OPTIONS
TIME SET DRIFT
3:21 350° 1.7Kts
8:02 171° 1.3kts
15:59 350° 1.6Kts
20:24 171° 1.2Kts
SLACK
--:-12:02
5:56
18:31
"ENTER" TO SELECT MOON DATA
AND DATE, "CLEAR" QUITS
D4979_3
Figure 3-61: Tidal Current Display
The ‘Port Name’ is that supplied by the Nav-Chart cartridge. The Tidal
Current graph is automatically scaled. The cursor, represented by a
dashed line, can be moved along the horizontal axis by means of the
Page 67

3-40 Raychart 425 Chartplotter
Trackpad. A CURSOR data box below the graph shows corresponding
TIME, SET and DRIFT.
DATE and TIME for TODAY (default) are shown with PREVIOUS/NEXT DAY
information available via the
MORE OPTIONS soft key; repeated presses
of these two soft keys moves the date back/forward one day at a time.
Times of
figures are shown. A separate box shows corresponding
MAXimum EBB and FLOOD Tides, together with SET and DRIFT
SLACK figures.
These data correspond to the selected Date/Time.
3. To return to chart display, press
CLEAR.
➤ To display the Tidal Current data for a particular Date:
1. Press
SUN/MOON
2. Using trackpad left/right, select PREVIOUS DAY or NEXT DAY soft key;
3. Select
ENTER to select MORE OPTIONS; the SUN/MOON DATA soft
keys are shown (Figure 3-62).
DATA
PREVIOUS
DAY
TODAY NEXT
DAY
D4975_1
Figure 3-62: Sun/Moon Data Soft Keys
press
ENTER the appropriate number of times to select the required
Date.
TODAY to return to current Date/Time.
➤ To display Sun/Moon data:
1. Select
2. Select
SUN/MOON DATA; the SUN rise/set and MOON rise/set times are
shown in individual boxes.
The
MOON PHASE box indicates the number of days referred to full
moon, together with a pictorial representation (Figure 3-63).
TIDAL CURRENT or press CLEAR to return to the Tidal Current
data.
Page 68

Chapter 3: Operation 3-41
NANTUCKET HARBOR
kts
1.75
1.46
1.18
0.89
0.60
0.32
0.03
0
2
TIDAL CURRENT
4 6 8 10121416182022
TIME
24
SUN
RISES 4:18
SETS 19:13
MOON
RISES 4:50
SETS 19:45
TIDAL
CURRENT
PREVIOUS
DAY
Figure 3-63: Tidal Current & Sun/Moon Data Display
3.9 Man Overboard (MOB)
If a person or object is lost overboard, and you need to return to the
location, use the Man Overboard (MOB) function.
Note: To obtain MOB position, a valid GPS fix must be available.
➤ To initiate the MOB procedure from the Chart display, press and hold the
GOTO key for two seconds. The system performs the following tasks
automatically:
• Stops any GoTo or Follow operation.
• Selects a
• Marks the current position as a temporary waypoint with an MOB
symbol which replaces any current active waypoint and route.
• Displays the MOB data box, showing the bearing and range to the
MOB position, the elapsed time since the MOB was initiated and
COG data (Figure 3-64).
1
/2 nm scale (even if cartography is not available).
TODAY
DATE:13/ 7/99
TIME:01:16:56
MOON PHASE
FIRST QRT
IN 7 DAYS
TODAY
NEXT
DAY
D4980_2
Page 69

3-42 Raychart 425 Chartplotter
Figure 3-64: MOB Data Box
• Sends an MOB message, including bearing and range, to other units
in the system, via NMEA.
Notes: (1) A suffix (c) to the POSition data indicates that the vessel’s
position has been User Calibrated, see Chapter 4,Chart Set
Up Parameters.
(2) The
RANGE key operates normally to change chart scale.
➤ To cancel MOB, press and hold the GOTO key for 2 seconds.
The MOB symbol and data box are removed and the unit returns to
normal Chart mode.
3.10 Alarms
The chartplotter reports the following alarms (Table 3-1 ):
Table 3-1: Alarm Settings
Alarm Indicates
Arrival The vessel has arrived at the active waypoint: it has either reached
XTE The vessel has exceeded the specified distance (maximum cross
Anchor The vessel has drifted from its anchor position (set when the alarm
No Fix GPS fix or Differential data has been lost for more than 30 s.
the arrival circle (the radius of w hich is specified) or, has r eached its
closest point of approach (defined by a line passing through the
waypoint and perpendicular to the track).
track error) from the active route leg.
was turned on) by more than the specified distance.
The alarms are switched on or off, and the limits set, using the Chart Set
Up function via the
PAGE key menu, see Chapter 4, Section 4.3, Chart
Set Up Parameters.
When an alarm is triggered, the alarm buzzer sounds and a pop-up box,
describing the alarm, is displayed.
➤ To silence the alarm and clear the message, press any key.
Page 70

Chapter 4: Setting Up 4-1
Chapter 4: Setting Up
4.1 Introduction
When you have installed your system and are familiar with its basic
operation, you may wish to set it up to operate according to your
requirements and display information according to your preferences.
This is achieved using the function controls which are displayed when the
PAGE key is pressed. These settings can be changed at any time.
When your preferences are set, they maintain until they are reset and are
retained even when the unit is powered off.
This chapter covers the following topics:
• System parameters and default settings.
• Chartplotter-specific parameters and default settings.
The set up parameters are selected via three soft keys:
• System Set Up: controlling overall functionality.
• Chart Set Up: controlling the chartplotter functions, including way-
point information and vectors.
• GPS Set Up: displaying the Raystar 120 GPS receiver status.
Note: The additional
eration.
TRACK SET UP function is covered in Chapter 3:Op-
This section provides instructions for displaying and changing the
factory default values to your preferences. The following sections list the
parameters with their possible settings and describe the function of each
parameter in turn.
4.2 System Set Up Parameters
➤ To set the System default parameters:
1. From chart mode, with no function bar displayed, press the
to display the
2. Use trackpad left/right to highlight SYSTEM SET UP and press ENTER
to display the System Set Up menu (Figure 4-2):
SET UP function bar (Figure 4-1):
Figure 4-1: Set Up Function Bar
PAGE key
D4694_1
Page 71

4-2 Raychart 425 Chartplotter
Figure 4-2: System Set Up Menu
3. Use trackpad up/down to move the highlight up or down the list.
4. When the required parameter is highlighted, use trackpad left/right to
step through the settings.
5. When the required values have been chosen, press
ENTER to imple-
ment the change and return to the set up function bar.
6. Press
CLEAR to clear the function bar and return to the chart display.
Note: To return all settings to their original factory settings, perform a
factory reset as described in Chapter 6.
Table 4-2 lists the System menus and their options, shows the factory
default settings and provides space to make a note of personal settings.
Each parameter is described in the following subsections.
Table 4-2: System Menu Options
Menu Item Options
BEARING
MODE
KEY BEEP OFF/ON ON
DISTANCE
UNITS
SPEED UNITS KNOTS
MAGnetic/TRUE TRUE
NAUTICAL MILES (nm)
KILOMETERS (km)
STATUTE MILES (sm)
KILOMETERS PER HOUR
(KPH)
MILES PER HOUR (MPH)
Factory
Default New Setting
NAUTICAL
MILES
KNOTS
Page 72

Chapter 4: Setting Up 4-3
Table 4-2: System Menu Options (Continued)
Menu Item Options
DEPTH UNITS METRES
VARIATION 30°W to 30°E (1° steps) 0.0°E
DATE FORMAT DD/MM/YY or MM/DD/YY DD/MM/YY
TIME OFFSET UTC or local offset value
LANGUAGE Multi Language ENGLISH
SIMULATOR OFF/ON OFF
SIMULATED
SOG
SIMULATED
COG
Bearing Mode
The mode (MAGnetic or TRUE) of all bearing and heading data displayed.
This is indicated by
Key Beep
This setting controls audible feedback resulting from operation of the
keys.
Note: Alarms remain active.
Factory
Default New Setting
METRES
FEET
FATHO MS
UTC
up to 13 hours in 1 hour
steps
00Kt to 99Kt in 1Kt steps 00Kt
000° to 359° in 1° steps 000°
M or T in the BRG or COG field of the Chart status bar.
Units
This sets the units for distance, speed and depth. This setting will be used
to display all data. However, the distance units do not affect the chart
scale, which is always in nautical miles.
Variation
The variation value is the difference between True and Magnetic
direction data for heading or bearing values. The Magnetic value is
derived from True by applying the user selected value of variation.
The variation is varied in 1° steps to 30° East or West. Press trackpad right
to move the value eastward, or left to move it westward. The selected
value is retained when the unit is switched off. The Default value is zero.
Page 73

4-4 Raychart 425 Chartplotter
Date Format
Set the preferred date format (DD/MM/YY or MM/DD/YY). The selected
setting is retained when the unit switched off. The Default is
DD/MM/YY.
Time Offset
To display local time, use the trackpad to change from UTC to the required
time offset. This can be up to ±13 hours, in 1 hour steps. The default is
UTC.
Language
Select the language in which information is to be displayed. The selected
language is used for screen text, labels, menus and options. Chart text,
provided by the chart card, is not affected.
Simulator
The simulator allows operation of the Raychart 425 without data from
external sources. The options are
When
ON is selected the simulator generates position, SOG and COG
data and uses the simulated data instead of any real data. A flashing
status indicator is displayed in the left hand corner of the Status Bar at the
top of the screen.
Note: The simulated data overrides any real data that the display unit is
receiving from externally connected equipment.
ON or OFF.
SIM
The position is initially the position of the cursor when the simulator is
switched on and the SOG and COG are as selected by the user. The
position is updated to reflect the SOG and COG. See Simulated SOG and
Simulated COG below.
If a GOTO or Follow is started, the simulator does not use the selected
value of COG but, instead, generates a value of COG that simulates the
navigation function in progress. When GOTO or Follow is stopped, the
user selected value of COG is used.
Simulated SOG
Use horizontal movements of the trackpad to adjust the value of SOG
which is adjustable in 1 knot intervals from 00 to 99.
The Default value is zero and the selected value is retained on power
down.
If the simulator is switched
adjustment is possible.
OFF, the value is shown as dashes and no
Page 74

Chapter 4: Setting Up 4-5
Simulated COG
Use horizontal movements of the trackpad to adjust the value of COG
which is adjustable in 1° intervals from 000° to 359°. It wraps around
from 000 to 359 and from 359 to 000.
The Default value is zero and the selected value is retained on power
down.
If the simulator is switched
adjustment is possible.
OFF, the value is shown as dashes and no
4.3 Chart Set Up Parameters
The CHART SET UP function allows the chartplotter to be set up according
to your system configuration and your personal preferences.
➤ To set the Chart default parameters:
1. Press the
PAGE key to display the SET UP function bar (Figure 4-3):
Figure 4-3: Set Up Function Bar
2. Use the trackpad left/right to highlight the CHART SET UP function and
press
ENTER to display the Chart Set Up menu (Figure 4-4):
Figure 4-4: Chart Set Up Menu
D4694_1
Page 75

4-6 Raychart 425 Chartplotter
3. Use trackpad up/down to highlight the required parameter, then use
trackpad left/right to select the required setting.
4. When the required values have been set, press
ENTER to clear the
menu and return to the set up function bar.
5. Press
CLEAR to clear the function bar and return to the normal dis-
play.
Note: To return all settings to their original factory settings, perform a
factory reset as described in Chapter 6.
Table 4-3 lists the Chart Set up parameters and their options, shows the
factory default setting and provides a space to make a note of the new
default setting. Each parameter is described in the following subsections.
Table 4-3: Chart Setup Parameters
Parameter Options
ORIENTATION NORTH UP
COURSE UP
HEAD UP
PLOTTER MODE OFF/ON ON
SHOW WAYPOINTS OFF/ON ON
WAYPOINT SYMBOL FISH, SCULL,
ANCHOR or X
AUTOZOOM OFF/ON ON
SCREEN AMPLIFIER OFF/ON ON
COG VECTOR OFF/ON OFF
ARRIVAL CIRCLE 0.01nm, 0.05nm,
0.1nm, 0.5nm
ANCHOR ALARM OFF, 0.01nm,
0.05nm, 0.1nm,
0.5nm
XTE ALARM OFF, 0.01nm,
0.05nm, 0.1nm,
0.3nm, 0.5nm
CHART TEXT OFF/ON ON
CHART BOUNDARIES OFF/ON ON
Factory
Default New Setting
NORTH UP
X
0.1nm
OFF
OFF
DEPTH CONTOURS
<5M
OFF/ON ON
Page 76

Chapter 4: Setting Up 4-7
Table 4-3: Chart Setup Parameters (Continued)
Parameter Options
DEPTH CONTOURS
10M
DEPTH CONTOURS
>20M
POSITION CALIBRATION
Orientation
The chart orientation is normally North Up, but can be changed to Course
Up or Head Up. The selected mode is always shown in the inverse video
Mode Indicator in the top left hand corner of the Status Bar at the top of
the display in the form
Up). The orientation modes function as follows:
• North Up: The chart is displayed with north upwards. This is the
default mode and is the only mode available if there is no
• Course Up: The chart is rotated such that the currently selected
course (bearing to the target waypoint) or, if no navigation function is
taking place, the current
To update the Course Up reference whilst Course Up is the current
mode, re-select
If a new course is selected, eg. a new target waypoint, the chart displays the new course upwards.
• Head Up: The chart is displayed with the vessel’s current COG
upwards. As the heading changes the chart rotates periodically to
maintain orientation.
Note: Head Up and Course Up modes are dependent upon a valid GPS
fix.
Factory
Default New Setting
OFF/ON ON
OFF/ON ON
OFF/ON/SET CAL OFF
NU (North Up), HU (Heading Up) or CU (Course
COG data.
COG value is shown upwards.
COURSE UP from the set up menu.
Plotter Mode
Plotter mode allows the user to zoom in beyond the level of cartography
and continue to use plotter functions. The selected setting is retained
when unit switched off.
Show Waypoints
This option controls whether or not the waypoints are shown on the Chart
display, with their appropriate symbols. The active waypoint, and
waypoints in the current route, are always shown.
Page 77

4-8 Raychart 425 Chartplotter
Waypoint Symbol
This option allows selection of the symbol for waypoint display. The
selected symbol is used for subsequent waypoints. Existing waypoints
are not affected. The selected symbol is retained when the unit switched
off.
Autozoom
When autozoom is enabled, commencing any navigation function or
selecting
chart range and position such that the vessel and the target waypoint are
both on screen but at the largest scale possible. Moving the cursor off the
vessel, or changing scale, deactivates Autozoom.
Autozoom will not zoom in beyond the largest cartographic scale (unless
Plotter Mode is activated). When in
automatically and will zoom in as far as possible, irrespective of the
selection of Plotter Mode.
FIND SHIP activates Autozoom. When active, this selects the
MOB mode, Autozoom is selected
Screen Amplifier
Screen amplifier mode makes best use of the screen by positioning the
vessel on the screen so as to increase forward visibility. The screen
amplifier is only active when the cursor is ‘homed’ on the vessel.
COG Vector
When ON, a vector line from the vessel is drawn in the direction of COG.
This line extends to the edge of the screen. If COG is not valid, no line is
drawn. The selected setting is retained when the unit switched off.
Arrival Circle
The selected value is used as the arrival circle radius. When approaching
the target waypoint, this is the distance at which the arrival alarm sounds.
The selected setting is retained when unit switched off. Arrival criteria
are met when the arrival circle is entered or a line perpendicular to the
desired track and passing through the waypoint is crossed.
Anchor Alarm
The selected value is used as the anchor alarm distance. If the vessel
moves outside of the selected distance from its position (at the time that
the alarm was enabled) the alarm sounds and an alarm message is
displayed.
Page 78

Chapter 4: Setting Up 4-9
To silence the alarm, press any key. This removes the warning and resets
the distance, ie. the alarm will not sound again unless the vessel moves
the selected distance from its position (at the time that the alarm was
silenced). The alarm is set to
OFF on power up.
XTE Alarm
The selected value is used as the cross track error limit. The alarm sounds
when the cross track error exceeds the selected limit when a
Route Follow is in progress and an alarm message is displayed.
GOTO or a
Chart Text
When ON, Chart text, eg. place names are shown on the screen. The
selected setting is retained when the unit switched off.
Chart Boundaries
When ON, Chart boundary lines are shown on the screen. The selected
setting is retained when the unit switched off.
Depth Contours <5M
When ON, depth contours less than 5 metres are shown. The selected
setting is retained when the unit switched off.
Depth Contours 10M
When ON, depth contours of 10 metres are shown. The selected setting is
retained when the unit switched off.
Depth Contours >20M
When ON, depth contours greater than 20 metres are shown. The selected
setting is retained when the unit switched off.
Position Calibration
When ON, all position data is offset from WGS 84 by the amount of the
selected calibration and is suffixed by (c). The selected setting is retained
when the unit switched off. The default calibration offset is zero.
Page 79

4-10 Raychart 425 Chartplotter
➤ To perform position calibration:
1. Using horizontal trackpad movements, select
The menu is removed and a single function and help text are shown
(Figure 4-5):
SET CAL.
2. Using the trackpad, set the value of offset required. The distance and
bearing of cursor from vessel is displayed in the Status Bar as
RNG.
3. Press
the value to zero and return to the Chart Set Up menu.
An offset of 2nm or less is applied to all position data equal to the range
and bearing between the WGS 84 position and the position entered. The
menu returns with
Note: Pressing
warning message which is cleared on any key press. The Calibration Set
Up mode maintains and the user can either reselect an acceptable offset
or press
4.4 GPS Setup
The GPS set up page provides information for the status of the tracked
navigation satellites plus HDOP and satellite Fix Status. It also provides
the ability to manually select the appropriate SD satellite dependent on
geographical location.
➤ To select GPS Set Up:
1. Press the
Figure 4-5: Set Position Function
D4713_
BRG and
ENTER to confirm the selected offset value or CLEAR to reset
ON highlighted.
ENTER with a selected offset of more than 2nm gives a
CLEAR to reset the value to zero and return to the Set Up menu.
PAGE key to display the SET UP functions:
Figure 4-6: GPS Setup Functions
D4694_1
2. Use the trackpad to highlight the GPS SET UP function and press
ENTER to display the GPS STATUS screen and soft key.
GPS STATUS is displayed (Figure 4-7).
Page 80

Chapter 4: Setting Up 4-11
0
0
0
0
0
0
0
0
0
0
0
0
SD-FIX
D4714_2
SD-GPS
SET UP
"ENTER" FOR SD-GPS SETUP MENU
"CLEAR" TO QUIT
D4995_1
Figure 4-7: GPS Status Screen and Soft Key
The GPS STATUS screen provides, for each tracked satellite, the satellite
number, a graphical signal strength bar, status, azimuth angle and its
elevation angle from your vessel.
Positional accuracy is dependent upon these parameters; in particular, the
azimuth and elevation angles are used in a triangulation process to
calculate your position. HDOP (Horizontal Dilution Of Position) is a
measure of this accuracy; a higher figure signifies greater error. In ideal
circumstances, the figure should be in the region of 1.0. The Fix Status
can indicate:
• SD-FIX, where a Satellite Differential fix has been acquired
• FIX OK, where a normal GPS fix has been acquired
• NO FIX, where no satellite fix can be acquired
➤ To access the SD GPS Setup menu:
1. Press
ENTER; the SD GPS SET UP menu is displayed (Figure 4-8):
Page 81

4-12 Raychart 425 Chartplotter
SD GPS SET UP
SD MODE ENABLED
SATELLITE SELECT AUTO
SD SATELLITE NAME AOR-W
SIGNAL STRENGTH 50dB
AZIMUTH 234°
ELEVATION 23°
D4996_2
Figure 4-8: SD GPS SET UP Menu
2. Using vertical trackpad movements, select SD MODE.
3. Use horizontal trackpad movements to toggle between
DISABLED
• Select
• Select
.
ENABLED to allow the unit to use SD corrections if available.
DISABLED to force the unit to calculate a normal GPS fix
with no satellite GPS corrections.
4. Use vertical trackpad movements to select
SATELLITE SELECT and use
horizontal trackpad movements to toggle between
.
UAL
• Select
AUTO to instruct the unit to select the SD satellite automati-
cally.
• Select
Note: The
MANUAL to force the unit to use the SD satellite selected.
SIGNAL STRENGTH, AZIMUTH and ELEVATION fields are deter-
mined by information from the SD satellite.
ENABLED and
AUTO and MAN-
5. Press
ENTER to select the new SD Satellite settings and return to the
GPS STATUS window, then press CLEAR again to return to the Setup
functions.
Page 82

Chapter 5: Installation 5-1
Chapter 5: Installation
5.1 Introduction
This chapter provides instructions to assist in planning the installation of
the Raychart 425 Chartplotter aboard your vessel.
Note: If you wish to practice using the Raychart 425 before installation,
you can connect it, via a 1A quick blow fuse, to a 12VDC power supply
and operate it using the simulator mode, as described in Chapter 2:Getting Started.
EMC Installation Guidelines
All Raymarine equipment and accessories are designed to the best
industry standards for use in the recreational marine environment.
Their design and manufacture conforms to the appropriate
Electromagnetic Com patibility (EMC) standards, but cor rect installation
is required to ensure that performance is not compromised. Although
every effort has been taken to ensure that they will perform under all
conditions, it is important to understand what factors could affect the
operation of the product.
The guidelines given here describe the conditions for optimum EMC
performance, but it is recognized that it may not be possible to meet all of
these conditions in all situations. To ensure the best possible conditions
for EMC performance within the constraints imposed by any location,
always ensure the maximum separation possible between different items
of electrical equipment.
For optimum EMC performance, it is recommended that wherever
possible:
• Raymarine equipment and cables connected to it are:
• At least 3 ft (1 m) from any equipment transmitting or cables carrying radio signals e.g. VHF radios, cables and antennas. In the
case of SSB radios, the distance should be increased to 7 ft (2 m).
• More than 7 ft (2 m) from the path of a radar beam. A radar beam
can normally be assumed to spread 20 degrees above and below
the radiating element.
• The equipment is supplied from a separate battery from that used for
engine start. Voltage drops below 10 V, and starter motor transients,
can cause the equipment to reset. This will not damage the equipment, but may cause the loss of some information and may change the
operating mode.
Page 83

5-2 Raychart 425 Chartplotter
• Raymarine specified cables are used. Cutting and rejoining these
cables can compromise EMC performance and must be avoided
unless doing so is detailed in the installation manual.
• If a suppression ferrite is attached to a cable, this ferrite should not be
removed. If the ferrite needs to be removed during installation it must
be reassembled in the same position.
Suppression Ferrites
The following illustration shows typical cable suppression ferrites used
with Raymarine equipment. Always use the ferrites supplied by
Raymarine.
D3548-4
Figure 5-1: Typical Suppression Ferrites
Connections to Other Equipment
If your Raymarine equipment is to be connected to other equipment using
a cable not supplied by Raymarine, a suppression ferrite MUST always
be attached to the cable near to the Raymarine unit.
Page 84

Chapter 5: Installation 5-3
5.2 Unpacking and Inspecting the Components
Unpack your Raychart 425 Chartplotter carefully. Retain the carton and
packing materials in the event that you need to return the unit for service.
Referring to Table 5-1 , check that you have all the correct system
components.
Table 5-1: System Parts and Accessories
Item Part #
RC425 System comprising: E32032
RC425 Chartplotter R38064
Raystar 120GPS Receiver E32026
RC425 Accessories:
Sun Cover E35004
Panel Mount Kit* E35006
Trunnion Mount Kit E35005
Power Cable R38024
GPS Extension Cable* E35003
Owner’s Handbook 81172
Bridge Card 86055
* Optional Accessory.
Items Missing?
If any one (or more) of the above items is missing or damaged, please
contact your Raymarine dealer or our Product Support Department to
obtain replacement parts. Please note that missing or damaged items
cannot be replaced without proof of purchase.
Registering this Product
When you have checked that you have all of the listed components,
please take the time to complete the pre-paid warranty registration card.
This ensures that you receive prompt and expert attention should you
experience any difficulties with the product.
Page 85

5-4 Raychart 425 Chartplotter
5.3 Installing the GPS Receiver
The Raystar 120 GPS Receiver is designed to receive the signals emitted
from the satellites in a direct path. Ideally, the unit should be mounted
horizontally in a location that is open and clear of any masts, search
lights, or other structures that could block line-of-sight reception of
signals. The height of the GPS Receiver is not as important as it’s having
a clear view horizon to horizon for optimum signal reception. In fact, the
lower the unit can be mounted and have a clear view to satellites, the
better. The more stable the unit, the easier it is to track satellites lower to
the horizon.
The Raystar 120 can be mounted on a pole. Alternatively, you can use the
supplied surface mount kit.
When mounting the GPS Receiver flush to a deck surface, avoid areas
where the unit will be trodden upon or where it may present a tripping
hazard.
When planning the location for the unit, consider finding a convenient
pathway for running the interconnecting cable between the GPS
Receiver and the display unit or to the rest of an inte grated system. Ideally
the cable should be run such that it is hidden from view and, if possible, be
in a direct path to the point of connection. It is important to keep the cable
separated from other shipboard cables as far as possible to prevent
interference pick-up.
Note: Mounting on the mast of a sailboat is not recommended.
Surface Mounting
Refer to Figure 5-2:
1. Select a suitable area which allows access to the underside of the
mounting surface for fixing and, using the template supplied in this
document, carefully drill the two 6mm (0.25in) fixing holes marked.
2. If the cable is to pass through the mounting surface drill the 6mm
(0.25in) or 19mm (0.75in) centre hole depending on whether the plug
is to pass through the surface or not.
If the cable is to exit from the side of the GPS Receiver above the
mounting surface, remove the two plastic tabs (1) obstructing the
cable channel.
Note: Failure to remove the plastic tabs from within the cable channel
could result in cable damage.
3. Screw the supplied brass studs (2) into the underside of the GPS
Receiver.
Page 86

Chapter 5: Installation 5-5
4. Stick the supplied gasket (3) to the mounting surface ensuring that the
holes match and pass the cable through the centre hole or the cable
exit channel.
5. Carefully position the GPS Receiver, passing the studs through the
holes in the mounting surface and secure to the mounting surface
using the thumb nuts provided (4).
1
2
4
Top view
Pole Mounting
Refer to Figure 5-3:
1. Screw the pole mount base to a suitable pole or rail mount bracket,
having an industry standard 1in 14TPI thread, until secure.
2. Pass the cable through the centre hole of the pole mount base (A) or
through the cable exit hole alongside the centre hole (B) or insert the
cable into the side exit channel (C).
3. Check that the cable is positioned correctly and secure the GPS
Receiver to the pole mount base using the two screws provided.
If the cable is to exit from the side of the GPS Receiver through the
side channel, remove the two plastic tabs (1) obstructing the cable
channel.
3
2
4
Underside view
Figure 5-2: Surface Mounting Arrangement
3
D4725_1
Page 87

5-6 Raychart 425 Chartplotter
Note: Failure to remove the plastic tabs from within the cable channel
could result in cable damage.
.
D4726-1
Figure 5-3: Pole Mounting Arrangement
Page 88

Chapter 5: Installation 5-7
5.4 Installing the Chartplotter
When planning the installation of your Raychart 425, the following
points should be considered to ensure reliable and trouble free operation:
• Convenience: The unit should be installed in a convenient position
where it can be viewed straight on or with a viewing angle of less than
35°. You may wish to apply power before you install the unit, to determine the best viewing angle prior to fixing. The mounting location
should be easily accessible to allow operation of the front panel controls.
• Access: There must be sufficient space behind the display unit to
allow cable connections to the rear panel connectors, avoiding tight
bends in the cable. At least 4cm should be allowed at the right of the
chartplotter to enable chart cards to be inserted and removed.
• Interference: The selected location should be far enough away from
devices that may cause interference, such as motors and generators
(see the EMC guidelines earlier in this section).
• Power Source: The unit should be located near a DC power source.
The power cable supplied is 1.5m, but a longer cable can be used if
required. Power must be supplied via a 1A quick blow fuse or circuit
breaker. Refer to Section 5.5, Cable Running.
• Interconnections: The unit transmits navigation and waypoint data
on NMEA and, therefore, can be connected to an NMEA
autopilot or compatible instrument repeater(s). The navigation data
transmitted by the chartplotter is detailed in Appendix C to this handbook.
• Environment: The unit should be protected from physical damage,
heat sources and excessive vibration. Although the unit is waterproof,
it is good practice to mount it in a protected area aw ay from prolonged
and direct exposure to rain and/or salt spray.
When surface mounting the unit to an enclosed compartment, make
sure that the compartment is ventilated and drained. Failure to meet
this requirement may lead to excessive build up of moisture within
the unit, leading to condensation on the screen.
The dimensions of the unit, including the bracket, are shown in
Figure 5-4.
1
compatible
1. National Marine Electronics Association (NMEA) 0183 interconnection standard, Version 2.3
April 1998.
Page 89

5-8 Raychart 425 Chartplotter
170mm (6.7in)
125 mm (4.9 in)
165 mm (6.5 in)
153 mm (6.0 in)
90 mm (3.5 in)
112 mm (4.4 in)
MOB
GO TO
PAGE
CLEAR
RANGE
ENTER
POWER
196 mm (7.7 in)
184 mm (7.25 in)
80 mm (3.15 in)
plug clearance
168 mm (6.6 in)
35 mm
35 mm
(1.38 in)
(1.38 in)
122 mm (4.8 in)
34 mm
25 mm
(1.3 in)
(1 in)
43.5 mm
(3.5 in)
32 mm
50 mm
(2.0 in)
(1.26 in)
Figure 5-4: Raychart 425 Dimensions
D4721-1
Page 90

Chapter 5: Installation 5-9
Trunnion (yoke) Mounting
The display unit can be conveniently mounted on a dash area, chart table,
bulkhead or deckhead. Trunnion mount the unit as follows:
1. Loosen the trunnion knobs and remove the trunnion from the display
unit.
2. Mark the locations of the trunnion screw holes on the mounting surface.
3. Use the screws supplied to fix the trunnion at the marked locations.
4. Fit the unit to the trunnion, adjust the display angle and tighten the
knobs.
Panel Mounting
CAUTION:
Make sure that there are no hidden electrical wires or other items
behind the location before proceeding. Make sure that there is
sufficient rear access for mounting and cabling. Allow at least
4cm at the right hand side of the display to enable chart cards to
be inserted and removed.
The unit can be panel mounted, using the panel-mounting kit (accessory)
available from your local Raymarine dealer.
➤ Panel mount the unit as follows:
1. Check the selected location for the unit. A clear, flat area at least 7in
(175mm) wide by 7½in (190mm) high, with at least 3½in (90mm) of
clearance behind the panel, is required.
2. Using the supplied template, trace out the display unit cut-out and
mark the drilling centres for the four securing holes outside of the
cut-out area.
3. To provide start holes for removing the cut-out, drill four
(10mm) holes in each opposing corner and four
1
/4 in (6mm) holes for
the two trunnion lug clearance slots in the cut-out area.
4. Using a suitable saw, cut along the inside edge of the cut-out line.
5. With the trunnion (yoke) and knobs removed, make sure that the unit
fits in the cut-out area.
6. Drill out the four
plate. It is recommended that a
3
/16in (5mm) securing holes as indicated on the tem-
1
/16in (1mm) pilot hole is drilled first.
7. Screw the studs into the vacant holes at the rear of the unit, hand tight
only.
3
/8in
Page 91

5-10 Raychart 425 Chartplotter
8. Place the gasket on the unit and slide the unit into the panel cut-out.
9. Secure the unit with the thumb nuts, hand tight only (Figure 5-5).
Figure 5-5: Raychart 425 Panel Mounting Arrangement
5.5 Cable Running
Introduction
The minimum requirements are a power cable and a connection from the
Raystar 120 GPS Receiver. Additional cables will be required if
connecting to other equipment.
Notes: (1) All cables should be adequately cleated and protected
from physical damage and exposure to heat. Avoid running
cables through bilges, doorways or close to moving objects or
heat sources.
(2) Where a cable passes through an exposed bulkhead or
deckhead, a watertight gland or swan neck tube should be
used.
D4722_1
Page 92

Chapter 5: Installation 5-11
Connectors
GPS Connector
The GPS connector provides power and data connections to the
Raystar 120 GPS Receiver using the attached 33ft (10m) cable
terminated in a moulded 6-pin connector.
➤ Connect the GPS Receiver as follows:
1. Mount the GPS Receiver as detailed in Installing the GPS Receiver
on page 4.
2. Feed the
3. Coil up any unused cable in an appropriate safe space out of view. Do
not bend the cable tighter than 4in (100mm) radius.
4. Connect the cable to the
Note: If the supplied cable is too short, use an extension cable (Part#
E35003) available from your local Raymarine dealer.
POWER/NMEA Connector
CAUTION:
If you do not have a breaker in your power circuit, you must fit an
in-line 1A quick-blow fuse to the positive (red) lead of the power
cable.
This unit is not intended for use on positive ground vessels.
The
POWER/NMEA connector provides for 12VDC power connection
and NMEA inputs/outputs using the supplied cable.
The chartplotter is intended for use on vessels’ DC power systems
operating in the range 10.0VDC to 18.0VDC (ie. 12V systems, not 24V
or 32V systems).
Power connections should be made at a DC power distribution panel
through an isolator switch and a 1A circuit breaker or 1A quick blow fuse.
All connections must be clean and tight.
The DC power system should be either:
• Negative ground, with the negative battery terminal connected to the
vessel’s ground.
• Floating, with neither battery terminal connected to the vessel’s
ground.
A 1.5m (5ft) power cable is supplied. If a longer power cable run is
required, use the supplied power cable to connect to the unit plus a
GPS cable through to the rear of the chartplotter.
GPS connector on the rear of the chartplotter.
Page 93

5-12 Raychart 425 Chartplotter
suitable connector block to connect to the extension cable. The supplied
power cable cores have a cross-section of 2.0mm
2
(15 AWG).
Longer power cable runs may require larger wire gauges to minimize any
voltage drop in the cable. In order to determine the correct supply cable
size if the power cable must be extended, estimate the length of cable
between the vessel’s main power source and the connector block, then
select the wire size determined by the distance as indicated in Table 5-2 .
Table 5-2: Maximum Power Cable Extension Lengths
Power Cable Core mm2:
Equivalent AWG: 16 15 14 12 10 8
Maximum Extension (feet): 36 49 65 98 147 230
Maximum Extension (meters): 11.0 15.0 20.0 30.0 45.0 70.0
1.5 2.0 2.5 4.0 6.0 10.0
The DC power and NMEA inputs/outputs should be connected to the
POWER/NMEA cable at the rear of the chartplotter. The cable colors are
detailed Table 5-3 .
Table 5-3: Power/NMEA Cable Colors
Function Color
Battery negative Black
Battery positive (10.0VDC to 18.0VDC) Red
NMEA input (+ve) White
NMEA input (-ve) common Green
Not connected Gray
NMEA output (+ve) Yellow
Data output (-ve) common Brown
Not connected Screen
➤ Connect to the power supply using the power cable supplied:
1. Connect the moulded connector to the
the rear of the chartplotter. Run the free end back to the vessel’s distribution panel or, if insufficient cable length, to a junction box.
2. Cut the cable to length and connect the red wire, via a 1A quick blow
fuse or circuit breaker, to the +ve battery terminal and the black wire
to 0V (-ve battery terminal).
POWER/NMEA connector on
Page 94

Chapter 5: Installation 5-13
3. Use a suitable junction box to connect to NMEA equipment if
required.
4. Cut any unused cores short or insulate and tape back.
Note: If the power connections are accidentally reversed, the system will
not function. Use a voltmeter to check that the input power leads are connected with the correct polarity.
5.6 System Check and Initial Switch On
When installation is complete and all connections have been made,
re-check the installation before using the system for navigation. If
problems occur, refer to Chapter 6:Maintenance & Fault Finding.
EMC Conformance
Always check the installation before going to sea to make sure that it is
not affected by radio transmissions, engine starting etc.
System Check
Before performing the functional test, check that:
• All connections are clean and tight.
• All cables are secured and protected.
Initial Switch On
To switch on the chartplotter, press and hold the POWER key until the
unit beeps.
If necessary, adjust the lighting and contrast (see Chapter 2).
If required, change the default language settings as follows:
1. Press the
2. Using trackpad left/right, select the
ENTER.
The
their current settings (Figure 5-6):
PAGE key to display the setup function bar.
SYSTEM SET UP menu is displayed, listing the parameters and
SYSTEM SET UP function and press
Page 95

5-14 Raychart 425 Chartplotter
Figure 5-6: System Set Up Menu
3. Using trackpad up/down, select the LANGUAGE option.
4. Using trackpad left/right, select the required language.
5. Press
ENTER to return to the setup functions. The chartplotter now
uses the selected language.
6. Press
CLEAR to return to the normal chart screen.
Checking Chartplotter Operation
To confirm that the chartplotter is operating correctly, perform the
following checks:
1. Press the trackpad left/right, up/down and check cursor movement
and normal scrolling action.
2. Insert a Navionics Nav-chart
Use the
RANGE key to zoom-in and check that the new chart car-
tridge data is displayed.
3. Ensure that position data is available; use the
check that the cursor is fixed on the vessel symbol which is correctly
positioned at the centre of the chart display, see Chapter 3:Operation.
®
card for the area of your vessel.
FIND SHIP function to
Page 96

Chapter 6: Maintenance & Fault Finding 6-1
Chapter 6: Maintenance & Fault Finding
This chapter provides information on routine maintenance and on
possible causes of problems you may experience with your Raychart 425
Chartplotter and/or its associated Raystar 120 Receiver.
6.1 Maintenance
WARNING:
The chartplotter contains high voltage and specialized circuits
only accessible to qualified service technicians - there are no user
serviceable parts or adjustments and the operator should not
attempt to service the equipment. The operator should not
remove the rear cover.
Routine Checks
The Chartplotter is a sealed unit. Maintenance procedures are therefore
limited to the following periodic checks:
• Wipe the display unit clean with a damp cloth.
• Examine the cables for signs of damage, such as chafing, cuts or
nicks.
• Check that the cable connectors are firmly attached and that the connections to the vessel’s dc power are clean and tight.
• Ensure that the cartridge cover is always fitted correctly.
Note: Never use chemical or abrasive materials to clean the chartplotter.
If the unit is dirty, wipe it with a clean, damp cloth.
Servicing and Safety
Raymarine equipment should be serviced only by authorized Raymarine
service technicians. They will ensure that service procedures and
replacement parts used will not affect performance. There are no user
serviceable parts in any Raymarine product.
Some products generate high voltages, so never handle the cables/
connectors when power is being supplied to the equipment.
When powered up, all electrical equipment produces electromagnetic
fields. These can cause adjacent pieces of electrical equipment to interact
with one another, with a consequent adverse effect on operation. In order
to minimize these effects and enable you to get the best possible
performance from your Raymarine equipment, guidelines are given in
Page 97

6-2 Raychart 425 Chartplotter
the installation instructions, to enable you to ensure minimum interaction
between different items of equipment, ie. ensure optimum
Electromagnetic Compatibility (EMC).
Always report any EMC-related problem to your nearest Raymarine
dealer. We use such information to improve our quality standards.
In some installations, it may not be possible to prevent the equipment
from being affected by external influences. In general this will not
damage the equipment but it can lead to spurious resetting action, or
momentarily may result in faulty operation.
6.2 Resetting the System
Two types of reset are available for the Chartplotter:
• Power-On Reset: When you turn the display unit off, then on again,
the screen reverts to the chart display with all windows cleared.
• Factory Reset: This resets all values back to their original factory
settings.
Note: Take care - factory reset clears all Waypoint and Route databases.
➤ To perform a factory reset:
1. Power off the unit.
2. Press and hold CLEAR whilst powering up until <Erase backup pro-
cedure> is displayed.
3. Either press CLEAR to abort Factory Reset and resume normal
Power-Up or press ENTER to continue Factory Reset.
4. Press ENTER again; the unit restarts as for a first time Power Up with
all values reset to their original factory settings
Note: The factory default settings are listed in Chapter 4.
6.3 Problem Solving
Prior to packing and shipping, all Raymarine products are subjected to
comprehensive test and quality assurance programmes. However, if this
unit should develop a fault, please refer to the following table to identify
the most likely cause and the corrective action required to restore normal
operation.
If you still have a problem after referring to the table, contact your local
dealer, national distributor or Raymarine Techncial Services for further
advice.
Always quote the product serial number.
Page 98

Chapter 6: Maintenance & Fault Finding 6-3
Fault Finding
As a guide to problem solving, common problems and their possible
causes are detailed in Table 6-1.
Table 6-1: Fault Finding Guide
Problem Correction
Unit does not function 1. Make sure that the power supply cable is
Poor display definition Adjust contrast setting and/or backlight level.
No position information Check the GPS Receiver connection
No fix Check that GPS Receiver not obstructed and
No NMEA data received Check the POWER/NMEA connector and the
Loss of stored data, eg. waypoints Return to d ealer for internal battery check.
No detailed chart data Check that Nav-Chart card is pushed fully home
Other problems Visit website www.raymarine.com
undamaged and that all connections are tight
and free from corrosion.
2. Check polarity of the dc power cables for
proper connection.
Reconnect cables if necessary.
3. Check in-line fuse. Replace if necessary.
4. Check vessel’s power (battery) for correct
voltage readings(10.0VDC to 18.0VDC).
Check the GPS Receiver
able to get clear direct line of sight view of s atellites in the sky.
NMEA equipment. Note that NMEA OUT from
one product connects to NMEA IN on another
product and vice versa.
Note that the Waypoint database is cleared
when a Factory Reset is performed.
Check that the Nav-Chart card has appropriate
cartography.
6.4 Technical Support
Please visit our website at:
www.raymarine.com/recreational/support
where you will find a Questions & Answers database, service
information and e-mail access to the Technical Support department.
Alternatively, if you don’t have access to our website, call:
1-800-539-5539 extension 2444 or
(603) 881-5200 extension 2444
Page 99

6-4 Raychart 425 Chartplotter
Page 100

Appendix A: Raychart 425 Specification A-1
Appendix A: Raychart 425 Specification
CE Conforms to 89/336/
Size 184mm (7.3in) x 168mm (6.7in) x 75mm (3in), excluding trunnion
Weight 0.75 kg (1.65 lb)
Environmental Waterproofing: To CFR46;
Mounting Trunnion (yoke) or panel
Power Input 10.0VDC to 18.0VDC
Controls 6 defined keys and trackpad
Display type Film Super Twist Nematic (FSTN) LCD
Display
Resolution
Display size 145mm (6in) diagonal
EEC(EMC),
EN60945:1997
suitable for external mounting
Temp Range - Operating: -10°C to 70°C
Temp Range -Storage: -20°C to 70°C
Humidity up to 95% RH
12Vdc nominal
Consumption - Typical <9.6W @12VDC including GPS
320 x 240 pixels (¼VGA) monochrome portrait with
4 grey scales, 4 levels of backlighting, 16 levels of contrast
117mm (4.25in) x 88mm (3.5in) viewable area
Interfaces Power/NMEA NMEA 0183 receive and transmit
GPS Raystar 120 GPS Receiver
Cartography Navionics Nav-Chart cartridge
Software
update
Memory Capacity: Waypoints: 500 max
Via Cartography cartridge interface
Protection: Built in dealer replaceable Lithium bat-
Waypoint upload/download (WPL &
RTE)
(20 routes of up to 50 waypoints)
Track history: 2000 points
tery giving 3 to 5 years usage
 Loading...