

Page 1
CONFOCAL LASER SCANNING
BIOLOGICAL MICROSCOPES
FV300
FLUOVIEW
Page 2
1
FV300 CONFOCAL LASER SCANNING MICROSCO
PERFORMANCE FOR THE PERSONAL USER
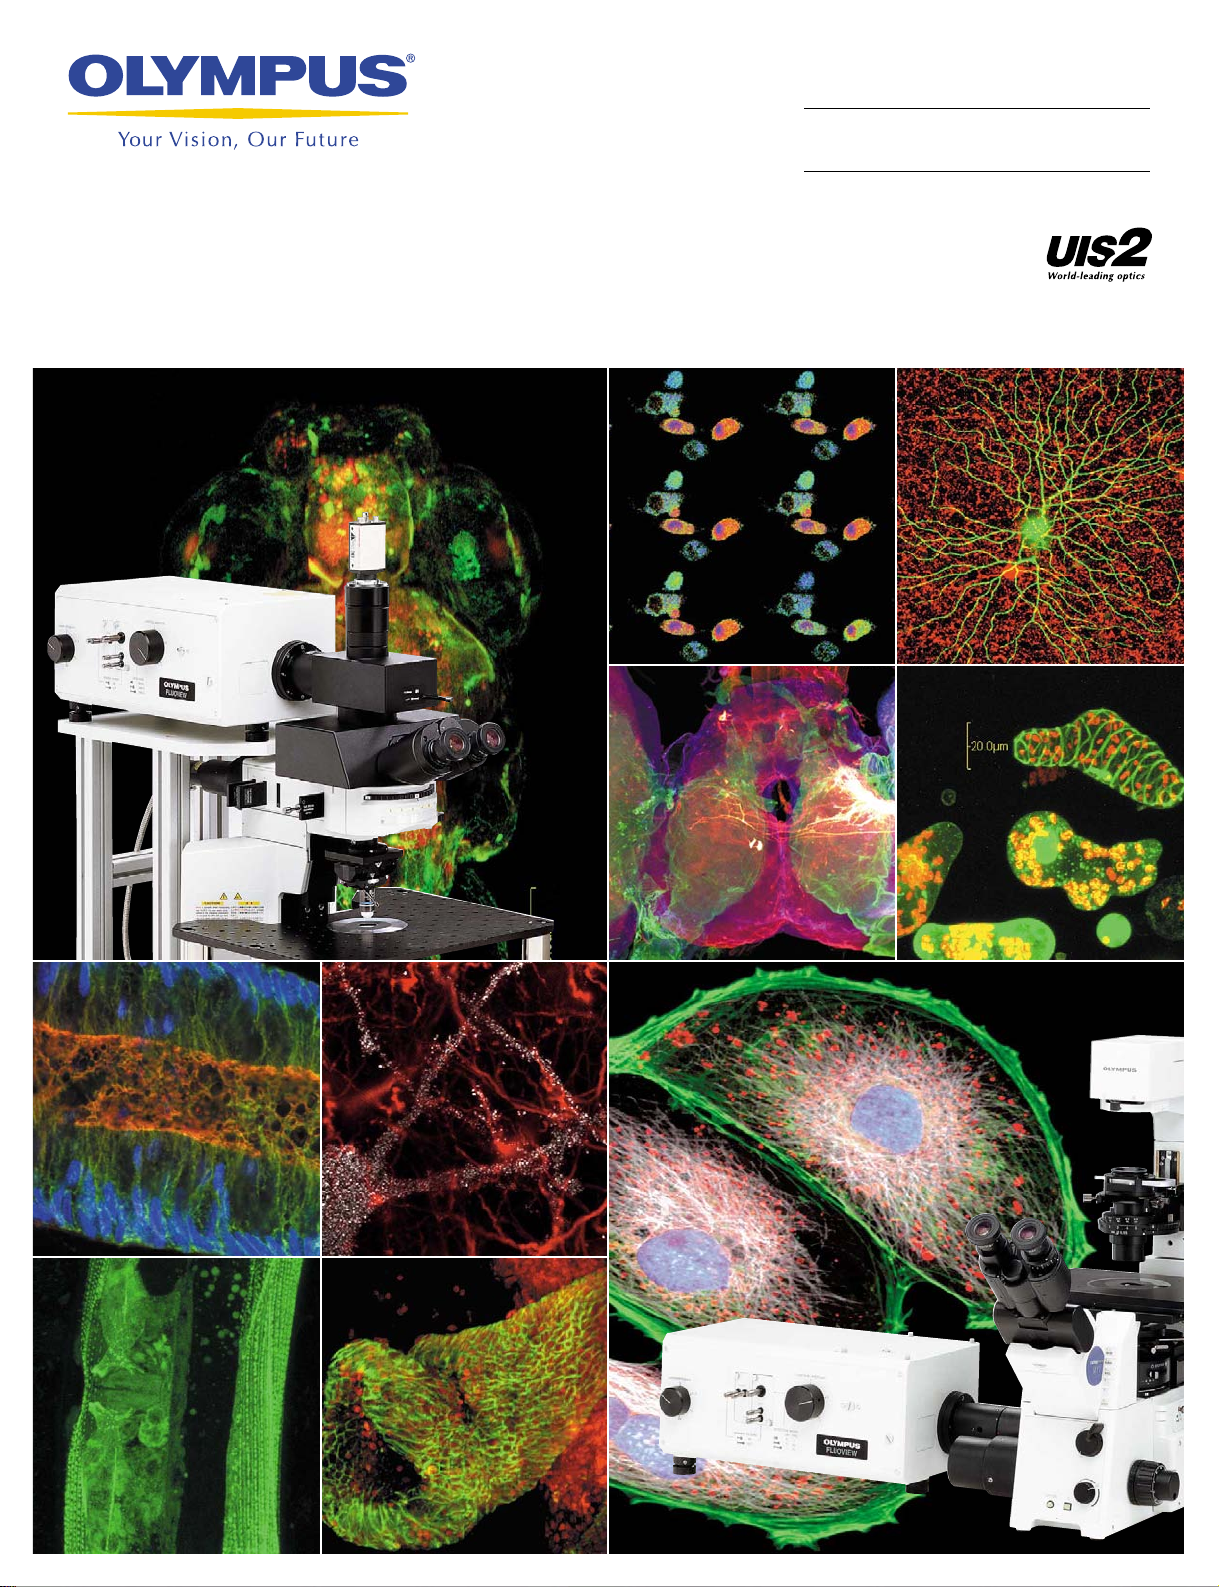
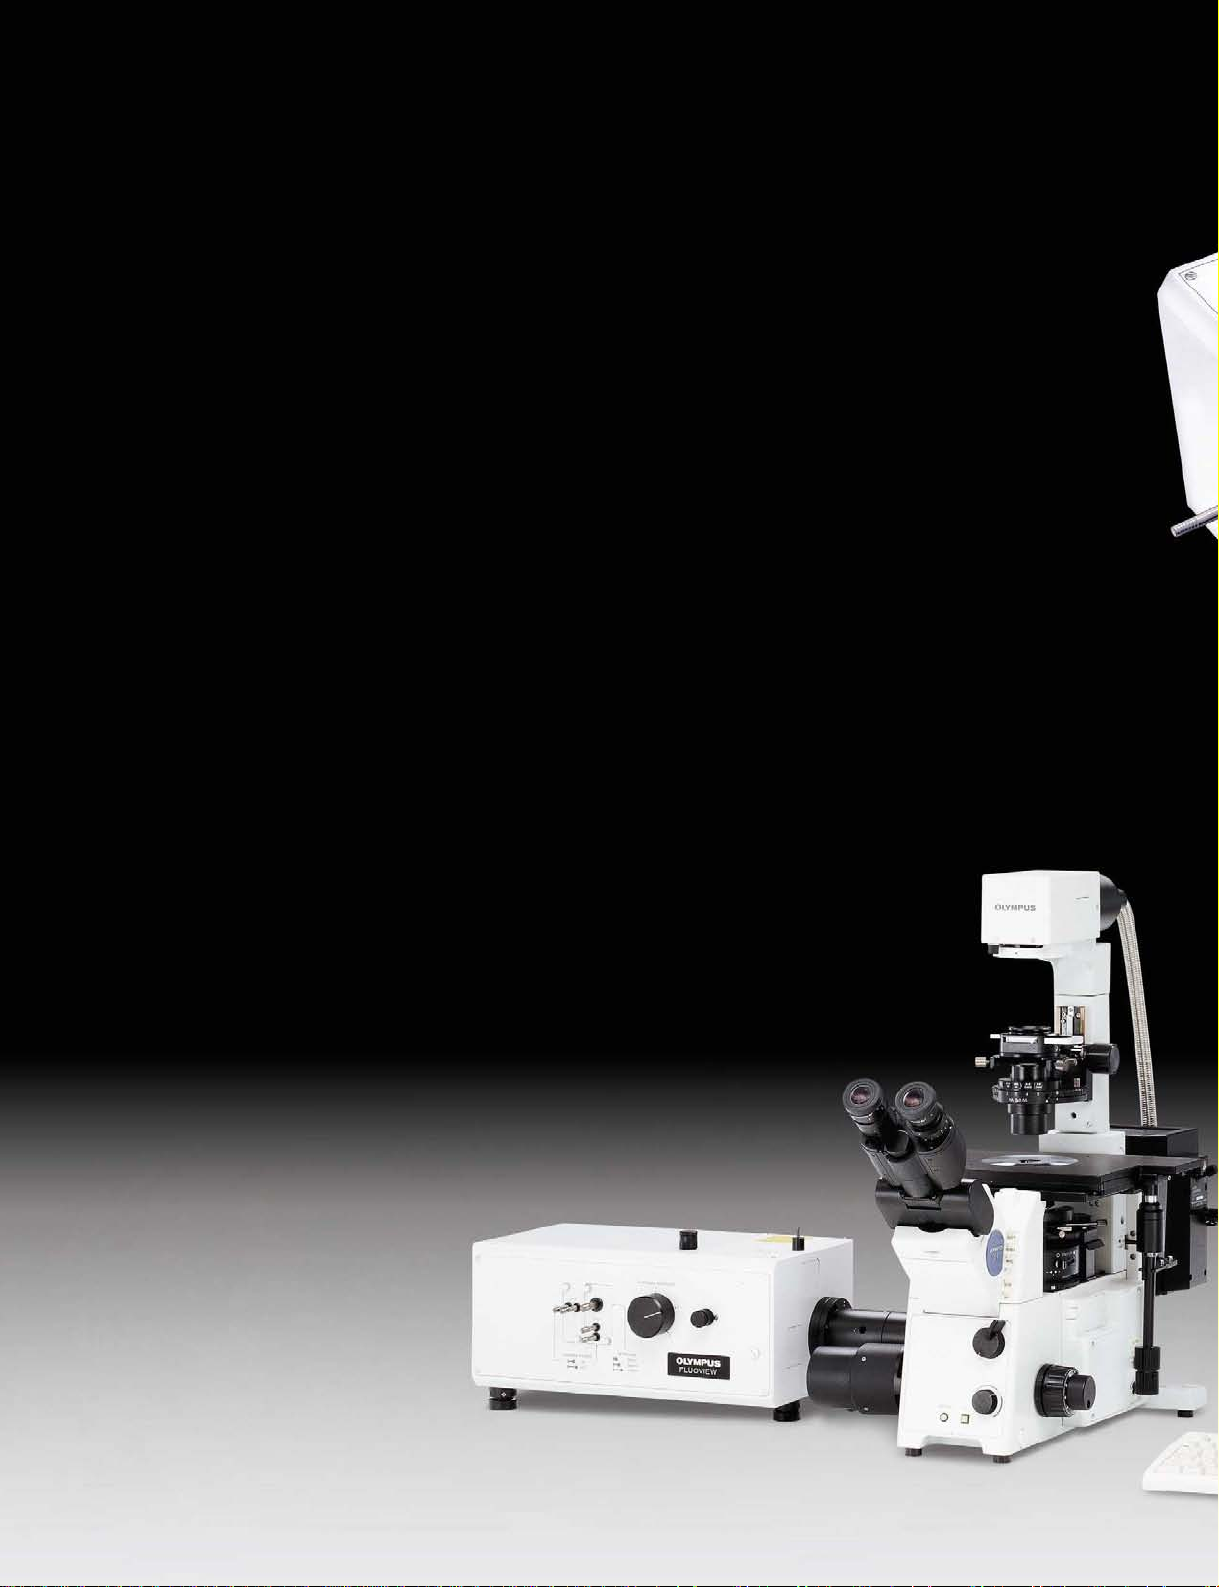
The FV300 is the ideal choice of laser scanning microscopes for personal users.
Its optical system is fully integrated, from scanner to microscope, and not only delivers
outstanding optical sectioning, but also ensures the easy, flexible expandability required
for any future upgrade.
With its wide choice of options and configurations, including the Olympus inverted,
upright and fixed-stage upright microscope platforms, the FV300 offers excellent
versatility as well as top-class laser scanning performance.
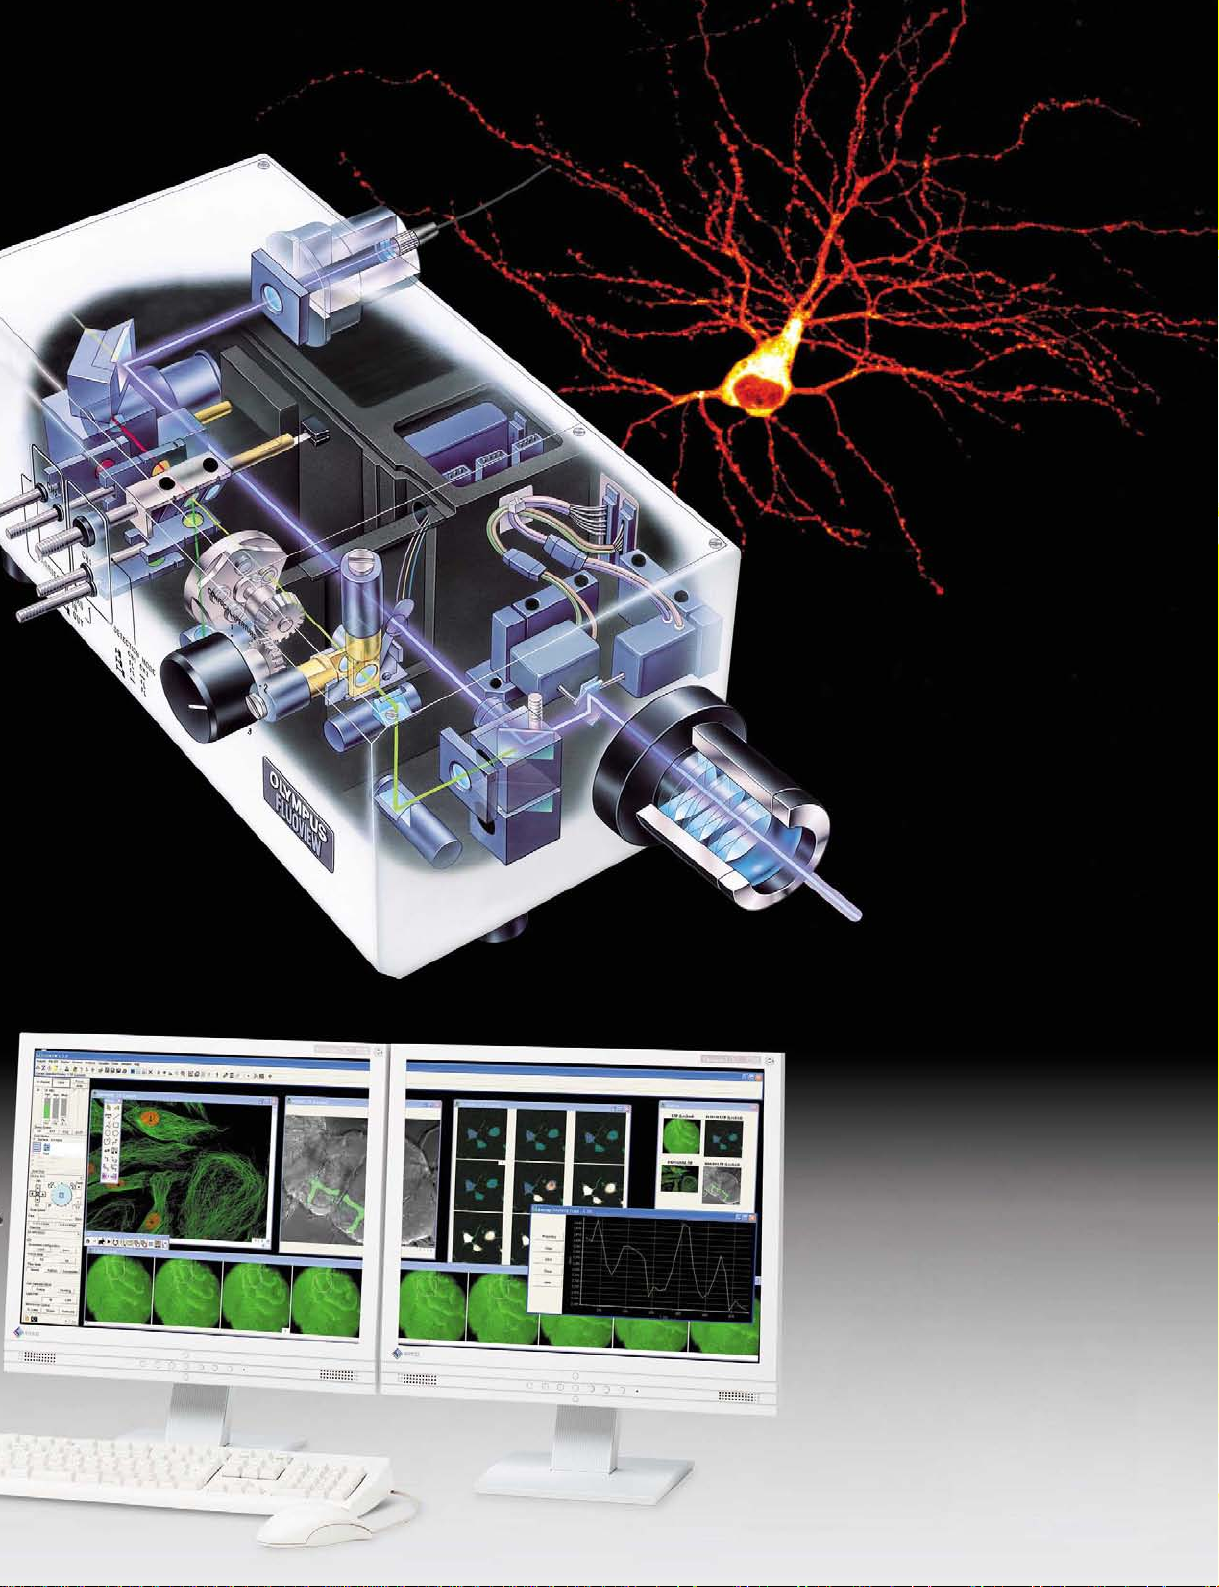
• Highest image quality (12 bit, 2048x2048 pixel resolution)
with economical cost
• Easy operation, with user-friendly software
• Simultaneous capture of 2 fluorescence and 1 transmitted
light detector images
• Capable of the most demanding tasks, with a direct and
efficient optical system
• Optical system chromatically corrects aberrations from UV
to NIR (near infrared red) spectrum
• Fiber illumination system separates fluorescence and
transmitted light sources from the microscope body for
improved temperature stability
FV300-IX71configuration
Page 3
2
q
e
r
t
y
u
i
o
!0
!1
!2
w
q Optical fiber for laser introduction
w Beam collimator
e Polarizer
r Dichromatic mirror
t Excitation dichromatic mirror
y XY galvanometer mirror scanners
u Pupil lens
i Collector Lens
o Pinhole turret
!0 Emission beam splitter slider
!1 Barrier filter slider
!2 Photo multiplier
Page 4
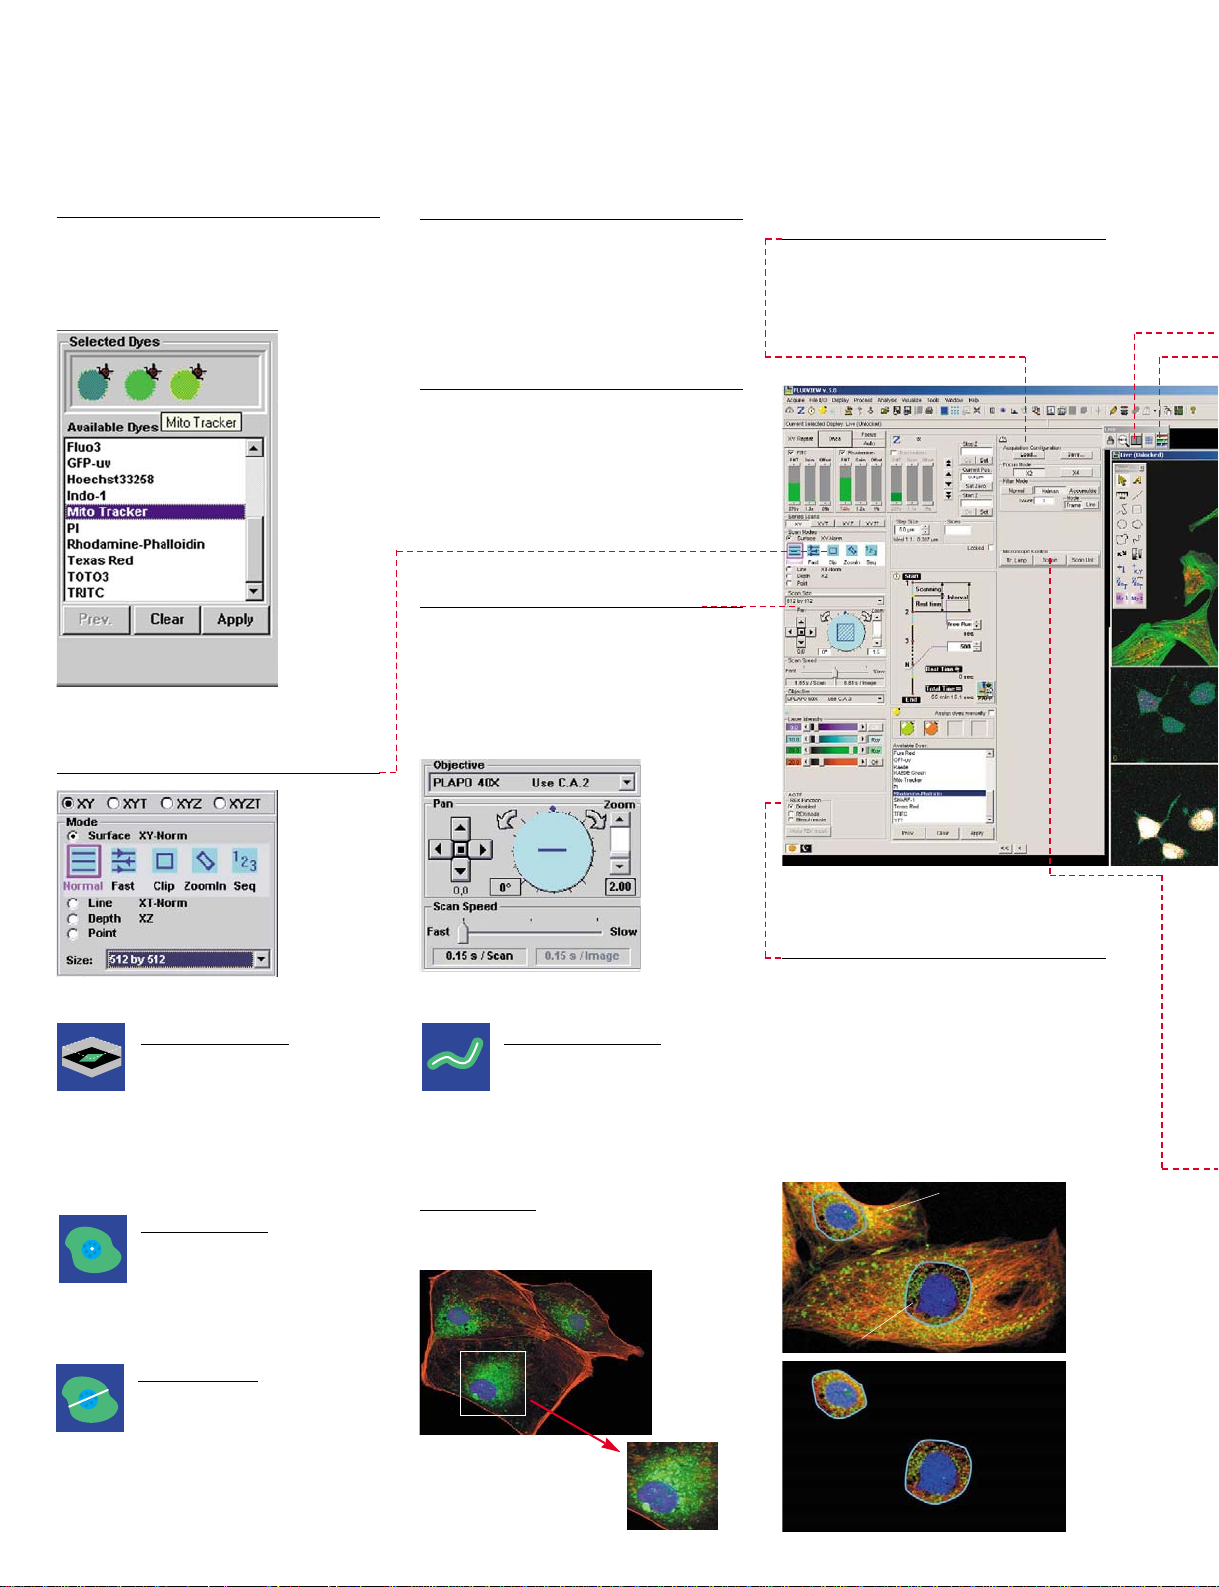
Preset the conditions for image
acquisition and loading
Storage of Acquisition Settings enables
immediate, one-touch recall of all the
relevant experimental settings and
conditions. Adding new conditions or
altering existing ones is quick and easy.
AOTF: flexible control of the laser
intensity to meet the specific
demands (optional)
The laser exposure will be limited within
the scanning area by default, minimizing
unnecessary bleaching of the specimen.
Option includes:
•Any laser intensity for any excitation area
("Region of Excitation" mode)
•Multiple laser applications
•AOTF controller that provides easy link
with external equipment
ZoomIn scanning
Zoom scanning can be
conducted over any
designated rectangular area.
Since only the region of the
targeted, zoomed-in area is acquired,
scan time and laser exposure of the
specimen is minimized.
Point scanning
The ultimate in fast scanning,
the point scan enables
accurate quantitation of
intensity changes during rapid
physiological events.
Line scanning
A single line may be scanned,
oriented at any angle in the XY
plane. This fast scanning
option permits accurate
quantitation of physiological events such
as Calcium waves or sparks.
Free line scanning
Intensity changes may be
measured over a given period
of time along the length of a
freely drawn line, such as the
trace of an axon or along a cellular
junction.
Clip scanning
By cropping the image, selected areas
can be cut out of complex image stacks.
3
Flexible setting of scanning size,
zoom, movement and rotation
The observation field and scanning area
are both displayed graphically. Settings
can be confirmed while scrolling through
the zoom ratios. The “pan” button lets the
operator move the image acquisition area
at will, and rotation scanning of images is
also possible.
Simplified toolbar
A newly designed toolbar with various
dedicated buttons has greatly improved
ease of use. The user can execute a
succession of selected processes with
one-click operation for each.
Ultimate ease of operation and monitor display.
Software Graphical User Interface
Dye selection display
When a fluorescence dye is chosen, the
laser and light path settings are selected
automatically, with each of the selected
fluorescence dyes displayed graphically
on the monitor.
Innovative scanning method for
improved performance
ZoomIn
Spot
SlantLine
FreeLine
20%
50%
B
Versatile display options
Exchange between condensed and full
image display modes can be performed
with a single touch. Individual panel
layouts can be changed at will, and the
panel in use can be placed in any desired
position.
Page 5
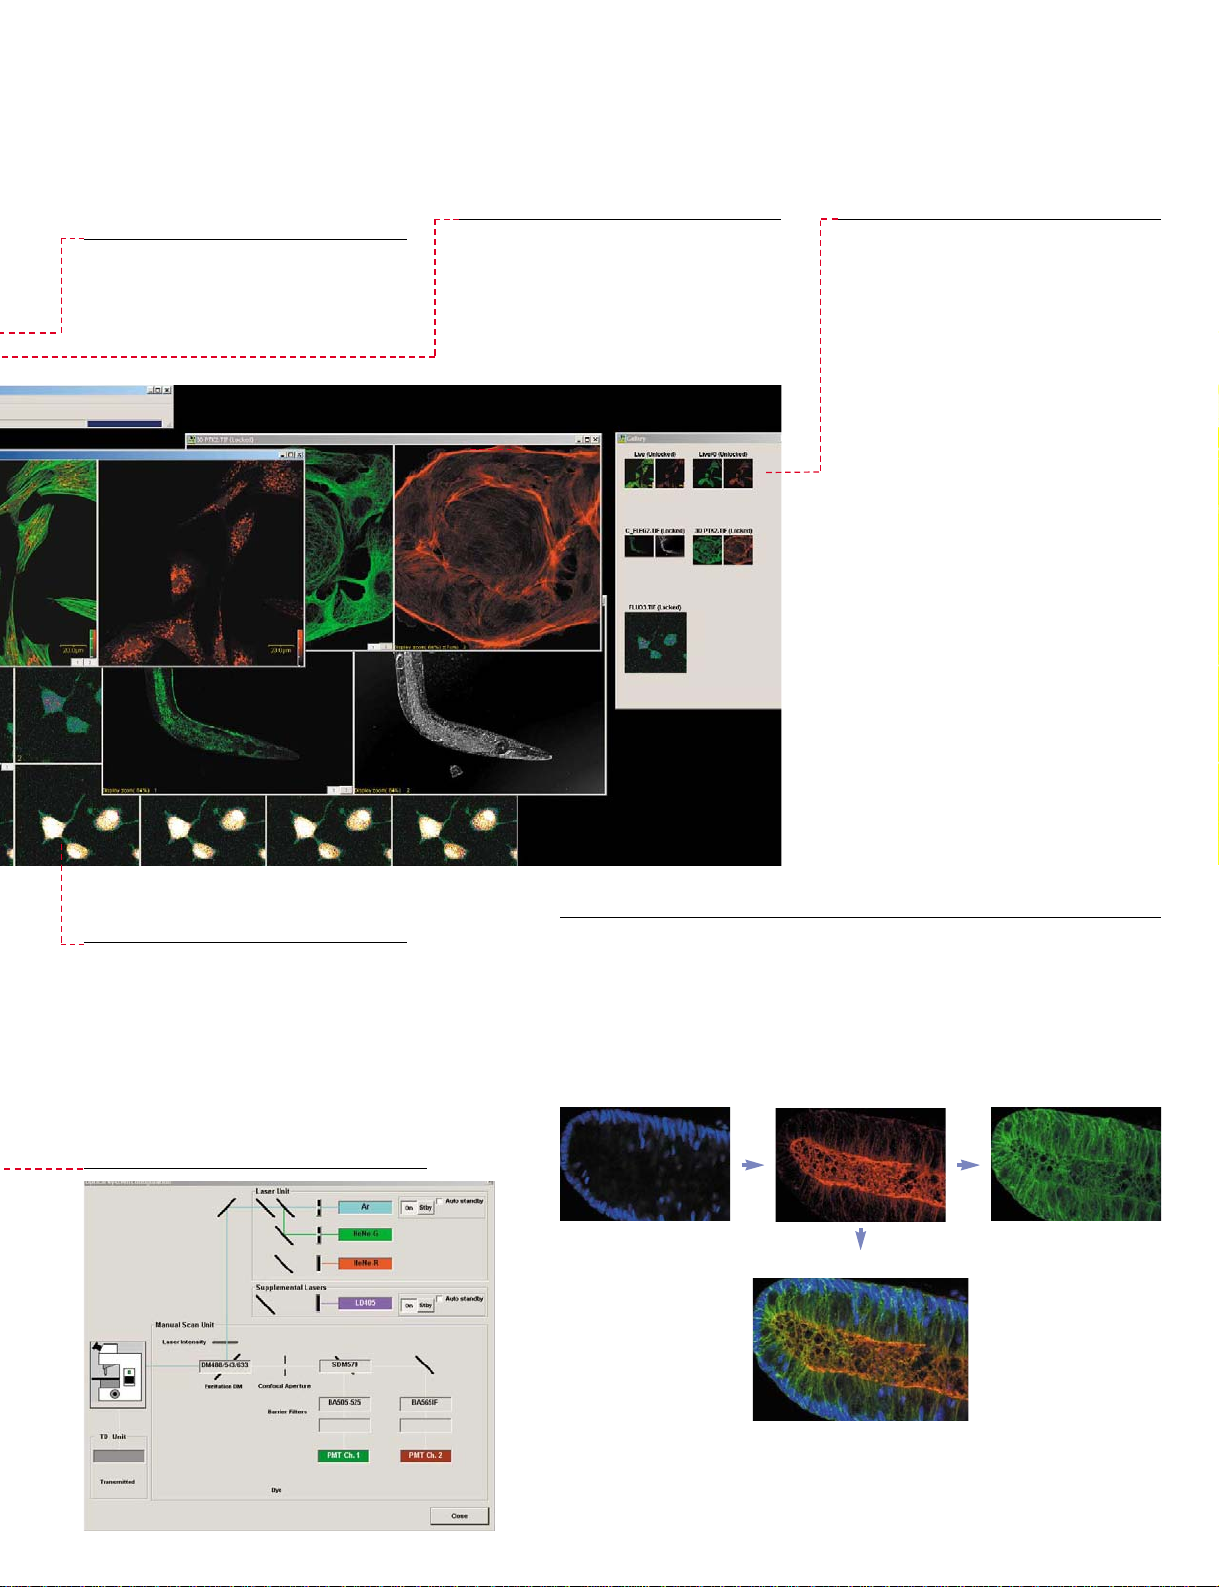
Image tool bar
X-Y-Z scanning operations and timelapse observations both produce multiple
images, which can be displayed in
sequence simply by clicking the
sequential mode button. Channel
selection and image zooming are also
available on the same menu.
4
Thumbnail display
Data stored in the gallery window are
displayed as thumbnails for easy viewing.
Sequential scanning to prevent cross talk
Sequential scanning may be used to minimize the fluorescence cross talk
often seen between channels in multicolored samples. This is achieved by
exciting each fluorochrome independently, one dye at a time. With the AOTF
function, line sequential scanning is available as well.
* Once optimized: steps q-r can be performed easily
Scanning unit set-up monitor display
Human colon crypt
Nuclei (Blue) TO-PRO-3
Actin (Green) Alexa 488
APC gene product (Red) Alexa 568
Christine Anderson,
Laboratory of Prof. Ray White,
Hunstsman Cancer Institute, Utah
q Excited by only HeNe633
w Excited by only Kr568
e Excited by only Ar488
r Composition
Easy exchange between display
methods
Independent navigation bars for each
image window enable the display method
to be changed quickly and easily.
Tiling display function for see-at-aglance comparison of multiple images
The FV300's live tiling function, which is
especially valuable in time course
experiments, allows observations of
multiple images or changes in the
specimen while the experiment is in
progress. Images in series (e.g. XYt or
XYZ) can be freely displayed.
Single monitor display is also possible.
Page 6

5
X -t
SlantLine-t
FreeLine-t
Y -t
Y-Z-tX-Y-t
ZoomIn-t
X-Z-t
X-Y-t
X-Y-Z-t
ZoomIn-Z-t
Patch clamp
BX61WI fixed stage upright microscope+translation stage
Image acquisition ROI designation Intensity versus time
measurement
Calcium sparks in isolated cardiac myocyte
Dr. Sandor Gyorke
Texas Technical University
X -t
X -t
Time Course
Using different scanning modes to chart time-lapse changes efficiently.
High-speed (4 frames/sec) image
acquisition
For the high speed observation of the
sample, Fluoview is capable of scanning 4
frames per second in a fast scanning mode
at an image size of 512X512. By limiting the
image size, the frame rate will be even
faster. This scanning mode is suitable for
living cell observation.
Versatile line scanning modes have
many uses
The wide variety of the line scanning modes
(linear/slant/free-line) enables flexible
analysis of rapid time-lapse experiments.
Superior slice patching system
In combination with the unique fixed stage &
nosepiece focusing BX61WI microscope,
the FV300 provides a highly effective
system for slice patching. This unique setup has a small footprint for increased room
in a space-limited cage. The remote control
microscope options minimize the danger of
accidentally touching the delicate
experimental settings.Olympus also offers
ideal non-cover glass long working distance
water immersion objectives and an optional
XY translation stage that moves the entire
confocal microscope system while the
sample and other experimental hardware
remains in a fixed position.
Highly precise time-lapse analysis
Fluoview’s wide dynamic range of 12-bit or
4096 grey levels provides enough sensitivity
to detect even the slightest changes in
intensity. The user can designate multiple
regions of interest (ROI) by using drawing
tools. The fluorescence intensity or the ratio
can be analyzed with the intuitive GUI driven
program.
Calcium wave in Xenopus oocyte, Calcium Green staining, fluorescence
pseudo-colored fluorescence image after injection of inositol 3-trisphospate
Japan Science and Technology Corporation, Exploratory Research for Advanced Technology,
Mikoshiba cell control project, Prof. Aya Muto
Calcium wave in isolated cardiac myocyte
Dr. Sandor Gyorke
Texas Technical University
Long working distance, non-cover
glass water immersion objective
Immersion-type LUMPLFL objectives
The 40X water immersion objective in this series has a
3.3mm working distance and an extremely fine tip which
is suitable for micromanipulation using a fixed stage
upright microscope. It has a large N.A. (0.8) and is also
ideal for confocal observations. When using the BX61WI
fixed stage & nosepiece focusing upright microscope
with water immersion objectives, confocal imaging can
be used to monitor time-lapse fluorescence changes in
thick specimens such as brain slices.
Page 7

6
The 440nm diode laser can be added
for CFP/YFP FRET imaging.
A 440nm diode laser is optionally available
for CFP/YFP imaging. The 440nm laser line
ideally excites CFP, with minimal
disturbance to YFP, and is therefore
suitable for CFP/YFP FRET experiments.
The high performance LSM objectives,
PLAPO40XWLSM and PLAPO60XWLSM,
are precisely corrected in this wavelength
range, and ensure the highest measuring
reliability.
*For simultaneous observation of CFP and YFP, 440nm
and 515nm laser lines are required.
Ratio imaging to analyze
2-wavelength images
Using time course software, the ratio image
can be continuously displayed in pseudocolor. At the same time, the intensity of
each channel can be monitored graphically.
The analysis process is presented as an
intuitive flow chart. (optional time course
software: TIEMPO)
Hardware and software support to optimize the environment for FRET.
FRET
Input/output of external trigger signal
The optional time course software gives
control over the input/output trigger signal
by GUI. It is suitable for combined
experiments such as those involving patch
clamping.
CFP Fluorescence wavelength 485nm
Measurement
Ratio changes when cameleon is manifested on the HeLa cell and stimulated by histamine then inhibited by
cyproheptadine.
Cameleon genes provided by Dr. Miyawaki Atsushi in Brain Research Institute.
Equipment: FV300 and HeCd laser
Time period : 4 seconds.
YFP Fluorescence wavelength 530nm
CFP/YFP FRET
Calcium ion concentration in a live HeLa cell using a cameleon (split type) indicator. Energy transfer between
CFP and YFP is proportional to bound calcium. The time series shows the increase of calcium ion density
caused by stimulation of histamine and the effect of blocking by proheputajin.
Page 8

7
PAPP for FRAP Application
PAPP: Programmable Acquisition Protocol Processor
Easy, reliable flow of experiments for fluorescence recovery after photobleaching.
AOTF and PAPP function for effective
FRAP (Fluorescence Recovery After
Photobleaching)
Fluorescence recovery after photobleaching
can be analyzed on any designated area by
means of the AOTF-equipped laser
combiner. During the processes of
photobleaching and recovery, the PAPP
function enables time scales to be freely
and easily programmed to suit different
experiment purposes.
New PAPP (Programmable Acquisition
Protocol Processor) makes it easy to
program a wide range of experiments
Using the new PAPP function, which is
included in standard software, the
experiment protocol is created by
describing the individual steps or phases
within the experiment. Users can specify
detailed conditions and parameters for each
step. This function enables users to
construct complex experimental protocols
with minimal effort. PAPP is suitable, for
example, for FRAP experiments that require
more flexibility.
Mouse; hippocampal neurons;
fluorescence of GFP
Living neurons expressing GFP were maintained in
culture and fluorescent images were obtained.
Subsequently, FRAP analysis was performed on
the same cell to determine the diffusion rate of
GFP proteins into the dendritic spines. Rapid
fluorescence recovery ( within seconds ) was
observed.
Shigeo Okabe
Department of Anatomy and Cell Biology
Tokyo Medical and Dental University
Fluorescence quantitation
Line graph depicting average
fluorescence intensity versus time.
q Fluorescence Baseline
w - t
Photobleaching at 0.22 sec interval
y - o
Fluorescence recovery at 0.32 sec interval
q
we t
r
yu oi
Page 9

8
Multi-point time lapse system
High-magnification multi-point time lapse observation of living cells.
Wide-ranging specimen observations
for improved experiment throughput
Use of a motorized XY stage allows the
analysis of time lapse changes in many
points scattered over a wide area. The
system is therefore effective for work with
thick specimens, such as observing
changes in the states and movements of
stem cells using a brain slice, or analyzing
expression mechanisms at the individual
level in an embryo. In wide-ranging tasks
such as analyzing cell functions using GFP,
the system provides many different kinds of
data at the same time, enabling a higher
overall level of experiment efficiency even in
long-lasting observations. In addition, using
separate chambers at the same time makes
it possible to perform different experiments
at the same time. These are just some of
the ways in which this system dramatically
improves the throughput of experiments
requiring long-duration observations.
Features
1. Measure up to 254 points
A variety of scan conditions can be set for each point,
such as XYZ coordinates, the Z-axis acquisition range
and the detector sensitivity.
2. Up to 5 X 5 adjacent fields of view registered
automatically
Since adjacent fields of view are registered
automatically, it is possible to broaden any given field
while maintaining a high magnification level.
3. High-precision XY stage scanning
A wide area can be observed with highly precise position
reproduction. Errors from repetition are not
accumulated. (High-precision XY stage complies
exclusively with the "PROSCAN" model from PRIOR
Scientific)
4. Flexible scanning conditions
The system combines scan flexibility with time lapse
imaging for monitoring changes in the specimen over
time.
No1
No2
No3
No4
No5
No6
z
z
z
z
z
z
Introduction of DsRed2 expression vector into brain of 14th day
mouse embryo through womb electroporation. Taking a specimen
slice from the 15th day embryo and observing the living nerve stem
cell and nerve cells subsequently born from it.
Image courtesy of:
Dr. Kazunori Nakajima
Dr. Hidenori Tabata
School of Medicine, Keio University
Using multi-point software*, it is possible to acquire an XYt, an XYZ or and XYZt image series
at multiple positions through automated software control of the motorized XY stage.
* Multi-point software and motorized XY stage are optional
Page 10

9
Tile display
Topographic projection
Height of 3D structure indicated by color.
X-Z
Y-Z
X-Y-Z
X -Z
Y -Z
Using multiple 3D images to obtain accurate 3D structure analysis.
3D Imaging
Easy Z axis operation and setting
The upper and lower limit of Z scanning can
be specified interactively by actually
scanning the sample or by direct input of
the numerical value.
Acquire X-Y-Z images and display X-Y
cross-sectional images quickly and
continuously in increments of 0.01*µm
Thanks to the precision driving mechanism
that enables 0.01µm step control within the
BX61, BX61WI and IX81 motorized
microscopes, high-quality continuous
cross-sectional images can be acquired.
The 3D function also provides extended
focus projections, red/green stereo views,
topographic projections and 3D animations
for exploring the structure of the sample.
Multi-plane images can be created from an
XYZ image series, enabling easy
measurement and observation of horizontal
and vertical cross sections. Other useful
procedures include 3D image cropping,
series animation and simple volume
measurement.
* 0.025µm is the smallest increment for other
microscope combinations.
X-Y-Z
ZoomIn-Z
Y -ZX -Z
SlantLine-Z
FreeLine-Z
Page 11

10
Link with patch clamping data
• With PCs linked through a LAN, Physiolink
can synchronize electrophysiological and
confocal image data simultaneously.
• With the same time stamp recorded in the
two PCs, it is possible to access and
analyze an image and its patch clamping
data corresponding to the Physiolink
software time scale.
• The patch clamping graph and Physiolink
software are interlocked and activated
concurrently.
• Physiolink software complies with the
FV300’s high-speed scanning, enabling
msec analysis.
Connecting two PCs by LAN is required.
Analyzing the degree of intensity overlap between channels.
Colocalization
Analyzing the state of a cell interior by synchronizing electrophysiological and confocal
image data. (
Optional software).
Physiolink
FV300
Ethernet
Axon
Clampex
Physioview software (Axon PC side)
Working conditions: Clampex Ver. 8.0 or later
Physiolink software (FV300 side)
Colocalization image (white)
Colocalization
By using this function to analyze multi-color
specimens, it is possible to discover
whether different labeled substances are
present in the same region. The ability to
quantify the Pearson correlation, the
overlapping coefficient and the
colocalization index allows colocalization
volumes to be compared between different
specimens. Images can also be analyzed in
series.
Thresholds Mode Regions/
Min-Max Bound Mode
Pacemaker neuron: Sea-slug (nudibranch)
Dr. Stuart Thompson, Department of Biological Sciences, Hopkins Marine Station, Stanford University.
Threshold Mode
Threshold lines can be interactively altered.
Regions/Min-Max Mode
Setting the ROI (region of interest) on the histogram makes it possible to create a
colocalization image. Values can also be obtained for Pearson correlation, overlapping
coefficient and colocalization index.
Page 12

11
Lucifer Yellow: retina ganglion cell
TexasRed: dopamine-operated amacrine cell
Prof. Shigetada Nakanishi
Dept. of Biological Sciences,
Kyoto Univ. Faculty of Medicine
Applications Gallery
Morphology
Structure of PtK2 cell
Nucleus: DAPI (Blue)
Actin: FITC (Green)
Mitochondria: Mito Tracker (Red)
Microtubules: Cy5 (White)
Neuron
Rat tongue taste bud
DAPI: Nuclei
FITC: TrkB, high-affinity receptor for brain-derived
neurotrophic factor
Texas Red: Protein Gene Products
Pr. Shigeru Takami
Department of Anatomy,
School of Health Science,
Kyorin University
Lucifer yellow injected visual interneurons of
swallowtail butterfly
Extended focus is used for every 100µm on 383µm
Z-range image and displayed by overlapping pseudo colors
Mituyo Kinoshita, Pr. Kentaro Arikawa
Laboratory of Neuroethology,Graduate School of
Integrated Science, Yokohama City University
Purkinje cell in the rat cerebellum
FITC: vesicular GABA transporter VGAT
Cy3: vesicular glutamate transporter VGLUT1
Pr. Masahiko Watanabe
Department of Anatomy,
Hokkaido University School of Medicine
Mouse hippocampal neurons
GFP: postsynaptic density protein
Rhodamine-phalloidin: actin
Hippocampal neurons expressing a GFP-tagged
postsynaptic density protein were fixed and
stained with rhodamine-phalloidin to visualize the
localization of cytoplasmic actin filaments.
In dendrites, actin filaments are concentrated in
the postsynaptic sites.
Shigeo Okabe
Department of Anatomy and Cell Biology
Tokyo Medical and Dental University
Human Colon Crypt
Alexa 488 and To-Pro 3
Christine Anderson,Prof. Ray White's Laboratory,
Huntsman Cancer Institute, U. Utah
Page 13

12
Fluorescent
Proteins
C elegans expressing beta-integrin fused to GFP
Dr. Xioping Xhu and Dr. John Plenefisch
University of Toledo, Dept. of Biology
GFP-labeling of Drosophila adults
Expression of DsRed in a zebrafish embryo
Extended focus image of 5µmx30 slice
Pr. Yasuhiro Kamei, Pr. Shunsuke Yuba
Institute for Molecular and Cellular Biology
Osaka University
Coexpression of EGFP and DsRed in
a zebrafish embryo
Extended focus image of 10µmx28 slice
Pr. Yasuhiro Kamei, Pr. Shunsuke Yuba
Institute for Molecular and Cellular Biology
Osaka University
GFP-labeling of Drosophila adult brain with staining
of mushroom bodies
Assistant Prof. Aigaki
Cytogenetics
Tokyo Metropolitan University, Science Dept.
Plant
Isolated Zinnia mesophyll cells
Keisuke Obara
Pr. Hiroo Fukuda
Department of Biological Sciences,
Graduate School of Science,
The University of Tokyo
Apoptosis of Tabacco hybrid plant cells
Dr. Wataru Marubashi
Laboratory of Plant Breeding and Cell Engineering,
School of Agriculture,Ibaraki University
Page 14

Fluorescence Dyes and Filters
300
400
500
600
700
BA530RIF
BA550RIF
BA650RIF
BA430-460
BA465-495
BA480-495
BA470-520
BA510-540
BA520-550
BA505-550
BA505-525
BA480-510
BA535-565
BA540-590
BA560-600
BA585-615
BA510IF
BA560IF
BA565IF
BA585IF
BA590
BA610IF
BA625IF
BA660IF
BA585-640
440 LD
405 LD
458 Multi Argon
488 Multi Argon
515 Multi Argon
543 Green HeNe
568 Krypton / Argon
633 Red HeNe
488 Argon
SDM515
SDM505
SDM570
RDM630
SDM630
SDM560
SDM600
ECFP
EYFP
Propidium Iodide
Rhodamine-Phalloidin
Cy3
EGFP
FITC
DsRed
Texas Red
Cy5
Short Pass
Band Pass
Long Pass
SDMFluorochrome
Excitation
Emission
433 475
Kaede
405 470 530 550 575
488
507
490
520
513
527
530
615
550
580
552
565
558
583
596
620
650
667
13
Page 15

Objectives for fixed stage upright
microscopes (using WI-UCD, WI-DICTHRA)
14
Item Specifications
Laser light Visible light laser source Select from the following laser, to mounted on laser combiner
source Multi-line Ar laser (458nm, 488nm, 515nm, Total 40mW), Ar laser (488nm,10mW), Kr laser (568nm, 10mW),
HeNe (G) laser (543nm,1mW), HeNe (R) laser (633nm,10mW), LD405 (405nm, 25mW), LD440 (440nm, 5.3mW)
Laser combiner Each laser light path is equipped with a continuously variable neutral density filter or AOTF
All laser lines are combined to apsis along the same fiber optic
Scanning unit Scanning method Galvanometer mirror scanners (both X and Y)
Field number 20 (10 with use of LD405 laser)
Pinhole 5-position pinhole turret
Image memory and Standard scanning mode: 256 x 256 (0.45s) - 2048 x 2048 (10.835s)
scanning speed Bi-directional high-speed scanning mode: 512 x 512 (0.25s) (Simultaneous scanning of up to 2 channels)
Image channel Selectable from 2-channel (fluorescence) or 2-channel (fluorescence) + 1-channel (transmitted light)
3-channel (fluorescence) using virtual channel
Selection of filters according to staining
Manual selection
Scanning modes XY, XYZ, XYT, XYZT, XZ, XT, XZT, point, Line-t, free line-t, line-z, free line-z, Clip, ZoomIn
Image depth resolution 12-bit (=4096 grey levels)
Zoom 1X-10X
Z-drive Step motor/Minimum step 10nm (BX61, BX61WI and IX81 combination), 25nm (other microscope combination)
Microscopes Upright BX51, BX61, BX51WI, BX61WI
Inverted (special laser safe frame) IX81FVSF, IX71FVSF (side port)
External trans- Transmitted light illumination unit External halogen light source connected to microscope via fiber cable
mitted light unit Transmitted light detector External detector unit with built-in photomultiplier Connected to microscope frame via fiber cable
Fluorescence illumination unit Connect to external mercury light source and microscope via fiber cable
Standard equipment of FV300-BX51, FV-300-BX61, FV300-BX51WI, FV300-BX61WI
PC with system control boards PC-AT compatible machine/OS: Windows XP (English version)/ 1GB memory (can be expanded to a maximum of 4GB)
CPU: Pentium 4, over 2.8GHz, Special I/F board/image capture: PCI bus
Graphic board: G450_Dual 32MB
Hard disk: 80GB 7200rpm_ID (ATA100) with DVD-ROM
Monitor: Two 19” LCD monitors are recommended, each able to display 1280x1024 images in full color (16.77 million colors)
LAN: On board
Fluoview Image acquisition Scanning condition setting: image size, scanning speed, zoom, panning etc.
application Real-time image calculation: Kalman filtering, peak integration,
software
Hardware control Laser, scanning unit, microscope
Each image display: Single-channel side-by- side, merge, cropping, tiling, series (Z/T) pass and continuous
Image display LUT: Individual color setting, pseudo-color, Overlay: Lines, text, scale bar, etc
Image processing Individual filter: Average, Low-pass, High-pass, Sobel, Median, Prewitt, 2D Laplacian, edge enhancement etc.
Calculations: Inter-image, mathematical and logical,
DIC back ground leveling
Image analysis Overview of fluorescence intensity within an area, histogram, perimeter measurement for user-assigned area,
time-lapse measurement , etc.
3D visualization 3D animation, left / right stereo pairs, red / green stereoscopic images and cross section
Others Graphic-based help, PAPP (Programmable Acquisition Protocol Processor), time course software (optional),
trigger IN/OUT function (optional), Multi point software (optional)
Power consumption Microscope (115V 6A/230V 3A), scanning unit+PSU (115V 3.5A/230V 2A), computer & monitor (115V 4.5A/230V 10A),
Ar laser (115V 10A/230V 5A), Mult-linei Ar laser (115V 10A/230V 5A), Kr laser (230V 20A),
HeNe laser each (115V 0.4A/230V 0.2A), LD laser (405nm, 440nm: 100V 0.9A/230V 0.5A)
Specifications
Objective N.A. W.D. DIC Revolving
prism nosepiece
MPL5X 0.10 19.60 — WI-SSNP,
WI-SRE2
UMPLFL10XW 0.30 3.30 U-LDPW10H WI-SSNP,
WI-SRE2
UMPLFL20XW 0.50 3.30 U-LDPW20H WI-SSNP,
WI-SRE2
LUMPLFL40XW 0.80 3.30 U-LDPW40H WI-SSNP,
WI-SRE2
LUMPLFL60XW 0.90 2.00 U-LDPW60H WI-SSNP,
WI-SRE2
LUMPLFL40XW/IR 0.80 3.30 U-LDPW40H WI-SSNP,
WI-SRE2
LUMPLFL60XW/IR 0.90 2.00 U-LDPW60H WI-SSNP,
WI-SRE2
LUMPLFL100XW 1.00 1.50 U-LDPW60H WI-SSNP,
WI-SRE2
XLUMPLFL20XW 0.95* 2.00 U-LDPXLU20 WI-SNPXLU
HR
* Note: These conditions are not met in confocal microscopy
Condenser for BX Condenser for IX
Description Immersion Correction ring U-UCD8A IX-LWUCDA
optical element optical element
UPLSAPO 4X
0.16 13 —
UPLSAPO 10X
0.40 3.1 0.17 U-DIC10 IX2-DIC10 normal
UPLAPO 10XO3
0.40 0.24 0.17 Oil U-DIC10 IX2-DIC10 normal
UPLAPO 10XW3
0.40 0.43 0.17 Water U-DIC10 IX2-DIC10 normal
UPLSAPO 20X
0.75 0.6 0.17 U-DIC20 IX2-DIC20 normal
UPLAPO 20XO3
0.80 0.19 — Oil U-DIC20 IX2-DIC20 normal
UPLSAPO 40X
0.90 0.2 0.11-0.23 _ U-DIC40 IX2-DIC40 normal
UPLFLN 40XO
1.30 0.2 0.17 Oil U-DIC40 IX2-DIC40 normal
PLAPON 60XO
1.42 0.15 0.17 Oil U-DIC60 IX2-DIC60 BFP1
UPLSAPO 60XO
1.35 0.15 0.17 Oil U-DIC60 X2-DIC60 normal
UPLSAPO 60XW
1.20 0.28 0.15-0.2 Water _ U-DIC60 X2-DIC60 normal
UPLSAPO 100XO
1.40 0.12 0.17 Oil U-DIC100 X2-DIC100 normal
Objectives for BX and IX
(using U-UCD8, IX-LWUCDA and U-DICTS)
NA W.D
Cover glass
thickness
U-DICTS
position
Page 16

● All brands are trademarks or registered trademarks of their respective owners.
● Monitor images are simulated.
Specifications are subject to change without any obligation on the part of the manufacturer.
This catalog is printed by enviromentally-friendly
waterless printing system with soy ink.
ISO9001
Certification
Design and production
adheres to ISO9001
international quality standard.
ISO14001
Design and production at the OLYMPUS
CORPORATION Ina Plant conforms with
ISO14001 specifications for
environmental management systems.
Certification
008
UKAS
ENVIRONMENTAL
MANAGEMENT
Certified ISO 14001 by
FV300-IX dimensions (unit: mm)FV300-BX dimensions (unit: mm)
Different types of laser combiners
Laser combiner with
Ar+HeNe (Red) / (Green) lasers
Laser combiner with
Multi Ar+HeNe (Red) / (Green) lasers
•Installation stand is not included in the unit.
* Please consult your Olympus dealer for additional laser
combinations.
External transmitted light detector system
Fluorescence illumination system
•Standard configuration for FV300-BX51/FV300-BX61/
FV300-BX51WI/FV300-BX61WI combination.
LD405 laser unit
*Direct fiber connection to scan unit.
LD440 laser unit
External transmitted light detector
and
fluorescence illumination system
Selectable from ND filter or AOTF combiner.
The shutters and light intensity can be
controlled via the Fluoview computer.
* Laser combiner for AOTF is required for
multi-line Argon laser.
This product corresponds to regulated goods as stipulated in the "Foreign Exchange and
Foreign Trade Control Law". An export license from the Japanese government is
required when exporting or leaving Japan with this product.
1310
1500
12001130
2330
1310
1370
12001130
2330
Depth: 990 Depth: 990
Printed in Japan M1444E-0205B
 Loading...