

Page 1

OOIColor
Color Analysis Worksheet
User's Guide
Version 2.0, January 2001
Offices: East Coast
380 Main Street, Dunedin, Fla., USA
727.733.2447 •• 727.733.3962 Fax
8:30 a.m.-6 p.m. EST
West Coast
5190 Golden Foothill Parkway, El Dorado Hills, Calif., USA
916.939-4300 •• 916.939.4307 Fax
Noon-9 p.m. EST
Ocean Optics B.V. (Europe)
Nieuwgraaf 108 G, 6921 RK DUIVEN, The Netherlands
31-(0)26-3190500 •• 31-(0)26-3190505 Fax
E-mail: Info@OceanOptics.com (general sales inquiries)
Info@OceanOpticsBV.com (for sales questions in
Europe)
Orders@OceanOptics.com (questions about orders)
TechSupport@OceanOptics.com (for technical
support)
Page 2

Copyright © 1999 Ocean Optics, Inc.
All rights reserved. No part of this publication may be reproduced, stored in a retrieval
system, or transmitted, by any means, electronic, mechanical, photocopying, recording, or
otherwise, without written permission from Ocean Optics, Inc.
This manual shall not, by way of trade or otherwise, be lent, re-sold, hired out or otherwise
circulated without the prior consent of Ocean Optics, Inc. in any form of binding or cover
other than that in which it is published.
Every effort has been made to make this manual as complete and as accurate as possible, but
no warranty or fitness is implied. The information provided is on an “as is” basis. Ocean
Optics, Inc. shall have neither liability nor responsibility to any person or entity with respect
to any loss or damages arising from the information contained in this manual.
Page 3

Table of Contents
Overview................................................................................................................................ 1
Worksheet Pages................................................................................................................ 2
Color Space and Illuminants......................................................................................... 2
Functions.......................................................................................................................... 2
Globals.............................................................................................................................. 2
Parameters ....................................................................................................................... 2
Coefficients and Intercept........................................................................................... 2
Integration Time........................................................................................................... 3
Sample to Average...................................................................................................... 3
Boxcar Smoothing Width ............................................................................................ 3
Delay Between Acquisitions ....................................................................................... 3
Observer ...................................................................................................................... 3
Illuminant Type ............................................................................................................ 3
Type of Color Measurement....................................................................................... 3
Type of Reference Tile ............................................................................................... 3
Acquisition ....................................................................................................................... 4
Store Reference.......................................................................................................... 4
Store Dark.................................................................................................................... 4
Calibrate Field Tile ...................................................................................................... 4
Start Acquisition........................................................................................................... 4
Stop Acquisition........................................................................................................... 4
Log Value ..................................................................................................................... 4
LAB Graphs and XYZ Graph ......................................................................................... 5
Experiment Tutorial............................................................................................................ 6
Reflective Color – An Overview.................................................................................... 6
Reflective Color Measurements with a White Standard.......................................... 6
Filed Tiles ......................................................................................................................... 7
Emissive Color Measurements..................................................................................... 8
Color Measurements: A Computation Tutorial......................................................... 9
Watch for Free Updates!................................................................................................. 11
Page 4
Overview
OOIColor is a Microsoft Excel worksheet template, which contains all of the necessary code to
access data directly from our line of miniature fiber optic spectrometers. Coupled with the
appropriate fiber optic probes, the worksheet and spectrometer combination can measure
reflective or emissive color.
The worksheet template operates under Microsoft Excel, version 5.0 or higher. Consult your
Excel documentation or help files for instructions on how to open and use worksheet templates.
Install the software by inserting the floppy disk into your disk drive, and running the
SETUP.EXE program.
OOIColor is intended as both a stand-alone application that is ready to use, as well as a template
for developing your own software. Be sure that you save a copy of the original version of the
worksheet template before you make any modifications.
All data acquisition and analysis is performed within this worksheet. Several color space values
are reported in numeric form: XYZ, xyz, L*u*v*, L*a*b*, W*U*V* and u’v’w’. Graphs are
provided for XYZ and L*a*b* color spaces.
Page 5
2
Worksheet Pages
Color Space and Illuminants
This worksheet page contains the tristimulus values for CIE1931 and CIE1964 observers as well
as the intensity of the 12 standard CIE illuminants. You should not change these values. When
you calibrate a field tile, or working standard, the reflectivity values are also stored on this page.
Functions
This worksheet page contains the source code for all of the data acquisition from the spectrometers
and processing macros. You are free to change this code as your experiments dictate, as long as
you follow the restrictions contained in the Credits and Copyright worksheet page.
Globals
The macro in this worksheet page defines all of the global variables used in this program.
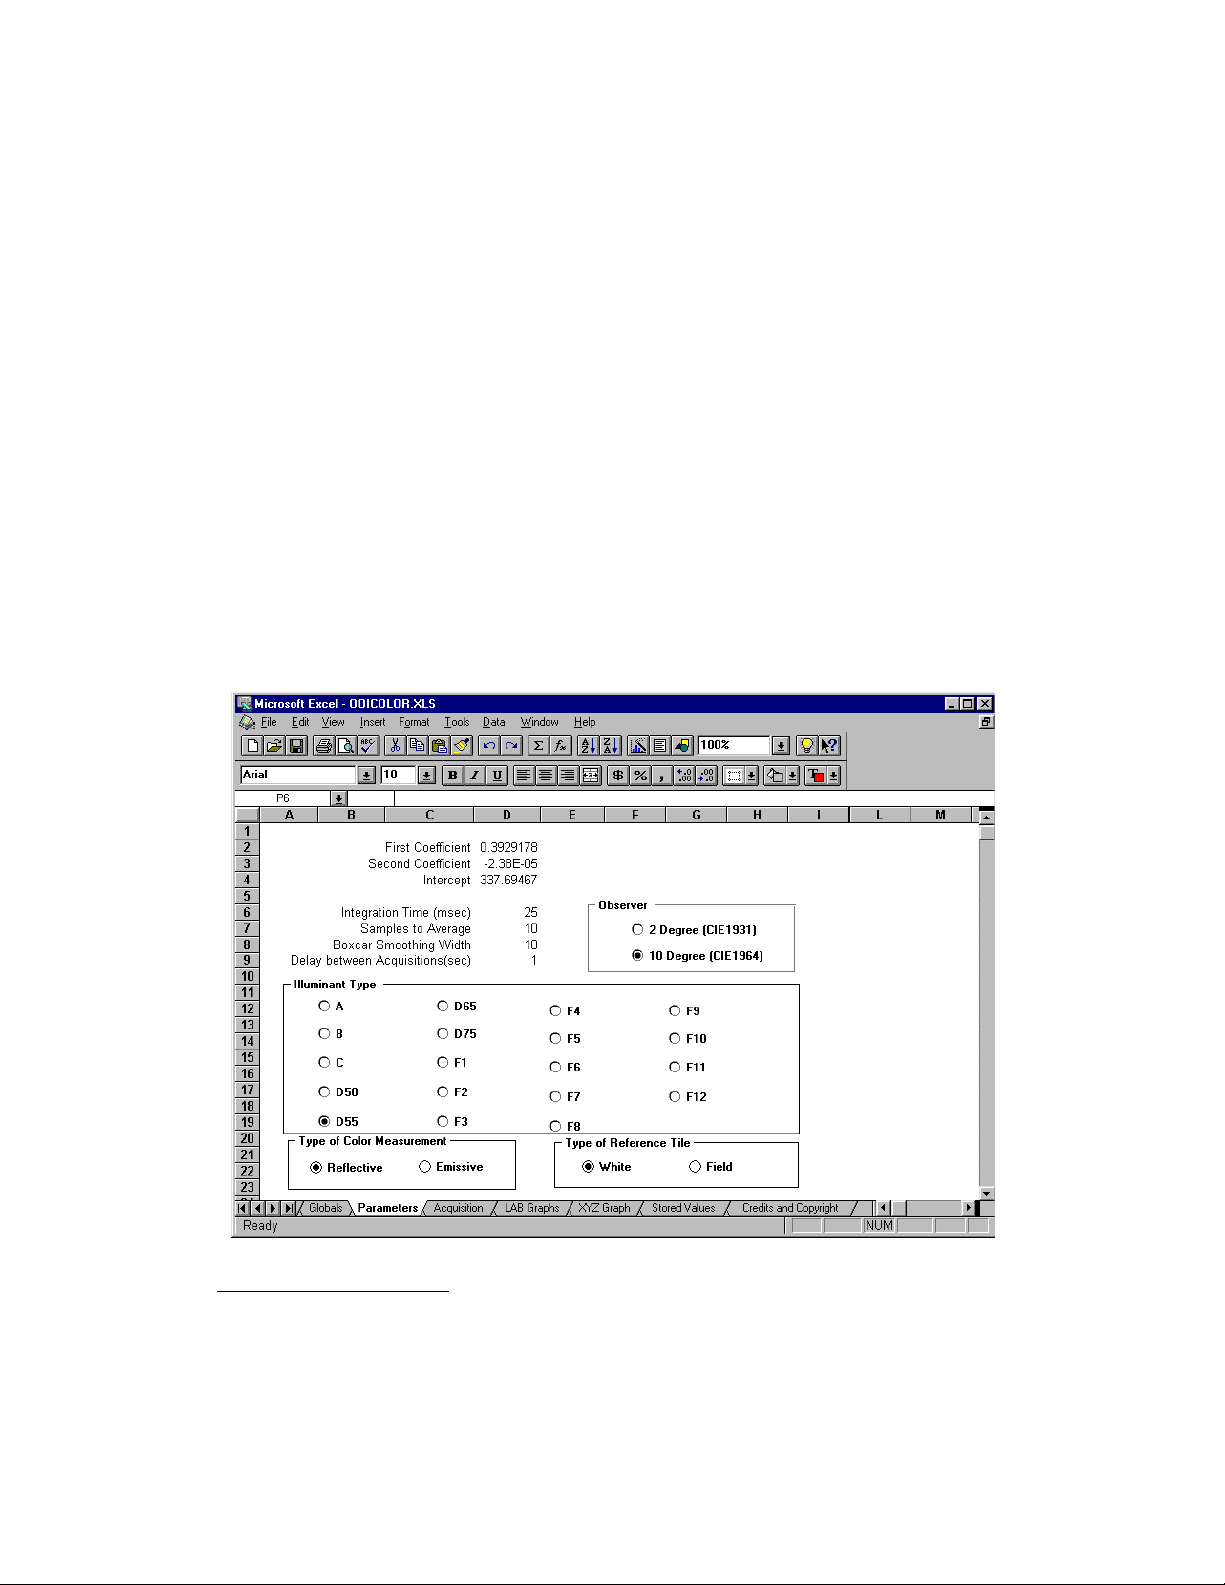
Parameters
This worksheet page contains all of the parameters necessary for data acquisition and processing:
Coefficients and Intercept
These values are the wavelength calibration coefficients of your spectrometer. They are
obtained from the calibration sheet that accompanied you spectrometer when you received it
from our factory. If you are missing this calibration sheet, please contact us for a free
replacement copy.
Page 6

3
Integration Time
The integration time of the spectrometer is analogous to the shutter speed of a camera. The
higher the value specified for the integration time, the longer the detector “looks” at the
incoming photons. If your intensity is too low, increase this value; if too high, decrease the
value. The following table lists the valid integration times for each spectrometer and A/D card:
Spectrometer ADC500 DAQ-700
S1000 8 msec – 16 seconds 40 msec – 16 seconds
S2000 4 msec – 60 seconds 20 msec – 60 seconds
Samples to Average
The value entered here sets the number of discrete spectral acquisitions that are accumulated
before OOIBase32 receives a spectrum. The larger the value, the better the signal-to-noise
(S:N ) ratio . The S:N improves by the square root of the number of spectra averaged.
Boxcar Smoothing Width
The value entered here sets the boxcar smoothing width, a technique that averages across
spectral data. This method averages a group of adjacent detector elements. A value of 5, for
example, averages each data point with 5 points (or bins) to its left and 5 points to its right. The
greater this value, the smoother the data and the higher the S:N. However, if the value entered
is too high, a loss in spectral resolution results. The S:N improves by the square root of the
number of pixels averaged.
Delay Between Acquisitions
This number controls the amount of time between spectral acquisitions. If you enter a 0 for
this value, the worksheet will acquire data as fast as possible. The Stop Acquisition button
will not operate, and you will have to press Esc to stop the acquisition. If you enter a number
greater than or equal to 1, you will be able to switch screens, stop the acquisition or even
retake a reference during the acquisition.
Observer
Check the observer that you wish to use.
Illuminant Type
Check the type of illuminant that you wish to use for the calculations.
Type of Color Measurement
Check the type of color measurement that you are performing.
Type of Reference Tile
Check the type of reference tile that you are using. These values are described in the
Experiment Tutorial section.
Page 7

4
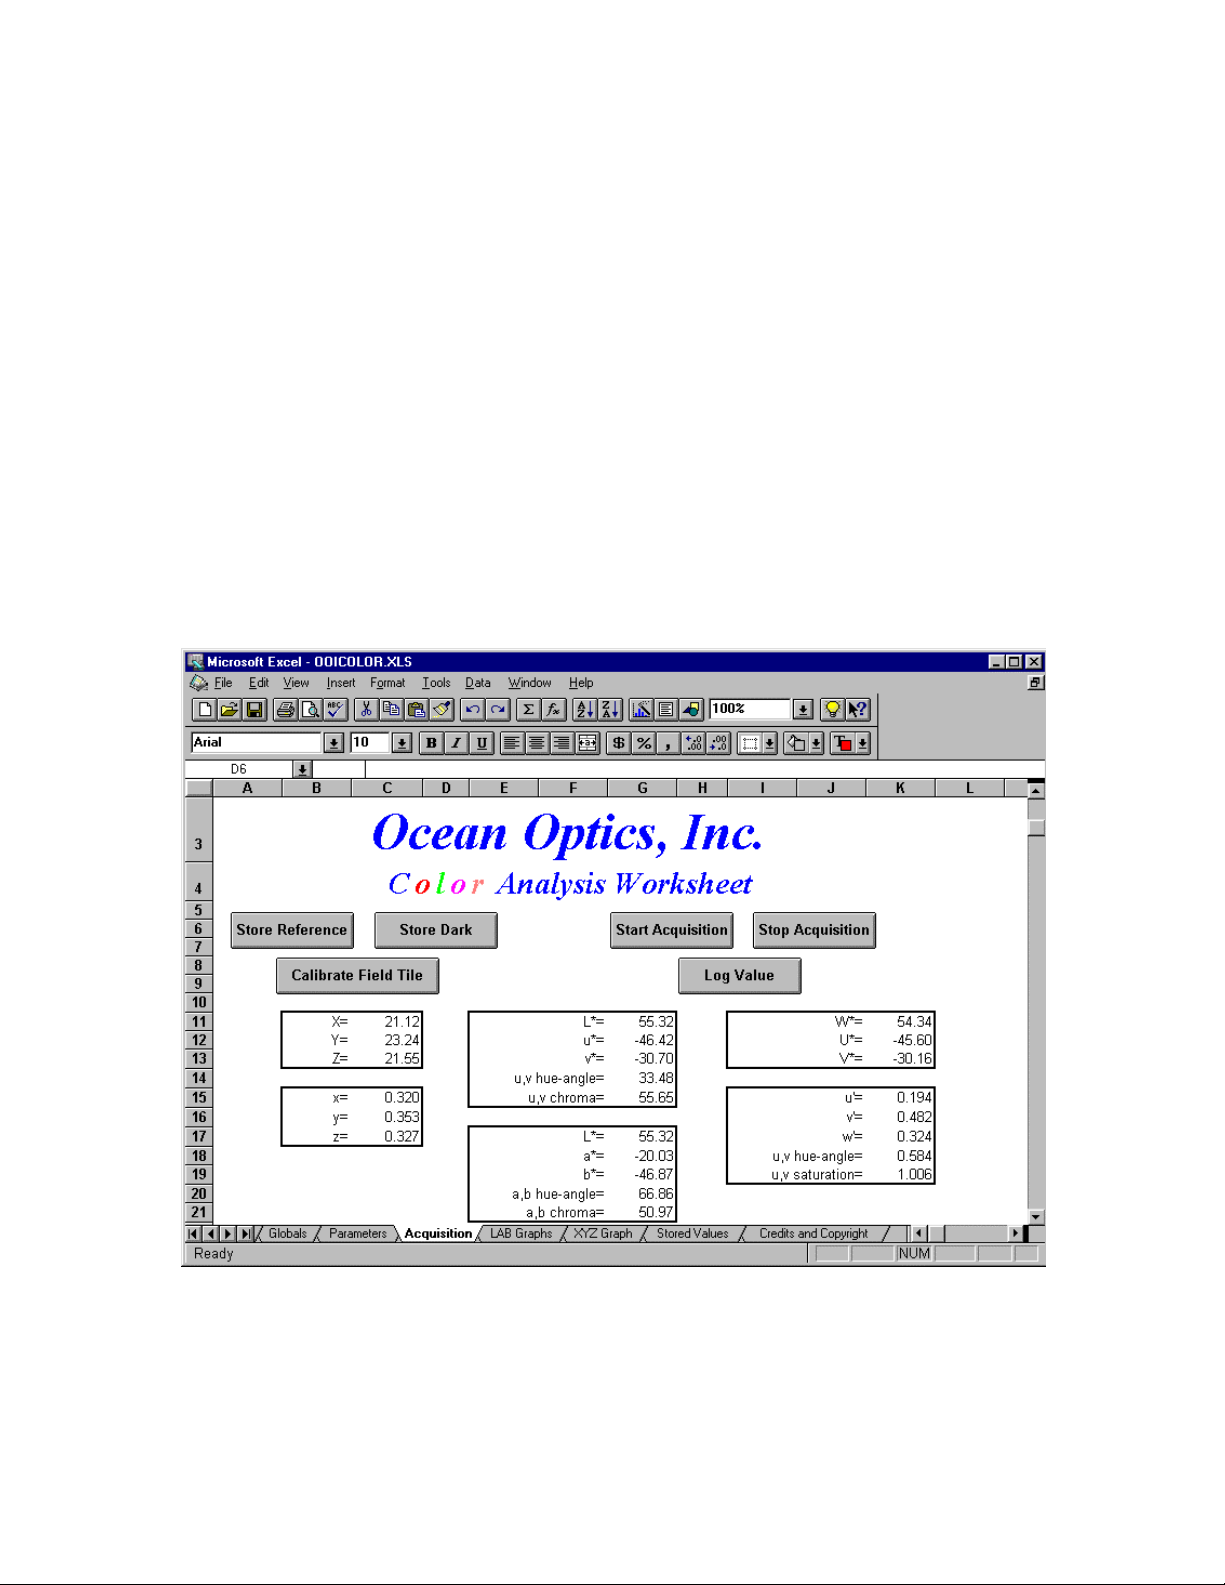
Acquisition
This worksheet page has buttons for the control of data acquisition, and displays the color space
values for the sample being analyzed.
Store Reference
In reflective color measurements, this button stores the reflection spectrum of either the white
standard (such as Ocean Optics’ WS-1) or your working standard or field tile (see the Parameters
page). For emissive color measurements, this button stores the spectrum of a blackbody of known
color temperature (e.g., Ocean Optics’ LS-1 has a color temperature of 3100K).
Store Dark
This button is for storing the spectrum obtained when there is no light entering the
spectrometer.
Calibrate Field Tile
This button is used to calibrate a working standard or field tile so that you can use something
other than a white standard to reference your spectrometer system.
Start Acquisition
After storing a dark and a reference, this button start the real-time data acquisition, which
constantly updates the color space values and graphs.
Stop Acquisition
This button stops the real-time data acquisition.
Log Value
This button takes the current XYZ and L*a*b* values and stores them in the Stored Values
worksheet page along with a time stamp and a brief, user-entered, description of the sample
being analyzed.
Page 8

5
LAB and XYZ Graphs
These pages display real-time graphs of the L*a*b* or XYZ color spaces, as illustrated below.
The buttons on these pages operate the same as the buttons on the Acquisition page:
Page 9

6
Experiment Tutorial
Reflective Color – An Overview
Ocean Optics offers several experimental arrangements to measure reflective color: our R200
fiber optic reflection probe, our ISP-REF integrating sphere or a custom geometry using optical
fibers and collimating lenses (74-VIS or 74-UV). All measurements produce valid results. The
choice of method is based on your experimental requirements and any procedural restraints such
as industry standards.
The R200 reflection probe consists of a bifurcated optical fiber bundle consisting of seven 200
µm optical fibers arranged in a six-around-one configuration. The outer six optical fibers provide
even surface illumination to your sample, while the central fiber reads the reflection from your
sample. The optical fiber probe is Y-shaped, with two arms of the Y being terminated in SMA
connectors, and the third leg terminated in a ¼” stainless steel tube. The end with the stainless
steel tube is the probe end of the fiber, and is positioned near your surface (our reflection probe
holder RPH-1 is ideal for this purpose). The other two ends of the optical fiber probe go into the
light source and the spectrometer; their orientation is extremely important. Look carefully at the
ends of the SMA connectors, and you will see that one has a hole that is about three times larger
than the other. The fiber leg with the larger hole MUST be placed in the light source. The leg
with the smaller hole is placed in the spectrometer.
Ocean Optics also offers an integrating sphere specifically designed for color measurements. The
inside of the sphere is illuminated with a tungsten-halogen light source, which will provide the
surface to be analyzed with even, non-directional surface illumination. An optical fiber is then
placed in the SMA port marked S, and the other end of the fiber is installed in your spectrometer.
The reference or sample is placed over the 1-cm orifice. There is a switch on the integrating
sphere marked E and I. This switch opens and closes a small port on the inside of the integrating
sphere, which Includes or Excludes the contribution of specular reflection from the sample.
Reflective Color Measurements with a White Standard
The first step in making a reflective color measurement is to take a spectrum of a physical
standard. This standard can be a 100% reflective white standard, such as Ocean Optics part WS-1.
The spectrometer response will be set to 100% reflective at all wavelengths.
Before making this measurement in OOIColor, it is a good idea to make the measurement in
OOIBase. The OOIBase program will allow you to see the scope-mode spectrum acquired in realtime, and to ensure that the spectrometer is receiving the proper amount of light. If you notice that
the spectrometer is saturated, you must either reduce the integration time of the spectrometer (see
Parameters worksheet page above), or reduce the amount of light entering the optical fiber. If you
are using an R200 fiber optic probe, you can easily reduce the amount of light entering the
spectrometer by simply moving the fiber probe farther away from your surface. If you are using
the integrating sphere, the only way to reduce the amount of light entering the optical fiber is to
use a fiber of smaller core diameter.
Page 10

7
If you observe that the light intensity is not very high (less than 2000 counts in scope mode), you
must either increase the integration time or move the R200 fiber optic probe closer to your
sample. If you are using an integrating sphere, using a larger diameter optical fiber will also
increase the signal intensity.
Once you find an experimental configuration that places the spectrum on scale, you are then
ready to switch back to OOIColor. Before you do, however, make a note of the integration time
that you used. Enter the integration time that you were using in OOIBase in the OOIColor
Parameters worksheet page, and make sure that the calibration coefficients of your spectrometer
are correctly entered on this page.
Go to the Acquisition worksheet page, place the white standard in the sample position, and click
on Store Reference. If you get an error box indicating that the spectrometer is not receiving the
proper amount of light, follow the instructions in the pop-up box to correct this problem. After
storing the reference, you now must store the dark spectrum. The dark spectrum is the spectrum
acquired when there is no light entering the spectrometer. If you are using an LS-1 light source,
there is a filter slot in the lamp in which you can insert a light block (a 3½” floppy disk without a
label works great). If you are using the integrating sphere, you must turn the internal light off to
take a reference. If you do, make sure that you allow the lamp to warm again up for
approximately 15 minutes before you continue acquiring data (you may even want to Store
Reference again).
After you have stored both the dark and the reference, unblock or turn on the light source and
place the substance to be analyzed in the sample location. Click on the Start Acquisition button,
and the color coordinates will be reported. To stop acquisition, simply click on the Stop
Acquisition button. To store the color space values, click on Log Values and enter a description
for the sample. They will be saved in the Stored Values worksheet page.
Field Tiles
White standards are typically expensive and easily damaged. A field tile is a rugged, inexpensive
tile which can be calibrated against the white standard. OOIColor allows you to calibrate this
field tile, and use it to reference the spectrometer. In order to calibrate the field tile, you will still
need a white standard, but you can leave this in a safe environment, and use the field tile as your
working standard.
To calibrate the field tile, go to the Acquisition page, and click on Calibrate Field Tile. This will
guide you through a series of spectral acquisitions (white tile reflection, dark spectrum and field
tile spectrum), which will compute the reflection spectrum of the field tile. This reflection data
will be stored in the Color Space and Illuminants worksheet page. After this field tile is
calibrated, you must go to the Parameters worksheet page and check the box to indicate that you
are using a Field Tile as the reference. You will then acquire data as described above, but instead
of using the white standard as the reference, you will be using the field tile that you calibrated.
This calibration only needs to be done once, as the reflection data is stored in the worksheet when
you exit and save it.
Page 11

8
Emissive Color Measurements
OOIColor also supports the measurement of emissive color, such as the light emitted from an
LED or a lamp. The experimental techniques are quite different from the measurement of
reflective color, and are outlined below.
The experimental configuration of the emissive color measurements consists of a single optical
fiber. One end of the fiber is placed in the spectrometer, and the other end is pointed at the light
source to be analyzed. To make emissive color measurements, you still must record a reference
and dark spectrum. The reference spectrum required for emissive color measurements is the
output of a blackbody illuminant at a known color temperature. For example, Ocean Optics offers
a miniature tungsten-halogen source, which behaves as a blackbody at 3100K. To take a reference
spectrum of the blackbody source, simply point the optical fiber at the source and click Store
Reference. You may be instructed to increase or decrease the integration time of the spectrometer,
as outlined above. After the reference is stored, you then must click Store Dark to record the dark
spectrum of the spectrometer. Make sure that when you do this, the optical fiber is not pointing at
any light source. Now, click Start Acquisition to begin acquiring color data, and point the optical
fiber at the light source to be analyzed.
Page 12

9
Color Measurements: A Computation Tutorial
−
∑
The fundamental computation involved in the measurement of color is to determine the reflection
spectrum of an object and apply it to a standard illuminant (a fictitious light source). The amount
of light from this standard illuminant that the object reflects (in terms of energy, not percent
reflection) is manipulated and reduced to the tristimulus values X,Y and Z. These values
correspond to the physiological response of the three types of color receptors that the typical
human has in his/her eye. These X,Y and Z values are then combined into uniform color spaces
(L*,a* and b*, for example).
The process begins by the acquisition of a reflection spectrum (Rλ) at 5nm intervals over the
wavelength range of 380-780nm (Note: All sums shown here are over this same interval).
S D
=
R D
λ λ
−
λ λ
R
λ
…where Rλ is the reflectivity at wavelength λ, Sλ is the sample spectrum intensity at wavelength
λ, Rλ is the reference spectrum intensity at wavelength λ and Dλ is the dark spectrum intensity at
wavelength λ.
The first step in the calculation is to compute the color matching values for the sample and the
reference:
x I x
=
ref
y I y
=
ref
z I z
=
ref
x R I x
y R I y
z R I z
…where xλ, yλ and zλ are the color matching coordinates at a specific wavelength, and Iλ is the
intensity of the illuminant at a specific wavelength.
sam
sam
sam
=
=
=
λ
∑
λ
∑
λ
∑
∑
∑
λ
λ λ
λ λ
λ λ
λ λ λ
λ
λ λ λ
λ
λ λ λ
Page 13

10
The tristimulus values (X, Y and Z) are computed by the following equations. It is important to
L
O
N
Q
XYZ
+
+
+
+
X
XYZ
15
3
′−′
note that by convention, these calculations are scaled so that the Y value for all illuminants is
100.00:
sam
ref
sam
ref
sam
ref
X
+ +
Y
+ +
Z
x
ref
M
P
y
M
P
ref
N
Q
L
O
y
ref
M
P
y
M
P
ref
N
Q
L
O
z
ref
M
P
y
M
P
ref
X
=
Y
=
Z
=
All other color space values are derived from these fundamental tristimulus values:
x
y
z
x
100
x
y
100
y
z
100
z
=
X Y Z
=
X Y Z
=
′ =
u
′ =
v
=
w
′
u v
, atan
hueangle
u v
,
Saturation
The derivation of other color space values can be found in references on measuring color. The
reference used for all of the coordinates and equations was R.W.G Hunt, Measuring Colour, 2
Edition, Ellis Horwood, 1991.
4
+ +
X Y Z
15 3
Y
9
+ +
X Y Z
15 3
− + +
X Y Z
3 6 3
=
v v
u u
′ − ′
u u
′−′
=
a f
13
v v
′ − ′
a f
Illuminant
Illuminant
2
Illuminant
2
Illuminant
nd
Page 14

11
Watch for Free Updates!
This software will be continuously updated and improved. You are entitled to free updates until a
completely new version is released. You can download the latest version at
ftp://ftp.oceanoptics.com/pub/OOIColor. The installation at this site will be password protected.
See the back of your Ocean Optics CD for the password, or contact Ocean Optics.
You can contact Ocean Optics, Inc. via one of the methods below:
Ocean Optics, Inc.
380 Main Street
Dunedin, FL 34698
(727) 733-2447
(727) 733-3962 fax
For the latest information, see our web site:
www.OceanOptics.com
Or, e-mail our Technical Service Department:
TechSupport@OceanOptics.com
 Loading...