

Page 1

OOIBase32
Spectrometer Operating Software
Installation Installation and Operation Manual
Document Number 000-20000-020-02-0505
Offices: Ocean Optics, Inc.
830 Douglas Ave., Dunedin, FL, USA 34698
Phone 727.733.2447
Fax 727.733.3962
8 a.m.– 8 p.m. (Mon-Thu), 8 a.m.– 6 p.m. (Fri) EST
Ocean Optics B.V. (Europe)
Geograaf 24, 6921 EW DUIVEN, The Netherlands
Phone 31-(0)26-3190500
F ax 31-(0)26-3190505
E-mail: Info@OceanOptics.com (General sales inquiries)
Info@OceanOpticsBV.com (European sales inquiries)
Orders@OceanOptics.com (Questions about orders)
TechSupport@OceanOptics.com (Technical support)
Page 2

Copyright © 1999-2005 Ocean Optics, Inc.
All rights reserved. No part of this publication may be reproduced, stored in a retrieval system, or transmitted, by any means, electronic,
mechanical, photocopying, recording, or otherwise, without written permission from Ocean Optics, Inc.
This manual is sold as part of an order and subject to the condition that it shall not, by way of trade or otherwise, be lent, re-sold, hired out or
otherwise circulated without the prior consent of Ocean Optics, Inc. in any form of binding or cover other than that in which it is published.
Trademarks
Microsoft, Windows, Windows 95, Windows 98, Windows ME, Windows NT, Windows 2000, Windows XP and Excel are either registered
trademarks or trademarks of Microsoft Corporation.
Limit of Liability
Ocean Optics has made every effort to ensure that this manual as complete and as accurate as possible, but no warranty or fitness is implied. The
information provided is on an “as is” basis. Ocean Optics, Inc. shall have neither liability nor responsibility to any person or entity with respect to
any loss or damages arising from the information contained in this manual.
Page 3

Table of Contents
About This Manual .......................................................................................................... iii
Document Purpose and Intended Audience ............................................................................. iii
What’s New in this Document ................................................................................................... iii
Document Summary.................................................................................................................. iii
Product-Related Documentation ............................................................................................... iv
Upgrades......................................................................................................................... iv
Chapter 1: ..................................................1OOIBase32 Introduction
Product Overview ............................................................................................................ 1
Scripting Functions.......................................................................................................... 1
Spectroscopic Functions ................................................................................................. 1
Free Updates................................................................................................................... 2
Chapter 2: ...................................................3Configuring OOIBase32
Overview.......................................................................................................................... 3
Connecting an A/D Converter to the PC.......................................................................... 3
Installing OOIBase32 ...................................................................................................... 4
Configuring OOIBase32 and your Hardware................................................................... 8
Operator and Serial Number ..................................................................................................... 8
Default Spectrometer Configuration File ................................................................................... 9
Configure Hardware ..................................................................................................................9
Spectrometer Configuration ...................................................................................................... 10
OOIBase32 Settings.................................................................................................................. 13
Configure Data Acquisition........................................................................................................ 13
Configure Sampling Optics.............................................................................................. 14
Getting Help .................................................................................................................... 14
Chapter 3: .........................................................15File Menu Functions
Overview.......................................................................................................................... 15
New Spectrum Window (Ctrl+N) ..................................................................................... 15
New ................................................................................................................................. 15
000-20000-020-02-0505
Page 4

Table of Contents
Open................................................................................................................................ 16
Dark ........................................................................................................................................... 16
Sample Dark.............................................................................................................................. 16
Reference .................................................................................................................................. 16
Sample....................................................................................................................................... 16
Processed.................................................................................................................................. 17
Experiment ................................................................................................................................ 17
Close ............................................................................................................................... 17
Save ................................................................................................................................ 17
Dark ........................................................................................................................................... 18
Sample Dark.............................................................................................................................. 18
Reference .................................................................................................................................. 18
Sample....................................................................................................................................... 18
Processed.................................................................................................................................. 18
Experiment ................................................................................................................................ 18
Autoincrement Filenames................................................................................................ 19
Enabled ..................................................................................................................................... 19
Show Name ............................................................................................................................... 19
Configure ................................................................................................................................... 20
Print ................................................................................................................................. 20
Print Preview ................................................................................................................... 20
Print Setup....................................................................................................................... 20
Exit .................................................................................................................................. 20
Chapter 4: ........................................................21Edit Menu Functions
Overview.......................................................................................................................... 21
Copy Spectral Data ......................................................................................................... 21
All Spectrometer Channels........................................................................................................ 21
Selected Spectrometer Channels.............................................................................................. 21
Copy Graphical Spectra (Ctrl+C)..................................................................................... 21
Settings ........................................................................................................................... 22
File Saving................................................................................................................................. 23
File Opening .............................................................................................................................. 24
Printing....................................................................................................................................... 25
Sounds ...................................................................................................................................... 25
Configuration Files..................................................................................................................... 26
Registration ............................................................................................................................... 28
Misc. Settings ............................................................................................................................ 28
ii 000-20000-020-02-0505
Page 5

Table of Contents
Chapter 5: View Menu Functions.......................................................31
Overview.......................................................................................................................... 31
Display Properties ........................................................................................................... 31
Active Line Type ........................................................................................................................ 32
Active Point Type ............................................................................................................ 32
Overlay Line Type ........................................................................................................... 33
Overlay Point Type.......................................................................................................... 34
Display Property Files ..................................................................................................... 35
Save Display Settings................................................................................................................ 35
Restore Display Settings ........................................................................................................... 36
Spectrum Scale ............................................................................................................... 36
Autoscale...................................................................................................................................37
Set Scale ................................................................................................................................... 38
Unscale...................................................................................................................................... 38
Background Image .......................................................................................................... 38
Visible ........................................................................................................................................ 38
Select Bitmap .................................................................................................................. 39
Set Graph Background Color .......................................................................................... 39
Set Axis Text Properties.................................................................................................. 40
Set Graph Title ................................................................................................................ 40
Rename Spectral Window............................................................................................... 40
Cursor.............................................................................................................................. 41
Enabled ..................................................................................................................................... 41
Configure ................................................................................................................................... 41
Grid.................................................................................................................................. 42
Enabled ..................................................................................................................................... 42
Configure ................................................................................................................................... 42
Legend ............................................................................................................................ 43
Enabled ..................................................................................................................................... 44
Configure ................................................................................................................................... 44
Show Overlay Filename ............................................................................................................45
Main Status Bar............................................................................................................... 45
Chapter 6: ..................................................47Overlay Menu Functions
Overview.......................................................................................................................... 47
Select to add overlay....................................................................................................... 47
Clear All........................................................................................................................... 48
000-20000-020-02-0505 iii
Page 6

Table of Contents
Chapter 7: ........................................49Spectrometer Menu Functions
Overview.......................................................................................................................... 49
Configure......................................................................................................................... 49
Wavelength Calibration Tab ...................................................................................................... 49
A/D Interface Tab ...................................................................................................................... 51
Reference Monitoring Tab......................................................................................................... 52
Stray Light Correction Tab ........................................................................................................ 56
Detector Linearity Tab ............................................................................................................... 57
Open Configuration ......................................................................................................... 58
Save Configuration As..................................................................................................... 59
Chapter 8: Spectrum Menu Functions ..............................................61
Overview.......................................................................................................................... 61
Store Dark ....................................................................................................................... 61
Store Reference .............................................................................................................. 61
Snapshot ......................................................................................................................... 62
Single Exposure .............................................................................................................. 62
Emergency Reset............................................................................................................ 62
Kickstart........................................................................................................................... 62
Global .............................................................................................................................. 63
Store Global Dark ...................................................................................................................... 63
Store Global Reference............................................................................................................. 63
Global Snapshot ........................................................................................................................ 63
Global Emergency Reset .......................................................................................................... 63
Configure Data Acquisition.............................................................................................. 64
Basic Tab................................................................................................................................... 64
External Trigger Tab.................................................................................................................. 66
Strobe Tab.................................................................................................................................66
HR4000/HR2000+ Features............................................................................................ 67
Scope Mode .................................................................................................................... 69
Scope Mode Minus Dark ................................................................................................. 70
Absorbance Mode ........................................................................................................... 70
Transmission Mode ......................................................................................................... 71
Relative Irradiance Mode ................................................................................................ 71
Specular Reflection Mode ............................................................................................... 72
Script-defined Custom Mode........................................................................................... 72
iv 000-20000-020-02-0505
Page 7

Table of Contents
Reference Color Temperature......................................................................................... 72
Configure Standard Correction........................................................................................ 73
Take Log of Vertical Scale .............................................................................................. 73
Time Normalized Intensity............................................................................................... 73
Enable........................................................................................................................................ 73
Store Reference Dark................................................................................................................ 74
Store Sample Dark .................................................................................................................... 74
Store Reference (Ctrl+R)........................................................................................................... 74
Chapter 9: Time Acquisition Menu Functions..................................75
Overview.......................................................................................................................... 75
Configure......................................................................................................................... 75
Configure Acquisition ...................................................................................................... 75
Configure Time Channels.......................................................................................................... 77
Restore Parameters ..................................................................................................................80
Save Parameters............................................................................................................. 80
Activate Time Acquisition ................................................................................................ 80
Start................................................................................................................................. 80
Pause .............................................................................................................................. 81
Stop ................................................................................................................................. 81
Suspend Graph Display .................................................................................................. 81
Save Data........................................................................................................................ 81
Chapter 10: Other Menu Functions ...................................................83
Overview.......................................................................................................................... 83
Script Menu Functions..................................................................................................... 83
Window Menu Functions ................................................................................................. 83
Arrange Icons ............................................................................................................................ 84
Help Menu Functions ...................................................................................................... 84
Contents .................................................................................................................................... 84
Index.......................................................................................................................................... 84
Always on Top ........................................................................................................................... 84
About OOIBase32 ..................................................................................................................... 85
Appendix A: ....................................................87Experiment Tutorials
Overview.......................................................................................................................... 87
Preparing for Experiments............................................................................................... 87
000-20000-020-02-0505 v
Page 8

Table of Contents
Application Tips ......................................................................................................................... 88
Absorbance Experiments ................................................................................................ 89
Transmission Experiments .............................................................................................. 91
Reflection Experiments ................................................................................................... 93
Relative Irradiance Experiments...................................................................................... 95
Time Acquisition Experiments ......................................................................................... 97
Appendix B: .........................................................................101Toolbars
Overview.......................................................................................................................... 101
Toolbar Descriptions ....................................................................................................... 101
General Functions ..................................................................................................................... 102
Platinum Functions .................................................................................................................... 103
Global Functions........................................................................................................................ 103
Acquisition Parameters ............................................................................................................. 103
Spectrum Controls..................................................................................................................... 104
Cursor Controls ......................................................................................................................... 105
Graph Scale............................................................................................................................... 106
Spectral View Mode................................................................................................................... 106
Time Acquisition ........................................................................................................................ 107
USB-LS-450 .............................................................................................................................. 108
NIR512 ...................................................................................................................................... 108
USB-ISS-UV/VIS ....................................................................................................................... 109
Toolbar Buttons Quick Reference ................................................................................... 109
Appendix C: File Formats...................................................................113
Overview.......................................................................................................................... 113
Spectral Data Files .................................................................................................................... 113
Experimental Parameters Files ................................................................................................. 114
Display Properties Files............................................................................................................. 117
Spectrometer Configuration Files..............................................................................................119
Time Acquisition Parameters Files............................................................................................121
Time Acquisition Data Files and Stream Files .......................................................................... 123
Grams/32 SPC Files.................................................................................................................. 124
Copied Data Clipboard Files ..................................................................................................... 124
Index.....................................................................................................125
vi 000-20000-020-02-0505
Page 9
About This Manual
Document Purpose and Intended Audience
This document provides you with installation and configuration instructions section to get your system up
and running. In addition, a description of the user interface is provided.
What’s New in this Document
This version of the OOIBase32 Spectrometer Operating Software Installation and Operation Manual
includes information specific to the HR4000, HR2000+ and QE65000 Spectrometers.
Document Summary
Chapter Description
Chapter 1: OOIBase32 Introduction
Chapter 2:Configuring OOIBase32 Contains instructions for installing and configuring the
Chapter 3: File Menu Functions Contains descriptions of the functions on the File Menu.
Chapter 4: Edit Menu Functions Contains a description of the functions on the Edit
Chapter 5: View Menu Functions Contains descriptions of the functions on the View
Chapter 6: Overlay Menu Functions Contains descriptions of the functions on the Overlay
Chapter 7: Spectrometer Menu Functions Contains descriptions of the functions on the
Chapter 8: Spectrum Menu Functions Contains descriptions of the functions on the Spectrum
Provides an overview of the OOIBase32 Operating
Software.
OOIBase32 application software.
Menu.
Menu.
Menu.
Spectrometer Menu.
Menu.
Chapter 9: Time Acquisition Menu Functions Contains descriptions of the functions on the Time
Acquisition Menu.
000-20000-020-02-0505 iii
Page 10
About This Manual
Chapter Description
Chapter 10: Other Menu Functions Contains descriptions of options and functions available
from other menus in OOIBase32 not described in the
other chapters.
Appendix A: Experiment Tutorials Contains instructions for performing sample experiments
using the USB2000 Spectrometer and OOIBase32
software.
Appendix B: Toolbars Provides a quick reference for the options available on
the various dockable toolbars in OOIBase32.
Appendix C: File Formats Contains information about the files created by
OOIBase32 for viewing and editing purposes.
Product-Related Documentation
• External Triggering Options
• Various spectrometer documents such as the HR4000 and HR4000CG-UV-NIR Series Installation
and Operation Manual.
You can access documentation for Ocean Optics products by visiting our website at
http://www.oceanoptics.com. Select Technical → Operating Instructions, then choose the appropriate
document from the available drop-down lists. Or, use the Search by Model Number field at the bottom
of the web page.
You can also access operating instructions for Ocean Optics products on the Software and Technical
Resources CD included with the system.
Engineering-level documentation is located on our website at Technical → Engineering Docs.
Upgrades
Occasionally, you may find that you need Ocean Optics to make a change or an upgrade to your system.
To facilitate these changes, you must first contact Customer Support and obtain a Return Merchandise
Authorization (RMA) number. Please contact Ocean Optics for specific instructions when returning a
product.
iv 000-20000-020-02-0505
Page 11

Chapter 1
OOIBase32 Introduction
Product Overview
OOIBase32 Spectrometer Operating Software (OOIBase32) is Ocean Optics’ next generation of operating
software, is user-customizable, and is compatible with all Ocean Optics spectrometers. OOIBase32 is a
32-bit advanced acquisition and display program that provides a real-time interface to a variety of signalprocessing functions for Windows 95/98/ME/NT/2000/XP users.
OOIBase32 enables you to perform spectroscopic measurements such as absorbance, reflectance, and
emission. You can control all system parameters, collect data from up to eight spectrometer channels
simultaneously, and display the results in a single spectral window. Additionally, you can perform
complex acquisition procedures such as reference monitoring and time acquisition experiments.
Scripting Functions
OOIBase32 Platinum is the standard OOIBase32 software with an embedded Visual Basic for
Applications-compatible scripting language. Scripts can automate OIBase32 to perform experiments,
methods and procedures and they can configure the way OOIBase32 acquires, displays and processes
data. Scripting language functionality added to OOIBase32 allows you to modify OOIBase32 to reflect
your specific needs. The Platinum version of OOIBase32 exposes a fully functional automation interface,
allowing OOIBase32 Platinum to be controlled from any application supporting automation or ActiveX
programming.
Spectroscopic Functions
OOIBase32 allows you to perform the three basic spectroscopic experiments – absorbance, reflectance
and emission – as well as signal-processing functions such as electrical dark-signal correction, stray light
correction, boxcar pixel smoothing and signal averaging. Scope mode, the spectrometer operating mode
in which raw data (signal) is acquired by the detector, allows you to establish these signal-conditioning
parameters. The basic concept for the software is that real-time display of data allows users to evaluate
the effectiveness of their experimental setups and data processing selections, make changes to these
parameters, instantly see the effects and save the data. Most spectrometer-system operating software does
not allow such signal-conditioning flexibility.
000-20000-020-02-0505 1
Page 12

1: OOIBase32 Introduction
With OOIBase32, you can perform time-acquisition experiments for kinetics applications. As part of the
time-acquisition function, you can monitor and report up to 6 single wavelengths and up to 2
mathematical combinations of these wavelengths. In addition, you can perform reference monitoring in a
variety of ways: single wavelength (1 or 2 channels), integrated intensity (starting and ending
wavelengths for 1 or 2 channels) and wavelength-by-wavelength (2 channels).
OOIBase32 gives you complete control of setting the parameters for all system functions such as
acquiring data, designing the graph display, using spectra overlays and configuring the cursor. You can
also save and then retrieve all of these system parameters for future experiments. OOIBase32 has the
benefit of providing various software-controlled triggering options for external events such as laser firing
or light source pulsing.
Other advanced features give you several data-collection options. You can independently store and
retrieve dark, reference, sample and processed spectra. All data can be saved to disk using
autoincremented filenames. You can save data as ASCII files or in the native GRAMS/32 SPC format.
One feature prints the spectra and another copies spectral data into other software such as Excel and
Word.
Other OOIBase32 extras include the ability to monitor the status bar for each spectral window, which
reflects numerous parameters set by the user; the ability to manipulate the placement of an array of
dockable toolbars; and the ability to choose sound cues for a variety of spectroscopic events. You can also
designate how to receive data acquisition warnings such as when the Scope mode signal has saturated in
absorbance, transmission and irradiance modes. In addition, the time-normalization function allows you
to designate separate integration times for reference and sample scans.
Free Updates
You can obtain free updates to the OOIBase32 software by visiting the following web address:
http://www.oceanoptics.com/technical/softwaredownloads.asp
Right-click on OOIBase32™ Spectrometer Operating Software and select Save Target As… to
download the executable to your machine. Once downloaded, double-click on the file to install
OOIBase32.
2 000-20000-020-02-0505
Page 13

Chapter 2
Configuring OOIBase32
Overview
The following sections will guide you in configuring your OOIBase32 software and your Ocean Optics
hardware components.
Note
If you are using a USB-based spectrometer, do NOT connect the spectrometer to the PC
until you install the OOIBase32 software. Follow the instructions contained in this
section to properly connect and configure your system.
Connecting an A/D Converter to the PC
If your hardware configuration requires you to connect an external A/D Converter to the PC, consult the
operating instructions for your particular model of A/D Converter for instructions on properly configuring
the equipment for use with OOIBase32. Currently supported A/D Converter models include:
• ADC1000-USB
• ADC1000-ISA
• ADC2000-PCI
Ocean Optics has discontinued the A/D Converters on the list below. The OOIBase32 software still
supports the use of these products:
• ADC500
• DAQ-700
• SAD500
To use one of these models, consult version 1.0 of the OOIBase32 Spectrometer Operating Software
Manual for specific instructions on connecting these models, or consult the operating instructions for the
A/D Converters directly.
000-20000-020-02-0505 3
Page 14

2: Configuring OOIBase32
Note
When using a USB-based spectrometer (such as the USB2000 or HR2000), you do not
need to perform this step. Proceed to the Installing OOIBase32 section.
There may be A/D Converter models manufactured after the publication of this manual that do not appear
in this document. Consult the manual for your A/D Converter for specific instructions, or contact Ocean
Optics Technical Support.
Installing OOIBase32
Once you configure your A/D Converter, you can install the OOIBase32 software. Follow the steps below
to install the software.
Note
These instructions apply to Software and Technical Resources CDs published after April
2003.
► Procedure
To install OOIBase32 software,
1. Close all other applications running on the PC.
2. Start the OOIBase32 installation process.
Installing from CD:
a. Insert the Software and Technical Resources CD containing the OOIBase32 software. The
CD interface automatically launches.
b. Click on Install Ocean Optics Software.
c. Click on OOIBase32 Operating Software. The installation process begins.
Installing from the Web:
a. Go to
b. Right-click on OOIBase32™ Spectrometer Operating Software and select Save Target
c. Double-click on the downloaded file. The installation process begins.
http://www.oceanoptics.com/technical/softwaredownloads.asp.
As… to download the executable to your machine.
3. Click the Next button at the Welcome screen. The Read Me File screen appears.
4 000-20000-020-02-0505
Page 15
2: Configuring OOIBase32
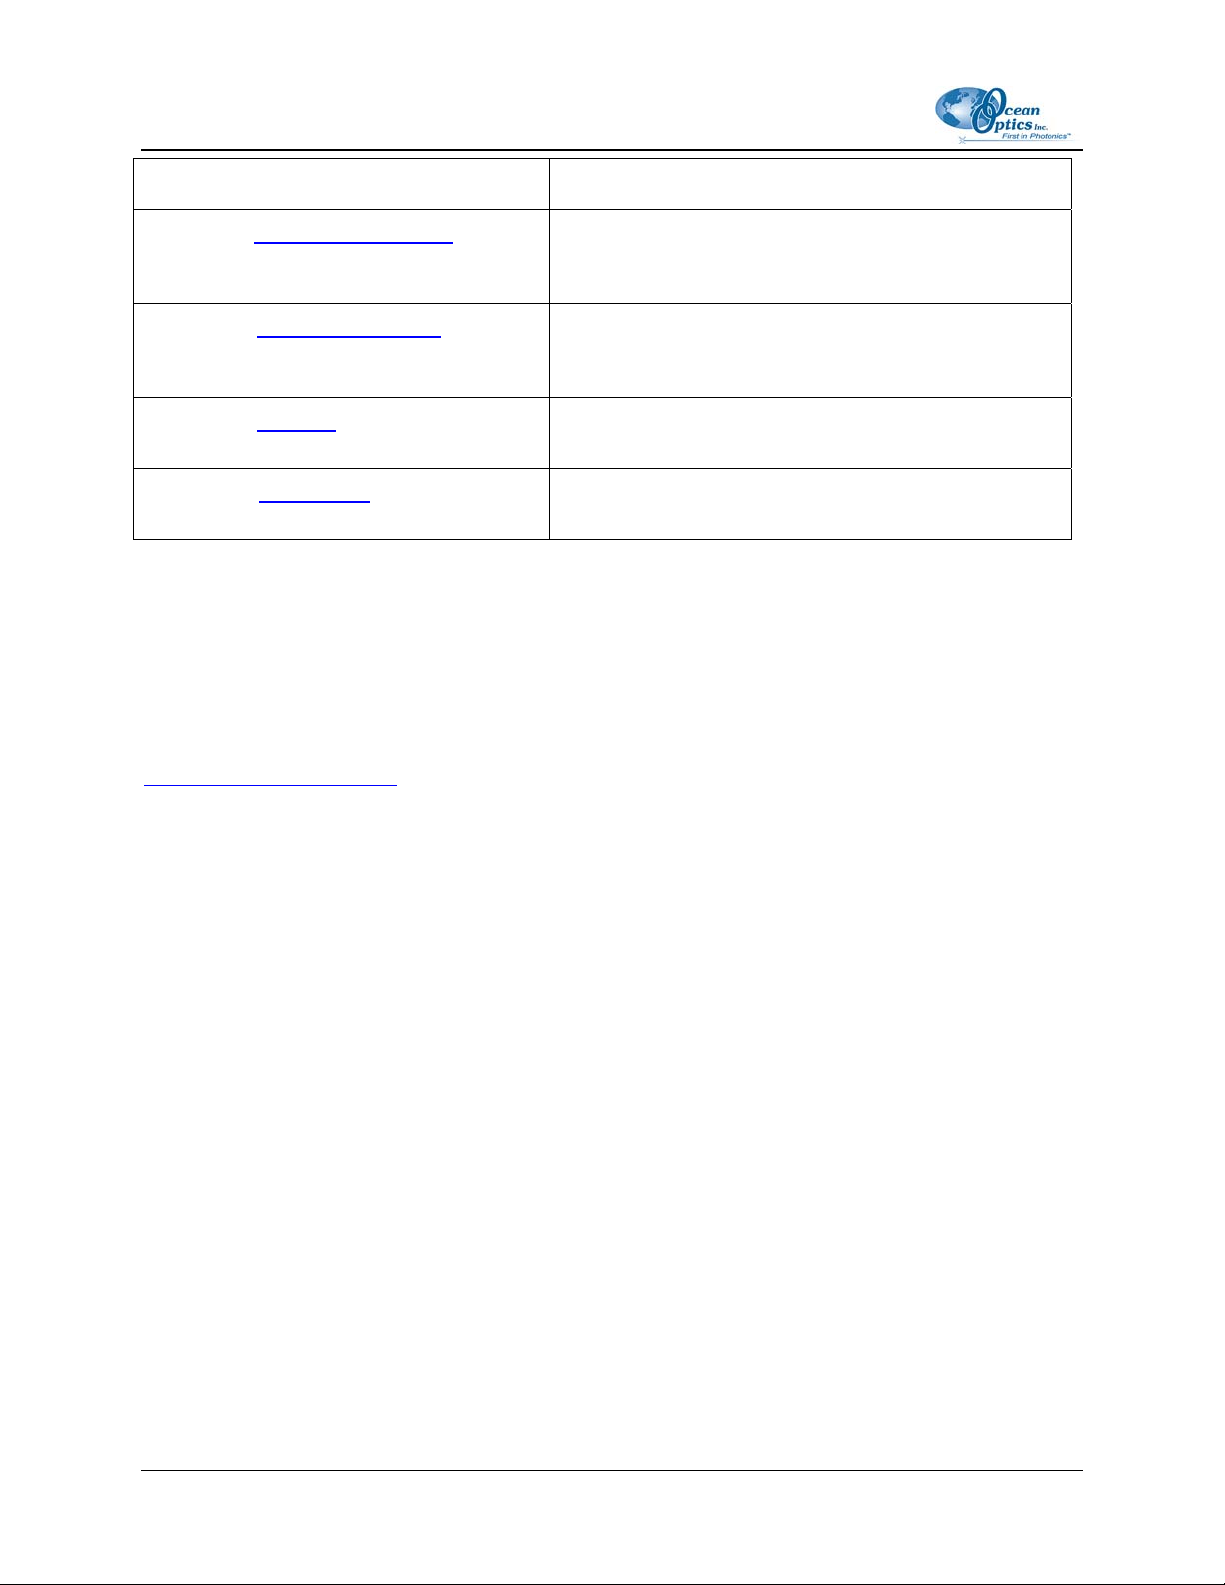
4. Read the Read Me file and click the Next button. The Choose Destination Location screen
appears.
5. Click the Browse button to customize your installation location, or click the Next button to
proceed. The Backup Replaced Files screen appears.
000-20000-020-02-0505 5
Page 16
2: Configuring OOIBase32
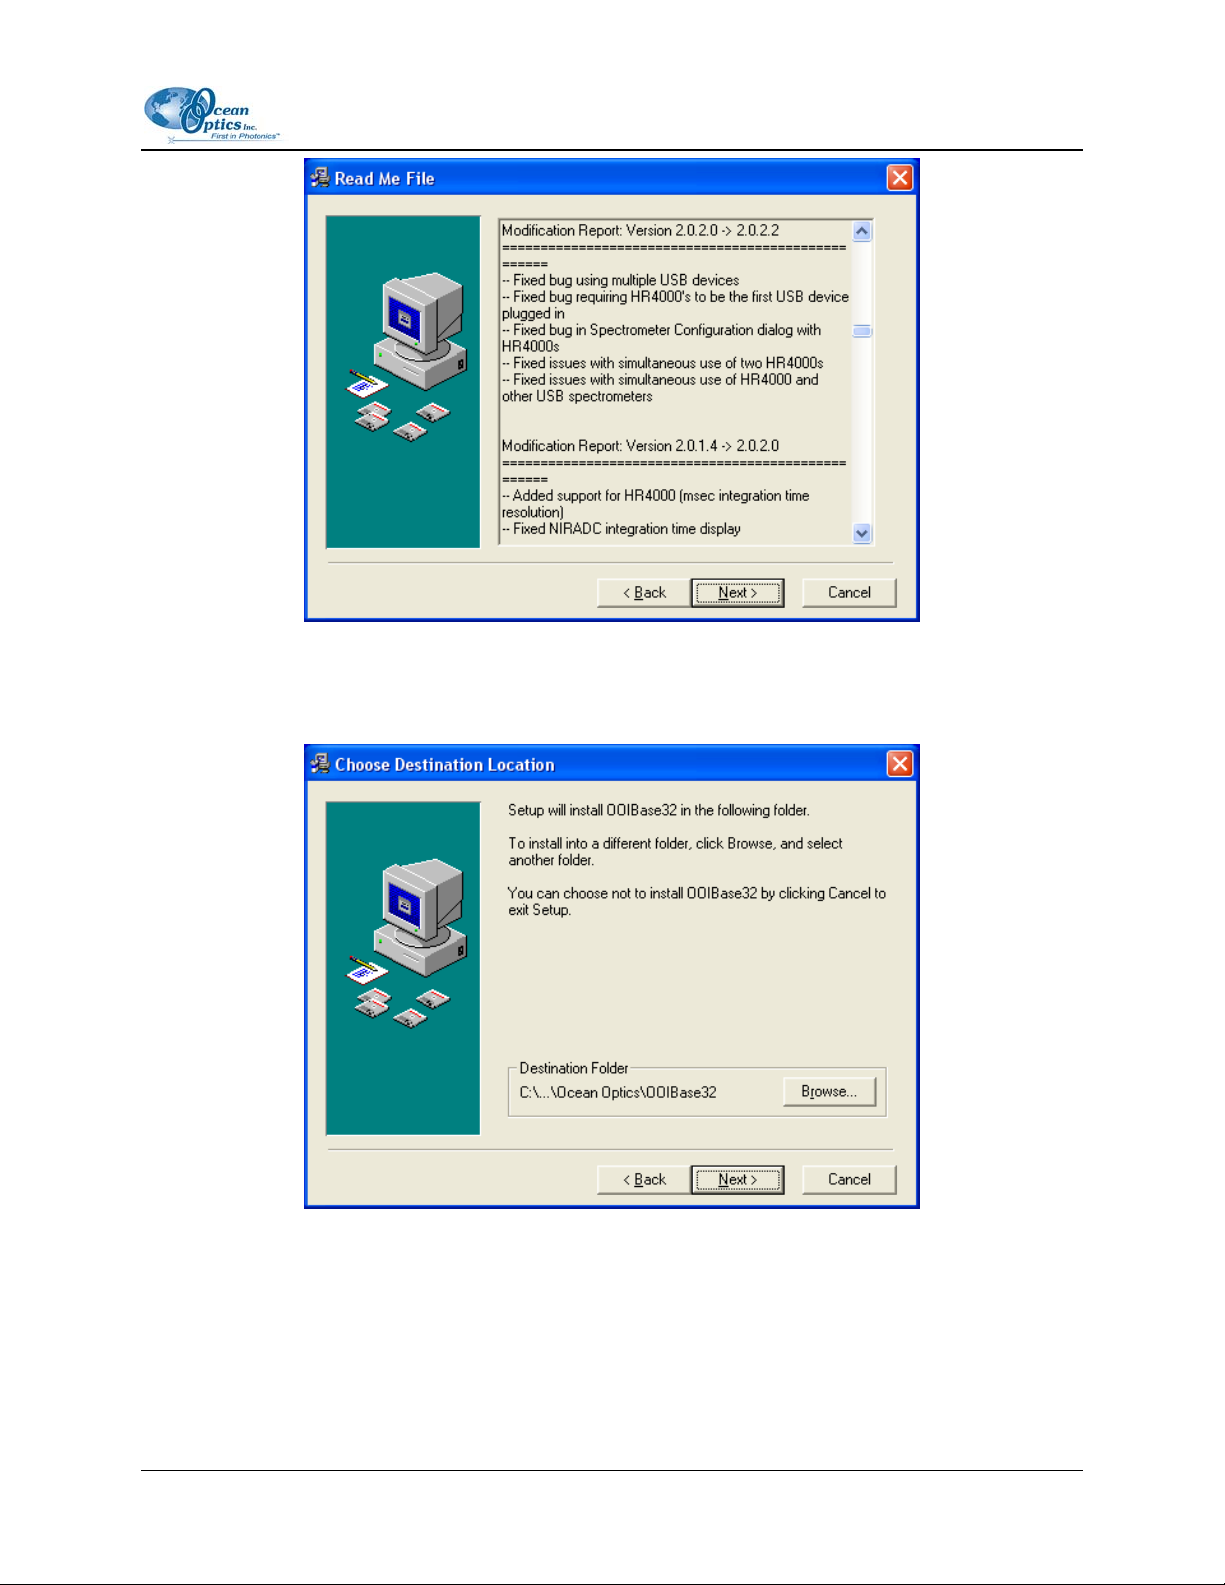
6. Click the Yes button to back up replaced files (OOIBase32 prompts you for a backup location), or
click the No button to proceed. The Select Program Manager Group screen appears.
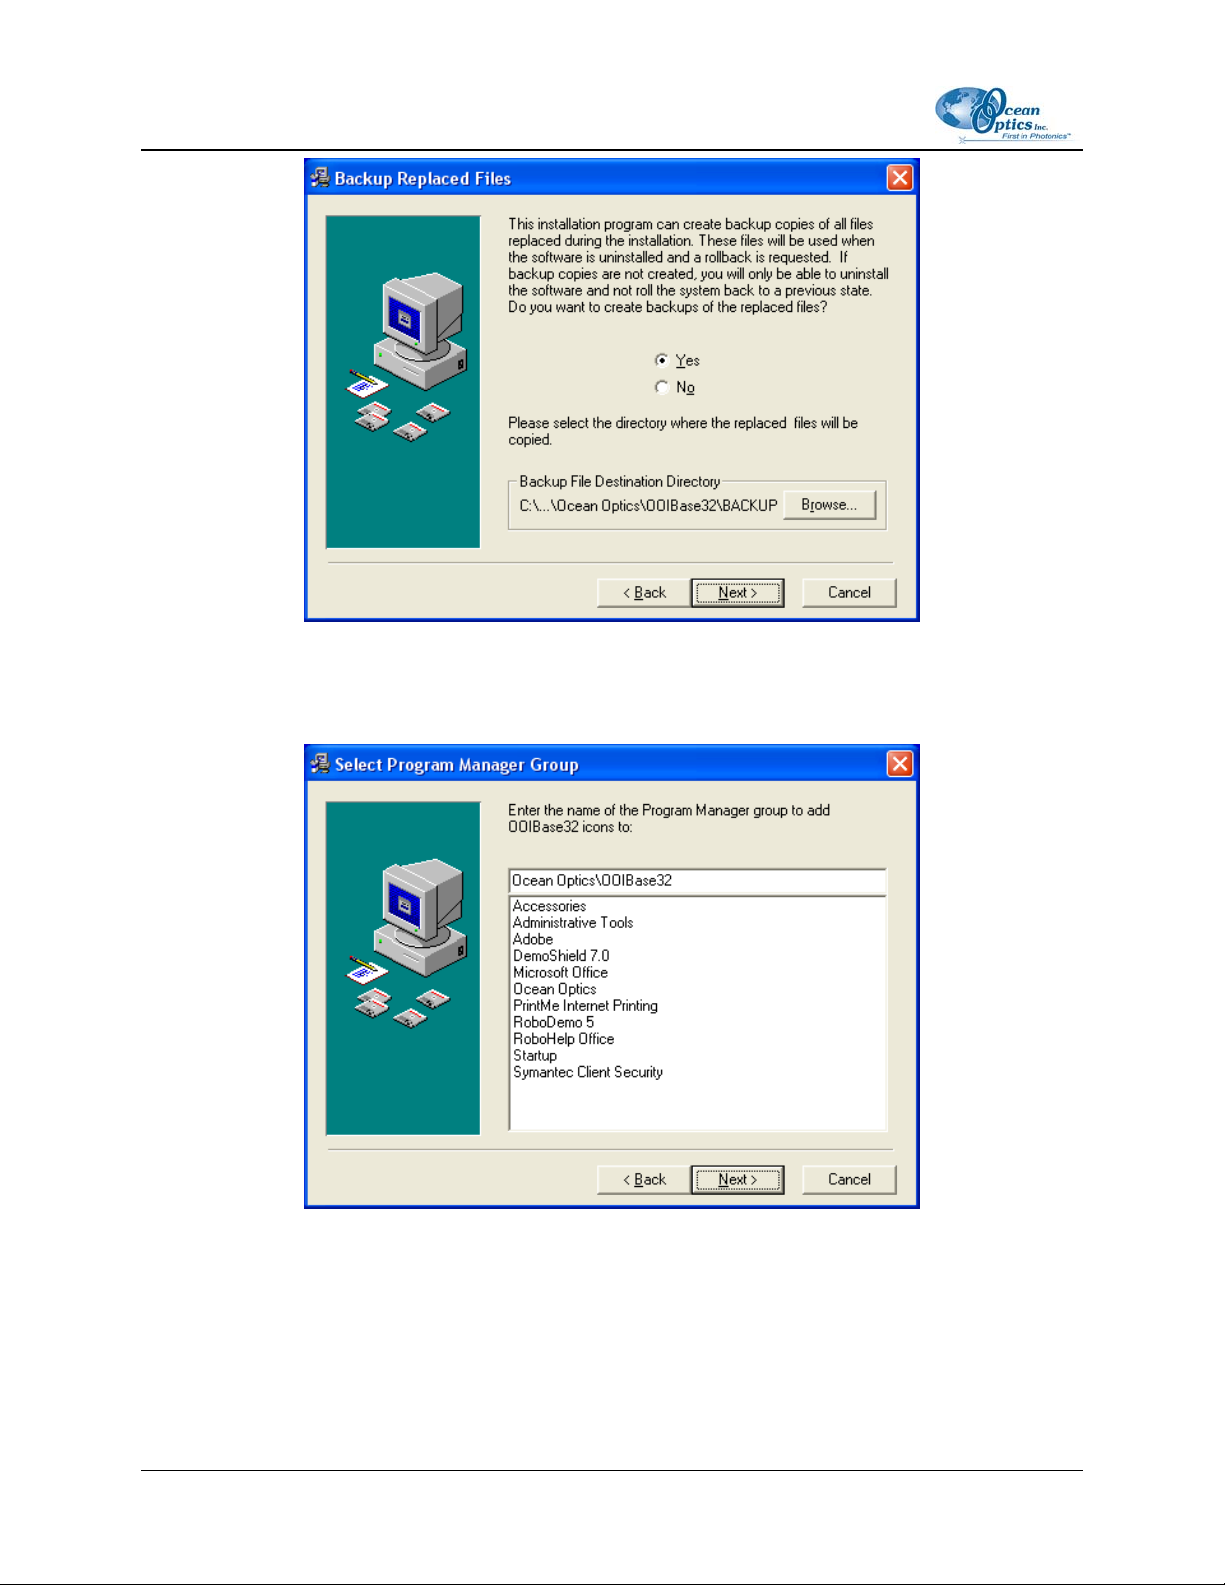
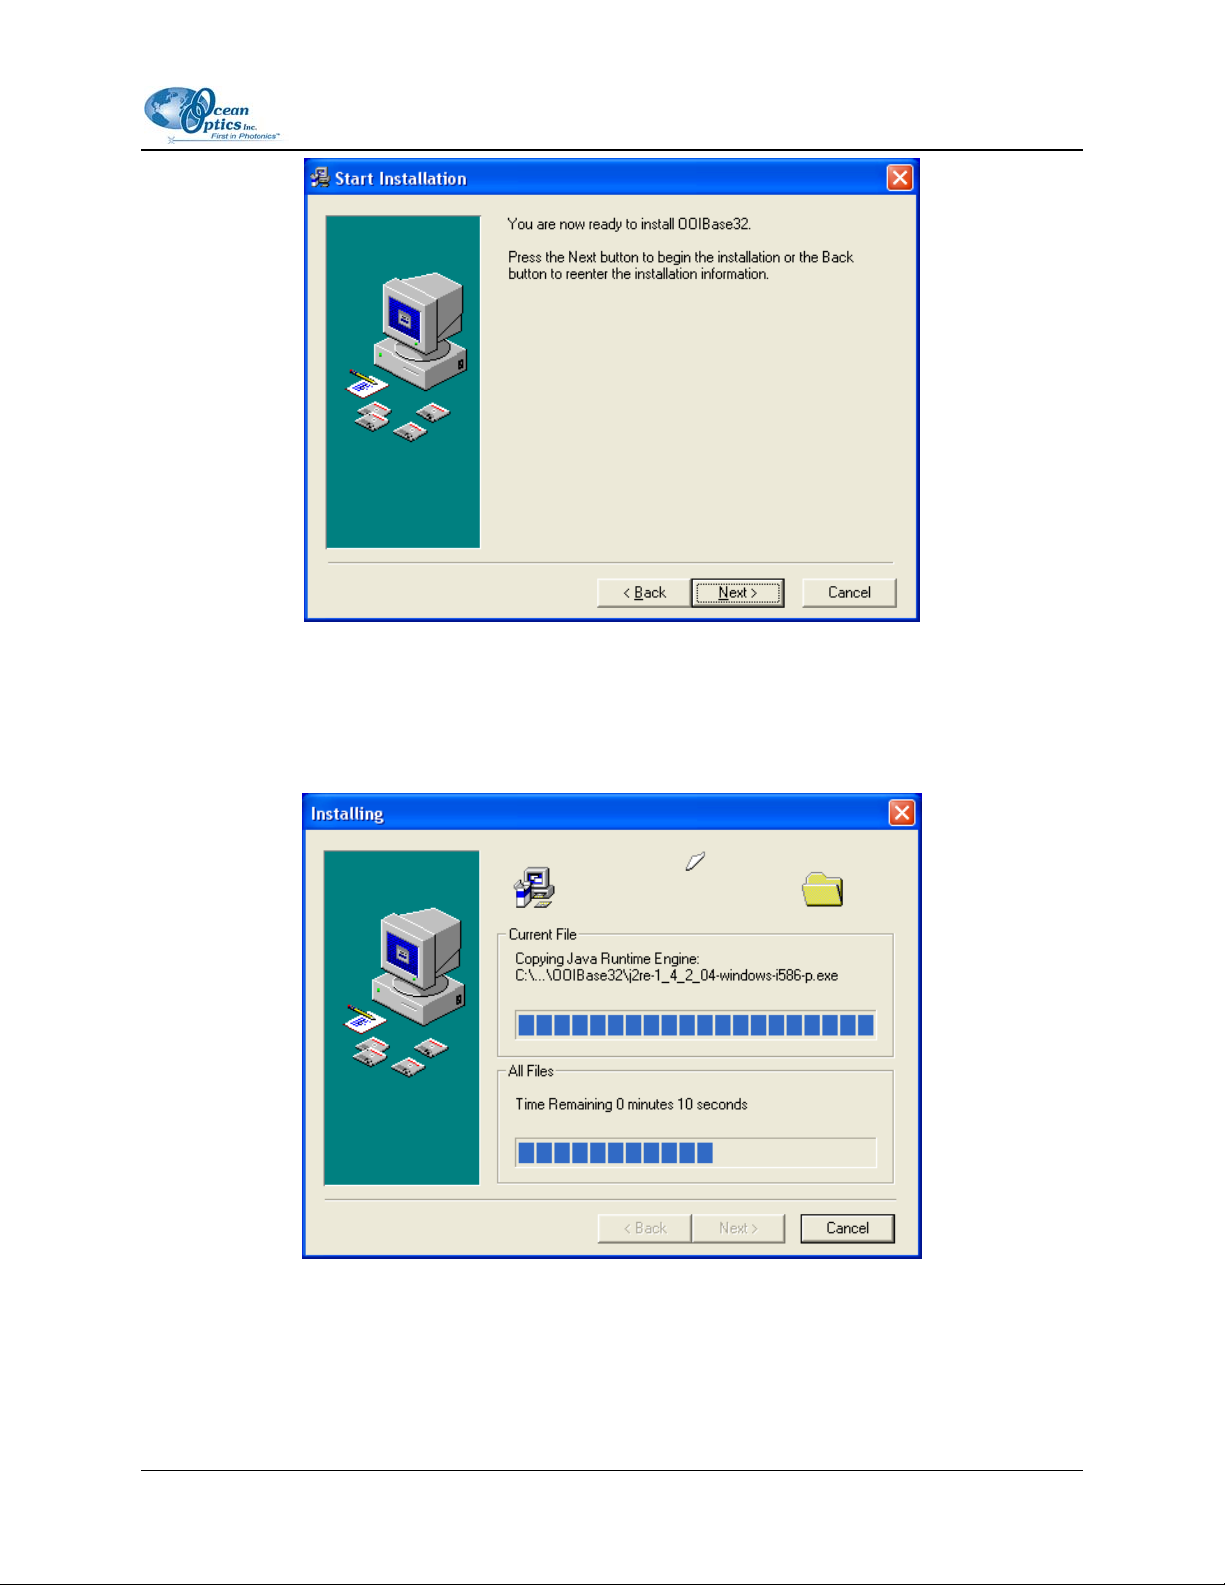
7. Select a program manager group, and then click the Next button. The Start Installation screen
appears.
6 000-20000-020-02-0505
Page 17
2: Configuring OOIBase32
8. Click the Next button to begin installation. The OOIBase32 Platinum password screen appears.
9. Enter your OOIBase32 Platinum password here, if necessary. Otherwise, click the OK button to
start the install of the free version of OOIBase32.
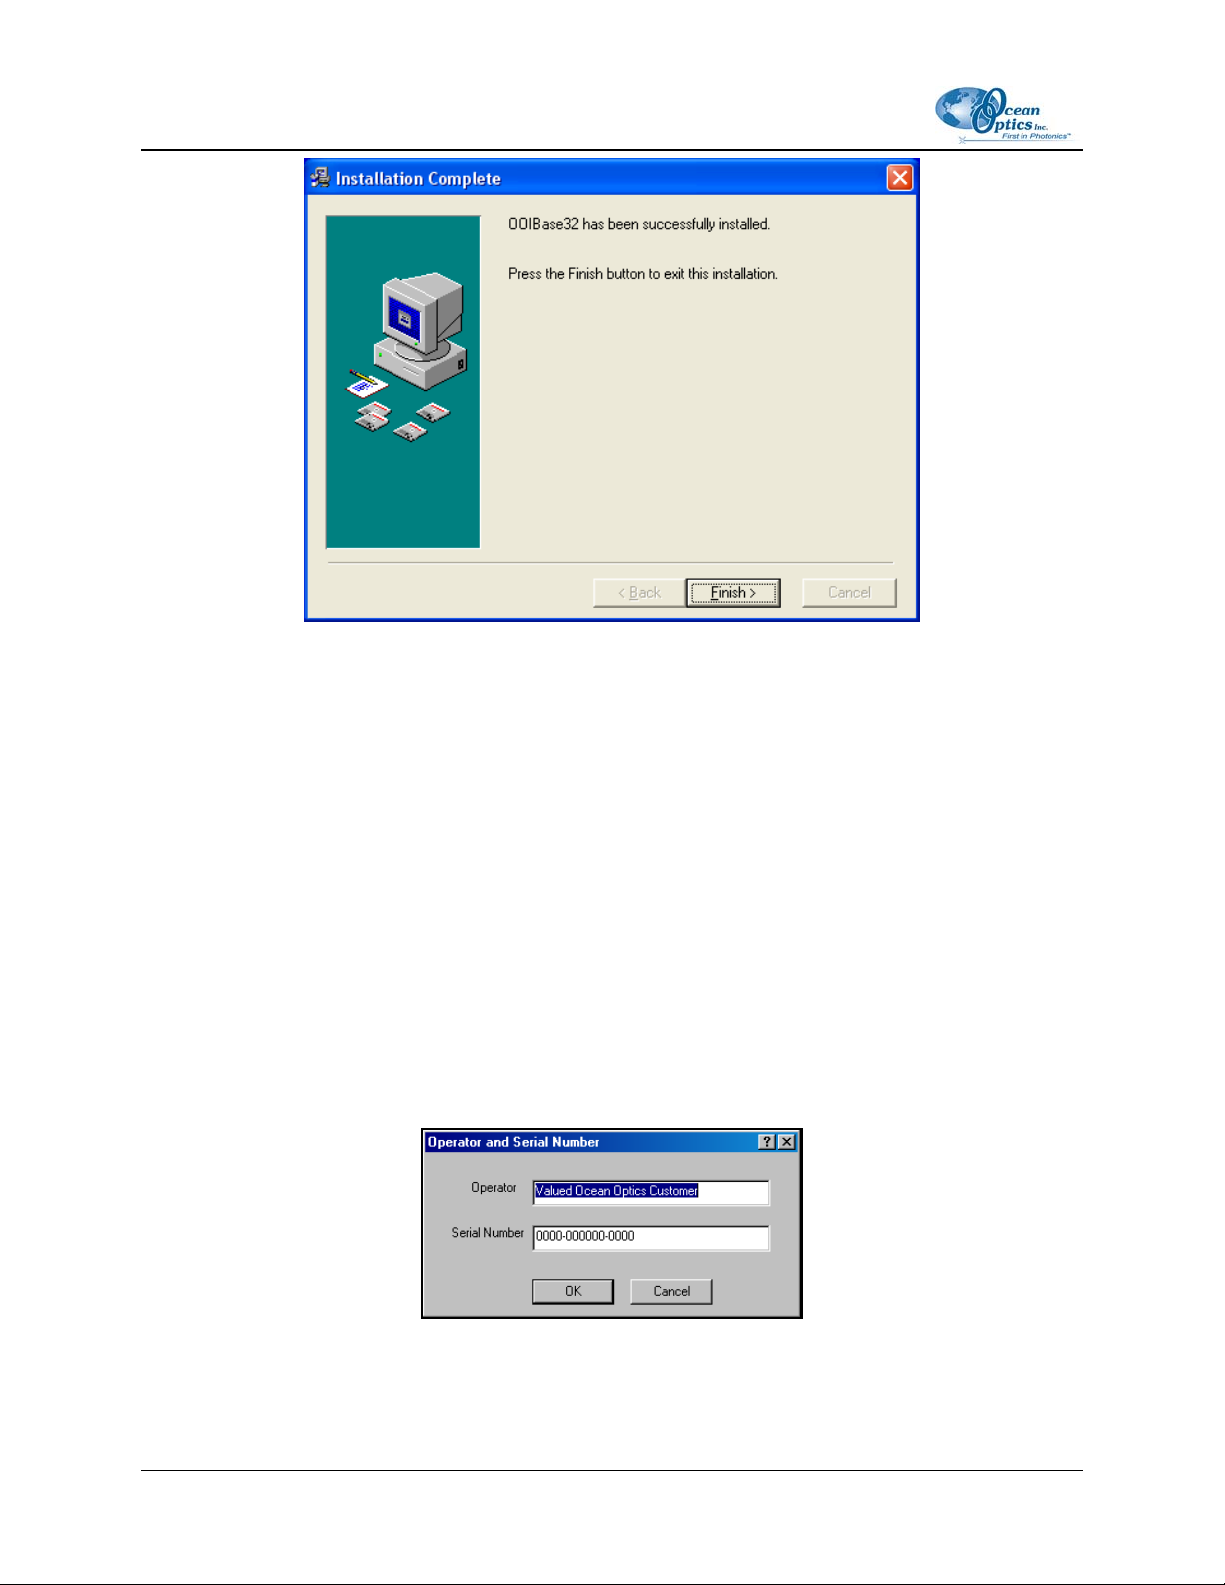
10. Click the Finish button when the installation completes.
000-20000-020-02-0505 7
Page 18
2: Configuring OOIBase32
11. Click the OK button to restart your computer.
You have now installed the OOIBase32 software.
Configuring OOIBase32 and your Hardware
Once your system restarts, you can begin to configure OOIBase32. Configuration of OOBase32 is a
multi-part process. In the following pages, each section details the various configuration processes.
Follow the steps below to configure OOIBase32 and your hardware:
To start the configuration process, double-click the OOIBase32 icon or launch OOIBase32 from the Start
menu.
Operator and Serial Number
8 000-20000-020-02-0505
Page 19
2: Configuring OOIBase32
This dialog box prompts your to enter a user name and serial number, which OOIBase32 places in the
header of certain data files. You can change this information later by selecting Edit | Settings from the
menu, and then selecting the Registration tab.
Since OOIBase32 is free software, it requires no serial number for installation. You can leave the field as
is.
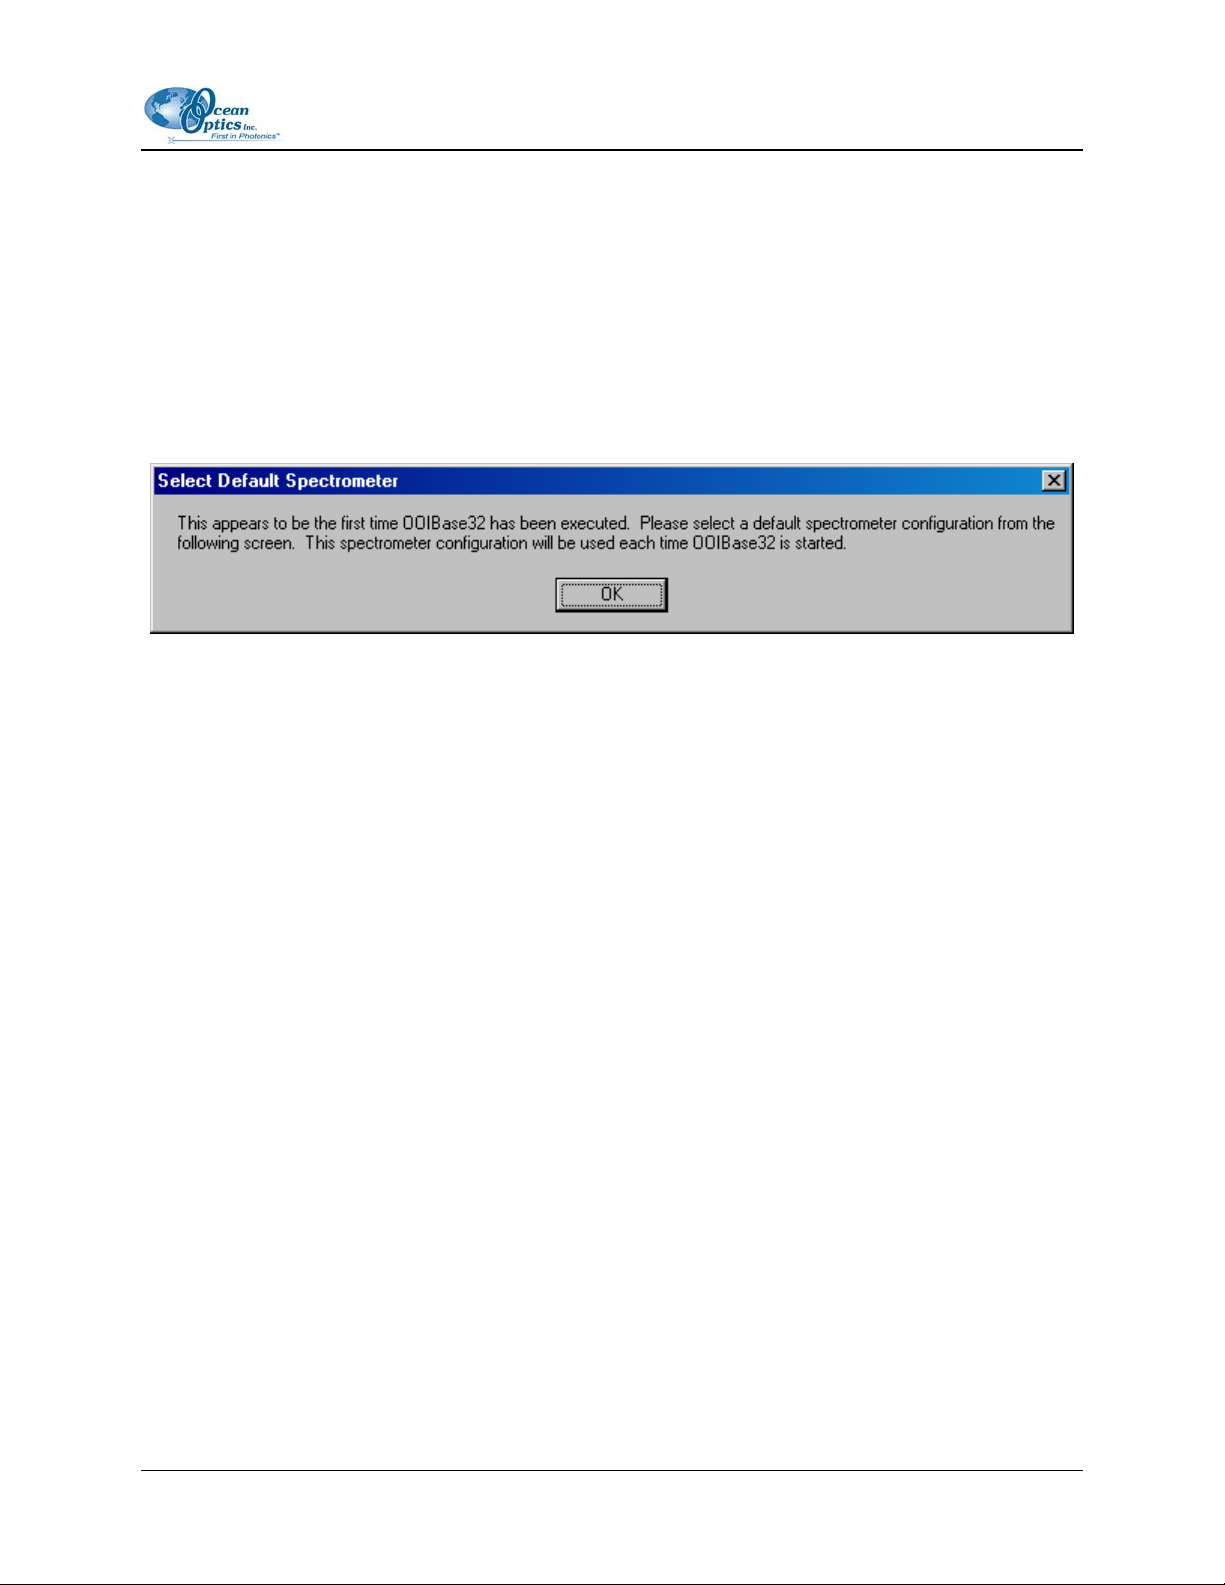
Default Spectrometer Configuration File
The following message box appears:
Click the OK button. A dialog box opens, prompting you to identify a default spectrometer configuration
file.
►
Procedure
1. Navigate to the OOIBase32 installation directory.
2. Choose the file with the .SPEC extension. The serial number of your spectrometer precedes
this file (for example, A1B234.spec).
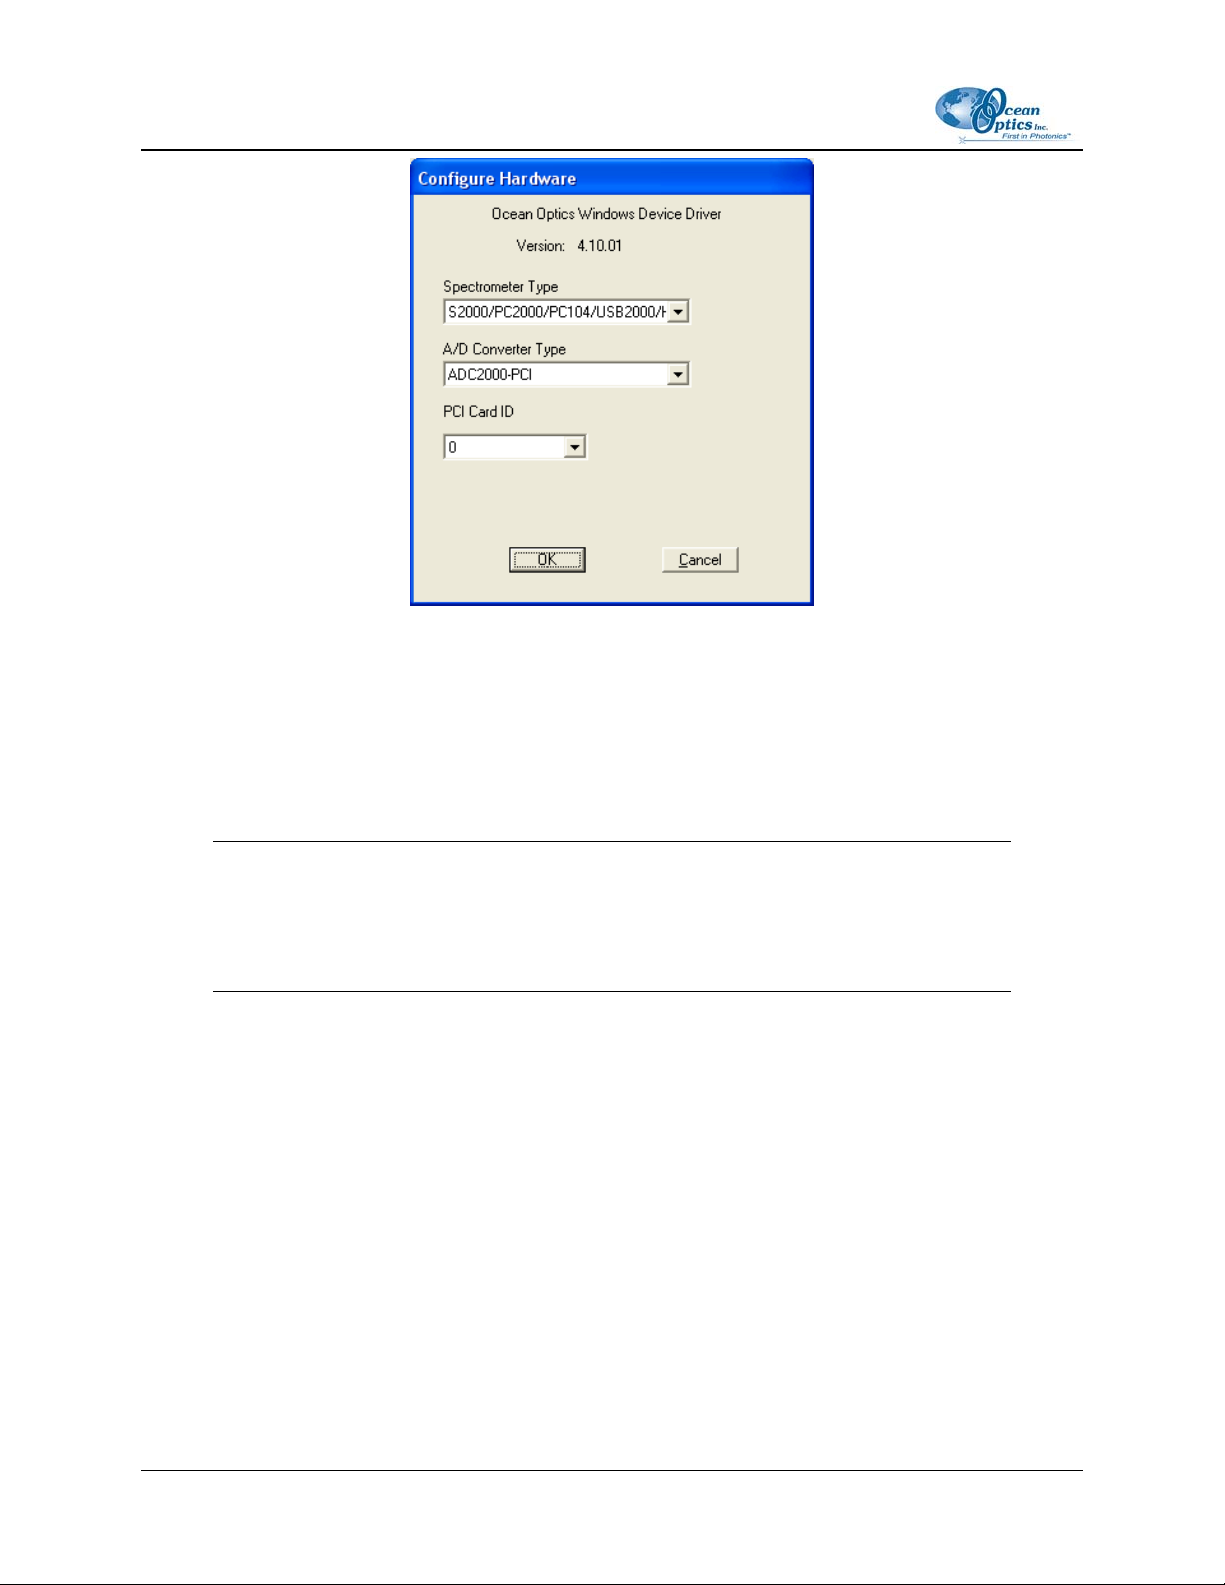
Configure Hardware
The Configure Hardware screen normally appears automatically for an initial OOIBase32 software
installation. If it does not, select Spectrometer | Open Configuration from the menu. Use this screen to
select the type of spectrometer, A/D converter, and PCI card being used in your system.
000-20000-020-02-0505 9
Page 20
2: Configuring OOIBase32
Procedure
►
1. Select your spectrometer type from the Spectrometer Type drop-down menu.
2. Select the appropriate A/D converter for your spectrometer from the A/D Converter Type dropdown menu.
Note
When using a non-USB A/D converter, you will need to set additional parameters on this
screen to properly configure your A/D converter. Consult the documentation for your
A/D converter hardware for specific instructions.
3. Configure the appropriate information based on your spectrometer and A/D converter type
(options that appear after you make the A/D Converter Type selection) and click the OK button.
OOIBase32 stores your configuration information, and the OOIBase32 software will run. You
will not need to re-enter this information the next time you start OOIBase32.
Spectrometer Configuration
You now need to configure your sampling system in OOIBase32. Perform the steps below to configure
OOIBase32 and your sampling system.
10 000-20000-020-02-0505
Page 21
2: Configuring OOIBase32
► Procedure
1. Select Spectrometer | Configure from the OOIBase32 menu. The Spectrometer
Configuration screen appears.
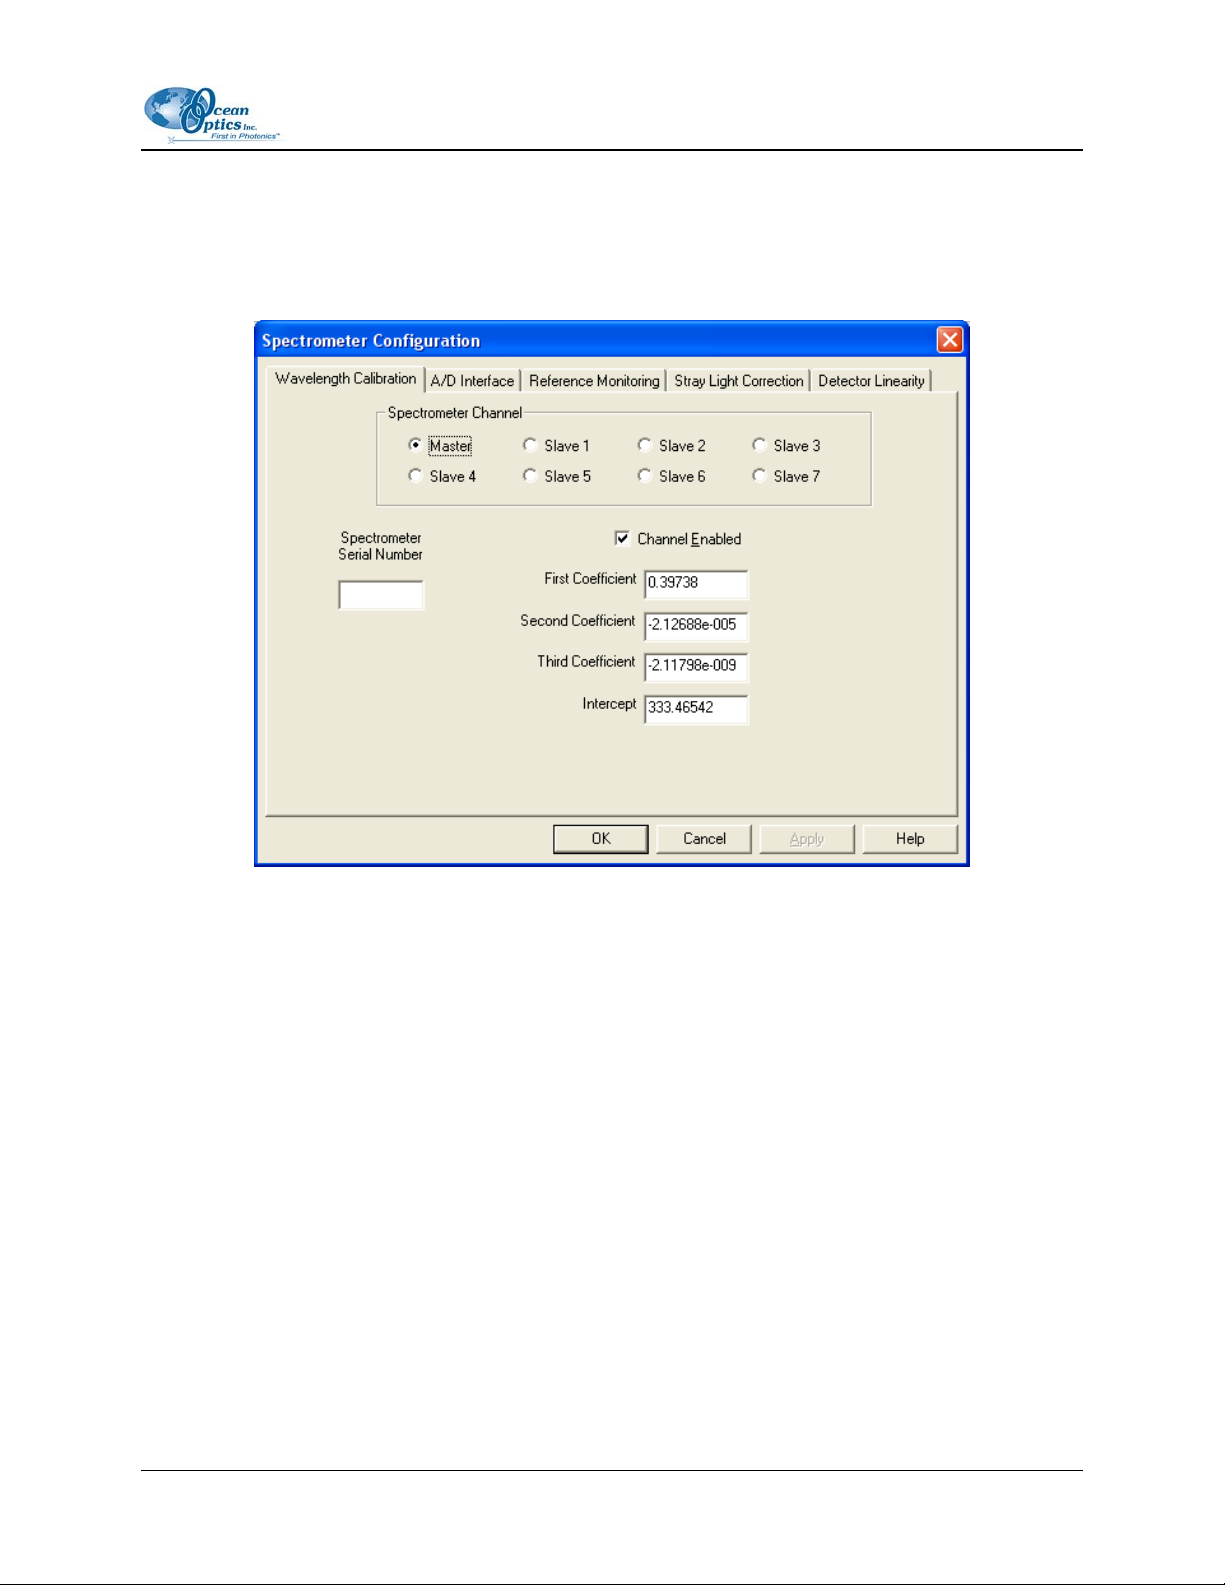
2. The Wavelength Calibration tab is selected. OOIBase32 should automatically load the
coefficients for each spectrometer channel in your system from the .SPEC file you specified.
If OOIBase32 did not load these values, manually enter the calibration values provided on the
Wavelength Calibration Data Sheet that came with your spectrometer.
3. Highlight each installed channel by clicking the appropriate radio button, and then check the
Enabled box for each installed spectrometer channel.
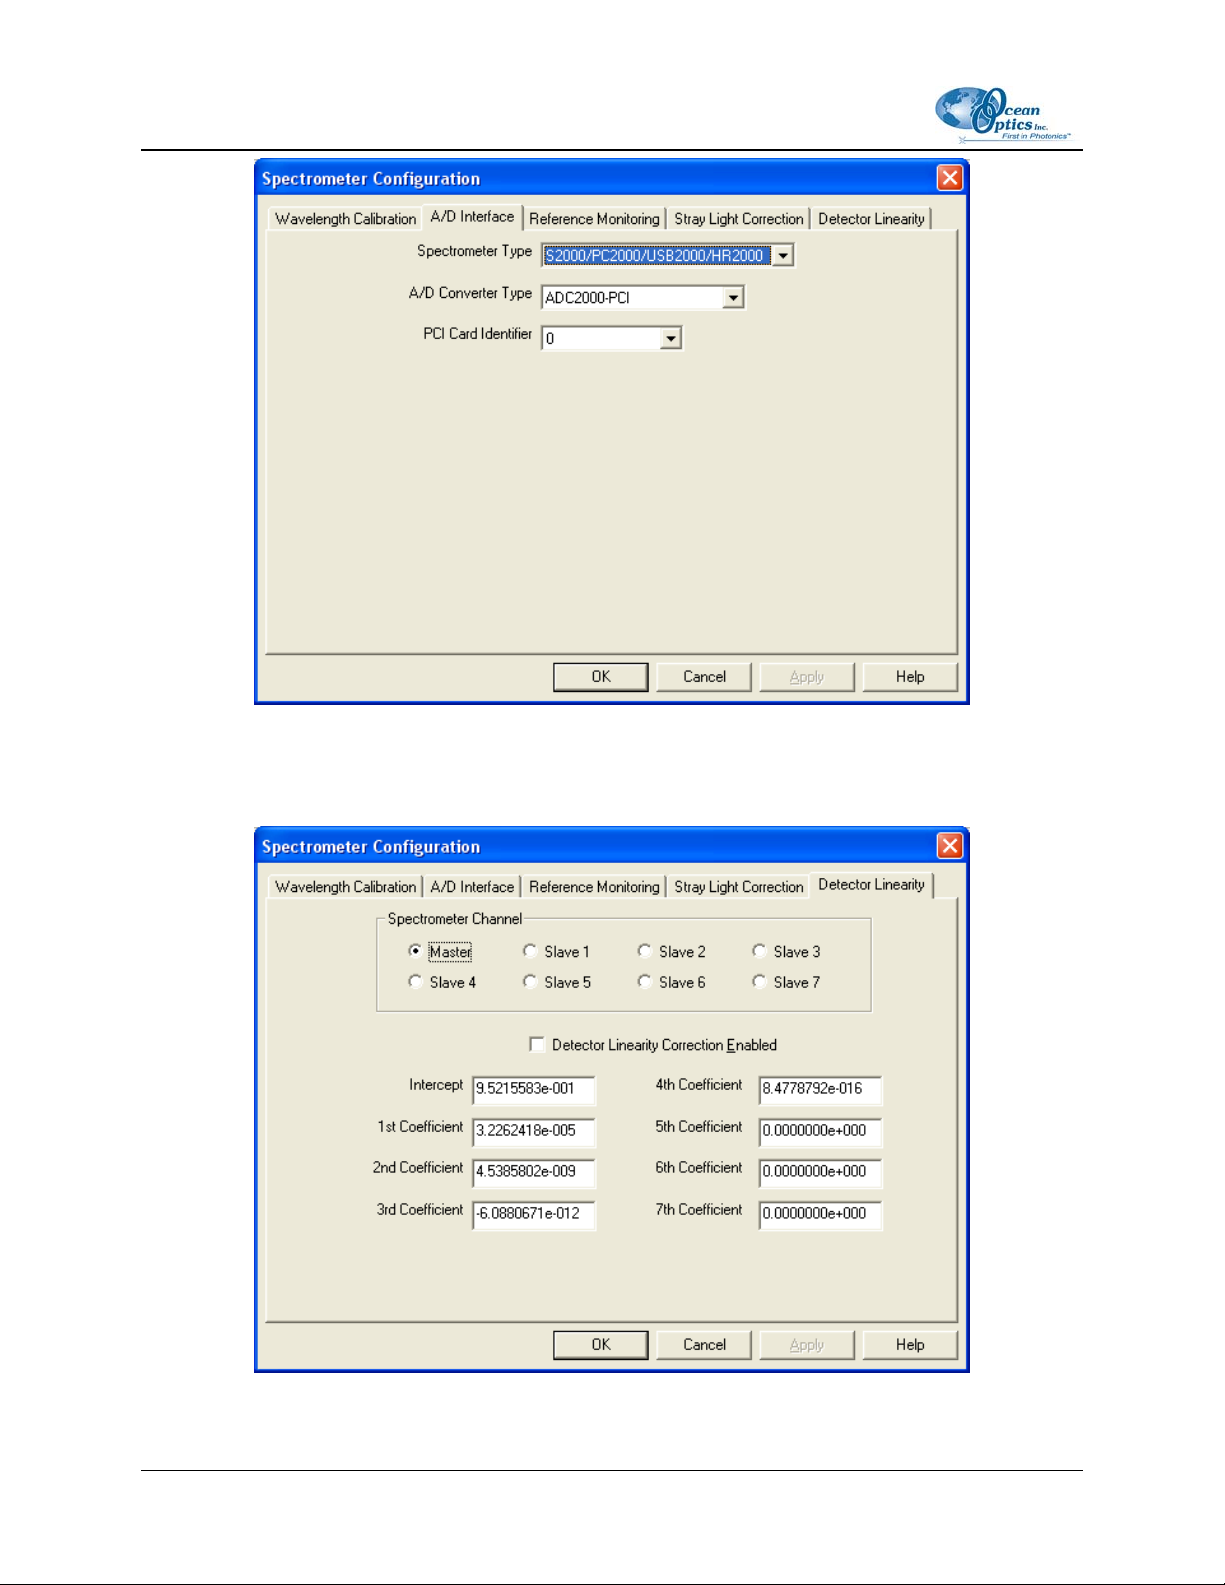
4. Select the A/D Interface tab and ensure that the values entered on this tab match the values
you entered in the Configure Hardware screen described in the previous section. Modify if
necessary.
000-20000-020-02-0505 11
Page 22
2: Configuring OOIBase32
5. Select the Detector Linearity tab and verify that OOIBase32 has loaded the intercept and
coefficients from the .SPEC file.
12 000-20000-020-02-0505
Page 23

2: Configuring OOIBase32
6. Click the OK button to save the data and close the Spectrometer Configuration screen.
Upon exiting OOIBase32, the software stores this configuration information in a spectrometer
configuration file named [your serial number].SPEC. Upon restart, OOIBase32 will load this as
the default .SPEC file. You can change the name of this file by selecting Spectrometer | Save
Configuration As from the menu and changing the name of the saved .SPEC file.
You should see a dynamic trace line displayed in the graph window of OOIBase32. This indicates
that you have properly configured the software and that it is acquiring data.
OOIBase32 Settings
You can now configure some important OOIBase32 operation parameters.
Procedure
►
1. Select Edit | Settings from the OOIBase menu. The OOIBase32 Settings screen appears.
2. Customize any parameters in the tabs on this screen. Available options include saving, opening,
printing, sound, and default settings. More information on this screen is available later in this
document.
3. Click the OK button to save your customized settings.
You have now customized OOIBase32. You can repeat these steps at any time to change the
customization settings.
Configure Data Acquisition
You must now configure your data acquisition parameters.
►
Procedure
1. Select Spectrum | Configure Data Acquisition from the menu. The Configure Data
Acquisition screen appears.
2. Select the Basic tab and configure the integration time, averaging, and boxcar smoothing
values.
3. Select the External Trigger tab and configure your external triggering mode and data save
option, if necessary.
4. Select the Strobe tab and configure external strobe events, if necessary.
5. Click the OK button to save these settings and exit the Configure Data Acquisition screen.
You can find more information on these options later in this document.
000-20000-020-02-0505 13
Page 24

2: Configuring OOIBase32
Configure Sampling Optics
Once you configure OOIBase32, you must configure the components in your sampling system. Due to the
variety of sampling optics available from Ocean Optics, please consult the operating instructions for your
individual optical components.
Getting Help
Comprehensive on-line assistance is available from the Help option in the menu. This help system
provides information on all buttons, options, items, and dialog boxes in OOIBase32.
If you find that you still need assistance after consulting this manual and the online help system, contact
our Technical Support department.
14 000-20000-020-02-0505
Page 25

Chapter 3
File Menu Functions
Overview
This chapter details the various options and functions available from the File menu in OOIBase32.
Where applicable, each section contains the associated toolbar icon below the section heading. Click on
these icons in OOIBase32 to perform the described function.
New Spectrum Window (Ctrl+N)
- General Functions Toolbar
Select this menu option to create a new spectrum window in the OOIBase32 graph display area. This
performs the same function as File | New.
You can also access this option via shortcut by pressing the CTRL and N keys simultaneously or by
clicking the New icon in the General Functions toolbar.
New
Select this menu option to create a new spectral window for displaying spectral data. Graphs appear in
scope mode by default. All active channels in a spectral window share the same data acquisition
parameters.
Procedure
►
To display a specific channel in a separate spectral window, follow the steps below:
1. Open a new spectral window.
2. Select Spectrometer | Configure from the menu.
3. Select the Wavelength Calibration tab.
4. Select or deselect the Channel Enabled option for the channel you wish to display.
000-20000-020-02-0505 15
Page 26

3: File Menu Functions
5. Create different parameters for the new spectral window, such as a different integration time.
Remember that one spectral window can operate with up to 8 channels and 8 overlays.
Open
Selecting the Open menu option displays a dialog box that allows you to open (under the Files of Type
drop-down option) Processed Spectra, Grams/32 SPC Files, or All Files. To open specific file types,
select File | Open from the menu, and then choose dark, sample dark, reference, sample, processed, or
experiment data files.
When you open a data file and the acquisition parameters of the file do not match the file currently open,
a warning box allows you to change the acquisition parameters, ignore the disparity between the
parameters, or cancel the opening of the data file.
Dark
A dark spectrum is a spectrum taken with the light path blocked.
Select File | Open | Dark to select and open one or more dark spectra.
Sample Dark
A sample dark spectrum is a spectrum taken in time normalized mode with the integration time set to that
of the sample spectrum.
Select File | Open | Sample Dark to select and open one or more sample dark spectra.
Reference
A reference spectrum is a spectrum taken with the light source on and a blank in the sampling region.
Select File | Open | Reference to select and open one or more reference spectra.
Sample
A sample spectrum is a spectrum taken while in scope mode with the sample in the sampling region.
Select File | Open | Sample to select and open one or more sample spectra.
16 000-20000-020-02-0505
Page 27

3: File Menu Functions
Processed
- General Functions Toolbar
Processed spectra are spectra taken while in scope, absorbance, transmission, or relative irradiance mode.
You can take these spectra after taking dark and reference spectra. When selecting a processed spectrum,
the active spectral window goes into snapshot mode and data acquisition stops. To resume acquisition,
select the snapshot icon from the Spectrum Controls toolbar.
Select File | Open | Processed to select and open one or more processed spectra.
Experiment
Opening an experiment loads the stored dark, reference, sample, and processed spectra, along with all
overlays and acquisition parameters in the experiment
Select File | Open | Experiment to select and open a complete set of acquisition and processing
parameters for the active spectral window.
Close
Select File | Close to immediately close the active spectral window. OOIBase32 does not prompt you to
save acquisition parameters or the spectra.
Save
This menu option allows you to save different types of data in a variety of file types (including Processed
Spectra, Grams/32 SPC Files, or All Files - available under the Files of Type option in the Save dialog
box).
To save specific file types, select File | Save from the menu. OOIBase32 saves all active channels in the
spectral window.
Note
You can name saved spectra automatically by enabling the Autoincrement Filenames
function. If you do not enable the Autoincrement Filenames function, a save file dialog
box will open every time you instruct OOIBase32 to save data.
000-20000-020-02-0505 17
Page 28

3: File Menu Functions
The following sections detail the types of data you can save:
Dark
A dark spectrum is a spectrum taken with the light path blocked.
Select File | Save | Dark from the menu to save a dark spectrum.
Sample Dark
A sample dark spectrum is a spectrum made in time normalized mode with the integration time set to that
of the sample spectrum.
Select File | Save | Sample Dark from the menu to save a sample dark spectrum.
Reference
A reference spectrum is a spectrum taken with the light source on and a blank in the sampling region.
Select File | Save | Reference to select and open one or more reference spectra.
Sample
A sample spectrum is a spectrum taken while in scope mode with the sample in the sampling region.
Select File | Save | Sample to select and open one or more sample spectra.
Processed
- General Functions Toolbar
Processed spectra are spectra taken while in scope, absorbance, transmission, or relative irradiance mode.
You can take these spectra after taking dark and reference spectra.
Select File | Save | Processed to select and open one or more processed spectra.
Experiment
Saving an experiment saves the stored dark, reference, sample, and processed spectra, along with all
overlays and acquisition parameters in the experiment
Select File | Save | Experiment to save the complete set of acquisition and processing parameters for the
active spectral window.
18 000-20000-020-02-0505
Page 29

3: File Menu Functions
Autoincrement Filenames
The Autoincrement Filenames option allows you to name and save spectra automatically when you click
the Save command in OOIBase32. Select File | Autoincrement Filenames | Enabled to enable this
feature.
When you enable this feature, choosing any save command automatically saves all spectra in the spectral
window and names the file with a base name and numerical index you specify.
The following table illustrates a sample file name structure:
Test The base name that you specified.
00012
Master
Irradiance
A sequential numerical index beginning from a user-specified number.
The spectrometer channel name, which OOIBase32 automatically adds to the
filename.
The file extension, which OOIBase32 automatically adds to the filename. In this
instance, it indicates that OOIBase32 saved the data while in relative irradiance
mode.
In this example, the specified values result in an autoincremented filename of Test.00012.Master.Irradiance.
Note
If you do not enable the Autoincrement Filenames function, a save file dialog box will
open every time you choose a save command.
Enabled
Select File | Autoincrement Filenames | Enabled to enable (or disable, if already checked) the
autoincrement filenames function.
Show Name
Select File | Autoincrement Filenames | Show Name to enable the Show Name option. When you
enable both this option and the Autoincrement Filenames option, the filename of the next saved file will
display in the title bar of OOIBase32.
000-20000-020-02-0505 19
Page 30

3: File Menu Functions
Configure
The File | Autoincrement Filenames | Configure option displays a dialog with the following
parameters:
Base Name
Select File | Autoincrement Filenames | Base Name to open the Autoincrement Filename Properties
dialog box. This screen allows you to set the base name for autoincremented files.
Starting Index
Select File | Autoincrement Filenames | Starting Index to open the Autoincrement Filename
Properties dialog box. This screen allows you to set the starting index for autoincremented files. For
example, if you enter “1” here, the number in the saved filename will appear as 00001. The next saved
file will have 00002 in the filename, etc.
- General Functions Toolbar
You can choose to print graphs in color or black and white by configuring the printing page of the
OOIBase32 Settings dialog box. By default, OOIBase32 disables background images during printing.
Select File | Print from the menu to print a graph. Alternately, you can click the Print icon in the General
Functions toolbar (see
General Functions for more information).
Print Preview
Select File | Print Preview from the menu to preview the graphical spectra before printing.
Print Setup
Select File | Print Setup from the menu to select and configure a printer for printing graphical spectra.
Exit
Select File | Exit from the menu to exit OOIBase32. The software does not prompt you for an exit
confirmation.
Alternately, you can click the top right
20 000-20000-020-02-0505
X box of the application’s display window.
Page 31

Chapter 4
Edit Menu Functions
Overview
This section details the various options and functions available from the Edit menu in OOIBase32.
Where applicable, toolbar icons associated with the function appear below the section heading. Click on
these icons in OOIBase32 to perform the described function.
Copy Spectral Data
Copied spectral data is in tab-delimited format and includes wavelength and intensity information as well
as an optional header to allow for easy identification of the spectrometer channel or overlay. You can
copy and paste spectral data directly into applications such as Microsoft Excel.
All Spectrometer Channels
Select Edit | Copy Spectral Data | All Spectrometer Channels to copy spectral data to the clipboard for
all active spectrometer channels and overlays in a spectral window.
Selected Spectrometer Channels
Select Edit | Copy Spectral Data | Selected Spectrometer Channels to copy spectral data for specific
channels or overlays in a spectral window. Check the channels and overlays you want copied to the
clipboard in the Select Spectrometer Channels to Copy dialog box.
Copy Graphical Spectra (Ctrl+C)
- General Functions Toolbar
You can paste graphical spectra data (the data as graphed) into any application that accepts a Windows
metafile (Microsoft Word and Excel, for example).
000-20000-020-02-0505 21
Page 32

4: Edit Menu Functions
Click on the Copy Spectra icon or select Edit | Copy Graphical Spectra to copy graphical spectra to the
Windows clipboard.
Settings
The Settings option brings up the OOIBase32 Settings screen, which allows you to configure many
aspects of the operation of OOIBase32.
Select Edit | Settings to access this screen. After making changes, click the Apply button to save the
changes and then the OK button to close the OOIBase32 Settings screen. Click the Cancel button to exit
without saving changes.
22 000-20000-020-02-0505
Page 33

4: Edit Menu Functions
File Saving
This tab provides options for saving files.
Available options include the following:
Option Function
Always Save Dark Spectra
Always Save Reference
Spectra
Always Save Sample
Spectra
Always Save Experiment
File
Always Warn if
Overwriting File
Always Save Data in
Exponential Format
Default File Format
Always saves a dark spectrum each time you save a processed spectrum.
Automatically saves a reference spectrum each time you save a processed
spectrum.
Automatically save a sample spectrum each time you save a processed
spectrum.
Saves the experiment configuration file each time you save a processed
spectrum.
Sends you a warning when OOIBase32 attempts to overwrite a data file.
Lists spectral data (not graphical data) in an exponential format
(OOIBase32 uses an ‘e’ as the exponential separator).
Select one of the following options to specify how OOIBase32 saves
spectral data:
• No Header - An ASCII file, tab delimited, without a header
• Standard - An ASCII file, tab delimited, with a header
(recommended)
• Grams/32 – A GRAMS/32
®
-compatible SPC file
000-20000-020-02-0505 23
Page 34

4: Edit Menu Functions
Option Function
Saved Precision
Save Data Files For
Select a value from 0 to 10 decimal places to specify the precision of the
spectral data.
Select how to save data: All active spectrometer channels, or selected
spectrometer channels only.
If you choose to save for selected channels, a dialog box prompts you to
specify the channels each time you save spectral data.
File Opening
This tab provides options for opening data files.
Available options include the following:
Option Function
Insure that Acquisition
Parameters Match
Warn if File Without a
Header is Opened
Check for File Conformity
Wavelength Tolerance
(nm)
24 000-20000-020-02-0505
Presents a warning box when you attempt to open a file that has different
acquisition parameters than the file currently in use.
Presents a warning box when you attempt to open a data file without a
header.
Presents a warning box if any parameter mismatches exist between the file
you are attempting to open and the file currently open.
Specify the tolerance (in nanometers) of the difference in wavelengths
between the files you open and the spectrometer configuration currently in
use. Use this option only if you enabled the Insure that Acquisition
Parameters Match and Check for File Conformity boxes.
Page 35

4: Edit Menu Functions
Printing
This tab specifies whether the graph window prints in black and white or color.
Select the Printing in Black and White only box to restrict color printing.
Sounds
This tab allows you to specify sound files that trigger upon various program and spectroscopic events.
Check the Enable Sounds box to enable sound events in OOIBase32. You must already have one or
more .WAV files to use this option. OOIBase32 does not come with any .WAV files.
000-20000-020-02-0505 25
Page 36

4: Edit Menu Functions
Available options include the following:
Option Function
Enable Sounds
Filename
Select
Preview
Enables sound events in OOIBase32
This text box displays the name and directory of the selected .WAV file.
This button next to each option brings up a file navigation dialog box,
enabling you to select a .WAV file for each option.
This button next to each option allows you to listen to the selected .WAV
file before applying the changes to the Sounds tab.
You can specify sounds for the following events:
• Save Dark
• Save Reference
• Save Sample
• Save Experiment
• Store Dark
• Store Reference
• Scope Mode Saturated – Alerts you when the scope mode signal becomes saturated while you are
in other modes
• Warning
• Error
Click the Apply button to save changes made in this tab.
Configuration Files
This tab allows you to configure default setting files in OOIBase32.
26 000-20000-020-02-0505
Page 37

4: Edit Menu Functions
Available options include the following:
Option Function
Default Display Settings
File
Default Spectrometer
Settings File
Default Time Acquisition
Settings File
Contains settings such as trace color, trace width, graph scale, etc.
Specify the path to and the name of the .display file you want to load
when OOIBase32 starts or a new spectral window opens. Alternately,
click on the ellipsis button to navigate to the .display file you want.
Check the Automatically Save Display Settings File on Exit box to
automatically save any display changes to your default display settings
file when OOIBase32 exits or a closes a spectral window. If you want to
save new display settings but do not want to enable this option, select
View | Display Property Files | Save Display Settings from the menu.
Contains settings such as the A/D interface, wavelength calibration, etc.
Specify the path to and the name of the .spec file you want to load when
OOIBase32 starts or a new spectral window opens. Alternately, click on
the ellipsis button to navigate to the .spec file you want.
Contains all of the time acquisition parameters. Specify the path to and
the name of the .TimeParameters file you want to load when OOIBase32
starts or a new spectral window opens. Alternately, click on the ellipsis
button to navigate to the .TimeParameters file you want.
Check the Automatically Save Time Acquisition Settings File on Exit
box to automatically save any time acquisition settings changes to your
default time acquisition settings file when OOIBase32 exits or closes a
spectral window. If you want to save time acquisition settings but do not
wish to enable this option, select Time Acquisition | Configure | Save
Parameters from the menu.
000-20000-020-02-0505 27
Page 38

4: Edit Menu Functions
Registration
This tab allows you to enter an Operator name and the software Serial Number. OOIBase32 includes
these entries in the header of certain data files.
When you run OOIBase32 for the first time, you must specify this information. This tab allows you to
change the information you specified during setup.
Misc. Settings
This tab allows you to configure a variety of options.
28 000-20000-020-02-0505
Page 39

4: Edit Menu Functions
Available options include the following:
Option Function
Warn Before Overlay
Spectrum is Cleared
Show Overlay Annotations
Scope Mode Saturated
Warning
Scope Mode Saturation
Threshold
When Storing Reference
and Dark
When Copying Spectral
Data
Enable this setting to receive a warning prompt before clearing an
overlay spectrum.
Displays any annotations saved with the overlay spectrum file on the
graph window of OOIBase32.
Specifies the warning method used when the scope mode signal
saturates the detector. This warning appears when you are in other
modes, such as the absorbance mode.
To choose a warning sound for scope mode saturation, see the Sounds
tab information.
Specifies a scope mode intensity threshold value from 0 to 4095 (0–
65535 for the NIR Spectrometer). This option is only functional if you
selected a Scope Mode Saturated Warning method.
The value you enter is the intensity at which the saturation warning will
appear.
Specifies whether OOIBase32 stores dark and reference spectra for all
enabled spectrometer channels or for selected channels only.
Includes a header in your spectral data files.
When Using Copy Toolbar
Button Function
Specifies the function of the copy icon on the
Options include the following:
General Functions toolbar.
• Copy Graphical Spectra – The data as graphed
• Copy Spectral Data for All Channels – Copies the spectral
data for all channels in the spectrometer system (storing the
data as numerical values)
• Copy Spectral Data for Selected Channels – Copies the
spectral data for selected channels in the spectrometer system
(storing the data as numerical values). When you enable this
option, OOIBase32 will prompt you to specify the channels from
which to save data.
The default function of the copy icon is Copy Graphical Spectra.
000-20000-020-02-0505 29
Page 40

4: Edit Menu Functions
Option Function
Percent Transmission Mode
Label
Select the axis label to reflect the type of Transmission mode
measurement you wish to take. OOIBase32 displays the label you select
on the vertical axis of the graphed spectrum. OOIBase32 can make both
transmission and reflection measurements while in the transmission
mode, as the mathematics required to calculate transmission and
reflection measurements are identical.
Select Percent Transmission or Percent Reflection as your vertical
axis label when you are in the transmission mode. OOIBase32 displays
the label you select on the vertical axis of the graphed spectrum when
you are in Transmission mode.
30 000-20000-020-02-0505
Page 41

Chapter 5
View Menu Functions
Overview
This chapter details the various options and functions available from the View menu in OOIBase32.
Where applicable, toolbar icons associated with the function appear below the section heading. Click on
these icons in OOIBase32 to perform the described function.
Display Properties
Select View | Display Properties to bring up the Display Properties screen. This screen allows you to
specify how OOIBase32 displays spectra.
The following sections detail the various tabs on the Display Properties screen.
000-20000-020-02-0505 31
Page 42

5: View Menu Functions
Active Line Type
These settings allow you to set the design of the line connecting the data points in an active spectrum.
The Line Style sets the style, the Line Width sets the pixel width, and the Line Color sets the color of
the line.
Click on each drop-down menu or color box to set these options:
Option Function
Line Style
Line Width
Line Color
Sets the style.
Sets the pixel width.
Sets the color of the line.
Active Point Type
These settings allow you to configure the points representing each pixel in an active spectrum.
32 000-20000-020-02-0505
Page 43

5: View Menu Functions
Click on each drop-down menu or color box to set these options:
Option Function
Point Style
Point Size
Fill Pattern
Fill Color
Sets the style (circle, square, triangle, etc.).
Sets the size (in relative units).
Sets the pattern (solid, crosshatch, etc.).
Sets the color of the points.
Overlay Line Type
These settings allow you to set the design of the line connecting the points in an overlay spectrum.
The Line Style sets the style, the Line Width sets the pixel width, and the Line Color sets the color of
the line.
000-20000-020-02-0505 33
Page 44

5: View Menu Functions
Click on each drop-down menu or color box to set these options:
Option Function
Line Style
Line Width
Line Color
Sets the style.
Sets the pixel width.
Sets the color of the line.
Overlay Point Type
These settings allow you to configure the points representing each pixel in an overlay spectrum.
34 000-20000-020-02-0505
Page 45

5: View Menu Functions
Click on each drop-down menu or color box to set these options:
Option Function
Point Style
Point Size
Fill Pattern
Fill Color
Sets the style (circle, square, triangle, etc.).
Sets the size (in relative units).
Sets the pattern (solid, crosshatch, etc.).
Sets the color of the points.
Display Property Files
These options allow you to store and retrieve display settings for use in OOIBase32.
Save Display Settings
This option saves the currently selected display settings to the disk. By default, these files have a .display
extension. After saving the file, you can designate it as the default display settings file, which OOIBase32
loads when starting or opening a new spectral window.
Select View | Display Property Files | Save Display Settings to save the display settings.
000-20000-020-02-0505 35
Page 46

5: View Menu Functions
Restore Display Settings
This option retrieves the previously saved display settings from the disk.
Select View | Display Property Files | Restore Display Settings to load the saved display settings.
Spectrum Scale
These options allow you to adjust the scale of the data displayed in the graph window in OOIBase32.
36 000-20000-020-02-0505
Page 47

5: View Menu Functions
Autoscale
- Graph Scale Toolbar
This option adjusts the scale of the spectrum displayed in the current spectral window so that it fills the
display vertically.
Click on the Autoscale icon or select View | Spectrum Scale | Autoscale.
000-20000-020-02-0505 37
Page 48

5: View Menu Functions
Set Scale
- Graph Scale Toolbar
This option allows you to specify the minimum and maximum limits of both the wavelength and
amplitude axes.
Click on the Set Scale icon or select View | Spectrum Scale | Set Scale.
Unscale
- Graph Scale Toolbar
This option resets the spectrum scale after you have chosen Autoscale or Set Scale.
Click on the Unscale icon or select View | Spectrum Scale | Unscale from the menu.
Background Image
These options allow you to configure the appearance of a background image in the graph window of
OOIBase32.
Visible
This option enables or disables the display of a bitmap file in the background of the spectral window in
OOIBase32.
Select View | Background | Visible.
38 000-20000-020-02-0505
Page 49

5: View Menu Functions
Select Bitmap
This option allows you to choose a background picture to display as a background image in the graph
window of OOIBase32.
Select View | Background Image | Select Bitmap and navigate to the Windows bitmap (bmp) file you
wish to use as a background picture in the spectral window.
Set Graph Background Color
This option allows you to choose a background color for the spectral window.
Select View | Set Graph Background Color.
000-20000-020-02-0505 39
Page 50

5: View Menu Functions
Set Axis Text Properties
This option allows you to choose a color for text in the spectral window.
Select View | Set Axis Text Properties from the menu. The Configure Axis Text dialog box appears.
Specify the Font, Size, and Text Color for the axis text via the drop-down menus and color box on the
Configure Axis Text dialog box.
Set Graph Title
This option allows you to configure the text and appearance of a graph title in OOIBase32.
Select View | Set Graph Title from the menu. The Configure Axis Text dialog box appears.
Specify the Font, Size, and Text Color for the axis text via the drop-down menus and color box on the
Configure Axis Text dialog box. Enter the title of your graph in the Text box.
Rename Spectral Window
This option allows you to choose a display name for your data displayed in the spectral window. The
software uses this name to refer to specific spectrum windows (when using OOIBase32 Platinum
version).
Select View | Rename Spectral Window from the menu. The Rename Spectral Window dialog box
appears. Enter a name for your spectral window.
40 000-20000-020-02-0505
Page 51

5: View Menu Functions
Cursor
These options enable you to specify cursor display properties in OOIBase32.
Enabled
- Cursor Controls Toolbar
This option enables or disables the display of a vertical cursor for the spectral window. Click on the
Toggle Cursor icon or choose View | Cursor | Enabled.
Configure
- Cursor Controls Toolbar
This option configures the cursor’s style, width, and color. You can also assign the cursor to a
spectrometer channel and set a precision value for the cursor’s position.
Click on the Configure Cursor icon or select View | Cursor | Configure. The Configure Cursor dialog
box opens.
The following table details Configure Cursor options:
Option Function
Line Style
Line Width
Line Color
Active Graph Trace
Displayed Precision
000-20000-020-02-0505 41
Sets the style of line for the cursor (dotted, dashed, etc.)
Width of the cursor line in pixels
Sets the color of the displayed cursor
Specifies the spectrometer channel associated with the displayed cursor
Sets the precision of the data to the specified number of decimal points
Page 52

5: View Menu Functions
Option Function
Limit Cursor to
Displayed Wavelength
Range
Restricts the cursor to the wavelengths displayed in the graph window.
Show Intensity in
Legend
Displays the intensity at the current cursor location in the legend on the
graph window.
Grid
These options allow you to configure the appearance of a grid in the graph window of OOIBase32.
Enabled
This option enables or disables the display of a grid in the spectral window.
Select View | Grid | Enabled.
Configure
This option allows you to configure the grid’s style and color.
Select View | Grid | Configure. The Configure Spectrum Grid dialog box appears.
Specify the style of line and the color of the grid in the Configure Spectrum Grid dialog box, and then
click the OK button.
42 000-20000-020-02-0505
Page 53

5: View Menu Functions
Legend
These options allow you to configure the appearance of the legend in the graph window of OOIBase32.
000-20000-020-02-0505 43
Page 54

5: View Menu Functions
Enabled
This option enables or disables the display of the legend in the spectral window.
Select View | Legend | Enabled.
Configure
This option allows you to configure the legend’s position, orientation, appearance, style, and color.
Select View | Legend | Configure. The Configure Legend dialog box appears.
The table below details the various options in the Configure Legend dialog box:
Option Function
Visible
Floating
Location
Orientation
Border
Width
Background Color
Foreground Color
Determines whether or not OOIBase32 displays the legend in the graph
window
Determines graph size in relation to legend. When unchecked, OOIBase32
resizes the graph to accommodate a legend. When checked, the graph size
does not change
Specifies the location of the legend in relation to the graph window
Determines the orientation of the legend (horizontal or vertical)
Determines the type of border surrounding the legend
Determines the width of the configured border
Determines the background color of the legend
Determines the foreground (text) color of the legend
Font
44 000-20000-020-02-0505
Determines the font type and size of the text in the legend
Page 55

5: View Menu Functions
Show Overlay Filename
This option enables or disables the display of the overlay filename (when you specify an overlay) in the
legend displayed in the spectral window. See Chapter 6:
on overlays.
Select View | Legend | Show Overlay Filename.
Overlay Menu Functions for more information
Main Status Bar
This option enables or disables the display of the Main Window Status Bar in OOIBase32.
Select View | Main Status Bar.
000-20000-020-02-0505 45
Page 56

5: View Menu Functions
46 000-20000-020-02-0505
Page 57

Chapter 6
Overlay Menu Functions
Overview
This section details the various options and functions available from the Overlay menu in OOIBase32.
Where applicable, toolbar icons associated with the function appear below the section heading. Click on
these icons in OOIBase32 to perform the described function.
Select to add overlay
This option enables you to display or clear data in one of the eight overlay slots for each spectral window.
To open a spectrum as an overlay, select Overlay | X – Select to add overlay from the menu (where X
represents the number of the overlay you wish to open. A dialog box prompts you to navigate to a saved
spectrum file. You must have some previously saved spectrum files to open an overlay.
To clear an overlay, select Overlay | X, where X represents the number of the overlay you wish to clear.
You may also choose the Clear All option (described below) to clear all overlay files from the spectral
window.
000-20000-020-02-0505 47
Page 58

6: Overlay Menu Functions
Note
To configure OOIBase32 to present a warning before clearing an overlay, select Edit |
Settings from the menu and choose the Misc. Settings tab. Once there, check the Warn
Before Overlay Spectrum is Cleared box.
Clear All
This option clears all displayed overlays in the current spectral window.
Select Overlay | Clear All.
48 000-20000-020-02-0505
Page 59

Chapter 7
Spectrometer Menu Functions
Overview
This section details the various options and functions available from the Spectrometer menu in
OOIBase32.
Where applicable, toolbar icons associated with the function appear below the section heading. Click on
these icons in OOIBase32 to perform the described function.
Configure
- Spectral View Mode Toolbar
This option opens the Spectrometer Configuration dialog box. This dialog box provides the ability to
configure your spectrometer. It includes parameters for wavelength calibration, A/D converter interfacing,
reference monitoring, stray light correcting, and detector linearity correction.
OOIBase32 loads the information contained in the Spectrometer Configuration dialog box as part of the
default spectrometer file.
Note
The parameters set in this dialog box apply only to a designated spectral window. Each
spectral window may have a different spectrometer configuration.
Select Spectrometer | Configure from the menu. The Spectrometer Configuration dialog box opens.
Wavelength Calibration Tab
The Wavelength Calibration tab allows you to enter or change the serial number of your spectrometer
and the wavelength calibration coefficients of each spectrometer channel.
000-20000-020-02-0505 49
Page 60

7: Spectrometer Menu Functions
When using a USB-based spectrometer or A/D interface, the coefficients for the spectrometer
automatically load as part of the spectrometer configuration file. For all other spectrometers, you must
manually enter these values from the Wavelength Calibration Data Sheet that accompanied your
spectrometer.
The Wavelength Calibration tab contains the following options:
Option Function
Spectrometer Channel
Spectrometer Serial
Number
Channel Enabled
First Coefficient
Second Coefficient
Third Coefficient
Specifies the spectrometer channel for which these modifications will
apply.
Serial number of the spectrometer on the channel selected in the
Spectrometer Channel field.
Specifies whether the channel specified in the Spectrometer Channel
field will acquire data.
First wavelength coefficient (provided on the Wavelength Calibration Data
Sheet that came with the spectrometer). Applies to the spectrometer
selected in the Spectrometer Channel field.
Second wavelength coefficient (provided on the Wavelength Calibration
Data Sheet that came with the spectrometer). Applies to the spectrometer
selected in the Spectrometer Channel field.
Third wavelength coefficient (provided on the Wavelength Calibration
Data Sheet that came with the spectrometer). Applies to the spectrometer
selected in the Spectrometer Channel field.
If your Wavelength Calibration Data Sheet does not contain a third
coefficient, enter 0 here
Intercept
50 000-20000-020-02-0505
Specifies the wavelength intercept of the spectrometer selected in the
Spectrometer Channel field.
Page 61

7: Spectrometer Menu Functions
A/D Interface Tab
The A/D Interface tab of the Spectrometer Configuration dialog box allows you to set the hardware
parameters for your spectrometer.
The table below contains a description of all options available from this tab. Not all options are available
for all hardware types.
Option Description
Spectrometer Type
A/D Converter Type
Interrupt Request (IRQ)
Base Address (I/O Range)
S1024DW Offset
SAD500 Serial Port
Specifies the type of spectrometer in use.
Specifies the type of A/D converter in use (if any).
Specifies the IRQ number for the A/D converter in use, if applicable.
Specifies the Base Address of the A/D converter in use, if applicable. Use
the same values as specified by the switches on your A/D board.
Adjusts the baseline signal by the specified value.
Some S1024DW Spectrometers have a negative baseline. This does not
affect data since OOIBase32 references all data from the same baseline.
However, if you wish to modify the baseline so that all obtained data is
positive, enter a value here to offset the baseline of the S1024DW.
This option is only available if you select S1024DW as the Spectrometer
Type.
Specifies the COM port on the PC used to communicate with the SAD500
A/D converter.
This option is only available if you select Serial (RS-232) A/D as the A/D
Converter Type.
000-20000-020-02-0505 51
Page 62

7: Spectrometer Menu Functions
Option Description
Specifies the communication speed at which the SAD500 A/D converter
operates.
SAD500 Baud Rate
This option is only available if you select Serial (RS-232) A/D as the A/D
Converter Type.
Specifies the pixel resolution of the SAD500 A/D converter.
Enter a value of 1-500 in this field. It specifies that the SAD500 will
transmit every nth pixel of the spectrometer to the PC. You will need to
determine the appropriate pixel resolution through experimentation.
Higher pixel resolution values result in increased communication speed,
as the SAD500 transmits fewer pixels to the PC.
SAD500 Pixel Resolution
Note that the transfer of one complete spectra requires approximately 0.4
seconds when communicating at 115,200 baud. If you need your
information faster than this, increase the pixel resolution or enable data
compression.
This option is only available you select if Serial (RS-232) A/D as the A/D
Converter Type.
Specifies whether you have enabled data compression. The data
compression feature maximizes the amount of data transferred over the
Compress SAD500 Data
USB Serial Number
serial connection.
This option is only available if you select Serial (RS-232) A/D as the A/D
Converter Type.
Specifies the serial number of the USB device that OOIBase32 will use.
This option is only available when using a USB-based spectrometer or
A/D interface.
Reference Monitoring Tab
The Reference Monitoring tab of the Spectrometer Configuration dialog box allows you to monitor a
reference for variations in spectral intensity based on light source and system drift.
Over time, the detected light from a source fluctuates or drifts. There are two types of drift: Spectrally
uniform and spectrally non-uniform. The drift associated with a tungsten lamp is often spectrally
uniform, but the drift associated with a deuterium lamp is not.
For extended experiments, you will achieve optimal results if you take frequent reference spectra. If this
is not possible, however, you can choose to monitor your light source and instruct OOIBase32 to correct
for any drift that might occur. OOIBase32 can perform a traditional, dual-beam type of reference
monitoring with a two-channel system (using Wavelength-by-Wavelength reference monitoring). If you
have a single-channel system, however, OOIBase32 can still correct for drift by offering two kinds of
reference monitoring: Integrated Intensity and Single Point.
52 000-20000-020-02-0505
Page 63

7: Spectrometer Menu Functions
Note
If your reference is in a region that has low scope mode intensity, you will introduce
noise into the corrected sample spectrum. Increase signal averaging to increase the S:N.
For the best results, make sure that the scope mode intensity of the region or wavelength
that you are using as your reference is at least 15% of the peak intensity.
The following sections explain each monitoring option.
Wavelength-by-Wavelength
The Wavelength-by-Wavelength option requires a minimum of two spectrometer channels in your
system, both configured for the same wavelength range. This method can correct for both uniform and
non-uniform drift.
►
Procedure
To monitor a reference using the Wavelength-by-Wavelength option, perform the following steps:
Hardware Configuration:
1. Attach a bifurcated fiber to the light source.
2. Attach one leg of the bifurcated fiber to the reference spectrometer channel.
3. Attach the second leg to the sample.
4. Attach another fiber from the sample to the second spectrometer channel.
One spectrometer channel looks at the reference while the other looks at the sample. You must
view both channels in the same spectral window.
000-20000-020-02-0505 53
Page 64

7: Spectrometer Menu Functions
Software Configuration:
1. Open OOIBase32 and select Spectrometer | Configure.
2. Select the Reference Monitoring tab.
3. Locate the channel (in the Spectrometer Channel field) to use for your experiment.
4. Select the Reference Monitoring tab and select a Reference Channel.
5. Select Wavelength-by-Wavelength under Reference Type.
6. Store a dark and a reference spectrum of the sample in Scope mode.
Note
You must perform Step 6 after configuring reference monitoring.
7. Change to the appropriate spectral view mode in OOIBase32 (or stay in Scope mode).
OOIBase32 now will automatically correct for drift and reflect any correction in the spectral window.
Typical Wavelength-by-Wavelength Reference Monitoring Setup
Integrated Intensity
If you cannot perform the dual-beam type of reference monitoring, you can use the Integrated Intensity
method. However, this method is only effective if the drift from the detected light is uniform. Use this
option instead of the Single Point option if you can afford to use as your reference an area of the
wavelength region versus a single wavelength point.
Use the Integrated Intensity option if the following is true:
• You do not have two spectrometer channels identically configured
• The drift of the light source is uniform
• Your sample has a nonabsorbing wavelength region
54 000-20000-020-02-0505
Page 65

7: Spectrometer Menu Functions
► Procedure
Perform the steps below to monitor a reference using the Integrated Intensity option:
Hardware Configuration:
1. Attach a fiber from the light source to the sample.
2. Attach a fiber from the sample to the spectrometer.
Software Configuration:
1. Open OOIBase32 and select Spectrometer | Configure.
2. Select the Reference Monitoring tab.
3. Locate the channel (in the Spectrometer Channel field) that you will use for your experiment.
4. Select the Reference Monitoring tab and select a Reference Channel.
5. Select Integrated Intensity under Reference Type.
6. Choose the Start and End for the Reference Bandwidth.
The software will use the wavelength area between these two points as the monitoring region.
You must know if the region you choose as the reference area is in a non-absorbing region of the
sample (during absorbance measurements) or is in the 100% transmission or reflectivity region of
the sample (during transmission or reflection measurements).
7. Store a dark and a reference spectrum of your sample while in Scope mode.
Note
You must perform Step 7 after configuring reference monitoring.
8. Change to the appropriate spectral view mode in OOIBase32 (or stay in Scope mode).
OOIBase32 now will automatically correct for drift and reflect any correction in the spectral window.
Single Point
If you cannot perform the dual-beam type of reference monitoring, you can use the Single Point method.
However, it is only possible for the software to correct for drift using this option if the drift from the
detected light is uniform. Choose this option over the Integrated Intensity option only if you cannot afford
to use as your reference an area of the wavelength region and must monitor a single wavelength point.
Use the Single Point option if:
• You do not have two spectrometer channels identically configured
• The drift of the light source is uniform
000-20000-020-02-0505 55
Page 66

7: Spectrometer Menu Functions
• You cannot afford to sample a wavelength area and must monitor a non-absorbing wavelength
region
►
Procedure
Perform the following steps to monitor a reference using the Single Point option:
Hardware Configuration:
1. Attach a fiber from the light source to the sample.
2. Attach a fiber from the sample to the spectrometer.
Software Configuration:
1. Open OOIBase32 and select Spectrometer | Configure.
2. Select the Reference Monitoring tab.
3. Locate the channel (in the Spectrometer Channel field) that you will use for your experiment.
4. Select the Reference Monitoring tab and select a Reference Channel.
5. Select Single Point under Reference Type.
6. Specify the Reference Wavelength point to monitor.
You must know if the wavelength point you choose as the reference point is in a non-absorbing
region of the sample (during absorbance measurements) or is in the 100% transmission or
reflectivity region of the sample (during transmission or reflection measurements).
7. Store a dark and a reference spectrum of your sample while in Scope mode.
Note
You must perform Step 7 after configuring reference monitoring.
8. Change to the appropriate spectral view mode in OOIBase32 (or stay in Scope mode).
OOIBase32 now will automatically correct for drift and reflect any correction in the spectral window.
Stray Light Correction Tab
The Stray Light Correction tab allows you to enable or disable the stray light correction feature and to
enter the stray light correction constant for each spectrometer channel.
Stray light is light the spectrometer detects at a wavelength or wavelengths other than those at which the
spectrometer should detect light. All spectrometers experience the effects of stray light. When you enable
the stray light correction feature, the Correction Constant reduces every pixel’s intensity to compensate
for the total amount of stray light in the spectrometer.
56 000-20000-020-02-0505
Page 67

7: Spectrometer Menu Functions
The table below details the options available in the Stray Light Correction tab.
Option Description
Spectrometer Channel
Stray-light Correction
Enabled
Correction Constant
Specifies the spectrometer channel for which modifications on the Stray
Light Correction tab apply.
Enables or disables the stray light correction feature of OOIBase32.
Contains a variable used by OOIBase32 to reduce the intensity of each
pixel in the spectrometer.
Detector Linearity Tab
The Detector Linearity tab allows you to enable or disable the detector linearity correction and to enter
the correction coefficients for each spectrometer channel in your system.
000-20000-020-02-0505 57
Page 68

7: Spectrometer Menu Functions
The software automatically populates the values in the Detector Linearity tab from the information on
the spectrometer EEPROM chip in some spectrometers.
For all other devices, you must run the OOINLCorrect program available at the following address:
http://www.oceanoptics.com/technical/softwaredownloads.asp.
When you run OOINLCorrect, the software prompts you to update your driver files and default
spectrometer configuration file. At this prompt, specify the configuration file that accompanied the
spectrometer you are using. OOINLCorrect will obtain the Detector Linearity information from this file
and load these values into OOIBase32 automatically.
You still must manually enable the detector linearity correction feature.
Contact Ocean Optics Technical Support for assistance, if necessary.
Open Configuration
This option allows you to open a file containing saved spectrometer configuration parameters.
►
Procedure
1. Select Spectrometer | Open Configuration. A dialog box prompts you to navigate to the
configuration file you wish to open.
2. Selecting the file. A message box opens asking if you would like to make the selected
configuration file the default configuration file.
3. Select Yes or No. You can save multiple configuration files and switch easily among them.
58 000-20000-020-02-0505
Page 69

7: Spectrometer Menu Functions
Save Configuration As
This option allows you to save the current spectrometer configuration parameters. After you name and
save the file, you can make the saved file the default configuration file. OOIBase32 will load that file
each time the software starts or a new spectral window opens.
Select Spectrometer | Save Configuration As to access this option.
000-20000-020-02-0505 59
Page 70

7: Spectrometer Menu Functions
60 000-20000-020-02-0505
Page 71

Chapter 8
Spectrum Menu Functions
Overview
This section details the various options and functions available from the Spectrum menu in OOIBase32.
Where applicable, toolbar icons associated with the function appear below the section heading. Click on
these icons in OOIBase32 to perform the described function.
Store Dark
- Spectrum Controls Toolbar
This option stores a dark spectrum for all enabled spectrometer channels in a spectral window (unless you
manually configure the When Storing Reference and Dark option on the Misc. Settings tab of the
OOIBase32 Settings dialog box, which stores the dark spectrum for the selected spectrometer channels).
Block the light path to the sample, and then take the dark spectrum.
You must store a dark spectrum before the software can calculate absorbance, transmission, and relative
irradiance spectra. This command merely stores a dark spectrum in temporary memory. You must use the
File | Save | Dark command to permanently save the dark spectrum to disk.
Click on the Store Dark icon (
) or select Spectrum | Store Dark from the menu.
Store Reference
- Spectrum Controls Toolbar
This option stores a reference spectrum for all enabled spectrometer channels in a spectral window
(unless you manually configure the When Storing Reference and Dark option on the Misc. Settings tab
of the OOIBase32 Settings dialog box, which stores the reference spectrum for the selected spectrometer
channels). Take a reference spectrum with the light source on and a blank in the sampling region.
You must store a reference spectrum before the software can calculate absorbance, transmission, and
reflection spectra. This command merely stores a reference spectrum in temporary memory. You must use
the File | Save | Reference command to permanently save the reference spectrum to disk.
000-20000-020-02-0505 61
Page 72

8: Spectrum Menu Functions
Click on the Store Reference icon ( ) or select Spectrum | Store Reference from the menu.
Snapshot
- Spectrum Controls Toolbar
This option halts data acquisition and takes a snapshot of the activity in the spectral window.
This option also places OOIBase32 in Snapshot mode, which allows you to obtain single exposures of the
activity in the spectral window by clicking the Single Exposure icon (described below).
Click on the Snapshot icon (
) or select Spectrum | Snapshot from the menu.
Single Exposure
- Spectrum Controls Toolbar
This option reactivates data acquisition, and acquires and displays a single spectral acquisition. It is only
active when OOIBase32 is in Snapshot mode (described above).
Click on the Single Exposure icon (
) or select Spectrum | Single Exposure from the menu.
Emergency Reset
- Spectrum Controls Toolbar
This option resets all acquisition parameters for the active spectral window.
In some cases, a chosen set of acquisition parameters could take an extremely long time to complete a
spectral acquisition (for example, a 10,000 msec integration time with 1000 averages). Selecting this
command sets the integration time to 100 msec, acquires one average, and turns off spectral smoothing
and external triggering.
Click on the Emergency Reset icon (
) or select Spectrum | Emergency Reset.
Kickstart
Under rare circumstances, the acquisition loop of OOIBase32 could stop. This command restarts the
acquisition loop without resetting any acquisition parameters.
62 000-20000-020-02-0505
Page 73

8: Spectrum Menu Functions
Global
Global functions apply to all spectral windows in OOIBase32.
Store Global Dark
- Global Functions Toolbar
This option stores the current spectra as dark spectra for all spectral windows in OOIBase32.
Take the dark spectrum with the light source off or with the light path blocked. You must save a dark
spectrum before the computer can make the calculations of absorbance, transmission, and relative
irradiance spectra. Additionally, you must use the Save Dark command to permanently save the dark
spectrum to disk.
Click on the Store Global Dark icon (
) or select Spectrum | Global | Store Global Dark.
Store Global Reference
- Global Functions Toolbar
This option stores the current spectra as reference spectra for all spectral windows in OOIBase32.
Take a reference spectrum with the light source on and a blank in the sampling region. You must save a
reference spectrum before the computer can make the calculations of absorbance, transmission, and
reflection spectra. Additionally, you must use the Save Reference command to permanently save the
reference spectrum to disk.
Click on the Store Global Reference icon (
) or select Spectrum | Global | Store Global Reference.
Global Snapshot
- Global Functions Toolbar
This option freezes the data acquisition for all spectral windows in OOIBase32 and allows you to
continue to view a single set of spectra.
Click on the Global Snapshot icon (
) or select Spectrum | Global | Global Snapshot.
Global Emergency Reset
- Global Functions Toolbar
Use this command to reset all acquisition parameters for all spectral windows in OOIBase32.
In some cases, a chosen set of acquisition parameters could take an extremely long time to complete a
spectral acquisition (for example, a 10,000 msec integration time with 1000 averages). Selecting this
000-20000-020-02-0505 63
Page 74

8: Spectrum Menu Functions
command sets the integration time to 100 msec, acquires one average, and turns off spectral smoothing
and external triggering.
Click on the Global Emergency Reset icon (
Reset.
) or select Spectrum | Global | Global Emergency
Configure Data Acquisition
- Spectrum Controls Toolbar
This option opens the Configure Data Acquisition dialog box. This dialog box allows you to configure
aspects of the data acquisition process.
You can access basic parameters (such as integration time or averaging) and advanced parameters (such
as strobe control and triggering) through this dialog box.
Basic Tab
The Basic tab allows you to configure basic data acquisition parameters.
64 000-20000-020-02-0505
Page 75

8: Spectrum Menu Functions
This tab contains the following options:
Option Function
Specifies the integration time (or A/D conversion frequency for an S1000
or S2000BT) of the spectrometer, which is analogous to the shutter
speed of a camera. The higher the integration time, the longer the
detector “looks” at the incoming photons. If your Scope mode intensity is
too low, increase this value. If the intensity is too high, decrease the
value.
Integration Time (msec)
Adjust the integration time so that the greatest amount of light that you
anticipate for your application causes a signal of about 3500 counts.
While watching the graph trace, adjust the integration time until the signal
intensity level is approximately 3500 counts. The integration time
specified controls enabled spectrometer channels in the active spectral
window.
Specifies the number of discrete spectral acquisitions that the OOIDRV32
Spectra to Average
Boxcar Smoothing Width
device driver accumulates before OOIBase32 receives a spectrum. The
higher the value, the better the signal-to-noise ratio (S:N). The S:N will
improve by the square root of the number of scans averaged.
Sets the boxcar smoothing width, a technique that averages across
spectral data. This technique averages a group of adjacent detector
elements. A value of 5, for example, averages each data point with 5
points to its left and 5 points to its right.
The greater this value, the smoother the data and the higher the signalto-noise ratio. If the value entered is too high, a loss in spectral resolution
will result. The S:N will improve by the square root of the number of pixels
averaged.
Enables or disables the correction of the spectral data for electrical dark
signal.
Correct for Electrical Dark
Signal
The first 24 pixels in the spectrometer, while producing an electrical
signal, do not respond to light. This option subtracts the average value of
these first 24 pixels from the entire spectrum.
Enables or disables the multi-threaded acquisition feature of OOIBase32.
When you disable this option, the acquisition of spectral data occurs in a
separate thread, allowing for the processing of user input. When enabled,
Single-threaded
Acquisition
the acquisition and user-interface occur in the same thread, which
prevents the processing of user input during the time OOIBase32 is
acquiring the scan.
You should always leave this option unchecked unless otherwise
instructed.
000-20000-020-02-0505 65
Page 76

8: Spectrum Menu Functions
External Trigger Tab
The External Trigger tab contains options that allow you to configure your sampling system to acquire
data when triggered by an external source.
This tab contains the following options:
Option Description
Sets the external trigger mode of the spectrometer.
External Trigger Mode
Automatically save file on
trigger
View the External Triggering Options document for specific triggering configuration instructions. See
Product-Related Documentation for more information.
Available options include None (free running), Software (integration time
controlled by software settings), Synchronization (integration time
controlled by frequency of triggers), and Hardware (hardware fixed or
jumpered integration time).
Enables or disables the saving of processed data with each external
trigger.
If you disable the Autoincrement Filenames feature, OOIBase32 displays
a File Save dialog box with each trigger.
Strobe Tab
The Strobe tab contains options that allow you to configure the strobing features of OOIBase32 and your
strobe-compatible light source.
66 000-20000-020-02-0505
Page 77

8: Spectrum Menu Functions
This tab contains the following options:
Option Description
Enables or disables the spectrometer strobe control function.
Strobe Enable
This function toggles the S0 line of the spectrometer.
Sets the delay, in milliseconds, between strobe signals sent out of the
Delay Between Flashes
(msec)
spectrometer.
This parameter only has an effect when using an ADC1000/ADC1000USB/ADC2000-PCI A/D converter.
Enables or disables the modulation of the LED in the USB-LS-450 light
source.
Modulate USB-LS-450
This option performs the same function as the Modulate LED option in the
USB-LS-450 toolbar.
HR4000/HR2000+ Features
This option provides access to additional functionality available with HR4000, HR2000+, and QE65000
Spectrometers.
Select Spectrum | HR4000/HR2000+ Features. The HR4000 Features dialog box appears.
000-20000-020-02-0505 67
Page 78

8: Spectrum Menu Functions
Available options on the HR4000/HR2000+ Features dialog box include the following:
Option Description
The options in this field enable you to set the timing for a single strobe
from the spectrometer’s light source. The timing of the single strobe is
based on the beginning of the integration period.
• High Transition Delay Counter – This option determines a
Single Strobe Timing
Continuous Strobe Timing
This field determines the length of time between 2 flashes of the
continuous strobe signal. The Base Clock Divisor divides down the 48
MHz master clock and feeds the Strobe Divisor. The resulting delay
between flashes is shown next to the Strobe Divisor edit box. For the
spectrometer to acquire accurate data, the integration time must be a
multiple of the time shown next to the Strobe Divisor box.
single strobe’s delay from the start of the acquisition period
expressed in units of one master clock tick.
•
Low Transition Delay Counter – This option determines how
long the single strobe single will remain high by setting the delay
from the start of an acquisition period until the single strobe signal
goes low.
68 000-20000-020-02-0505
Page 79

8: Spectrum Menu Functions
Option Description
This setting sets the delay between the assertion of an external trigger
External Trigger
General Purpose
Input/Output (GPIO)
and the start of the spectrometer integration period. The base frequency
of this counter is the master clock frequency.
This field corresponds to the 10 GPIO pins in the spectrometer.
• Alt. Function – Allows OOI functionality to take control of the
enabled pin(s). A pin is enabled if its corresponding box is
checked.
•
Pin is Output – If the box is checked, then the pin is configured
as output.
•
Value – If the corresponding pin in the Pin is Output field
(above) is configured as output (checked), then a check in the
Value field for the same pin indicates that the pin’s value is high.
Otherwise, the pin’s value is low.
If the corresponding pin in the Pin is Output field (above) is
configured as input (not checked), then a check in the Value field
for the same pin indicates that the external value being applied to
the pin is high. Otherwise, the external value is low.
Analog Input and Output
Screen Update Interval
(msec)
Set the analog output (0 – 5 volts) in the Analog Out Value field. This
field is invalid for QE65000 Spectrometers.
Set the frequency of screen updates (in msec). The status of the analog
input value and the GPIO are updated if analog input is being read.
A 0 indicates that the screen is not updated in real time.
Scope Mode
- Spectral View Mode Toolbar
This command switches the current spectral window into Scope mode.
The signal graphed in Scope mode is the raw voltage coming out of the A/D converter. This spectral view
mode provides complete control of signal processing functions before taking absorbance, transmission,
reflection, and relative irradiance measurements. This mode reflects the intensity of the light source, the
reflectivity of the grating and mirrors in the spectrometer, the transmission efficiency of the fibers, the
response of the detector, and the spectral characteristics of the sample.
Use Scope mode when configuring your setup, adjusting the integration time, and taking dark and
reference scans.
Click the Scope Mode icon (
000-20000-020-02-0505 69
) or select Spectrum | Scope Mode.
Page 80

8: Spectrum Menu Functions
Scope Mode Minus Dark
- Spectral View Mode Toolbar
This command switches the current spectral window into Scope mode, and subtracts the stored dark
spectra from each spectrometer channel before OOIBase32 displays it.
See the description of Scope mode (above) for more information.
Click the Scope Mode icon (
) or select Spectrum | Scope Mode Minus Dark.
Absorbance Mode
- Spectral View Mode Toolbar
This command switches the current window into Absorbance mode. You must first store a dark and
reference spectra in Scope mode before you can access Absorbance mode.
OOIBase32 uses an equation to determine the concentration of a species in solution (illustrated below).
The software uses this equation to evaluate each pixel on the detector and produce the absorbance
spectrum:
Where:
λ
S = Sample intensity at wavelength
D = Dark intensity at wavelength λ
R = Reference intensity at wavelength
The concentration of a species in a solution directly affects the absorbance of the solution. This
relationship, known as Beer’s Law, is expressed as:
λ
Where:
λ
A = Absorbance at wavelength
ε
= Extinction coefficient of the absorbing species at wavelength λ
λ
c = Concentration of the absorbing species and l
Click the Absorbance mode (
mode.
70 000-20000-020-02-0505
) icon or select Spectrum | Absorbance Mode to enter Absorbance
,
is the optical path length of the absorption.
Page 81

8: Spectrum Menu Functions
Transmission Mode
- Spectral View Mode Toolbar
This command switches the current window into Transmission mode. This is also the spectral processing
mode used for reflection spectroscopy, as the math necessary to compute reflection is identical to that
required for transmission. You must first store a dark and reference spectra in Scope mode before you can
access Transmission mode.
OOIBase32 calculates the transmission of a solution using the following equation:
Where:
S
= Sample intensity at wavelength λ
λ
D
= Dark intensity at wavelength λ
λ
= Reference intensity at wavelength λ
R
λ
Click the Transmission mode icon or select Spectrum | Transmission Mode to enter Transmission
mode.
Relative Irradiance Mode
- Spectral View Mode Toolbar
This command switches the current window into Relative Irradiance mode.
Before you can access Relative Irradiance mode, you must take a reference spectrum in Scope mode of a
blackbody of known color temperature. Additionally, you must obtain a dark spectrum by removing the
fiber from the reference lamp and preventing light from entering it.
Relative irradiance spectra are a measure of the intensity of a light source relative to a reference emission
source. OOIBase32 calculates relative irradiance using the following equation:
Where:
B
= Relative energy of the reference calculated from the color temperature
λ
= Sample intensity at wavelength λ
S
λ
= Dark intensity at wavelength λ
D
λ
R
= Reference intensity at wavelength λ
λ
Click the Relative Irradiance mode icon or select Spectrum | Relative Irradiance Mode to enter
Relative Irradiance mode.
000-20000-020-02-0505 71
Page 82

8: Spectrum Menu Functions
Specular Reflection Mode
- Spectral View Mode Toolbar
This command switches the current window into Reflection mode. This is also the spectral processing
mode used for transmission spectroscopy, as the math necessary to compute transmission is identical to
that required for reflection.
You must take a dark and reference spectra in Scope mode before you can access Specular Reflection
mode.
OOIBase32 calculates the reflection of a solution using the following equation:
Where:
S
= Sample intensity at wavelength λ
λ
= Dark intensity at wavelength λ
D
λ
= Reference intensity at wavelength λ
R
λ
Click the Specular Reflection mode icon or select Spectrum | Specular Reflection Mode to enter
Specular Reflection mode.
Script-defined Custom Mode
- Spectral View Mode Toolbar
This mode is only available in OOIBase32 Platinum. Contact an Ocean Optics Application Specialist for
more information on OOIBase32 Platinum.
You can find more information about OOIBase32 Platinum at the following web address:
http://www.oceanoptics.com/products/ooibase32plat.asp
Reference Color Temperature
This command opens a Reference Color Temperature dialog box, which allows you to enter the color
temperature (in Kelvin) of your reference lamp.
72 000-20000-020-02-0505
Page 83

8: Spectrum Menu Functions
You must enter the color temperature to use Relative Irradiance mode.
Select Spectrum | Reference Color Temperature.
Configure Standard Correction
This function is currently under development.
Take Log of Vertical Scale
This command enables or disables the presentation of spectral data on a logarithmic vertical scale.
When you enable this feature, OOIBase32 takes the base-10 logarithm of the spectral intensities and
affects both the plotted and stored spectral data.
Select Spectrum | Take Log of Vertical Scale.
Time Normalized Intensity
The Time Normalized Intensity mode is useful in experiments where the reference and sample scans
cannot use the same integration times due to detector saturation from the reference or the sample.
In this mode, you can use one integration time for the reference spectra and a different integration time
for sample spectra. The software normalizes the data as a function of time. However, for this processing
technique to produce valid spectral data, you must store separate dark spectra for each integration time
used.
Enable
This option enables or disables the Time Normalized Intensity mode.
Select Spectrum | Time Normalized Intensity | Enable.
Enable this option before storing any spectra.
000-20000-020-02-0505 73
Page 84

8: Spectrum Menu Functions
Store Reference Dark
This option stores a reference dark spectrum for all enabled spectrometer channels in the active spectral
window while in time normalized intensity mode. Take the reference dark spectrum with the light path
blocked and with the integration time set to the value used when acquiring the reference spectra.
You must store a reference dark spectrum before OOIBase32 can calculate absorbance, transmission, and
relative irradiance spectra in the Time Normalized Intensity mode.
Select Spectrum | Time Normalized Intensity | Store Reference Dark.
Store Sample Dark
This option stores a sample dark spectrum for all enabled spectrometer channels in the active spectral
window while in time normalized intensity mode. Take the sample dark spectrum with the light path
blocked and with the integration time set to the value used when acquiring the sample spectra.
You must store a sample dark spectrum before OOIBase32 can calculate absorbance, transmission, and
relative irradiance spectra in the Time Normalized Intensity mode.
Select Spectrum | Time Normalized Intensity | Store Sample Dark.
Store Reference (Ctrl+R)
This option stores a reference spectrum for all enabled spectrometer channels in a spectral window while
in time normalized intensity mode. Take this spectrum with the light source on and a blank in the
sampling region.
You must store a reference spectrum before OOIBase32 can calculate absorbance, transmission, and
reflection spectra in the Time Normalized Intensity mode.
Select Spectrum | Time Normalized Intensity | Store Reference.
74 000-20000-020-02-0505
Page 85

Chapter 9
Time Acquisition Menu
Functions
Overview
This section details the various options and functions available from the Time Acquisition menu in
OOIBase32.
Where applicable, toolbar icons associated with the function appear below the section heading. Click on
these icons in OOIBase32 to perform the described function.
Time acquisition experiments track processes, perform kinetic analyses, and monitor spectral events as a
function of time. You can collect spectral data as a function of time from up to six single wavelengths
(designated as Channels A through F) and up to two mathematical combinations of these wavelengths
(designated as Combinations 1 and 2). You can acquire data in any mode.
Follow the instructions in this chapter to configure OOIBase32’s Time Acquisition functions.
Configure
The Time Acquisition | Configure option brings up a sub-menu with options that allow you to configure
a variety of aspects for your time acquisition experiments.
Configure Acquisition
This option opens the Time Acquisition Configuration dialog box. This dialog box allows you to
configure and establish the parameters for OOIBase32’s time acquisition processing.
000-20000-020-02-0505 75
Page 86

9: Time Acquisition Menu Functions
Available options on the Time Acquisition Configuration dialog box include the following:
Option Description
Forces OOIBase32 to write the time acquisition data to disk during the
Stream Data to Disk
time acquisition process. The software writes data at the frequency
defined by the Write Data to Disk Every X Acquisitions setting.
Show Values in Status Bar
Write Data to Disk Every X
Acquisitions
Stream and Autosave
Filename
Save Full Spectrum with
Each Acquisition
Save Every Acquisition
Continue Until Manually
Stopped
Displays the time acquisition values in the status bar during the time
acquisition. These values replace the display of the cursor values.
Sets the number of discrete time acquisitions to perform before the
software streams data to the disk.
The smaller this number, the more frequently OOIBase32 will write the
data to disk. You can enhance time acquisition performance by making
this number larger and thus reducing the number of times the software
writes data to the disk.
Defines the filename of the time acquisition stream file or the auto-
incremented files saved (when you enable the Save Full Spectrum with
Each Acquisition option).
Saves the complete spectral data for each enabled spectrometer channel
at each time interval in the time acquisition experiment.
Configures the time acquisition to store data for every spectral
acquisition. OOIBase32 will ignore the value in the Frequency setting
when you enable this option.
Configures the time acquisition to continue to store data until you
manually stop the process with either the Stop button on the Time
Acquisition toolbar or the Time Acquisition | Stop command from the
menu.
OOIBase32 ignores the Duration setting when you enable this option.
76 000-20000-020-02-0505
Page 87

10: Other Menu Functions
Option Description
Determines the initial delay for a time acquisition.
OOIBase32 introduces this delay after you initiate the time acquisition
with the Start button on the Time Acquisition toolbar or the Time
Initial Delay
Frequency
Acquisition | Start command from the menu.
Select the Hours, Minutes, Seconds, or Milliseconds from the check
boxes immediately to the right of the entry to specify the time units of the
initial delay period.
Determines the frequency of the data collection in a time acquisition.
Numerous parameters determine how rapidly OOIBase32 can acquire
data (integration time, number of scans averaged, video performance,
computer speed, etc.). This entry controls the delay between acquisitions.
The software stamps data from a time acquisition with a time accurate to
1 millisecond.
Select the Hours, Minutes, Seconds, or Milliseconds from the check
boxes immediately to the right of the entry to specify the time units of the
frequency variable.
OOIBase32 will ignore the Frequency setting when you enable the Save
Every Acquisition option.
Determines the length of the data collection in a time acquisition.
Select the Hours, Minutes, Seconds, or Milliseconds from the check
Duration
boxes immediately to the right of the entry to specify the time units of the
duration variable.
OOIBase32 will ignore the Duration setting when you enable the
Continue Until Manually Stop option.
Select Time Acquisition | Configure | Configure Acquisition to access this dialog box.
Configure Time Channels
The Configure Time Channels option allows you to configure time channels for a time acquisition
process.
You can collect spectral data as a function of time from up to 6 single wavelengths (designated as Time
Channels A through F) and up to two mathematical combinations of these wavelengths (designated as
Time Channel Combinations 1 and 2).
Select Time Acquisition | Configure| Configure Time Channels to access the Time Acquisition
Channel Configuration dialog box.
000-20000-020-02-0505 77
Page 88

9: Time Acquisition Menu Functions
Time Channels A Through F
These tabs allow you to configure a time acquisition process for a single wavelength.
Select one of the Channel tabs to modify information for that channel.
The following options are available from the Channel tabs on the Time Acquisition Channel
Configuration dialog box.
Option Description
Enabled
Enables the time acquisition calculation for the channel. Time acquisition
will not acquire data for this channel if you uncheck this box.
Instructs the system to plot the time acquisition data in a spectral
window.
Each channel or combination of channels for a time acquisition means
Plotted
that you have one less overlay available in the same spectral window as
the time acquisition process. If you specify Channel A for the time
acquisition, Overlay 1 will not be available in the spectral window. If you
specify Channel B for the time acquisition, Overlay 2 will not be visible,
etc.
Spectrometer Channel
Wavelength (nm)
Bandwidth (pixels)
Factor (multiply)
Determines the spectrometer channel to use for the time acquisition.
Determines the wavelength (in nm) to use for the time acquisition
Determines the bandwidth (in pixels) that the system will average around
the analysis wavelength in a time acquisition.
Contains a multiplicative factor that OOIBase32 will apply to time
acquisition data before it plots or stores the data.
Contains an additive constant that OOIBase32 will apply to the time
Offset (add)
acquisition data after it applies the factor and before it plots or stores the
data.
78 000-20000-020-02-0505
Page 89

10: Other Menu Functions
Time Channels Combination 1 and 2
These tabs allow you to configure a time acquisition process for a combination of two time channels.
Select one of the Combination tabs to modify information for that combination.
The following options are available from the Combination tabs on the Time Acquisition Channel
Configuration dialog box.
Option Description
Enabled
Plotted
First Channel
Operation
Second Channel
Factor (multiply)
Offset (add)
Enables the time acquisition calculation for the combination.
Instructs OOIBase32 to plot the time acquisition data in a spectral
window.
Each channel or combination of channels for a time acquisition results in
one less Overlay being available in the same spectral window as the time
acquisition process. If you specify Combination 1 for the time acquisition,
Overlay 1 will not be available in the spectral window. If you specify
Combination 2 for the time acquisition, Overlay 2 will not be visible.
Specifies the first time acquisition channel for the time Combination 1.
Specifies the mathematical operation to perform on both the First
Channel and the Second Channel to produce the time acquisition
Combination 1 data.
Specifies the second time acquisition channel for the time Combination 1.
Contains a multiplicative factor that OOIBase32 will apply to time
acquisition data before it plots or stores the data.
Contains an additive constant that OOIBase32 will apply to the time
acquisition data after it applies the factor and before it plots or stores the
data.
000-20000-020-02-0505 79
Page 90

9: Time Acquisition Menu Functions
Restore Parameters
This option opens a dialog box that prompts you to navigate to and open a file with the complete set of
saved time acquisition parameters, including the configuration settings for all time channels
You must have previously saved a set of time acquisition parameters in order to restore them. See the
Save Parameters section below.
Select Time Acquisition | Configure | Restore Parameters to access the Restore Parameters dialog box.
Save Parameters
This option saves a complete set of time acquisition parameters, including the configuration settings for
all time channels. After saving this file, you may designate the saved parameters file as the default
parameters for all future time acquisition experiments.
Select Time Acquisition | Configure | Save Parameters to access the Save Parameters dialog box.
Activate Time Acquisition
- Time Acquisition Toolbar
This option activates Time Acquisition mode.
Note
This function only places OOIBase32 in Time Acquisition mode. It does not start data
acquisition. You must click the Start icon or select Time Acquisition | Start to begin
data acquisition.
Click on the icon or select Time Acquisition | Activate Time Acquisition.
Start
- Time Acquisition Toolbar
This option starts the time acquisition process. OOIBase32 enables this option once you activate Time
Acquisition mode.
If you configured the software to stream data to disk, OOIBase32 opens the data file at this point. Once
you start time acquisition, you can pause it, stop it, or permit it to run for the previously defined duration
Click on the start icon (
80 000-20000-020-02-0505
) or select Time Acquisition | Start.
Page 91

10: Other Menu Functions
Pause
- Time Acquisition Toolbar
This option pauses the time acquisition process. OOIBase32 enables this option once you begin the time
acquisition process.
If you defined a specific duration for the time acquisition process in the Time Acquisition Configuration
dialog box, the acquisition will pause until you disable the pause option. If the duration expires during the
paused state, the process terminates and OOIBase32 saves all collected data.
It is possible to pause a time acquisition process and change the parameters without losing any previously
stored data
Click on the Pause icon ( ) or select Time Acquisition | Pause.
Stop
- Time Acquisition Toolbar
This option stops the time acquisition process. OOIBase32 enables this option once you begin the time
acquisition process.
You can stop a time acquisition at any point during the acquisition. If you specified to stream data to disk,
OOIBase32 saves any collected data.
Click on the Stop icon (
) or select Time Acquisition | Stop.
Suspend Graph Display
- Time Acquisition Toolbar
This option suspends the graph display during a time acquisition process. OOIBase32 enables this option
once you begin the time acquisition process.
Depending on your computer, OOIBase32 can spend up to 90% of software processing time calculating
and drawing the graph. When you suspend the display, you allow OOIBase32 to collect data at a higher
frequency.
Click on the Suspend Graph Display (
) icon or select Time Acquisition | Suspend Graph Display.
Save Data
This option saves the data from a time acquisition process. It saves all time acquisition data currently
shown in the spectral window. This function is not the same as streaming data to the disk, and
OOIBase32 saves only the last 2048 time acquisitions.
000-20000-020-02-0505 81
Page 92

9: Time Acquisition Menu Functions
OOIBase32 stores the data in a tab-delimited ASCII file, with time data arranged in columns. The first
column is a time stamp for each acquisition and is in seconds.
Click on the start icon or select Time Acquisition | Save Data to access this option. A dialog box appears
for you to select where to save the data.
82 000-20000-020-02-0505
Page 93

Chapter 10
Other Menu Functions
Overview
This section details the various options and functions available from other menus in OOIBase32 not
previously detailed in this manual.
Where applicable, toolbar icons associated with the function appear below the section heading. Click on
these icons in OOIBase32 to perform the described function.
Script Menu Functions
The Script menu in OOIBase32 is only active in the OOIBase32 Platinum version of the software.
Contact an Ocean Optics Application Specialist for more information on OOIBase32 Platinum.
You can find more information about OOIBase32 Platinum at the following web address:
http://www.oceanoptics.com/products/ooibase32plat.asp
Window Menu Functions
The Window menu functions allow you to configure how OOIBase32 displays multiple windows.
Function Description Example
This option arranges all spectral windows in a horizontally overlapping
Cascade
Tile Horizontally
design.
Select Window | Cascade.
This option stacks all spectral windows on top of one another.
Select Window | Tile Horizontally.
This option arranges all spectral windows side by side.
Tile Vertically
Select Window | Tile Vertically.
000-20000-020-02-0505 83
Page 94

10: Other Menu Functions
Arrange Icons
This command arranges all iconic windows.
Select Window | Arrange Icons.
Help Menu Functions
The Help Menu contains links to the online help system, as well as information regarding your
installation of OOIBase32 and other system information.
Contents
This option displays the contents page of the OOIBase32 help file.
Select Help | Contents.
Index
This option displays the index page of the OOIBase32 help file.
Select Help | Index.
Always on Top
This option instructs OOIBase32 to display the OOIBase32 help file on top of all other displayed
windows on the screen.
Select Help | Always on Top.
84 000-20000-020-02-0505
Page 95

10: Other Menu Functions
About OOIBase32
This command displays the About OOIBase32 dialog box.
This dialog box contains the following information:
• Program version number
• OOIBase32 driver version
• Copyright information
• Contact information
Select Help | About OOIBase32.
000-20000-020-02-0505 85
Page 96

10: Other Menu Functions
86 000-20000-020-02-0505
Page 97

Appendix A
Experiment Tutorials
Overview
The following sections contain information on conducting sample experiments using the USB2000
Spectrometer and OOIBase32.
For information on experiments with Ocean Optics spectrometers other than the USB2000, consult the
operating instructions for your particular spectrometer model.
Preparing for Experiments
► Procedure
Follow the steps below to configure the USB2000 and OOIBase32 for experiments:
1. Verify that you have correctly installed the USB2000, installed OOIBase32, and configured the
light source and other sampling optics.
2. Open the OOIBase32 application, select Spectrometer | Configure from the menu bar, and
double-check that A/D Interface settings are correct.
3. Check your spectrometer setup configurations in OOIBase32:
Locate the Wavelength Calibration Data sheet that came with the USB2000. Select Spectrometer
| Configure from the menu and choose the Wavelength Calibration page. Ensure the First
Coefficient, Second Coefficient, Third Coefficient and Intercept correspond to those of the
system. If not, enter the values as listed on the Wavelength Calibration Data sheet.
4. Adjust the acquisition parameters using the Acquisition Parameters dialog bar or select
Spectrum | Configure Data Acquisition from the menu.
If you followed the previous steps and started OOIBase32, the spectrometer is already acquiring data.
Even with no light in the spectrometer, OOIBase32 should display a dynamic trace in the bottom of the
graph window. If you allow light into the spectrometer, the graph trace should rise with increasing light
intensity. This indicates that you correctly installed the software and hardware.
000-20000-020-02-0505 87
Page 98

A: Experiment Tutorials
Once you install the hardware, configure the software, and establish your sampling system, you are ready
to take measurements.
This section details five types of experiments:
Absorbance Experiments
•
•
Transmission Experiments
• Reflection Experiments
Relative Irradiance Experiments
•
• Time Acquisition Experiments
The type of measurement you will take determines the configuration of the sampling optics for your
system. Furthermore, your choice of reference and data analysis determines how the OOIBase32 presents
the results.
Note
For each measurement, you must first take a reference and dark spectrum. After you take
a reference and a dark spectrum, you can take as many measurement scans as needed.
However, if you change any sampling variable (integration time, averaging, smoothing,
fiber size, etc.), you must store a new dark and reference spectrum.
Application Tips
If the signal you collect is saturating the spectrometer (intensity greater than 4000 counts), you can
decrease the light level on scale in scope mode by:
• Decreasing the integration time
• Attenuating the light going into the spectrometer
• Using a smaller diameter fiber
• Using a neutral density filter with the correct optical density
If the signal you collect has too little light, you can increase the light level on scale in scope mode by:
• Increasing the integration time
• Using a larger diameter fiber
• Removing any optical filters
88 000-20000-020-02-0505
Page 99

A: Experiment Tutorials
Absorbance Experiments
Absorbance spectra are a measure of how much light a sample absorbs. For most samples, absorbance
relates linearly to the concentration of the substance. OOIBase32 calculates absorbance (A
following equation.
- D
S
λ
Aλ = -
log
10
(
Rλ -
D
λ
λ
)
Where:
S
= Sample intensity at wavelength λ
λ
D
= Dark intensity at wavelength λ
λ
= Reference intensity at wavelength λ
R
λ
Typical absorbance setup: The light source (far right) sends light via an input fiber into a cuvette in a
cuvette holder (bottom center). The light interacts with the sample. The output fiber carries light from the
sample to the spectrometer (top center) connected to the PC (far left).
) using the
λ
Absorbance is also proportional to the concentration of the substance interacting with the light (this is
known as Beer’s Law). Common absorption applications include the quantification of chemical
concentrations in aqueous or gaseous samples.
Procedure
►
Follow the steps below to take an absorbance measurement using OOIBase32:
1. Place OOIBase32 in scope mode by clicking the scope mode icon on the toolbar or selecting
Spectrum | Scope Mode from the menu bar.
000-20000-020-02-0505 89
Page 100

A: Experiment Tutorials
2. Ensure that the entire signal is on scale. The intensity of the reference signal should peak at about
3500 counts. If necessary, adjust the integration time until the intensity is approximately 3500
counts.
3. Place a sample of the solvent into a cuvette and take a reference spectrum. You must take a
reference spectrum before measuring absorbance.
Note
Do not put the sample itself in the path when taking a reference spectrum, only the
solvent.
Click the Store Reference spectrum icon on the toolbar or select Spectrum | Store Reference
from the menu bar to store the reference. This command merely stores a reference spectrum in
memory. You must select File | Save | Reference from the menu bar to permanently save the
spectrum to disk.
4. Block the light path to the spectrometer. Then, take a dark spectrum by clicking the Store Dark
Spectrum icon on the toolbar or by selecting Spectrum | Store Dark from the menu bar. This
command merely stores a dark spectrum in memory. You must select File | Save | Dark from the
menu to permanently save the spectrum to disk.
Note
If possible, do not turn off the light source when taking a dark spectrum. If you must turn
off your light source to store a dark spectrum, allow enough time for the lamp to warm up
again before continuing your experiment. After the lamp warms up again, store a new
reference (Step 3).
You must take a dark spectrum before measuring absorbance.
5. Put the sample in place and ensure that the light path is clear. Then, take an absorbance
measurement by clicking on the Absorbance Mode icon on the toolbar or selecting Spectrum |
Absorbance Mode from the menu. To permanently save the spectrum to disk, click the Save
icon on the toolbar or select File | Save | Processed from the menu bar.
Note
If you change any sampling variable (integration time, averaging, smoothing, fiber size,
etc.), you must store a new dark and reference spectrum.
90 000-20000-020-02-0505
 Loading...