

Page 1

OOIBase Operating
Software
Instruction Manual
Version 1.52
Ocean Optics, Inc.
380 Main Street
Dunedin, FL 34698
(727) 733-2447
(727) 733-3962 fax
For the latest information and software upgrades
consult our web site:
www.OceanOptics.com
Or, e-mail our Technical Service Department:
TechSupport@OceanOptics.com
070699
Page 2

Contents
About OOIBase Operating Software
Installing OOIBase Operating Software
Using OOIBase Operating Software
File Menu Functions .........................................................................................3
View Menu Functions .......................................................................................4
Setup Menu Functions......................................................................................6
Toolbar Functions.............................................................................................9
Doing an Experiment
Absorbance Measurement..............................................................................10
Transmission Measurement............................................................................11
...................................................................................10
...........................................................1
.....................................................2
...........................................................3
Relative Irradiance Measurement...................................................................11
Reflection Measurement.................................................................................12
Page 3
About OOIBase Operating Soft ware
OOIBase is the standard operating software for Ocean Optics spectrometers. OOIBase for Windows is a
basic acquisition and display software that provides a real-time interface to a variety of signal-processing
functions. OOIBase allows users to perform basic spectroscopic measurements such as absorbance,
reflectance and emission, as well as more sophisticated tasks such as the automation of experiments with a
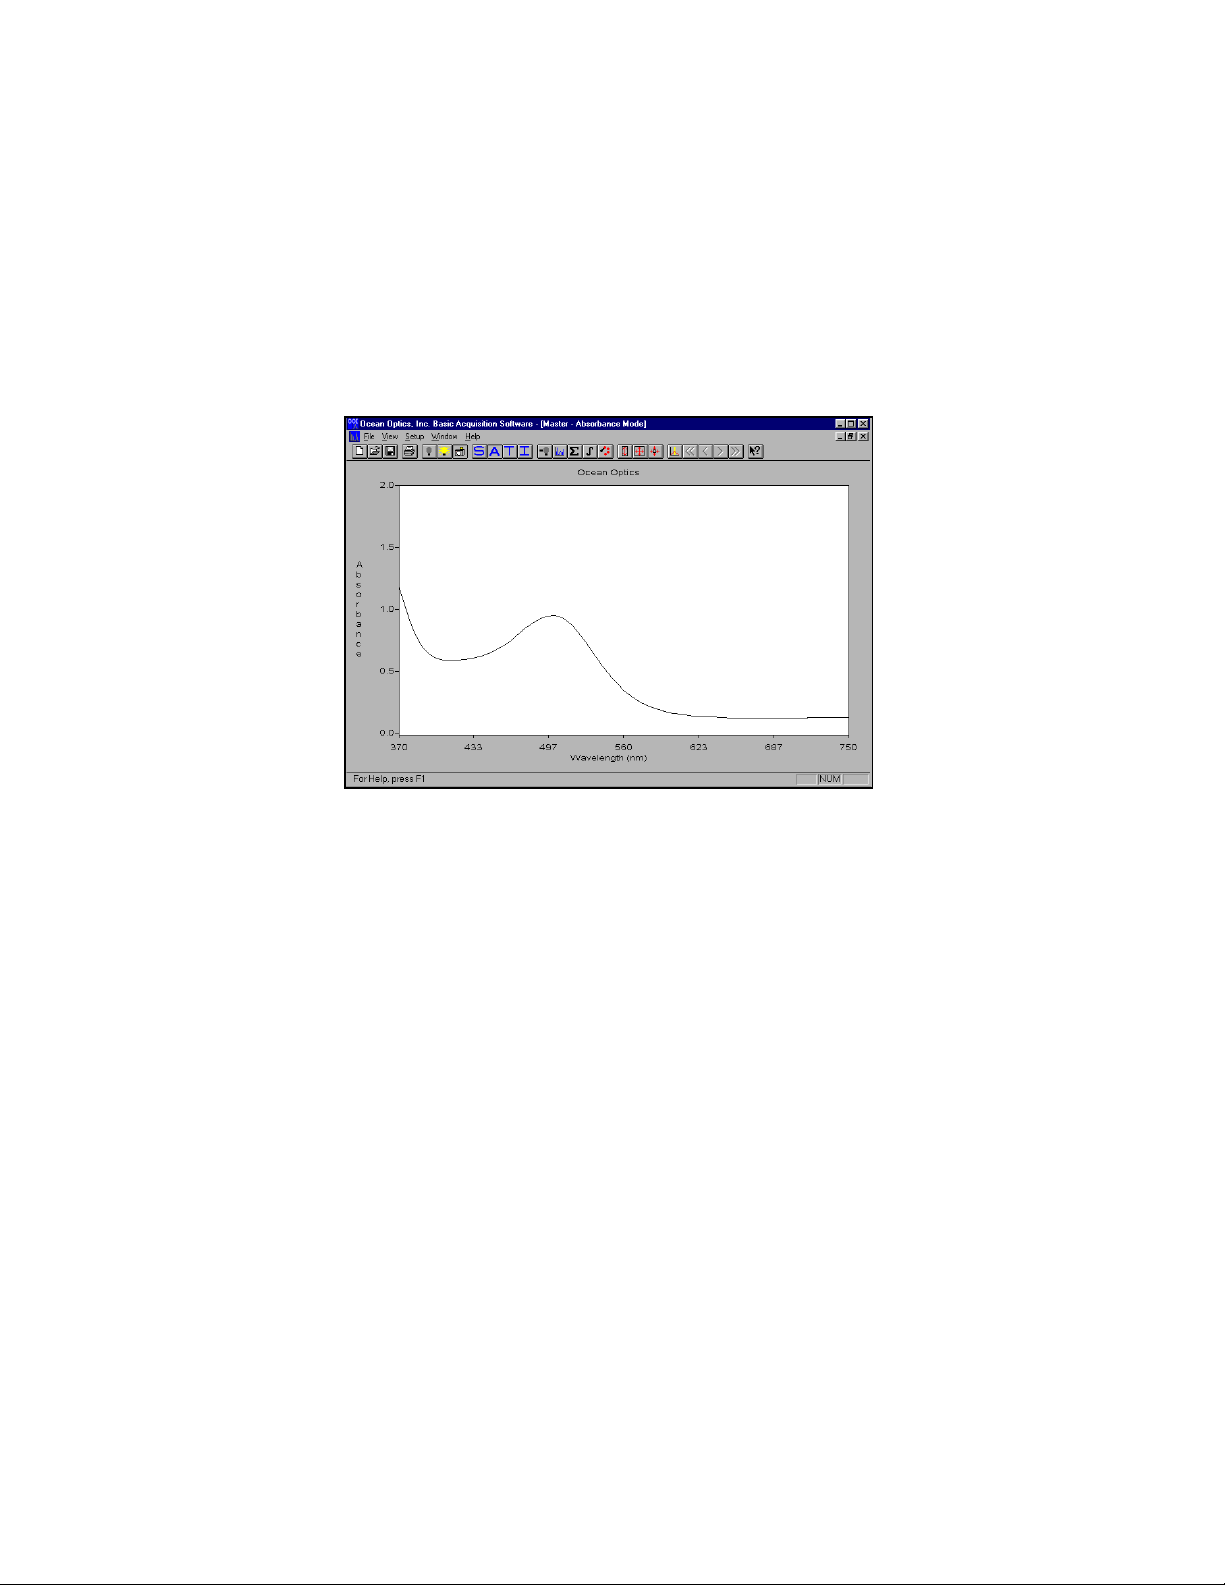
time-series acquisition function. OOIBase allows the user to view, in real-time and entirely on one screen,
spectral data from up to 8 spectrometer channels.
Absorbance spectrum of cranberry juice
OOIBase offers users considerably more flexibility than they are likely to experience with other spectrometer
operating software. The basic concept for the software is that real-time display of data allows users to
evaluate the effectiveness of their experimental setup and data processing selections, make changes to these
parameters, instantly see their effect, and save the data. OOIBase offers:
! Spectrometer control
• integration time regulation
• multiple triggering options
• channel selection
! Signal Processing including:
• signal averaging
• boxcar pixel smoothing
• electrical dark-signal subtraction
• stray light correction
! Spectral Processing: absorbance, transmission, irradiance
! Time series acquisition for full spectra
! Real time graphical display with zoom, cursor and cosmetic selections
! Multi-window support
! File Export to ASCII format
OOIBase operates with Windows 3.x and Windows 95/98. Windows NT users are easily able to write their
own applications using the OOIWinIP Windows or OOILVD La bVIEW drivers.
All Ocean Optics software products comply with Year 2000 requirements.
""""
1
""""
Page 4
Installing OOIBase Operating Soft ware
1. Insert the OOIBase floppy disk into a drive.
2. Select
3. Click OK at the “Welcome!” dialog box.
4. Select the
5. In the “Make Backups” dialog box, click
6. After the software installation is complete, you will go back out to your desktop.
7. Start OOIBase by selecting
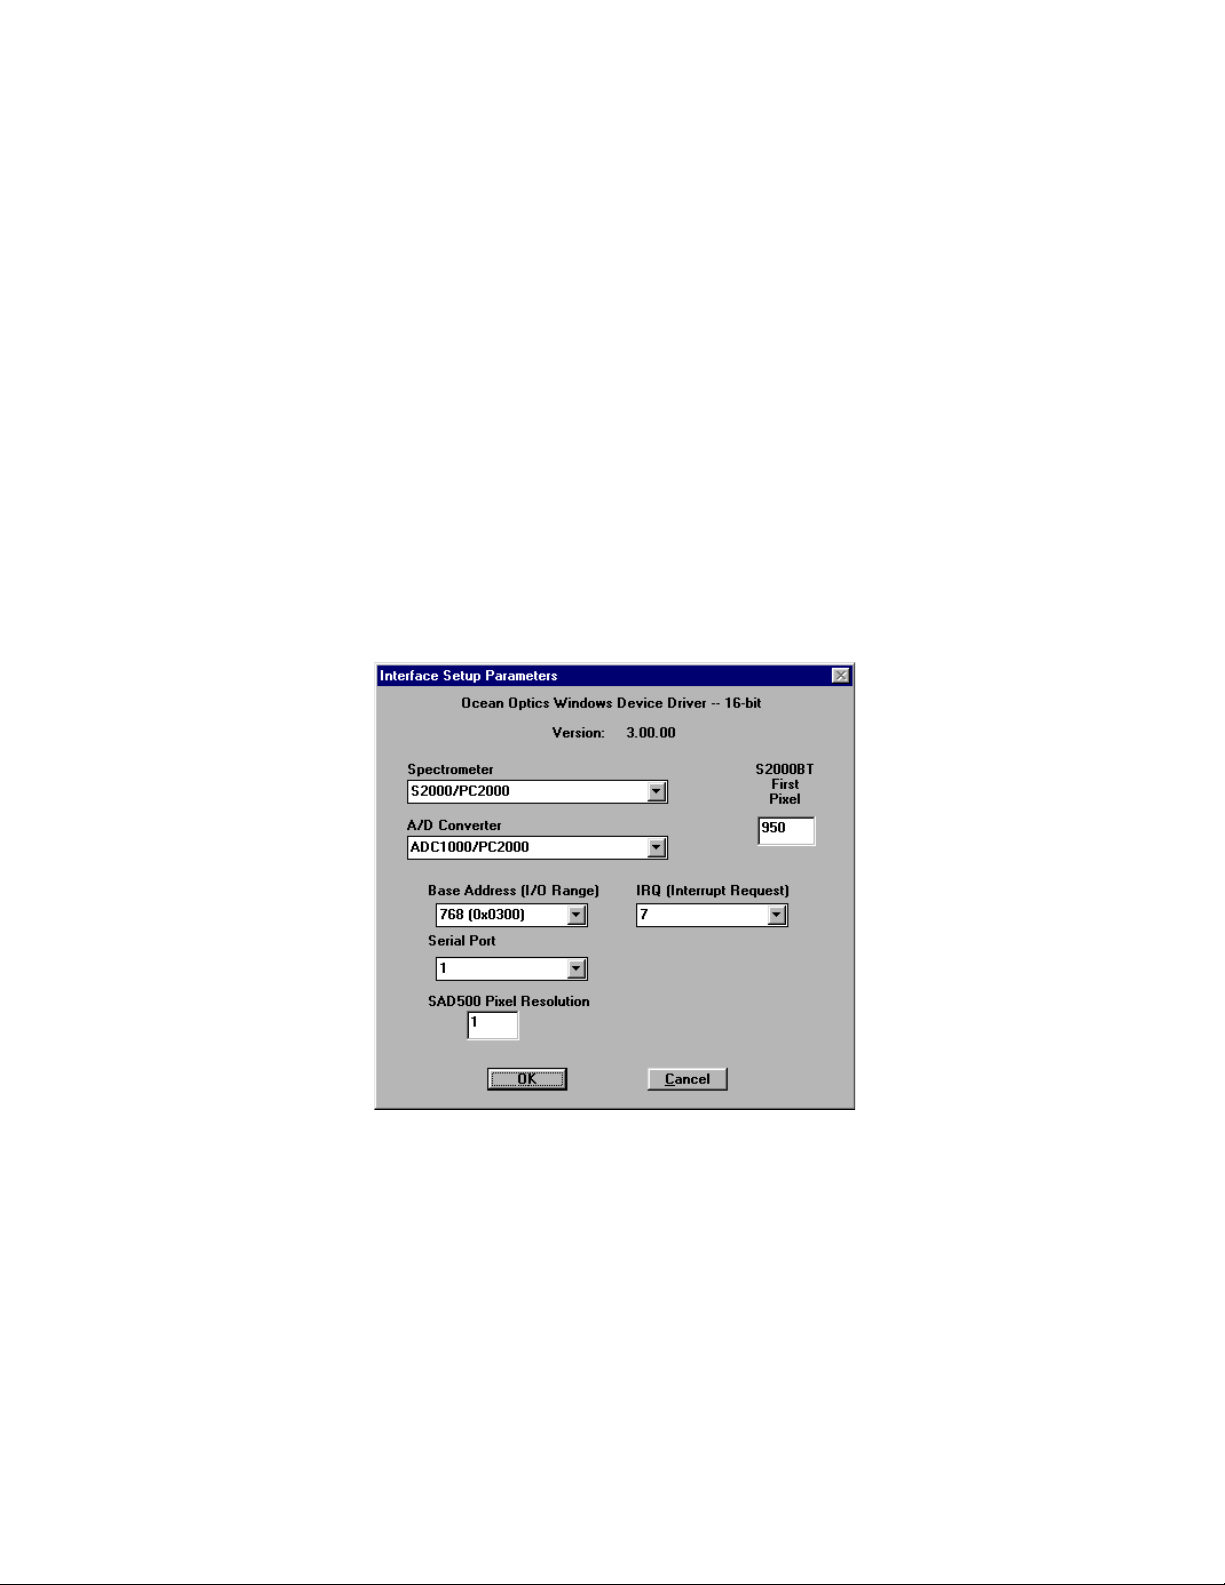
8. The first time the software starts, the “Interface Setup Parameters” dialog box opens. This box allows
Run
and type
Destination Directory
housed. Clic k OK.
you to specify your Spectrometer, A/D Converter, Base Address (I/O Range), and IRQ (Interrupt
Request). Choose the correct parameters for your setup. For the ADC500, ADC1000 or PC2000,
choose the same Base Address and IRQ settings as the dip switches on the A/D board. If you left them
unchanged, accept the default settings (Base Address of 768 and IRQ of 7). If you have the DAQ-700,
you will have to use your computer to find the correct settings of the hardware. For specific
instructions on changing the settings for these A/D cards, see the directions that came with your
product. If you have the SAD500, ignore the Base Address and IRQ selections. Click OK. You can
always go back to this dialog box by selecting
(drive):setup
. Click OK.
. Choose the default destination or type where you want the software
YES
.
Start | Programs | OOIBase V 1.5 | OOIBase V 1.5
Setup | Configure Hardware
.
9. If you do not see the “Interface Setup Parameters” dialog box when you start OOIBase, exit OOIBase
by selecting
open Notepad and allow you to edit the initialization file for our device driver. Find the “Initialized”
entry within this file. Make sure this line reads: Initialized=0. Save the OOIDRV.INI file and
exit Notepad. Restart OOIBase. You should now see the “Interface Setup Parameters” dialog box
allowing you to spec i f y your ha rdware configurat io n.
10. At this point, OOIBase should be acquiring data from your spectrometer. There should be a dynamic
trace responding to light near the bottom of the displayed graph. If your spectrometer is not responding
to light (or your computer hangs or crashes), please contact our Technical Support Department.
11. Exit and restart OOIBase. This enables the hardware changes to take effect.
File | Exit
. Then select
Start | Run
, and type C:\windows\ooidrv.ini. This will
2
Page 5

Using OOIBase Operating Soft ware
File Menu Functions
New
This command opens a new window and starts acquiring data from the spectrometer. By default, the Master
channel is selected and the graph is placed in Scope Mode.
Open
This command opens a dialog box that allows you to reload a saved set of spectra. If you saved the dark or
the reference spectra, they are also restored.
Close
This command immediately closes the current graph window. You are
current spectrum when this command is chosen.
Store Dark Spectrum
This command stores the current spectrum as the dark spectrum for the channel activated. This spectrum is
taken with the light source off or with the light path blocked. (See
Saving a dark spectrum is requisite before the software can make the calculations of absorbance,
transmission, and relative irradiance spectra.
not
given the opportunity to save the
Doing an Experiment
on page 15.)
Store Reference Spectrum
This command stores the current spectrum as the reference spectrum for the channel activated. This
spectrum is taken with the light source on and a blank in the sampling region. (See
on page 15.) Saving a reference spectrum is requisite before the software can make the calculations of
absorbance, transmission, and reflection spectra.
Doing an Experiment
Save Sample Spectrum
This command opens a dialog box that allows you to save a set of spectra as a binary file. If the dark and
reference spectra are saved, they are also saved in the binary file. Data acquisition parameters are also saved.
Export Spectrum
This command opens a dialog box that allows you to export the current spectra (sample, reference, and/or
dark) into a comma-delimited ASCII file. You are given the opportunity to specify the filename. The
following file extensions are the default:
Spectrum Extension
Reference .REF
Dark .DRK
Sample
Absorbance .ABS
Transmission .TRM
Reflection .RFL
Scope .SCO
Print Preview
This command opens a window allowing you to view how the current spectrum will look when printed.
3
Page 6

Print
This command displays a dialog box allowing you to print the current spectrum. The graph title, grid and
cursor are all printed if they are displayed on the screen.
Exit
This command exits OOIBase.
View Menu Functions
Scope Mode
This command switches the current window into Scope Mode. The signal graphed in Scope Mode is the
raw voltage c oming out of the A/D converter. Once you open O OIBase and it begins to acquire data, you
see the raw voltage from the detector expressed in A/D counts. This spectral view mode is unique to Ocean
Optics and allows the user the ability to have complete control of signal processing. Be careful when using
this mode, as it represents a combination of several factors: the intensity of the light source, the reflectivity
of the grating and the mirrors in the spectrometer, the transmission of the fibers, the response of the
detector, and the spectral characteristics of the sample. Scope Mode should only be used to select signal
acquisition functions.
Absorbance Mode
This command switches the current window into Absorbance Mode. Before this can occur, both the dark
and reference spectra must be stored while in Scope Mode. (See
details.) The absorbance of a solution is related to the concentration of species within it. The relationship,
known as Beer’s Law, is:
ε
Aλ =
A = absorbance at wavelength λ, ε = extinction coefficient of the absorbing species at wavelength λ,
c = the concentration of the absorbing species, and l = the pathlength of the absorption.
l
c
λ
Doing an Experimen
t
on page 15 for
This relationship is used to determine the concentration of a species in solution. Absorb ance is calculated
by the following equation. When this equation is evaluated for each pixel of the detector, the absorbance
spectrum is produced.
S
D
-
λ
Aλ = - log
S
= sample intensity of each wavelength,
λ
R
= reference intensity of each wavelength, λ = each wavelength
λ
10
(
λ
)
D
R
-
λ
λ
D
= dark intensity of each wavelength,
λ
Transmission Mode
This command switches the current window into Transmission Mode. Before this can occur, both the dark
and reference spectra must be made and stored while in Scope Mode. (See
15 for details.) The transmission of a sample is calculated by the following equation:
S
D
-
λ
λ
%Tλ =
R
λ
S
= sample intensity of each wavelength,
λ
R
= reference intensity of each wavelength, λ = each wavelength
λ
-
D
λ
x 100%
D
= dark intensity of each wavelength,
λ
Doing an Experiment
on page
4
Page 7

Irradiance Mode
This comma nd switches the current window into relative Irradiance Mode. The reference spectrum must be
made in Scope Mode with a blackbody of known color temperature. A dark spectrum is usually obtained by
removing the fiber from the reference lamp and preventing light from entering it. (See
Experiment
source relative to a reference emission source. Relative irradiance is calculated by the following equation:
B
S
R
on page 15 for details.) Relative irradiance spectra are a measure of the intensity of a light
D
S
-
λ
B
Iλ =
λ
(
= relative energy of the reference calculated from the color temperature in degrees Kelvin,
λ
= sample intensity of each wavelength,
λ
= reference intensity of each wavelength, λ = each wavelength
λ
λ
)
D
R
-
λ
λ
D
= dark intensity of each wavelength,
λ
Doing an
Snapshot
This command freezes the data acquisition for the current spectral window and allows you to continue to
view a single spectrum.
Autoscale Y Axis
This command automatically adjusts the vertical scale of a current graph so the selected area fills the graph.
Change Graph Scale
This command opens a dialog box allowing you to manually set both the vertical and horizontal scale of
the graph.
Unscale Graph
This command returns the graph to its default scale.
Colors
This command allows the user to choose a color for the frames, background, trace, text, grid, and cursor. It
is especially useful if multiple channels are being used. Utilize this function to differentiate one channel’s
display from another.
Cursor
This command toggles a vertical cursor on the current graph. The cursor can be moved with either the
yellow arrows in the toolbar or via the following keystrokes:
Keystroke Command
Page Up Moves vertical cursor 25 pixels to the right
Page Down Moves vertical cursor 25 pixels to the left
#
(right arrow) Moves vertical cursor 1 pixel to the right
$
(left arrow) Moves vertical cursor 1 pixel to the left
%
(up arrow) Moves vertical cursor to beginning pixel
&
(down arrow) Moves vertical cursor to end pixel
<,
(less than, comma) Moves vertical cursor to next peak
>.
(greater than, period) Moves vertical cursor to previous peak
Grid
This command toggles the display of a vertical and horizontal grid on the graph.
5
Page 8

Setup Menu Functions
Configure Hardware
This command opens the “Interface Setup
Parameters” dialog box. It allows you to configure
the specific type of hardware connecting the
spectrometer to the computer. In this box, you
specify your
Address
box are usually set only once -- when OOIBase is
first installed and the software first starts. (See
Installing OOIBase Operating Software
page 3 for further details.)
Configure Spectrometer
This command opens the “Spectrometer
Configuration” dialog box. The number of
spectrometer channels in your system is selected.
The correct numbers for the
Second Coefficient
been entered from the bottom of the
calibration sheet that came with your
spectrometer.
Stray light is light detected at a wavelength
or wavelengths other than those at which the
light should be detected. All spectrometers
experience the effects of stray light. The
Enable Stray Light Correction
Stray Light Constant
mathematical equation, reduce every pixel’s
intensity to compensate for the total amount
of stray light in the spectrometer.
Spectrometer, A/D Converter, Base
IRQ
and
. The parameters in this dialog
First Coefficient
Intercept
, and
functions, through a
have already
and the
on
,
Time Series Acquisition
This command opens the “Time Series
Setup” dialog box. It allows you to specify
parameters important to the time series
data acquisition of full spectra. You can
opt to have up to four
Channels
Enter the
Between Scans
The value entered for Number of Scans
will affect the amount of memory (see
Estimated memory
measurements. If these values are too
high and require more memory than you
have available, your computer may
freeze, hang or crash.
The
allows you to begin acquiring data at a
later time. After entering the time (in
in a time series setup.
Number of Scans
Delay Before First Scan
Spectrometer
Delay
and
you want for your setup .
) required for your
function
6
Page 9

seconds), a dialog box opens with a running countdown of the time left before data acquisition begins. At
this point during this countdown, you can click “Start Now” to override the delay. Also, when the data
acquisition begins, you can always cancel the procedure, which results in a loss of data.
By selecting
acquisition may take longer. If you select
Update Graph During Acquisition,
Acquire Data as Fast as Possible
you can see the live spectra being acquired but the
, you will not be able to use
your computer for any other tasks while the time series acquisition is running.
This dialog box also requires that you choose an
Acquisition Mode
. If you choose Absorbance or
Transmission, a dialog box opens requiring you to take a reference and dark spectrum – even if you have
already done so.
Subtract Dark Spectrum
This command subtracts the current dark spectrum from the spectra being displayed. This command is
useful if you are trying to look at a change in an emission spectrum or are trying to eliminate fixed
pattern noise from the spectra. The Subtract Dark Spectrum function only acts on the spectra displayed in
Scope Mode.
Data Acquisition
This command opens the “Configure Data
Acquisition” dialog box (see picture at right).
It allows you to specify data acquisition
parameters. The choices made in this dialog
box control all channels in your system.
Trigger Mode
four modes of operation. The Normal mode is
a continuously scanning mode. The Software
mode is an external control mode allowing you
to signal the spectrometer to take complete
data sets. The External Sync mode allows you
to control the integration time from an external
source, such as a periodic TTL signal. The
External Trigger mode is ideal for use with
laser and other short-pulse events; however,
this mode has a fixed integration time of 55
milliseconds.
allows you to choose between
The first 24 pixels in the spectrometer do not respond to light but they do produce an electrical signal.
When you select the
Correct for Electrical Dark Signal
box, this function subtracts the value of these
optical black pixels from the entire signal, reducing the counts of the black pixels to almost zero.
Choosing the
Spectrum
function.
You would only select the
Correct for Electrical Dark Signal
S2000 Strobe Enable
if you were operating an exte rnal strobe source. To
function
does not
replace the
Store Dark
purchase one of our strobe light sources, such as our PX-2 Pulsed Xenon Lamp or our LS-450 Blue LED
Pulsed Light Source, contact an Ocean Optics Applications Scientist.
Samples for Static Average
is a signal averaging function that averages x number of spectra before it gets
to OOIBase. The value chosen affects all channels in the system. The higher the value, the better the S:N.
The S:N will improve by the square root of the number of scans averaged. Samples for Static Average has
no limits; thousands of scans can be averaged if you are patient enough. (Another function averages spectra
after the scans get to OOIBase. See
Data Analysis
on page 10.)
7
Page 10

Integration Time
This command opens the “Integration Time” dialog box (see picture at right). The integration time of the
spectrometer is analogous to the shutter speed of a camera. The higher the integration time, the longer the
detector “looks” at the incoming
photons. If your Scope Mode
intensity is too low, increase this
value. If the intensity is too high,
decrease the value. You should
adjust the integration time so that
the greatest amount of light that
you anticipate for your application
causes a signal of about 3500
counts. Whil e watching the graph
trace, adjust the integration time
until the signal intensity level is
approximately 3500 counts. The
integration time specified controls
all channels i n your system.
Spectrometer Channel
This command opens the “Spectrometer Channel to View” dialog box. It allows you to animate the window
for a specific spectrometer channel.
Data Analysis
This command opens the “Configure Data Analysis”
dialog box (see picture at right). The functions in
this dialog box regulate S:N. The values specified
control only the activated window.
Samples to Dynamically Average
averaging function that averages x number of
spectra after it gets to OOIBase. The software
collects each spectrum and presents the running
average of the value entered in this box. The
maximum value is 30 scans. The S:N will improve
by the square root of the number of scans averaged.
(Another function averages spectra before the scans
get to OOIBase. Read about this preferred averaging
method in
Boxcar Smoothing Pixel Widt h
that averages across spectral data. This technique
averages a group of adjacent detector elements. A
value of 5, for example, averages each data point with 5 points to its left and 5 points to its right. The
greater this value, the smoother the data and the higher the S:N. The maximum value allowed is 50 pixels.
However, if the value entered is too high, a loss in spectral resolution will result. The S:N will improve by
the square root of the number of pixels averaged.
Choose
Non-Weighted
Data Acquisition
Savitzky-Golay
option.
on page 9.)
if you want the Boxcaring Technique to be weighted; otherwise, choose the
is a signal
is a technique
Set Graph Title
This command opens the “Graph Title” dialog box allowing you to specify the title for the current graph.
This title is displayed on the screen and is also printed when you select
File | Print
.
8
Page 11

Toolbar Functions
Many of the Menu functions can also be accessed through your toolbar. All of the toolbar functions, except
New, Data Acquisition, Integration Time
for
functions include:
Store Reference Spectrum Subtract Dark Spectrum Set Scale for graph 25 pixels to right
Print Transmission Mode Spectrometer Channel 1 pixel to left
Open Scope Mode Data Analysis Cursor
New Snapshot Data Acquisition Unscale graph Help
Save Absorbance Mode Integration Time 25 pixels to left
Store Dark Spectrum Irradiance Mode Autoscale graph 1 pixel to right
, and
Help
, control only the active window. The toolbar
9
Page 12

Doing an Experiment
By now, your spectrometer and sapling optics should be set-up for your application. Con firm that the
parameters for your setup are satisfactory. Assuming that you have followed the necessary steps and started
OOIBase, your spectrometer is already acquiring data. With no light in the spectrometer you should see a
fluctuating trace on the bottom of the graph. If you turn on your lamp, you should see the graph trace rise
with increasing light intensity.
Now you are ready to take your measurements. There are three basic spectral measurements from which to
choose: absorbance, transmission, and relative irradiance. Certain measurements require specific
components . Your current setup might not be the best configuration for all measuring functions. Cont act an
Ocean Optics Applications Scientist for options.
For each measurement, a reference and dark spectrum must first be made. After taking a reference and a
dark spectrum, you may take as many absorbance, transmission, or relative irradiance measurement scans
as you want.
Absorbance Measurement
Absorbance spectra are a measure of how much light is absorbed by a sample. Absorbance spectra are
formed by radiation that has penetrated a material medium. For most samples, absorbance is linearly related
to the concentration of the substance. The software calculates absorbance using the following equation:
S
D
-
λ
Aλ = - log
S
= sample intensity of each wavelength,
λ
R
= reference intensity of each wavelength, λ = each wavelength
λ
Absorbance can also be expressed as proportional to the concentration of the substance interacting with the
light. Common applications include the quantification of chemical concentrations in aqueous or gaseous
samples. To take an absorbance measurement:
1. Make sure you are in Scope Mode, by either clicking the
View | Scope Mode
be about 3500 counts. (See
sure nothing is blocking the light path goi ng to your sample . The analyte you want to measur e must be
absent while taking a reference spectrum. Take the reference reading by clicking the
Spectrum
2. While still in
your sample. Do not turn off the light source. Take the dark reading by clicking the
Spectrum
3. Begin an absorbance measurement by first making sure the sample is in place and nothing is blocking
the light going to your sample. Then choose the
View | Absorbance Mode
Save Sample Spectrum
If at any time any sampling variable changes -- integration time, averaging, smoothing, distance
from light source to sample, etc. -- you must store a new reference and dark spectrum.
10
(
. Make sure the signal is on scale. The peak intensity of the reference signal should
icon on the toolbar or selecting F
Scope Mode
icon on the toolbar or selecting
λ
)
D
R
-
λ
λ
D
= dark intensity of each wavelength,
λ
Scope Mode
Integration Time
, take a Dark Spectrum by first completely blocking the light path going to
. To save the spectrum, click the
.
on page 10.) Take a Reference Spectrum by first making
ile | Store Reference Spectrum
File | Store Dark Spectrum
Absorbance Mode
Save
icon on the toolbar, or selecting
Store Reference
.
Store Dark
.
icon on the toolbar or select
icon on the toolbar or select
File |
10
Page 13

Transmission Measu rement
Transmission is the percentage of energy passing through a system relative to the amount that passes
through the reference. Transmission Mode is also used to show the portion of light reflected from a sample.
Transmission and reflection measurements require the same mathematical calculations. The transmission is
expressed as a percentage (%T) relative to a standard substance (such as air). The software calculates %T
(or %R) by the following equation:
S
D
-
λ
λ
%Tλ =
R
λ
S
= sample intensity of each pixel,
λ
R
= reference intensity of each pixel, λ = each pixel
λ
Common applications include measurement of transmission of light through solutions, optical filters,
optical coatings, and other optical elements such as lenses and fibers. To take a transmission measurement:
1. Make sure you are in Scope Mode, by either clicking the
View | Scope Mode
3500 counts. (See
nothing is blocking the light path going to your sample. The analyte you want to measure must be
absent while taking a reference spectrum. Take the reference reading by clicking the
Spectrum
2. While still in
your sample. Do not turn off the light source. Take the dark reading by clicking the
Spectrum
3. Take a transmission measurement by first making sure the sample is in place and nothing is blocking
the light going to your sample. Then choose the
View | Transmission Mode
Save Sample Spectrum
icon on the toolbar or selecting
Scope Mode
icon on the toolbar or selecting
x 100%
D
-
λ
D
= dark intensity of each pixel,
λ
Scope Mode
. Make sure the signal is on scale. The peak intensity of the signal should be about
Integration Time
.
on page 10.) Take a Reference Spectrum by first making sure
File | Store Reference Spectrum
, take a Dark Spectrum by first completely blocking the light path going to
File | Store Dark Spectrum
Transmission Mode
. To save the spectrum, click the
Save
icon on the toolbar, or selecting
Store Reference
.
Store Dark
.
icon on the toolbar or select
icon on the toolbar or select
File |
If at any time any sampling variable changes -- integration time, averaging, smoothing, distance
from light source to sample, etc. -- you must store a new reference and dark spectrum.
Relative Irradian c e Measurement
Irradiance is the amount of energy at each wavelength from a radiant sample. In relative terms, it is the
fraction of energy from the sample compared to the energy collected from a lamp with a blackbody
energy distribution, normalized to 1 at the energy maximum. Relative irradiance is calculated by the
following equation:
S
D
-
λ
B
Iλ =
λ
(
B
= relative energy of the reference calculated from the color temperature in Kelvin,
λ
S
= sample intensity of each wavelength,
λ
R
= reference intensity of each wavelength, λ = each wavelength
λ
Common applications include characterizing the light output of LEDs, incandescent lamps and other
radiant energy sources such as sunlight. Also included in irradiance measurements is fluorescence, in which
case the spectrometer measures the energy given off by materials that have been excited by light at a
different wavelength. To take a relative irradiance measurement:
λ
R
-
λ
)
D
λ
D
= dark intensity of each wavelength,
λ
11
Page 14

1. Make sure you are in Scope Mode, by either clicking the
selecting
should be about 3500 counts. (See
View | Scope Mode
. Make sure the signal is on scale. The peak intensity of the signal
Integration Time
Scope Mode
icon on the toolbar, or
on page 10.) Take a Reference Spectrum by first
making sure nothing is blocking the light path. The light source must be a blackbody of known color
temperature. Take the reference reading by clicking the
toolbar or selecting
2. While still in
clicking the
Store Dark Spectrum
File | Store Reference Spectrum
Scope Mode
, take a Dark Spectrum by blocking the light. Take the dark reading by
icon on the toolbar or selecting
Store Reference Spectrum
.
File | Store Dark Spectrum
icon on the
.
3. Take a relative irradiance measurement by first positioning the fiber at the light source you wish to
measure. Then choose the
Irradiance Mode
icon on the toolbar or select
View | Irradiance Mode
dialog box opens requiring the light source’s color temperature in Kelvin. Enter the color temperature
and click OK. To save the spectrum, click the
Spectrum
.
If at any time any sampling variable changes -- integration time, averaging, smoothing, distance
from light source to sample, etc. -- you must store a new reference and dark spectrum.
Save
icon on the toolbar or select
File | Save Sample
Reflection Measurement
Reflection is the return of radiation by a surface, without change in wavelength. The reflection may be
specular, from a smooth surface; diffuse, from a rough surface or from within the specimen; or total, a
combination of the two. Reflection is expressed as a percentage (%R) relative to the reflection from a
standard substance (such as our WS-1 white reference material for a diffuse reflection measurement):
. A
D
S
-
λ
λ
%Rλ =
R
λ
S
= sample intensity of each wavelength,
λ
R
= reference intensity of each wavelength, λ = each wavelength
λ
-
D
λ
x 100%
D
= dark intensity of each wavelength,
λ
Common applications include measuring the reflection properties of mirrors, anti-reflection coatings, and
measuring the visual properties of the color in paints, graphics arts, plastics, and food products. To take a
reflection measurement:
1. Make sure you are in Scope Mode, by either clicking the
View | Scope Mode
. Take a Refer ence Spectrum by first making sure nothing is blocking the light
Scope Mode
icon on the toolbar, or selecting
path going to your reference. (For diffuse reflection measurements, place the reflection probe over a
diffuse white standard. For specular reflection measurements, place the reflection probe over a firstsurface mirror.) The analyte you want to measure must be absent while taking a reference spectrum.
Take the reference reading by clicking the
File | Store Reference Spectrum
2. While still in
Scope Mode
.
, take a Dark Spectrum by first completely blocking the light path going to
your sample. Do not turn off the light source. Take the dark reading by clicking the
Spectrum
icon on the toolbar or selecting
Store Reference Spectrum
File | Store Dark Spectrum
icon on the toolbar or selecting
Store Dark
.
3. Take a reflection measurement by first making sure the sample is in place and nothing is blocking the
light going to your sample. Then choose the
Transmission Mode
. The Transmission Mode uses the same mathematical formula for both
Transmission Mode
icon on the toolbar or select
View |
transmission and reflection measurements (%R is calculated in the same wa y as %T). To save the
spectrum, click the
If at any time any sampling variable changes -- integration time, averaging, smoothing, distance
from light source to sample, etc. -- you must store a new reference and dark spectrum.
Save
icon on the toolbar or select
File | Save Sample Spectrum
.
12
 Loading...