


TL/F/5283
DP8464B Disk Pulse Detector
June 1989
DP8464B Disk Pulse Detector
General Description
The DP8464B Disk Pulse Detector utilizes analog and digital
circuitry to detect amplitude peaks of the signal received
from the read/write amplifier fitted with the heads of disk
drives. The DP8464B produces a TTL compatible output
which, on the positive leading edge, indicates a signal peak.
Electrically, these peaks correspond to flux reversals on the
magnetic medium. The signal from the read/write amplifier
when reading a disk is therefore a series of pulses with
alternating polarity. The Disk Pulse Detector accurately replicates the time position of these peaks.
The DP8464B Disk Pulse Detector has three main sections:
the Amplifier, the time channel and the gate channel. The
Amplifier section consists of a wide bandwidth amplifier, a
full wave rectifier and Automatic Gain Control (AGC). The
time channel is made from the differentiator and its following bi-directional one shot, while the gate channel is made
from the differential comparator with hysteresis, the D flipflop and its following bi-directional one shot.
The Disk Pulse Detector is fabricated using an advanced
oxide isolated Schottky process, and has been designed to
function with data rates up to 15 Megabits/second. The
DP8464B is available in either a 300 mil wide 24-pin dual-inline package or a surface mount 28-pin plastic chip carrier
package. Normally, it will be fitted in the disk drive, and its
output may be directly connected to the DP8461 or the
DP8465 Data Separator.
Features
Y
Wide input signal amplitude rangeÐfrom 20 mVpp to
660 mVpp differential
Y
Data rates up to 15 Megabits/sec 2,7 code
Y
On-chip differential gain controlled amplifier, differentiator, comparator gating circuitry, and output pulse
generator
Y
Input capacitively coupled directly from the disk head
read/write amplifier
Y
Adjustable comparator hysteresis
Y
AGC and differentiator time constants set by external
components
Y
TTL compatible digital Inputs and Outputs
Y
Encoded Data Output may connect directly to the
DP8461 or DP8465 Data Separator
Y
Standard drive supply: 12Vg10%
Y
Available in 300 mil wide 24-pin dual-in-line package, a
surface mount 28-pin plastic chip carrier package, or a
40-pin TapePak
É
package
Block Diagram
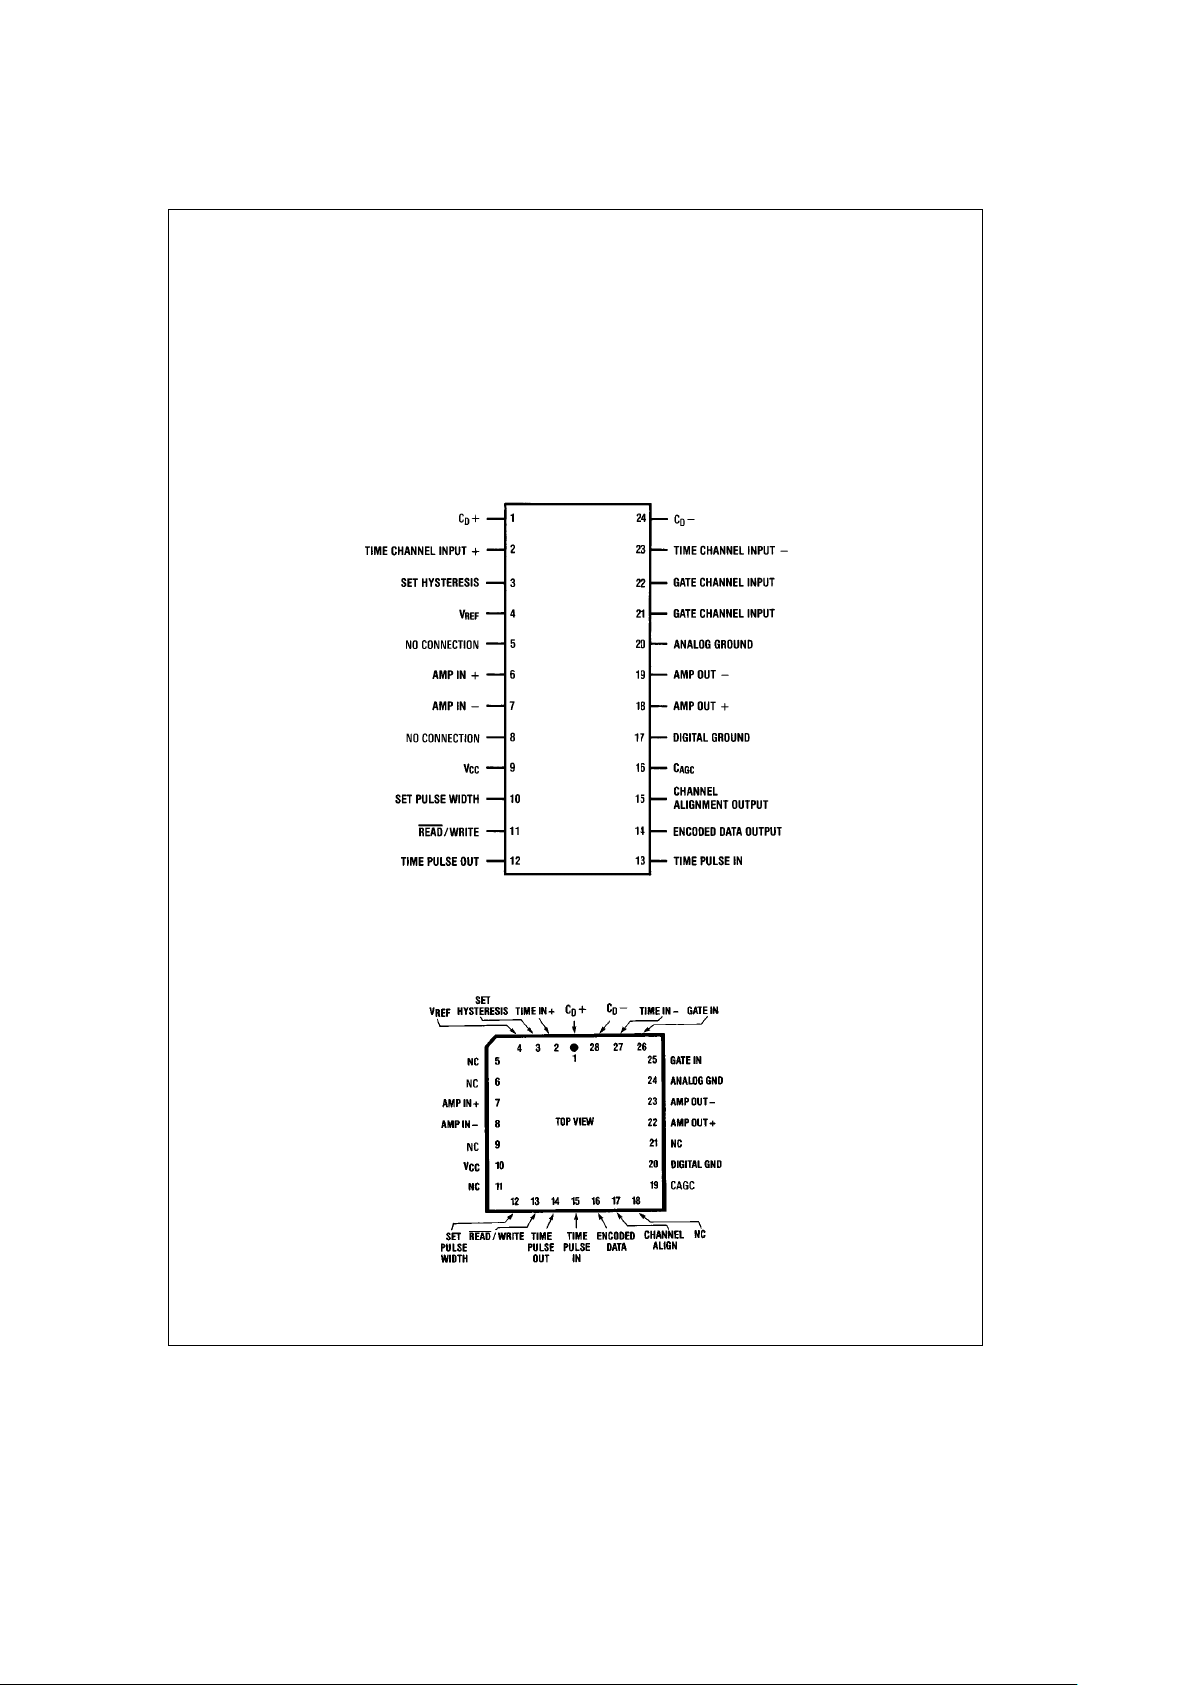
Pin 5ÐNo connection
Pin 8ÐNo connection
TL/F/5283– 7
Note: All pin numbers in this data sheet refer to the 24-pin dual-in-line package.
TapePakÉis a registered trademark of National Semiconductor Corporation.
C
1995 National Semiconductor Corporation RRD-B30M105/Printed in U. S. A.

Absolute Maximum Ratings
If Military/Aerospace specified devices are required,
please contact the National Semiconductor Sales
Office/Distributors for availability and specifications.
Pins Limit
Supply Voltage 9 14V
TTL Input Voltage 11,13 5.5V
TTL Output Voltage 12,14,15 5.5V
Input Voltage 3,4 5.5V
Minimum Input Voltage 3,4
b
0.5V
Differential Input 6-7, 21-22, 3V or
b
3V
Voltage 2-23
ESD Susceptibility (see Note 5)
Storage Temperature
b
65§Ctoa150§C
Lead Temp. (Soldering, 10 seconds) 300
§
C
Maximum Power Dissipation at 25§C
Molded DIP Package
(derate 15.6 mW/
§
C above 25§C) 1950 mW
Plastic Chip Carrier Package
(derate 12.5 mW/
§
C above 25§C) 1560 mW
Operating Conditions
Symbol Parameter Min Typ Max Units
V
CC
Supply Voltage 10.8 12.0 13.2 V
T
A
Ambient Temperature 0 70§C
DC Electrical Characteristics Over Recommended Operating Temperature and Supply Range V
REF
e
0.5V,
Set Hysteresis
e
0.3V. Read/Writee0.3V unless otherwise noted. All Pin Numbers Refer to 24 Pin Dual-In-Line Package.
Symbol Pins Parameter Conditions Min Typ Max Units
AMPLIFIER
Z
IN
AI
6,7 Amp In Impedance T
A
e
25§C 0.75 1.0 1.25 kX
(Note 1)
A
VMIN
18,19 Min Voltage Gain AC Output 4 Vpp 6.0 V/V
Differential
A
VMAX
18,19 Max Voltage Gain AC Output 4 Vpp 200 V/V
Differential
V
C
AGC
16 Voltage on C
AGC
A
V
e
6.0 4.5 5.5 V
A
V
e
200 2.8 3.7 V
GATE CHANNEL
Z
IN
GCI
21,22 Gate Channel Input T
A
e
25§C 1.75 2.5 3.25 kX
Impedance (Note 1)
I
C
AGC
b
16 Pin 16 Current which V
PIN 16
e
3.9V
b
1.5
b
2.5
b
3.5 mA
Charges C
AGC
l
V
PIN 21
b
V
PIN 22
l
e
1.3 V
DC
I
C
AGC
a
16 Pin 16 Current which V
PIN 16
e
5V 1 5 mA
Discharges C
AGC
l
V
PIN 21
b
V
PIN 22
l
e
0.7 V
DC
I
V
REF
4V
REF
Input Bias
b
20
b
100 mA
Current
V
TH
AGC
22,21 AGC Threshold (Note 2) 0.88 1.0 1.12 V
4,16 V
PIN 16
e
4.2V
I
SH
3 Set Hysteresis Input
b
60
b
100 mA
Bias Current
V
TH
SH
22,21 Set Hysteresis (Note 3) 0.48 0.6 0.72 V
3,15 Threshold
TIME CHANNEL
Z
IN
TC
2,23 Time Channel Input T
A
e
25§C 3.5 5.0 6.5 kX
Impedance (Note 1)
I
C
d
24 Current into Pin 1 and 1.4 1.8 2.50 mA
24 that Discharges
C
d
2

DC Electrical Characteristics Over Recommended Operating Temperature and Supply Range V
REF
e
0.5V,
Set Hysteresis
e
0.3V. Read/Writee0.3V unless otherwise noted. All pin numbers refer to the 24 pin dual-in-line package.
(Continued)
Symbol Pins Parameter Conditions Min Typ Max Units
WRITE MODE
Z
IN
AI
6,7 Amp In Impedance V
PIN 11
e
2.0V 50 250 X
in Write Mode
I
C
AGC
b
16 Pin 16 Current V
PIN 11
e
2.0V 1 5 mA
in Write Mode V
PIN 16
e
3.9V
l
V
PIN 21
b
V
PIN 22
l
e
1.3 V
DC
DIGITAL PINS
V
IH
11,13 High Level Input 2 V
Voltage
V
IL
11,13 Low Level Input 0.8 V
Voltage
V
I
11,13 Input Clamp V
CC
e
Min
b
1.5 V
Voltage I
I
eb
18 mA
I
IH
11,13 High Level Input V
CC
e
Max 20 mA
Current V
I
e
2.7V
I
I
11,13 Input Current at V
CC
e
Max 1 mA
Maximum Input V
I
e
5.5V
Voltage
I
IL
11,13 Low Level Input V
CC
e
Max
b
200 mA
Current V
I
e
0.5V
V
OH
12,14, High Level Output V
CC
e
Min 2.7 V
15 Voltage I
OH
eb
40 mA
(Note 4)
V
OL
12,14, Low Level Output V
CC
e
Min 0.5 V
15 Voltage I
OL
e
800 mA
(Note 4)
I
OS
12,14, Output Short V
CC
e
Max
b
100 mA
15 Circuit Current V
O
e
OV
I
CC
9 Supply Current V
CC
e
Max 54 75 mA
AC Electrical Characteristics
Over Recommended Operating Temperature and Supply Range unless otherwise noted
Symbol Pins Parameter Conditions Typ Max Units
DP8464B-2 14 Pulse Pairing (See Pulse Pairing Set Up)
g
1.5
g
3ns
t
pp
DP8464B-3 14 Pulse Pairing (See Pulse Pairing Set Up)
g
2
g
5ns
t
pp
DP8464B-1 14 Pulse Pairing (See Pulse Pairing Set Up)
g
0.5
g
1ns
t
pp
at 25§CV
CC
e
12V only
Note 1: The temperature coefficient of the input impedance is typically 0.05% per degree C.
Note 2: The AGC Threshold is defined as the voltage across the Gate Channel Input (pins 21 and 22) when the voltage on C
AGC
(pin 16) is 4.2V.
Note 3: The Set Hysteresis Threshold is defined as the minimum differential AC signal across the Gate Channel Input (pins 21 and 22) which causes the voltage on
the Channel Alignment Output (pin 15) to change state.
Note 4: To prevent inductive coupling from the digital outputs to Amp In, the TTL outputs should not drive more than one ALS TTL load each.
Note 5: The following pins did not meet the 2000V ESD test with the human body model, 120 pF thru 1.5 kX: Pins 1, 2, 3, 10, 11, 12, 14, 21, 24.
3

Pulse Pairing Set Up
* Transformer (T1) is
Tektronix CT-2 current
probe or equivalent
TL/F/5283– 3
DP8464B
f
e
2.5 MHz
V
IN
e
40 mVppdifferential
V
REF
e
0.50V
C
D
e
50 pF
R
D
e
430X
Filter
R1e240X R2e680X
C1e15 pF C2e100 pF
L1
e
4.7 mH
This is a 3 pole Bessel with the corner frequency at 7.5
MHz.
TL/F/5283– 4
Pulse Pairing Measurement
Connect a scope probe to pin 14 (Encoded Data Out) and
trigger off its positive edge. Adjust the trigger holdoff so the
scope first triggers off the pulse associated with the positive
peak and then off the pulse associated with the negative
peak (as shown in the scope photo below). Pulse pairing is
displayed on the second pair of pulses on the display. If the
second pulses are separated by 4 ns, then the pulse pairing
for this part is
g
2 ns.
Circuit Operation
The output from the read/write amplifier is AC coupled to
the Amp Input of the DP8464B. The amplifier’s output voltage is fed back via an external filter to an internal fullwave
rectifier and compared against the external voltage on the
V
REF
pin. The AGC circuit adjusts the gain of the amplifier
to make the peak to peak differential voltage on the Gate
Channel Input four times the DC voltage on V
REF
. Typically
the signal on Amp Out will be set for 4 Vpp differential.
Since the filter usually hasa6dBloss, the signal on the
Gate Channel Input will be 2 Vpp differential. The user
should therefore set 0.5V on V
REF
which can be done with a
simple voltage divider from the
a
12V supply.
The peak detection is performed by feeding the output of
the Amplifier through an external filter to the differentiator.
The differentiator output changes state when the input pulse
changes direction, generally this will be at the peaks. However, if the signal exhibits shouldering (the tendency to return to the baseline), the differentiator will also respond to
noise near the baseline. To avoid this problem, the signal is
also fed to a gating channel which is used to define a level
either side of the baseline. This gating channel is comprised
4
Circuit Operation (Continued)
of a differential comparator with hysteresis and a D flip-flop.
The hysteresis for this comparator is externally set via the
Set Hysteresis pin. In order to have data out, the input amplitude must first cross the hysteresis level which will
change the logic level on the D input of the flip-flop. The
peak of the input signal will generate a pulse out of the
differentiator and bi-directional one shot. This pulse will
clock the new data at the D input through to the output. In
this way, when the differentiator is responding to noise at
the baseline, the output of the D flop is not changing since
the logic level into the D input has not changed. The comparator circuitry is therefore a gating channel which prevents any noise near the baseline from contaminating the
data. The amount of hysteresis is twice the DC voltage on
the Set Hysteresis pin. For instance, if the voltage on the
Set Hysteresis pin is 0.3V, the differential AC signal across
the Gate Channel Input must be larger than 0.6V before the
output of the comparator will change states. In this case,
the hysteresis is 30% of a 2V peak to peak differential signal at the gate channel input.
Connection Diagrams
Dual-In-Line (DIP) Package
TL/F/5283– 2
Top View
Order Number DP8464BN-3 or DP8464BN-2
See NS Package N24C
Plastic Chip Carrier (PCC) Package
TL/F/5283– 30
Order Number DP8464BV-3, DP8464BV-2 or DP8464BV-1
See NS Package V28A
5

Pin Definitions
(All pin numbers refer to the 24 pin dual-in-line package)
Pin
Ý
Name Function
Power Supply
9V
CC
The supply isa12Vg10%.
17 Digital Digital signals should be referenced
Ground to this pin.
20 Analog Analog signals should be referenced
Ground to this pin.
Analog Signals
6 Amp In
a
These are the differential inputs to
7 Amp In
b
the Amplifier. The output of the read/
write head amplifier should be capacitively coupled to these pins.
18 Amp Out
a
These are the differential outputs of
19 Amp Out
b
the Amplifier. These outputs should
be capacitively coupled to the gating
channel filter (if required) and to the
time channel filter.
22 Gate These are the differential inputs to
21 Channel the AGC block and the gating chan-
Inputs nel. These inputs must be capacitive-
ly coupled from the Amp Out.
2 Time These are the differential inputs to
Channel the differentiator in the time channel.
Input
a
In most applications, a filter between
23 Time the Amp Out (pins 18 and 19) and
Channel these inputs is required to band limit
Input
b
the noise and to correct for any
phase distortion introduced by the
read circuitry. In all cases this input
must be capacitively coupled to prevent disturbing the DC input level.
1C
d
a
The external differentiator network is
24 C
d
b
connected between these two pins.
3 Set The DC voltage on this pin sets the
Hysteresis amount of hysteresis on the differen-
tial comparator. Typically this voltage
can be established by a simple resistive divider from the positive supply.
4V
REF
The AGC circuit adjusts the gain of
the amplifier to make the differential
peak to peak voltage on the Gate
Channel Input equal to four times the
DC voltage on this pin. This voltage
can be established by a simple resistive divider from the positive supply.
5 No connection
8 No connection
16 C
AGC
The external capacitor for the AGC is
connected between this pin and Analog Ground.
Pin
Ý
Name Function
Digital Signals
10 Set Pulse An external capacitor to control the
Width pulse width of the Encoded Data Out
is connected between this pin and
Digital Ground.
11 Read
/Write If this pin is low, the Pulse Detector is
in the read mode and the chip is active. When this pin goes high, the
pulse detector is forced into a standby mode. This is a standard TTL input.
12 Time This is the TTL output from the bi-di-
Pulse rectional one shot following the difOut ferentiator. In most applications this
can be connected directly to the
Time Pulse In.
13 Time This is the TTL input to the clock of
Pulse the D flip-flop. Usually this is conIn nected directly to the Time Pulse Out
pin.
15 Channel This is the buffered output of the dif-
Alignment ferential comparator with hysteresis.
This is usually used in the initial system design and is not used in production.
14 Encoded This is the standard TTL output
Data Out whose leading edge, indicates the
time position of the peaks.
Application Information
GENERAL DESCRIPTION
All pin numbers refer to 24 pin dual-in-line package.
The DP8464B Disk Pulse Detector utilizes analog and digital
circuitry to detect amplitude peaks of the signal received
from the Read/Write Amplifier. The analog signal from a
disk is a series of pulses, the peaks of which correspond to
1’s or flux reversals on the magnetic medium. The pulse
detector must accurately determine the time position of
these peaks. The peaks are indicated by the positive leading edge of a TTL compatible output pulse. This task is complicated by variable pulse amplitudes depending on the media type, head position, head type and read/write amplifier
circuit gain. Additionally, as the bit density on the disk increases, the amplitude decreases and significant bit interaction occurs resulting in pulse distortion and shifting of the
peaks.
The graph in
Figure 1
shows how the pulse amplitude varies
with the number of flux reversals per inch (or recording density) for a given head disk system. The predominant disk
applications are associated with the first two regions on this
graph, Regions 1 and 2. Typical waveforms received by the
pulse detector for these regions are shown next to the
graph.
6

Application Information (Continued)
Region 1 is the high resolution area characterized by a large
spread between flux reversals and a definite return to baseline (no signal) between these peaks. Pulses of this type are
predominantly found in drives which use either thin film
heads or plated media, or in drives which utilize run length
limited codes (like the 2,7 code) which spread the distance
between flux reversals.
A Region 2 waveform will vary from a tendency to return to
the baseline (called shouldering) to almost sinusoidal at the
higher frequencies. These pulses come from drives which
use limited frequency codes (such as MFM). The pulses
may contain shouldering on the outer tracks of the disk and
be nearly sinusoidal on the inner tracks since the flux density increases towards the inner track.
Detecting pulse peaks of waveforms of such variable characteristics requires a means of separating both noise and
shouldering-caused errors from the true peaks. In the past,
mild shoulder-caused errors were blocked by self-gating circuits (such as the ‘‘de-snaker’’). These circuits fail when
shouldering is extensive, hence the need for the DP8464B
which includes a peak sensing circuit and an amplitude sensitive gating channel in parallel.
The main circuit blocks of the DP8464B are shown in
Figure
2
. The output from the read/write amplifier is fed directly to
the Amp Input of the DP8464B. This is the input of a Gain
Controlled Amplifier. The amplifier’s output voltage is fed
back via an external filter to an internal fullwave rectifier and
compared against the external voltage on the V
REF
pin. The
AGC circuit adjusts the gain of the amplifier to make the
peak-to-peak differential Gate Channel input voltage four
times the DC voltage on V
REF
.
The peak detection is performed by feeding the output of
the Gain Controlled Amplifier through an external filter to
the differentiator. The differentiator output changes state
when the input pulse changes direction, generally this will
be at the peaks. However, if the signal exhibits shouldering
(the tendency to return to the baseline) as seen in Region 1
and the upper part of Region 2, the differentiator will also
respond to noise near the baseline. To avoid this, the signal
is also fed to a gating channel which is used to define a
level either side of the baseline. This gating channel comprises a differential comparator with hysteresis and a D flipflop. The hysteresis for this comparator is externally set via
the Set Hysteresis pin. In order to have valid data out, the
input amplitude must first cross the hysteresis level. This will
change the logic level on the D input of the flip-flop. The
peak of the input signal will generate a pulse out of the
differentiator and bi-directional one shot. This pulse will
clock in the new data on the D input, which will appear at
the Q output. In this way, when the differentiator is responding to noise at the baseline, the output of the D flop is not
changing since the logic level into the D input has not yet
changed. The comparator circuitry is therefore a gating
channel to prevent any noise near the baseline from contaminating the data.
The amount of hysteresis is twice the DC voltage on the Set
Hysteresis pin. For instance, if the voltage on the Set Hysteresis pin is 0.3V, the differential Gate Channel Input must
be larger than 0.6V (
g
0.3V) before the output of the comparator will change states. The Time Pulse Out, Encoded
Data, and Channel Alignment Output are designed to drive 1
standard TTL gate.
TL/F/5283– 5
TL/F/5283– 6
FIGURE 1. Pulse Amplitude vs. Bit Density with Typical Waveforms
7

Block Diagram
Pin 5ÐNo connection
Pin 8ÐNo connection
TL/F/5283– 7
FIGURE 2. DP8464B Block Diagram, Region 1 Connection
8

Application Information (Continued)
GAIN CONTROLLED AMPLIFIER
The purpose of the Gain Controlled Amplifier is to increase
the differential input signal to a fixed amplitude while maintaining the exact shape of the input waveform. The Gain
Controlled Amplifier is designed to accept input signals from
20 mVpp to 660 mVpp differential and amplify that signal to
4 Vpp differential. The gain is therefore from 6 to 200 and is
controlled by the automatic gain control (AGC) loop. The
amplifier output is actually capable of delivering typically 5
Vpp differential output but the parts are only tested and
guaranteed to 4 Vpp.
The input to the Gain Controlled Amplifier is shown in
Figure
3
. The value of the input capacitors should be selected so
that the pole formed by the coupling capacitor and the 1k
bias resistor is a factor of 10 lower than the lowest signal
frequency. These input bias resistors have a
g
20% tolerance and a temperature coefficient of 0.05% per degree C.
When the pulse detector is in the write mode, these bias
resistors are automatically shunted by 425X resistors. This
allows the input circuit to recover quickly from the large tran-
sients encountered during a write to read transition. The
input impedance to the amplifier is therefore 1k during read
operations and 300X during write operations.
The output of the Gain Controlled Amplifier is shown in
Fig-
ure 4
. The outputs are biased at (12Vb(0.75 mAc2.4k)
b
0.75V) or 9.5V. Since each output will swingg1V (4 Vpp
differential), each output pin will swing from 8.5V to 10.5V. If
the total differential load placed on the output is 1k, (see
Figure 5
) then the circuit must supply 2V/1k or 2 mA. Since
the output is class A, external resistors to ground must be
used to provide the sink current. In this case, in order to sink
2 mA at the lowest voltage, then (8.5V/2 mA) or an external
4.3k resistor from each output to ground is required. Note
that the circuit has additional margin since the internal 2 mA
current sources were not included in the calculation. Typically the output impedance of the Gain Controlled Amplifier
is 17X, and the
b
3 dB bandwidth is greater than 20 MHz.
TL/F/5283– 8
FIGURE 3. Input to Gain Controlled Amplifier
9

Application Information (Continued)
TL/F/5283– 9
FIGURE 4. Output of Gain Controlled Amplifier
TL/F/5283– 10
FIGURE 5. Output Stage with 1k Differential Load
10

Application Information (Continued)
AUTOMATIC GAIN CONTROL (AGC)
The Automatic Gain Control holds the signal level at the
Gate Channel Input at a constant level by controlling the
gain of the Gain Controlled Amplifier. This is necessary because the amplitude of the input signal will vary with track
location, variations in the magnetic film, and differences in
the actual recording amplitude. The Gain Controlled Amplifier is designed for a maximum 4 Vpp differential output. To
prevent the Gain Controlled Amplifier from saturating, the
V
REF
level must be set so the maximum amplifier output
voltage is 4 Vpp. The AGC will force the differential peak-topeak signal on the Gate Channel Input to be four times the
voltage applied to the V
REF
pin. Normally some kind of filter
is connected between the Gain Controlled Amplifier’s output
and the Gate Channel Input. Typically this filter hasa6dB
insertion loss in its pass band. Since the AGC holds the
amplitude at the Gate Channel Input constant, this 6 dB loss
through the Gate Channel filter will cause the Gain Controlled Amplifier’s output to be 6 dB larger than the Gate
Channel Input.
The AGC loop starts out in the high gain mode. When the
input signal is larger than expected, the AGC loop will quickly reduce the amplifier gain so the peak-to-peak differential
voltage on the Gate Channel Input remains four times the
voltage on V
REF
. If the input amplitude suddenly drops, the
AGC loop will slowly increase the amplifier gain until the
differential peak-to-peak Gate Channel Input voltage again
reaches four times V
REF
. The AGC loop requires several
peaks to react to an increased input signal. In order to recover the exact peak timing during this transition, the V
OUT
level must be set somewhat lower than the maximum of
4 Vpp. For instance, if the V
REF
is 0.5V, and if the loss in the
gate channel filter is 6 dB, then the Amp Output is 4 Vpp. If
the Amp Input suddenly increases 30%, the amplifier may
saturate and the timing for a few peaks may be disturbed
until the AGC reduces the amplifier gain. If the peak detec-
tion is critical during this time, the system may fail. The proper operation, for this example, is to set the V
REF
at 0.35V so
the amplifier will not saturate if the input suddenly increases
30%.
A simplified circuit of the AGC block is shown in
Figure 6
.
When the full wave rectified signal from the Gate Channel
Input is greater than V
REF
, the voltage on the collector of
transistor T1 will increase and charge up the external capacitor C
AGC
through T2. The typical available charging cur-
rent is 2.5 mA. Conversely, if this input is less than V
REF
,
transistor T2 will be off, so the capacitor C
AGC
will be discharged by the base current going into the Darlington T3
and T4. This discharge current is approximately 1 mA. The
voltage across C
AGC
controls the gain of the Gain Controlled Amplifier. This voltage will vary from typically 3.4V at
the highest gain to 4.5V at the lowest gain.
When the AGC circuit has not received an input signal for a
long time, the base current of the Darlington will discharge
the external C
AGC
to 3.4V. The amplifier will now be at its
highest gain. When a large signal comes in, the external
C
AGC
will be charged up with the 2.4 mA from T2 thereby
reducing the gain of the amplifier. The formula, I
e
C
c
(dV/dt) can be used to calculate the time required for the
amplifier to go from a gain of 200 to a gain of 6. For instance, if C
AGC
e
0.01 mf, the charging current I is 2.4 mA,
and the dV required for the amplifier to go through its gain
range is 1.1V, then
dt
e
(0.01 mFc1.1V)/(2.4 mA) or 4.6 ms.
In reality, the gain does not change this quickly since the
C
AGC
would only be charging during a portion of the input
waveform.
By using the same argument, the time required to increase
the amplifier gain after the input has been suddenly reduced
can be calculated. This time, the discharging current is only
1 maso
dt
e
(0.01 mFc1.1V)/1 mA) or 11 ms.
TL/F/5283– 11
FIGURE 6. Simplified AGC Circuit
11

Application Information (Continued)
This time can be decreased by placing an external resistor
across the C
AGC
. For instance, if a 100k resistor is placed in
parallel with C
AGC
, then the discharge current is 40 mA. The
time required to increase the amplifier gain is now 40 times
faster or 275 ms. If this external resistor is made even smaller, say 10k, then the discharge time will go to 27.5 ms. Now
however, there is another problem introduced. The response time of the AGC is so fast that it distorts the signal
at the output of the Gain Controlled Amplifier. Distortion of
the signal at the Amplifier Output can affect the time position of the peaks of this signal. Be sure to check this distortion over the range of input levels you expect to encounter,
when choosing the external R and C values for the AGC.
If the value of the bleed resistor across the C
AGC
is decreased (in order to equalize the AGC attack and decay
times) the value of C
AGC
must be increased in order to
maintain an AGC response that does not distort the signal.
There is a second order effect on the amplitude that results
from this attack and decay time equalization. Referring to
Figure 2
, notice that the AGC is driven from a full wave
rectified version of the Gate Channel Input signal. When the
AGC is operated normally (ie. fast attack and slow decay)
the voltage that appears across C
AGC
is the peak detected
value of this full wave rectified waveform. However, if you
equalize the AGC attack and decay times the voltage
across C
AGC
is the RMS voltage (0.707 times the peak) of
the full wave rectified waveform. Thus, the voltage across
C
AGC
is less and the amplitude out of the Gain Controlled
Amplifier will consequently be 1.4 times larger.
It is possible to externally drive the C
AGC
pin to control the
gain of the amplifier. It must be noted that the gain of the
amplifier is not always exactly 200 when the voltage on
C
AGC
is 3.4V. The transfer curve between the gain of the
amplifier and the voltage on C
AGC
is only approximate. This
transfer curve will vary between parts and with temperature.
Care should be taken to prevent the voltage on the C
AGC
pin from going below ground or above 5.5V.
Figure 7
shows
a typical curve of the Gain Controlled Amplifier Gain vs. the
voltage across C
AGC
(Vpin 16.)
TL/F/5283– 12
FIGURE 7. Gain Controlled Amplifier Gain vs. Vpin 16
It is possible to change the time constant of the AGC circuit
by switching in different external components at the desired
times. For instance, as shown in
Figure 8
, an external open
collector TTL gate and resistor can be added in parallel with
C
AGC
to decrease the AGC response time. Similarly, an external capacitor could be switched in to increase the response time. Since in the absence of an external resistor
the discharge time of C
AGC
is much longer than the attack
time there may be some applications where it is desirable to
switch in a parallel resistor to quickly discharge C
AGC
then
switch it out to force a quick attack. Because of the quick
attack time, the AGC obtains the proper level quicker than it
would had C
AGC
simply been allowed to discharge to the
new level.
There are some applications where it is desirable to hold the
AGC level for a period of time. This can be done by raising
the READ
/WRITE pin. This will shut off the input circuitry,
and it will take time (about 2.5 ms) for the circuit to recover
when going back into the read mode.
Figure 9
shows a
method to hold the AGC level while remaining in the read
mode (which could be used in embedded servo applications). If the voltage on V
REF
is raised to 3V, then the amplifier output voltage cannot get large enough to turn on the
circuitry to charge up C
AGC
. For this to work properly, there
can not be a large discharge current path (resistor in parallel
with C
AGC
) across C
AGC
. The AGC block can be bypassed
altogether by connecting V
REF
to 3V. In this way, the user
can use his own AGC circuit to drive the C
AGC
pin directly.
TL/F/5283– 13
FIGURE 8. Circuit to Decrease AGC Response Time
TL/F/5283– 14
FIGURE 9. Circuit for AGC Hold
READ
/WRITE
In the normal read mode, the signal from the read/write
head amplifier is in the range of 20 mVpp to 660 mVpp.
However, when data is being written to the disk, the signal
coming into the analog input of the pulse detector will be on
the order of 600 mV. Such a large signal will disturb the
AGC level and would probably saturate the amplifier. In addition, if a different read/write amplifier is selected, there will
be a transient introduced because the offset of the preamplifiers are not matched. A READ
/WRITE input pin has
been provided to minimize these effects to the pulse detector. This is a standard TTL input.
When the READ
/WRITE pin is low, the pulse detector is in
the read mode. When the READ
/WRITE pin is taken high,
three things happen. First, the 1k resistors across the AMP
IN pins are shunted by 300X resistors, as described previously in the Gain Controlled Amplifier section. Next, the amplifier is squelched so there is no signal on the Amp Output.
12

Application Information (Continued)
Finally, the previous AGC level is held. This AGC hold function is accomplished by not allowing any current to charge
up the external C
AGC
. The voltage across this capacitor will
slowly reduce due to the bias current into the Darlington
(see
Figure 6
) or through any resistor placed in parallel with
C
AGC
. Therefore, as described in the Automatic Gain Control section, the gain of the amplifier will slowly increase. All
of these three events happen simultaneously.
When the READ
/WRITE input is returned low, the pulse
detector will go back to the read mode in a specific sequence. First of all, the input impedance at the Amp In is
returned to 1k. Then, after approximately 1 ms, the Gain
Controlled Amplifier is taken out of the squelch mode, and
finally approximately 1 ms after that, the AGC circuit is
turned back on. This return to the read mode is designed to
minimize analog transients in order to provide stable operation after 2.5 ms. It is very important that the analog input be
stable before the chip is returned to the read mode. It is
recommended that other than when writing, the Pulse Detector be in the read mode at all times in order to prevent
the 2.5 ms delay from slowing up the system. The READ
/
WRITE pin may be connected to the Write Gate output of a
controller (such as the DP8466 Disk Data Controller).
TIME CHANNEL FILTER
The peak detection is performed by feeding the output of
the Gain Controlled Amplifier through an external filter to
the differentiator. The differentiator output changes state
when the input pulse changes direction, generally this will
be at the peaks. The differentiator can also respond to
noise near the baseline, in which case the comparator gating channel will inhibit the output. The purpose of the external filter is to bandwidth limit the incoming signal for noise
considerations. Care must be used in the design of this filter
to ensure the delay is not a function of frequency. For this
reason, a high order Bessel filter with its constant group
delay characteristics can be used in this application. Often,
this filter must be specifically designed to correct errors introduced by the non-ideal phase characteristics of the input
read head. The typcial
b
3 dB point for this filter is around
1.5 times the highest recorded frequency. The design of this
filter is complex and will not be discussed here. However,
the following discussion does give a feel for some of the
considerations involved in the filter design. The reader is
referred to reference
Ý
3 listed at the end of the Applica-
tions Notes for further filter design information.
Figure 10
shows a typical Region 1 waveform where there is
no bit interaction. This waveform is primarily the sum of the
fundamental frequency and its 3rd harmonic (higher odd
harmonics are present when there is more shouldering).
If the filter is to preserve this wave shape (this would be the
case if no read/write head phase compensation were necessary) then the phase relationship between the fundamental frequency and its harmonics must not be altered.
Figure
11
shows the output when the 3rd harmonic has the proper
magnitude, but the phase relationship is not maintained.
The result is that the output waveform is not the same
shape as the input (in a severe case it may be almost unrecognizable) and the time position of the peaks has been altered.
One electrical parameter which describes how well a filter
will preserve a wave shape is called group delay. Group
delay is defined as the change in phase divided by the
change in frequency. If the group delay is constant over the
TL/F/5283– 15
FIGURE 10. Typical Region 1 Waveform
TL/F/5283– 16
FIGURE 11. Region 1 Waveform with
the Incorrect Phase Relationship
frequencies of interest, then the wave shape will be maintained. An MFM coded signal will contain three basic frequency components for the various digital patterns of data.
For instance, a 10 Megabit/sec MFM signal will consist of
analog frequencies of 2.5 MHz, 3.33 MHz and 5 MHz. On
the outer track the bit density is the lowest and the 5 and
3.33 MHz signals will look sinusoidal while the 2.5 MHz signal will have a tendency to return to the baseline. This returning to the baseline is called shouldering and is illustrated
in
Figure 10
. Since this shouldering is rich in 3rd harmonicÐ
the 2.5 MHz signal will have a strong 7.5 MHz component.
The 10 Megabit/sec MFM signal will therefore have
2.5 MHz, 3.33 MHz, 5 MHz, and 7.5 MHz components which
must be filtered with constant group delay in order to reproduce the original waveform. For example, if the phase shift
through the filter at 2.5 MHz is 33.3
§
, then at 3.33 MHz the
phase shift must be 44.3
§
, at 5 MHzÐ66.6§, and at
7.5 MHzÐ99.9
§
. The group delay
di
dt
for this case is
13.32
§
/MHz. This can be better interpreted as a time delay.
33.3
§
of a 2.5 MHz signal is equivalent to (33.3/360)
c
(1/2.5 MHz) or 37 ns. Similarly, 66.6§on a 5 MHz signal is
(66.6/360)
c
(1/5 MHz)e37 ns.
The third order Bessel Filter as shown in the 10 Mbit/sec.
pulse pairing measurement board on the data sheet is designed for a constant group delay and a
b
3 dB point of
7.5 MHz. At this frequency the delay through the filter is 35
ns. The Gain Controlled Amplifier of the DP8464B is designed for a group delay of a 7.8 ns
g
0.5 ns for frequencies
up to 7.5 MHz. The 7.8 ns delay in the Gain Controlled
Amplifier and the 37 ns delay in the Bessel Filter do not
introduce any timing error, only a delay of 44.3 ns from the
Amp Input to the output of the filter.
DIFFERENTIATOR
A simplified circuit of the first stage of the differentiator is
shown in
Figure 12
. The voltages at V3 and V4 are simply
two diodes down from V1 and V2. Therefore the voltage
13

Application Information (Continued)
TL/F/5283– 17
FIGURE 12. Simplified Differentiator First Stage
across the external differentiator network (Cdin series with
R
d
) is the differential input voltage V1bV2. When Rdis
zero, the current through C
d
is IeCc(dV/dt) or C
d
c
(dVIN/dt). The Q2 collector current is the sum of the 1.8 mA
current source plus the current through C
d
or
1.8 mA
a
C
d
c
(dVIN/dt).
Similarly, the Q3 collector current is
1.8 mAbC
d
c
(dVIN/dt).
Therefore, the differentiator output voltage, V5bV6, is
1.5k
c2c
C
d
c
(dV
IN
/dt).
The input is at a peak when V5
bV6e
0V.
The differentiator network (Cdand Rd) should be selected
so the maximum current into the differentiator network is not
greater than the minimum current of I1 and I2 over temperature. In the electrical specifications, the minimum current is
specified for 1.4 mA (I
Cd
Current into Pin 1 and 24 that
discharges C
d
). For example, the highest analog frequency
in a 10 Megabit/sec, MFM signal is 5 MHz. Since the AGC
loop has forced the input to the differentiator to 2 V
PP
(which includes the 6 dB loss of the filter), then the voltage
across the capacitor (assuming R
d
is 0) is:
V
IN
e
1csin(2
cqc
5E6ct)
and
dVIN/dte1c2
cqc
5E6ccos(2
cqc
5E6ct)
and the maximum slope is
(dV
IN
/dt)maxe1c2
cqc
5E6e314E5 V/sec.
For this example, Cdcan now be calculated. Since IeC
c
(dV/dt), then for Ie1.4 mA, dV/dte314E5, then the
maximum C
d
must equal 45 pF. From this example, a follow-
ing simple design equation for the value of C
d
can be de-
rived.
C
d
e
445/(V
IN
c
f
max
)
where
C
d
is the maximum external differentiator capacitor in pF
VINis the peak to peak differential Time Channel input
voltage
f
max
is the maximum analog frequency in MHz
Note that this is the maximum value for the capacitor when
the series resistor R
d
is zero. The value of the capacitor can
be increased if a series resistor is used, but the maximum
current through the differentiator network must not exceed
1.4 mA. If too large a value for C
d
is used, the delay through
the differentiator will become dependent on frequency. This
will not show up in a single frequency test such as a test for
pulse pairing.
For the MFM code, the maximum analog frequency is (/2 the
data rate. For the (/2(2,7) code, the maximum analog frequency is (/3 the data rate. The above sinusoidal analysis is
valid as long as the highest frequency on the outer track is
nearly sinusoidal. If, however, there is significant shouldering of this signal then the value of C
d
should be reduced
accordingly.
The following table summarizes the value of C
d
to use for a
2V
pp
differential signal to the time channel input.
Data Rate Code Maximum Frequency C
d
5 mbits/sec MFM 2.5 MHz 90 pF
5 mbits/sec 2,7 1.6 MHz 140 pF
10 mbits/sec MFM 5.0 MHz 45 pF
10 mbits/sec 2,7 3.3 MHz 67 pF
As noted above, the value of the capacitor can be increased
if a series resistor is used, but the maximum current through
the differentiator network must not exceed 1.4 mA. For example, the components used in the Pulse Pairing Setup
(see AC Electrical Specifications) are for a typical 10 Mbits/
sec MFM drive. The combination of the C
d
of 50 pF and the
R
d
of 430X gives a combined impedance of 768X at the
highest frequency of 5 MHz. This gives a maximum current
of 1.3 mAÐwell below the 1.4 mA limit.
A resistor is placed in series with C
d
in order to bandlimit the
differentiator response. This resistor also has an effect on
the phase linearity of the differentiator. An ideal differentiator produces an output that is 90 degree phase shifted from
the input regardless of the input frequency. The presence of
the series resistor produces an output phase shift that is
less than 90 degrees and changes with the input frequency.
This resistor can be used to correct for frequency related
phase problems encountered elsewhere in the read path.
14

Application Information (Continued)
To properly decode the information on the disk, the read
channel must determine if there is a peak (or a ‘‘1’’) during a
period of time called a detection window. The detection window for MFM and the (2,7) code is
1/(2
c
data bit rate).
This detection window must accommodate errors in many
parts of the system including filters, data separator, and
peak shift variations in the data pattern. The pulse pairing of
the DP8464B should be included in the error budget calculation.
Unequal delays through the bi-directional one shots will
contribute to pulse pairing. To minimize this effect, pin 2
should be connected to 22 and pin 23 should be connected
to 21. If connected this way, the delays tend to cancel. For
the PCC Package, Pin 26 to Pin 2, and Pin 25 to Pin 27.
DIFFERENTIAL COMPARATOR WITH HYSTERESIS
The actual peak detection is done in the time channel with
the differentiator. Unfortunately, the differentiator not only
responds to signal peaks but also responds to noise at the
baseline. In order to prevent this noise from generating false
data, the signal at the output of the Gain Controlled Amplifier is also passed through a gating channel which prevents
any output change before the input signal has crossed an
established level. This gating channel comprises a differential comparator with hysteresis and a D flip-flop. The hysteresis for this comparator is set externally via the Set Hysteresis pin. The amount of hysteresis is twice the voltage on the
Set Hysteresis pin. For instance, if the voltage on the Set
Hysteresis pin is 0.3V, the differential input signal must be
larger than 0.6V(
g
0.3V) before the output of the comparator will change states. The 0.6V hysteresis represents 30%
of a typical 2V differential input signal level to the
gating channel. The hysteresis level is usually set between
15% to 40% of the differential input signal.
The operation of the gating channel is shown in
Figure 13
.
At the top is a typical Region 1 waveform which exhibits
shouldering on the lowest frequency and is almost sinusoidal on the highest frequency. In this example, this waveform
is fed to both the timing and the gating channel. The hysteresis level (of about 25%) has been drawn on this waveform.
The second waveform is the output of the differentiator and
its bi-directional one shot. This is the waveform on the Time
Pulse Out pin. While there is a positive edge pulse at each
peak, there is also noise at the shoulders. In this example,
the Time Pulse Out is connected directly to the Time Pulse
In without any external delay. This output is therefore the
clock for the D flip-flop.
The third waveform in
Figure 13
is the output of the Comparator with Hysteresis which goes to the D input of the flipflop. The true peaks are the first positive edges of the Time
Pulse Out which occur after the output of the comparator
has changed states. The D flip-flop will ‘‘clock’’ in these
valid peaks to the output bi-directional one shot. Therefore,
the noise pulses (due to the differentiator responding to
noise at the baseline) just ‘‘clock’’ in the old data through
the flip-flop and the output does not change.
The Q output of the flip-flop drives the output bidirectional
one-shot which generates the positive edges corresponding
to the peaks. The width of the data pulses can be controlled
by an external capacitor from the Set Pulse Width pin to
ground. This pulse width can be adjusted from 20 ns to (/2
the period of the highest frequency. Typical values for this
capacitor are 20 pF for a 25 ns pulse width to 100 pF for a
100 ns pulse.
TL/F/5283– 19
FIGURE 13. Time and Gate Channel Operation for Region 1 Signals
15

Application Information (Continued)
PULSE DETECTOR OPERATION IN REGIONS 1 AND 2
Figure 14
shows the input waveform for the lowest frequency followed by the highest frequency for an MFM code. In
MFM the highest frequency is twice the lowest frequency.
The outer track has the least flux changes per inch (FCI)
and is illustrated in the waveforms at the top. There is so
much room between the pulses that the signal returns to the
baseline for the lowest frequency while there is shouldering
at the highest frequency. As you go towards the inner track,
the pulses become more crowded and bit interaction occurs. At the third curve down (N
c
1.7 FCI), there is shouldering at the lowest frequency while the highest frequency
is almost sinusoidal. At higher bit densities, the lowest frequency looks sinusoidal, while the highest frequency is decreasing in amplitude. In
Figure 14
, the first three waveforms are examples of Region 1 operation (very little
change in amplitude with frequency). The last two waveforms are examples of Region 2 operation.
In a disk system, the bit density changes about a factor of
1.7 between the inner and the outer track. For instance, if
the input waveform for the F-2F signal on the inner track of
a system looks similar to waveform
Ý
4in
Figure 14
(N
c
2.2 FCI), then the outer track will have a bit density that is
approximately N
c
2.2/1.7 or Nc1.3 FCI. This is shown in
the second waveform. Tracks half the way in will have a bit
density of the average between the inner and outer tracks,
in this case N
c
1.7 FCI which is illustrated in the third
waveform. Note that the analog waveforms change considerably with track location. Self-gating circuits (‘‘desnakers’’)
can be used in MFM systems which operate in these last
three curves (from N
c
1.7 FCI to Nc2.9 FCI). If the FCI
becomes much less, the shouldering on the lowest frequency will let in too much noise. If the FCI is increased, the peak
resolution gets very poor. Now we can compare these
waveforms to longer run length limited codes.
Figure 15
shows the analog waveform for the lowest frequency followed by the highest frequency for a 2,7 code. In
the 2,7 code, the frequency range is from F to 2.66
c
F.
Unlike the MFM code, there is no region where the self-gating ‘‘desnaker’’ will work on both the inner and outer tracks.
TL/F/5283– 20
FIGURE 14. MFM F-2F Pulse Waveforms
for Various Flux Changes per Inch
TL/F/5283– 21
FIGURE 15. F-2.66cF Pulse Waveforms
for Various Flux Changes per Inch
16

Application Information (Continued)
The simplest operation is for systems operating entirely in
Region 1, that is, no amplitude reduction between the highest and the lowest frequency at the inner track. The inner
track is specified because the pulse interaction is most severe on the inner track. For Region 1 operation, only the
Time Channel filter is required, so the Gate Channel Input is
connected to the Time Channel Input. Since no external
time delay is required to align the time and gate channels,
the Time Pulse Out is connected directly to the Time Pulse
In. The Region 1 connection is shown in
Figure 2
. The inter-
nal timing for this operation is shown in
Figure 13
.
If there is significant amplitude reduction at the highest frequency, the peak detection becomes more complex. If the
worst case waveform is like the fourth waveform on
Figure
14
, then the Region 1 connection might still work satisfactorily. However, if the input begins to approach the fifth waveform, this system configuration will completely fail. One
problem is that the AGC will respond to the frequency dependent amplitude modulation and distort the waveform.
Figure 16
illustrates this problem which is encountered in
systems operating in Region 2. If the input digital pattern
suddenly shifts from a high frequency to a low frequency,
the bit density may shift from the 70% level on the BPI
curve of
Figure 1
to a point at 90% on the BPI curve. As
shown, the AGC loop is correcting for this frequency-induced change in amplitude by quickly decreasing the amplifier gain. The situation gets worse if the input digital pattern
shifts back to a high frequency. The AGC loop now cannot
quickly increase the amplifier gain, so the output waveform
will very slowly increase. The AGC response to frequency
related amplitude change is not desirable since the AGC is
now distorting the input waveform. This can be prevented by
inserting a lead network between the Gain Controlled Amplifier’s output and the AGC input, as shown in
Figure 17
. This
will increase the amplitude of the higher frequency into the
AGC, thereby preventing the AGC from changing gain.
Another problem encountered in Region 2 operation is that
the amplitude of the highest frequency may be so low that it
may not trip the hysteresis level. If this happens, these
peaks would not be gated on to the output. This problem
can also be corrected by placing a separate filter to the
gating channel which will make the amplitude of the highest
frequency equal the amplitude of the lowest frequency. This
is illustrated in the following example.
Consider a disk system which uses the 2,7 code and has an
input at the inner track which looks like the fifth waveform in
Figure 15
. Since the flux density on the outer track is 1/1.7
times the flux density of the inner track, the outer track
waveform will look like the third waveform. One filter cannot
perfectly compensate both these extremes, so we design to
compensate a waveform between these two. The track
which is )/3 of the way in towards the inner track is a good
compromise. The filter in this example is a single zero
placed such that the lowest frequency followed by the highest frequency have the same amplitude on the track )/3 of
the way in.
Figure 18
shows the operation of the inner track
of this example. While the gating channel filter has made
the amplitudes of the two frequencies nearly the same, the
time relationship to the Time Channel Input has not been
preserved. The proper operation is to have the positive
edge of the signal at the Time Pulse In pin, which corresponds to a peak, be the first positive edge after the output
of the comparator has changed states. This can be accomplished either of two ways. One way is to insert an external
delay between the Time Pulse Out and the Time Pulse In as
shown in
Figure 18
. The required delay can be determined
by comparing the Time Pulse Out to the Channel Alignment
Output with both external filters in the circuit. Another way is
to design the Time Channel Filter with more group delay.
This will probably require additional poles.
Figure 19
shows the outer track operation of our example.
Notice how the system has taken care of the shoulder-induced-noise on the Time Pulse Out. The external delay has
shifted the Time Pulse In so the noise is not clocking in new
data to the flip-flop. It is important to select this delay such
that the positive edge corresponding to a signal peak is always the first positive edge after the output of the comparator has changed states.
While the gating filter has equalized the amplitudes between
the highest and the lowest frequency, the amplitude between the inner and the outer track has not been held constant. This can be seen by comparing the Gate Channel
Input between
Figure 18
and
Figure 19
. In order to avoid
saturating the Gain Controlled Amplifier, the voltage on the
V
REF
pin must be set so that the voltage out of the Gain
Controlled Amplifier is 4 Vpp or less for all tracks. The low
frequency signal on the inner track contains far more fundamental frequency than the low frequency signal on the outer
track. Consequently, the low frequency inner track signal
will experience more attenuation than the low frequency
outer track signal in passing through the gating channel filter which, for this example, has been optimized to pass
higher frequencies. The AGC tends to hold the input to the
gating channel constant for a fixed V
REF
level. Therefore
the largest output from the Gain Controlled Amplifier is for
the low frequency inner track signal. The voltage on V
REF
should be adjusted so that the differential output swing of
the Gain Controlled Amplifier is 4 Vpp maximum for this
signal. This means that the output voltage on the outer track
will be less than 4 Vpp.
TL/F/5283– 22
FIGURE 16. Improper AGC Response to Region 2 Signal
17

Application Information (Continued)
TL/F/5283– 23
FIGURE 17. Circuit Connection for Region 2 Operation
18

Application Information (Continued)
TL/F/5283– 24
FIGURE 18. Region 2 Inner Track Operation
TL/F/5283– 25
FIGURE 19. Region 2 Outer Track Operation
19

Application Information (Continued)
Another troublesome input pattern which should be investigated is a high frequency triplet surrounded by the lowest
frequency as shown in
Figure 20
. Since the center bit of the
triplet does not rise very much above the baseline, there is
the possibility it will not trip the hysteresis level. This pattern
should be checked to ensure the gating channel filter raises
this center bit enough for the proper operation of the gating
channel. The operation of the triplet in the previous example
is shown in
Figure 21
.
LAYOUT CONSIDERATIONS
Figure 22
is a top view of the component layout for the
DP8464B application board whose schematic is shown in
Figure 23
. Care must be exercised in the board layout in
order to isolate all digital signals from analog signals. The
layout shown in
Figure 22
is a good example of what is
required in this regard. In particular the Amp. In pins (pins 6
and 7) and the C
DIFF
pins (pins 1 and 24) must be isolated
from all digital signals. An analog ground plane will greatly
aid in this isolation as will separate digital and analog
grounds. The V
CC
(pin 9) should have a 0.1 mf bypass capacitor to analog ground located close to the DP8464B. The
component list is provided as an example. These components will need to be optimized for a specific read channel.
TL/F/5283– 26
FIGURE 20. (2,7) Triplet
TL/F/5283– 27
FIGURE 21. Region 2 Triplet Operation
20

Application Information (Continued)
TL/F/5283– 28
FIGURE 22. DP8464B Component LayoutÐTop View
21

Application Information (Continued)
TL/F/5283– 29
FIGURE 23. DP8464B Application Board Schematic
22

Application Information (Continued)
PARTS LIST FOR DP8464B BOARD
Component Note
Function
Value for Value for
Name
Ý
Value 5 Mbits/sec 10 Mbits/sec
R2 3 Adjustment for V
REF
(AGC amplitude) 1k pot
R3 3 Adjustment for Set Hyst. (threshold) 1k pot
R4 2 Adjustment for differentiator network Q 5k pot
R5 1 Low pass filter resistor 560X
R6 1 Low pass filter resistor 240X
R7 1 Low pass filter resistor 240X
R8 Amp Out emitter bias resistor 4.3k
R9 Amp Out emitter bias resistor 4.3k
R10 Pull down resistor for Read/Write Pin 5.1k
R11 Resistor in parallel with C
AGC
100k
R12 Encoded Data Out damping resistor 51X
R13 Read/Write damping resistor 51X
R14 Divider network for Set Hyst. and V
REF
2.4k
R17 6 Series resistor for Time Channel Input Not required on DP8464B
R18 6 Series resistor for Time Channel Input Not required on DP8464B
C1 V
REF
cap 0.1 mF
C2 Set Hyst. cap 0.1 mF
C3 2 Differentiator cap 100 pF 50 pF
C4 Time and Gate Channel In coupling cap 0.01 mF
C5 Time and Gate Channel In coupling cap 0.01 mF
C6 1 Low pass filter cap 200 pF 100 pF
C7 1 Low pass filter cap 30 pF 15 pF
C8 4 C
AGC
cap 0.01 mF
C10 V
CC
cap 1.0 mF
C11 V
CC
cap 0.1 mF
C13 5 Amp In coupling cap 2200 pF
C14 5 Amp In coupling cap 2200 pF
C16 Set Pulse Width cap 100 pF 50 pF
L1 2 Differentiator inductor 3.6 mH 1.6 mH
L2 1 Low pass filter inductor 10 mH 4.7 mH
L3 1 Low pass filter inductor 10 mH 4.7 mH
BREADBOARD OPERATION NOTES
1. The low pass filter is a 3 pole Bessel with the corner
frequency at 3.75 MHz for the 5Mbits/sec board (7.5
MHz for the 10 Mbits/sec board).
2. The differentiator is a simple RLC filter with the break
frequency at 8.5 MHz for the 5 Mbits/sec board (17 MHz
for the 10 Mbits/sec board). The resistor can be adjusted
to correct for phase distortion in the channel.
3. The V
REF
should be set at 0.5V. Since the low pass filter
hasa6dBloss, the signal on AMP OUT is 4 Vpp differential while the amplitude into the gate channel is 2 Vpp
differential. The Set Hyst. should be nominally set at
0.3V.
4. The AGC attack time (the response to an increased input
amplitude) is about 2 ms. To increase this time, increase
the value of C8 (the AGC capacitor). The AGC decay time
(the response to a decrease in amplitude) is about 10 ms.
To increase this time, increase the value of R11. Care
must be taken to not allow the response of the AGC loop
to become too fast, otherwise loop instability may occur.
5. The input pole is set at 72 kHz (1k input impedance and a
2200 pF input coupling capacitor).
6. Pulse pairing (described in the differentiator section of
this data sheet) can be caused by unequal delays through
the Bi-directional one shots. To minimize this effect, pin 2
should be connected to pin 22, and pin 23 should be
connected to pin 21. If connected this way, the delays
tend to cancel.
REFERENCES
1. I. H. Graham, ‘‘Data Detection Methods vs. Head Resolution in Digital Recording,’’ IEEE Transactions on Magnetics Vol. MAG-14, No. 4 (July 1978)
2. I. H. Graham, ‘‘Digital Magnetic Recording Circuits,’’ to be
published.
3. Anatol I., Zverev, Handbook of Filter Synthesis, John Wiley & Sons publisher, 1967.
23

Connection Diagrams (Continued)
TapePak
É
TL/F/5283– 31
Top View
Order Number DP8464BTP-3 or DP8464BTP-2
See NS Package Number TP40A
24

Physical Dimensions inches (millimeters)
Molded Dual-In-Line Package (N)
Order Number DP8464BN
NS Package Number N24C
25

DP8464B Disk Pulse Detector
Physical Dimensions inches (millimeters) (Continued)
Plastic Chip Carrier (V)
Order Number DP8464BV
NS Package Number V28A
LIFE SUPPORT POLICY
NATIONAL’S PRODUCTS ARE NOT AUTHORIZED FOR USE AS CRITICAL COMPONENTS IN LIFE SUPPORT
DEVICES OR SYSTEMS WITHOUT THE EXPRESS WRITTEN APPROVAL OF THE PRESIDENT OF NATIONAL
SEMICONDUCTOR CORPORATION. As used herein:
1. Life support devices or systems are devices or 2. A critical component is any component of a life
systems which, (a) are intended for surgical implant support device or system whose failure to perform can
into the body, or (b) support or sustain life, and whose be reasonably expected to cause the failure of the life
failure to perform, when properly used in accordance support device or system, or to affect its safety or
with instructions for use provided in the labeling, can effectiveness.
be reasonably expected to result in a significant injury
to the user.
National Semiconductor National Semiconductor National Semiconductor National Semiconductor
Corporation Europe Hong Kong Ltd. Japan Ltd.
1111 West Bardin Road Fax: (
a
49) 0-180-530 85 86 13th Floor, Straight Block, Tel: 81-043-299-2309
Arlington, TX 76017 Email: cnjwge@tevm2.nsc.com Ocean Centre, 5 Canton Rd. Fax: 81-043-299-2408
Tel: 1(800) 272-9959 Deutsch Tel: (
a
49) 0-180-530 85 85 Tsimshatsui, Kowloon
Fax: 1(800) 737-7018 English Tel: (
a
49) 0-180-532 78 32 Hong Kong
Fran3ais Tel: (
a
49) 0-180-532 93 58 Tel: (852) 2737-1600
Italiano Tel: (
a
49) 0-180-534 16 80 Fax: (852) 2736-9960
National does not assume any responsibility for use of any circuitry described, no circuit patent licenses are implied and National reserves the right at any time without notice to change said circuitry and specifications.
 Loading...