

Page 1

KKOODDAAKK PPRROOFFEESSSSIIOONNAALL
ENDURA Papers
DDeeffiinniinngg PPrriinntt LLiiffee::
TThhee ccrriittiiccaall bbaallaannccee ooff lliigghhtt
aanndd tthheerrmmaall ssttaabbiilliittyy
© Eastman Kodak Company, 200
.
7
Page 2

KODAK PROFESSIONAL ENDURA Papers
The following pages discuss light and thermal
stability as they apply to Kodak’s newest generation
of professional color negative papers, KODAK
PROFESSIONAL SUPRA, SUPRA VC Digital, and
LTRA ENDURA and ENDURA Metallic papers.
U
Since the earliest days of photography, people have
wanted to increase the stability and extend the
ongevity of captured images. As the medium
l
evolved, ongoing improvements in image stability, as
well as the discovery of new challenges to image
stability, have been the rule.
The introduction of KODACHROME Film for color
movies and slides in the 1930s brought new stability
challenges related to color. In 1942, Kodak
announced KODACOLOR Film for prints,
the world’s first true color negative film. The
advancements of color technology into prints allowed
color photography to expand rapidly
into the professional portrait/social and consumer
environments.
It was at this time that Kodak recognized the need
for dedicated testing facilities to examine the
stability of images. Since then, the company has
invested in and expanded its testing capability
continuously for over 50 years.
As advances in technology have improved image
stability and reduced major concerns, new, more
subtle c
silver halide-based photographic materials of all
manufactur
need for more precise measurements of image
stabilit
have also brought a need for a better understanding
of these factors:
•
• how the different uses of images affect
The following pages discuss these factors as
they apply to Kodak’s newest generation of
prof
PROFESSIONAL SUPRA, SUPRA VC Digital, and
ULTRA ENDURA and ENDURA Metallic Papers, and
will cover the f
oncerns have arisen. In the last 15 years, the
s have improved significantly, creating a
er
er time periods. New technologies
er long
v
y o
omplexities of how images on modern
the c
photographic print materials fade
e
e lif
imag
sional color negative papers, KODAK
es
opics:
wing t
ollo
ow materials are processed and used by finishing
• h
laboratories
• how prints are used and stored by the end-user
• what image stability means today
• the importance of the ways in which image stability is
easured and interpreted
m
Note: In this discussion of image stability, we
ssume that the process conditions in the finishing
a
lab meet specifications set by the manufacturer of
the photographic material. A process that does not
meet specifications can have an impact on image
stability that is as large as or larger than any of the
variables discussed here.
Philosophy of Product Design
Obviously image stability is a decisive factor in the
design of color photographic paper. In fact, it would
be possible to design a paper solely to optimize
image stability. However, designing and optimizing
for a single criterion such as image stability will
often degrade other key factors.
During the last 20 years, the design of Kodak silver
halide color papers has been driven by a three-prong
strategy, coupled with continuous improvement.
While a typical Kodak color paper has more than 60
individual design parameters, we follow three major
design criteria:
• image quality today
• image quality tomorrow (i.e., print longevity)
• ease of use in the finishing lab
In many instances, trade-offs between the major
crit
eria would be possible. For example, excellent
image quality with accurate color and pleasing flesh
eproduction depends on the image dyes formed by
r
the paper, so color and flesh reproduction could be
omised t
ompr
c
dyes optimized for image stability can be more
process-sensitive, which can cause difficulties for the
finishing lab.
o achie
ve good dye stability. Similarly,
• objectives in the design of photographic materials
1
Page 3

KODAK PROFESSIONAL ENDURA Papers involve no
24°C
years
100
log days
Inverse Kelvin
.0034.0033.0032
.0031
.003.0029.0028.0027
5
4
3
2
1
uch trade-offs. Both the dye set used and the
s
emulsions and curve shape drive short-term and
long-term image quality, as well as ease of handling
and processing.
Kodak has supplemented its three-prong design
philosophy with continuous improvement between
major development programs. Ongoing
improvements keep products fresh by adding new
technology as it becomes available. Over the last 20
years, we have made a multitude of improvements
in image quality and lab operations in addition to
image stability.
As the stability of papers improves, the testing
ecomes more complex. Predictions of image
b
stability are based on accelerated testing, and the
accuracy of predictions depends entirely on
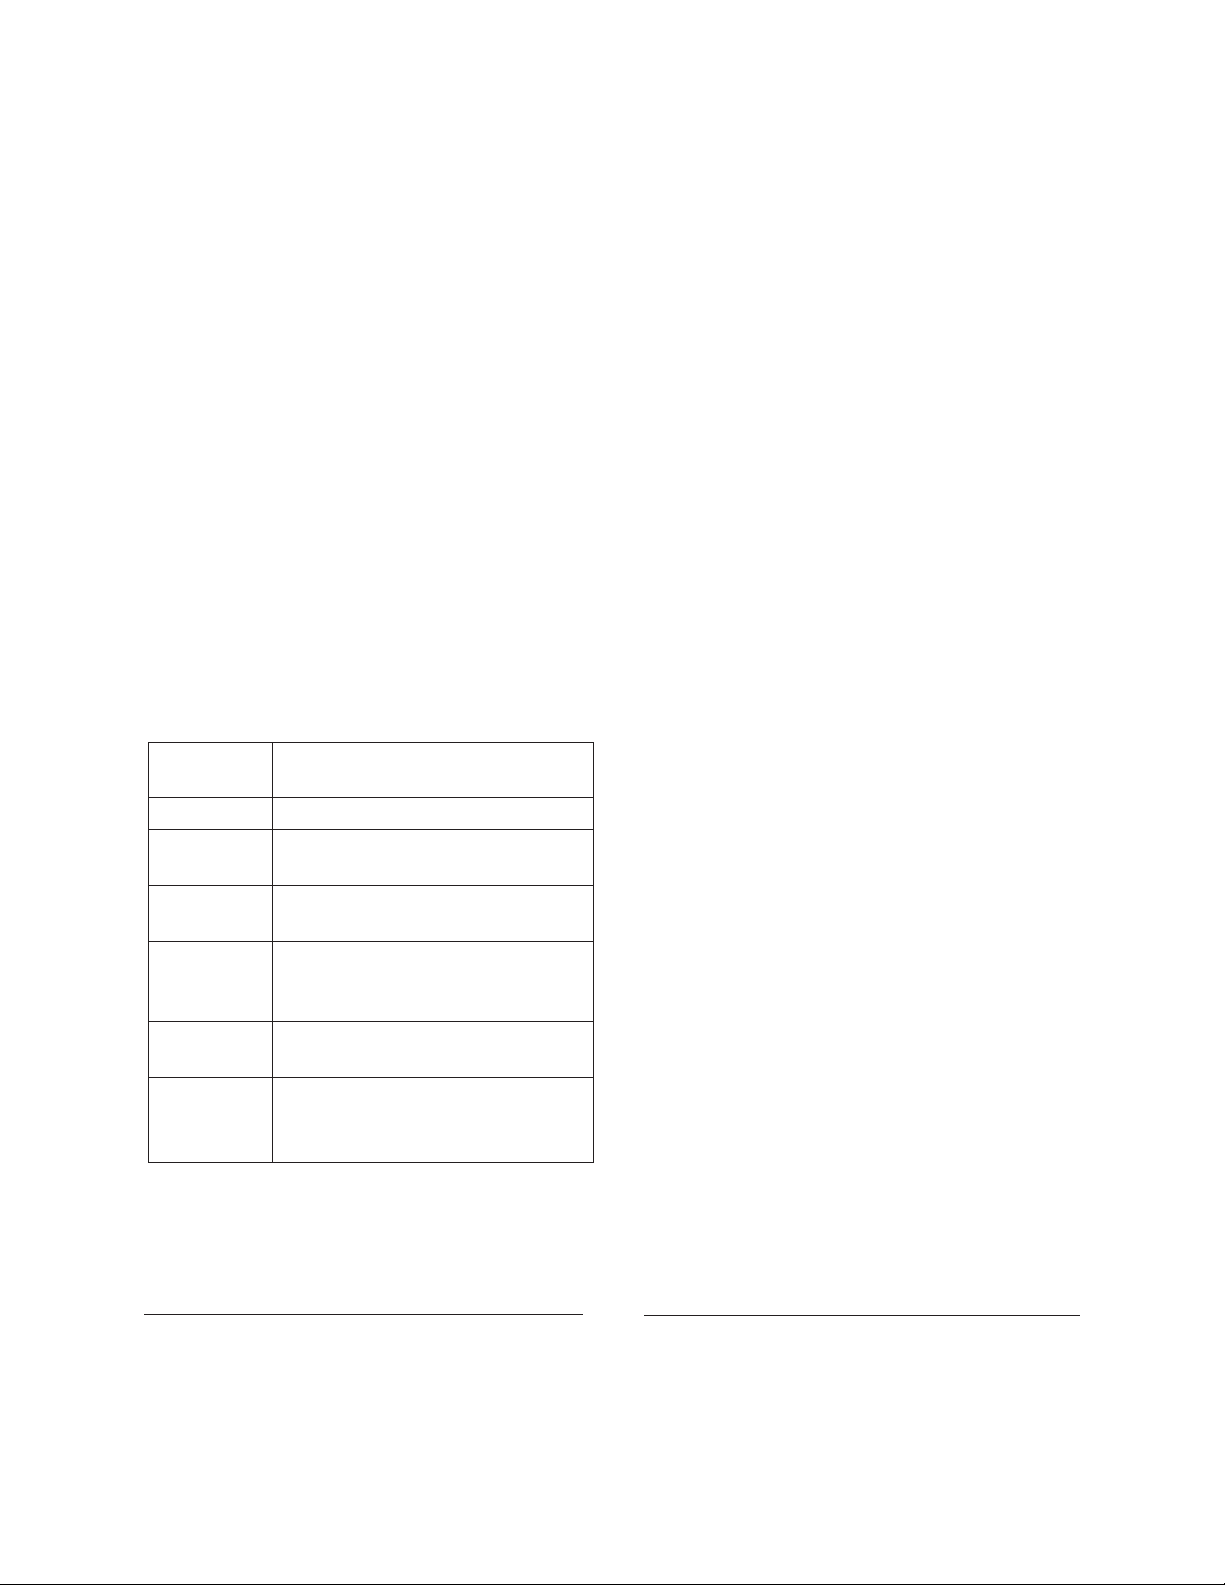
generating test data that are low in noise. Figures 1
and 2 show a hypothetical example of two different
apers tested for thermal stability. One paper is
p
more stable than the other, but because of time
imitations, both samples were tested for one year.
l
Figure 1
Four-Point Prediction
—Linear Fit
KODAK PROFESSIONAL ENDURA Papers, however,
are truly revolutionary. Made with advanced dye
technology, they represent a major leap forward in
Linear Fit
Log Days = 13.04666 + 5229.7488 Inverse Kelvin
image stability and print life without sacrificing
image quality, while also enhancing ease of use in
the lab
.
In the professional market, flesh reproduction is the
paramount image-quality criterion. In many color
papers optimized for image stability, image quality
and flesh reproduction suffer. But the three new
dyes in KODAK PROFESSIONAL ENDURA Papers
have been optimized for excellent image stability
without degrading color reproduction or flesh
reproduction. SUPRA ENDURA Paper has additional
patented technologies specifically designed to
optimize flesh reproduction through modifications
es combined with precise curve-
o the imag
t
e dy
shape control in the emulsions.
Testing Methodology and Modern
aper C
P
Stabilit
major degradation pathways, and includes testing
for light fade, thermal fade (degradation due to
heat, often referred to as “dark fade”), and base
omponents
y testing of c
olor paper
s focuses on the
igur
F
enerat
g
e 1
s four data points based on fade
w
sho
ed from four high-temperature conditions.
The points form a straight line with a high linear
correlation coefficient, and the extrapolated
prediction of room-temperature performance is 100
years. Given the correlation and the statistically
calculated error from this extrapolation, the high
w limit around the predicted 100 years is plus
and lo
he actual performance may be
or minus 40 y
ears. T
as high as 140 years or as low as 60.
degradation. Although we will not discuss the
specifics of imag
important to understand the major challenges in
e-stabilit
y testing here, it’s
performing the tests correctly and in interpreting
est data.
the t
2
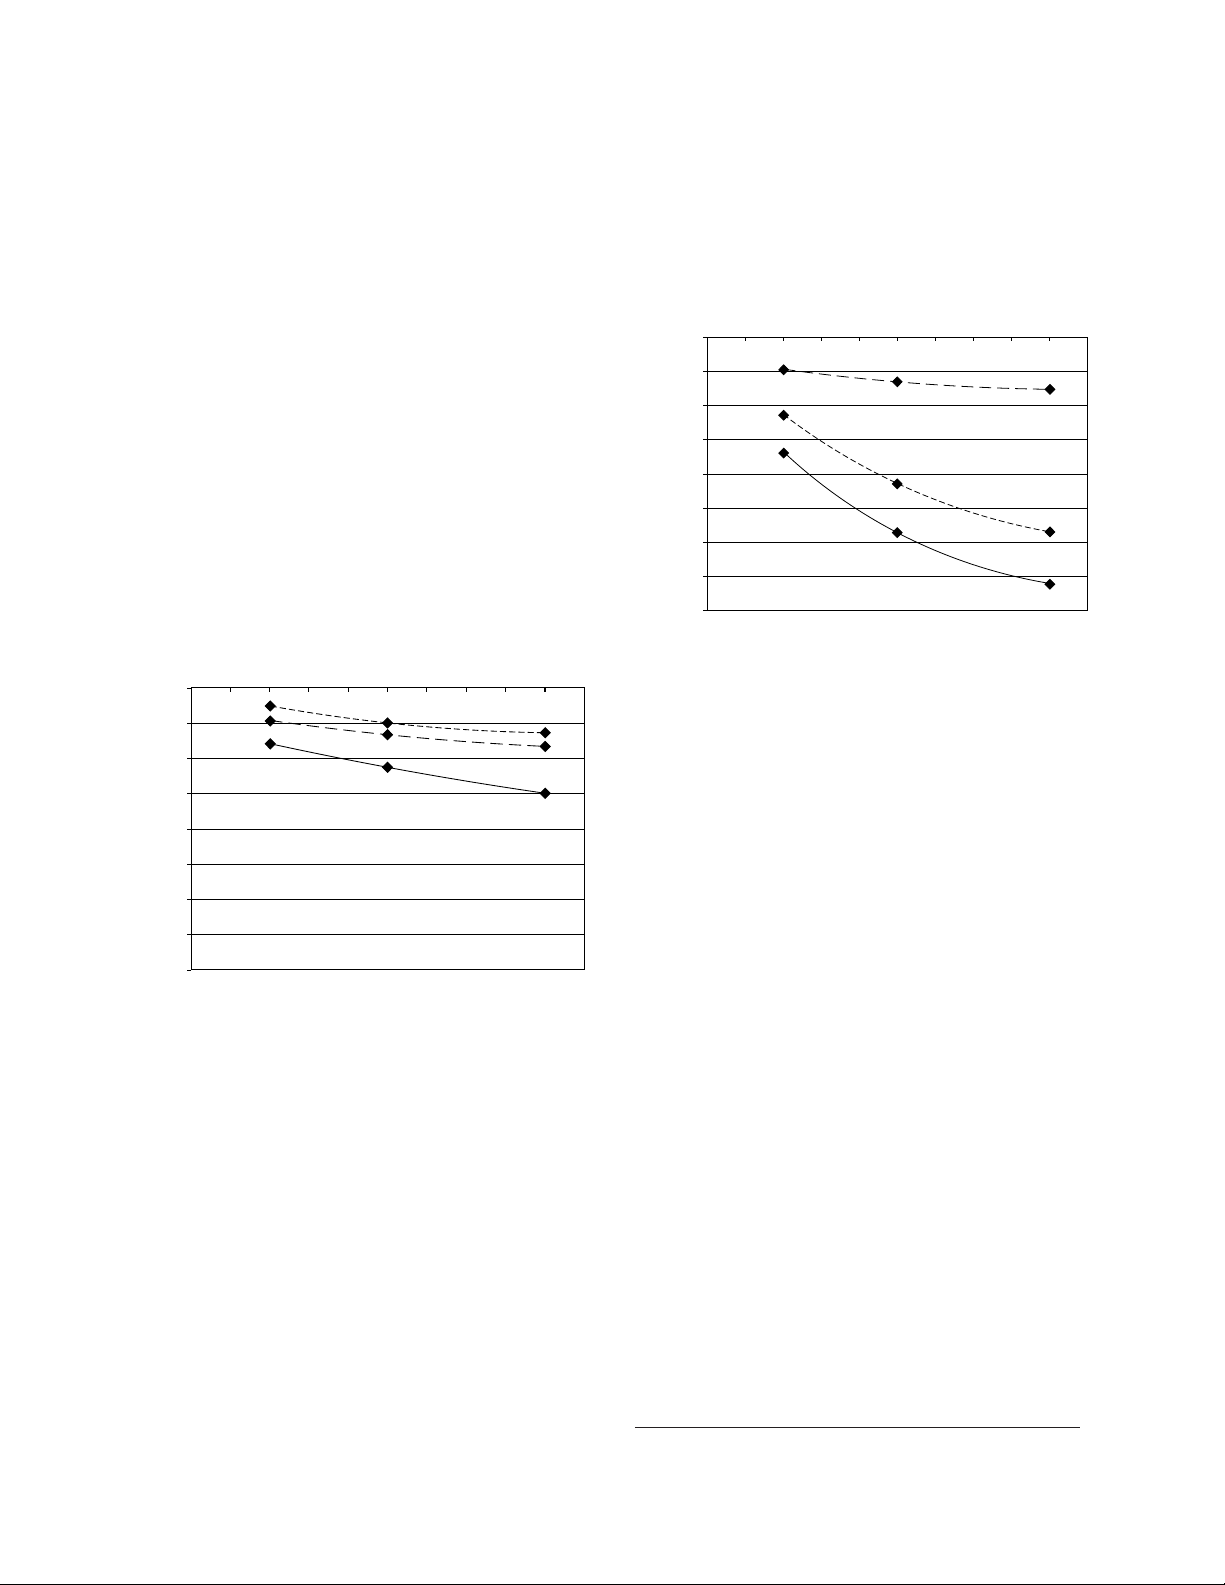
Page 4

log days
Inverse Temp
.
0034.0033.0032
.0031
.
003.0029.0028.0027
5
4
3
2
1
24°C
y
ears
200
Figure 2
Bivariate Fit of Log Days by Inverse Temp
testing, which predicts a material’s stability over
00 years, is used. Because the test is so highly
1
accelerated and run in such a short time, it cannot
detect the impact of ambient ozone. Only after
images were displayed in the real environment,
which included low levels of ambient ozone, was the
rue stability determined. Then it turned out that
t
product stability was measured in weeks, not years.
As Kodak added new resin stabilizers to increase
the stability of the paper base, Kodak scientists
encountered another example of a test becoming
difficult to use because of noise in the data. The
then-current accelerated test to measure cracking
and crazing of the resin was no longer generating
—Linear Fit
Linear Fit
Figure 2 shows a straight-line extrapolation to 200
years. However, because the paper is more stable
than that in Figure 1, only three data points are
available. Because of noise, the three points are
scattered around the predicted straight line. With
only three points and the higher noise, the
correlation is lower and the error band is higher. So
while the straight-line extrapolation predicts a
performance of 200 years, the statistically
calculated error is very wide and quite nonlinear.
According to the plot, the paper could last as long
as 600 y
running the test for a longer period of time would
v
e
more precise prediction with less error around the
pr
In light-fade testing, using only highly accelerated
tests can lead to significant errors because of
ecipr
r
we now know that some inkjet materials are highly
susceptible to image fading due to very low levels of
ambient ozone in the atmosphere.
outcome when only high-intensity light-fade
ears or as few as 50. In this example,
entually g
enerate a fourth data point to give a
ediction.
ocity and other external factors. For example,
1
Consider the
the normal response of cracks that would predict
long-term resin stability. Instead of trying to
accelerate the test further and risk the creation of
even more noisy, possibly erroneous data, Kodak
scientists looked to the molecular level for a
predictive mechanism. They made measurements of
the actual decay of the resin molecules and found
that those measurements provided a good
correlation to the prediction of long-term resin
stability.
In these times when companies, including Kodak,
introduce new products at a faster pace, it is
tempting to run image-stability tests for shorter
times with greater acceleration and noisier data. It
would be even worse to use the high end of the
statistical noise to promote a product as more
stable than it really may be.
t Kodak we do neither. We continue to run highly
A
accelerated light- and thermal-fade screening tests,
using high light levels and high temperatures.
, we verify the results with less accelerated
er
v
e
How
tests by using lower light levels and lower
temperatures. Although these tests take
significantly longer, often more than a year, the data
is much more reliable. We use only this data to
support product claims for image stability. We take
xtra time to generate reliable data because
the e
1
D.E. Bugner, D. K
Reciprocity Failure Resulting from the Accelerated Fade of Inkjet Photographic
Prints,”
Technology,
opperl, and P
Proceedings of IS&T’s 12th International Symposium on Photofinishing
2002, pp. 54–57.
. Artz, “Further Studies on the Apparent
3
Page 5

of our commitment to report image-stability data
ccurately and to maintain integrity and credibility
a
with our customers.
These same four degradation mechanisms also
pply to inkjet materials. However, we must also
a
consider other mechanisms:
Kodak is very confident in the revolutionary image
tability of KODAK PROFESSIONAL ENDURA
s
Papers. To further demonstrate this confidence we
commissioned a major study with the Image
Permanence Institute at the Rochester Institute of
Technology. Through this study, we not only
achieved independent substantiation of Kodak’s own
internal testing, but learned that in fact our intrnal
claims were conservative.
Defining Print Life—
Degradation Mechanisms
Defining print life requires information on the
mechanisms that degrade prints and which
mechanism first becomes limiting. This often
requires knowledge of the environment in which the
image is stored or displayed, because different
degradation mechanisms may outweigh others in
different environments.
In silver halide-based color papers, four
mechanisms contribute to determining print life:
• degradation of the dyes caused by heat
• degradation of the dyes caused by light
• yellowing of the minimum densities (D-min) due
to light or heat
• ambient moisture (relative humidity)
• atmospheric pollutants
• direct water contact
• fingerprinting
A multitude of tests, reports, and conclusions from
many sources have described the significant
advancements made in inkjet light stability.
However, while the thermal stability of most inkjet
systems is quite good and very significant
improvements in colorant stability due to light
exposure have occurred, promotion of products
based on light-stability testing is extremely
misleading when it ignores the other important
degradation mechanisms. To describe print life
accurately requires taking all degradation
mechanisms int
o account. A material could have
excellent light- and thermal-fade performance but
poor print life if the colorant stability is poor when
exposed to moisture or atmospheric pollutants.
For a more detailed discussion of the degradation
mechanisms and image-stability performance of
2,3
Kodak inkjet materials, see the references
below
as well as the technical papers found at:
http://www.kodak.com/eknec/PageQuerier.jhtml?p
.
q-locale=en_US&pq-path=98#technical_papers
.
adation of the resin base
degr
•
ample, a resin-based color paper may have
x
or e
F
very high light stability but only mediocre resin
y in the base. It will perf
stabilit
orm very w
ell in
tests for light stability. However, if it is stored in an
environment where the base degrades faster than
omes
the dy
ellent light stabilit
c
es, ex
y bec
meaningless. In this example, degradation of the
resin base is the limiting mechanism.
4
It is extr
emely important to recognize that
the life of the image may not necessarily be limited
by the stability of the image dyes. A manufacturer
who talks about “dye stability” or “light stability”
alone, or who uses only light-fade data to describe
the performance of a product, is very likely not
esenting an accurate prediction of print life.
pr
2
D.E. Bugner and C.E. Romano, “Printing Memories to Last a Lifetime:
standing Imag
Under
ger Magazine, 13(1), 2001, pp. 134–140.
echar
R
3
D.E. Bugner and P. Artz, “A Comparison of the Image Stability of Digital
Photographic Prints Produced by Various Desktop Output Technologies,”
Proceedings of the International Conference on Imaging Science 2002,
2002, pp. 308–310.
e Stabilit
or Ink Jet P
y f
rints,”
Page 6
Criteria for Defining Print Life
t is very important to know which degradation
I
mechanism is the limiting mechanism in any given
torage environment. It is also important to know
s
the print-life criteria being used in reporting print
life. The print-life criteria determine “how bad is
bad”—for example, when a consumer would take a
print down and throw it away.
Kodak uses the illustrative criteria stated in the
ANSI/ISO standard, which places dye-fade limits at
,5
60%
4
Internal studies done by Kodak
6
Correlated Visual Impact
Very slight—noticeable to an expert
only in a paired comparison
Slight—noticeable in a paired
comparison
Moderate—noticeable in single
original scene quality
ade with a single
eable f
Notic
stimulus, but not objectionable
ery noticeable fade with
V
a single stimulus; possibly
objectionable based on use
30 percent.
indicate that 30-percent fade is a conservative limit.
able 1compares dye-fade limits, consumer
T
descriptors, and consumers’ perceptions or
reactions.
Table 1
Approximate Correlation of Color Descriptors to
Dye Loss from 1.0 Density
Approximate
Dye Loss
0 to 10% Minimal
10 to 15%
15 to 20%
20 to 30% stimulus to a person familiar with
30 to 60%
Greater than
Depending on the scene content, fade levels below
bout 15 to 20 percent are usually not noticeable
a
without direct comparison to an unfaded reference
image. A fade level between 20 and 30 percent
could be considered noticeable without a non-faded
comparison, but typically would not be considered
bjectionable. Fade levels between 30 and 60
o
percent would not be objectionable; consumers
ould continue to value the image based on scene
w
content and emotional involvement.
Additional research continues to confirm that the
use of the 30 percent endpoint criteria is quite
conservative, and that levels of 60 percent or higher
can still be considered to fall within the acceptable
category. Generally, at fade levels above 70 percent,
the psychophysical studies behind this research
found that most prints would fall into the marginally
unacceptable category or worse.
Although it w
ould be possible to use a fade limit
7
greater than 30 percent and report longer print life,
Kodak takes a conservative approach with the 30percent upper limit. It is also important to note that
using a fade limit lower than 30 percent would
result in under-predictions of print life. For example,
a fade limit of 15 percent may be appropriate for
images in a museum, but is far too conservative for
typical consumer environments because a print at
this endpoint would only be slightly changed from
the original. Using a 15% endpoint would predict
print life that is only half of that predicted using a
30% criteria and would be very misleading. Many
onsumer
c
s would see little or no chang
e in a single
stimulus situation and calling this an endpoint could
cause needless concern and worry.
4
St
ANSI IT9.9-1996, and ISO 10977.
5
Stability of Colour Photographic Images—Methods for Measuring, ISO
Publication 18909-
6
D. Oldfield and G. Pino, R. Segur, J. Twist, “Assessment of the Current LightFade End-Point Metrics Used in the Determination of Print Life: Part I”,
Journal of Imaging Scienc
abilit
y of C
olor Phot
aphic Images—Methods for Measuring,
ogr
.
2006
, 48 (6), 2004, pp
echnology
e and T
. 495-501.
7
. Oldfield and J
D
Metrics Used in the Determination of Print Life: Part II”, Proceedings of
IS&T’s 2004 Conference on Archiving, pp. 36-42
. T
sessment of the Current Light-Fade Endpoint
As
wist, “
.
5
Page 7

Standards for Measuring Stability
nternational standards for measuring the stability
I
of color materials are contained in the ANSI/ISO
tandard Stability of Color Photographic Images—
S
Methods for Measuring
and ISO Publication 10977. An updated version of
this standard, ISO Publication 18909-2006, was
issued in 2006. Work currently under way in the
standards committee includes a new set of
publications to address the additional complexities
and degradation mechanisms found in non-silver
halide color materials.
A look thr
silver halide materials quickly reveals that the
testing and measurement of image stability is a very
complex science. The standard also provides
recommendations and guidance on interpreting and
using test data generated by the testing methods.
Why doesn’t the standard provide specific rules and
definitions on how to interpret the data? The
standard provides only general recommendations
and guidance because images in general have a wide
range of stability requirements based on intended
application, and are stored or displayed under a vast
range of conditions.
The standard strongly suggests that interpretation
of test data be based on the specific conditions
likely to be encountered as the product is used in
the real world. For example, the typical environment
for prints on SUPRA or SUPRA VC Digital ENDURA
Paper is a wall display or a wedding album kept in a
home. This is very different from the typical
vironment for prints on ENDURA Metallic Paper,
en
which is lik
purchase commercial display in a mall. It is logical
that the int
for these two very different products reflect the
different environments.
ough the current 60-page standard on
ely to be a high-int
erpr
, ANSI Publication IT9.9-1996
ensity point-of-
etation of the imag
e-stability data
Design for Real-World Conditions
odak has long recognized the importance of
K
product design based on customer use. KODAK
ROFESSIONAL SUPRA and SUPRA VC Digital
P
ENDURA Papers are designed to be used by endconsumers in the home. These papers are designed
for “portrait and social” applications, i.e., formal
portraits and wedding pictures displayed in a home
or stored in albums.
Remember the three major design criteria: image
quality, print life, and performance in the finishing
lab. In the case of papers for portrait and social
applications, pr
without regard to real-world conditions and the
other two major design criteria, could result in many
trade-offs, even in print life itself. For example,
excellent high intensity light stability with mediocre
thermal stability would be a poor combination in
prints stored and displayed where light intensity is
low but thermal performance is significant.
Similarly, a trade-off in finishing lab operations—
such as permitting high sensitivity to chemical
activity levels to achieve good print life—would be a
poor choice.
KODAK PROFESSIONAL SUPRA and SUPRA VC
Digital ENDURA Papers are optimized for all three
major design criteria in the context of real-world
portrait/social applications. The design criteria for
KODAK PROFESSIONAL ULTRA and ENDURA
Metallic Papers are tailored to the needs of the
commercial display market.
Just as the design of KODAK PROFESSIONAL
ENDURA Papers reflects real-world conditions, any
testing and interpreting of stability data must also
reflect the environment in which the product will be
used and st
ait and social papers, like SUPRA and SUPRA
tr
por
VC Digital ENDURA Papers, without regard to real-
onditions can mislead labs in their choic
orld c
w
a color paper as well as photographers and
consumers in their choice of a finishing lab.
oduct design for print longevity,
ored. Reporting of stability results for
e of
6
Page 8

Some critics have discussed the use of independent,
ingle-condition, highly accelerated light- and dark-
s
8
fade tests as very misleading.
These tests are
useful for rapid screening of experimental dyes, but
are prone to possible errors (e.g., reciprocity in light
fade or reaction-mechanism shift in dark fade),
hich limits their reliability in predicting print
w
longevity. They don’t reflect real-world conditions
nd require very careful interpretation. This is true
a
not only because they are accelerated well beyond
the normal light and heat levels found in a home,
but because the data are often reported in isolation.
Running stability tests in a window gives even more
misleading results.
Because thermal stability is so important in the
portrait and social environment, testing and
reporting on light fade only, without considering the
impact of thermal stability, would be relevant only
to consumers who store their prints in a lighted
freezer.
9
Predominance of Thermal Stability in the
Portrait/Social Environment
Thermal stability, often called “dark stability,” is
driven by ambient temperature. This is especially
important in the portrait and social environment
where light levels are low. Thermal degradation,
even when prints are on display, predominates.
Note: Temperature can play a role in the commercial
or example,
f
vironment as w
en
in transmission display materials used on warm light
w
es. Ho
x
bo
display is relatively short (often three to 12
months). The thermal effects do not become
apparent because the light-fade
effects predominate.
ell—
ever, the time frame for a commercial
When you see the term “dark stability,” remember that it is
ot darkness that causes dyes to fade or D-min to turn
n
yellow; it is heat. Therefore, even when a print is on display
(unless it’s in that lighted freezer), thermal degradation is
taking place. Dark stability is actually the combined effects
of thermal fade and everything else that is not related to
10
owever, from the early history of color
ight fade.
l
H
photography through the early 1980s, thermal fade was
he principal mechanism.
t
Improvements to thermal stability have been
infrequent; but when they do come, they have been
very large:
• Kodak’s introduction of 5-ethyl-4,6-dichloro-2amidophenolic couplers resulted in a three- to
fourfold improvement in print stability. KODAK
EKTACOLOR Plus and Professional Papers first
used this new technology.
• The use of non-yellowing pyrazolotriazole (PT)
class magenta couplers virtually eliminated
yellowing of print D-min caused by both
temperature (thermal yellowing) and light (“printout” due to unreacted magenta coupler). Kodak
first used this technology in KODAK
PROFESSIONAL PORTRA III Paper.
• It was not until the invention of 2,5diacylaminophenol couplers that excellent thermal
stability combined with desirable color hue was
ed. Kodak invented these couplers and
v
achie
11
patented them in 1997.
KODAK EKTACOLOR Edge
8 Paper first used them in 1999.
8
R.E. McComb, “Separating Facts from Fiction: Examining Photo Prints,”
PhotoTrade News, February 1998.
9
Op. cit., R.E. McComb.
10
M. Oakland, D.E. Bugner, R. Levesque, and R. Vanhanehem, Proceedings Paper
from NIP 17,
11
U.S. Patent 5686235 (Nov. 11, 1997) and U.S. Patent 5962198
(Oct. 5, 1999).
2001, p. 175.
7
Page 9

Significant modifications of this most recent coupler
llowed its use in the critical professional markets,
a
i.e., in SUPRA and SUPRA VC Digital ENDURA
Papers. The successful commercialization of these
couplers produced a twofold improvement in
thermal stability over all earlier papers that use the
revious class of couplers.
p
Kodak papers that incorporate this patented coupler
technology have thermal stability that is twice as
good as that of any other silver halide-based color
photographic paper. For portrait and social
applications, which have a totally thermal-driven
environment (e.g., dark album storage), this means
that prints will last over 200 years before noticeable
fade occurs. In a typical home display environment,
it means that prints will last over 100 years before
noticeable fading occurs.
Light Levels
Because the large majority of prints in portrait and
social applications are stored in the dark, strong
thermal performance is a must. However, images are
displayed as well, and simultaneously undergo both
thermal fade and light fade. The longevity of the
paper will depend on the light levels that will be
encountered and the paper‘s stability to thermal
fade and light fade. Therefore, the design process
includes the balancing of thermal- and light-fade
mechanisms.
A study to measure actual light levels in homes has
documented 120 lux as the representative light
intensity for the home display category. This study
12
was first published in 1987
and repeated in 1991.
The conclusions were confirmed through a 10-year
study in which prints w
ere placed in people’s homes
around the United States, kept in places where
people typically display prints, and measured at
regular intervals. After 10 years, the level of fade
erified the pr
v
edict
vel based on 120 lux,
ed le
confirming that the 120 lux level is typical.
12
S. Anderson and G. Larson, “A Study of Environmental Conditions
omer Keeping of Photographic Prints,”
Associated with C
Journal of Imaging T
13
S. Anderson and R. Anderson, “A Study of Lighting Conditions Associated
with Print Displa
127–131.
ust
echnology
y in Homes,
,
, pp. 49–54.
7
13, 198
Journal of Imaging T
”
echnology
,
17 (3), 1991, pp
13
How bright is 120 lux? Consider a typical suburban
iddle-class home in the United States, with images
m
displayed in a living room with two west-facing
windows and one south-facing window. Taking into
account the seasonal cycle of short (winter) and
long (summer) days, with daylight periods averaged
ver a 12-hour “daylight period,” the light levels in
o
the room might range from 50 to 100 lux at the low
imes of the day (morning in this example) to 150 to
t
200 lux at the high times of the day
(afternoon/evening in this example). The average
12-hour “daylight period” would include times of
only indirect sun illumination, times with direct sun
illumination, and times with only artificial
illumination. Over the course of these daily and
seasonal periods, the average level would typically
be 120 lux.
14,15
If the living room had two south-facing windows and
one west-facing window, the light levels would
average somewhat higher, perhaps up to 150 lux. If
the living room had only north- and east-facing
windows, the levels would average somewhat lower,
perhaps only 100 lux.
Apartments or condominiums with only one or two
outside-facing walls would have fewer windows and
might have lower average illumination levels. A
house with very large windows and skylights could
have intensity levels of 1000 lux at a peak point
during the day, depending on the room orientation
to the sun and the number of windows and
skylights.
Based on the published studies and the 10verification study, we believe the average intensity
of 120 lux is a good one for the typical suburban
e of the higher and lower
ag
er
home, and a good a
v
light levels in homes and apartments typically found
in the United States. Of course, the actual range can
be quite large. From prints displayed in the
apartment bedroom with no windows to prints
displayed in the sunroom of a lavish home in
southern Calif
w points widens fr
lo
ornia, the range of the daily high and
om near zero to as high as
4000 or 5000 lux.
14
. cit., S. Ander
.
Op
15
. cit., S. Anderson and R. Anderson.
Op
son and G. Lar
son.
y
ear
8
Page 10

Taking into account the income-weighted population
istributions in the U.S., the darker rooms would be
d
much more prevalent than the very bright rooms.
However, to be conservative, the studies defining
120 lux as the typical home display condition
considered neither of these extremes.
A very recent multi-year study covering homes in
cities around the world has again verified the 120
lux light level as typical, if not conservative.
Findings of this study indicated that the 90th
percentile of light levels studied was 137 lux. That
is, fully 90% of the homes would have light levels
below 137 lux. This study was done over a two-year
time period, covering homes in North and South
America, Asia, Europe, and Asutralia, and included
6
well over 100,000 discrete measurements.
In commercial applications, the light intensity of
typical display conditions covers a range much
wider than that of t
Typical home conditions are clustered over a
relatively narrow range of intensities. Commercial
conditions are not clustered at all, and the
difference between the lower and higher light levels
can be a factor of 1000 or more. The range would
cover museum conditions at 50 to 100 lux to
outdoor displays at 50,000 to 100,000 lux. This
wide range makes it impossible to pick one light
intensity level to represent all commercial
conditions. Using a single light intensity for
predicting commercial print life would be extremely
misleading.
eloping the new KODAK PROFESSIONAL
v
In de
ENDURA Papers for commercial applications, Kodak
acknowledged the extremely wide range of
cial c
ommer
c
commercial applications, even in relatively similar
display environments, have the same ambient light,
temperature, and humidity conditions. Nevertheless,
various studies have been done to quantify
commercial conditions and several broad categories
ve been recognized.
ha
able 2
T
y establishing t
. B
ypical home display conditions.
e when any two
onditions. It is r
ar
17
hese are summarized in
T
ypical light levels in the
1
broad categories, it is possible to provide a broad
stimate of print life. A more accurate estimate
e
would require quantifying ambient conditions of
light intensity and temperature at a minimum.
able 2
T
ommercial Display Categories and Approximate
C
Light Levels
Approximate
Display Category Light level
(Lux)
Museum 150
e 450
Offic
Moderate-Intensity
Commercial Reflection Display
High-Intensity
Commercial Reflection Display
As a guide for estimating print life in the
commercial environment,
estimate for ULTRA ENDURA Paper in commercial
reflection display situations.
Table 3
Approximate Print Lifetimes for KODAK
PROFESSIONAL ULTRA ENDURA Paper in
Commercial Applications
Table 3 adds an average
Approximate
Display Category Light level
(Lux)
Museum 150
1000
5000
Approximate
Print Life
Over 100
years
Office 450 35 years
ensity
e-Int
at
Moder
s
ear
ommercial
C
1000
8.5 y
Reflection Display
High-Intensity
Commercial 5000 20 months
eflection Display
R
Note:All light c
12 hours off. Thermal conditions, used for the low-intensity levels,
assume 24°C and 50% RH.
onditions assume illumination for 12 hours on and
16
D. Bugner, J. LaBarca, et. Al., “A Survey of Environmental Conditions Relative
to the Storage and Display of Photographs in Consumer homes”, Journal of
Imaging Science and Technology, 50 (4), 2006, PP. 309-319.
17
D.F. Kopperl, unpublished results.
9
Page 11
Balance of Light and Thermal Mechanisms
8075706560555045403530
-0.8
-0.7
-0.6
-0.5
-0.4
-0.3
-0.2
-0.1
0
Loss from 1.0 density
Dark
1
20 Lux
Lux
D
ark + 120
Loss from 1.0 density
5
00 Lux
Dark +
5
00 Lux
Dark
0
-
0.1
-0.2
-0.3
-
0.4
-
0.5
-0.6
-
0.7
-0.8
30 35 40 45 50 55 60 65 70 75 80
As mentioned earlier, balancing the rate of dye fade
due to light degradation and dye fade due to thermal
degradation is important in optimizing print life. This
s especially so in the portrait and social
i
environment, where light levels are low.
how examples of the relationship of light and
nd 4
s
a
thermal fade. (For ease of illustration, the data come
rom an earlier generation of Kodak color papers.) In
f
low-light situations, the two degradation mechanisms
contribute nearly equally to overall print life
. Under higher-intensity lighting, such as
3)
commercial displays, the light-fade mechanism
outweighs thermal fade
(Figure 4).
Figure 3
Relationship of Light and Dark Fade
with Typical Home Illumination
Years to a Given Fade
Figures 3
(Figure
Figure 4
elationship of Light and Dark Fade
R
with Typical Commercial Illumination
Years to a Given Fade
Through the mid-1970s, thermal stability had been
the prime fade mechanism. Then product
improvements permitted a catch-up of thermal
stability to light stability. By the mid-1990s, many
manufacturers had achieved a good balance between
light and thermal fade. However, for various reasons,
the industry paid more attention to the light-stability
improvements than to thermal-stability
improvements. This is unfortunate for both the
portrait/social and the commercial markets, because
all images in both environments undergo thermal
degradation, whether displayed in the light or stored
in the dark. Especially in the portrait/social
environment (including both consumer snapshots and
professional portraits), the vast majority of images
are stored in the dark—in albums, shoeboxes, closets,
18
etc.
10
In balancing light and thermal stability, it is
important to evaluate the combination of both
effects, rather than just one or the other individually.
An improvement in light stability without a
esponding improvement in thermal stability, or
orr
c
vice versa, will not necessarily improve print life.
Kodak has long recognized the need to improve both
light and thermal stabilit
, and it was a key factor in
y
creating the new dye technologies that are now used
in KODAK PROFESSIONAL ENDURA Papers. The
echnology
ch, t
esear
s of r
esult of nearly six y
r
18
D.S. Hachey, unpublished report.
ear
Page 12

development, testing, modeling, and
ommercialization, these new papers represent
c
dramatic improvements in print life for all
professional market segments.
or more information on design and balancing
F
of light and thermal degradation mechanisms, see
the Kodak Research and Development
Web site Tech Brief from January 2002 at
http://www.kodak.com/US/en/corp/researchDevel
opment/productFeatures/balance.shtml.
For an in-depth discussion, see “The Importance of
the Balance of Light and Thermal Image Stability
Effects in the Design of Photographic Color Paper.”
Habits in Imag
e Usage—Practical Print-Life
Examples for the End-User
All KODAK PROFESSIONAL ENDURA Papers are
designed to last for more than 200 years before
noticeable changes occur in typical home darkstorage environments, such as albums. In the typical
home display environment, the new papers will last
over 100 years before noticeable changes occur.
Although the vast majority of end-user images in
the portrait and social environment are stored in the
dark, many images are displayed. In the mid-1990s
an informal survey asked U.S. professional portrait
finishing labs about practical print-life expectations
for displayed images. Specifically, it asked how
many of the images made for display would still be
on display after various times. The data from the
survey are shown in
Table 4.
Table 4
Informal Survey of Length of Display of
rofessional Prints
P
Image Age Approximate Images Still
(Years) on Display
5 54 percent
10 42 percent
20 21 percent
40 1.9 percent
60 Virtually none
19
For various reasons, such as home redecorating and
orce, the majority of images placed on display
div
are often taken down after 10 years.
Considering the balanc
the portrait/social environment, the additive effects
of thermal and light degradation, and the fact that
many images displayed initially are eventually
stored in the dark, it is possible to calculate
practical print-life estimates. The estimates are
based on the combined rates of display and darkstorage fade.
Table 5 gives several estimates.
e of thermal and light fade in
19
J. LaBarca and S. O’Dell, “The Importance of the Balance of Light and
Thermal Image Stability Effects in the Design of Photographic Color Paper,”
Proceedings of IS&T’s 12th International Symposium on Photofinishing Technology,
2002, pp. 38–47.
11
Page 13

Table 5
Practical Print-Life Estimates Based on Combined
ome Display (120 Lux) and Eventual Dark Storage
H
(24°C and 50% RH)
Image Estimated
Display Remaining Dark Total Estimated
Time Life After Print Life (Years)
(Years) Display (Years)
0 Over 200 Over 200
10 Over 180 Over 190
20 Over 160 Over 180
40 Over 120 Over 160
60 Over 80 Over 140
80 Over 40 Over 120
After a print is removed from display, the
degradation mechanism reverts to the slower
thermal effect and provides a jump in remaining
print life during dark storage.
Conclusions
learly, the science of measuring, interpreting, and
C
estimating print life is very complex. Print life
epends on many external variables that can cover
d
wide ranges of conditions.
While newer imaging technologies have revealed
dditional degradation mechanisms (and more
a
mechanisms may be discovered in the future), silver
halide-based color photographic paper has been
around for more than five decades. The key
degradation mechanisms of light fade and thermal
fade are very well understood. Product
ovements have made other degradation
impr
mechanisms from earlier days, such as base
stability, inconsequential.
Because color silver halide-based paper has existed
for so long, it is unlikely that any undiscovered
degradation mechanisms will suddenly arise. For all
these reasons, it is possible to predict print life
accurately and with a very high degree of
confidence.
As stated earlier, the accuracy of predictions
depends on the quality of test data, and statistically
good data take a long time and a high degree of
testing precision to generate. Also, designing for
optimum print life and predicting print life
accurately require a thorough understanding of the
degradation mechanisms in the real-world
environment where products will be used.
Finally, it is critically important not to design a
oduct ex
pr
at the expense of other design criteria, i.e., image
qualit
design of KODAK PROFESSIONAL ENDURA Papers
has successfully improved all three major design
criteria. The new papers provide excellent print life,
excellent image quality, and excellent performance
in the lab, all in the context of the real-world
equirements of end-users in the portrait/social and
r
ommer
c
clusively for image stability and print life
y and perf
cial display markets.
ormanc
e in the finishing lab. T
he
12
Page 14

wwwwww..kkooddaakk..ccoomm//ggoo//eenndduurraa
Kodak, Kodak Professional, Kodachrome, Kodacolor, Ektacolor, Endura,, Supra, and Ultra are
trademarks of Eastman Kodak Company. Printed in U.S.A. 12/03 ©Eastman Kodak Company, 2007
PPI-1097 CAT 134 1817
 Loading...