


ARRL Laboratory
Expanded Test-Result Report
Kenwood TS-570D
Prepared by:
American Radio Relay League, Inc.
Technical Department Laboratory
225 Main St.
Newington, CT 06111
Telephone: (860) 594-0210
Internet: mtracy@arrl.org
Order From:
American Radio Relay League, Inc.
Technical Department Secretary
225 Main St.
Newington, CT 06111
Telephone: (860) 594-0278
Internet: reprints@arrl.org
Price:
$7.50 for ARRL Members, $12.50 for non-Members, postpaid.
Model Information:
Model: TS-570D Serial #: 80600403
QST
Manufacturer:
Kenwood Communications Corporation
2201 East Dominguez Street
PO Box 22745
Long Beach, CA 90801-5745
Tel: (310) 639-5300 (Customer Support)
Fax: (310) 631-3913
Web Site: http://www.kenwood.net
"Product Review": January, 1997
ARRL Laboratory Expanded Test-Result Report Model: Kenwood TS-570D Serial: 80600403
Copyright 1997, American Radio Relay League, Inc. All Rights Reserved. - Page 1

List of Tests:
(Page numbers are omitted because the length of the report varies from unit to unit.)
Introduction
Transmitter Tests:
Transmit Output Power
Transverter Jack Output Power
Current Consumption
Transmit Frequency Range
Spectral Purity
Transmit Two-Tone IMD
Carrier and Sideband Suppression
CW Keying Waveform
Transmit Keyer Speed
SSB/FM Transmit Delay
Transmit/Receive Turnaround
Transmit Composite Noise
Receiver Tests:
Noise Floor (Minimum Discernible Signal)
Receive Frequency Range
AM Sensitivity
FM Sensitivity
Blocking Dynamic Range
Two-Tone, Third-Order Dynamic Range and Intercept Point
Two-Tone, Second-Order Intercept Point
In-Band Receiver IMD
FM Adjacent Channel Selectivity
FM Two-Tone, Third-Order IMD Dynamic Range
Image Rejection
IF Rejection
Audio Output Power
IF + Audio Frequency Response
Squelch Sensitivity
S-Meter Accuracy and Linearity
In-Band Receiver IMD
Notch Filter
Audio Filter
Receiver bandpass
Followup Tests:
Temperature Chamber Test Description
Duty Cycle Test Description
Appendix
Comparative Table
ARRL Laboratory Expanded Test-Result Report Model: Kenwood TS-570D Serial: 80600403
Copyright 1997, American Radio Relay League, Inc. All Rights Reserved. - Page 2

Introduction:
This document summarizes the extensive battery of tests performed by the ARRL Laboratory for each unit that is featured in QST
"Product Review." For all tests, there is a discussion of the test and test method used in ARRL Laboratory testing. For most tests,
critical conditions are listed to enable other engineers to duplicate our methods. For some of the tests, a block diagram of the test
setup is included. The ARRL Laboratory has a document, the ARRL Laboratory Test Procedures Manual, that explains our specific
test methods in detail, with a test description similar to the one in this report, a block diagram showing the specific equipment
currently in use for each test, along with all equipment settings and a specific step by step procedure used in the ARRL Laboratory.
While this is not available as a regular ARRL publication, the ARRL Technical Department Secretary can supply a copy at a cost of
$20.00 for ARRL Members, $25.00 for non-Members, postpaid.
Most of the tests used in ARRL product testing are derived from recognized standards and test methods. Other tests have been
developed by the ARRL Lab. The ARRL Laboratory test equipment is calibrated annually, with traceability to National Institute of
Standards and Technology (NIST). Most of the equipment is calibrated by a contracted calibration laboratory. Other equipment,
especially the custom test fixtures, is calibrated by the ARRL Laboratory Engineers, using calibrated equipment and standard
techniques.
The units being tested are operated as specified by the equipment manufacturer. The ARRL screen room has an ac supply that is
regulated to 117 or 234 volts. If possible, the equipment under test is operated from the ac supply. Mobile and portable equipment is
operated at the voltage specified by the manufacturer, at 13.8 volts if not specified, or from a fully charged internal battery.
Equipment that can be operated from 13.8 volts (nominal) is also tested for function, output power and frequency accuracy at the
minimum specified voltage, or 11.5 volts if not specified. Units are tested at room temperature and humidity as determined by the
ARRL HVAC system. Also, units that are capable of mobile or portable operation are tested at their rated temperature range, or at 10 to +60 degrees Celsius in a commercial temperature chamber.
ARRL "Product Review" testing represents a sample of only one unit (although we sometimes obtain an extra sample or two for
comparison purposes). This is not necessarily representative of all units of the same model number. It is not uncommon that some
parameters will vary significantly from unit to unit. The ARRL Laboratory and Product Review editor work with manufacturers to
resolve any deviation from specifications or other problems encountered in the review process. These problems are documented in
the Product Review.
Units used in "Product Review" testing are purchased off the shelf from major distributors. We take all necessary steps to ensure that
we do not use units that have been specially selected by the manufacturer. When the review is complete, the unit is offered for sale
in an open mail bid, announced regularly in QST .
Related ARRL Publications and Products:
The 1998 ARRL Handbook for Radio Amateurs has a chapter on test equipment and measurements. The book is available for
$32.00 plus $6 shipping and handling. The Handbook is also now available in a convenient, easy to use CD-ROM format. In
addition to the complete Handbook text and graphics, the CD-ROM includes a search engine, audio clips, zooming controls,
bookmarks and clipboard support. The cost is $49.95 plus $4.00 shipping and handling. You can order both versions of the
Handbook from our Web page, or contact the ARRL Publications Sales Department at 888-277-289 (toll free). It is also widely
stocked by radio and electronic dealers and a few large bookstores.
The ARRL Technical Information Service has prepared an information package that discusses Product Review testing and the
features of various types of equipment. Request the "What is the Best Rig To Buy" package from the ARRL Technical Department
Secretary. The cost is $2.00 for ARRL Members, $4.00 for non-Members, postpaid.
Many QST "Product Reviews" have been reprinted in three ARRL publications: The ARRL Radio Buyers Sourcebook (order #3452)
covers selected Product Reviews from 1970 to 1990. The cost is $15.00 plus $4.00 shipping and handling. The ARRL Radio Buyers
Sourcebook Volume II (order #4211) contains reprints of all of the Product Reviews from 1991 and 1992. The cost is $15.00 plus
$4.00 shipping and handling. The VHF/UHF Radio Buyer’s Sourcebook (order #6184) contains nearly 100 reviews of transceivers,
antennas, amplifiers and accessories for VHF and above. You can order these books from our Web page or contact the ARRL
Publications Sales Department to order a copy.
QST is now available on CD ROM! The 1995 ARRL Periodicals CD ROM (order #5579) and the 1996 ARRL Periodicals CD ROM
(order #6109) contain a complete copy of all articles from a year’s worth of QST, the National Contest Journal and QEX, ARRL's
ARRL Laboratory Expanded Test-Result Report Model: Kenwood TS-570D Serial: 80600403
Copyright 1997, American Radio Relay League, Inc. All Rights Reserved. - Page 3

experimenter's magazine. It is available for $19.95 plus $4.00 for shipping and handling. Contact the ARRL Publications Sales
Department to order a copy.
Older issues of QST are also available: QST View CD-ROMs come in sets covering several years each - QST View 1990-1994 (order
#5749), QST View 1985-1989 (order #5757), QST View 1980-1984 (order #5765), QSTView 1975-1979 (order #5773), QSTView
1970-1974 (order #5781), QSTView 1965-1969 (order #6451), QSTView 1960-1964 (order #6443) and QSTView 1950-1959 (order
#6435). The price for each set is $39.95. Shipping and handling for all ARRL CD ROM products is $4.00 for the first one ordered,
$1.00 for each additional set ordered at the same time.
Additional test result reports are available for:
Manufacturer Model Issue
Alpha Power 91ß Sep 97
Amewritron AL-800H Sep 97
ICOM IC-706 Mar 96
IC-756 May 97
IC-775DSP Jan 96
IC-821H Mar 97
JRC NRD-535 May 97
Kenwood TS-570D Jan 97
TS-870S Feb96
QRO HF-
Sep 97
2500DX
Ten-Tec Centaur Jun 97
Omni VI + Nov 97
Yaesu FT-920 Oct 97
FT-
Apr 96
1000MP
The cost is $7.50 for ARRL Members, $12.50 for non-Members for each report, postpaid. ARRL Members can
obtain any three reports for $20.00, postpaid.
ARRL Laboratory Expanded Test-Result Report Model: Kenwood TS-570D Serial: 80600403
Copyright 1997, American Radio Relay League, Inc. All Rights Reserved. - Page 4

Transmitter Output Power:
Test description:
One of the first things an amateur wants to know about a transmitter or receiver is its RF output power. The
ARRL Lab measures the CW output power for every band on which a transmitter can operate. The unit is tested across the entire
amateur band and the worst-case number for each band is reported. The equipment is also tested on one or more bands for any other
mode of operation for which the transmitter is capable. Typically, the most popular band of operation for each mode is selected.
Thus, on an HF transmitter, the SSB tests are done on 75 meters for lower sideband, 20 meters for upper sideband, and AM tests are
done on 75 meters, FM tests are done on 10 meters, etc. This test also compares the accuracy of the unit's internal output-power
metering against the ARRL Laboratory's calibrated test equipment.
The purpose of th e Tran smitter Output-Power Test is to measure the DC current con sumption at the manufacturer's specified
DC-supply voltage, if applicable, and the RF output power of the unit under test across each band in each of its available modes. A
two-tone audio input, at a level within the manufacturer's microphone-input specifications, is used for the SSB mode. No
modulation is used in the AM and FM modes.
Many transmitters are derated from maximum output power on full-carrier AM and FM modes. In most cases, a 100-watt CW/SSB
transmitter may be rated at 25 watts carrier power on AM. The radio may actually deliver 100 watts PEP in AM or FM but is not
specified to deliver that power level for any period of time. In these cases, the published test-result table will list the AM or FM
power as being "as specified."
In almost all cases, the linearity of a transmitter decreases as output power increases. A transmitter rated at 100 watts PEP on single
sideband may actually be able to deliver more power, but as the power is increased beyond the rated RF output power, adjacent
channel splatter (IMD) usually increases dramatically. If the ARRL Lab determines that a transmitter is capable of delivering its
rated PEP SSB output, the test-result table lists the power as being "as specified."
Key Test Conditions:
Termination: 50 ohms resistive, or as specified by the manufacturer.
Block Diagram:
PTT S
ELEGRAPH KEY
T
TWO-T
UDIO
A
ENERATOR
G
WITCH
OWER
P
UPPLY
S
ONE
AC ONLY
T
DC ONLY
DUT
RANSMITTER
100 W
T
YPICAL
ATTS
CAUTION!: Power must only be applied to the
attenuator input! Do not reverse input and output
terminals of the Bird 8329.
RF W
B
ATTMETER
4381
IRD
100 W
T
YPICAL
ATTS
RF Power
Attenuator &
Dummy Load
Bird 8329
ARRL Laboratory Expanded Test-Result Report Model: Kenwood TS-570D Serial: 80600403
Copyright 1997, American Radio Relay League, Inc. All Rights Reserved. - Page 5

Transmitter Output Power Test Results:
Frequency
Band
(MHz)
1.8 MHz CW N/A 4.3 W N/A 104.4 W
3.5 MHz CW N/A 4.4 W N/A 106.6 W
3.5 MHz AM N/A 4.6 W N/A 22.7 W
7 MHz CW N/A 4.5 W N/A 107.7 W
10.1 MHz CW N/A 4.5 W N/A 107.6 W
14 MHz CW 5 W 4.7 W 100 W 110.0 W
14 MHz USB 5 W 5.5 W 100 W 115.0 W 10
14 MHz CW N/A N/A N/A 104.4 W 11
14 MHz CW N/A N/A N/A 107.4 W 12
14 MHz CW N/A N/A N/A 88.4 W 13
18 MHz CW N/A 4.6 W N/A 108.2 W
21 MHz CW N/A 4.6 W N/A 108.5 W
24 MHz CW N/A 4.6 W N/A 109.0 W
28 MHz CW N/A 4.8 W N/A 109.1 W
28 MHz FM N/A 4.7 W N/A 109.0 W
Notes:
10. Transmit IMD generally increases significantly above rated power.
11. Temperature chamber test at -10 degrees Celsius.
12. Temperature chamber test at +50 degrees Celsius. (The specified maximum limit.)
13. Output power test at 11.5 volts dc power supply (if applicable).
Mode Unit's Meter
Minimum
Power (W)
Measured
Minimum
Power (W)
Unit 's Meter
Maximum
Power (W)
Measured
Maximum
Power (W)
Notes
(99)
99. Temperature chamber tests and 11.5 volt tests are performed only for portable and mobile equipment.
Transverter Jack Output Power Test:
Test Description:
dBm. The transverter-jack power usually varies from band to band. The 28-MHz band is the most common band for transverter
operation. Most transverter outputs are between -10 dBm and +10 dBm.
Test Results:
Frequency
(MHz)
20 M N/A 1
15 M N/A 1
10 M N/A 1
Notes:
1. The TS-570D Transverter Output is approximately 5 watts at the Antenna Jack. It does not have a dedicated transverter jack.
An attenuator is needed to bring the level down to the 0 dBm range.
This test measures the output power from the transverter jack (if applicable). This is usually somewhere near 0
Output
(dBm)
Notes
ARRL Laboratory Expanded Test-Result Report Model: Kenwood TS-570D Serial: 80600403
Copyright 1997, American Radio Relay League, Inc. All Rights Reserved. - Page 6

Current Consumption Test: (DC-powered units only)
Test Description:
important for QRP rigs, the ARRL Lab tests the current consumption of all equipment that can be operated from a battery or 12-14
vdc source. The equipment is tested in transmit at maximum output power. On receive, it is tested at maximum volume, with no
input signal, using the receiver's broadband noise. Any display lights are turned on to maximum brightness, if applicable. This test
is not performed on equipment that can be powered only from the ac mains.
Current Consumption:
Voltage
(V)
13.8 V 18 A 106.6 A 0.78 A ON 1
Notes:
1. This test not performed for units operated from ac mains.
Current consumption can be a important to the success of mobile and portable operation. While it is most
Transmit
Current (A)
Output
Power (W)
Receive
Current (A)
Lights? Notes
Transmit Frequency Range Test:
Test Description:
operation, for example, or unintentionally as the result of the design and internal software. The ARRL Lab tests the transmit
frequency range inside the screen room. The purpose of the Transmit Frequency Range Test is to determine the range of frequencies,
including those outside amateur bands, for which the transmitter may be used. The key test conditions are to test it at rated power,
using nominal supply voltages. Frequencies are as indicated on the transmitter frequency indicator or display. Most modern
synthesized transmitters are capable of operation outside the ham bands. However, spectral purity is not always legal outside the
hams bands, so caution must be used. In addition, most other radio services require that transmitting equipment be type accepted for
that service. In most cases, Amateur Radio equipment is not legal for use on other than amateur, MARS or CAP frequencies.
Many transmitters can transmit outside the amateur bands, either intentionally, to accommodate MARS
Test Results:
Frequency Low-Frequency Limit High-Frequency Limit Notes
160 M 1.800.00 MHz 1.999.99 MHz
80 M 3.500.00 MHz 3.999.99 MHz
40 M 7.000.00 MHz 7.299.99 MHz
30 M 10.100.00 MHz 10.150.00 MHz
20 M 14.000.00 MHz 14.349.99 MHz
17 M 18.068.00 MHz 18.167.99 MHz
15 M 21.000.00 MHz 21.449.99 MHz
12 M 24.890.00 MHz 24.989.99 MHz
10 M 28.000.00 MHz 29.699.99 MHz
Notes:
ARRL Laboratory Expanded Test-Result Report Model: Kenwood TS-570D Serial: 80600403
Copyright 1997, American Radio Relay League, Inc. All Rights Reserved. - Page 7

CW Transmit Frequency Accuracy Test:
Test Description:
Most modern amateur equipment is surprisingly accurate in frequency. It is not uncommon to find equipment
operating within a few Hz of the frequency indicated on the frequency display. However, some units, notably "analog" units, not
using a phase-lock loop in the VFO design, can be off by a considerable amount. This test measures the output frequency. Unit is
operated into a 50-ohm resistive load at nominal temperature and supply voltage. Frequency is also measured at minimum output
power, low supply voltage (12 volt units only) and over the operating temperature range (mobile and portable units only). Nonportable equipment is not tested at -10C or +60C (or specified limits) in the temperature chamber.
Test Results:
Unit Frequency Supply
Voltage
Temperature Measured Frequency
Full Output Power
Notes
14.000.00 MHz 13.8 V 25 C 13.999.985 MHz 1
14.000.00 MHz 11.5 V 25C 13.999.985 MHz
14.000.00 MHz 13.8 V -10C 14.000.031 MHz
14.000.00 MHz 13.8 V +50C 13.999.994 MHz
Notes:
1. Temperature specified as 25 C is nominal room temperature.
Spectral Purity Test:
Test Description:
known as spurious emissions or "spurs." Part 97 of the FCC rules and regulations specify the amount of spurious emissions that
can be emitted by a transmitter operating in the Amateur Radio Service. The ARRL Laboratory uses a spectrum analyzer to measure
the spurious emission on each band on which a transmitter can operate. The transmitter is tested across the band and the worst-case
spectral purity on each band is captured from the spectrum analyzer and stored on disk. Spectral purity is reported in dBc, meaning
dB relative to the transmitted carrier.
All transmitters emit some signals outside their assigned frequency or frequency range. These signals are
The graphs and tables indicate the relative level of any spurious emissions from the transmitter. The lower that level, expressed in
dB relative to the output carrier, the better the transmitter is. So a transmitter whose spurious emissions are -60 dBc is spectrally
cleaner than is one whose spurious emissions are -30 dBc. FCC Part 97 regulations governing spectral purity are contained in
97.307 of the FCC rules. Information about all amateur rules and regulations is found in the ARRL FCC Rule Book. Additional
information about the decibel is found in the ARRL Handbook.
Key Test Conditions:
Unit is operated at nominal supply voltage and temperature.
Output power is adjusted to full power on each amateur band.
A second measurement is taken at minimum power to ensure that the spectral output is still legal at low power.
Block Diagram:
CAUTION!: Power must only be applied to
the attenuator input! Do not reverse input
and o utput termi nals of the Bird 8329.
TWO-T
A
ENERATOR
G
ELEGRAPH KEY
T
OWER SOURCE
P
UDIO
ONE
DUT
RANSMITTER
T
10 dB S
TTENUATOR
A
HP 355D
TEP
100 W
T
YPICAL
ATTS
RF W
ATTMETER
B
4381
IRD
1 dB S
TTENUATOR
A
HP 3555C
TEP
100 W
T
YPICAL
DO NOT
EXCEED
0 dBm
ATTS
RF Power
Attenuator &
Dummy Load
Bird 8329
PECTRUM
S
NALYZER
A
HP 8563E
ARRL Laboratory Expanded Test-Result Report Model: Kenwood TS-570D Serial: 80600403
Copyright 1997, American Radio Relay League, Inc. All Rights Reserved. - Page 8

Spectral Purity Graphs
0
–10
–20
–30
–40
–50
–60
–70
–80
0 20 40 60 80 100 120 140 160 180 200
Kenwood TS-570D S/N: 80600403
28.0 MHz Band, Spectral Purity, 100 W
P:\TESTS\TS570\TS570S10.TXT
0
–10
–20
–30
–40
–50
–60
–70
–80
0 10 20 30 40 50 60 70 80 90 100
Kenwood TS-570D S/N: 80600403
24.9 MHz Band, Spectral Purity, 100 W
P:\TESTS\TS570\TS570S12.TXT
0
–10
–20
–30
–40
–50
–60
–70
–80
0 10 20 30 40 50 60 70 80 90 100
Kenwood TS-570D S/N: 80600403
21.0 MHz Band, Spectral Purity, 100 W
P:\TESTS\TS570\TS570S15.TXT
Frequency (MHz)
Frequency (MHz)
Frequency (MHz)
Reference Level: 0 dBc
Reference Level: 0 dBc
Reference Level: 0 dBc
0
–10
Reference Level: 0 dBc
–20
–30
–40
–50
–60
–70
–80
0 10 20 30 40 50 60 70 80 90 100
Kenwood TS-570D S/N: 80600403
10.1 MHz Band, Spectral Purity, 100 W
P:\TESTS\TS570\TS570S30.TXT
0
0
–10
–10
–20
–20
–30
–30
–40
–40
–50
–50
–60
–60
–70
–70
–80
–80
0 5 10 15 20 25 30 35 40 45 50
0 5 10 15 20 25 30 35 40 45 50
Kenwood TS-570D S/N: 80600403
Kenwood TS-570D S/N: 80600403
3.5 MHz Band, Spectral Purity, 100 W
7.0 MHz Band, Spectral Purity, 100 W
P:\TESTS\TS570\TS570S80.TXT
P:\TESTS\TS570\TS570S40.TXT
0
–10
Frequency (MHz)
Frequency (MHz)
Frequency (MHz)
Reference Level: 0 dBc
Reference Level: 0 dBc
Reference Level: 0 dBc
–20
–30
–40
–50
–60
–70
–80
0 5 10 15 20 25 30 35 40 45 50
Kenwood TS-570D S/N: 80600403
1.8 MHz Band, Spectral Purity, 100 W
P:\TESTS\TS570\TS570SLO.TXT
Frequency (MHz)
0
–10
Reference Level: 0 dBc
–20
–30
–40
–50
–60
–70
–80
0 10 20 30 40 50 60 70 80 90 100
Kenwood TS-570D S/N: 80600403
14.0 MHz Band, Spectral Purity, 100 W
P:\TESTS\TS570\TS570S20.TXT
Frequency (MHz)
ARRL Laboratory Expanded Test-Result Report Model: Kenwood TS-570D Serial: 80600403
Copyright 1997, American Radio Relay League, Inc. All Rights Reserved. - Page 9

Transmit Two-Tone IMD Test:
Test Description:
Investigating the sidebands from a modulated transmitter requires a narrow-band spectrum analysis. In this test,
a two-tone test signal is used to modulate the transmitter. The display shows the two test tones plus some of the IMD products
produced by the SSB transmitter. In the ARRL Lab, a two-tone test signal with frequencies of 700 and 1900 Hz is used to modulate
the transmitter. These frequencies were selected to be within the audio passband of the typical transmitter, resulting in a meaningful
display of transmitter IMD. The intermodulation products appear on the spectral plot above and below the two tones. The lower the
intermodulation products, the better the transmitter. In general, it is the products that are farthest removed from the two tones
(typically > 3 kHz away) that cause the most problems. These can cause splatter up and down the band from strong signals.
Key Test Conditions:
Transmitter operated at rated output power. Audio tones and drive level adjusted for best performance. Audio tones 700 and 1900
Hz. Both audio tones adjusted for equal RF output. Level to spectrum analyzer, - 10 dBm nominal, -10 dBm maximum. Resolution
bandwidth, 10 Hz
Block Diagram:
CAUTION!: Power must only be applied to
the attenuator input! Do not reverse input
and o utput termi nals of the Bird 8329.
TWO-T
A
ENERATOR
G
ELEGRAPH KEY
T
OWER SOURCE
P
UDIO
ONE
DUT
RANSMITTER
T
10 dB S
TTENUATOR
A
HP 355D
TEP
100 W
T
YPICAL
ATTS
RF W
ATTMETER
B
4381
IRD
1 dB S
TTENUATOR
A
HP 3555C
TEP
100 W
T
YPICAL
DO NOT
EXCEED
0 dBm
ATTS
RF Power
Attenuator &
Dummy Load
Bird 8329
PECTRUM
S
NALYZER
A
HP 8563E
Notes:
1.
The ARRL Laboratory has traditionally tested transmitter IMD performance on 80 M and 20 M only. This represented a low
band, and the most popular of the higher HF bands, one band on LSB and the other on USB. However, with the addition of
computer-controlled testing and the associated test automation it became economically practical to test this transmitter's IMD
performance on all available bands. This information is being offered in the test-result reports and will be used in future "Product
Reviews," taking more data to give us a wider selection for "worst-case" test results published in QST. The ARRL Lab is constantly
expanding and improving its test methods. Expect to see additional changes as we more fully explore the technical performance of
modern equipment.
ARRL Laboratory Expanded Test-Result Report Model: Kenwood TS-570D Serial: 80600403
Copyright 1997, American Radio Relay League, Inc. All Rights Reserved. - Page 10

Transmit IMD Graphs
Kenwood TS-570D S/N: 80600403
7.250 MHz, Transmit IMD, 100 W
P:\TESTS\TS570\TS570I40.TXT
–10 –8 –6 –4 –2 0 2 4 6 8 10
–80
–70
–60
–50
–40
–30
–20
–10
0
Frequency Offset (kHz)
Reference Level: 0 dB PEP
Kenwood TS-570D S/N: 80600403
3.900 MHz, Transmit IMD, 100 W
P:\TESTS\TS570\TS570I80.TXT
–10 –8 –6 –4 –2 0 2 4 6 8 10
–80
–70
–60
–50
–40
–30
–20
–10
0
Frequency Offset (kHz)
Reference Level: 0 dB PEP
Kenwood TS-570D S/N: 80600403
1.850 MHz, Transmit IMD, 106.0 W
P:\TESTS\TS570\TS570ILO.TXT
–10 –8 –6 –4 –2 0 2 4 6 8 10
–80
–70
–60
–50
–40
–30
–20
–10
Frequency Offset (kHz)
Reference Level: 0 dB PEP
0
Reference Level: 0 dB PEP
–10
–20
–30
–40
–50
–60
–70
–80
–10 –8 –6 –4 –2 0 2 4 6 8 10
Kenwood TS-570D S/N: 80600403
28.350 MHz, Transmit IMD, 100 W
P:\TESTS\TS570\TS570I10.TXT
0
Reference Level: 0 dB PEP
–10
–20
–30
–40
–50
Frequency Offset (kHz)
–60
–70
–80
–10 –8 –6 –4 –2 0 2 4 6 8 10
Kenwood TS-570D S/N: 80600403
21.250 MHz, Transmit IMD, 100 W
P:\TESTS\TS570\TS570I15.TXT
0
Reference Level: 0 dB PEP
Frequency Offset (kHz)
–10
–20
–30
–40
–50
–60
–70
–80
–10 –8 –6 –4 –2 0 2 4 6 8 10
Kenwood TS-570D S/N: 80600403
14.250 MHz, Transmit IMD, 100 W
P:\TESTS\TS570\TS570I20.TXT
Frequency Offset (kHz)
ARRL Laboratory Expanded Test-Result Report Model: Kenwood TS-570D Serial: 80600403
Copyright 1997, American Radio Relay League, Inc. All Rights Reserved. - Page 11
SSB Carrier and Unwanted Sideband Suppression Test:
Test Description
: The purpose of the SSB Carrier and opposite-sideband Suppression test is to determine the level of carrier and
unwanted sideband suppression relative to Peak Envelope Power (PEP). The transmitter output is observed on the spectrum analyzer
and the unwanted components are compared to the desired sideband. The level to the spectrum analyzer is -10 dBm nominal. The
measurement bandwidth is 100 Hz. The greater the amount of suppression, the better the transmitter. For example, opposite
sideband suppression of 60 dB is better than suppression of 50 dB.
Test Results:
Frequency
(MHz)
Carrier Suppression
(dB)
Opposite Sideband
Suppression (dB)
Notes
14.2 MHz USB >50 dB > 50 dB 1
14.2 MHz LSB >50 dB > 50 dB
Notes:
1. Manufacturer’s spec is 40 dB or more for carrier and sideband suppression.
CW Keying Waveform Test:
Test Description:
point of th e device under test's RF output envelope in the CW mode. The on and off delay times fr om key closure to RF output are
also measured. If the transmitter under test has several CW modes, (i.e. VOX, QSK) these measurements is made at rated outpu t
power for each mode. A picture of th e oscilloscope screen is taken of the results with the QSK off, an d in the VOX mode showing
the first dit, and any other test condition s that r esult in a waveshape that is significantly different from the others (more than 10%
difference, spikes, etc.). The fir st and second dits are shown in all modes.
The purpose of the CW Keying Waveform Test is to determine the rise and fall times for the 10% to the 90%
If the risetime or falltime become too short, the transmitter will generate key clicks. Most click-free transmitters have a rise and fall
time between 1 ms and 5 ms. The absolute value of the on delay and off delay are not critical, but it is important that they be
approximately the same so that CW weighting will not be affected.
Some transmitters used in the VOX mode exhibit a first dit that is shorter than subsequent dits. Other transmitters can show
significant shortening of all dits when used in the QSK mode. The latter will cause keying to sound choppy.
The first dit foreshortening is expressed as a "weighting" number. In perfect keying, the weighting is 50%, meaning that the carrier
is ON for 50% of the time.
Key Test Condit i ons:
The transmitter is operated at room temperature at rated output power into a 50-ohm resistive load. The power supply voltage is
nominal. Attenuators are adjusted to obtain 3 volts RMS to the oscilloscope.
Test Result Summary:
Frequency
(MHz)
14.02 MHz QSK 1.1 ms 2.2 ms 2 ms 2.2 ms 15 ms 14 ms 18 ms 17 ms 50% 54%
14.02 MHz VOX 1.0 ms 2.2 ms 2 ms 2.2 ms 14 ms 16 ms 15 ms 16 ms 50% 54%
Mode First Dit
Risetime
(ms)
First Dit
Falltime
(ms)
Subsequent
Dits
Risetime
Subsequent
Dits
Falltime
(ms)
First
Dit
On
Delay
First
Dit
Off
Delay
Subsequent
Dits
On Delay
(ms)
Subsequent
Dits
Off Delay
(ms)
Weighting%First Dit
Weighting %
Captions (Figures on next pages): All Figures are 10 ms/division., unless otherwise noted.
Figure 1. This shows the first and second dits in the VOX mode, full breakin (QSK).
Figure 2. This shows the first and second dits in the MOX mode, full breakin (QSK)
Figure 3. This shows the first and second dits in the VOX mode, delay set to 50 ms
Figure 4. This shows the first and second dits in the MOX mode, delay set to 50 ms
ARRL Laboratory Expanded Test-Result Report Model: Kenwood TS-570D Serial: 80600403
Copyright 1997, American Radio Relay League, Inc. All Rights Reserved. - Page 12
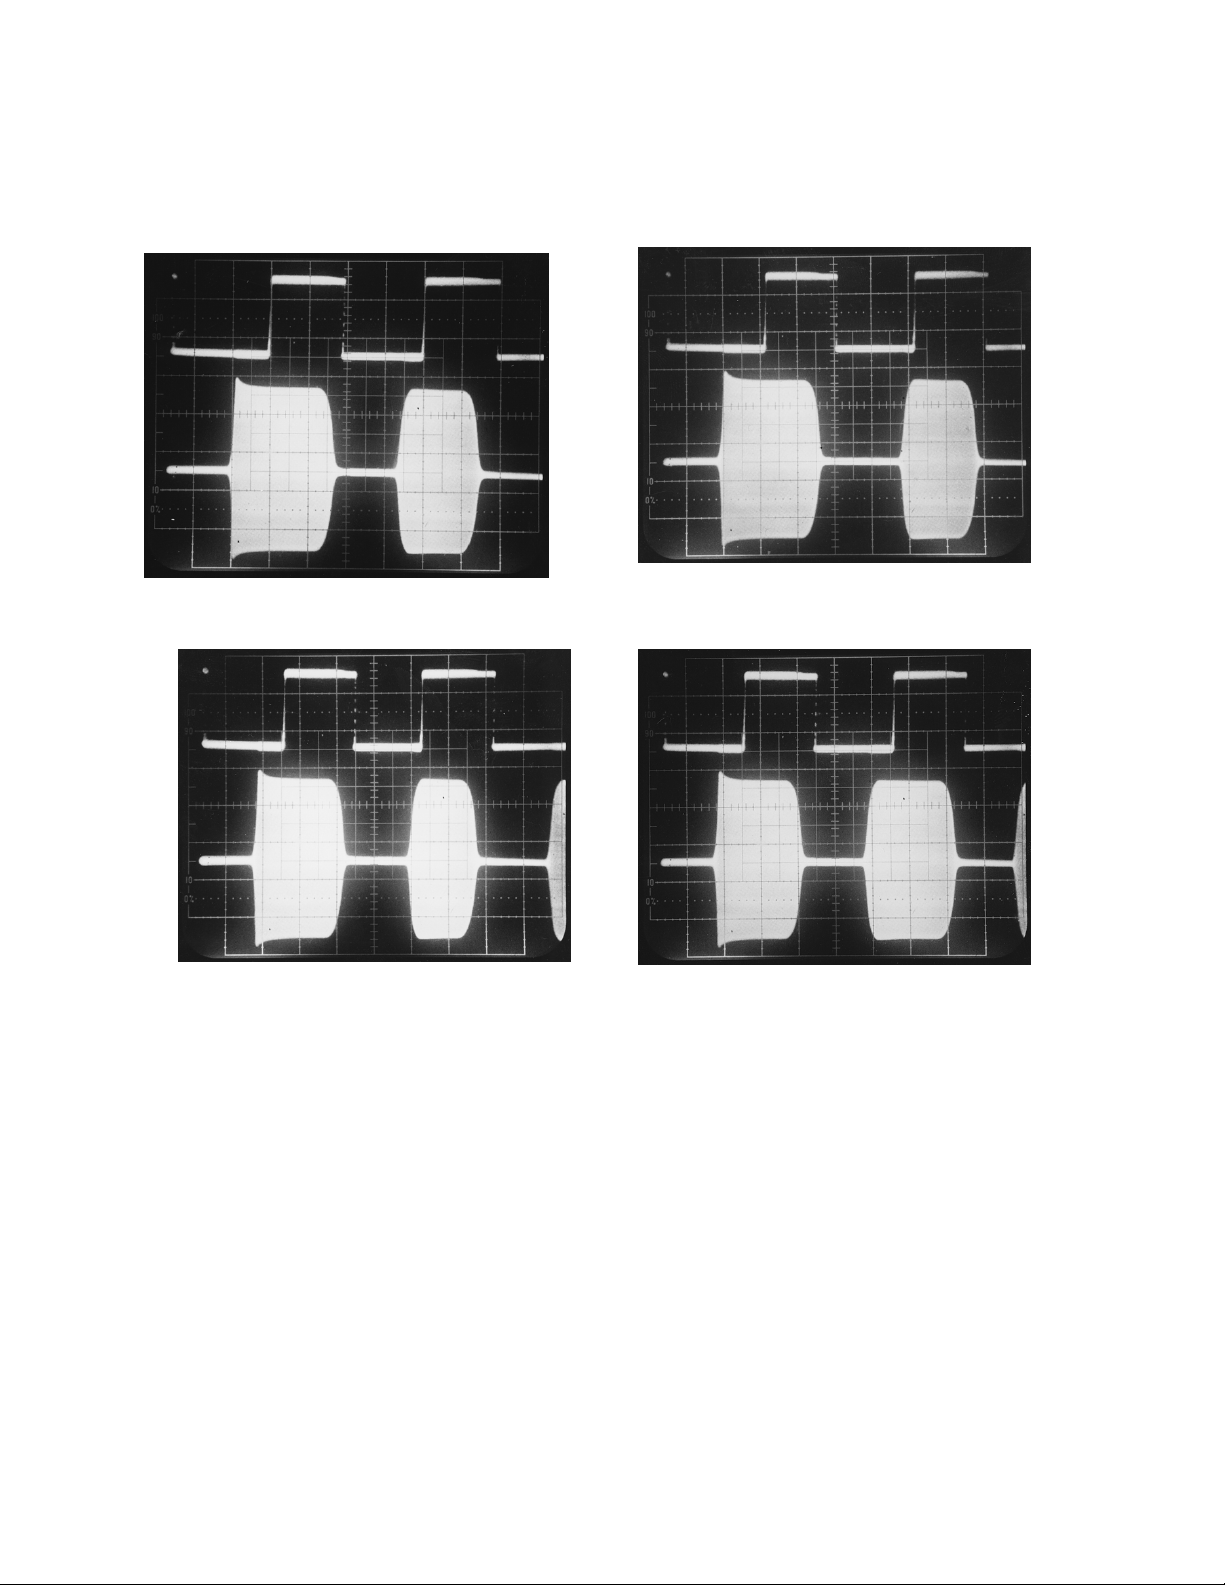
CW Keying Waveforms:
Figure 1 Figure 2
Figure 3 Figure 4
ARRL Laboratory Expanded Test-Result Report Model: Kenwood TS-570D Serial: 80600403
Copyright 1997, American Radio Relay League, Inc. All Rights Reserved. - Page 13

Transmit Keyer Speed Test:
Test Description:
time from dit to dit is measured using an oscilloscope and used to calculate the speed using the "Paris" method of code speed calculation. (In
"Paris" is used as the standard word to calculate words per minute.)
Test Results:
Min WPM Max WPM Mid WPM Notes
10 WPM 75 WPM 35 WPM 1
Notes:
1. The DUT display range indication extends from 0 to 100.
This test measures the speed of the internal keyer on transmitters so equipped. The keyer is tests at minimum, midrange a
Transmit/Receive Turnaround Test:
Test Description: The purpose of the Transmit/Receive turnaround test is to measure the delay required to switch from the transmit
to the receive mode of a transceiver.
Test Results:
Frequency Conditions T/R Delay
AGC Fast
(ms)
14.2 MHz SSB 50 ms 50 ms 1
T/R Delay
AGC Slow
(ms)
Notes
Notes:
1. T/R delay less than or equal to 35 ms is suitable for use on AMTOR.
Transmit Delay Test
Test Description: The purpose of the Transmit Delay test is to measure the time between PTT closure and 50% RF output. It is
measured on SSB, modulated with a single tone and on FM, unmodulated.
Test Results:
Frequency
(MHz)
14.2 MHz SSB 18 ms 5 ms
14.2 MHz FM 14 ms 6 ms
Notes:
Mode On delay Off dela y Notes
ARRL Laboratory Expanded Test-Result Report Model: Kenwood TS-570D Serial: 80600403
Copyright 1997, American Radio Relay League, Inc. All Rights Reserved. - Page 14

Transmit Composite Noise Test:
Test Description:
The purpose of th e Composite-Noise Test is to observe and measure the phase and amplitude noise, as well as
any spurious signals generated by the device under test transmitter. Since phase noise is the primary noise component in any
well-designed transmitter, it can be assumed, therefore, that almost all the noise observed during this test is phase noise. This
measurement is accomplished by converting the output of the transmitter down to a frequency about 10 or 20 Hz above baseband. A
mixer and a signal generator used as a local oscillator are used to perform this conversion . Filters remove the 0 Hz component as
well as the unwanted heterodyne components. The remaining noise and spurious signals are then observed on the spectrum
analyzer.
The lower the noise as seen on the plot, the better the transmitter.
Key Test Conditions:
Transmitter operated at rated output power into a 50-ohm resistive load.
Transmitter operated at room temperature.
Frequencies from 2 to 22 kHz from the carrier are measured.
Ten sweeps are averaged on the spectrum analyzer to reduce noise.
Block Diagram:
OWER MUST ONLY BE
DUT
RANSMITTER
T
HE BIRD
T
RF
ATTMETER
W
IRD
B
!
8329.
4381
OWER
RF P
TTENUATOR
A
IRD
B
8329
10 dB S
TTENUATOR
A
HP 355D
TEP
TEP
1 dB S
TTENUATOR
A
HP 355C
RF S
ENERATOR
G
ARCONI
M
CAUTION!: P
PPLIED TO THE ATTENUATO R INPUT
A
O NOT REVERSE THE INPUT AND
D
UTPUT TERMINALS OF
O
IGNAL
4031
L
Notes:
M
IXER
R
PHASE LOCK SIGNAL
A
IF IN
I
COMPOSITE NOISE MIX E R
6 dB
TTENUATOR
1.25 MH
OW PASS
L
ILTER
F
LOW-NOISE
AMPLIFIER
Z
1 KH
IGH PASS
H
ILTER
F
IF OUT
Z
PECTRUM
S
NALYZER
A
HP 8563E
ARRL Laboratory Expanded Test-Result Report Model: Kenwood TS-570D Serial: 80600403
Copyright 1997, American Radio Relay League, Inc. All Rights Reserved. - Page 15

Transmit Composite Noise Graphs (20 M is top figure; 80 M is bottom figure):
–60
Reference Level: - 60 dBc/Hz
–70
Vertical Scale: dBc/Hz
–80
–90
–100
–110
–120
–130
–140
2 4 6 8 10 12 14 16 18 20 22
Kenwood TS-570D S/N: 80600403
14.020 MHz, Phase Noise, 100 W
P:\TESTS\TS570\TS570P20.TXT
Frequency Sweep: 2 to 22 kHz from Carrier
–60
Reference Level: - 60 dBc/Hz
–70
Vertical Scale: dBc/Hz
–80
–90
–100
–110
–120
–130
–140
2 4 6 8 10 12 14 16 18 20 22
Kenwood TS-570D S/N: 80600403
3.520 MHz, Phase Noise, 100 W
P:\TESTS\TS570\TS570P80.TXT
Frequency Sweep: 2 to 22 kHz from Carrier
ARRL Laboratory Expanded Test-Result Report Model: Kenwood TS-570D Serial: 80600403
Copyright 1997, American Radio Relay League, Inc. All Rights Reserved. - Page 16

Receiver Noise Floor (Minimum Discernible Signal) Test:
Test Description
:
The noise floor of a receiver is the level of input signal that gives a desired audio output level that is equal to the
noise output level. This is sometimes called "minimum discernible signal " (MDS), although a skilled operator can copy a signal at
considerably less than the noise floor. Most modern receivers have a noise floor within a few dB of "perfect." A perfect receiver
would hear only the noise of a resistor at room temperature. However, especially for HF receiving systems, the system noise is rarely
determined by the receiver. In most cases, external noise is many dB higher than the receiver's internal noise. In this case, it is the
external factors that determine the system noise performance. Making the receiver more sensitive will only allow it to hear more
noise. It will also be more prone to overload. In many cases, especially in the lower HF bands, receiver performance can be
improved by sacrificing unneeded sensitivity by placing an attenuator in front of the receiver. The more negative the sensitivity
number expressed in dBm, or the smaller the number expressed in voltage, the better the receiver.
Key Test Conditions:
50-ohm source impedance for generators.; Receiver audio output to be terminated with specified impedance.
Receiver is tested using 500 Hz bandwidth, or closest available bandwidth to 500 Hz.
Block Diagram:
HI-Z
ONITOR AMP
M
RF S
ENERATOR
G
ARCONI
M
IGNAL
2041
10 dB S
TTENUATOR
A
HP 355D
TEP
TEP
1 dB S
TTENUATOR
A
HP 355C
DUT
ECEIVER
R
UDIO/
A
ISTORTION
D
ETER
M
HP 339A
Noise Floor:
Frequency Preamp OFF
MDS (dBm)
Preamp ON
MDS (dBm)
Notes
1.82 MHz -130.5 dBm -138.3 dBm 4
3.52 MHz -132.2 dBm -139.7 dBm
7.02 MHz -131.7 dBm -139.6 dBm
10.12 MHz -131.8 dBm -139.2 dBm
14.02 MHz -130.1 dBm -138.7 dBm
14.02 MHz N/A -138.5 dBm 1
14.02 MHz N/A -136.7 dBm 2
14.02 MHz N/A -138.4 dBm 3
18.1 MHz -129.5 dBm -138.4 dBm
21.02 MHz -129.9 dBm -138.3 dBm
24.91 MHz -130.4 dBm -143.4 dBm
28.02 MHz -130.7 dBm -142.1 dBm
Notes:
1. Unit operated at 11.5 V dc. (Only performed on units that are specified to operate from 12-14 V dc source.
2. Unit operated at -10C. (Only performed on mobile or portable units)
3. Unit operated at +50C. (Only performed on mobile or portable units)
4. For all measurements, the IF filter bandwidth was set for 500 Hz. The DSP filter bandwidth was set for 600 Hz.
ARRL Laboratory Expanded Test-Result Report Model: Kenwood TS-570D Serial: 80600403
Copyright 1997, American Radio Relay League, Inc. All Rights Reserved. - Page 17

Receive Frequency Range:
Test Description:
be tuned. Most receivers exhibit some degradation of sensitivity near the limits of their tuning range. In cases where this
degradation renders the receiver unusable, we report both the actual and useful tuning range.
Test Results:
Minimum
Frequency
(MHz)
0.030 MHz -98.0 dBm 30 MHz -141.9 dBm 1, 2, 3
Notes:
1. Minimum frequency measurement made with preamp off. Preamp degrades minimum frequency sensitivity.
2. Minimum frequency measurement made at 31 kHz do dodge a birdie.
3 The maximum frequency measurement was made with the preamp on.
This test measures the tuning range of the receiver. The range expressed is the range over which the receiver can
Minimum
Frequency
MDS (dBm)
Maximum
Frequency
(MHz)
Maximum
Frequency
MDS (dBm)
Notes
AM Sensitivity Test:
Test Description:
kHz, that result s in a tone 10 dB above the noise level (MDS) of the r ecei ver. T wo frequen ci es, 1. 020 MHz and 3.800 MHz are used
for this test. The more negative the number, expressed in dBm, or the smaller the number expressed in voltage, the better the
sensitivity.
The p ur pose of th e AM recei ve Sensitivity Test is to determine the level of an AM signal, 30% modulated at 1
Test Results:
Frequency
(MHz)
1.02 MHz OFF -88.5 dBm 8.41 uV 1, 2
1.02 MHz ON -96.6 dBm 3.31 uV
3.8 MHz OFF -106.6 dBm 1.05 uV 3
3.8 MHz ON -114.6 dBm 0.416 uV
Notes:
1. The NARrow filter bandwidth is used for all tests.
2. The manufacturer’s spec at 1.020 MHz is less than or equal to 31.6 uV.
3. The manufacturer’s spec at 3.8 MHz is less than or equal to 2 uV.
Preamplifier Sensitivity
(dBm)
Sensitivity
(uV)
Notes
ARRL Laboratory Expanded Test-Result Report Model: Kenwood TS-570D Serial: 80600403
Copyright 1997, American Radio Relay League, Inc. All Rights Reserved. - Page 18

FM SINAD and Quieting Test:
Test Description
MHz:
1) The 12 d B SINAD valu e.
SINAD is an a cronym for "SIgna l p l u s Noise And Distortion" and is a m easu re of signal q u ality. The exact expression for
SINAD is th e following :
SINAD = Signal + Noise + Di st ortion (exp ressed in dB)
Noise + Distortion
If we con sider distortion to be merely another form of noise, (distortion, like noise, is something unwanted added to the signal), and
a pra ct i ca l ci rcuit in which t he signal is much great er tha n th e noise, the SI NAD equation can be approximated by the signal to noise
ratio:
SINAD = Signal (expressed in dB)
Noise
For the 25% level of distortion used i n thi s test , t he SINAD value can be calculated as follows:
2) The level of unmodulated input signal that produces 10 dB of quieting if specified by the manufacturer.
3) The level of unmodulated input signal that produces 20 dB of quieting if specified by the manufacturer.
:
The purpose of the FM SINAD and Qu i et i ng Test is to determine the following a t a test frequ ency of 29.000
SINAD = 20 log (1/25%) = 20 log 4 = 12 dB
The more negative the number, expressed in dBm, or the smaller the number, expressed as voltage, the better the sensitivity.
Results
Test
Frequency
(MHz)
:
Preamplifier Bandwidth Sensitivity
(dBm)
Sensitivity
(uV)
Notes
29.0 MHz OFF Wide -111.3 dBm 0.609 uV 1, 2
29.0 MHz ON Wide -123.9 dBm 0.143 uV
Notes:
1. Level for 12 dB SINAD. The FM quieting test is performed only if needed to verify a manufacturer's specification.
2. The IF filter bandwidth cannot be changed in the FM mode.
ARRL Laboratory Expanded Test-Result Report Model: Kenwood TS-570D Serial: 80600403
Copyright 1997, American Radio Relay League, Inc. All Rights Reserved. - Page 19

Blocking Dynamic Range Test:
Test Description:
Dynamic range is a measurement of a receiver's ability to function well on one frequency in the presence of one
or more unwanted signals on other frequency. It is essentially a measurement of the difference between a receiver's noise floor and
the loudest off-channel signal that can be accommodated without measurable degradation of the receiver's response to a relatively
weak signal to which it is tuned. This difference is usually expressed in dB. Thus, a receiver with a dynamic range of 100 dB would
be able to tolerate an off-channel signal 100 dB stronger than the receiver's noise floor.
In the case of blocking dynamic range, the degradation criterion is receiver desense. Blocking dynamic range (BDR) is the
difference, in dB, between the noise floor and a off-channel signal that causes 1 dB of gain compression in the receiver. It indicates
the signal level, above the noise floor, that begins to cause desensitization. BDR is calculated by subtracting the noise floor from the
level of undesired signal that produces a 1-dB decrease in a weak desired signal. It is expressed in dB. The greater the dynamic
range, expressed in dB, the better the receiver performance. It is usual for the dynamic range to vary with frequency spacing.
Key Test Conditions:
AGC is normally turned off; the receiver is operated in its linear region. Desired signal set to 10 dB below the 1-dB compression
point, or 20 dB above the noise floor in receivers whose AGC cannot be disabled. The receiver bandwidth is set as close as possible
to 500 Hz.
Block Diagram:
RF S
ENERATOR
G
ARCONI
M
IGNAL
2041
HI-Z
ONITOR AMP
M
PORT
2-
OUPLER
C
MCL ZSFC 2-6
IGNAL
RF S
ENERATOR
G
HP 8640B
10 dB S
TTENUATOR
A
HP 355D
1 dB S
TTENUATOR
A
HP 355C
TEP
Test Result Summary:
Frequency
(MHz)
Preamp Spacing BDR
(dB)
1.82 MHz ON 50 kHz 124.3 dB 1
3.52 MHz OFF 20 kHz 114.2 dB*
3.52 MHz ON 20 kHz 118.7 dB*
3.52 MHz ON 50 kHz 125.7 dB
7.02 MHz ON 50 kHz 124.6 dB
14.02 MHz ON 20 kHz 114.7 dB
14.02 MHz OFF 20 kHz 114.6 dB*
14.02 MHz ON 50 kHz 124.7 dB
14.02 MHz ON 100 kHz 134.2 dB
21.02 MHz ON 50 kHz 128.3 dB
28.02 MHz ON 50 kHz 126.1 dB
TEP
Notes
DUT
ECEIVER
R
UDIO/
A
ISTORTION
D
ETER
M
HP 339A
Notes:
1. For all measurements, the IF filter bandwidth was set for 500 Hz. The DSP filter bandwidth was set for 600 Hz.
* Indicates that measurement was noise limited at values shown
ARRL Laboratory Expanded Test-Result Report Model: Kenwood TS-570D Serial: 80600403
Copyright 1997, American Radio Relay League, Inc. All Rights Reserved. - Page 20

Two-Tone 3rd-Order Dynamic Range Test:
Test Description: I
ntermodulation distortion dynamic range (IMD DR) measures the impact of two-tone IMD on a receiver. IMD
is the production of spurious responses resulting from the mixing of desired and undesired signals in a receiver. IMD occurs in any
receiver when signals of sufficient magnitude are present. IMD DR is the difference, in dB, between the noise floor and the strength
of two equal off-channel signals that produce a third-order product equal to the noise floor. In the case of two-tone, third-order
dynamic range, the degradation criterion is a receiver spurious response. If the receiver generates a third-order response equal to
the receiver's noise floor to two off-channel signals, the difference between the noise floor and the level of one of the off-channel
signals is the blocking dynamic range. This test determines the range of sign als th at can be tolerated by the device under test while
producing essentially no undesired spurious responses. To perform the 3
kHz apart , ar e injected in t o the input of the receiver. If we call these frequencies f
frequencies of (2f
) and (2f2-f1). Automated test software also perfor ms a swept test on the 20-meter band.
1-f2
rd
Order test, two signals of equal amplitude and spaced 20
and f2, the third-order products will appear at
1
The greater the dynamic range, expressed in dB, or the higher the intercept point, the better the performance.
Key Test Conditions:
Sufficient attenuation and isolation must exist between the two signal generators. The two-port coupler must be terminated in a 20dB return loss load. The receiver is set as close as possible to 500 Hz bandwidth.
Block Diagram:
RF S
ENERATOR
G
ARCONI
M
IGNAL
2041
HI-Z
ONITOR AMP
M
PORT
2-
OUPLER
C
MCL ZSFC 2-6
IGNAL
RF S
ENERATOR
G
HP 8640B
10 dB S
TTENUATOR
A
HP 355D
TEP
TEP
1 dB S
TTENUATOR
A
HP 355C
DUT
ECEIVER
R
Two-Tone Receiver IMD Dynamic Range Test Result Summary:
Frequency
(MHz)
1.82 MHz 50 kHz 98.3 dB 95.5 dB 1
3.52 MHz 20 kHz 98.7 dB 99.3 dB
3.52 MHz 50 kHz 98.7 dB 99.2 dB
7.02 MHz 50 kHz 101.6 dB 103.7 dB
14.02 MHz 20 kHz 96.7 dB* 98.1 dB*
14.02 MHz 50 kHz 99.7 dB 101.1 dB
14.02 MHz 100 kHz 98.7 dB 101.1 dB
21.02 MHz 50 kHz 98.3 dB 101.9 dB
28.02 MHz 50 kHz 93.1 dB 98.7 dB
Spacing Preamp ON
IMD DR (dB)
Preamp OFF
IMD DR (dB)
Notes
UDIO/
A
ISTORTION
D
ETER
M
HP 339A
Notes:
1. For all measurements, the IF filter bandwidth was set for 500 Hz. The DSP filter bandwidth was set for 600 Hz.
* Indicates that the measurement was noise limited at values shown.
ARRL Laboratory Expanded Test-Result Report Model: Kenwood TS-570D Serial: 80600403
Copyright 1997, American Radio Relay League, Inc. All Rights Reserved. - Page 21

Dynamic Range Graphs:
The following page shows one of the highlights of ARRL test result reports -- swept graphs on receiver twotone, third-order IMD dynamic range and blocking dynamic range. These graphs are taken using National
Instruments LabWindows CVI automated test software, with a custom program written by the ARRL
Laboratory.
Dynamic range measures the difference between a receiver's noise floor and the receiver's degradation in the
presence of strong signals. In some cases, the receiver's noise performance causes receiver degradation before
blocking or a spurious response is seen. In either case, if the noise floor is degraded by 1 dB due to the presence
of receiver noise during the test, the dynamic range is said to be noise limited by the level of signal that caused
the receiver noise response. A noise-limited condition is indicated in the
QST
"Product Review" test-result
tables. The Laboratory is working on software changes that will show on the test-result graphs which specific
frequencies were noise limited. These will be incorporated into future test-result reports.
Being "noise limited" is not necessarily a bad thing. A receiver noise limited at a high level is better than a
receiver whose dynamic range is lower than the noise-limited level. In essence, a receiver that is noise limited
has a dynamic range that is better than its local-oscillator noise. Most of the best receivers are noise limited at
rather high levels.
The ARRL Laboratory has traditionally used off-channel signals spaced 20 kHz from the desired signal. This
does allow easy comparisons between different receivers. There is nothing magical about the 20-kHz spacing,
however. In nearly all receivers, the dynamic range varies with signal spacing, due to the specific design of the
receiver. Most receivers have filter combinations that do some coarse filtering at RF and in the first IF, with
additional filtering taking place in later IF or AF stages. As the signals get "inside" different filters in the
receiver, the dynamic range decreases as the attenuation of the filter is no longer applied to the signal.
Interestingly, the different filter shapes can sometimes be seen in the graphs of dynamic range of different
receivers. In the case of the ARRL graphs, one can often see that the 20-kHz spacing falls on the slope of the
curve. Many manufacturers specify dynamic range at 50 or 100 kHz.
The computer is not as skilled (yet) at interpreting noisy readings as a good test engineer, so in some cases there
are a few dB difference between the computer-generated data and those in the "Product Review" tables. Our
test engineer takes those number manually, carefully measuring levels and interpreting noise and other
phenomena that can effect the test data. (We are still taking the two-tone IMD data manually.)
The graphs that follow show swept blocking and two-tone dynamic range. In the blocking test, the receiver is
tuned to a signal on 14.020 MHz, the center of the graph. The X axis is the frequency (MHz) of the undesired,
off-channel signal. In the two-tone test, the receiver is tuned to a signal on 14.020 MHz, the center of the graph.
The X axis is the frequency of the closer of the two tones that are creating intermodulation.
ARRL Laboratory Expanded Test-Result Report Model: Kenwood TS-570D Serial: 80600403
Copyright 1997, American Radio Relay League, Inc. All Rights Reserved. - Page 22

Dynamic-Range Graphs:
Swept Blocking Dynamic Range
D
y
n
a
m
i
c
R
a
n
g
e
160.0
150.0
140.0
130.0
120.0
110.0
100.0
90.0
80.0
70.0
Receiver Frequency = 14.02 MHz
o = Measured at Value Shown
* = Noise Limited at Value Shown
d
60.0
B
50.0
13.820 13.900 13.980 14.060 14.140 14.220
Kenwood TS-570D
Blocking Dynamic Range
Preamplifier: ON, 500 Hz receiver BW - 600 Hz DSP Filter
P:\TESTS\TS570\TS570BDR.TXT
Frequency (MHz)
120.0
Swept Two-Tone, Third-Order Dynamic Range
D
y
110.0
Receiver Frequency = 14.02 MHz
n
a
100.0
m
i
90.0
c
80.0
r
a
70.0
n
g
60.0
e
d
50.0
B
40.0
13.920 13.960 14.000 14.040 14.080 14.120
TS-570D
Two-tone, third-order IMD dynamic range
Preamplifier: ON, 500 Hz receiver BW
600 Hz DSP
P:\TESTS\TS570\TS570IMD.TXTdWed Jan 22 17:51:32 1997
Frequency (MHz)
ARRL Laboratory Expanded Test-Result Report Model: Kenwood TS-570D Serial: 80600403
Copyright 1997, American Radio Relay League, Inc. All Rights Reserved. - Page 23

Second-Order IMD Test:
Test Description:
This test measures the amount of 2nd-order mixing that takes place in the receiver. Signals at 6.000 and
8.020 MHz are presented to the receiver and the resultant output at 14.020 MHz is measured.
Test Results:
Frequency
(MHz)
Preamplifier Mode Dynamic
Range (dB)
IP2
dBm
Notes
14.02 MHz OFF CW 95.1 dB +60.1 dBm
14.02 MHz ON CW 98.7 dB +58.7 dBm
Notes:
In-Band Receiver IMD Test:
Test Description:
passband of a receiver. Two signals, at levels of 50 uV (nominally S9), spaced 100 Hz are used. The receiver AGC is set to FAST.
The receiver is tuned so the two signals appear at 900 Hz and 1100 Hz in the receiver audio. The output of the receiver is viewed on
a spectrum analyzer and the 3rd- and 5th order products are measured directly from the screen. The smaller the products as seen on
the graph, the better the receiver. Generally, products that are less than 30 dB below the desired tones will not be cause
objectionable receiver intermodulation distortion.
Key Test Conditions:
S9 or S9 + 40 dB signals
Receiver set to SSB normal mode, nominal 2 - 3 kHz bandwidth
This test measures the intermodulation that occurs between two signals that are simultaneously present in the
Block Diagram:
IGNAL
RF S
ENERATOR
G
ARCONI
M
PORT
2-
OUPLER
C
MCL ZSFC 2-6
IGNAL
RF S
ENERATOR
G
HP 8640B
Notes:
2041
10 dB S
TTENUATOR
A
HP 355D
TEP
TEP
1 dB S
TTENUATOR
A
HP 355C
DUT
ECEIVER
R
HI-Z
ONITOR AMP
M
UDIO/
A
ISTORTION
D
ETER
M
HP 339A
ARRL Laboratory Expanded Test-Result Report Model: Kenwood TS-570D Serial: 80600403
Copyright 1997, American Radio Relay League, Inc. All Rights Reserved. - Page 24

In-Band Receiver IMD Graphs:
0
Reference Level: 0 dB
–10
–20
–30
–40
–50
–60
–70
–80
0.0 0.2 0.4 0.6 0.8 1.0 1.2 1.4 1.6 1.8 2.0
Kenwood TS-570D S/N: 80600403
14.020 MHz, AGC Fast, In-Band Receiver IMD
P:\TESTS\TS570\TS570IBF.TXTWed Jan 22 18:16:55 1997
Audio Frequency: 0 to 2 kHz
0
Reference Level: 0 dB
–10
–20
–30
–40
–50
–60
–70
–80
0.0 0.2 0.4 0.6 0.8 1.0 1.2 1.4 1.6 1.8 2.0
Kenwood TS-570D S/N: 80600403
14.020 MHz, AGC Slow, In-Band Receiver IMD
P:\TESTS\TS570\TS570IBS.TXTWed Jan 22 18:15:59 1997
Audio Frequency: 0 to 2 kHz
ARRL Laboratory Expanded Test-Result Report Model: Kenwood TS-570D Serial: 80600403
Copyright 1997, American Radio Relay League, Inc. All Rights Reserved. - Page 25
FM Adjacent Channel Selectivity Test:
Test Description
receiver to r eject interference fr om individu al undesired sig nal s while receiving various l evel s of desired s ignal. T he desi red carri er
signal will be at 29.000 MHz, modulated at 1000 Hz, and the offending signal will be located at adjacent nearby frequencies with
400 Hz modulation. (NOTE: The SINAD Test in 5.3 m u st be per form ed before this test can be completed.) The great er the number
in dB, the better the rejection.
Test Results:
Frequency
(MHz)
29.0 MHz ON 20 kHz 67.7 dB
Notes:
:
The purpose of th e FM Adjacent Channel Selectivity Test is to measure the ability of the device under test
Preamplifier Frequency
Spacing
(kHz)
Adjacent-channel
rejection (dB)
Notes
FM Two-Tone 3rd-Order Dynamic Range Test:
Test Description: T
tolerated by the device under testing th e FM mode while producing no spurious responses greater t han the 12-dB SINAD level. To
perform this test, two signals, f
signal located 40 kHz from the distortion product being measured is modulated at 1,000 Hz with a deviation of 3 kHz. Th e receiver
is tuned to the Third Order IMD fr equencies as determined by (2f
by equal amounts until 25 % distortion, or the 12 dB SINAD point, i s obtained. Frequencies 10 MHz outside the amateur band are
used to test the wide-band dyn amic range. The greater the dynamic range, the better the receiver performance.
he purpose of the FM Two-Tone 3
and f2, of equal amp litu d e and spaced 20 k Hz apart, a re injected i nto the input of t he receiver. The
1
rd
Order Dyn amic Range Test is to determine the range of signals that can be
) and (2f2-f1). The input signals are then raised simultaneously
1-f2
Test Results:
Frequency
(MHz)
29 MHz OFF 20 kHz 66.3 dB 1
29 MHz ON 20 kHz 66.9 dB
Notes:
1. The IF bandwidth cannot be changed in the FM mode.
Preamplifier Frequency
Spacing
(kHz)
FM Dynamic
Range (dB)
Notes
ARRL Laboratory Expanded Test-Result Report Model: Kenwood TS-570D Serial: 80600403
Copyright 1997, American Radio Relay League, Inc. All Rights Reserved. - Page 26

Image Rejection Test:
Test Description:
inp ut to the receiver at th e fi rst I F image frequencies that will produce an audio output equal to the MDS level. The test is conducted
with the receiver in t he CW mode u s ing the 500 Hz, or closest available, IF filters. Any audio filtering is disabled and AGC is
tur ned OFF, i f possibl e. The test is performed with the recei ver tun ed to 14.250 MHz for receivers t hat have 20-meter capability, or
to a fr eq u ency 20 kHz up from the lower band edg e for sin gle-band r eceivers. The great er the number in dB, t he better the ima ge
rejection.
Test Results:
Frequency
(MHz)
14.250 MHz OFF CW 160.35 MHz 109.3 dB
14.250 MHz ON CW 160.35 MHz 119.5 dB
Notes:
This test measures the amount of image rejection for superhetrodyne receivers by determining the level of signal
Preamplifier Mode Calculated
Image
Frequency
(MHz)
Image
Rejection
(dB)
Notes
IF Rejection Test:
Test Description:
inp ut to the receiver at th e fi rst I F that will produce an audio output equal to the MDS level. The test i s conducted wit h the receiver
in the CW mode using the 500 Hz, or closest available, IF filters. Any audio filtering is disabled and AGC is turned OFF, if
possible. Th e test is performed with the receiver tuned to 14.250 MHz for receivers t hat have 20-meter capability, or to a frequency
20 kHz up from t he lower ba nd edg e for sin g le-ban d recei vers. The greater th e number in dB, the better the IF r ejection.
This test measures the amount of first IF rejection for superhetrodyne receivers by determining the level of signal
Test Results:
Frequency
(MHz)
14.250 MHz OFF CW 114.6 dB
14.250 MHz ON CW 123.2 dB 1
Notes:
1) Measurement was noise limited at this value.
Preamplifier Mode 1st IF Rejection
(dB)
Notes
Audio Output Power Test:
Test Description:
distortion are used. For units not specified, an 8-ohm load and 10% harmonic distortion are used.
Test Results:
Specified Distortion Specified Load
Not specified. 8 ohms 2.10 W 1
Notes:
This test measures the audio power delivered by the receiver. The manufacturer's specification for load and
Impedance
Audio Output
Power (W)
Notes
1. The maximum possible distortion was 3.65% THD. The manufacturer’s specification is 1.5 watts or more.
ARRL Laboratory Expanded Test-Result Report Model: Kenwood TS-570D Serial: 80600403
Copyright 1997, American Radio Relay League, Inc. All Rights Reserved. - Page 27
IF + Audio Frequency Response Test:
Test Description:
receiver audio drops 6 dB from the peak signal response. The frequency-response bandwidth is then calculated by taking the
difference between the lower and upper frequency.
Test Results:
IF Filter
Use/Unit Mode
CW 500/600 Hz 534 Hz 258 Hz 769 HZ 511 Hz 1
CW 500/400 Hz 501 297 713 416 1
CW 500/100 Hz 506 443 557 114 1
CW 500/50 Hz 504 470 530 60 1
CW 1 kHz 511 199 1044 845 2
CW 2 kHz 494 224 1534 1310 2
USB Wide 714 286 2433 2147 3
USB Mid 782 404 1633 1229 3
LSB Wide 644 287 2428 2141 3
LSB Mid 706 404 1626 1222 3
AM WIDe 617 2670 115 2555 4
AM NARrow 537 113 1270 1157 4
Notes:
The purpose of the IF + Audio Frequency Response Test is to measure the audio frequencies at which the
Nominal
Bandwidth
Center Freq
(Hz)
Low Freq
(Hz)
High Freq
(Hz)
Difference
(bandwidth)
Notes
1. Bandwidths specified as IF Bandwidth/DSP Bandwidth.
2. DSP filter bandwidth with wide IF filter bandwidth. (NOTE: Optional 500 Hz IF filter disengaged when DSP filter bandwidth is
greater than 600 Hz).
3. WIDe IF filter with DSP Bandwidth specified as high and low cut control settings. The mid settings were both high and low cut
controls set halfway at the 12:00 o’clock position.
4. AM filter options are WIDe and NARrow. The DSP High and Low cut controls were set for maximum bandwidth.
Squelch Sensitivity Test:
Test Description:
squelch at the threshold and at the point of maximum squelch. This number is not usually critical. A result anywhere between 0.05
and 0.5 uV is usually useful. The maximum can range to infinity.
Test Results:
Frequency
(MHz)
29.0 MHz ON FM 0.043 uV 0.254 uV
14.2 MHz ON SSB 0.436 uV 43.6 uV
Notes:
The purpose of the Squelch Sensitivity Test is to determine the level of the input signal required to break
Preamplifier Mode Minimum
(uV)
Maximum
(uV)
Notes
ARRL Laboratory Expanded Test-Result Report Model: Kenwood TS-570D Serial: 80600403
Copyright 1997, American Radio Relay League, Inc. All Rights Reserved. - Page 28

S-Meter Test:
Test Description:
S9+20 dB indication on the receiver S meter. This test is performed with the receiver in the CW mode at a frequency of 14.200
MHz. The IF filter is set to 500 Hz, nominal. A traditional S9 signal is a level of 50 uV (an old Collins receiver standard). The
Collins standard S unit was 6 dB. This is , however, not a hard and fast rule, especially for LED or bar-graph type S meters.
Test Results:
Frequency
(MHz)
14.2 MHz OFF S9 94.3 uV
14.2 MHz ON S9 25.1 uV
14.2 MHz ON S1 1.32 uV
14.2 MHz ON S5 3.59 uV
14.2 MHz ON S9 + 10 111 uV
14.2 MHz ON S9 + 20 367 uV
29.0 MHz ON S9 25.7 uV
1.0 MHz ON S9 168 uV
Notes:
1. The S9+10 dB measurement was made with S meter indication halfway between S9 and S9+20 dB.
The purpose of the S-Meter Test is to determine the level of RF input signal required to produce an S9 and
Preamplifier S Units uV Notes
Notch Filter Test:
Test Description:
detect and notch a signal. The more negative the notch depth number, the better the performance.
Test Results: <add more rows as necessary for different conditions>
Frequency
(MHz)
14.250 MHz Beat Cancel > 50 dB
Notes:
This test measures the notch filter depth at 1 kHz audio and the time required for auto-notch DSP filters to
MODE Notch Depth
(dB)
Notes
Temperature Chamber Test Description:
All equipment that would normally be used outdoors are subjected to a function, output power and frequency accuracy test over its
specified temperature range. For those units not specified, the unit is operated at the manufacturer’s specified limits, or if not
specified, -10 and +60 degrees Celsius. These temperatures were chosen to represent typical specifications and typical outdoor use
over most of the country.
Duty Cycle Test Description:
Most equipment does not specify a duty cycle. For this reason, most Product Review equipment is not subject to a specific duty cycle
test. It is assumed that equipment without a duty-cycle specification is intended for conversational use on CW or SSB. The
equipment sees considerable such use during the review process. If equipment does have a duty-cycle specification, such as
"continuous," "continuous commercial" or a specific time parameter, the equipment is tested against that specification. If the unit
does not pass, this will be treated as a defect that occurred during the review.
ARRL Laboratory Expanded Test-Result Report Model: Kenwood TS-570D Serial: 80600403
Copyright 1997, American Radio Relay League, Inc. All Rights Reserved. - Page 29
 Loading...