


LogWorks 3
User Manual
1 |
Overview ............................................................................................................................ |
|
- 6 - |
|
|
1.1 |
Specifications ............................................................................................................. |
|
- 6 - |
|
1.2 |
Manual Conventions .................................................................................................. |
|
- 7 - |
|
1.2.1 |
Important Info Marker............................................................................................. |
|
- 7 - |
|
1.2.2 |
Menu Selection Terminology ................................................................................. |
|
- 7 - |
|
1.3 |
Manual Overview........................................................................................................ |
|
- 8 - |
|
1.4 |
LogWorks Overview ................................................................................................... |
|
- 9 - |
|
1.4.1 |
LogWorks Data Views............................................................................................ |
|
- 9 - |
|
1.4.2 |
LogWorks Plug-ins................................................................................................. |
|
- 9 - |
2 |
Logging engine data....................................................................................................... |
|
- 11 - |
|
|
2.1 |
Data logging 101 ...................................................................................................... |
|
- 11 - |
|
2.1.1 |
Definitions ............................................................................................................ |
|
- 11 - |
|
2.1.2 |
Logging rate ......................................................................................................... |
|
- 11 - |
|
2.1.3 |
Logging resolution................................................................................................ |
|
- 13 - |
|
2.2 |
Sensors and the Modular Tuning System ................................................................ |
|
- 14 - |
|
2.3 |
Sensor Hookup......................................................................................................... |
|
- 15 - |
|
2.4 |
The Innovate Log-Chain concept ............................................................................. |
|
- 17 - |
|
2.5 |
LogWorks Channels ................................................................................................. |
|
- 18 - |
|
2.5.1 |
Value channels .................................................................................................... |
|
- 18 - |
|
2.5.2 |
Bit channels ......................................................................................................... |
|
- 19 - |
|
2.5.3 Identifying devices and Channels ........................................................................ |
|
- 19 - |
|
|
2.6 |
Logs and Sessions ................................................................................................... |
|
- 21 - |
|
2.7 |
LogWorks Files and Folders .................................................................................... |
|
- 22 - |
|
2.7.1 Files used by LogWorks 3 in the main Folder ..................................................... |
|
- 22 - |
|
|
2.7.2 LM1 Log Files Folder ........................................................................................... |
|
- 22 - |
|
|
2.7.3 |
LWSettings Folder ............................................................................................... |
|
- 23 - |
3 |
Starting up LogWorks .................................................................................................... |
|
- 24 - |
|
|
3.1 |
The LogWorks 3 Dashboard .................................................................................... |
|
- 25 - |
|
3.1.1 Changing the preferences for units...................................................................... |
|
- 26 - |
|
4 |
Channel Setup and Configuration................................................................................. |
|
- 27 - |
|
|
4.1 |
Custom Input Lookup Tables ................................................................................... |
|
- 32 - |
|
4.2 |
Thermistor Temp Sensor Configuration ................................................................... |
|
- 34 - |
|
4.2.1 |
Thermistor circuit ................................................................................................. |
|
- 35 - |
|
4.2.2 |
Configuring a Thermistor ..................................................................................... |
|
- 36 - |
|
4.3 |
Changing Channel Trace Colors.............................................................................. |
|
- 38 - |
|
4.4 |
Storing and loading channel configurations ............................................................. |
|
- 38 - |
5 |
LogWorks Gauges .......................................................................................................... |
|
- 40 - |
|
|
5.1 |
Anatomy of a LogWorks gauge................................................................................ |
|
- 40 - |
|
5.2 |
LogWorks gauge types ............................................................................................ |
|
- 41 - |
|
5.2.1 Round, Vertical Bar, Horizontal Bar, Multi and Numeric gauges......................... |
- 41 - |
||
|
5.2.2 |
Vector gauge........................................................................................................ |
|
- 42 - |
|
5.2.3 |
Indicator Light ...................................................................................................... |
|
- 42 - |
|
5.3 |
Selecting, adding, deleting and editing gauges. ...................................................... |
|
- 42 - |
|
5.3.1 |
Selecting a gauge ................................................................................................ |
|
- 42 - |
|
5.3.2 Adding and editing gauges .................................................................................. |
|
- 43 - |
|
|
5.4 |
Skins and colors ....................................................................................................... |
|
- 45 - |
|
5.4.1 |
Backgrounds ........................................................................................................ |
|
- 46 - |
|
5.4.2 Saving and Loading Skins ................................................................................... |
|
- 46 - |
|
|
5.5 |
Changing gauge sizes and position ......................................................................... |
|
- 47 - |
|
5.5.1 |
Changing gauge size ........................................................................................... |
|
- 47 - |
|
5.5.2 |
Aligning gauges ................................................................................................... |
|
- 47 - |
|
5.5.3 Changing gauge depth position relative to other gauges .................................... |
- 47 - |
||
|
5.6 |
Resetting and displaying Min/Max Value of a gauge ............................................... |
|
- 48 - |
|
5.6.1 |
Resetting Min/Max hold ....................................................................................... |
|
- 48 - |
|
5.6.2 |
Displaying Min/Max Values.................................................................................. |
|
- 48 - |
|
5.7 |
Using multiple gauge sets ........................................................................................ |
|
- 48 - |
|
|
- 2 - |
LogWorks3_Manual_1.01.doc |
|
|
5.8 |
Full Screen Mode ..................................................................................................... |
|
- 49 - |
6 |
Using the LogWorks Main Dashboard .......................................................................... |
|
- 50 - |
|
|
6.1 |
Connecting to the MTS Log Chain ........................................................................... |
|
- 50 - |
|
6.2 |
Real time logging...................................................................................................... |
|
- 50 - |
|
6.2.1 Triggered Real time Logs .................................................................................... |
|
- 51 - |
|
|
6.3 |
Real time Math channels.......................................................................................... |
|
- 55 - |
|
6.4 |
Viewing existing log Files ......................................................................................... |
|
- 56 - |
|
6.5 |
Downloading from an LM-1 or LM-2/DL-32 recorded SD card ................................ |
- 56 - |
|
|
6.5.1 |
Downloading LM-1 data ....................................................................................... |
|
- 56 - |
|
6.5.2 Downloading SD-card (LM-2 or DL-32) data ....................................................... |
|
- 57 - |
|
|
6.6 |
Selecting Representation of the Mixture .................................................................. |
|
- 58 - |
|
6.7 |
And Further .............................................................................................................. |
|
- 58 - |
|
6.7.1 LogWorks Main Window Menu ............................................................................ |
|
- 58 - |
|
|
6.7.2 |
Help Menu............................................................................................................ |
|
- 58 - |
7 |
Working with Logs and Sessions ................................................................................. |
|
- 59 - |
|
|
7.1 |
The Log Window ...................................................................................................... |
|
- 59 - |
|
7.2 |
Navigating Logs........................................................................................................ |
|
- 61 - |
|
7.2.1 Changing the size of the Panes ........................................................................... |
|
- 61 - |
|
|
7.2.2 |
Navigating Sessions ............................................................................................ |
|
- 61 - |
|
7.2.3 Scrolling in the Time Axis .................................................................................... |
|
- 61 - |
|
|
7.2.4 Zooming in and out in the Time Scale ................................................................. |
|
- 62 - |
|
|
7.2.5 |
Measuring ............................................................................................................ |
|
- 62 - |
|
7.2.6 |
Identifying Channels ............................................................................................ |
|
- 63 - |
|
7.2.7 |
Marker Lines ........................................................................................................ |
|
- 63 - |
|
7.3 |
Manipulating channel traces .................................................................................... |
|
- 64 - |
|
7.3.1 |
The scale pane .................................................................................................... |
|
- 64 - |
|
7.3.2 Zooming in and out on a channel trace ............................................................... |
|
- 65 - |
|
|
7.3.3 |
Smoothing channels ............................................................................................ |
|
- 65 - |
|
7.3.4 |
Hiding/Showing channels .................................................................................... |
|
- 66 - |
|
7.3.5 |
Deleting channels ................................................................................................ |
|
- 66 - |
|
7.3.6 |
Configuring Channels .......................................................................................... |
|
- 67 - |
|
7.3.7 |
Math Channels ..................................................................................................... |
|
- 67 - |
|
7.3.8 |
Channel Templates.............................................................................................. |
|
- 67 - |
|
7.4 |
Selecting areas in a Session.................................................................................... |
|
- 69 - |
|
7.4.1 |
Inverting a selection ............................................................................................. |
|
- 69 - |
|
7.4.2 Auto Selecting and Searching ............................................................................. |
|
- 69 - |
|
|
7.4.3 Scanning through selected areas ........................................................................ |
|
- 71 - |
|
|
7.5 |
Working with Sessions ............................................................................................. |
|
- 72 - |
|
7.5.1 |
Changing session information ............................................................................. |
|
- 72 - |
|
7.5.2 |
Notes and comments ........................................................................................... |
|
- 72 - |
|
7.5.3 Deleting a whole Session or parts of a session ................................................... |
|
- 73 - |
|
|
7.5.4 |
Copying and Pasting............................................................................................ |
|
- 75 - |
|
7.5.5 |
Overlays ............................................................................................................... |
|
- 75 - |
|
7.6 |
Saving, exporting and Printing ................................................................................. |
|
- 76 - |
|
7.6.1 Exporting to different file formats ......................................................................... |
|
- 76 - |
|
|
7.6.2 |
Printing Logs ........................................................................................................ |
|
- 77 - |
|
7.7 |
Alternate Views of Sessions and Logs..................................................................... |
|
- 78 - |
|
7.7.1 |
Playback .............................................................................................................. |
|
- 78 - |
|
7.7.2 |
Statistics Views .................................................................................................... |
|
- 79 - |
|
7.7.3 Opening X-Y Plot Views....................................................................................... |
|
- 80 - |
|
|
7.7.4 |
Opening 3D charts ............................................................................................... |
|
- 81 - |
8 |
X-Y Plots .......................................................................................................................... |
|
- 83 - |
|
|
8.1 |
Selecting the channels to plot .................................................................................. |
|
- 84 - |
|
8.1.1 |
XY - Templates .................................................................................................... |
|
- 85 - |
|
8.2 |
Selecting the data to show ....................................................................................... |
|
- 85 - |
|
8.3 |
X-Y Plot representation ............................................................................................ |
|
- 86 - |
|
8.3.1 |
Scatter Plot .......................................................................................................... |
|
- 86 - |
|
|
- 3 - |
LogWorks3_Manual_1.01.doc |
|
|
8.3.2 |
|
Line Plot ............................................................................................................... |
|
- 86 - |
|
8.3.3 |
|
Text Table View ................................................................................................... |
|
- 87 - |
|
8.4 |
Zooming and scrolling the view................................................................................ |
|
- 88 - |
|
|
8.4.1 Increasing the axis resolution .............................................................................. |
|
- 88 - |
||
|
8.4.2 Reducing the axis resolution................................................................................ |
|
- 88 - |
||
|
8.4.3 |
|
Scrolling ............................................................................................................... |
|
- 88 - |
|
8.4.4 Auto scaling the x-axis ......................................................................................... |
|
- 88 - |
||
|
8.5 |
Marker Lines............................................................................................................. |
|
- 89 - |
|
|
8.6 |
Min Max Info............................................................................................................. |
|
- 89 - |
|
|
8.7 |
Channel Identification............................................................................................... |
|
- 90 - |
|
|
8.8 |
Polar Coordinates..................................................................................................... |
|
- 90 - |
|
|
8.8.1 Marker Lines in Polar View .................................................................................. |
|
- 91 - |
||
|
8.8.2 Interpretation example of Polar View................................................................... |
|
- 92 - |
||
9 |
3D charts and graphs ..................................................................................................... |
|
- 93 - |
||
|
9.1 |
The 3D chart window ............................................................................................... |
|
- 93 - |
|
|
9.2 |
Selecting data to base the chart on.......................................................................... |
|
- 94 - |
|
|
9.2.1 |
|
Locking a chart..................................................................................................... |
|
- 94 - |
|
9.3 |
Manipulating the chart settings ................................................................................ |
|
- 95 - |
|
|
9.3.1 Adding a column or row ....................................................................................... |
|
- 95 - |
||
|
9.3.2 Changing row or column header values .............................................................. |
|
- 95 - |
||
|
9.3.3 Copying/pasting row and column settings ........................................................... |
|
- 95 - |
||
|
9.3.4 Changing the Chart channels .............................................................................. |
|
- 96 - |
||
|
9.3.5 Deleting rows or columns .................................................................................... |
|
- 97 - |
||
|
9.4 |
Chart Templates....................................................................................................... |
|
- 97 - |
|
|
9.5 |
Colorizing a chart ..................................................................................................... |
|
- 98 - |
|
|
9.6 |
User sub-charts ........................................................................................................ |
|
- 99 - |
|
|
9.6.1 Creating a user sub-chart .................................................................................... |
|
- 99 - |
||
|
9.6.2 Entering data in a user sub-chart......................................................................... |
|
- 99 - |
||
|
9.6.3 Deleting user chart entries ................................................................................... |
|
- 99 - |
||
|
9.6.4 Filling in user data quickly.................................................................................. |
|
- 100 - |
||
|
9.6.5 |
|
Blending ranges ................................................................................................. |
|
- 100 - |
|
9.7 |
Exchanging chart data with other programs .......................................................... |
|
- 101 - |
|
|
9.7.1 |
|
Exporting chart data........................................................................................... |
|
- 101 - |
|
9.7.2 Copying and pasting chart data ......................................................................... |
|
- 101 - |
||
|
9.8 |
Overlaying charts ................................................................................................... |
|
- 101 - |
|
|
9.9 |
Viewing a sub-chart as 3D-graph........................................................................... |
|
- 103 - |
|
|
9.9.1 Manipulating the graph view .............................................................................. |
|
- 106 - |
||
|
9.9.2 |
|
Glyphs ................................................................................................................ |
|
- 106 - |
|
9.9.3 Overlays on 3D graphs ...................................................................................... |
|
- 107 - |
||
|
9.10 |
Calculations with charts ......................................................................................... |
|
- 108 - |
|
|
9.11 |
Realtime indication in the chart and graph (Map tracing) ...................................... |
- 109 - |
||
|
9.12 |
Some tips on working with charts........................................................................... |
|
- 109 - |
|
10 |
Math Trace Calculator .................................................................................................. |
|
- 111 - |
||
|
10.1 |
Calculator basics .................................................................................................... |
|
- 112 - |
|
|
10.2 |
Asking for user data ............................................................................................... |
|
- 113 - |
|
|
10.3 |
Restrictions on variable names .............................................................................. |
|
- 114 - |
|
|
10.4 |
Using LogWorks channels ..................................................................................... |
|
- 114 - |
|
|
10.5 |
Calculating new LogWorks channels ..................................................................... |
|
- 116 - |
|
|
10.5.1 |
Creating calculated value channels............................................................... |
|
- 116 - |
|
|
10.5.2 |
Calculating new bit channels ......................................................................... |
|
- 117 - |
|
|
10.6 |
Dealing with units ................................................................................................... |
|
- 119 - |
|
|
10.7 |
Formula Calculator Functions ................................................................................ |
|
- 120 - |
|
|
10.8 |
Chart Calculator ..................................................................................................... |
|
- 122 - |
|
|
10.8.1 |
Pre-assigned names for the standard sub-charts: ........................................ |
- 122 - |
||
|
10.8.2 |
Using the Chart Calculator ............................................................................ |
|
- 122 - |
|
11 |
LogWorks Libraries ...................................................................................................... |
|
- 124 - |
||
|
11.1 |
Using the Libraries ................................................................................................. |
|
- 124 - |
|
|
|
|
- 4 - |
LogWorks3_Manual_1.01.doc |
|
|
11.1.1 |
Basic usage ................................................................................................... |
- 124 - |
|
|
11.1.2 |
Adding a new formula to a library .................................................................. |
- 125 - |
|
|
11.2 |
LogWorks built-in Trace calculations ..................................................................... |
- 126 - |
|
|
11.2.1 |
Category: Fuel Calculations .......................................................................... |
- 126 - |
|
|
11.2.2 |
Density and VE .............................................................................................. |
- 126 - |
|
|
11.2.3 |
Power calculations......................................................................................... |
- 126 - |
|
|
11.3 |
LogWorks built-in chart calculations....................................................................... |
- 128 - |
|
|
11.3.1 |
Fueling calculations ....................................................................................... |
- 128 - |
|
|
11.4 |
Library file format.................................................................................................... |
- 128 - |
|
|
11.4.1 |
Name comment ............................................................................................. |
- 128 - |
|
|
11.4.2 |
Category comment ........................................................................................ |
- 128 - |
|
|
11.4.3 |
Description comment..................................................................................... |
- 129 - |
|
12 |
LogWorks Plug-ins ....................................................................................................... |
- 130 - |
||
13 How LogWorks unit conversions work ...................................................................... |
- 131 - |
|||
|
13.1 |
Conventions on unit names.................................................................................... |
- 131 - |
|
|
13.1.1 |
Temperature conventions.............................................................................. |
- 131 - |
|
|
13.1.2 |
Pressure conventions .................................................................................... |
- 131 - |
|
|
13.2 |
The Conversions.txt format .................................................................................... |
- 132 - |
|
14 Tips & Tricks for using LogWorks .............................................................................. |
- 134 - |
|||
15 Interfacing with various sensors................................................................................. |
- 138 - |
|||
|
15.1 |
Electronic parts basics ........................................................................................... |
- 138 - |
|
|
15.1.1 |
Diodes............................................................................................................ |
- 138 - |
|
|
15.1.2 |
IC’s................................................................................................................. |
- 138 - |
|
|
15.1.3 |
Resistors........................................................................................................ |
- 138 - |
|
|
15.1.4 |
Capacitors (Caps).......................................................................................... |
- 139 - |
|
|
15.2 |
Using external MAP sensors.................................................................................. |
- 140 - |
|
|
15.2.1 |
Calibrating a 3 bar (or more) MAP sensor..................................................... |
- 140 - |
|
|
15.2.2 |
Calibrating a 1 bar MAP sensor .................................................................... |
- 140 - |
|
|
15.3 |
Measuring voltages higher than 5 Volt................................................................... |
- 141 - |
|
|
15.4 |
Using Thermocouples ............................................................................................ |
- 142 - |
|
|
15.5 |
Measuring duty cycle of peak-hold injectors .......................................................... |
- 143 - |
|
|
15.6 |
Making a 5 Volt supply for external sensors .......................................................... |
- 143 - |
|
|
15.7 |
And finally, a weird one .......................................................................................... |
- 144 - |
|
16 |
Revision History............................................................................................................ |
- 145 - |
||
- 5 - |
LogWorks3_Manual_1.01.doc |
1 Overview
LogWorks is a software application that interfaces with the Innovate Modular Tuning System products. It enables easy analysis and manipulation of engine data acquired by MTS components and also allows to view engine data in real-time on the on-screen virtual gauges.
This manual describes the basics of data logging with the Innovate Modular Tuning System and how to use the LogWorks 3.0 Program. In addition this manual shows how you can extend the capabilities of the MTS with some basic electronic skills.
1.1 Specifications
Computer Requirements |
|
Operating System |
Windows 98 or later |
Computer speed |
600MHz Pentium 1 or faster |
RAM |
Min. 100 Mbyte more than recommended for the |
|
operating system |
Hard Disk space |
Min. 100 Mbyte free space |
Display |
Thousands of colors, 800 x 600 Min. |
Other |
1 free serial port or USB to serial adapter |
LogWorks 3 Limits |
|
Max. Session Size |
1 hr 30 minutes |
|
(65536 sample sets at 0.08192 sec/set) |
Max. Number of sessions per log |
1024 |
Max. Number of logs open |
32 open concurrently |
Max. Number of value channels |
64 |
Max. Number of bit channels |
32 |
Max. Number of channels total |
96 |
- 6 - |
LogWorks3_Manual_1.01.doc |
1.2Manual Conventions
1.2.1Important Info Marker
In this Manual important info and notes are highlighted with a  Marker.
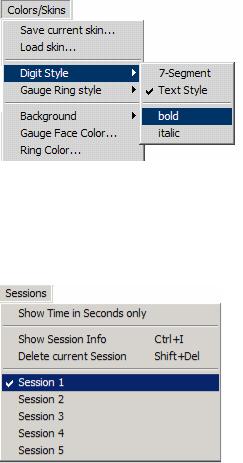
1.2.2Menu Selection Terminology
Menu Selections of a Window are shown as
Main Item->Item->Sub Item
Example selecting the Sub-Menu item “bold” in this menu:
Would be shown as:
Colors/Skins->Digit Style->bold.
If the menu item to select is variable, for example the name of a session or channel, the actual item name is shown in bold and italics
In this case it would be shown as Sessions->Session Name.
- 7 - |
LogWorks3_Manual_1.01.doc |
1.3Manual Overview
This manual is divided into chapters and is to be used both as a tutorial on how to use LogWorks as well as a reference handbook for the LogWorks program.
Chapter 1
Is the Overview you are reading.
Chapter 2
Explains the basics of data logging, channels, sessions and logs and what files LogWorks uses.
Chapter 3
Deals with Starting up LogWorks and shows the initial view of the LogWorks Main Dashboard.
Chapter 4
Explains channel configuration in LogWorks in detail.
Chapter 5
Explains LogWorks gauges and their setup and manipulation.
Chapter 6
Explains the functions available in the LogWorks Main Dashboard.
Chapter 7
Explains how to deal with logs and sessions and explains the analyzing functions available in the main log window
Chapter 8
Explains the X-Y Plot view of data. This is a view of channel data plotted against another channel.
Chapter 9
Explains the 3D chart view of data. This is a view of channel data plotted or analyzed against two other channels. For example air-fuel against RPM and MAP. This chapter is important for creating fuel and spark tables.
Chapter 10
Explains the Math Engine in LogWorks used to mathematically analyze the data or create new math channels.
Chapter 11
Describes the built-in formulas of LogWorks to be used with the math engine.
Chapter 12
Describes the Plug-in architecture to extend the functionality of LogWorks.
Chapter 13
Explains the unit conversion mechanism of LogWorks.
Chapter 14
Shows Tips and Tricks in using LogWorks
Chapter 15
Shows how to interface to various sensors.
Chapter 16
Revision History
- 8 - |
LogWorks3_Manual_1.01.doc |
1.4LogWorks Overview
1.4.1LogWorks Data Views
The LogWorks application is used to record, display and analyze engine or car data. Natively it provides six different “views” of the data:
1. Main Dashboard
This view displays the current engine data (real-time data) in “gauges”. Similar to a car’s dashboard. The gauges are configurable in many ways. This view is active whenever LogWorks receives engine data, whether the data is being logged or not.
2.Time Trace Log View
This is the main view of a datalog. A datalog is a collection of engine data, sorted by recording time. The data in the Time Trace Log View (Log Window) is shown graphically and can be analyzed in many ways. During recording with LogWorks this view is updated automatically as new data arrives.
3.Playback View
This is a sub-view of the Time-Trace Log View when the log is played back. This view is similar to the Main Dashboard View, but shows the recorded engine data in it’s time sequence when playing back.
4.X-Y Plot View
In this View the logged engine data is shown in its dependency of another channel. A common example is to plot AFR as dependent on RPM. But any channel data combination can be used. The X-Y Plot view also allows viewing and analyzing the data in different ways. This view is NOT automatically updated during recording.
5.3D Chart View
In this View the logged engine data is analyzed and shown in its dependency of two other channels. A common example is to show AFR data as dependent on RPM and engine load. But any channel combination can be used. This view sorts the engine data into different fields. The spacing and number of field columns and rows is user adjustable so it for example fits the spacing and number of how a fuel injection’s fuel tables are stored. This view is automatically updated during recording and provides many analyzing functions.
6.Channel Statistics View
In this view a single channel is analyzed and its statistical distribution during a recording session is shown. This view is NOT automatically updated during recording.
1.4.2LogWorks Plug-ins
LogWorks 3 can be extended with plug-ins. A plug-in is a piece of computer code or program that extends the functionality of LogWorks. Innovate provides some plug-ins for 3rd party products as examples, but 3rd parties can also provide plug-ins for LogWorks. The LogWorks SDK document describes how to create a plug-in.
LogWorks allows functionally 5 different types of plug-ins. A plug-in module does not have to be of a single type, but can provide the functional equivalent of multiple types.
- 9 - |
LogWorks3_Manual_1.01.doc |
LogWorks plug-in types:
1.Acquisition Plug-ins
This plug-in type provides real-time engine data from another type of interface, e.g. not an Innovate device. An example is a plug-in that reads OBDII data from an OBDII interface for a factory ECU and feeds that data to LogWorks, or a plug-in for an aftermarket ECU or piggyback to data log that devices data.
The only restriction for Acquisition plug-ins is that at least ONE Innovate MTS device MUST be connected to the computer and is providing real time data.
2.Real Time Channel Processor Plug-ins
This type of plug-in uses real-time engine data recorded from innovate MTS devices or Acquisition Plug-ins to either filter or modify the recorded data, or create a new recording channel filled with the results of computing new data from existing engine data. An example of this might be a plug in to convert a torque input channel and RPM information into a real time HP channel.
3.Channel Processor Plug-ins
This type of plug-in operates similar to a real time channel plug-in, but operates on a whole recorded data session or data log. These plug-ins can be used to analyze the engine data in a way not provided by LogWorks, show different views of the data not provided by LogWorks or modify the recorded data, show “out-of-band” data that was captured concurrently with the data log, but not stored as part of it. Examples would be GPS data for track mapping, or video data from a video recording.
4.Chart Source Plug-ins
These are very simple plug-ins. A chart source has to do only one thing: Provide chart column and row spacing data.
A chart source plug-in for example could download column and row spacing information from an ECU so a LogWorks chart matches the ECU tables.
5.Chart Processor Plug-ins
A chart processor Plug-in can be used to, but is not restricted to:
a.Process chart data for example to create a new fuel table
b.Provide a different view of the chart data
c.Retrieve the current fuel table from the ECU, modify it based on data from the data log and write it back.
d.Whatever the programmer can think of to do with charts.
- 10 - |
LogWorks3_Manual_1.01.doc |
2 Logging engine data
2.1Data logging 101
Data logging is basically the recording of engine data. Engine data is measured with various sensors. Two types of logging are common.
a.Time based logging
b.RPM based logging
In time based logging the sensor data is read in fixed time intervals. This is similar to how a movie projector or a TV works. In a movie, a snapshot of the camera scene is taken 24 times per second. Because of the limited speed of the human eye, these snapshots, when viewed at the same sample rate of 24 snapshots per second, seem like continuous motion to the human eye.
Time based data logging works the same way. A snapshot of the engine state is recorded at fixed time intervals.
RPM based logging is mainly used in conjunction with chassisor engine-dynamometers. Their purpose is to measure power and torque curves of an engine in relation to RPM. Typical RPM interval is every 50 RPM. Although this serves its purpose, time-dependent dynamic effects can’t be analyzed with this logging method.
A time based recording can be converted into an RPM based recording (LogWorks has that capability), but an RPM based recording can’t be converted back into a time based recording.
2.1.1Definitions
Channel
A channel is the data from a single sensor, like AFR or RPM.
Sample
A snapshot of the engine state is called a sample. A sample can contain the data of many channels, but they are all measured ideally at the same time.
Sample Rate
The sample rate is the number of samples (snapshots) of engine data taken per second.
Channel Rate
The channel rate is the number of total channel measurements taken per second. It is the number of sensors measured for each sample multiplied by the sample rate.
2.1.2Logging rate
The data logging rate or speed (samples per second) is dependent on what data is to be logged. When logging engine data, 99% of the data changes no faster than about 5 times per second (one state to another and back).
- 11 - |
LogWorks3_Manual_1.01.doc |
The engine state is ultimately controlled by the driver’s right foot. The fastest external muscle in humans is the eye-lid muscle. It goes through one blink-cycle in about 100 milliseconds.
A mathematician named Harry Nyquist found out (in 1928), that for anything that you want to record, you only need to record at twice the maximum frequency contained in the recorded signal. So, for the human eye-lid, the required minimum logging speed is 20 times/second. The human foot, controlling a gas pedal, is much slower. Remember, the frequency is not measured from idle to WOT, but from idle to WOT and back.
The second parameter determining the logging speed is the statistical nature of the combustion process itself. No two combustion events in an engine are identical. Therefore, to get meaningful data, multiple combustion events must be averaged to see the overall effects. If each combustion event is analyzed and recorded, meaningful tuning data can’t be seen in most cases. At 6000 RPM an engine goes through 50 engine cycles per second (a 4-stroke engine cycle requires two rotations per cycle). At a logging speed of 12.5 samples per second this would mean that the resulting data is the average of 4 engine cycles.
The above means that data logging engine data needs to be done at 10-15 samples per second. Anything more creates only more data points which do not contain any additional information, but are harder to analyze.
The Innovate Modular Tuning System samples engine data at 12.2 samples/second.
 This sample rate is the rate for a sample containing multiple sensor data, each sampled at the same time instance, NOT the total channel rate.
When evaluating data-logging products be very aware of the difference between channel rate and sample rate. Many manufacturers specify the channel rate, but claim it as sample rate. For example if a data logging system records 30 data channels, but reads each in turn only once per second, the channel rate is 30 per second, but the sample rate is only 1 per second.
This is especially problematic if the channels are not sampled at the same instance in time, but at whenever it is the turn for this channel to be read. The channel data, when taken and interpreted as sample, do not correlate anymore, because each reflect the engine state at up to 1 second apart and there is no way to correlate them. Many OBDII based systems log this way because of the limited speed of OBDII, but some of the manufacturers claim 30 samples or more per second.
Higher logging speeds
There are situations when higher logging speeds are needed. To analyze engine data on a crank degree basis at a resolution of 1 crank degree, requires measuring at 72000 times per second at 6000 RPM ( 6000 * 360 degrees * 2 [Nyquist] / 60 ). The applications for this are very specialized. An example is to analyze the point (in crank degrees) where flywheel acceleration is fastest. With the availability of fast and cheap microprocessors today this data can be analyzed on the fly and then the results logged (for example as max. acceleration point) at a much lower speed of 10-15 samples per second.
Another application for higher logging speeds is suspension analysis. There typically the shock velocity needs to be known under various conditions. Measuring rates of 1000-2000 times/second are required to calculate shock velocity and travel amplitude. But again, this data can be processed on the fly and then get logged at lower speeds by modern microprocessors.
- 12 - |
LogWorks3_Manual_1.01.doc |
2.1.3Logging resolution
Logging most channels involves interpreting voltages. Typically for most of today’s sensors the voltage range is 0-5V. When a data logger reads these voltages they are converted into a number that is represented digitally. Converting the voltage to that number is the task of an analog-to- digital converter (abbreviated A/D or ADC). The highest number a A/D can represent conforms to the max. Voltage it can read and also determines the finest resolution it can read. The number of ‘bits’ of the ADC specifies that highest number. For example for an 8 bit A/D the highest number is 255 (2 to the power of 8 minus 1). It could resolve the input voltage into 5/256 Volts. For a 10 bit A/D the highest number is 1023 and the resolution is 5/1024 Volts. So the resolution for any sensor is:
Range / ( 2 to the power of [number_of_bits] ) or Range / 2^N,
Where N is the number of bits of the ADC.
Most MTS devices that read external voltages or internal sensors use 10 bit resolution A/D’s. The exception is the AFR/Lambda data.
Even though the Lambda range goes from 0.5 to infinite, it is limited for logging purposes to 0.5 to 1.523 Lambda.
This is a 10 bit range with a resolution of 0.001 Lambda.
The LMA-3 internally digitizes with a 16 bit ADC. It then uses the extra resolution to filter out noise and finally reduce the resulting resolution to 10 bit for the MTS data stream.
 LogWorks always stores all channel data in the 10 bit raw format as digitized. How the numbers are interpreted for the user display depends on the user settable channel configuration. But the raw stored 10 bit numbers will not get changed when the interpretation changes.
- 13 - |
LogWorks3_Manual_1.01.doc |
2.2Sensors and the Modular Tuning System
The Innovate modular tuning system (MTS) consists of various devices to measure, digitize and record various engine parameters. Typically these parameters are sensed by different sensors built either into the engine itself or into MTS components. These sensors measure for example temperatures, pressures, air-flow, air-fuel ratio and so on. Sensors convert the measured quantity into an electrical signal, typically a voltage between 0 and 5V, which can be logged or displayed by the MTS components. The sensors can be categorized generally into four different groups, depending on the output they produce:
a. Voltage output sensors with external supply
These sensors have mostly 3 pins. One for the supply voltage (typically 5V), one for the output signal, and one ground. Sometimes the ground pin is omitted and the sensor is grounded through its metallic body to the engine. Typical examples are Throttle Position sensors (TPS), Manifold Absolute Pressure sensors (MAP), and Mass Air Flow Sensors (MAF). The output voltage has a typical range of 0..5V and varies for most sensors linearly with the measured quantity.
b. Voltage generating sensors
These sensors generate a (small) voltage more or less proportional to the measured quantity. Typical examples are Thermocouples and (Narrow-Band) O2 sensors. Thermocouples output a very small voltage (in the microvolt range) that requires a special amplifier to make the signal readable and loggable. The LMA-3 Auxbox has such an amplifier built in. Narrow-Band O2 sensors output a voltage in the milliVolt range (up to 1000mV). Their voltage output has a jump from low (~100mV) to high (700mV to 1000mV) when the AFR of the exhaust gas changes from lean of stoichiometric to rich of stoichiometric. They act more like switches than actual sensors. Basically they can indicate lean, rich and stoichiometric.
c. Resistive sensors
These sensors change their electrical resistance with the measured quantity. Very often the relationship between resistance change and the measured parameter is non-linear. Typical examples are Intake Air Temperature Sensors (IAT), coolant temperature sensors (CT) and some oil-pressure/fuel pressure sensors. Typically these sensors have 2 pins. One is ground, the other is connected to a load resistor. Often the ground pin is omitted and the sensor is grounded through its body to the engine. The other end of the load resistor is connected to a voltage supply (typically 5V). The purpose of the load resistor is to form a voltage divider with the sensor. At the connection between load resistor and sensor a voltage is formed that is dependent on the resistance change of the sensor according to this formula:
Vout = Vsupply * Rs / (Rs + RL)
Were Vout is the output voltage, Vsupply is the supply voltage, Rs is the sensor resistance and RL is the load resistor. For maximum sensitivity, RL is typically chosen to be equal to Rs at the typical operating point.
A sensor that falls between resistive sensors and voltage output sensors with external supply is the throttle position sensor. Although it is a resistor with a movable tap, it behaves looks and interfaces exactly like a voltage output sensors with external supply.
d. Frequency sensors
These sensors output a signal that varies in frequency (oscillating voltage) with the measured quantity. Examples are some MAF sensors, the tach signal that measures engine RPMs and the vehicle speed signal generated by drive-shaft or wheel sensors.
The LMA-3 (Auxbox) has the capability to convert these frequencies into a digital or analog signal that can be interpreted and logged.
- 14 - |
LogWorks3_Manual_1.01.doc |
The MTS components convert the sensor data to a digital number between 0 and 1023 or a total of 1024 steps incl. 0. This is equivalent of a 10 bit resolution (210 = 1024). The resulting resolution for a 0..5V signal is therefore about 4.9 mV. Any signal variations smaller than that cannot be resolved.
LogWorks has capabilities to convert the logged number back to the original quantity, provided the characteristics of the original sensors are known. This means that LogWorks needs to know how to convert the voltage output of the original sensor to the measured quantity equivalent.
The Air-Fuel-Ratio signal of the MTS components is not digitized from an external analog voltage. Instead it is internally calculated. For logging purposes this signal is internally always stored as Lambda with a resolution of 10 bits (1024 steps). To create the Air-Fuel-Ratio, the Lambda value is multiplied with the stoichiometric ratio for the given fuel (like 14.7 for gasoline) by the LogWorks software.
The data log range for Lambda is 0.5 to 1.523, equivalent to 1024 steps with a resolution of 0.001 Lambda (for gasoline this is equivalent to a 0.0147 AFR with a range of 7.4 to 22.4 AFR). This range is more than sufficient for spark ignited internal combustion engines. AFR/Lambda ranges outside of the logging range are pegged at the minimum or maximum point respectively.
See the manual for the MTS device you are using for details on how to connect various sensors.
2.3Sensor Hookup
Most sensors requires a ground connection. The voltage output of the sensor is referenced to that ground. If the device measuring the sensor is connected to a different ground, the voltage difference between the grounds can shift the sensor output voltage relative to the measuring device. Some measuring devices, like the LMA-3, have differential inputs to compensate for that offset. The negative side of a differential input is NOT a ground. It is intended to be connected to the same ground as the sensor. A measuring device with a differential input measures the difference between its own ground and the sensor’s ground on the negative input and subtracts the difference from the measured voltage on the positive input to compensate for the ground offsets. The hookup from a differential input requires two wires. One for the signal itself and one for the ground reference. The ground reference input (typically named CHx-) goes to the grounding point of the sensor.
Ground offsets are especially problematic for resistive and voltage output sensors. They are not so important for frequency or duty cycle based sensors. For a measuring device with common ground, like the LMA-2, it is best to ground all sensors at the same point where the measuring device itself is grounded.
Ground offsets can also affect frequency or duty cycle based sensors. Typically when measuring a frequency, the signal is measured as ‘high’ or ‘low’ depending on the measurement device’s high-low threshold. In the LMA-2 or LMA-3 the threshold is 1V for the LMA-2 or 2.5V for the LMA- 3. Ground offsets of 1V or 2.5V will not allow the device to measure correctly.
Another problem can be ‘ground bounce’. If the signal generating device (for example an ignition system) creates very high current pulses, it’s ground can momentarily ‘jump’ over the threshold of the measuring device because of the high current. These ‘ground-bounce’ pulses are measured as false frequencies and can interfere with the measurement.
Another problem in sensor hookup is called ‘induced noise’. In an engine compartment very high current pulses are routed many different places. These current pulses can come from the
- 15 - |
LogWorks3_Manual_1.01.doc |
injectors, ignition system or alternator. Any (changing) current flowing through a conductor creates a changing magnetic field. A changing magnetic field intersecting another conductor (for example the sensor wires) will create a voltage along that conductor. This voltage is added as noise to the sensor signal. This is how an antenna for radio signals works as well.
By twisting the sensor output and sensor ground wire together, that induced noise can be minimized. Each twist creates a wire loop acting as small antenna to pick up the induced noise. BUT, the noise induced in each loop changes polarity from loop to loop. This way each twist-loop cancels out the noise from the previous loop. The tighter the twist, the more cancellation can be achieved.
- 16 - |
LogWorks3_Manual_1.01.doc |
2.4The Innovate Log-Chain concept
LogWorks 3.0 has the capability to log, display and analyze up to 96 engine parameters.
Of those 64 can be regular channels with a variable and programmable range. 32 are reserved for “Bit Channels”, that can indicate only an on-off condition. Most MTS components read between 1 and 6 engine parameters. To interface a multitude of MTS components to LogWorks with a single connection, the Innovate LogChain concept was introduced.
Each of the MTS components has two serial ports (except the LM-1, which has only one). One serial port is designated as IN-port, the other as OUT port. The OUT-port of one device is connected to the IN-port of the next device and so on. This way devices can be ‘daisy-chained’ to build a log-chain for up to 32 channels total. The OUT-port of the last device is connected to the computer for logging or downloading of logged data.
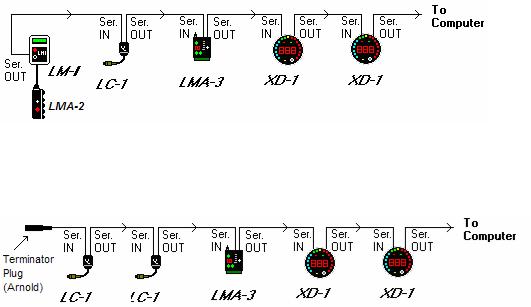
The following diagram shows how to connect multiple MTS devices to form a log-chain. The example chain consists of a LM-1/LMA-2, a LC-1, a LMA-3 and 2 XD-16’s or XD-1’s. In this case the chain has 12 channels (6 from LM-1, 1 from LC-1 and 5 from LMA-3).
Devices attached to the LM-1’s analog input count as being part of the LM-1’s 6 channels. They don’t count extra. XD-1’s do not contribute any channels, so you can add as many as needed.
Another Example Log Chain (7 channels with 2 AFR channels):
The device that’s first in the chain is special. It determines the logging sample rate. The first device in the chain sends a data packet containing its channel data (a sample) to the next device (downstream, left to right in the diagram) every 81.92 milliseconds. The next device appends its data to that packet and hands that packet to the next device downstream and so on. At each device the packet grows in length. The devices in the chain synchronize their sampling of the engine parameters to the packets, so that all the channels in a packet together represent the same instance in time. At the downstream end of the log chain (OUT-port of the last device) a computer or external logger can be connected to store or display the stream data. The XD-1 display is such a device.
This also means that the complete channel data set is ONLY available at the end of the log-chain. A datalogger capable of recording the log-chain data-stream therefore MUST be placed at the end of the log-chain. This includes lap-top computers or other loggers.
- 17 - |
LogWorks3_Manual_1.01.doc |
Commands for individual devices are sent ‘upstream’. A device (incl. a computer or an XD-1) can send commands to the devices upstream of itself, but not downstream. Commands can include start-stop recording, calibration/configuration commands and so on. Only the device directly upstream of the command originator of course will receive the command. This device then decides, depending on the command, whether to execute the command and whether to pass it on. An example of a case where the command is executed but not passed on is the start-stop record command. The first upstream device capable of logging internally will execute the command, but not pass it on.
As said before, the first device is special because it is the synchronization source for the entire chain. By plugging its IN-port with the supplied terminator connector, a device can detect that requirement when it powers up. The terminator connector just connects the transmit and receive line of the IN-port together. Each device sends a special command out on it’s IN port when it powers up. This command is ignored and not passed on by any device if received on it’s OUT port. If the sending device immediately receives that command on its IN-port again, because the terminator is plugged in, it assumes it is the first and special device in the chain. The LM-1, having only one serial port, is ALWAYS a special device and MUST be connected to the beginning of the chain.
2.5LogWorks Channels
A channel is the data from a single sensor, like AFR or RPM. Channels are the basic data items that LogWorks processes. Therefore their understanding is crucial to the use of LogWorks.
LogWorks 3 uses two basic channel types.
1.Value channels
2.Bit channels
2.5.1Value channels
Value channels have a range and a unit. For example RPM from 0 to 10230 RPM, Mixture data from 7.35 to 22.4 AFR, Throttle position from 0 to 100 %.
In the first case the unit is RPM, range 0..10230.
In the second case the unit is AFR, range is 7.35 to 22.4
In the third case the unit is %, range is 0..100.
In either case a MTS device reads the measurement and translates the result into a raw data number. In most cases the raw data measured is a Voltage in the range 0 Volt to 5 Volt that is sent to LogWorks. The Channel Configuration database of LogWorks then tells LogWorks how to translate the raw data into the appropriate units and range. For convenience, and because it is the most common case, the raw data is always treated as if it were digitized from a sensor with a 0 to 5Volt output.
See chapter 4 for details about channel configuration.
Value channels can be created a few different ways:
a.Directly measured with an MTS device.
b.Created by a “virtual” device plug-in that connects to LogWorks.
c.Created mathematically from other channels either with the LogWorks math engine or by a program plug-in.
- 18 - |
LogWorks3_Manual_1.01.doc |
 The Range in the channel configuration ALWAYS has to match the range to which the original quantity was digitized.
For example most MTS devices that measure RPM output the raw RPM data to a default Range of 0V equivalent to 0 RPM and 5V to 10230 RPM.
Configuring a channel to a different range than it was digitized to, causes a wrong translation of the indicated data in LogWorks.
2.5.2Bit channels
Bit channels are very simple channels. They can only indicate two states: On and Off, or 1 and 0 or High and Low.
They are used to indicate engine states like:
•Closed Loop or Open Loop.
•Acceleration enrichment on or off and so on.
Bit channels do not have a range or unit. They only have a name. Their state is immediately apparent and therefore they don’t need any more definition like value channels. Like Value channels they can also be created different ways:
a.Directly measured with an MTS device.
b.Created by a “virtual” device that connects to LogWorks.
c.Created mathematically from other channels either with the LogWorks math engine or by a program plug-in.
2.5.3Identifying devices and Channels
To easily identify which channel is representing which engine parameter, the channels must be given a name. Use short names to not use up a lot of screen real-estate.
USE ONLY NUMBERS AND LETTERS IN A CHANNEL NAME. THE ONLY SPECIAL CHARACTER ALLOWED IS THE UNDERLINE CHARACTER _ .
A CHANNEL NAME MUST START WITH A LETTER.
LogWorks allows you to configure each channel. Part of the configuration is the name. Also the color in which the channel is displayed is programmable in LogWorks as well.
To further easily identify the channels each MTS device MUST be given a name. This name can be up to 8 characters long and is programmed into the device. Use the LM Programmer application to change the name of a device. This is especially important when multiple devices of the same type are used.
When LogWorks start up, it will identify the devices in the LogChain. If new devices have been added or devices removed, LogWorks will automatically change its channel configuration to reflect the new log-chain configuration. Channels associated with a device previously will stay associated with that device, even if the device has been moved to a different location in the chain, provided it has been given a unique name.
- 19 - |
LogWorks3_Manual_1.01.doc |
 LogWorks will maintain the channel configuration for each device, IF THE DEVICE IS GIVEN A UNIQUE NAME WITH LM PROGRAMMER, even if the device has been moved to a different position in the LogChain. This is NOT true for display devices like the XD-16. The XD-16 is sensitive to the position of its programmed input in the LogChain. This means that if you moved for example an LMA-3 from the first position in the LogChain to the second position, and have the XD-16 programmed to display or use (hold or warning) an XD-16 channel, you need to reprogram the XD-16.
- 20 - |
LogWorks3_Manual_1.01.doc |
2.6Logs and Sessions
Different from other data logging products, LogWorks organizes the acquired data in logs and sessions. A session is a contiguous data set. This means there is no interruption in the data stream and all data points are spaced equally in time (81.92ms apart). Each time you start logging, a new session is created and the session ends when the logging stream is stopped.
A log is a collection of sessions. In a typical qualifying race or tuning session multiple runs are made, and each run is data logged. LogWorks conveniently organizes these runs into a common log. The sessions in a log are numbered from 1 through x. Typically they are sequential in time, starting with the oldest session as session 1 and so on. Each log can be stored in a separate file on the computer. Each session can be renamed so it does reflect something more meaningful than just a numbered sequence.
In addition each log contains the information on how to convert the digitized numbers (see Logging engine data) into the original quantities. These so called channel settings apply to all sessions in a log.
LogWorks distinguishes three different kinds of logs:
a)Real-time log
This is a log created by connecting a computer to the MTS log-chain and recording the real-time data stream from the MTS devices to the computers hard drive. New sessions can be added at any time by starting to record the serial stream.
Only one real-time log can be open at any time.
The current real-time input settings apply to the real-time log.
b)LM-1 log
This is a log created by downloading log data from the LM-1’s internal memory, but not yet stored in a file. Only one LM-1 log can be open at any time. The current real-time input settings apply to LM-1 log.
 The LM-1 has to be the first device in a log-chain. Therefore the only channels it can see are its own AFR channel and the 5 channels on its Aux input. The LM-1 can NOT record any other channels downstream in the log-chain.
c)File logs
File logs are data files created by LogWorks when saving a real-time log or a LM-1 log. Up to 30 such logs can be opened by LogWorks concurrently. LogWorks stores logs in either of two file formats:
Log files (file extension .log)
Or
DIF files (file extension .dif)
- 21 - |
LogWorks3_Manual_1.01.doc |
The .log file format is native to LogWorks. It stores the original data in a very compact format and also stores additional information like measurement points, filter parameters and all input settings. This allows to change and manipulate the data later more conveniently than the DIF file format.
The DIF file format is used to allow importing the log data into spreadsheet program like Microsoft Excel.
The DIF format stores the data as manipulated by LogWorks and already converted into the real engine quantities. Because of that, information can be lost when reloading a DIF file for further manipulation.
The DIF format should only be used when the log data is to be processed by external software like Excel.
 LogWorks 3.0 LOG files (file extension .log) are different from log files created by an earlier version of LogWorks. Although LogWorks 3.0 can read the earlier files, an earlier version of LogWorks can’t read the new file format fully.
LogWorks 3.0 LOG files can be read by LogWorks 2.x, but if more than 32 channels, or bit channels, are stored, those won’t be visible in LogWorks 2.x.
2.7LogWorks Files and Folders
LogWorks uses the following files and Folders. These are installed in the same directory or folder where the LogWorks program file (LogWorks.exe) is installed.
2.7.1Files used by LogWorks 3 in the main Folder
a.LogWorks.exe (the main LogWorks Program)
b.Mts.dll (the MTS serial protocol manager – includes plug-ins for LM-1, LC-1, and LMA-2)
c.Conversions.txt (text file containing formulas for unit conversions. See section x)
d.MathlibSI.txt (text file containing mathematical formulas in international units [MKS system] for channel calculations)
e.MathlibUS.txt (text file containing mathematical formulas in US units [pounds, degF and so on] for channel calculations)
f.ChartMathlib.txt (text file containing mathematical formulas for 3D-chart calculations.
g.Searchlib.txt (text file containing formulas for frequently used searches)
2.7.2LM1 Log Files Folder
This Folder is the default location for Log Files. Regular Log Files have the file extension .log
- 22 - |
LogWorks3_Manual_1.01.doc |
2.7.3LWSettings Folder
This folder is the default location for LogWorks Settings like Input Descriptions, Profiles and Skins (see later chapters) are stored in this directory.
Input description files (extension .inp)
These contain sets of channel descriptions. Each channel description contains data about a channel like name, unit, how digitized voltages are translated to units, channel trace color, possible lookup table and channel type and source (from which MTS device). Input description files capture the current channel settings of all channels.
Skin Files (extension .skn)
A skin file describes the “look and feel” of LogWorks gauges like colors used, background picture, bezel style and numeric digit style.
File Currentskin (no file extension)
This is a skin file that saves what the user has selected as current skin. It is saved and stored when exiting LogWorks.
File DashTemplates (no file extension)
This file contains a database of dash templates. A dash template contains the number of gauges on the LogWorks Dash, their location, size and type, and what channels are assigned to each gauge. Up to 16 named templates can be stored in the DashTemplates file.
File LWTemplates (no file extension)
This files contains templates for the main realtime trace window, the realtime X-Y Plots and Realtime charts. These templates are stored by default into a log file when a new realtime log is saved the first time.
- 23 - |
LogWorks3_Manual_1.01.doc |
3 Starting up LogWorks
Connect OUT port of the last device in the Log-Chain to a free serial port on your computer and start the LogWorks program. If an LM-1 is used, the LM-1 can either be currently operating in the car or can be connected (running from its internal battery) to the computer. Real-time logging can of course only be done when running the Log-Chain (can be as small as just an LM-1) in the car.
 For Real time display, logging or download from an LM-1 make sure no other program (including LM Programmer or LM-1 Manager) is using the selected serial port.
LogWorks can handle channels coming from a MTS Log Chains as well as so called virtual channels that are created by non MTS devices. Plug-ins for almost any device that supplies engine data can be created. This includes OBDII data readers, aftermarket ECUs and piggybacks, dynos or other devices. One restriction is that at least one MTS device has to be connected to the computer for real time logging.
For log viewing, LogWorks is also automatically started when double-clicking on a .log file.
- 24 - |
LogWorks3_Manual_1.01.doc |
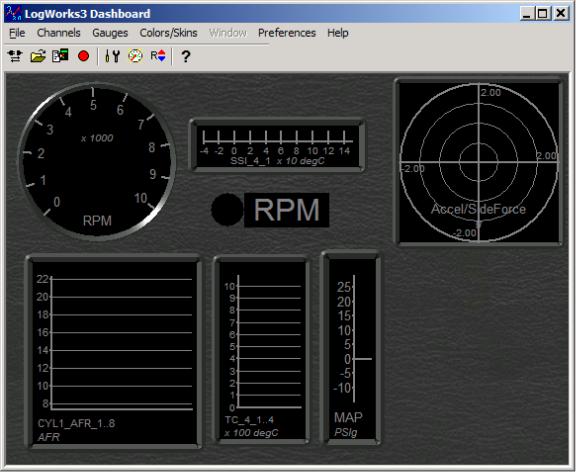
3.1The LogWorks 3 Dashboard
Note: The actual look of the window background and gauges depends on the selected skin.
This window is resizable by grabbing on the lower edge of the window. All gauges are grayed out until:
a)LogWorks is connected to the Log Chain
b)A valid serial data stream is detected on the serial port
c)The appropriate input is enabled.
When this happens the window might look like this with the gauges active.
- 25 - |
LogWorks3_Manual_1.01.doc |

3.1.1Changing the preferences for units
This menu allows you to set your preferences for unit calculations and for displaying channels. A lot of calculations are different when US units vs. international units are used. To make it easier to find the correct calculations, the math libraries are divided, so that the number of duplicate entries is minimized.
- 26 - |
LogWorks3_Manual_1.01.doc |
4 Channel Setup and Configuration
 Channel configurations from the LogWorks Main Dashboard will be stored in the computers registry and will be applied to real time logs and to downloaded logs from LM- 1 and DL-32 automatically.
Channel configuration changes done in the already downloaded log from the Log Window apply only to that log.
See chapter 2.5 for details about channels.
A LogWorks channel needs to be configured. The Configuration is very important for LogWorks because it tells LogWorks how to:
a.Translate raw digitized data into the appropriate measurement in units, scaling and range.
b.In what color the trace should be shown in the LogWorks menu.
c.What the channels should be named.
The “Channels” Menu of the main window allows configuring logged or displayed channels. In the Channel Menu, go either to
Channels->Configuration Wizard…
Or
Click on the  tool in the toolbar.
Either way brings up the Channel Configuration Wizard Dialog Box.
- 27 - |
LogWorks3_Manual_1.01.doc |
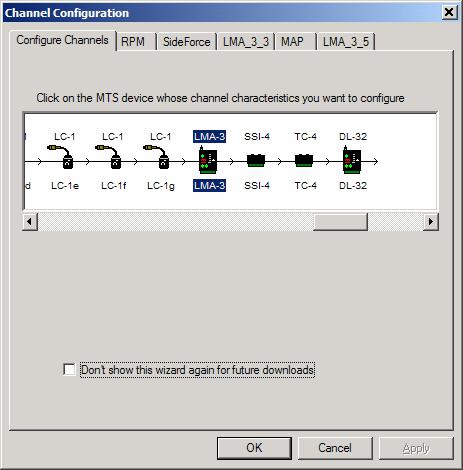
The main page of this dialog box shows the current Log-Chain as detected by LogWorks 3. Click on the device whose channels you want to configure.
In the above example it is a LMA-3 named, coincidentally, also LMA-3.
Additional Tabs for the channels from that device are then created. Click on the tab of the channels you want to configure.
 If you download from an LM-1 or DL-32, or if you connect to a MTS Log-Chain the first time, LogWorks will automatically detect devices which have not yet had a channel configuration assigned to them. It then forces you to configure those channels.
If you find that annoying, enable the “Don’t show this wizard for future downloads” checkbox. When clicking on a channel tab the following dialog box appears (for value channels):
 The same dialog box will appear when you directly configure a channel with the menu selection:
Channels->Configure Channel->Channel name, or right-click on a gauge assigned to a channel.
- 28 - |
LogWorks3_Manual_1.01.doc |

The dialog box contains multiple fields. For bit channels, only field 1 and possibly field 3 and 4 are shown.
Field 1.
In field one you can specify a name for the input for easy identification.
Use a unique name.
 Only letters, numbers and the underline character _ are allowed in an input name. A channel name may not start with a number.
If multiple channels measure similar data, like multiple EGT or Lambda/AFR channels, name them with a number at the end like:
AFR_CYL1, AFR_CYL2 and so on. This makes it easier for LogWorks to create channel group names.
- 29 - |
LogWorks3_Manual_1.01.doc |

Field 2.
Click on this field to change the trace color for this channel. See chapter 4.3 on details of manipulating channel color.
Field 3.
This indicates the input mode selected for this input of the selected device, dependent on the device. LogWorks interrogates all devices connected to the serial LogChain during connection and downloads their settings. If the settings have changed since the last time LogWorks started, LogWorks will change the current input to the current settings of the input, using defaults for the unit and range.
If a device is connected to the Aux-In port of the LM-1, it can’t be interrogated by LogWorks. In this case you have to manually select the function and, if necessary, fill out the fields for range and unit. See the manual for the appropriate device for details.
Field 4.
This field shows the name, type and icon of the device where this input is from. If a device allows the connection of optional accessories, the accessory selected is also shown.
Field 5.
Either type in the unit for the channel here or select a unit from the drop-down list. The drop-down list shows all units that are preprogrammed into LogWorks. For details about using units and unit conversions see chapter xxx.
Units typically belong to a unit family. A unit family consists of different units for the same measured quantity. For example you can measure pressure in PSI, inHg, kPascal and so on. Conversion formulas describe how to convert between different units of the same family. In the drop-down list the units belonging to the same family as the current unit are shown in bold face. When converting between absolute pressure and gauge pressure LogWorks will ask you to enter the current atmospheric air pressure:
You can enter this in either in inches of mercury (inHg) or millibar. LogWorks decides from the number entered which unit is used. This is asked only once after LogWorks has started and will not be asked again if that conversion is executed again. For details see chapter xxx.
Field 6, 7 and 8
Specify two voltages (0 and 5V in the above example) in field 7 and the equivalent measurement quantity ( 0 and 10230 RPM respectively in the example). If voltages different than 0 and 5V are specified, the range will be automatically expanded to 0..5V if the push button “Expand to 0..5V” in Field 5 is selected, even if the sensor is not capable to produce 0..5V (the measured signal will stay within the range the sensor produces).
If the “Limit to programmed range” push button is selected, the input is limited to the programmed range in field 3. Input values outside the range will be clipped to the entered range.
To easily enter the correct voltage values when LogWorks is connected realtime to a Logchain, you can also right-click on one of the voltage fields.
- 30 - |
LogWorks3_Manual_1.01.doc |
 Loading...