

Page 1
Ingersoll Rand
System Automation
VX Accessory Box
Visualization Software Manual
Before installing or starting this unit for the rst
time, this manual should be studied carefully to
obtain a working knowledge of the unit and or the
duties to be performed while operating and
maintaining the unit.
RETAIN THIS MANUAL WITH UNIT. This Technical
manual contains IMPORTANT SAFETY DATA and
should be kept with the unit at all times.
More Than Air. Answers.
Online answers: http://air.ingersollrand.com
C.C.N. : 80445091
REV. : A
DATE : APRIL 2009
Page 2

SECTION 1 TABLE OF CONTENTS
Section 1 - table of contentS .............................2
7.3 EQUIPMENT DETAIL VIEW I/O BOX..................33
Section 2 - intRoDUction ...................................... 3
Section 3 - GettinG StaRteD ................................. 4
3.1 COMMISSIONING PROCEDURES .........................4
3.2 CONNECTING TO A VX BOX VIA PC .....................4
Section 4 - loGin ........................................................8
4.1 LOGIN PROCESS .........................................................8
4.2 DEFAULT ACCOUNTS ................................................9
Section 5 - naViGation ..........................................10
5.1 TITLE BAR ....................................................................10
5.2 TAB NAVIGATION ......................................................10
Section 6 - SYSteM oVeRVieW ..............................12
6.1 THE SYSTEM OVERVIEW SCREEN .......................12
6.1.1 TITLE BAR THE EVENT LOG ................................12
6.1.2 TITLE BAR THE SERVICE UTILITY ....................14
6.2 THE DASHBOARD .....................................................16
6.3 CONFIGURABLE I/O.................................................17
6.4 SYSTEM EFFICIENCY GAUGE ...............................17
6.5 X8I/X12I INTERFACE ................................................18
6.5.1 X8I/X12I CONTROLS ..............................................18
6.5.2 TABLE CONFIGURATION AND CONTROL ......18
6.5.3 PRESSURE SCHEDULE CONTROL .....................20
6.6 COMPRESSOR STATUS OVERVIEW ....................20
6.7 SYSTEM DETAIL VIEW .............................................21
6.7.1 PERFORMANCE REPORT UTILITY .....................21
6.7.2 PRESSURE SCHEDULE ...........................................22
6.7.3 GRAPHING UTILITY ................................................23
6.7.4 ARCHIVING HISTORICAL DATA .........................25
7.4 EQUIPMENT DETAIL VIEW INTELLIFLOW ......34
Section 8 - confiGURation oVeRVieW .............36
8.1 CONFIGURATION OVERVIEW ...............................36
8.2 X8I/X12I SYSTEM SETUP .........................................36
8.2.1 SYSTEM CONFIGURATION ..................................37
8.2.2 USER CONFIGURABLE DATA ITEMS ................. 38
8.3 COMPRESSOR SETUP .............................................39
8.3.1 COMPRESSOR CONFIGURATION....................... 39
8.3.1.1 COMPRESSOR MODEL INFORMATION...................40
8.3.1.2 COMPRESSOR NAMEPLATE DATA...........................41
8.3.1.3 ADDITIONAL DATA ITEMS..........................................41
8.4 I/O BOX AND INTELLIFLOW SETUP ...................46
8.4.1 I/O BOX AND INTELLIFLOW IX
CONFIGURATION ....................................................46
8.4.1.1 ANALOG INPUT CONFIGURATION..........................47
8.4.1.2 RELAY OUTPUT CONFIGURATION...........................48
8.4.1.3 DIGITAL INPUT CONFIGURATION............................48
8.5 ACCOUNT MANAGEMENT ....................................48
8.6 DIAGNOSTICS ............................................................51
8.6.1 SERIAL COMMUNICATIONS DIAGNOSTICS .52
8.6.2 SOFT WARE VERSIONS ..........................................53
8.6.3 VX BOX CONNECTIVITY........................................ 53
8.6.4 ETHERNET CONFIGURATION .............................53
8.7 VX OPTIONS SCREEN ..............................................54
8.7.1 GRAPH SCALING DEFINED VARIABLES ......54
8.7.2 GRAPH SCALING SELECTABLE VARIABLES 55
8.7.3 LANGUAGE ................................................................55
8.7.4 DATE AND TIME .......................................................55
Section 7 - eQUiPMent oVeRVieW ......................29
7.1 EQUIPMENT OVERVIEW ........................................29
7.2 COMPRESSOR DETAIL VIEW ................................30
7.2.1 COMPRESSOR STATUS ..........................................30
7.2.2 COMPRESSOR NAMEPLATE DATA ....................31
7.2.3 USER CONFIGURABLE COMPRESSOR DATA..32
7.2.4 MANUAL START/STOP CONTROL.....................32
2
Page 3
SECTION 2 INTRODUCTION
Ingersoll Rand System Visualization oers a window into a compressed air system by adding a VX Module to an X8I
or X12I control network and using only a web browser on your PC. The VX Box incorporates hardware and software to
allow monitoring of the X8I and X12I Automation system as well as all connected equipment. The software allows you
to monitor your air system at a glance or take a more detailed look into system operation, equipment status and setup
through an intuitive web-page based user interface. To access the application running on the VX Box, simply connect
via a Web Browser from any PC using an Ethernet connection.
The VX Box connects to the X8I or X12I controller via the two-wire RS485 network. The VX Box is suitable for wall
mounting and can be located up to 4,000 ft. (1,219 m) from the X8I or X12I unit. The VX Box connects to the customer’s
PC or LAN via Ethernet, using a RJ45 connector, Cat5e 10/100Base T cable.
The PC can be local “stand alone” or part of a LAN. The VX Box is fully eld congurable using standard screen
templates.
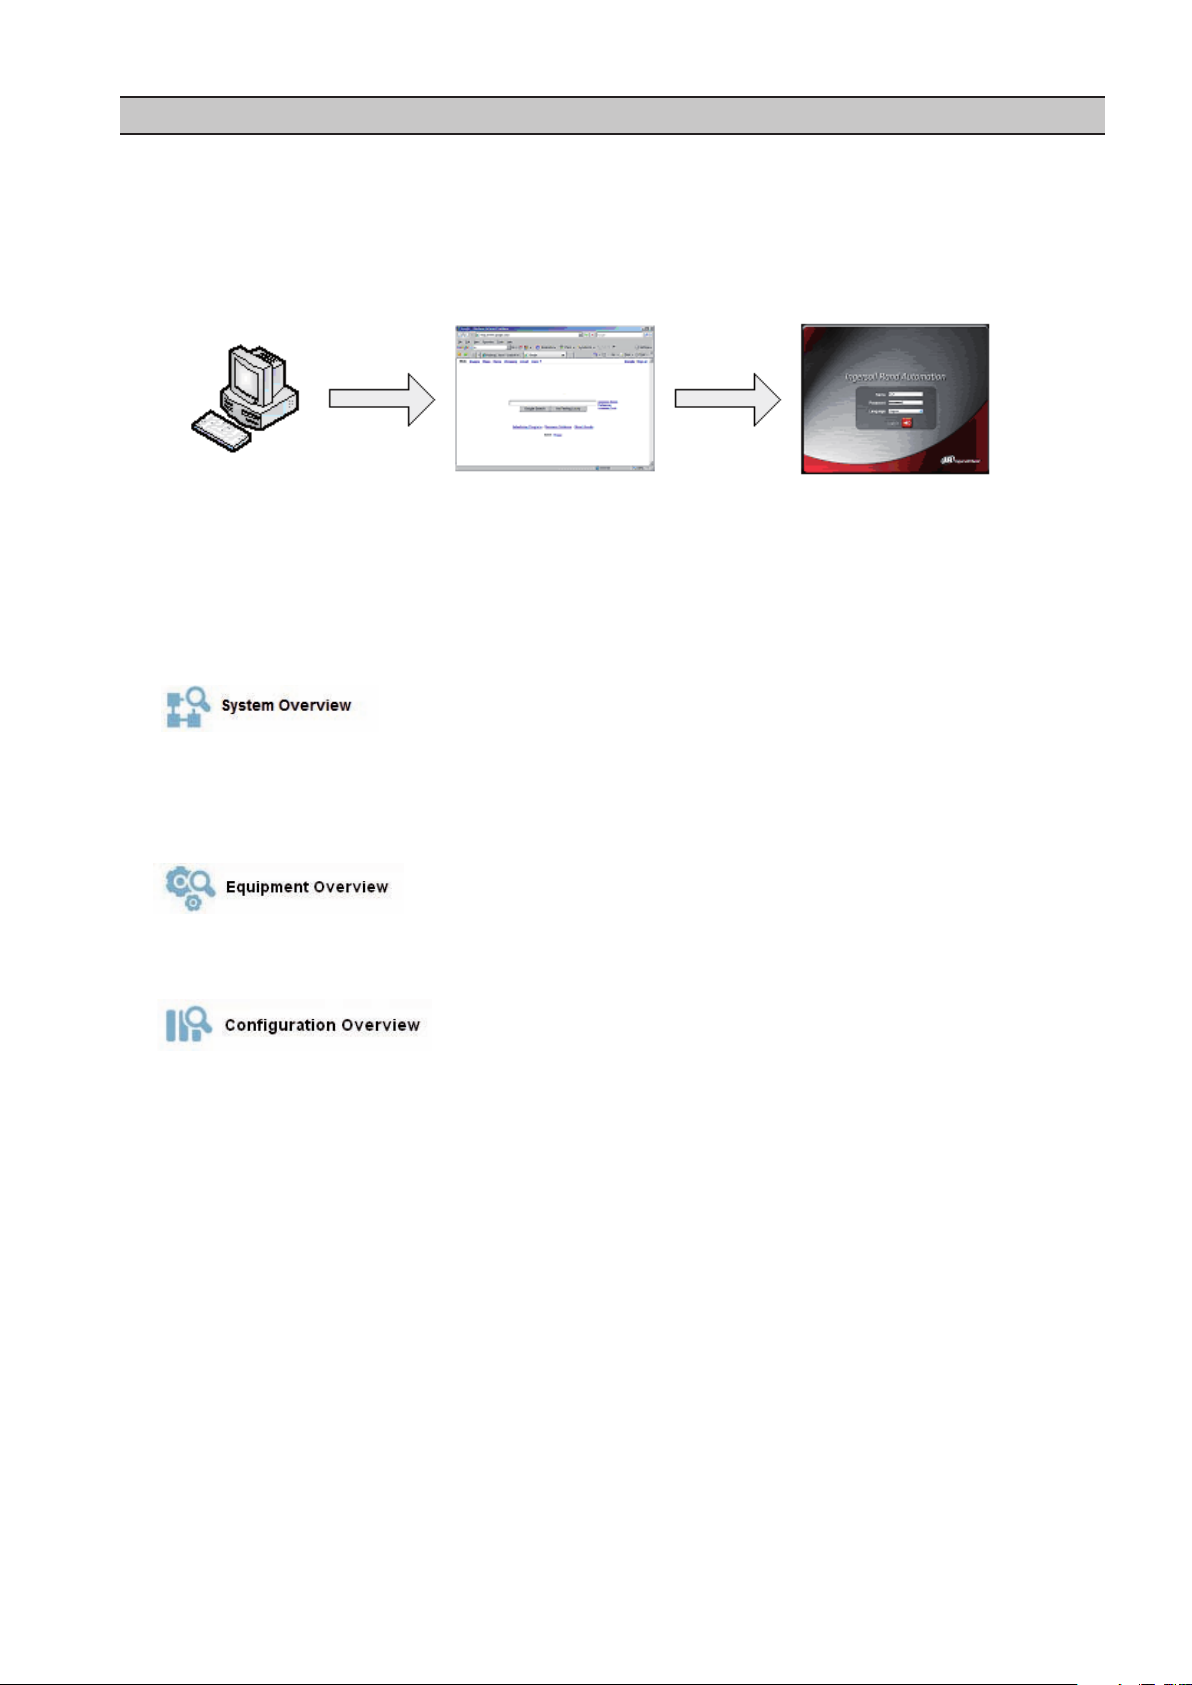
The visualization interface is broken down into three major segments:
Monitor and adjust important air system data such as air system pressure and eciency, air system set points,
status of each compressor, and X8I/X12I status in an easy to read dashboard style interface. The system overview
screen is also the launching point for performance reports and historical trending. See section 5 – System
Overview.
Monitor more detailed compressor information such as the model and manufacturer of the compressor, capacity
and power data, and congurable data points. See section 7 – Equipment Overview.
View and change air system congurations such as adding or removing a compressor, I/O box, or Intelliow valve.
Manage user accounts and network conguration and view diagnostic information. See Section 8 – Conguration
Overview.
The system administrator can assign a user one of three levels of access (view only, user, and administrator) which will
determine which functions will be available to that user. For example, only users with administrator access will be able
to view or modify the conguration overview parameters. See section 8.5 – Account Management.
Please note that this software manual assumes that the Ingersoll Rand Automation VX Box has been installed and
connected to your company’s network. If this is not the case please refer to the Ingersoll Rand Automation VX Box
installation manual CCN 80445083.
3
Page 4
4
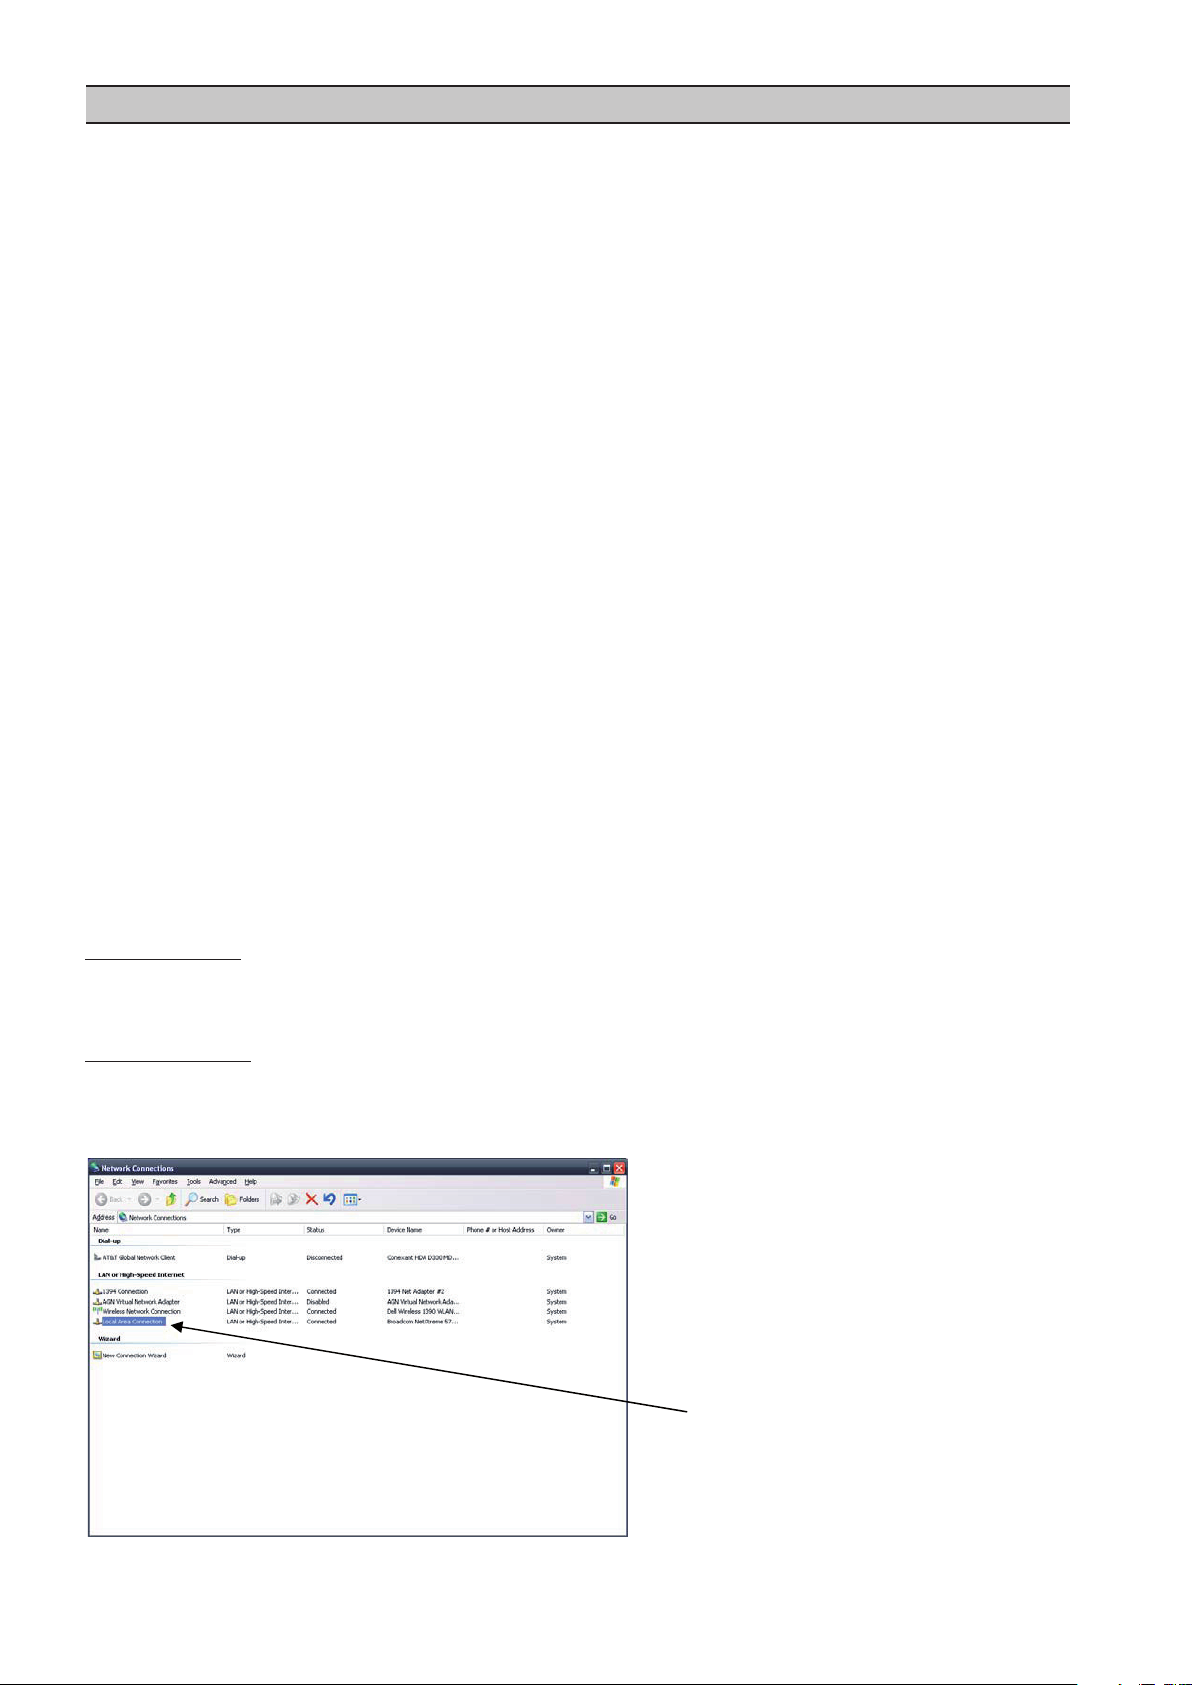
SECTION 3 GETTING STARTED
Select Local Area Connection
3.1 Commissioning Procedures
There are certain parameters that must be congured in order for the VX box to properly communicate to the LAN
and to the X8I/X12I control network. Outlined below is a list of steps that must be completed before the visualization
software can be fully utilized.
Most of the setup is conducted using the conguration overview screen described in detail in section 7. Please be sure
that you have ADMIN rights before attempting to congure the VX box.
Install the VX box according to the Installation Manual
1.
Connect to the VX box using a PC – Follow the procedure outlined in section 3.2.
2.
Login to the Visualization Software – Follow the procedures in section 4.1
3.
If you will only be connecting to the VX box using a single PC, go to step 5. If you will be using a static IP or DHCP
assigned IP address on your company’s LAN please continue.
Congure the VX box Ethernet settings – Obtain a static IP address from your IT department or have an
4.
assigned domain name for DHCP access. Follow the procedures in section 8.6.4.
Synchronize VX Box time to PC time – Follow the procedures in section 8.7.4
5.
Congure the X8I/X12I information - Follow the procedures in section 8.2
6.
Congure compressor information – Follow the procedures in section 8.3. Make sure you have the
7.
compressor nameplate data available.
Congure any I/O boxes or Intelliow Valves – Follow the procedures in section 8.4. Make sure you have I/O
8.
conguration information for any I/O boxes on the network. Please refer to the I/O Box operator’s manual.
Set up User accounts – Follow the procedures in section 8.5 if not using default accounts.
9.
Select units on Dashboard – Follow the procedures in section 6.2
10.
3.2 Connecting to a VX Box via PC
In order to congure your computer to communicate point-to-point with the VX Box, you must rst set the IP
address range of your computer to the default IP address range of the Visualization box. To do this, please follow the
instructions listed below to congure the Computer IP address. These settings are accessible using Windows XP by
selecting:
Please note that the VX Box ships with a default IP address of 192.168.1.1.
Using Classic View:
Select Start
Select Settings
Select Network Connections
Using XP Start View:
Select Start
Select Control Panel
Select Network Connections
Page 5
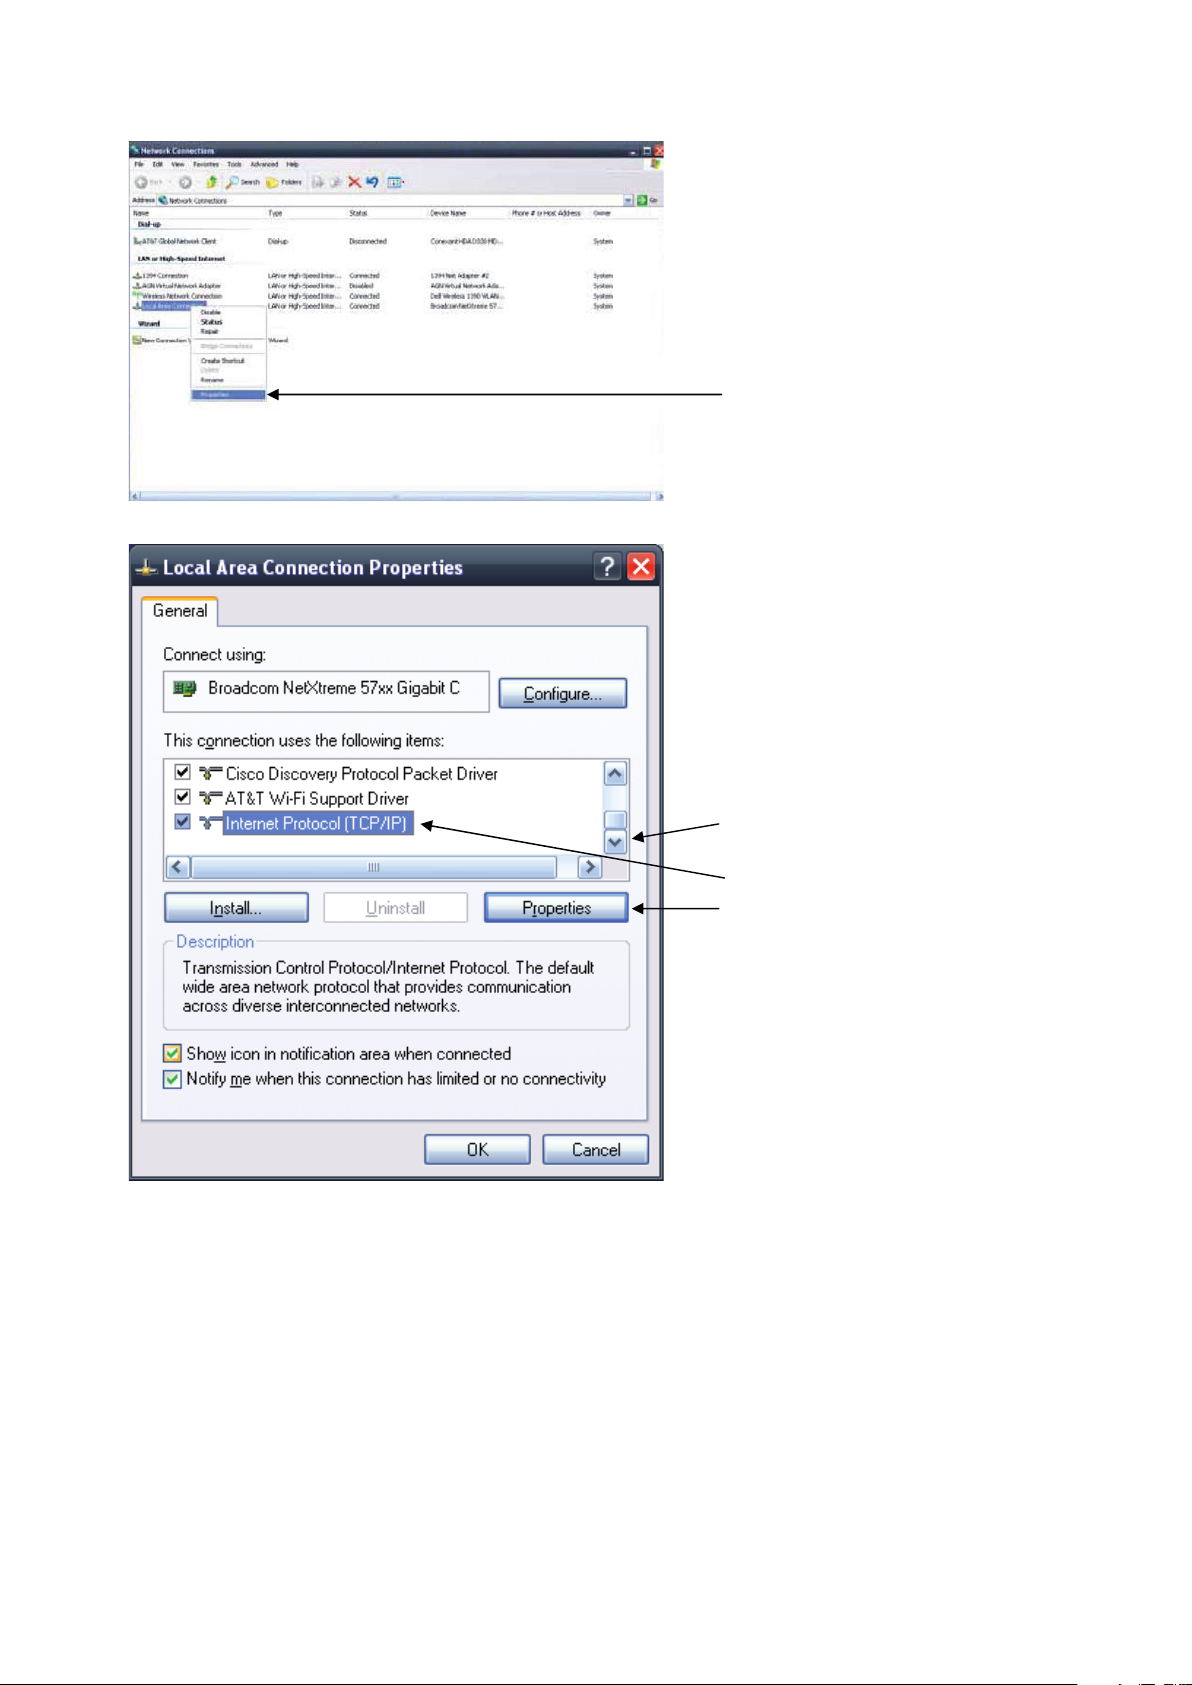
Scroll down the Connection List to find
Internet Protocol (TCP/IP)
Select Internet Protocol (TCP/IP)
Click on Properties
Right Click on the Local Area
Connection
Select Properties
5
Page 6
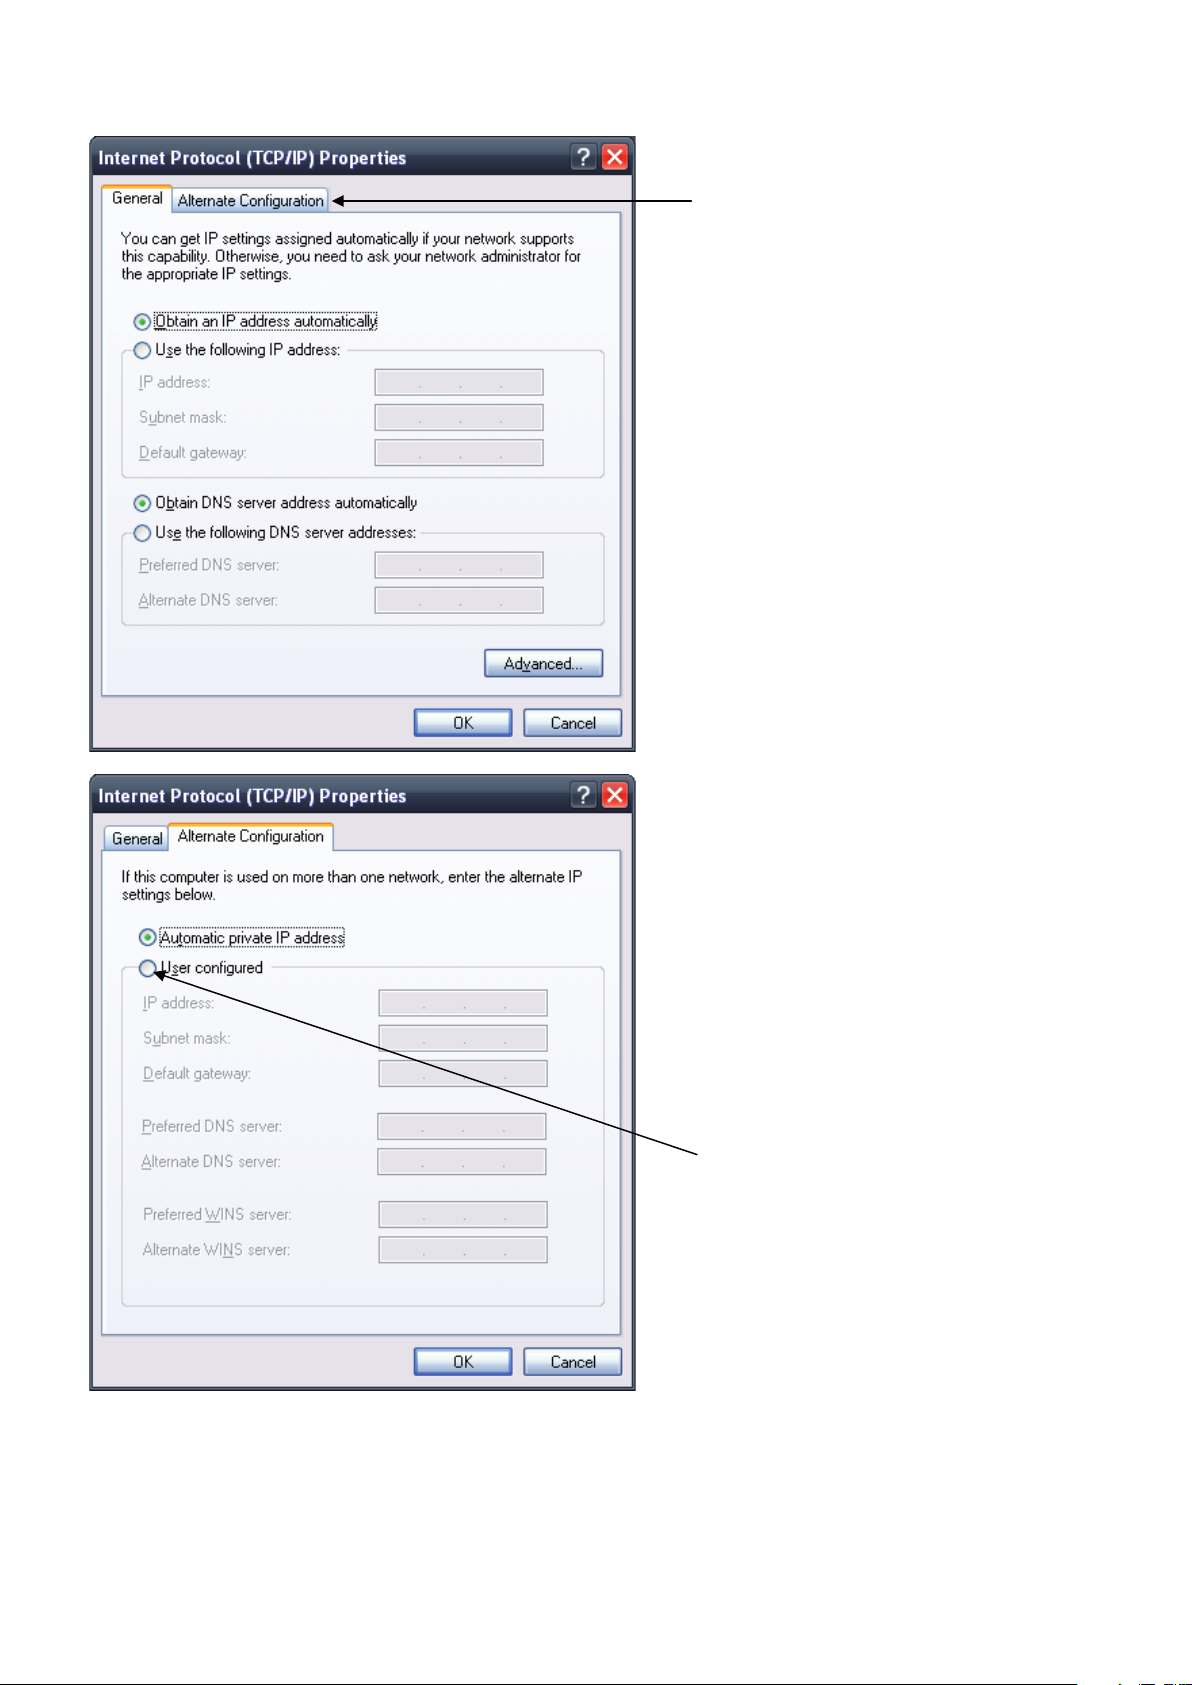
6
Click on User Configured Button
Click on the Alternate Configuration
Tab
Page 7
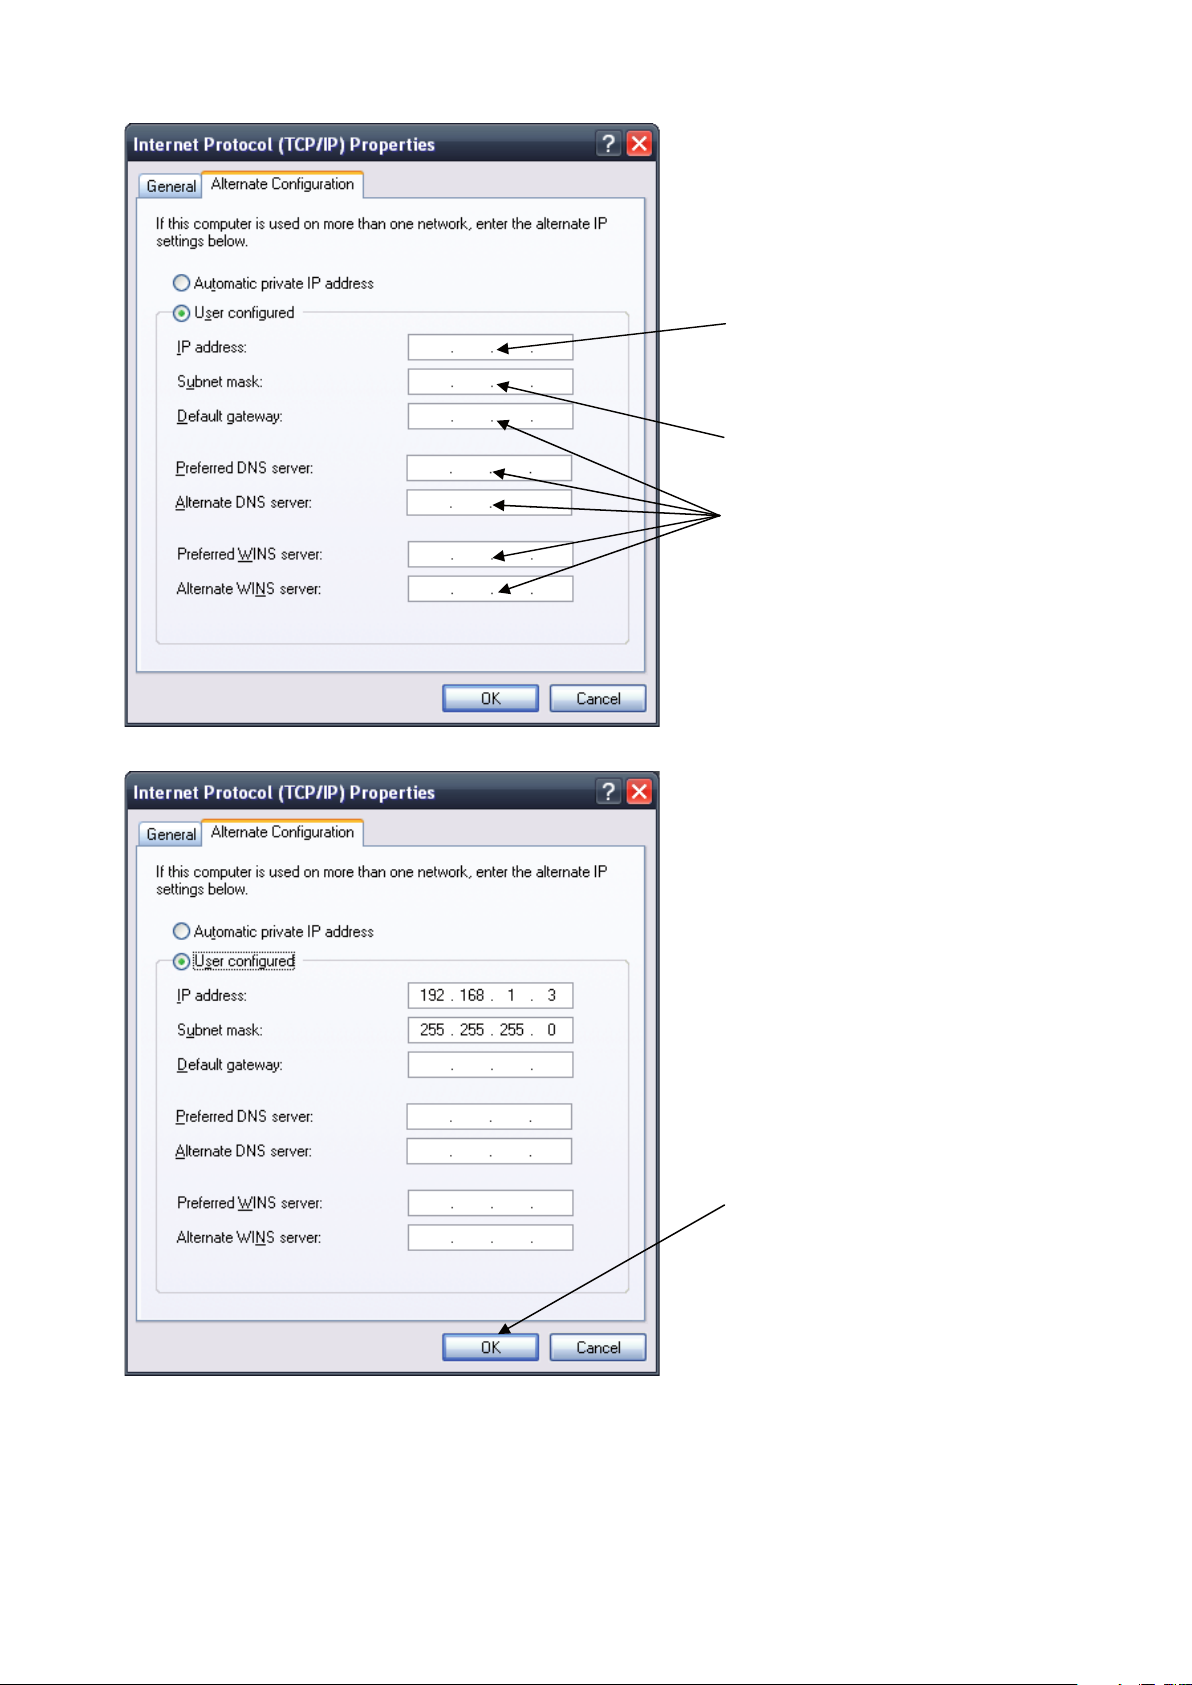
Enter IP address for the Computer
192.168.1.3
Enter the Subnet Mask for the Computer
255.255.255.0
Leave all other Fields blank
When complete, Click OK
Connect an Ethernet cable to your Computer and to the Visualization Box. Within a minute, the Computer will make a
connection to the Visualization Box. Once connected, you will be able to log into and congure the Visualization Box.
7
Page 8
8
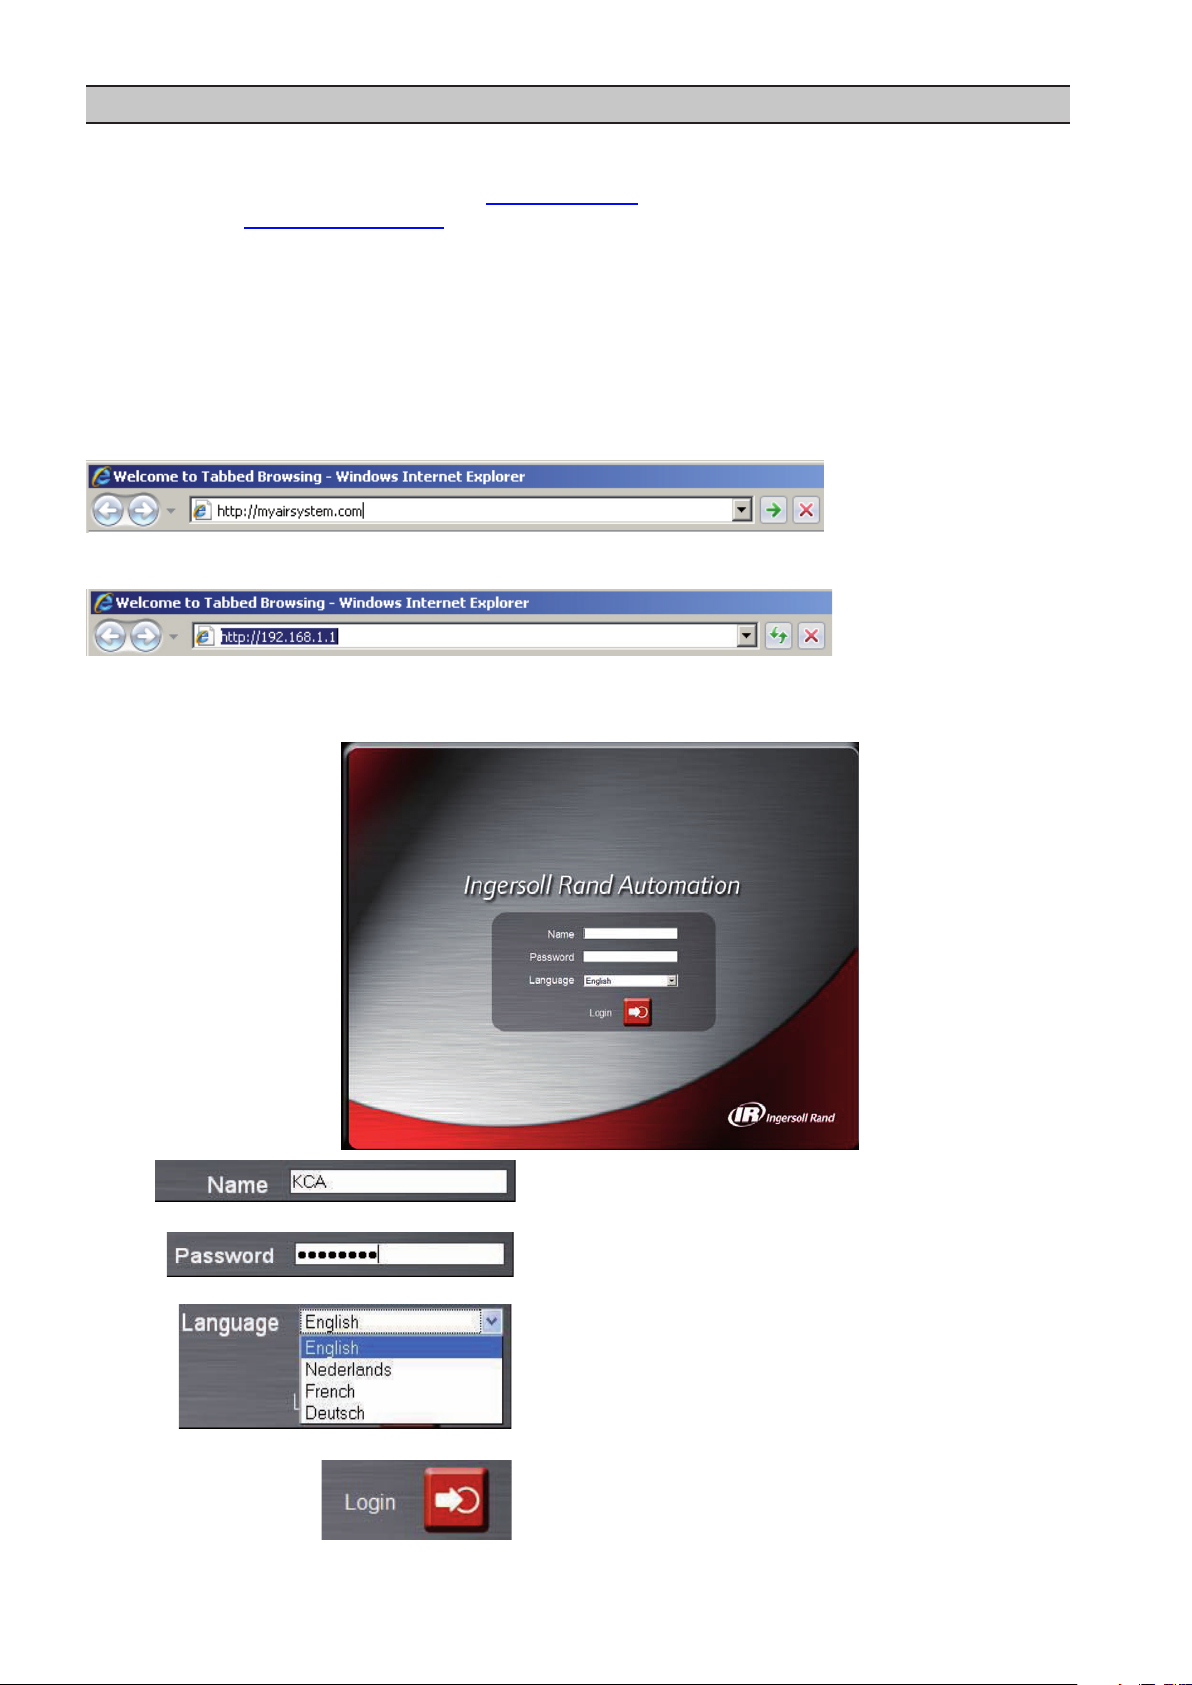
SECTION 4 LOGIN
Type in your user name (case sensitive)
Type in your password (case sensitive)
Select your language from the dropdown list
Click the Login button or press enter
4.1 Login Process
During the installation and commissioning process a network address was assigned to the VX Box by your IT
department. This address may be a static IP (e.g. http://192.168.1.1, recommended) or a DHCP assigned domain
name address (e.g. http://myairsystem.com). A domain name address is a web page address chosen by the user to
represent the VX box. The domain name must be approved by your IT department but can generally be any text label
you wish. You must have this address before you can log in to the visualization software. See section 8.6.4 – Ethernet
Conguration.
Please note that Ingersoll Rand Automation Visualization requires Internet Explorer 7 ( or newer) or Mozilla Firefox
2 (or newer). Certain functions may not behave correctly when using older browser software.
To log in to the visualization program you must rst type the address into your browser and then press the enter
button.
For example, with a DHCP enabled VX box you might type this:
While with a static IP address you might type this:
If the VX box is congured correctly you will then see the Ingersoll Rand Automation splash screen in your browser.
This may take a few seconds depending on our network connection speed.
Page 9
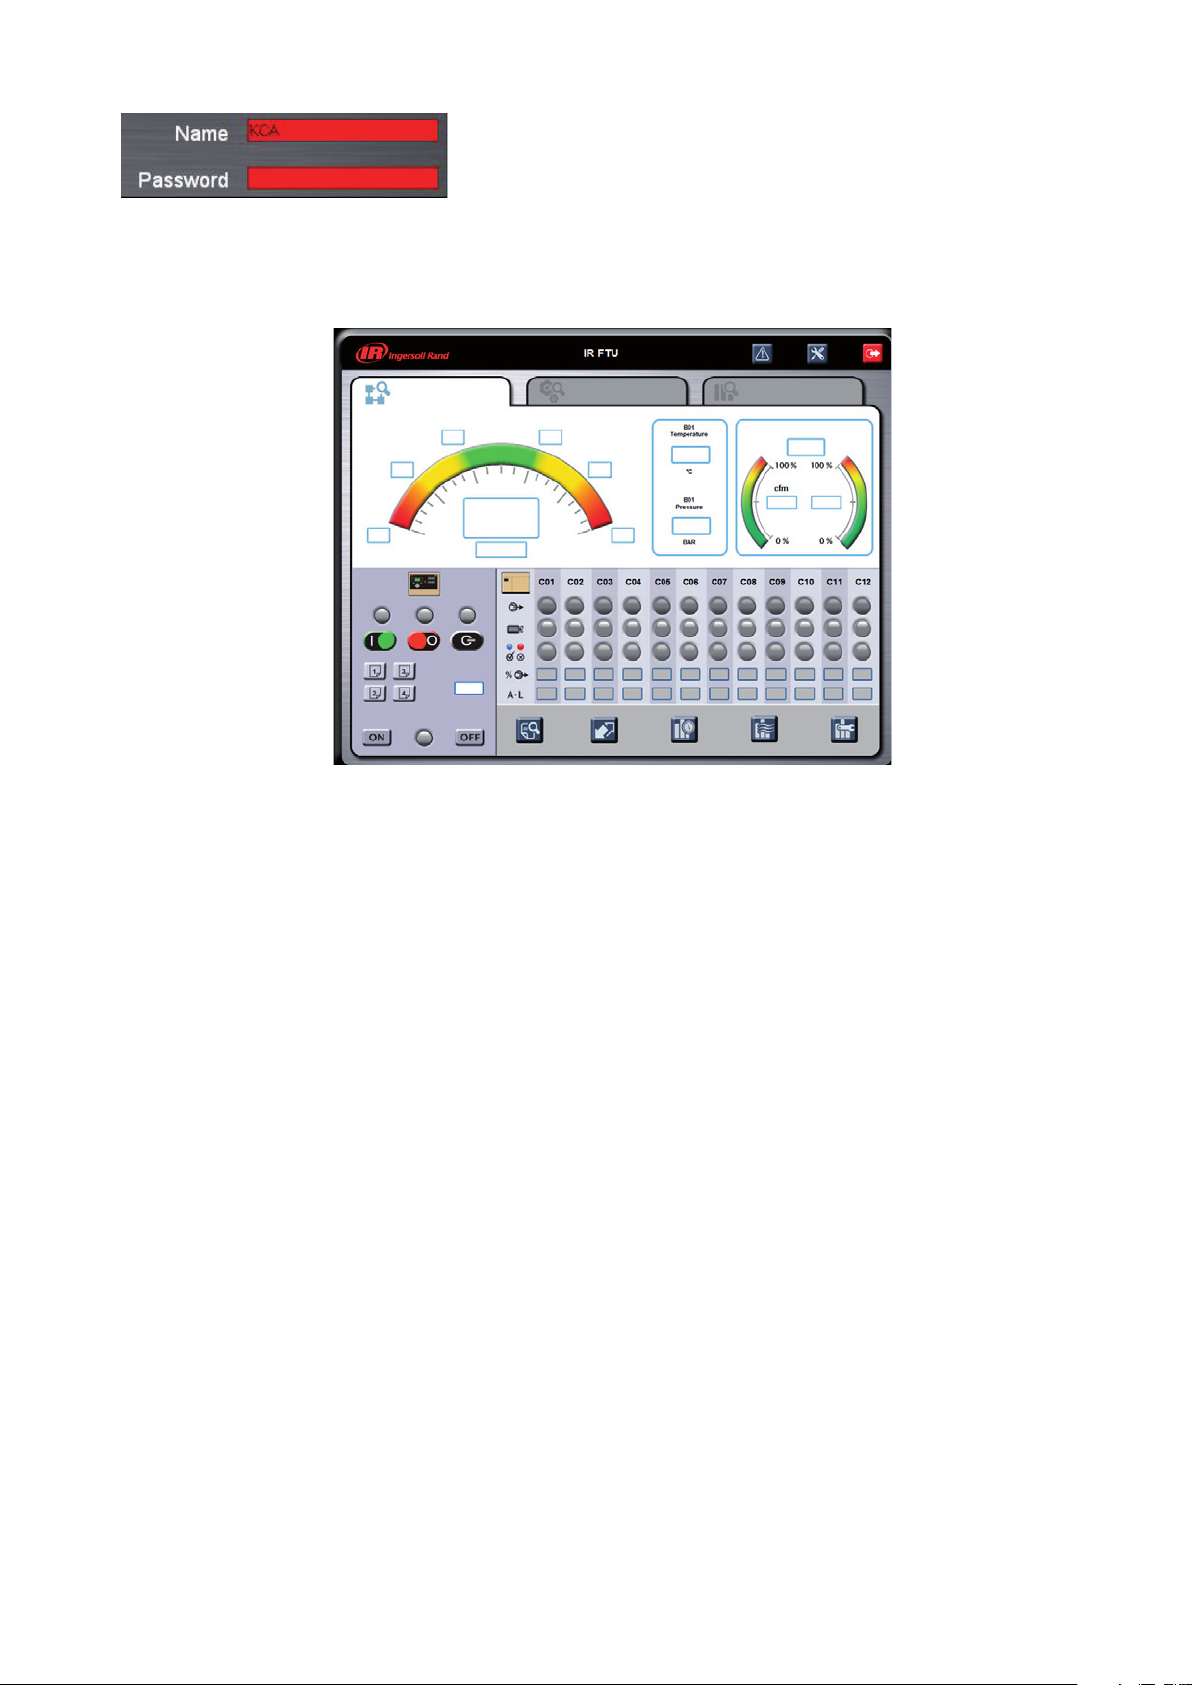
If the user name or password are incorrect the background of the eld will
turn red.
Please see section 4.2 for default account information, and section 8.5 for more detailed information about the account
management process.
Upon successfully logging in you will see the system overview screen shown below:
4.2 Default Accounts
The Visualization software comes precongured with three default user accounts. The system administrator can
assign users one of three levels of access (view only, user, and administrator) which will determine which functions
will be available. For example, only users with administrator access will be able to view or modify the conguration
overview parameters. It is highly advised that the administrator change these accounts as soon as feasible to prevent
unauthorized access to the Visualization software. The three level of access rights are as follows:
VIEW – The user is able to view all information on the SOV and EOV screens and their detail view screens. The
1.
user is unable to change any set points or access the Conguration Overview (COV) screens.
2. USER – The user has all rights available to the VIEW access level as well as being able to change set points on
2.
the table conguration screens, pressure schedule screens, and is able to manually start and stop compressors,
as well as start and stop the X8I/X12I.
3. ADMIN – The user has all rights of the VIEW, and USER access levels as well as full access to the Conguration
3.
Overview (COV) screens, the account management utility, and the diagnostics screen.
Please note that there can be as many as ve (5) maximum users logged into the system at one time, and only one
administrator logged in at one time.
The three default accounts are:
Login: view
1.
Password: pwview
Rights: VIEW
Login: user
2.
Password: pwuser
Rights: USER
Login: admin
3.
Password: pwadmin
Rights: ADMIN
Only a user with ADMIN rights will be able to modify these default accounts.
9
Page 10
10
SECTION 5 NAVIGATION
5.1 Title Bar
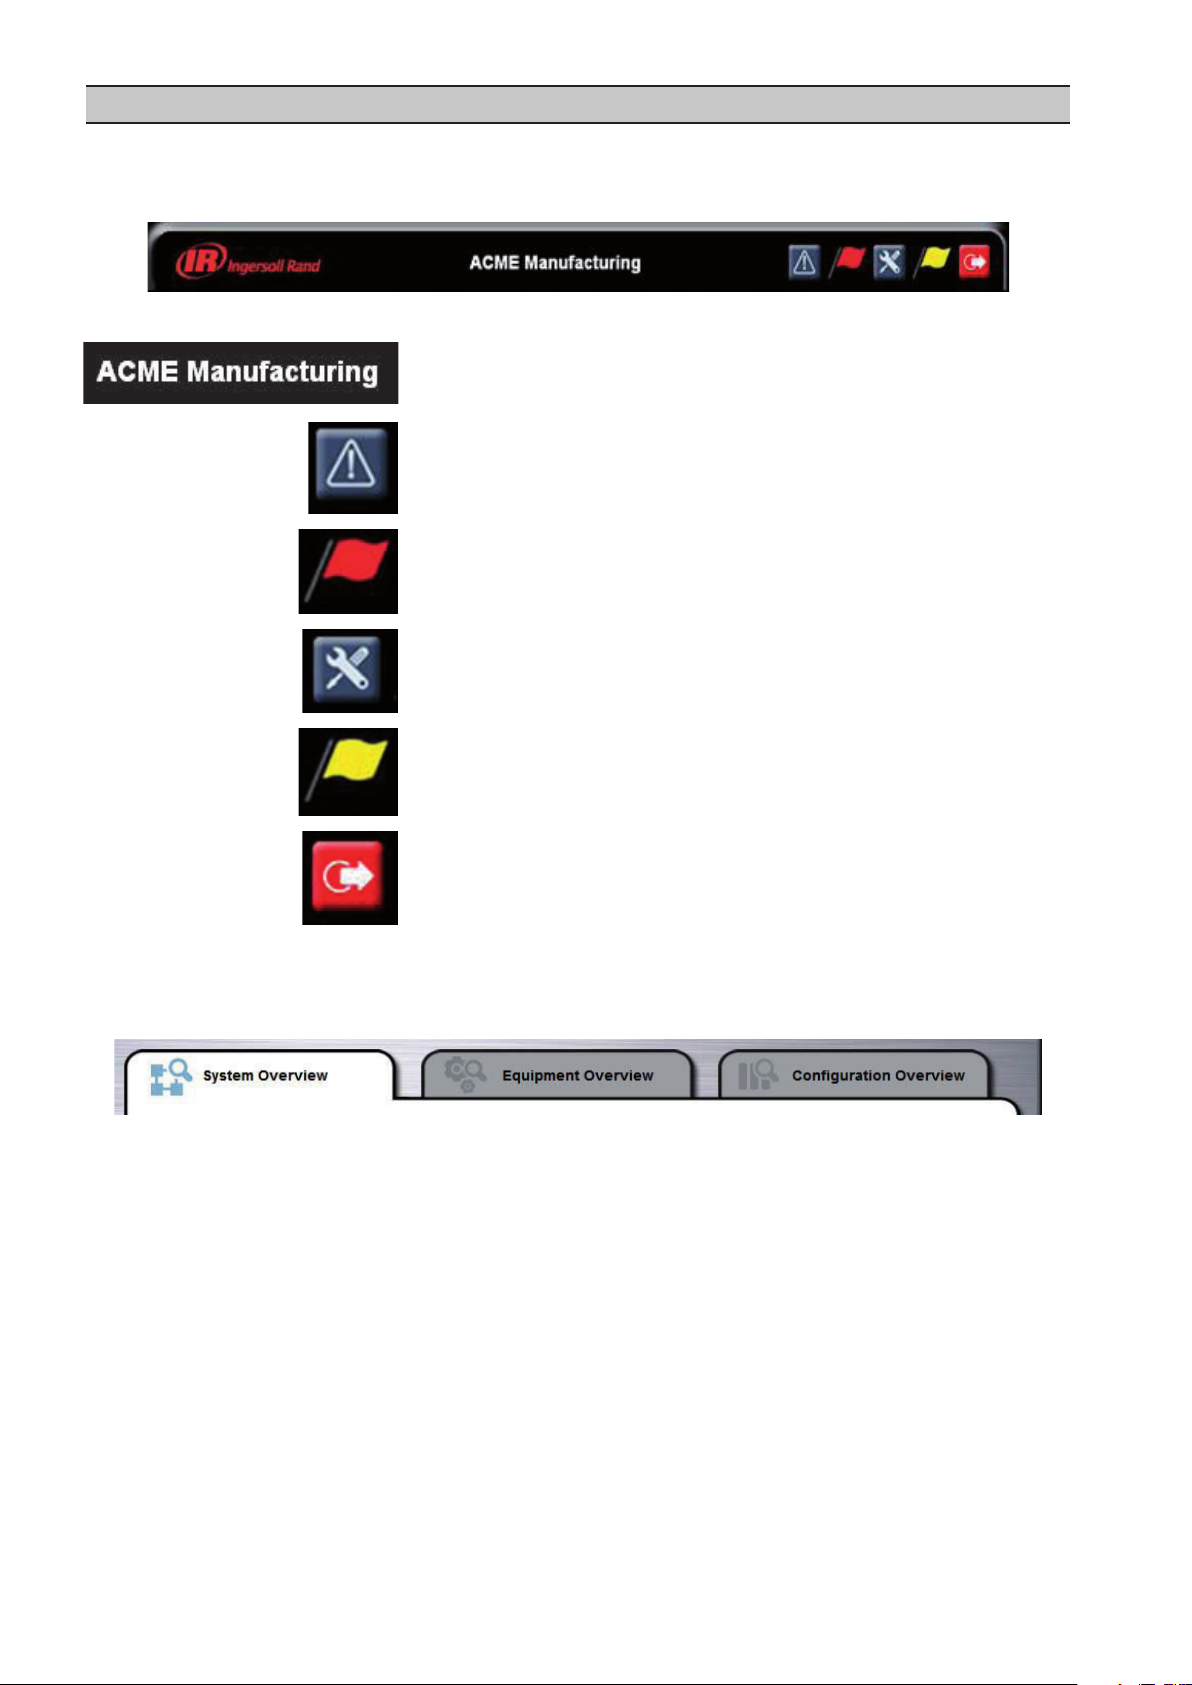
Visualization navigation uses a simple point and click interface. A title bar will be present at the top of every screen and
will display information about system name, alarms, and will provide access to event and service logs.
The components of the title bar are as follows:
Installation Name – This is congured by the system administrators and is a
name that is used to identify the compressed air system.
Event Log Button – Clicking this button will bring the user to the
visualization event log. See section 6.1.1 – Event Log
General Alarm Flag – This ag will appear if there is an alarm condition
present on the X8I/X12I or any of the compressors in the system. If there is
no alarm present or the alarm has been resolved this ag will disappear.
Service Maintenance Button – Clicking this button will bring the user to
the maintenance reminder utility. See section 6.1.2 – Service Reminder
utility.
Service Reminder Flag – This ag will appear if a service reminder has been
set up for a compressor and service is now due. Once the service reminder
has been updated this ag will disappear.
Log Out Button – Clicking this button will log out the current user and
return to the visualization login screen.
5.2 Tab Navigation
Each of the three main segments: System Overview, Equipment Overview, and Conguration Overview, is represented
by a tab below the title bar.
Clicking on the tab will bring you to the overview screen for that particular segment.
Clicking on the system overview tab will bring the user to the System Overview page. From here the user can monitor
and adjust (with the correct security) important air system data such as air system pressure and eciency, status of
each compressor, and X8I and X12I status in an easy to read dashboard style interface. The system overview screen is
also the launching point for set point and scheduling screens plus performance reports and historical graphing and
trending tools. See section 6 – System Overview.
Page 11
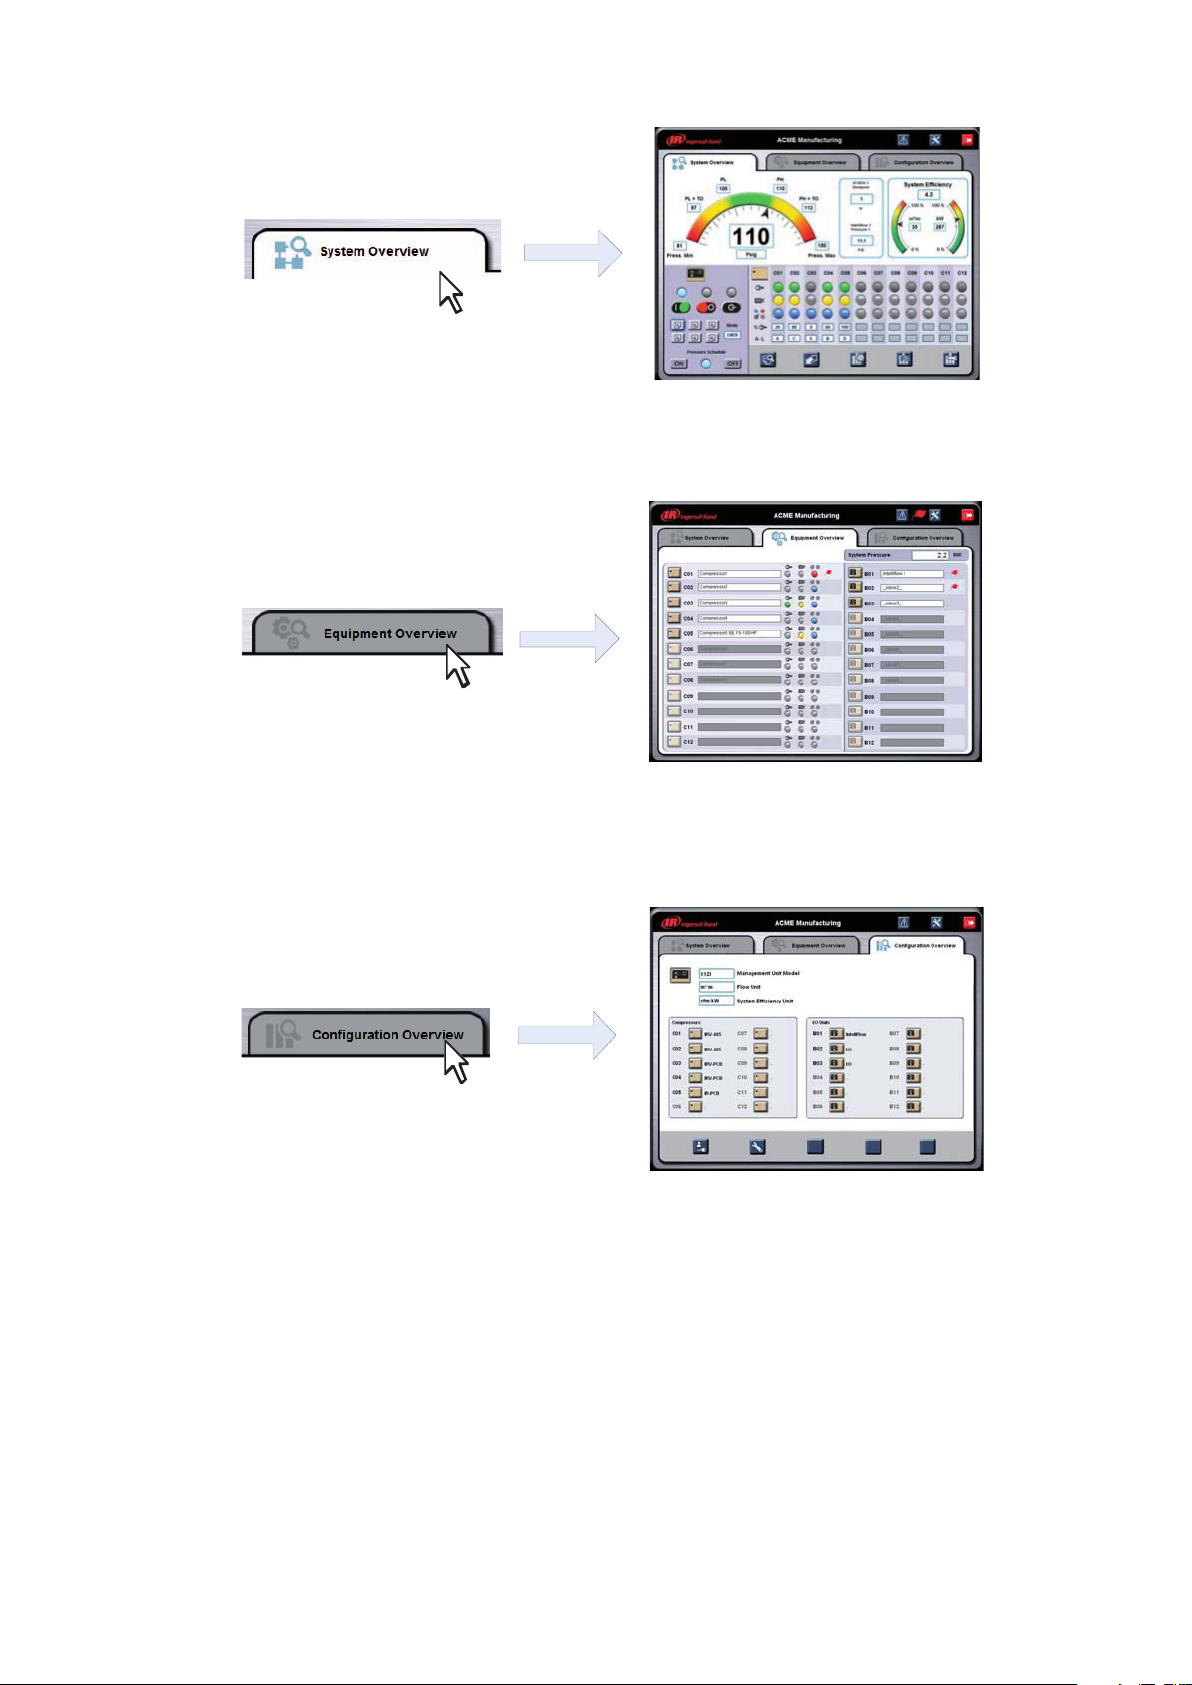
Clicking on the equipment overview tab will bring the user to the Equipment Overview page. From here the user can
monitor more detailed compressor information such as the model and manufacturer of the compressor, capacity and
power data, and congurable data points. See section 7 – Equipment Overview.
Clicking on the conguration overview tab will bring the user to the Conguration Overview page. From here the
system administrator(s) can view and change air system congurations such as adding or removing a compressor,
I/O box, or Intelliow valve. Manage user accounts and network conguration and view diagnostic information. The
conguration overview page is only accessible by users with ADMIN rights. See section 8 – Conguration Overview.
Navigation between tabs is instant; there is no need to save data before moving to another tab. From the overview
tabs the user can navigate to the various associated detail view pages.
11
Page 12
12
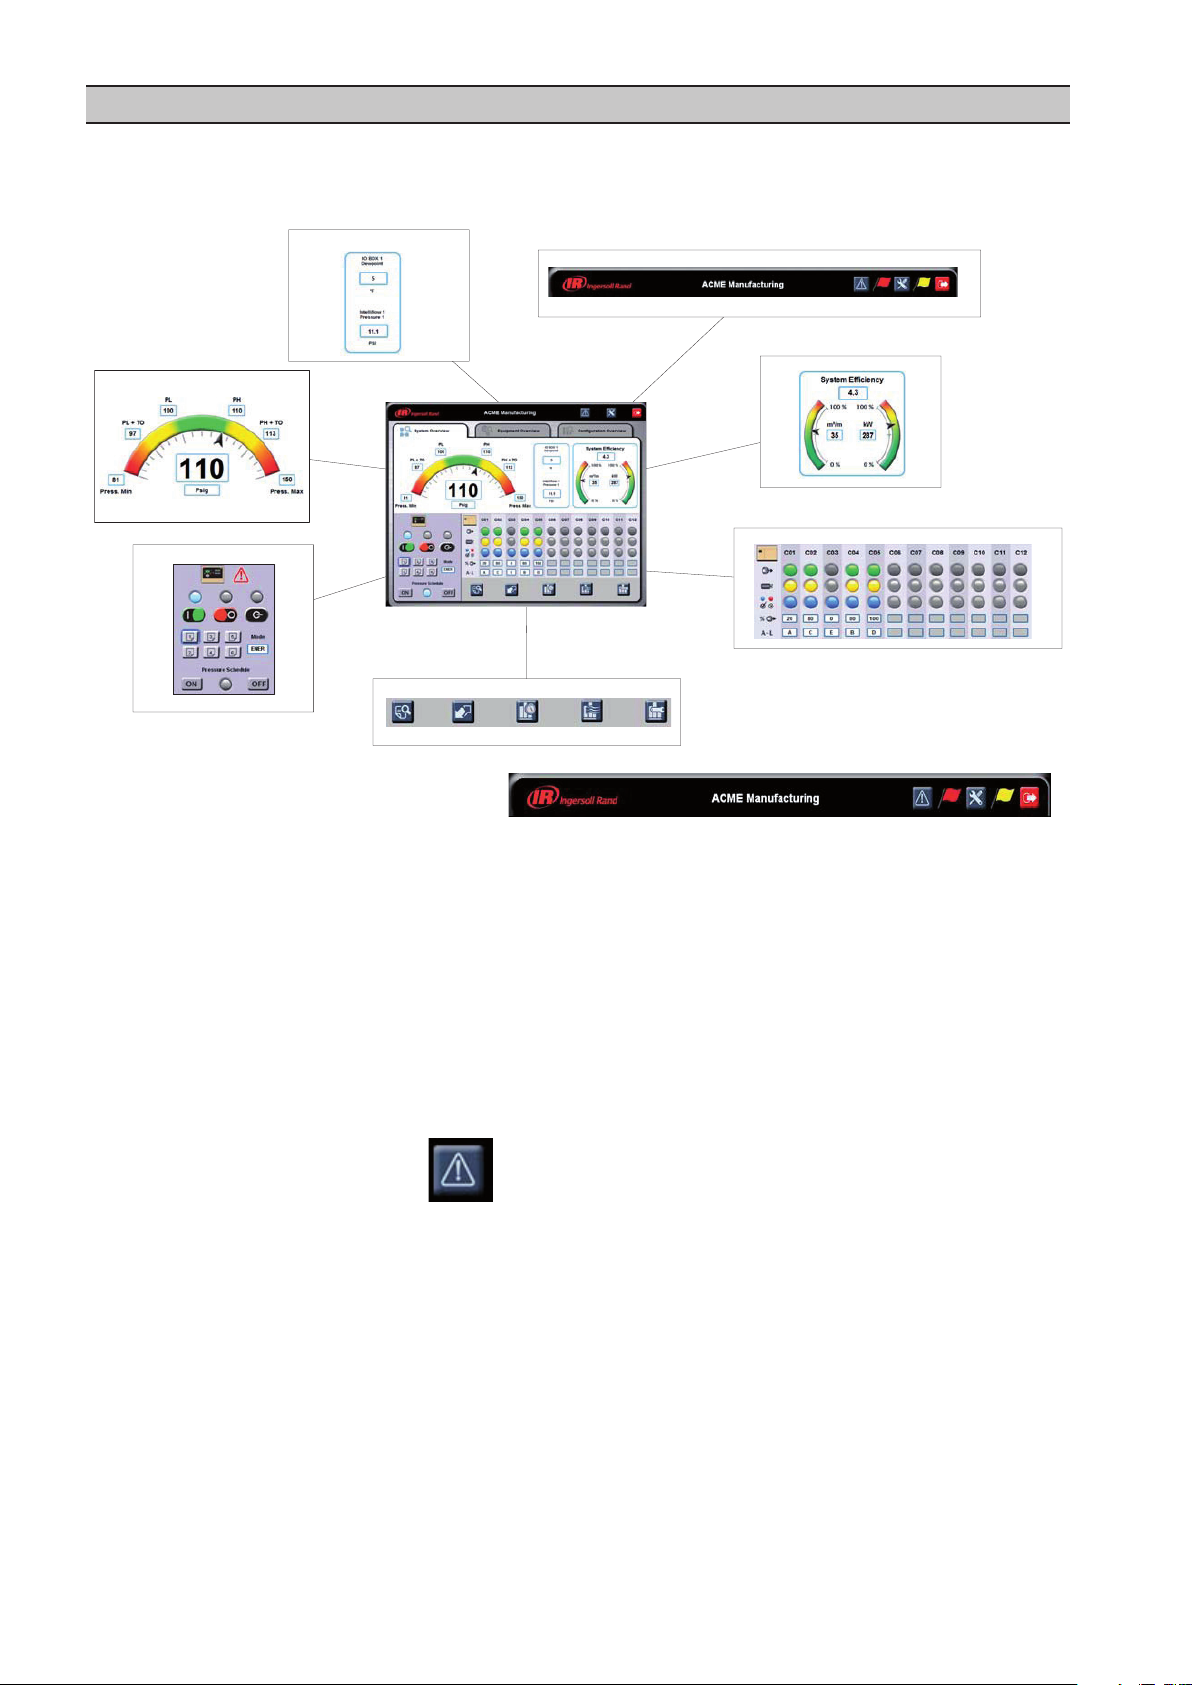
SECTION 6 SYSTEM OVERVIEW
Title Bar – Section 5.1 and 6.1
Dashboard – Section 6.2
Efficiency Gauge – Section 6.4
X8I/X12I Interface – Section 6.5
Compressor Status – Section 6.6
System Detailed View – Section 6.7
Configurable I/O – Section 6.3
6.1 The System Overview Screen
The system overview screen presents an overall view of your compressed air system and is broken down into
functional sections.
6.1.1 Title Bar - The Event Log
The Visualization Event Log records certain events that occur in your air system or in the visualization software itself.
The events recorded and placed into one of three categories:
1.
2.
3.
The event log will record the last 500 events. Once this 500 event limit has been reached the oldest events will be
cleared and the newest events will appear at the top of the event log.
The event log is accessible from all overview screens using the following procedure:
Alarms – Alarms are events that indicate that an abnormal situation has occurred on a compressor, X8I/X12I, I/O
Box, or Intelliow valve but the piece of equipment is still functioning normally.
Trips/Shutdowns – Trips/Shutdowns are events that indicate that an abnormal situation has occurred on a
compressor, X8I/X12I, I/O Box, or Intelliow valve and the piece of equipment has been stopped.
System Information – System information events record user logins and logouts.
Click the event log button
Page 13
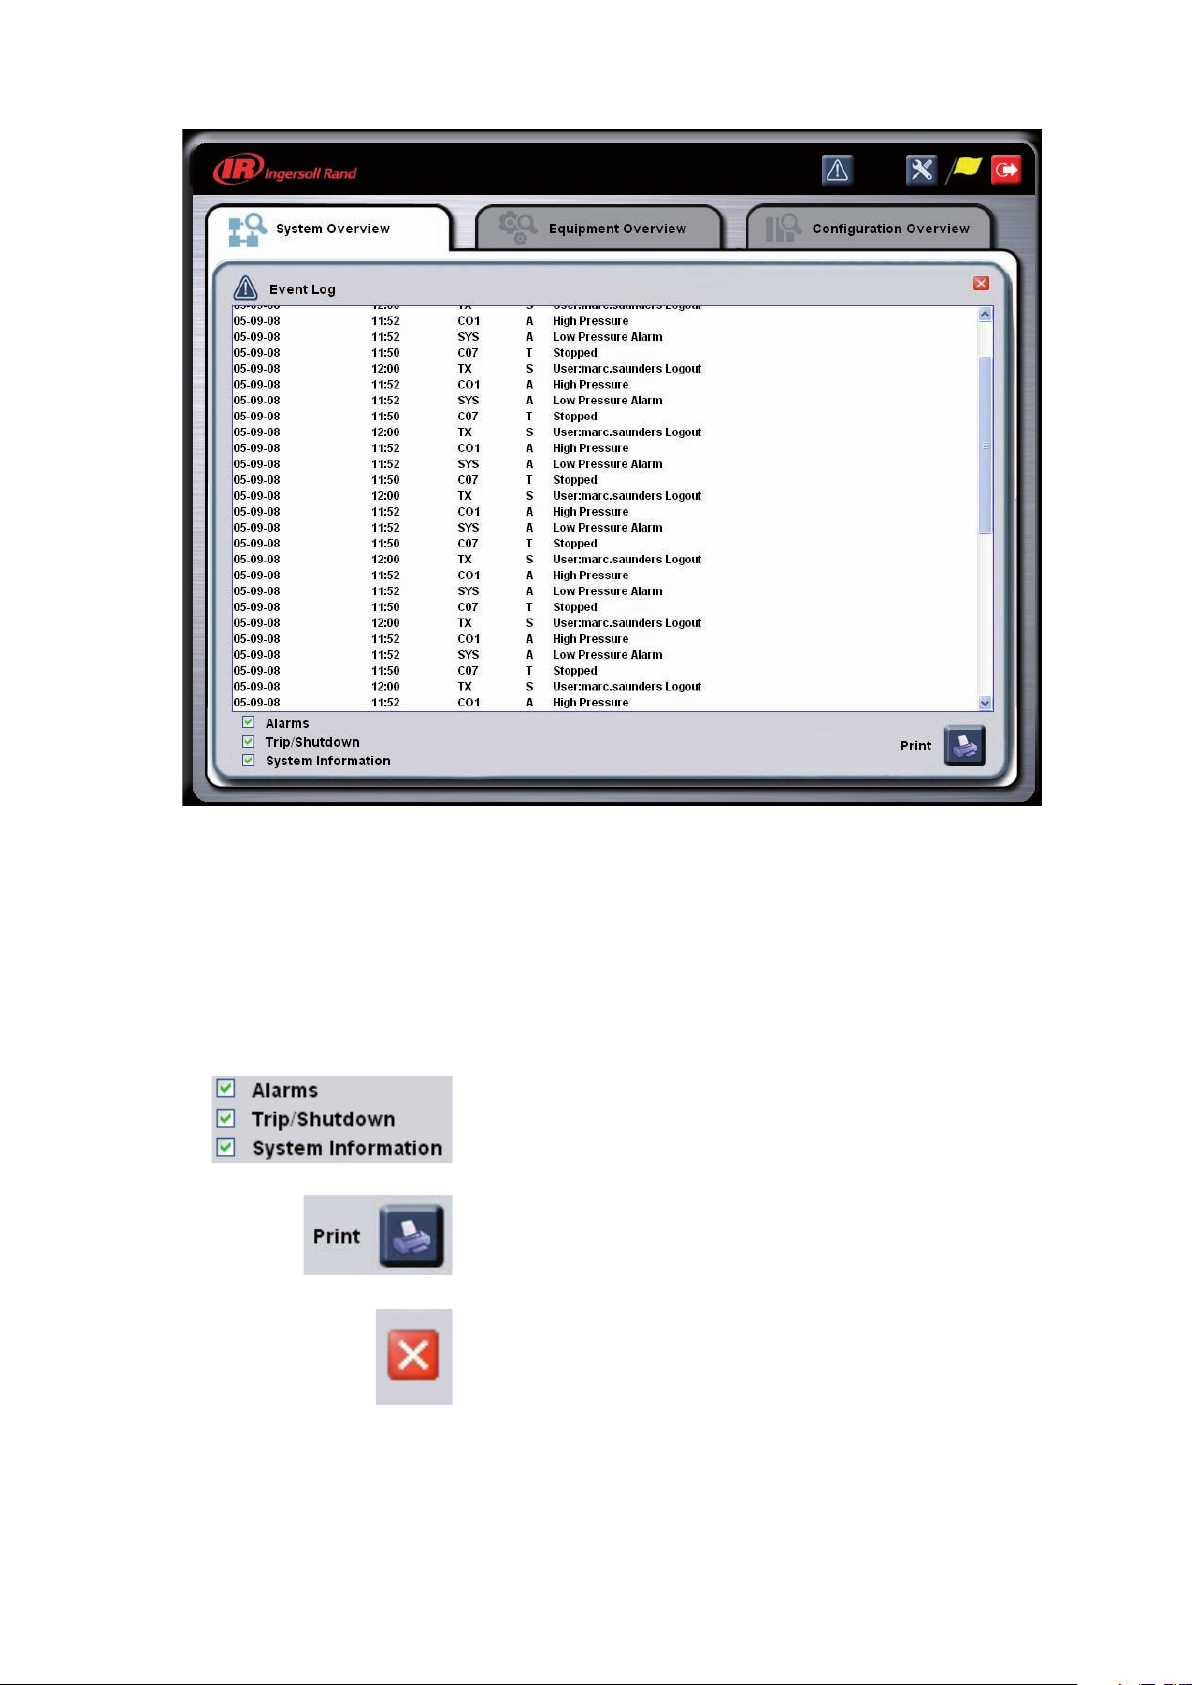
The event log will then appear as shown below
Information in the event log is presented in ve columns. The columns represent, from left to right:
Date of the event (in DD/MM/YY format).
1.
Time of the event (in a 24 hour clock format).
2.
Equipment reporting the event (C01 through C12 for compressors, B01 through B12 for I/O boxes and Intelliow
3.
valves, SYS for the X8I or X12I, and VX for the VX box itself.
Type of event. A(Alarm), T(Trip), or S(Shutdown).
4.
Details of the event.
5.
The event log lters allow you to control which events are displayed
on the event log. A check mark appearing next to the event type
means all events of that type will appear in the log. Uncheck the box
to hide all events of that type.
Clicking the print button will print the event log.
When you are nished with the event log, clicking the exit button will
exit back to the overview screen last viewed.
13
Page 14
14
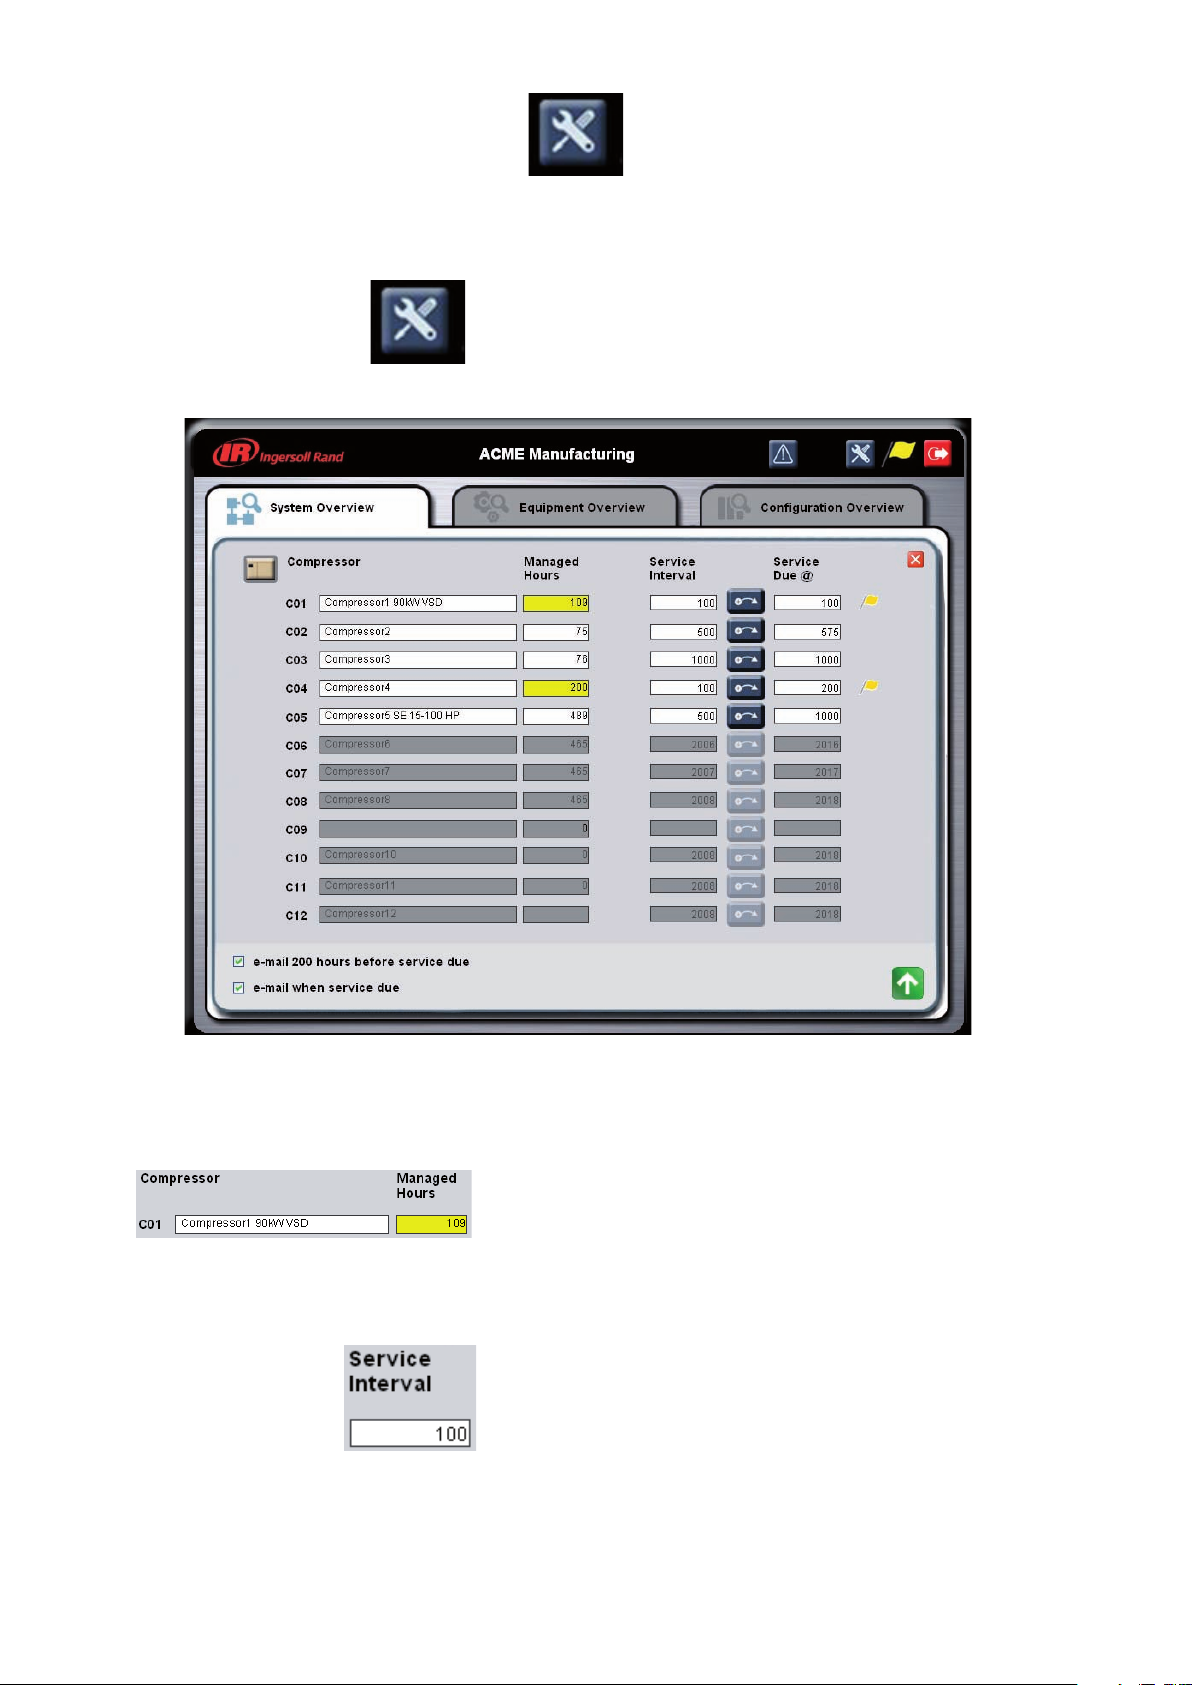
6.1.2 Title Bar - The Service Utility
The Service Utility is used to set up maintenance reminders for compressors in the system. The user enters a specied
maintenance interval based on the compressor’s factory recommendations and the Visualization software will provide
a visual cue on the title bar as well as optional email reminders that are sent to selected users.
The service utility is accessed by clicking the service utility button
on the title bar.
The service utility will appear as shown below:
The service utility has the following data:
Compressor address on the system controller (C01 through
C12) and the compressor name as congured by the system
administrator.
Managed Hours – The number of hours that the X8I/X12I has been
monitoring the compressor. Please note that this value is initially
entered into the X8I/X12I based on the compressor’s local running
hour indicator. This value must periodically be compared to the
actual compressor running hours to maintain consistency. This
value will turn yellow when maintenance is due and the yellow
ag will appear on the title bar.
This value is entered based on the compressor’s maintenance
interval according to OEM recommendations.
User or Administrator access is required to change this value.
Page 15
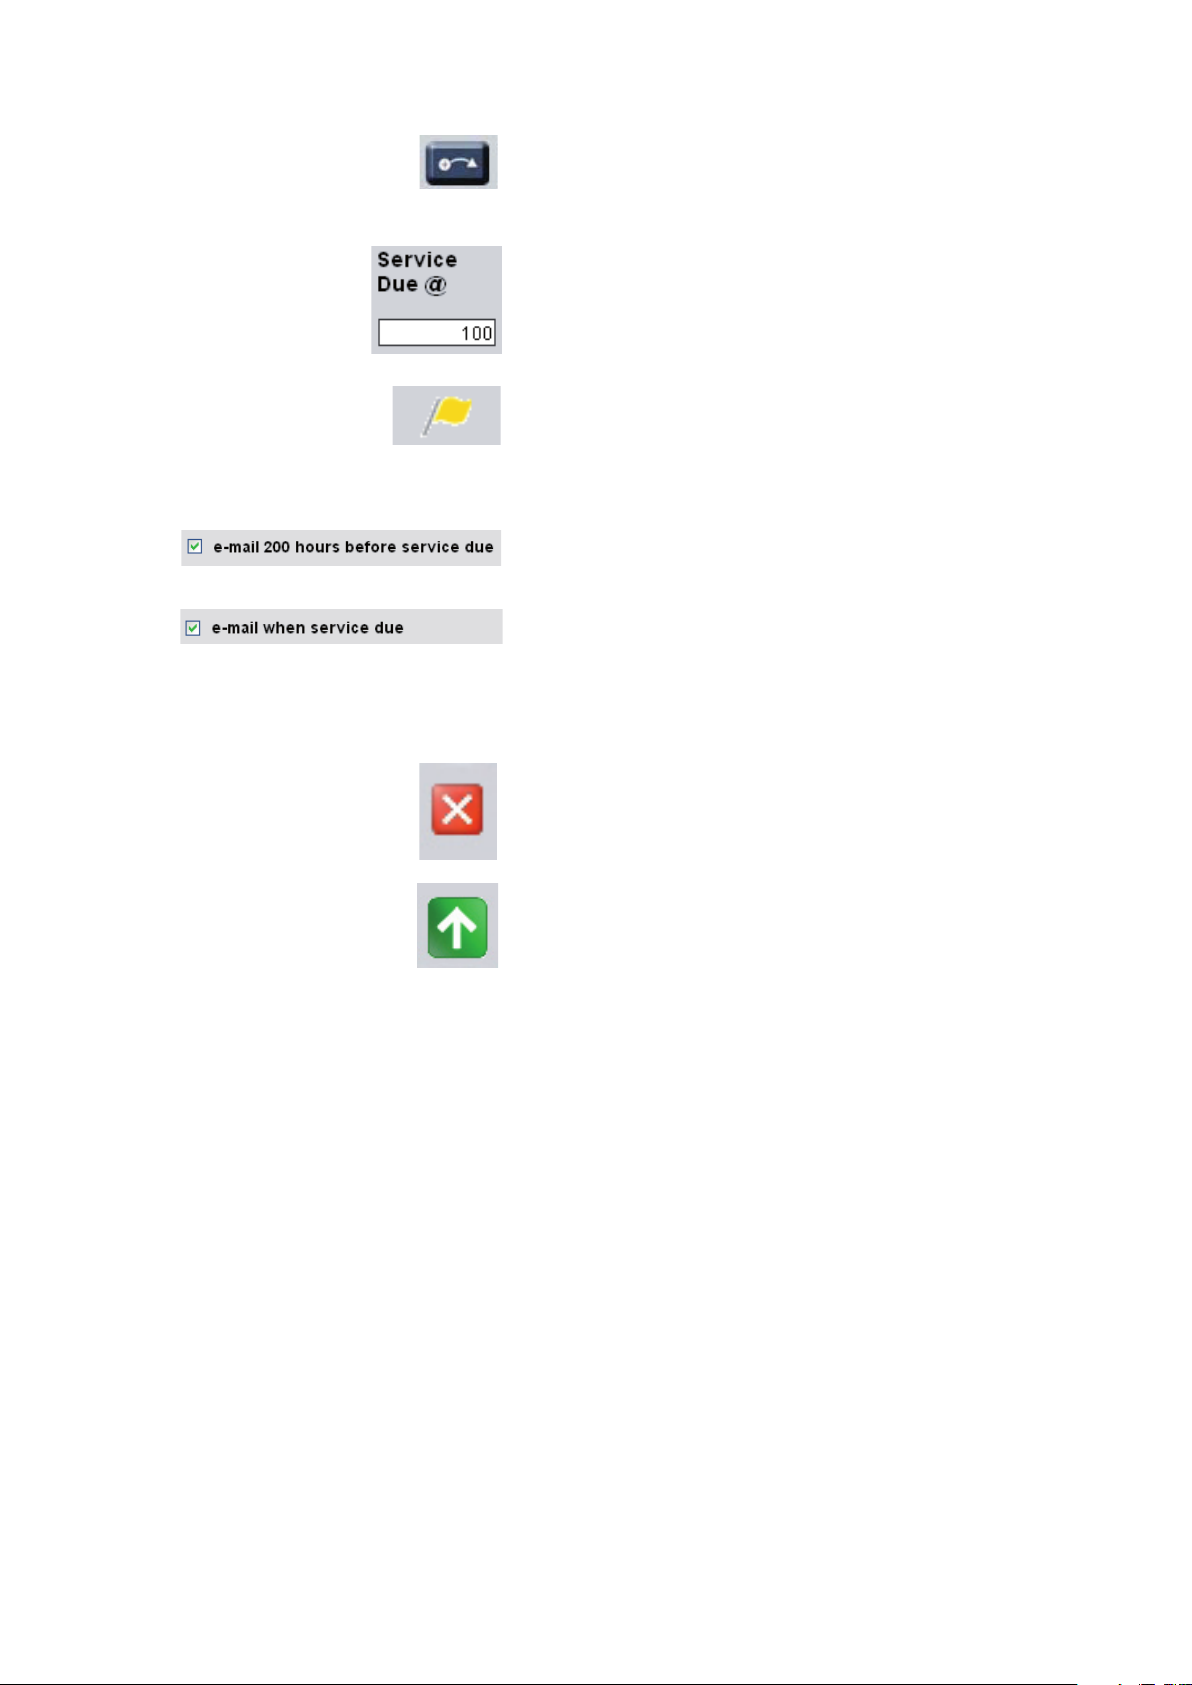
Pressing this button adds the service interval to the managed
hours. This adds the service interval value to the service due eld
and removes the yellow maintenance due ag for the compressor.
This should be done after maintenance is performed on the
compressor. This button is only available to users with User or
Administrator rights.
When the managed hours reach the service due hours the yellow
maintenance reminder ag will be activated.
The maintenance reminder ag appears when the managed hours
reach the service due hours. There is a ag for each compressor
and a master ag that will appear on the title bar if any compressor
has a maintenance reminder ag active.
The service utility also has the capability of emailing users that service is due.
Checking o this option will instruct the visualization software
to send out emails to any users who have been selected by the
administrator when a compressor is due for service in 200 hours.
Checking o this option will instruct the visualization software
to send out emails to any users to have been selected by the
administrator when a compressor is due for service.
Please see section 6.5 for information on setting up users to receive service due reminder emails.
When you are nished viewing and/or changing the settings in the service utility:
Click the exit button to leave the service utility without saving any
changes. You will be returned to the last overview page viewed.
Click the Save and Exit button to save your changes and return to
the last viewed overview page.
15
Page 16
16
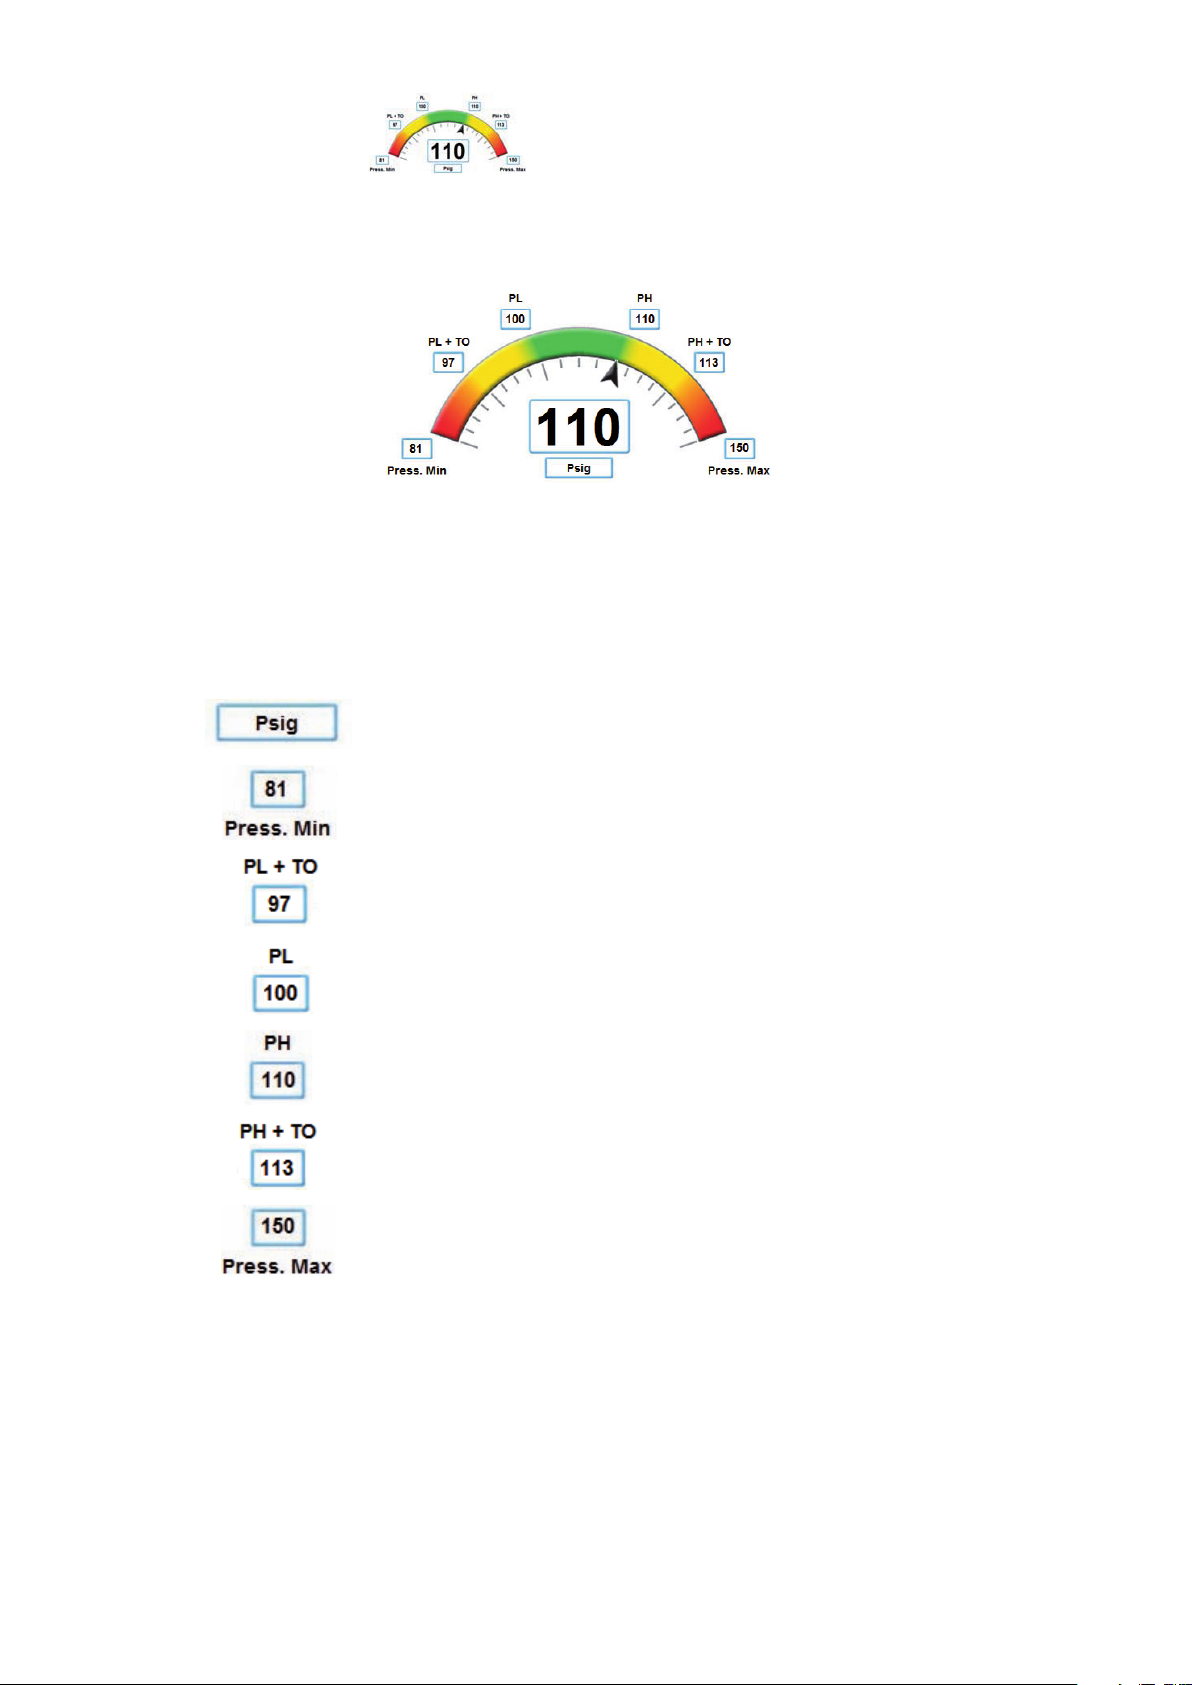
6.2 The Dashboard
The dashboard area of the System Overview page (SOV) is where system pressure information is displayed in an easy
to read gauge interface. The dashboard prominently displays system pressure as well as setpoints from the X8I or X12I
system controller.
The arrow on the pressure gauge represents where the system pressure is in relation to the system controller’s
setpoints. If the arrow is in the green zone system pressure is currently optimal and the system controller will take no
action. If the arrow reaches the yellow zone the system controller will consider actions to load or unload a compressor
to return system pressure to the green zone. In the red zone the system controller is taking increasingly urgent action
to return the system pressure to the green zone. Please see the X8I or X12I operator’s manual for more detailed
information on pressure control.
The other data points shown are (please note that the values below are examples only):
System pressure display units. Clicking on the units will switch between bar and
psig units of measure.
Minimum pressure alarm setting.
Low pressure setpoint minus the tolerance setting.
Low pressure setpoint. This is the pressure setpoint where the X8I or X12I will load
a compressor. This is based on the active table.
High pressure setpoint. This is the pressure setpoint where the X8I or X12I will
unload a compressor. This is based on the active table.
High pressure setpoint plus the tolerance setting.
Maximum pressure alarm setting.
Please refer to the X8I or X12I operator’s manual for further information on the system pressure setpoints.
Page 17
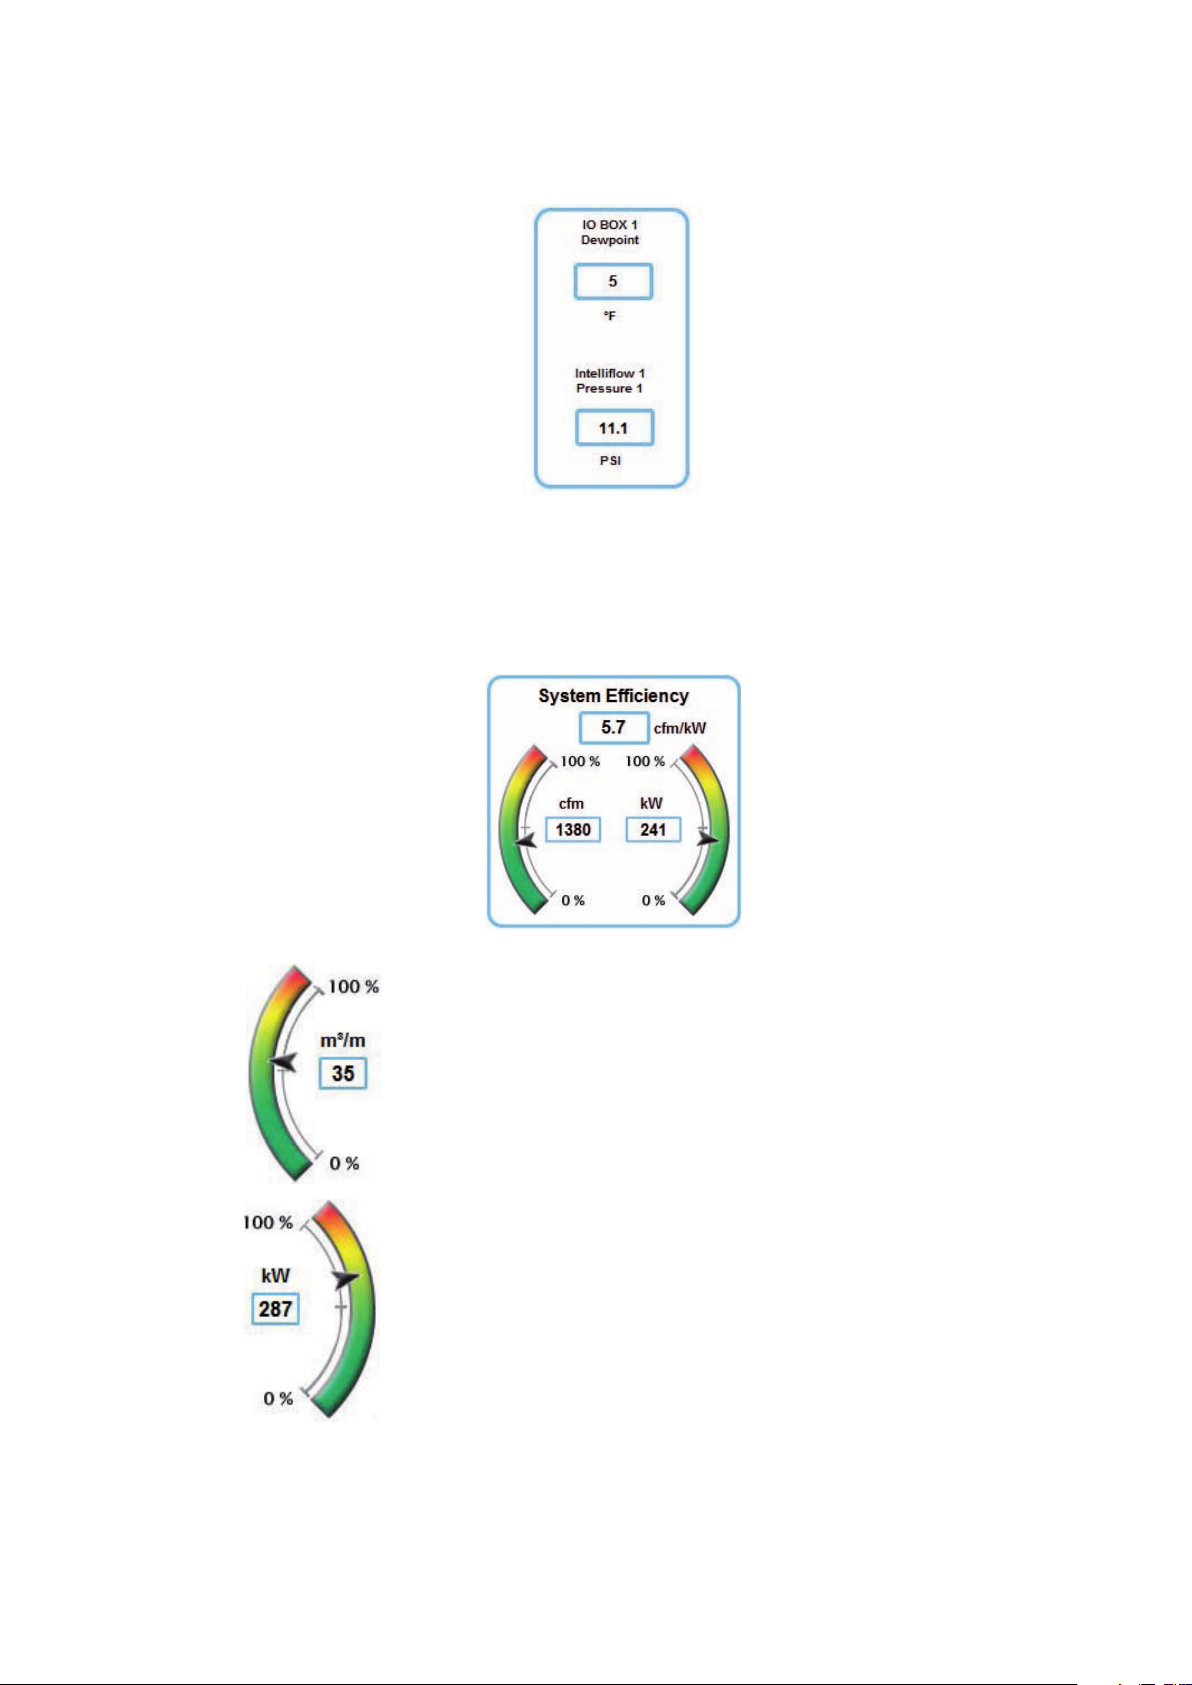
6.3 Congurable I/O
The congurable I/O section of the SOV screen allows the user to select two data points to display on the SOV. The
user congurable I/O may be from the X8I or X12I, an Intelliow valve, or an I/O box. The congurable I/O may only be
congured by a user with administrator rights, see section 8.2.2 – User Congurable Data Items.
6.4 System Eciency Gauge
The system eciency gage calculates and displays an overview of air system energy eciency. This is intended to be a
guide only and is based on user input, monitored status, and in some cases, measured data. The system eciency units
are congurable by a user with administrator rights. System eciency can be displayed in units of cfm/kW, kW/cfm, or
kW/m3/min.
The system output gauge uses the name plate capacity of the compressors
in the air system as well as monitoring compressor load states to
determine how much compressed air is being placed into the system.
The gauge shows how much capacity is being utilized in relation to the
capacity of all compressors in the system. A ow meter can also be used
for this value. Units and data source can only be changed by a user with
administrator rights, see section 8.2 – System Setup.
The system power consumption gauge uses the name plate power
consumption of the compressors in the air system as well as monitoring
compressor load states to determine the current power draw of the
compressors. The gauge shows how much power is being consumed
in comparison to the power consumed when all compressors are at
maximum load. Units are always kW.
The system eciency reading is only a guideline and should be used for monitoring day to day changes in compressed
air system eciency. True system eciency can only be determined with accurate ow and power meters and detailed
calculations.
17
Page 18

18
6.5 X8I/X12I Interface
The X8I and X12I interface allows remote control of the system controller from the visualization software. The user can
monitor and change the current operating state as well as change system controller setpoints.
If an X8I or X12I system alarm occurs this caution symbol will
appear next to the system controller icon on the X8I/X12I
interface.
6.5.1 X8I/X12I Controls
The X8I/X12I controls can only be used by users with USER or ADMIN rights. All other users will only be able to view the
status.
Pressing the start button will start the X8I or X12I. The blue indicator light
above the button will light up to conrm that the system controller has started.
The indicator will also change state if the X8I/X12I has been started or stopped
remotely.
Pressing the stop button will stop the X8I or X12I and place the compressors into
local control. The blue indicator light above the button will light up to conrm
that the system controller has stopped. The indicator will also change state if the
X8I/X12I has been started or stopped remotely.
Pressing the standby button will place the X8I or X12I into a standby state and
hold all compressors unloaded. The blue indicator light will light up to conrm that
the system controller is in standby. WARNING – The standby button will stop all
compressors in the system from producing air. Be sure this is what you intend
to do before pressing the standby button.
6.5.2 Table Conguration and Control
The X8I and X12I control interface allows the user to see which table is currently active and which sequencing
algorithm the system controller is currently utilizing. The user can also edit any table setpoints. Please note that the X8I
has four tables while the X12I has six tables.
The current active table will be highlighted in blue, such as table 1 in the picture above. If the active table changes;
either by the pressure schedule or by a user changing the default table on the X8I/X12I the highlight will move within
two seconds of the change being made. If the system controller is in a standby state no table will be highlighted.
Page 19

The mode shows the sequencing algorithm that is currently being utilized by the
system controller. If a change is made, this will be updated within two seconds.
Clicking on a table will bring up a table conguration screen where the user can
edit the pressure setpoints in the system controller. This function is only available
to users with USER or ADMIN rights.
The table conguration screen allows anyone with USER or ADMIN rights to change the X8I/X12I table setpoints.
Users with VIEW rights will only be able to view the settings. The X8I/X12I setpoints are described in detail in the X8I or
X12I operator’s manual.
High Pressure Setpoint – The X8I/X12I will unload a compressor when
system pressure rises above this value.
Low Pressure Setpoint – The X8I/X12I will load a compressor when system
pressure drops below this value..
Minimum Pressure Alarm – The X8I/X12I will report an alarm condition if
system pressure drops below this value.
Sequencing Algorithm – The sequencing currently utilized by the X8I/
X12I.
Compressor Priority – Set each compressors priority in the X8I/X12I
sequence. Please see the X8I/X12I operator’s manual for more information
about compressor priority.
When you are nished viewing and/or changing the settings in the table conguration screen:
Click the exit button to leave the table conguration page without
saving any changes. You will be returned to the SOV screen.
Click the Save and Exit button to save your changes and return to
the SOV screen.
19
Page 20

20
6.5.3 Pressure Schedule Control
The pressure schedule control allows a user with USER or ADMIN rights to activate or deactivate the pressure schedule
on the X8I/X12I. The X8I/X12I’s pressure schedule allows the user to switch between pressure tables or standby mode
based on date and time. The pressure schedule is activated by clicking the ON button. The indicator light will turn blue
to conrm that the pressure schedule has been activated. The pressure schedule can be deactivated by clicking the
OFF button. The indicator will then turn grey to conrm that the pressure schedule has been deactivated. The indicator
will also change state if the pressure schedule has been activated or deactivated from the X8I/X12I.
Please see section 6.7.2 – Pressure Schedule for information on setting up the pressure schedule. Also please refer to
the X8I or X12I operator’s manual for detailed information about the pressure schedule functionality of the X8I/X12I.
6.6 Compressor Status Overview
The compressor status overview gives the current operating condition of all compressors that are connected to the
X8I/X12I. The overview duplicates the data that is given on the X8I/X12I control panel, using the same style of lights.
The compressor status overview is view only and may not be adjusted by any users.
Compressor address.
Compressor Load Status – This indicator will be green when the
compressor is in a loaded condition and grey when the compressor is
unloaded.
Compressor Running Status – This indicator will be yellow when the
compressor’s motor is running and grey when the compressor’s motor
is not running.
System Control Indicator – This indicator will be blue when the
compressor is under X8I/X12I control and red when the compressor is
under local control or placed into service maintenance mode, or
otherwise unavailable to the X8I/X12I.
Compressor Load Percentage – This value displays the load percentage
the compressor is currently reporting. This will vary for variable speed
drive compressors and be either 0% or 100% for xed speed
compressors.
Compressor Sequence Position – This letter will display which place in
the sequence the compressor is assigned. This letter can range from A
to K for a 12 compressor system, with A being the 1st compressor in the
sequence and K being the 12th. An @ symbol in this eld will indicate
that the compressor has been restricted from use in the priority
settings.
Page 21

6.7 System Detail View
Performance Report Utility
Pressure Schedule
System Pressure Graph
Total Flow Graph
Configurable Graph
The system detail view buttons provide access to the visualization software’s reporting and graphing utilities. The
system detail view buttons also provide access to the X8I/X12I pressure schedule.
6.7.1 Performance Report Utility
The performance report provides a summary of the compressed air system’s performance for the past hour, day, week,
or 4 week period. The performance report provides information on the average and maximum output capacity, power
consumption, and utilization of the entire air system. Information on the utilization of each individual compressor
is also displayed. The time period of the performance report is selected based on the current graph being viewed.
For example, if you are currently viewing the 4 week graph, clicking the performance report utility will produce a
performance report for that 4 week period of time.
Click the Performance Report Utility button to open the
performance report. From the system overview page the
performance report will be based on the last complete seven days
of operation (one calendar week; 168hrs).
Clicking the graph button will open the graph utility.
Clicking on the print button will print the performance report
currently being viewed.
Click the exit button to leave the Performance Report Utility.
You will be returned to the system overview page.
21
Page 22

22
6.7.2 Pressure Schedule
The X8I/X12I pressure schedule can be modied from the visualization software by users with USER or ADMIN rights.
The pressure schedule lets you schedule when the 4 (X8I) or 6 (X12I) pressure tables are utilized. Users with VIEW
rights can only view the current pressure schedule. Please see the X8I or X12I operator’s manual for more detailed
information about the pressure schedule function.
Click the pressure schedule button to open the pressure
schedule conguration screen.
Conguring the pressure schedule in the visualization software is identical to conguring the pressure schedule from
the X8I/X12I control panel. Days are entered as numbers, where 1 is Monday and 7 is Sunday. 8 means the event occurs
every day and 9 means the event occurs every day except for weekends. Hours are entered in a 24 hour format. Please
note that the pressure schedule conguration screen rearranges entries automatically.
When you are nished viewing and/or changing the settings in the pressure schedule conguration screen:
Click the exit button to leave the pressure schedule conguration
page without saving any changes. You will be returned to the SOV
screen.
Click the Save and Exit button to save your changes and return to
the SOV screen.
Page 23
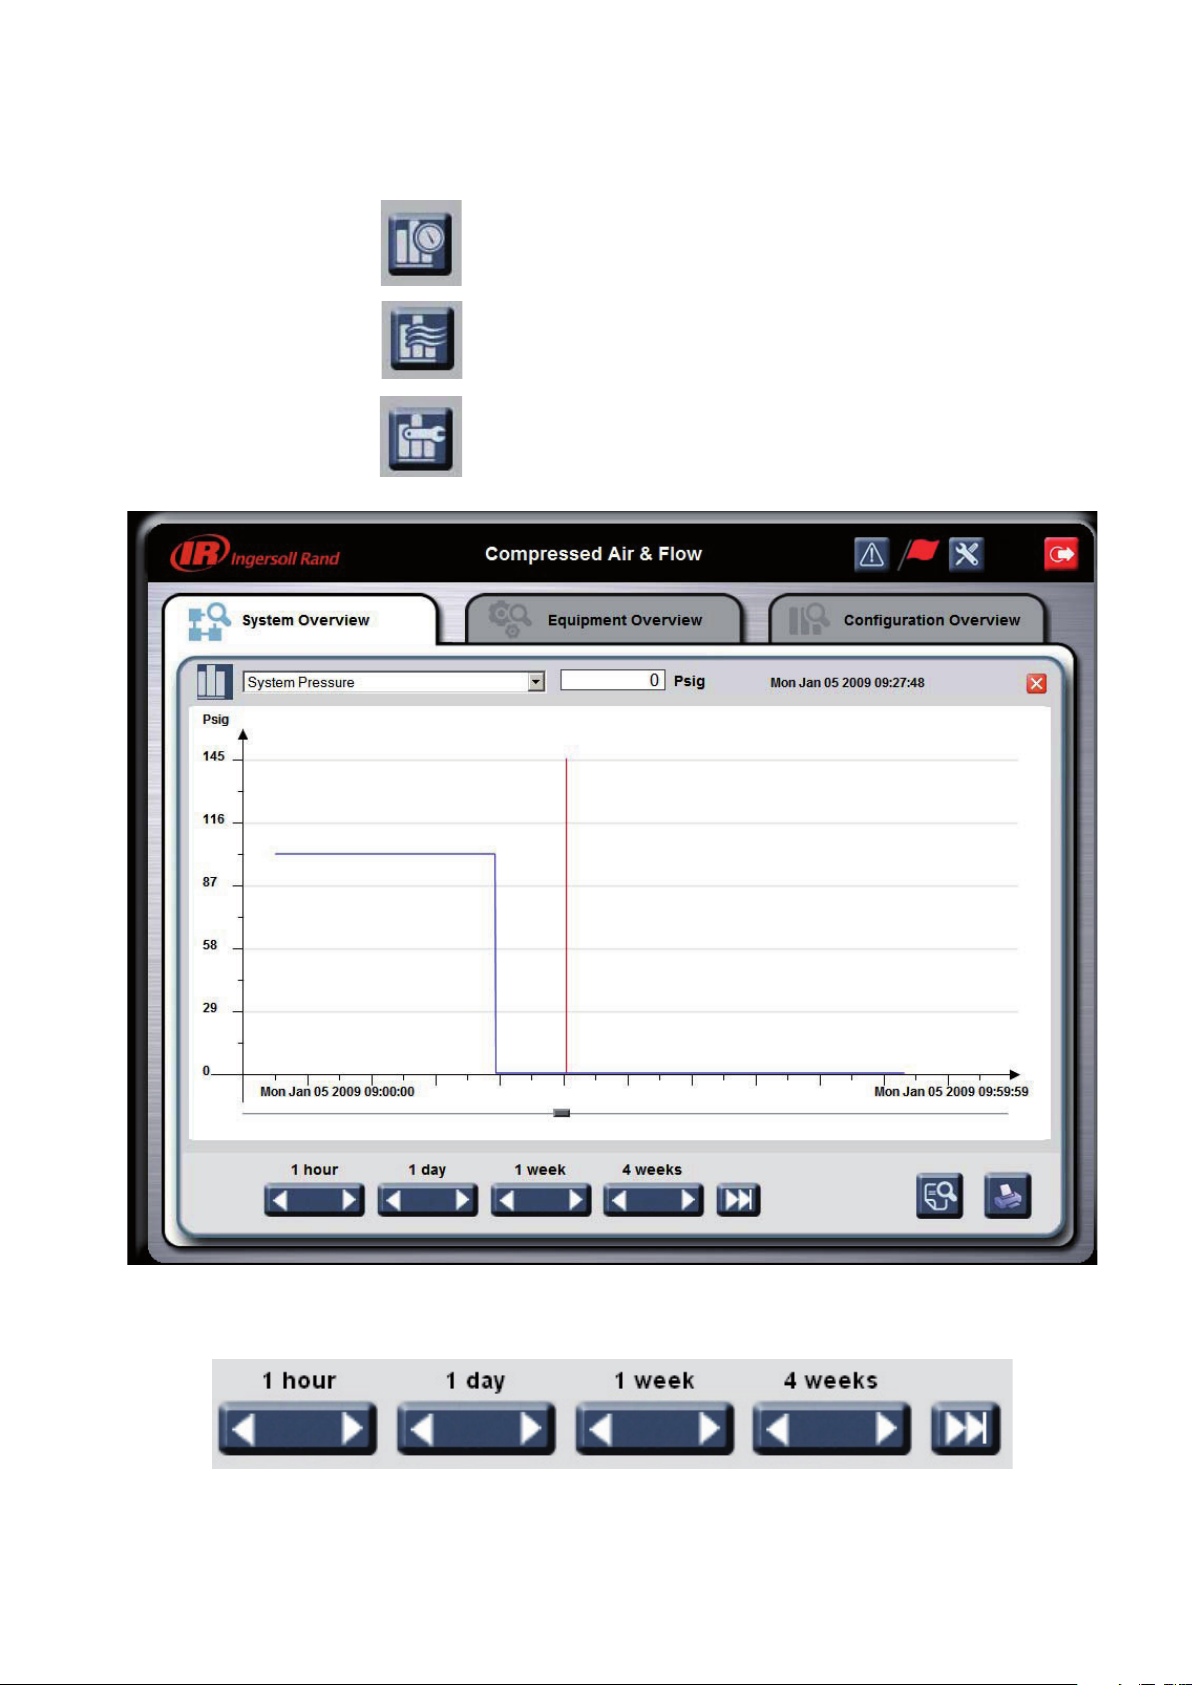
6.7.3 Graphing Utility
The graphing utility allows the user to plot certain data points, such as system pressure, output ow, or compressor
load percentages for hour, day, week, or 4 week periods. There are three graphing utility buttons on the system
overview screen.
Precongured Graph, System Pressure - Click the system
pressure graph button to bring up a graph of the past hour of
system pressure data.
Precongured Graph, Total Flow - Click the system ow graph
button to bring up a graph of the past hour of system ow data.
Congurable Graph - Click on the congurable graph
button to select a variable to graph.
Once the graphing utility has been opened the navigation buttons can be used to see data from dierent time periods.
The VX box will store the last 90 days of data.
23
Page 24

24
Clicking the left arrow will show the previous hour’s data.
Clicking the right arrow will show the next hour’s data (if applicable).
Clicking the left arrow will show the previous day’s data.
Clicking the right arrow will show the next day’s data (if applicable).
Clicking the left arrow will show the previous week’s data.
Clicking the right arrow will show the next week’s data (if applicable).
Clicking the left arrow will show the previous 4 week’s data.
Clicking on the right arrow will show the next 4 week’s data (if
applicable).
Clicking the double right arrow button will bring you to the latest
collected data of the current time period. For example if you are
currently viewing 1 day’s time period you will go to the current day’s
data.
The graph can also be navigated by using the grey slider below the time axis. Sliding the cursor all the way to the left
will navigate to previous data using the same time scale currently selected. Sliding the cursor all the way to the right
will navigate to the next data using the same time scale.
The slider can also be used to view the value of the graph at the selected point in time.
The drop down menu allows you to choose a variable to view on
the graph. Available variables include system pressure, system ow,
compressor load percentages, compressor load status, compressor run
status, user congurable data points, dewpoint (if installed), power, and
eciency.
Dragging the cursor to a point on the graph will display the value in
this box next to the selected variable.
The units of the current variable are displayed.
Page 25

Click the Performance Report Utility button to open the performance
Typical PC USB A Port Connection
USB 2.0 Universal Serial Bus Cable A to B
VX Box USB B Port Connection
report for the currently displayed time period.
Clicking the print button will print the current graph view.
Click the exit button to exit the graphing utility and return to
the system overview screen.
6.7.4 Archiving Historical Data
The VX Box stores up to three months of data for all data points that can be graphed using the graphing utility. In order
to retrieve this data rst follow the USB connection procedure on page 4 of the VX Accessory Box Installation Manual
(CCN: 80445083). Once connected, follow the procedure outlined below.
NOTE: During the le copy, the VX Box will not accept Logins. Any user connected will be logged out and the web
browser will display the message “SD Card Unreachable” when logins are attempted.
To initiate the le transfer, connect your PC to VX Box using a standard USB 2.0 Universal Serial Bus Cable A to B
25
Page 26

26
Upon connection, the following drive folder will appear on your PC.
NOTE: The drive designation will be dependent on your PC conguration.
Click the Name column to sort by name.
Scroll down the list of le names until you see the LOGDAY01.TXT
Select the les by clicking on the LOGDAY01.TXT le and then pressing SHIFT and the DOWN ARROW. This will
highlight the les to be copied.
Page 27

Now press CNTL C or right click and select COPY.
Paste the les into the directory of your choice on your PC.
After the copy and paste is complete, remove the USB cable from the VX Box. The VX box will be return to normal
operation.
To use the data for reports, you can use EXCEL or any other Database program to import and extract the data as
desired. All data is saved in comma separated variable (CSV) format which can easily be imported into Excel using the
import wizard.
The text le has data formatted in the following manner. In order to provide the proper header information for your
spreadsheet you will need to add the information to the rst row of your spreadsheet.
27
Page 28

28
*1 Please note that the Compressors Available data is in binary format where each digit represents a compressor
(compressor 1 being the right most digit). If a digit is 0 that means the compressor is available for the X8I or X12I to use.
If a digit is 1 that means the compressor is unavailable.
For example, 4 would be 100 in binary, where compressors 1 and 2 are available and compressor 3 is unavailable.
*2 Other compressor data marked with *2 is also binary, but if a digit is 1, that means the condition is true
(the compressor is loaded, running, alarmed, or in maintenance mode). If a digit is 0 the conditions is false (the
compressor is unloaded, not running, not alarmed, or not in maintenance mode.
It is recommended that the log les are archived periodically, at least once every 90 days in order to maintain a proper
historical archive.
Page 29

SECTION 7 EQUIPMENT OVERVIEW
100
Psig
Load Status
Run Status
System Control Status
Alarm
Alarm
7.1 Equipment Overview
The Equipment Overview screen (EOV) gives a summary of the operating conditions of all compressors, I/O boxes,
and Intelliow Valves in the compressed air system. Compressors are shown along the left side of the screen with their
user assigned name, load state, running state, system control state, and an alarm ag if the compressor is currently
in an alarm or trip condition. I/O boxes and Intelliow valves are shown on the right side of the screen with their user
assigned name and an alarm ag if the unit is in an alarm or trip condition. The EOV screen contains only view only
data.
The system pressure is displayed in the upper right corner using
the same units selected on the SOV screen.
Compressor Information is displayed as shown below. The compressor name is assigned by an administrator following
section 8.3.1 – compressor conguration:
I/O Box and Intelliow Information is displayed as shown below. The equipment name is assigned by an administrator
following section 8.4.1 I/O Box conguration:
29
Page 30

30
7.2 Compressor Detail View
The Compressor Detail View (CDV) screen shows relevant data about the selected compressor. The CDV contains view
only data with the exception of the manual controls. Manual controls are only usable by users with USER or ADMIN
rights.
Clicking the compressor icon next to the compressor address
on the Equipment Overview Screen will open that compressor’s
CDV screen.
The compressor name and address are shown at the top of the CDV screen.
7.2.1 Compressor Status
The compressor status box duplicates the status indicator lights shown on the SOV and EOV screens as well as
providing more detailed information about the compressor. The graphic represents the compression method of the
compressor, a picture of a pair of rotors for example, for a rotary screw compressor, or a piston for a reciprocating
compressor.
Page 31

The compressor status indicator shows the current state of the compressor as shown below, this is equivalent to the
Load Status
Motor Status
System Control Status
Load Percentage
Sequence Position
indicators on the SOV:
The model, manufacturer, and X8I/X12I interface type
are displayed as entered by the administrator during
system setup. Please see section 8.3 – Compressor
Conguration for further information on compressor
setup.
7.2.2 Compressor Nameplate Data
The nameplate data section shows the power consumption and output characteristics of the compressor. This
data is usually taken from the compressor specications and motor nameplate data. This data must be input by an
administrator and is used in calculating the system eciency as displayed on the System Overview screen. Care must
be taken to enter the correct information for accurate performance data.
Capacity is the volume of air ow from the compressor at its rated pressure. Capacity will be in the units selected by
the administrator.
Package Power is the power consumption of the compressor at full load at its rated pressure. Pressure units will again
be selected by the administrator. Power units are always in kW.
Unloaded Power is the power consumption of the compressor running in an unloaded state. Units are always kW.
VSD Minimum Capacity is the volume of air ow from a variable speed compressor when it is running at its minimum
load percentage. This value will always be 0 for a xed speed machine. Units will be selected by the administrator.
VSD Minimum Power is the power consumption of a variable speed compressor when it is running at its minimum
speed. The units are always kW.
Warning State will show a text description of the current alarm or trip aecting the compressor. This value will be
blank and the red alarm ag will disappear if there is no alarm. Please note that text descriptions are only available for
IntelliSys controlled compressors with IR-485 or IRV-485 interface types.
Managed Hours show how many hours the compressor has been running while under control of the X8I/X12I.
31
Page 32

32
7.2.3 User Congurable Compressor Data
112
146
0.7
2
180
82
Administrators can set up to six additional data points to be read from each compressor. These data points will be
displayed on the CDV screen with administrator dened titles and units. Data points may come from the compressor or
any I/O box connected to the system. Please see section 7.3.1.3 – Additional Date Items for information on setting up
these data points. These additional data points are only available for IntelliSys controlled compressors with IR-485 or
IRV-485 interface types.
7.2.4 Manual Start/Stop Control
The Manual Start/Stop control allows a user with User or Administrator rights to take the compressor out of X8I/X12I
control to start and stop the compressor remotely using the interface on the CDV screen. The Manual Control interface
will only appear for IntelliSys controlled compressors with IR-485 or IRV-485 interface types. The compressor’s local
controller must also be set to accept remote start/stop commands before Manual Control will function.
Manual Control is currently o when the button reads “On” and the
indicator light is grey.
Clicking the “On” button will place the compressor into service
maintenance mode and remove the compressor from X8I/X12I control.
The indicator light will turn blue to conrm that the compressor is in
service maintenance mode.
Clicking the “O” button will place the compressor back under X8I/X12I
control and return the Manual Control button to “On.”
If Manual Control is on the compressor can be started by pressing
the green start button. The indicator light above the start button will
turn blue to conrm the compressor has started. If Manual Control is
o the compressor will not respond to the manual start command but
the indicator lights will report the operating state of the compressor.
When Manual Control is on the compressor can also be stopped by
pressing the red stop button. The indicator light above the stop
button will turn blue to conrm that the compressor has stopped. If
Manual Control is o the compressor will not respond to the manual
stop command but the indicator light will report the operating state of
the compressor.
Click the exit button to exit the CDV screen and return to the EOV
screen.
Page 33

7.3 Equipment Detail View - I/O Box
99
The I/O Box Equipment Detail View (EDV) screen shows all data from the I/O box’s analog and digital inputs and
outputs. Please refer to the I/O box manual for detailed information about the I/O box’s functionality.
Clicking the I/O Box icon next to the desired I/O Box on the EOV screen
will open the EDV screen.
The system pressure is displayed in the upper right corner using
the units selected on the SOV screen.
The I/O box’s name is displayed next to its network address across the top of the EDV screen. An alarm state will cause
the red alarm ag to be displayed on the upper left part of the EDV screen.
Analog input information is displayed as congured by the
Administrator when setting up the I/O Box conguration.
Please see section 8.4.1 – I/O Box Conguration for information
about I/O Box Conguration. Labels and values shown here are
only Samples.
The alarm symbol will appear next to any analog input value
which is currently in an alarm condition. These alarm limits are
programmable at the I/O Box.
The output states of the I/O box’s six relay outputs are shown on
the EDV screen. A blue indicator means the relay is in its
energized state while a gray indicator means that the relay is in
its de-energized state.
33
Page 34

34
The input states of the I/O box’s eight digital inputs are shown. A
check mark indicates that the input is in its energized state while
an empty circle indicates that the input is in its de-energized
state.
The alarm symbol will appear next to any digital input value
which is currently in an alarm condition. Alarm conditions are
congured at the I/O box.
Click the exit button to exit the EDV screen and return to the EOV
screen.
7.4 Equipment Detail View - Intelliow
The Equipment Detail View (EDV) screen shows the current operating condition of any connected Intelliow valves.
Please refer to the Intelliow operator’s manual for more detailed information about the data. Visualization is only
compatible with Intelliow valves equipped with the IX controller (Mid-2009).
Clicking the Intelliow icon next to the desired Intelliow valve
on the EOV screen will open the EDV screen.
The system pressure is displayed in the upper right corner using
the units selected on the SOV screen.
Page 35

The Intelliow box’s name is displayed next to its network address across the top of the EDV screen. An alarm state will
Forward Flow Control
Backward Flow Control
Combination Flow Control
cause the red alarm ag to be displayed on the upper left part of the EDV screen.
P4 Outlet Pressure is the pressure read on the demand (process)
side of the Intelliow Valve.
P3 Inlet Pressure is the pressure read on the supply (compressor)
side of the Intelliow Valve.
% Open is the Intelliow Valve current position.
The selected control method is also shown, forward control,
backward control, or both, indicated by the indicator light turning
blue beside the current method.
Any current alarms will cause a red ag to appear. A text readout of
the alarm will appear next to the alarm ag.
The target pressure selection for the Intelliow valve is shown.
A check mark indicates that the selection is true while an empty
circle indicates that the input is false. The IX Intelliow has 4
programmable and selectable pressure sets.
Click the exit button to exit the EDV screen and return to the EOV
screen.
35
Page 36

36
SECTION 8 CONFIGURATION OVERVIEW
8.1 Conguration Overview
The Conguration Overview (COV) screen is only accessible by users with Administrator rights. The COV gives
administrators access to change the conguration of system parameters as well as access to account management and
diagnostic utilities.
8.2 X8I/X12I System Setup
The X8I/X12I System Setup allows the administrator to change the type of system controller, ow and eciency units,
and set up the user congurable data points that are displayed on the SOV screen.
Management Unit Model – Shows whether the visualization
system is connected to an X8I or X12I.
Flow Unit – Shows the units used in the eciency gauge on
the SOV for ow.
System Eciency Unit – Shows the units used in the
eciency gauge on the SOV for overall system eciency.
Page 37

8.2.1 System Conguration
Click on the icon representing the X8I/X12I to open the System
Setup conguration screen.
Installation Name – Name of the air system, this will be
shown on the title bar on all screens.
Management Model – Select X8I or X12I from the drop
down list according to your air system.
System Eciency Unit – Select the units of measure
to be used for the system eciency reading on the
SOV screen.
System Flow Unit – Select the units of measure to be
used for the system ow reading on the SOV screen.
Flow Data Source – The system ow reading may be
taken from calculated values using the name plate
data entered for the individual compressors or using
a ow meter assigned to either of the user
congurable data items.
37
Page 38
38
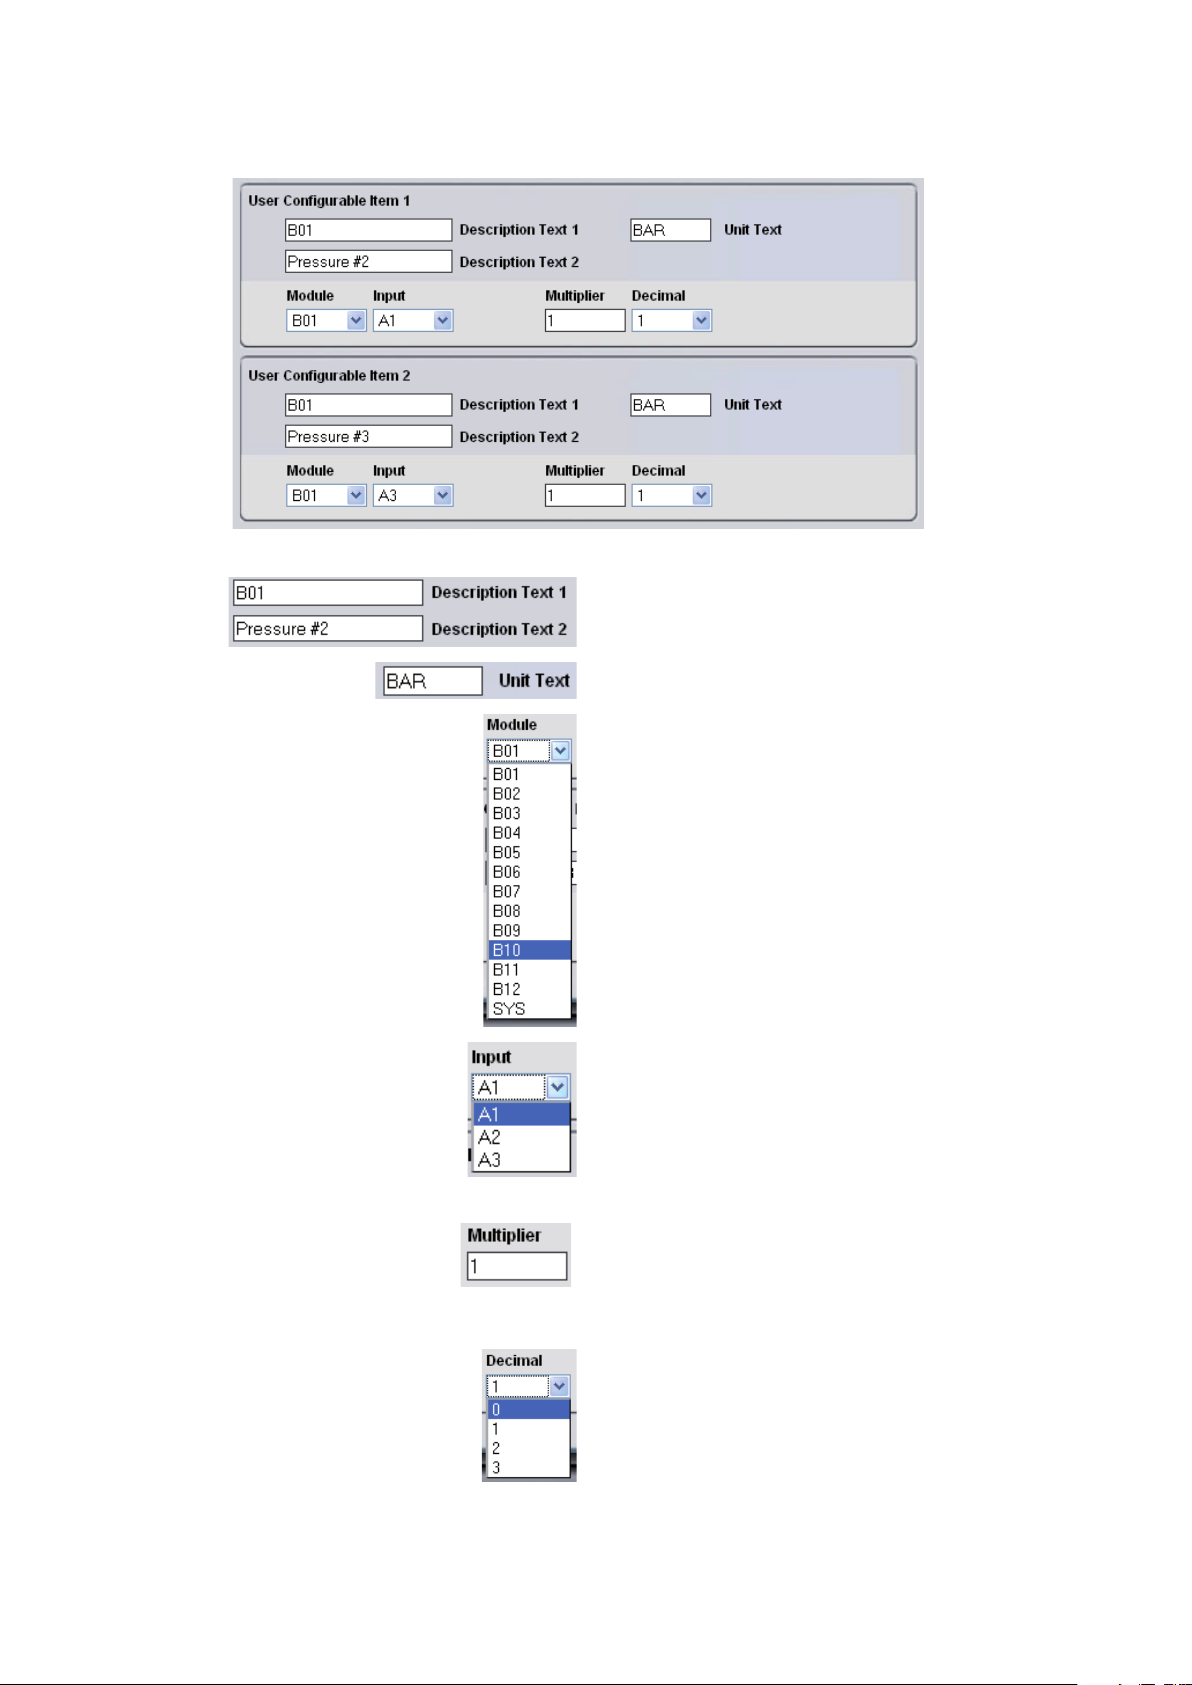
8.2.2 User Congurable Data Items
The administrator can select any two analog inputs in the system to be displayed on the SOV screen and to be archived
for graphing purposes. These analog inputs may be taken from I/O boxes or the system controller.
Description Text – Up to two lines of text can be used
per user congurable data item for ease of identifying
the data.
Unit Text – Type in the units of the analog input used.
Module – Select the module where the desired analog
input resides. Remember that B01 through B12 could
be either I/O boxes or Intelliow Valves. SYS represents
the X8I or X12I.
Input – Select the desired analog input of the I/O box or
X8I/X12I.
Multiplier – Some analog inputs may need to be
multiplied by a value to obtain the correct display value.
For example, if the reading is 100.3 but the analog input
is transmitted as 1003, the multiplier would be 0.1.
Decimal – Select the desired number of decimal places
you wish to display. For example 100.33 would be
displayed as 100 with 0 decimal selected, 100.3 with 1
decimal selected, 100.33 with 2 decimal selected, and
100.330 with 3 decimal selected.
Page 39

When you are nished viewing and/or changing the settings in the System Conguration screen:
Click the exit button to leave the conguration screen without
saving any changes. You will be returned to the COV.
Click the Save and Exit button to save your changes and return to
the COV.
8.3 Compressor Setup
The compressor setup area shows the compressor addresses and the interface type for all compressors.
C01 through C12 – Represents the compressor address of all
possible compressors in the system.
Interface Type – Represents the connection method of the
compressor to the X8I/X12I. This value will be a dash “-“ if the
compressor is not installed in the system.
8.3.1 Compressor Conguration
Click on the compressor icon next to the desired compressor to
open that compressor’s conguration screen.
Type in the name of the compressor for that will appear on the EOV
screen and the EDV screen for that compressor.
39
Page 40

40
8.3.1.1 Compressor Model Information
Type in the model name of the compressor, this is
usually taken from the compressor nameplate.
Type in the name of the compressor manufacturer.
Select the compressor’s compression method from
the dropdown menu. The picture representing the
compressor will change according to the selected
compressor type.
Selecting “---“indicates that no compressor is connected
at this position.
Select the compressor’s interface type. This should
be identical to the interface type used in the X8I/X12I
setup.
Please see the X8I/X12I operator’s manual for more
information.
Select the compressor’s controller type. This
information should be obtained from your compressor
service representative. The controller type will vary
depending on the interface type selected.
Page 41

8.3.1.2 Compressor Nameplate Data
Type in the compressor’s nameplate ow output.
Type in the compressor’s nameplate power
consumption at its rated pressure.
Type in the compressor’s nameplate power
consumption running unloaded.
Type in the minimum ow output of the compressor.
This will be zero for xed speed machines and
dependent on nameplate data for variable speed
machines.
Type in the compressor’s power consumption at
its minimum speed. This will be zero for xed speed
machines and dependent on nameplate data for
variable speed machines.
8.3.1.3 Additional Data Items
Up to six additional data items may be read from the compressor’s local controller to be displayed on the compressor’s
EDV screen. Please note that additional data items may only be congured for compressors with IR- 485 or IRV-485
data types. The administrator also must have a Modbus or Multi485 table to nd the addresses for any desired data
points. Please refer to the SMG manual for Modbus tables for many Ingersoll Rand compressors.
Type in the description for the data point and the
units of measure.
Select the module where the data resides from the
dropdown list. The data can come from the
compressor or from an I/O box installed on the
system.
41
Page 42

42
Select the communication protocol, usually Modbus
for local compressor controllers, and Multi485 for
X8I/X12I modules.
Refer to the System Modbus Gateway manual for
more information.
Type in the Modbus or Multi485 address (in decimal)
and select the proper data type for the controller. Refer
to the controller documentation for more information.
U16 will be the most common data type used.
U16 – Unsigned 16 bit integer
S16 – Signed 16 bit integer
U32 – Unsigned 32 bit integer
S32 – Signed 32 bit integer
HRS – Run Hours
Some analog inputs may need to be multiplied by a
value to obtain the correct display value. For example, if
the reading is 100.3 but the analog input is transmitted
as 1003, the multiplier would be 0.1.
Select the desired number of decimal places you wish
to display. For example 100.33 would be displayed
as 100 with 0 decimal selected, 100.3 with 1 decimal
selected, 100.33 with 2 decimal selected, and 100.330
with 3 decimal selected.
When you are nished viewing and/or changing the settings in the Compressor Conguration screen:
Click the exit button to leave the conguration screen
without saving any changes. You will be returned to the
COV.
Click the Save and Exit button to save your changes and
return to the COV.
The following Intellisys Controller Modbus Tables provide the most common compressor data values that can be
congured and monitored from the VX Box, up to six (6) for each compressor. The VX Box uses the Relative Address
Modbus format. The Register Addresses shown in each of these Tables has been converted and is the Relative Modbus
Address.
TABLE 1 SSR REDEYE CONTROLLER REGISTER STRUCTURE
Description Unit Module Type Address Data Multiplier Decimal
Discharge Pressure PSI C0x Modbus 2 U16 1 0
Sump Pressure PSI C0x Modbus 3 U16 1 0
Inlet Vacuum PSI C0x Modbus 4 U16 0.1 1
Coolant Temperature DEG C0x Modbus 5 U16 1 0
Airend Temperature DEG C0x Modbus 6 U16 1 0
Discharge Temperature DEG C0x Modbus 7 U16 1 0
Low Ambient Coolant Temp. DEG C0x Modbus 8 U16 1 0
“x” is the Compressor number being congured
Page 43

TABLE 2 SSR SG CONTROLLER REGISTER STRUCTURE
Description Unit Module Type Address Data Multiplier Decimal
Discharge Pressure PSI C0x Modbus 2 U16 1 0
Sump Pressure PSI C0x Modbus 3 U16 1 0
Inlet Vacuum PSI C0x Modbus 4 U16 0.1 1
Coolant Temperature DEG C0x Modbus 5 U16 1 0
Airend Temperature DEG C0x Modbus 6 U16 1 0
Discharge Temperature DEG C0x Modbus 9 U16 1 0
Low Ambient Coolant Temp. DEG C0x Modbus 11 U16 1 0
“x” is the Compressor number being congured
TABLE 3 SSR SE 15100HP CONTROLLER REGISTER STRUCTURE
Description Unit Module Type Address Data Multiplier Decimal
Discharge Pressure PSI C0x Modbus 2 U16 1 0
Sump Pressure PSI C0x Modbus 3 U16 1 0
Separator Pressure Drop PSI C0x Modbus 4 U16 1 0
Airend Temperature DEG C0x Modbus 5 U16 1 0
“x” is the Compressor number being congured
TABLE 4 SIERRA REDEYE 125200 HP CONTROLLER REGISTER STRUCTURE
Description Unit Module Type Address Data Multiplier Decimal
Discharge Pressure PSI C0x Modbus 2 U16 1 0
2nd Stage Inlet Pressure PSI C0x Modbus 3 U16 1 0
2nd Stage Discharge Pressure PSI C0x Modbus 4 U16 1 0
Inlet Vacuum PSI C0x Modbus 5 U16 1 0
Oil Filter In Pressure PSI C0x Modbus 6 U16 1 0
Bearing Oil Pressure PSI C0x Modbus 7 U16 1 0
1st Stage Discharge Temp. DEG C0x Modbus 8 U16 1 0
2nd Stage Inlet Temp. DEG C0x Modbus 9 U16 1 0
2nd Stage Discharge Temp. DEG C0x Modbus 10 U16 1 0
Bearing Oil Temp. DEG C0x Modbus 11 U16 1 0
Package Discharge Temp. DEG C0x Modbus 12 U16 1 0
“x” is the Compressor number being congured
TABLE 5 SIERRA SE 50100 HP CONTROLLER REGISTER STRUCTURE
Description Unit Module Type Address Data Multiplier Decimal
Discharge Pressure PSI C0x Modbus 2 U16 1 0
Package Discharge Temp. DEG C0x Modbus 3 U16 1 0
Bearing Oil Temp. DEG C0x Modbus 4 U16 1 0
2nd Stage Inlet Temp. DEG C0x Modbus 5 U16 1 0
2nd State Discharge Temp. DEG C0x Modbus 6 U16 1 0
1st Stage Discharge Temp. DEG C0x Modbus 7 U16 1 0
“x” is the Compressor number being congured
43
Page 44

44
TABLE 6 SIERRA SG 125400 HP CONTROLLER REGISTER STRUCTURE
Description Unit Module Type Address Data Multiplier Decimal
Discharge Pressure PSI C0x Modbus 2 U16 1 0
2nd Stage Inlet Pressure PSI C0x Modbus 3 U16 1 0
2nd Stage Discharge Pressure PSI C0x Modbus 4 U16 1 0
Inlet Vacuum PSI C0x Modbus 5 U16 1 0
Oil Filter In Pressure PSI C0x Modbus 6 U16 1 0
Bearing Oil Pressure PSI C0x Modbus 7 U16 1 0
1st Stage Discharge Temp. DEG C0x Modbus 8 U16 1 0
2nd Stage Inlet Temp. DEG C0x Modbus 9 U16 1 0
2nd Stage Discharge Temp. DEG C0x Modbus 10 U16 1 0
Bearing Oil Temp. DEG C0x Modbus 11 U16 1 0
Package Discharge Temp. DEG C0x Modbus 12 U16 1 0
“x” is the Compressor number being congured
TABLE 7 RECIP REDEYE CONTROLLER REGISTER STRUCTURE
Description Unit Module Type Address Data Multiplier Decimal
1st Stage Discharge Pressure PSI C0x Modbus 2 U16 1 0
Package Discharge Pressure PSI C0x Modbus 3 U16 1 0
Air Filter Pressure Drop PSI C0x Modbus 4 U16 1 0
Frame Oil Pressure PSI C0x Modbus 5 U16 1 0
Package Water In Pressure PSI C0x Modbus 6 U16 1 0
Package Water Out Pressure PSI C0x Modbus 7 U16 1 0
Pressure AA PSI C0x Modbus 8 U16 1 0
Pressure BB PSI C0x Modbus 9 U16 1 0
1st Stage Discharge Temp. DEG C0x Modbus 10 U16 1 0
2nd Stage Discharge Temp. DEG C0x Modbus 11 U16 1 0
Frame Oil Temperature DEG C0x Modbus 12 U16 1 0
Package Water In Temp. DEG C0x Modbus 13 U16 1 0
2nd Stage Air In Temp. DEG C0x Modbus 14 U16 1 0
1st Stage Water Out Temp. DEG C0x Modbus 15 U16 1 0
2nd Stage Water Out Temp. DEG C0x Modbus 16 U16 1 0
“x” is the Compressor number being congured
TABLE 8 RECIP SG CONTROLLER REGISTER STRUCTURE
Description Unit Module Type Address Data Multiplier Decimal
Oil Pressure PSI C0x Modbus 2 U16 1 0
Water In Pressure PSI C0x Modbus 3 U16 1 0
Water Out Pressure PSI C0x Modbus 4 U16 1 0
Package Discharge Pressure PSI C0x Modbus 5 U16 1 0
1st Stage Discharge Pressure PSI C0x Modbus 6 U16 1 0
2nd Stage Discharge Pressure PSI C0x Modbus 7 U16 1 0
Suction Pressure PSI C0x Modbus 8 U16 1 0
Inlet Vacuum PSI C0x Modbus 9 U16 1 0
Oil Temperature DEG C0x Modbus 10 U16 1 0
Water In Temperature DEG C0x Modbus 11 U16 1 0
2nd Stage Inlet Temperature DEG C0x Modbus 12 U16 1 0
Page 45

3rd Stage Inlet Temperature DEG C0x Modbus 13 U16 1 0
Package Discharge Temperature DEG C0x Modbus 14 U16 1 0
1st Stage Discharge Temperature DEG C0x Modbus 15 U16 1 0
2nd Stage Discharge Temperature DEG C0x Modbus 16 U16 1 0
DEG C0x Modbus 17 U16 1 0
“x” is the Compressor number being congured
TABLE 9 NIRVANA SGN CC CONTACT COOLED CONTROLLER REGISTER STRUCTURE
Description Unit Module Type Address Data Multiplier Decimal
Discharge Pressure PSI C0x Modbus 2 U16 1 0
Sump Pressure PSI C0x Modbus 3 U16 1 0
Dry Side Sump Pressure PSI C0x Modbus 4 U16 0.1 1
Coolant Temperature DEG C0x Modbus 10 U16 1 0
Airend Temperature DEG C0x Modbus 11 U16 1 0
Discharge Temperature DEG C0x Modbus 12 U16 1 0
Separator Pressure Drop DEG C0x Modbus 18 U16 1 0
“x” is the Compressor number being congured
TABLE 10 NIRVANA SGNE CC CONTACT COOLED CONTROLLER REGISTER STRUCTURE
Description Unit Module Type Address Data Multiplier Decimal
Discharge Pressure PSI C0x Modbus 2 U16 1 0
Sump Pressure PSI C0x Modbus 3 U16 1 0
Dry Side Sump Pressure PSI C0x Modbus 4 U16 1 0
Interstage Pressure PSI C0x Modbus 5 U16 1 0
Coolant Temperature DEG C0x Modbus 10 U16 1 0
Airend Temperature DEG C0x Modbus 11 U16 1 0
Discharge Temperature DEG C0x Modbus 12 U16 1 0
Inlet Temperature DEG C0x Modbus 13 U16 1 0
Cooler Out Temperature DEG C0x Modbus 14 U16 1 0
Separator Pressure Drop PSI C0x Modbus 18 U16 1 0
“x” is the Compressor number being congured
TABLE 11 NIRVANA SGNE OF OILFREE CONTROLLER REGISTER STRUCTURE
Description Unit Module Type Address Data Multiplier Decimal
Discharge Pressure PSI C0x Modbus 2 U16 1 0
2nd Stage Inlet Pressure PSI C0x Modbus 3 U16 1 0
2nd Stage Discharge Pressure PSI C0x Modbus 4 U16 1 0
Inlet Vacuum PSI C0x Modbus 5 U16 1 0
Oil Filter Pressure Drop PSI C0x Modbus 6 U16 1 0
Bearing Oil Pressure PSI C0x Modbus 7 U16 1 0
2nd Stage Inlet Temperature DEG C0x Modbus 8 U16 1 0
1st Stage Discharge Temperature DEG C0x Modbus 9 U16 1 0
2nd Stage Discharge Temperature DEG C0x Modbus 10 U16 1 0
Bearing Oil Temperature DEG C0x Modbus 11 U16 1 0
Discharge Temperature DEG C0x Modbus 12 U16 1 0
1st Stage Inlet Temperature DEG C0x Modbus 18 U16 1 0
“x” is the Compressor number being congured
45
Page 46

46
TABLE 12 NIRVANA 1530 KW 2040 HP DF CONTROLLER REGISTER STRUCTURE
Description Unit Module Type Address Data Multiplier Decimal
Discharge Pressure PSI C0x Modbus 2 U16 1 0
Aftercooler Discharge Pressure PSI C0x Modbus 3 U16 1 0
“x” is the Compressor number being congured
TABLE 13 SSR UP SE CONTROLLER REGISTER STRUCTURE
Description Unit Module Type Address Data Multiplier Decimal
Package Discharge Pressure PSI C0x Modbus 2 U16 1 0
Sump Pressure PSI C0x Modbus 3 U16 1 0
Airend Temperature DEG C0x Modbus 4 U16 1 0
Separator Pressure Drop PSI C0x Modbus 5 U16 1 0
“x” is the Compressor number being congured
TABLE 14 ESA SE 22 150 KW CONTROLLER REGISTER STRUCTURE
Description Unit Module Type Address Data Multiplier Decimal
Package Discharge Pressure PSI C0x Modbus 2 U16 1 0
Sump Pressure PSI C0x Modbus 3 U16 1 0
Airend Temperature DEG C0x Modbus 4 U16 1 0
Separator Pressure Drop PSI C0x Modbus 5 U16 1 0
“x” is the Compressor number being congured
TABLE 15 RSERIES S3 CONTROLLER REGISTER STRUCTURE
Description Unit Module Type Address Data Multiplier Decimal
Package Discharge Pressure PSI C0x Modbus 2 U16 1 0
Sump Pressure PSI C0x Modbus 3 U16 1 0
Airend Temperature DEG C0x Modbus 6 U16 1 0
Separator Pressure Drop PSI C0x Modbus 9 U16 1 0
“x” is the Compressor number being congured
8.4 I/O Box and Intelliow Setup
The I/O Box and Intelliow Setup area shows the network address and whether an I/O Box or Intelliow Valve is
connected at that address.
B01 through B12 - Represents the address of the I/O box or
Intelliow Valve.
Equipment Type – Intelliow for an Intelliow valve, or I/O
for an I/O Box.
8.4.1 I/O Box and Intelliow IX Conguration
The I/O Box conguration screen is set independently of the I/O Box local conguration but in almost all cases should
be congured identically. Please note that for Intelliow IX congurations only the title and module type need be set.
Page 47

8.4.1.1 Analog Input Conguration
Type in a name so that the I/O Box can be easily
identied.
Select whether the unit is an I/O Box or an Intelliow
Valve from the dropdown menu.
Type in the description for the analog input and type
in the units of measure.
Some analog inputs may need to be multiplied by a
value to obtain the correct display value. For
example, if the reading is 100.3 but the analog input is
transmitted as 1003, the multiplier would be 0.1.
Select the desired number of decimal places you
wish to display. For example 100.33 would be
displayed as 100 with 0 decimal selected, 100.3 with
1 decimal selected, 100.33 with 2 decimal selected,
and 100.330 with 3 decimal selected.
47
Page 48

48
8.4.1.2 Relay Output Conguration
8.4.1.3 Digital Input Conguration
Type in the description of the relay output.
Type in the description of the digital output.
When you are nished viewing and/or changing the settings in the I/O Box Conguration screen:
Click the exit button to leave the conguration screen
without saving any changes. You will be returned to the
COV.
Click the Save and Exit button to save your changes and
return to the COV.
8.5 Account Management
The administrator can create any number of users desired and assign each user one of three levels of access, as well as
assigning email notications to various events that may occur.
Click the account management button on the COV to
open the Account Management utility.
Page 49

`
The list of accounts that currently exist are listed by user
name and access rights. Clicking on an account will
highlight that account in red and display its attributes.
The attributes will be displayed on the right side of the
account management utility.
49
Page 50

50
To modify an account create a new user, start with any account highlighted in red:
Type in a unique user name (new account only).
Type in a password.
Select the access rights from the drop down menu.
Access rights are as follows:
VIEW – The user is able to view all information on the SOV and EOV screens and their detail view screens. The
1.
user is unable to change any setpoints or access the COV screen.
USER – The user has all rights available to the VIEW access level as well as being able to change setpoints on the
2.
table conguration screens, pressure schedule screens, and is able to manually start and stop compressors, as
well as start and stop the X8I/X12I.
ADMIN – The user has all rights of the VIEW, and USER access levels as well as full access to the COV screen, the
3.
account management utility, and the diagnostics screen.
Please note that there can only be ve users logged into the system at one time, and only one administrator logged in
at one time.
Type in the description of the digital output.
Set the email lter settings for the user. The lter will
set which, if any, events will dispatch an email to the
user. Checking an event will cause that event to send an
email. Multiple users may receive emails for any or all
events.
The events lter will determine which types of events will generate an email to the user.
Send an email if the VX box reports a warning or if
communications are interrupted to the VX box.
Send an email if the system controller reports a warning
(Alarm) or shutdown (Trip) condition.
Send an email if a selected compressor reports a
warning (Alarm), shutdown (Trip), or service due
condition as set up using the service reminder utility.
Send an email if a selected I/O Box or Intelliow Valve
reports an alarm or trip condition as congured at the
I/O Box or Intelliow Valve.
Page 51

After selecting which events will generate an email the administrator selects which piece of equipment the user will
receive emails about using the modules lter.
The user will only receive emails about compressors
which are checked in the modules lter.
The user will only receive emails about I/O Boxes and
Intelliow valves which are checked in the modules
lter.
Once you have nished updating all of the elds:
Click the add button to update the information. New
accounts will appear in the list, and modied accounts
will now have their settings saved.
To remove an account:
When you are nished viewing and/or changing the settings in the Account Management screen:
Click the remove button, the account will no longer
appear in the account list. Be sure that the account you
intend to remove is highlighted. Otherwise, the rst
account in the list will be deleted.
Click the exit button to leave the account management
screen. You will be returned to the COV. Since all
information is saved using the add button there is no
save and exit button.
8.6 Diagnostics
The Diagnostics page allows the administrator to view the Ethernet conguration of the VX box, which users are
currently logged in, serial communications information, and VX box software information.
Click on the diagnostics button to open the diagnostics
utility.
51
Page 52

52
8.6.1 Serial Communications Diagnostics
The serial communications diagnostics shows the trac on the RS-485 network, between the compressors, the X8I/
X12I, and the VX box.
Requests:
Stack – Number of communication requests that are
waiting to be sent on the RS-485 network.
Time – The estimated time required to process all
communication requests currently on the stack.
Communications:
Valid – The number of valid communications over the
past minute.
Error – The number of invalid or rejected
communications over the past minute
Broadcasts Received – The number of valid broadcast
messages received from the unit over the past minute.
The number of expected broadcasts per minute is 30 for
the X8I/X12I, 6+ for each compressor, and 6+ for each
I/O Box or Intelliow Valve.
If a failed communication attempt occurs, the broadcasts received eld will turn red until the communication issue is
resolved.
Page 53
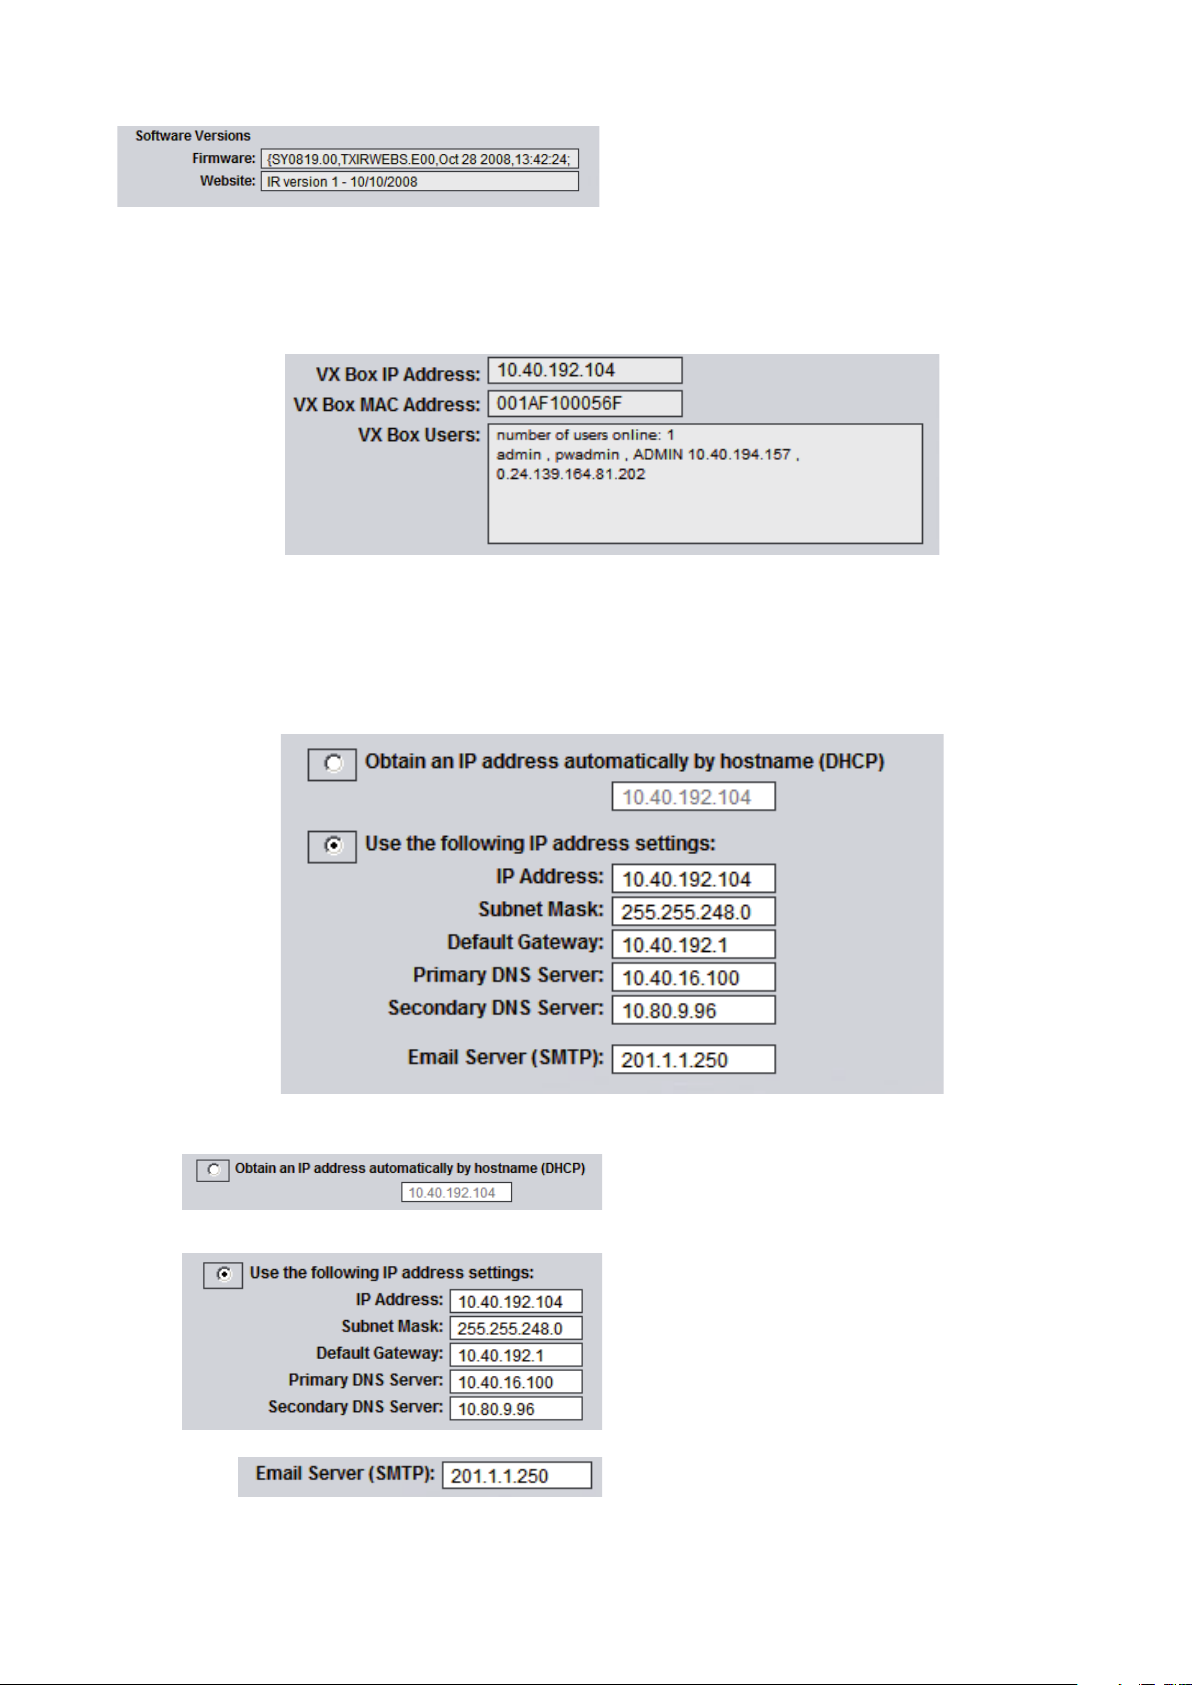
8.6.2 Software Versions
The Firmware represents the embedded software in
the VX Box while the website version represents the
currently loaded graphics. These should be referenced
when troubleshooting any issues.
8.6.3 VX Box Connectivity
The current network information for the VX box is displayed, including the current IP address, the MAC address
(hardware address) of the VX box, and a log of all users who are currently logged into the visualization software. This
information is view only.
8.6.4 Ethernet Conguration
Caution! Changing the Ethernet conguration of the VX box may cause the visualization software to become
unresponsive and require IT or other support to return the VX box to an operational condition. Be certain all Ethernet
settings are correct before saving changes.
The Ethernet conguration allows the user to select how the VX box will be connected to the LAN.
If the VX box is to obtain an IP address via DHCP, click
this radio button. The assigned IP address will appear
below this selection. Please note that depending on the
LAN architecture, not all users will be able to view the
visualization software from their PC.
If the VX box has a static IP address assigned by the IT
department, this radio button should be clicked and the
appropriate network settings should be typed in. These
settings are to be obtained from the IT department for
installation and commissioning.
If email notications are to be used, the SMTP server
address must be obtained from IT and entered in this
location.
53
Page 54

54
When you are nished viewing and/or changing the settings in the Diagnostics screen:
Click the exit button to leave the conguration screen
without saving any changes. You will be returned to the
COV.
Click the Save and Exit button to save your changes and
return to the COV.
Please note that if you change the Ethernet conguration you will need to power cycle the VX box before these
changes will take eect.
8.7 VX Options Screen
The VX Options screen allows the ADMIN to change the scaling of the graphing utility as well as manage the time, date,
and language settings for the VX Box.
Click the VX Box Options button to open the options
screen.
8.7.1 Graph Scaling – Dened Variables
Certain variables available for trending in the graphing utility have customizable scaling parameters. Six of these
variables are pre-congured, but may need to be adjusted depending on system setup.
Page 55

The variable name is in the far left column and is
identical to variable names in the graphing utility.
Units are based on system setup except for Dewpoint,
which is selectable via the dropdown menu.
Set the minimum and maximum y-axis values by typing
them in.
8.7.2 Graph Scaling – Selectable Variables
The visualization software also provides 10 variables that can be selected by the ADMIN for trending. The selected
variables will have 90 days worth of data stored on the VX box and can be graphed just like any of the predened
variables. All selectable variables have user dened scaling.
Select the desired equipment where the data resides.
A compressor, I/O Box, or Intelliow Valve is a valid
selection.
Select the desired input on the equipment. Any user
dened input is available for a compressor, and any
analog input is available for an I/O Box.
Type in the desired variable name.
Type in the units for the variable.
Type in the minimum and maximum values for the
y-axis.
8.7.3 Language
Select the language for the Visualization software from the dropdown menu.
8.7.4 Date and Time
The current date and time for your PC and the VX box
are displayed.
Click the synchronize button to update the VX box time
and date to match that of your PC.
55
Page 56

LOOK WHAT INGERSOLL RAND CAN DO FOR YOU!
Ecient Field Service
We maintain a highly trained sta of technicians
to service your equipment for preventive
maintenance, or to assist you should emergencies
ever occur.
Complete Repair Service
Our trained technicians will repair or overhaul
your equipment to factory specications,
using only genuine Ingersoll Rand parts.
Special Engineering Service
We can help you identify and solve your problems
by evaluating your needs and recommending
theproper equipment to give your maximum
eciency.
Spare Parts
By stocking genuine Ingersoll Rand spare
parts, we can help you avoid costly delays
or substituting inferior parts. Using genuine
Ingersoll Rand parts on you Ingersoll
Rand equipment will help to keep even
older equipment running in good-as-new
Complete Stock of Equipment
We carry a complete line of Ingersoll Rand
equipment and accessories designed to meet
any compressed air application. We are backed
by Ingersoll Rand’s prompt factory shipment to
ensure you on-time delivery.
condition.
A SUBSTITUTE IS NOT A REPLACEMENT!
Ensure you get peak performance and longevity out of your Ingersoll Rand product by insisting on genuine Ingersoll
Rand replacement parts and maintenance kits. Not only are the replacement parts made to precise dimensions and OEM-
specied metallurgy, but each part is backed by the Ingersoll Rand warranty. Your local Customer Center, Distributor, or
direct Ingersoll Rand salesperson will work with your to ensure you get the parts you need to do the job right. Equip your
machines with only the best Ingersoll Rand genuine parts.
NOTE: THE USE OF REPAIR PARTS OTHER THAN THOSE INCLUDED WITHIN THE INGERSOLL RAND COMPANY
APPROVED PARTS LIST MAY CREATE UNSAFE CONDITIONS OR MECHANICAL FAILURES OVER WHICH INGERSOLL
RAND COMPANY HAS NO CONTROL. INGERSOLL RAND COMPANY SHALL BEAR NO RESPONSIBILITY FOR
EQUIPMENT ON WHICH NON-APPROVED REPAIR PARTS ARE INSTALLED.
The manufacturer reserves the right to make changes or add improvements without notice and without incurring any
obligation to make such changes to products previously sold.
 Loading...