

Humminbird LEGEND 2005 DEEP, LEGEND 2005, LEGEND 2000 DEEP User Manual

Operations Manual
Operational instructions for Humminbird Legend 2000 Series
including the Legend –2000, 2005, 2000 Deep and 2005 Deep
www.reelschematic.com
www.reelschematic.com
Thank you for choosing Humminbird®, America's#1 name in fishfinders. Humminbird has
built its reputation by designing and manufacturing top-quality, thoroughly reliable marine
equipment. Your Humminbird is designed for trouble-free use in even the harshest marine
environment. In the unlikely event that your Humminbird does require repairs, we offer an
exclusive Service Policy - free of charge during the first year after purchase, and available
at a reasonable rate after the one-year period. For complete details, see the warranty
included in with your unit. We encourage you to read this operation manual carefully in
order to get full benefit from all the features and applications of your Humminbird product.
Contact our Customer Resource Center at either 334-687-0503 or www.humminbird.com.
WARNING! This device should not be used as a navigational aid to prevent collision,
grounding, boat damage, or personal injury. When the boat is moving, water depth may
change too quickly to allow time for you to react. Always operate the boat at very slow
speeds if you suspect shallow water or submerged objects.
Legend™, Humminbird®, WhiteLine®, RTS®, Fish ID+™, Structure ID®,
TrueArch™, are trademarked by or registered trademarks of
Techsonic Industries, Inc.
© 2003. All rights reserved.
THANK YOU
WARNING:
Disassembly and repair of this electronic unit should only be performed by authorized service personnel.Any modification of the serial
number or attempt to repair the original equipment or accessories by unauthorized individuals will void the warranty. Handling and/or opening this
unit may result in exposure to lead, in the form of solder.
WARNING:This product contains lead,a chemical known to the State of California to cause cancer and birth defects and other
reproductive harm.
www.reelschematic.com
www.reelschematic.com
Section 1: USING The Legend 2000 Series . . . . . . . . . . . . . . . . . . . . . . . . . 2
Performance . . . . . . . . . . . . . . . . . . . . . . . . . . . . . . . . . . . . . . . . . . . . 2
Deep Models Additional Performance . . . . . . . . . . . . . . . . . . . . . . . . . . 2
Powering Up the Unit. . . . . . . . . . . . . . . . . . . . . . . . . . . . . . . . . . . . . . 2
Simulator and Feature Memory . . . . . . . . . . . . . . . . . . . . . . . . . . . . . . 2
User Interface . . . . . . . . . . . . . . . . . . . . . . . . . . . . . . . . . . . . . . . . . . . 3
Knobs. . . . . . . . . . . . . . . . . . . . . . . . . . . . . . . . . . . . . . . . . . . . . . 3
LCD Display . . . . . . . . . . . . . . . . . . . . . . . . . . . . . . . . . . . . . . . . . 3
Real Time Sonar Window . . . . . . . . . . . . . . . . . . . . . . . . . . . . 3
Chart Window. . . . . . . . . . . . . . . . . . . . . . . . . . . . . . . . . . . . . 4
Control Panels. . . . . . . . . . . . . . . . . . . . . . . . . . . . . . . . . . . . . . . . . . . 6
Mode . . . . . . . . . . . . . . . . . . . . . . . . . . . . . . . . . . . . . . . . . . . . . . 6
Automatic Mode. . . . . . . . . . . . . . . . . . . . . . . . . . . . . . . . . . . 7
Bottom Lock Zoom Mode . . . . . . . . . . . . . . . . . . . . . . . . . . . . 8
Manual Mode. . . . . . . . . . . . . . . . . . . . . . . . . . . . . . . . . . . . . 8
Chart Speed . . . . . . . . . . . . . . . . . . . . . . . . . . . . . . . . . . . . . . . . . 9
Sonar View . . . . . . . . . . . . . . . . . . . . . . . . . . . . . . . . . . . . . . . . . . 9
Light . . . . . . . . . . . . . . . . . . . . . . . . . . . . . . . . . . . . . . . . . . . . . . 9
Contrast . . . . . . . . . . . . . . . . . . . . . . . . . . . . . . . . . . . . . . . . . . . . 9
RTS Window. . . . . . . . . . . . . . . . . . . . . . . . . . . . . . . . . . . . . . . . . 9
Surface Clutter . . . . . . . . . . . . . . . . . . . . . . . . . . . . . . . . . . . . . . 10
White Line . . . . . . . . . . . . . . . . . . . . . . . . . . . . . . . . . . . . . . . . . 10
Filter . . . . . . . . . . . . . . . . . . . . . . . . . . . . . . . . . . . . . . . . . . . . . 10
Depth Alarm . . . . . . . . . . . . . . . . . . . . . . . . . . . . . . . . . . . . . . . . 10
Temp Alarm . . . . . . . . . . . . . . . . . . . . . . . . . . . . . . . . . . . . . . . . 11
Fish Alarm . . . . . . . . . . . . . . . . . . . . . . . . . . . . . . . . . . . . . . . . . 11
Fish Sensitivity . . . . . . . . . . . . . . . . . . . . . . . . . . . . . . . . . . . . . . 11
Fish ID . . . . . . . . . . . . . . . . . . . . . . . . . . . . . . . . . . . . . . . . . . . . 11
Simulator . . . . . . . . . . . . . . . . . . . . . . . . . . . . . . . . . . . . . . . . . . 11
Units . . . . . . . . . . . . . . . . . . . . . . . . . . . . . . . . . . . . . . . . . . . . . 11
Language . . . . . . . . . . . . . . . . . . . . . . . . . . . . . . . . . . . . . . . . . . 11
Section 2: MAINTENANCE And Warranty . . . . . . . . . . . . . . . . . . . . . . . . . . 12
Maintenance . . . . . . . . . . . . . . . . . . . . . . . . . . . . . . . . . . . . . . . . . . . 12
Troubleshooting. . . . . . . . . . . . . . . . . . . . . . . . . . . . . . . . . . . . . . . . . 13
Warranty. . . . . . . . . . . . . . . . . . . . . . . . . . . . . . . . . . . . . . . . . . . . . . 14
Service Policy . . . . . . . . . . . . . . . . . . . . . . . . . . . . . . . . . . . . . . . . . . 15
Customer Support . . . . . . . . . . . . . . . . . . . . . . . . . . . . . . . . . . . . . . . 15
Section 3: SPECIFICATIONS
Legend 2000/2005 Specifications . . . . . . . . . . . . . . . . . . . . . . . . . . . 16
Legend
2000 Deep/2005 Deep
Specifications . . . . . . . . . . . . . . . . . . . . 16
Legend 2005/2005 Deep Specifications (International Models) . . . . . . 16
TABLE OF CONTENTS
www.reelschematic.com
www.reelschematic.com
2
USING THE LEGEND 2000 SERIES
Performance
The
LEGEND 2000 SERIES
represents a new way of thinking about fishing
electronics. It combines state-of-the-art electronics with the detail of a
traditional sonar paper chart recorder to create the fishfinder of the future.
Minimal, easy-to-understand knob controls provide access to the most
important features. The L
EGEND
2000 S
ERIES
eliminates confusion created by
too many buttons and menus. High technology, high performance, with “back
to basics” operation makes the L
EGEND
2000 S
ERIES
the ideal choice of the
serious angler.
The L
EGEND
2000 S
ERIES
uses sonar to locate and define underwater objects.
Sonar technology is based on sound waves sent into the water in a controlled
“beam” from the transducer. Objects within this beam reflect the sonar signal
back. The L
EGEND
2000 S
ERIES
very accurately measures the distance to these
objects based on the time it takes for the sonar to return. Each object (bottom,
fish or structure) reflects the sonar uniquely, providing information about its
makeup. The L
EGEND
2000 S
ERIES
draws this returned information on the
display.
The L
EGEND
2000 S
ERIES
operates in a wide variety of water conditions, from 2'
to 600' (2000' for the Legend 2000 Deep and 2005 Deep Models). Actual depth
capability depends on many factors such as bottom hardness, water conditions,
and transducer installation. All sonar units typically read to deeper depths in
fresh water than in salt water.
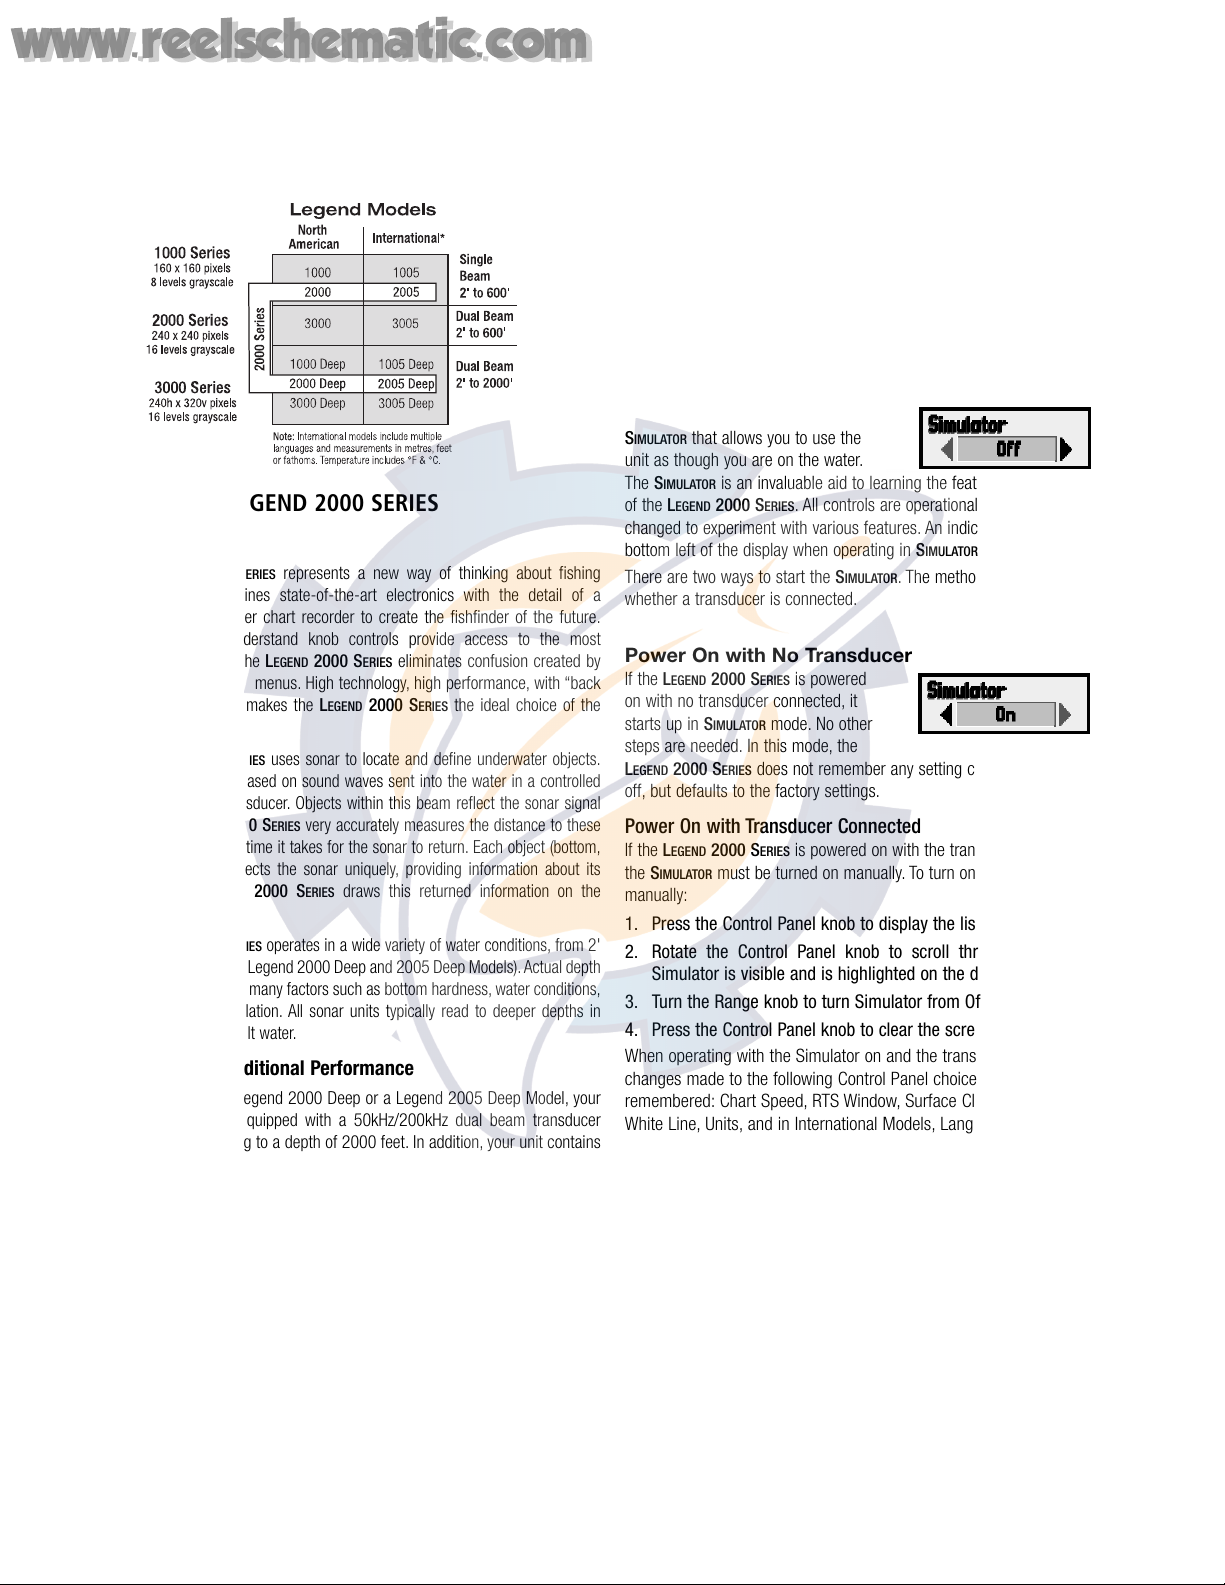
Deep Models Additional Performance
If you purchased a Legend 2000 Deep or a Legend 2005 Deep Model, your
Legend product is equipped with a 50kHz/200kHz dual beam transducer
capable of performing to a depth of 2000 feet. In addition, your unit contains
several extra features that will enhance its sonar performance in deep water.
S
ONAR VIEW allows you to display the sonar information from either beam or
both beams simultaneously. F
ILTER control allows the filtering algorithms to be
turned off to show the greatest amount of sonar information. F
ISH ALARM, FISH
SENSITIVITY, and FISH ID provide advanced signal processing to identify fish
and show their depth and relative size from either beam.
Powering Up the Unit
After installation, turn the LEGEND 2000 SERIES on by momentarily pressing the
G
AIN knob. An audible chirp sounds as the unit turns on. If the unit detects
that the transducer is connected and is in water, the L
EGEND 2000 SERIES
begins to show sonar information on the display. If the transducer is not
detected, the unit starts up in S
IMULATOR mode.
To power the unit off at any time, press and hold the G
AIN knob for several
seconds until the unit turns off.
Simulator and Feature Memory
The LEGEND 2000 SERIES contains a
SIMULATOR that allows you to use the
unit as though you are on the water.
The
SIMULATOR is an invaluable aid to learning the features and functions
of the
LEGEND 2000 SERIES. All controls are operational and settings can be
changed to experiment with various features. An indicator appears at the
bottom left of the display when operating in
SIMULATOR mode.
There are two ways to start the
SIMULATOR.The method to use depends on
whether a transducer is connected.
Power On with No Transducer
If the LEGEND 2000 SERIES is powered
on with no transducer connected, it
starts up in
SIMULATOR mode. No other
steps are needed. In this mode, the
LEGEND 2000 SERIES does not remember any setting changes after power
off, but defaults to the factory settings.
Power On with Transducer Connected
If the LEGEND 2000 SERIES is powered on with the transducer connected,
the
SIMULATOR must be turned on manually. To turn on the SIMULATOR
manually:
1. Press the Control Panel knob to display the list of options.
2. Rotate the Control Panel knob to scroll through the list until
Simulator is visible and is highlighted on the display.
3. Turn the Range knob to turn Simulator from Off to On.
4. Press the Control Panel knob to clear the screen.
When operating with the Simulator on and the transducer connected,
changes made to the following Control Panel choices are permanently
remembered: Chart Speed, RTS Window, Surface Clutter, Contrast,
White Line, Units, and in International Models, Language.
USING THE LEGEND 2000 SERIES
PERFORMANCE / SIMULATOR / POWERING UP THE UNIT
www.reelschematic.com
www.reelschematic.com
3
USER INTERFACE
The LEGEND 2000 SERIES User Interface is
made up of the following components:
knobs and the LCD Display, which in
turn is made up of the RTS (Real Time
Sonar™) and the Chart Windows.
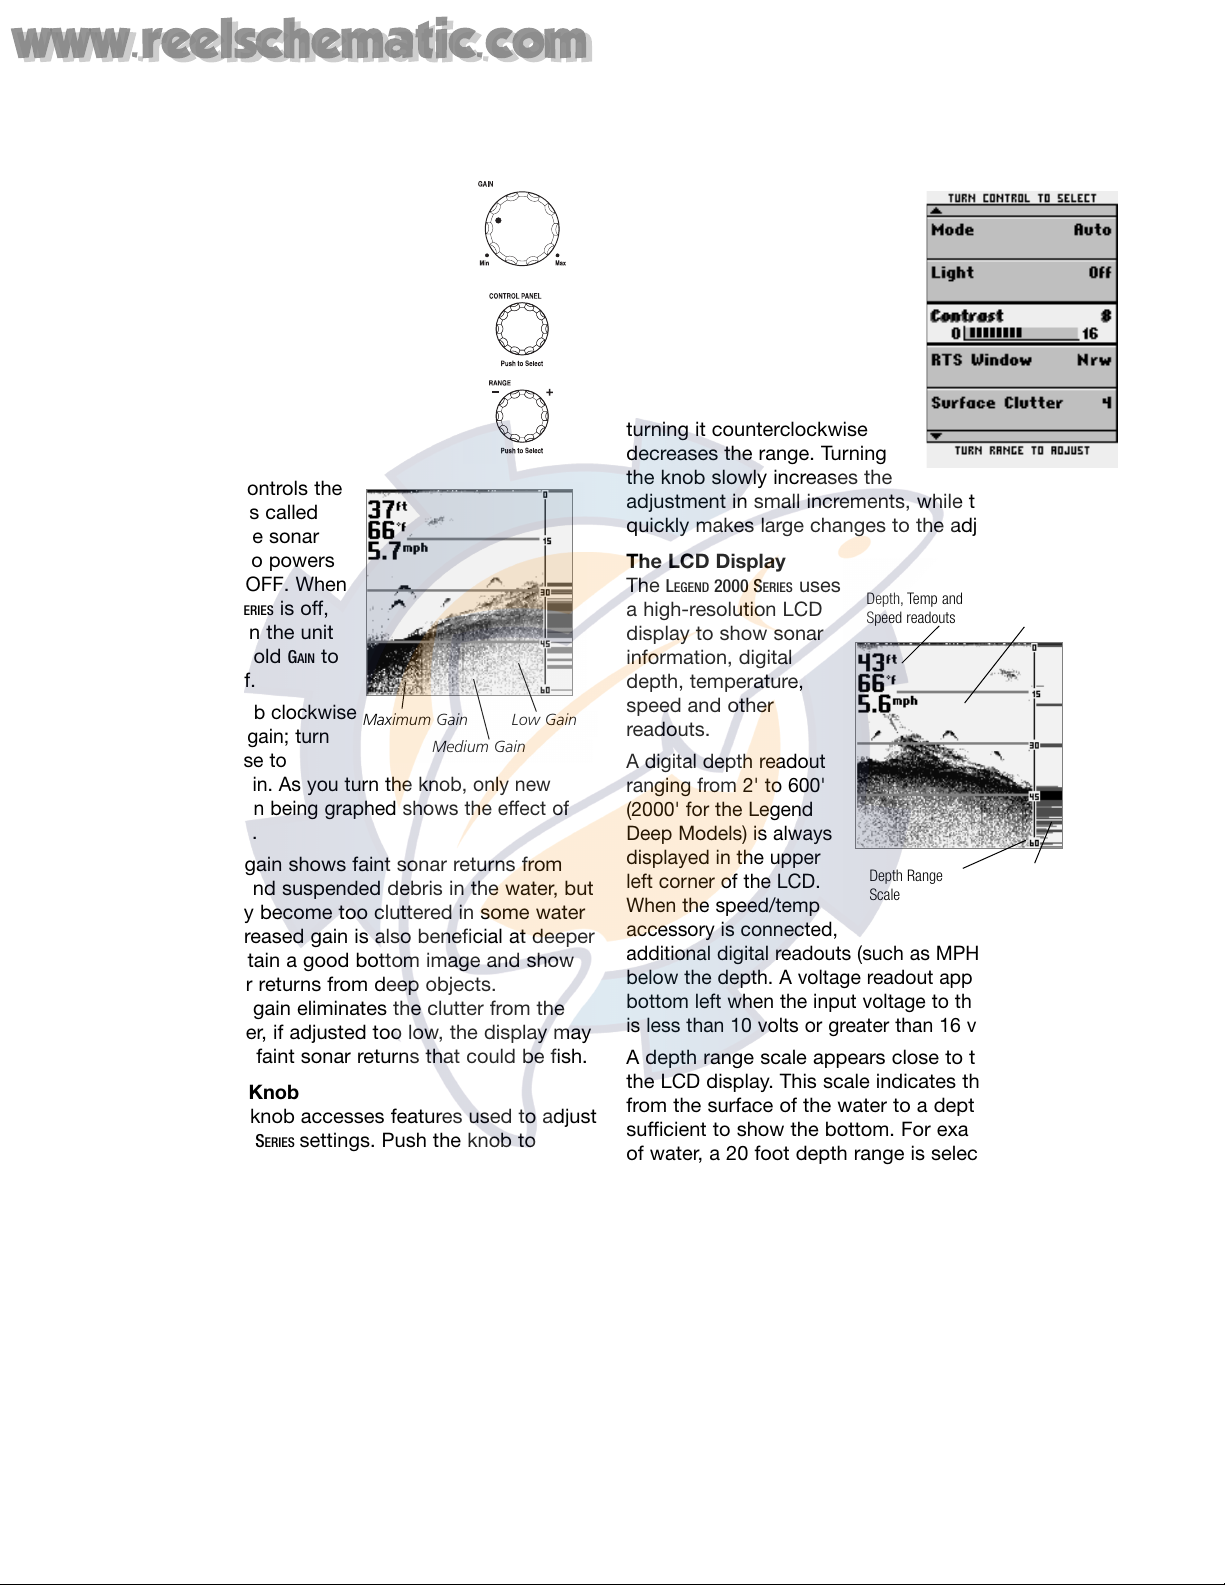
Knobs
Three knobs on the LEGEND 2000 SERIES
control all user settings: GAIN, CONTROL
PANEL and RANGE.
Gain Knob
The GAIN knob controls the
gain (sometimes called
sensitivity) of the sonar
receiver. GAIN also powers
the unit ON or OFF. When
the LEGEND 2000 SERIES is off,
press GAIN to turn the unit
on. Press and hold GAIN to
turn the unit off.
Turn the G
AIN
knob clockwise
to increase the gain; turn
counterclockwise to
decrease the gain. As you turn the knob, only new
sonar information being graphed shows the effect of
the gain change.
Increasing the gain shows faint sonar returns from
small bait fish and suspended debris in the water, but
the display may become too cluttered in some water
conditions. Increased gain is also beneficial at deeper
depths to maintain a good bottom image and show
adequate sonar returns from deep objects.
Decreasing the gain eliminates the clutter from the
display; however, if adjusted too low, the display may
not show many faint sonar returns that could be fish.
Control Panel Knob
The CONTROL PANEL knob accesses features used to adjust
some LEGEND 2000 SERIES settings. Push the knob to
display the CONTROL PANEL list, then rotate the knob to
select a feature for adjustment. A light colored
background indicates the selected feature. Turn the
RANGE knob to adjust the selected feature. Remove the
CONTROL PANEL list from the display by pushing the CONTROL
PANEL knob again. If no adjustments are made after a
few seconds, the
CONTROL PANEL list is removed
automatically.
Range Knob
The
RANGE knob adjusts the
depth ranges used on the
display. The RANGE knob has
slightly different capabilities in
each mode of operation. See
MODES OF OPERATION for specific
information. In all modes,
turning the knob clockwise
increases the range, while
turning it counterclockwise
decreases the range. Turning
the knob slowly increases the
adjustment in small increments, while turning it
quickly makes large changes to the adjustment.
The LCD Display
The LEGEND 2000 SERIES uses
a high-resolution LCD
display to show sonar
information, digital
depth, temperature,
speed and other
readouts.
A digital depth readout
ranging from 2' to 600'
(2000' for the Legend
Deep Models) is always
displayed in the upper
left corner of the LCD.
When the speed/temp
accessory is connected,
additional digital readouts (such as MPH) are shown
below the depth. A voltage readout appears in the
bottom left when the input voltage to the
LEGEND 2000 SERIES
is less than 10 volts or greater than 16 volts.
A depth range scale appears close to the right side of
the LCD display. This scale indicates the distance
from the surface of the water to a depth range
sufficient to show the bottom. For example, in 18 feet
of water, a 20 foot depth range is selected. The depth
range scale can be controlled automatically or
manually depending on the mode of operation. In
AUTOMATIC and BTM LOCK (BOTTOM LOCK) modes, the LEGEND 2000
S
ERIES selects the depth range. In MANUAL mode, the
depth range is selected by the user.
Push ON / OFF
Maximum Gain Low Gain
Medium Gain
Depth Range
Scale
Depth, Temp and
Speed readouts
Real TIme Sonar™
Window
Chart
Window
USING THE LEGEND 2000 SERIES
USER INTERFACE / KNOBS / LCD DISPLAY
www.reelschematic.com
www.reelschematic.com
The sonar returns received by the LEGEND 2000 SERIES are
displayed along the depth range scale in a REAL TIME
SONAR™ (RTS) WINDOW and CHART WINDOW. The RTS WINDOW
displays new sonar information within the transducer
cone in an expanded, easy-to-see format; the CHART
WINDOW logs old RTS WINDOW information to show a contour
view of the bottom and structure.
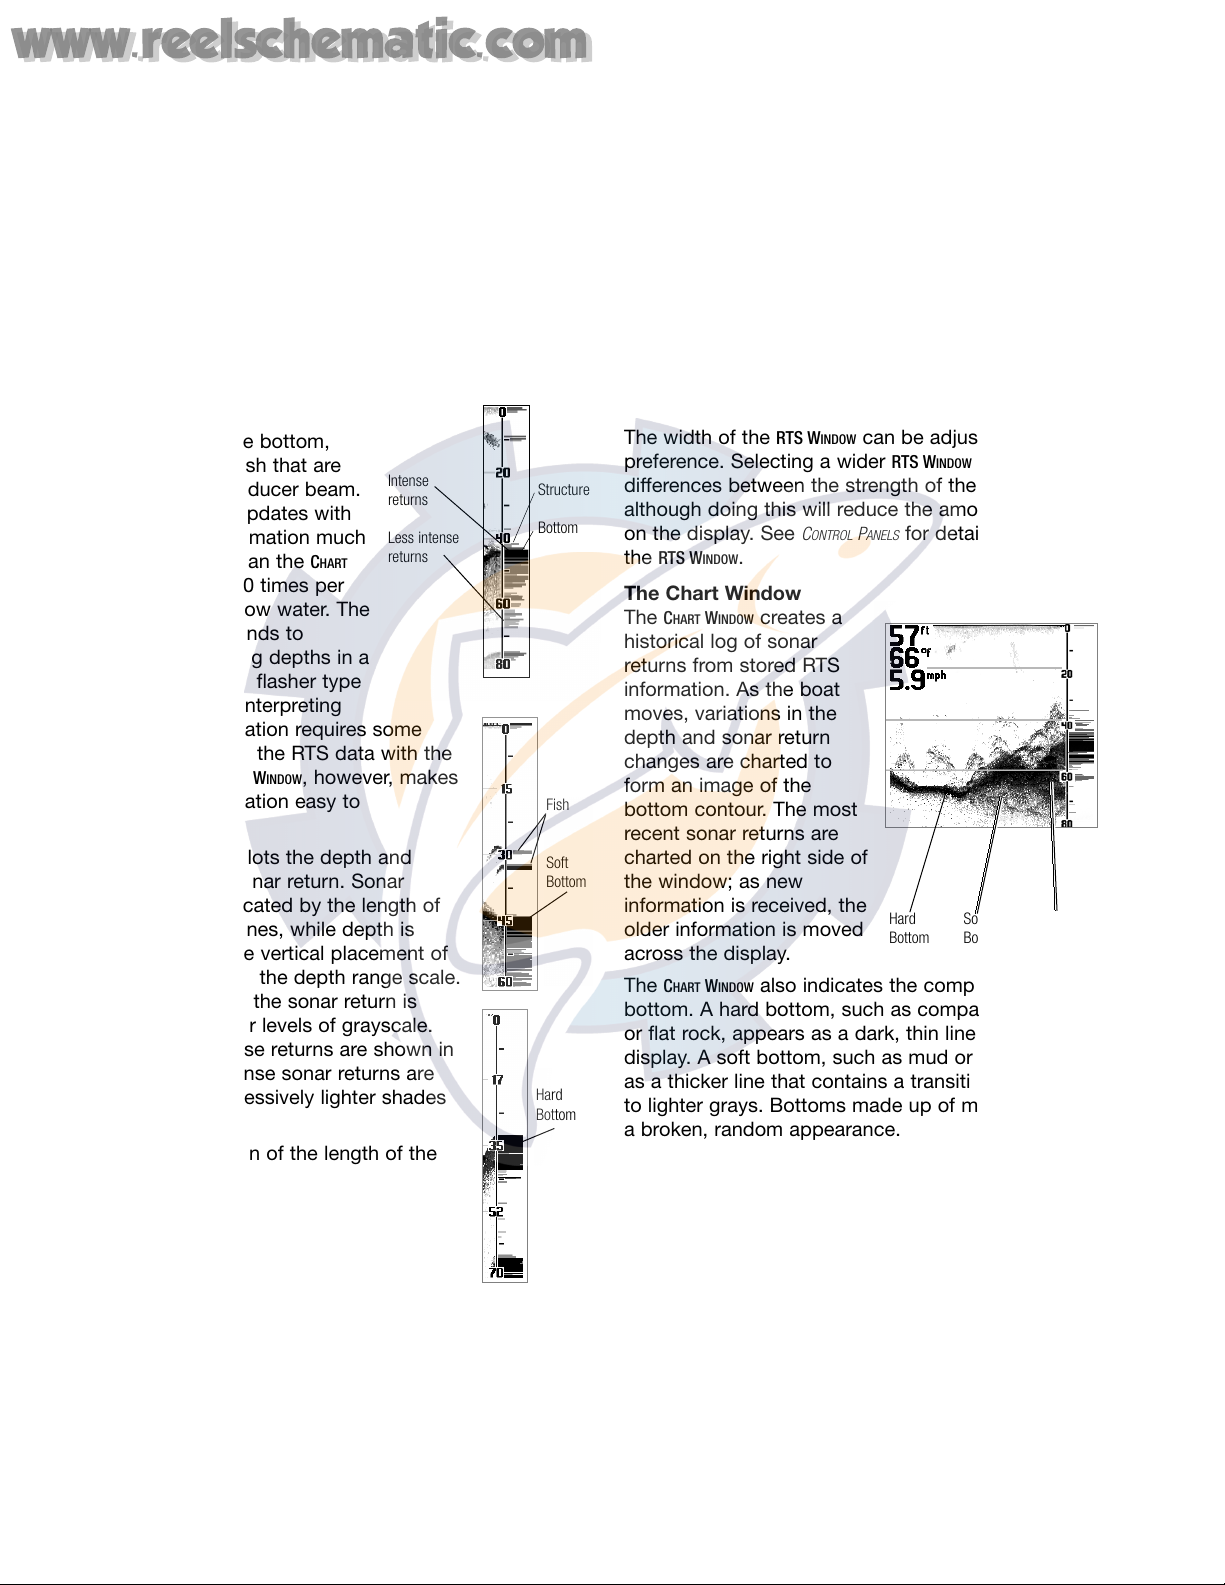
Real Time Sonar™ (RTS) Window
The REAL TIME SONAR (RTS) WINDOW
shows instantaneous sonar
returns from the bottom,
structure and fish that are
within the transducer beam.
The RTS WINDOW updates with
new sonar information much
more quickly than the CHART
WINDOW - up to 20 times per
second in shallow water. The
RTS WINDOW responds to
quickly-changing depths in a
way similar to a flasher type
sonar display. Interpreting
the RTS information requires some
skill; comparing the RTS data with the
data in the CHART WINDOW, however, makes
the RTS information easy to
understand.
The RTS WINDOW plots the depth and
intensity of a sonar return. Sonar
intensity is indicated by the length of
the horizontal lines, while depth is
indicated by the vertical placement of
the lines next to the depth range scale.
The intensity of the sonar return is
divided into four levels of grayscale.
The most intense returns are shown in
black; less intense sonar returns are
shown in progressively lighter shades
of gray.
The combination of the length of the
lines and the gray scale level helps to
identify the bottom composition and
structure. The bottom displays as the
largest grouping of black horizontal
lines, and typically has gray lines
underneath. A harder bottom shows less gray below;
a soft bottom shows more gray below. Structure
appears above the bottom as a cluster of lines with
varying lengths and gray shades.
Fish appear as smaller groupings of sonar returns
between the bottom and surface. Often, large fish
within a structure will show as a strong return within a
grouping of smaller returns. When the boat is
stationary or drifting very slowly, the RTS WINDOW can
show the movement of the fish through the transducer
beam. Moving fish appear as smaller groups of lines
that become progressively larger lines, or vice versa.
A grouping of lines moving vertically indicates a fish
changing depth.
The width of the RTS WINDOW can be adjusted to your
preference. Selecting a wider RTS WINDOW shows greater
differences between the strength of the sonar returns,
although doing this will reduce the amount of history
on the display. See CONTROL PANELS for details on adjusting
the RTS WINDOW.
The Chart Window
The CHART WINDOW creates a
historical log of sonar
returns from stored RTS
information. As the boat
moves, variations in the
depth and sonar return
changes are charted to
form an image of the
bottom contour. The most
recent sonar returns are
charted on the right side of
the window; as new
information is received, the
older information is moved
across the display.
The CHART WINDOW also indicates the composition of the
bottom. A hard bottom, such as compacted sediment
or flat rock, appears as a dark, thin line across the
display. A soft bottom, such as mud or sand, appears
as a thicker line that contains a transition from darker
to lighter grays. Bottoms made up of many rocks have
a broken, random appearance.
4
USING THE LEGEND 2000 SERIES
REAL TIME SONAR™ / CHART WINDOW
Hard
Bottom
Soft
Bottom
Rocky
Bottom
Chart Window
Intense
returns
Less intense
returns
Structure
Bottom
Fish
Soft
Bottom
Hard
Bottom
www.reelschematic.com
www.reelschematic.com
 Loading...