

Page 1

APM
User Guide
Issue 01
Date 2021-01-05
HUAWEI TECHNOLOGIES CO., LTD.
Page 2

Copyright © Huawei Technologies Co., Ltd. 2021. All rights reserved.
No part of this document may be reproduced or transmitted in any form or by any means without prior
written consent of Huawei Technologies Co., Ltd.
Trademarks and Permissions
and other Huawei trademarks are trademarks of Huawei Technologies Co., Ltd.
All other trademarks and trade names mentioned in this document are the property of their respective
holders.
Notice
The purchased products, services and features are stipulated by the contract made between Huawei and
the customer. All or part of the products, services and features described in this document may not be
within the purchase scope or the usage scope. Unless otherwise specied in the contract, all statements,
information, and recommendations in this document are provided "AS IS" without warranties, guarantees
or representations of any kind, either express or implied.
The information in this document is subject to change without notice. Every eort has been made in the
preparation of this document to ensure accuracy of the contents, but all statements, information, and
recommendations in this document do not constitute a warranty of any kind, express or implied.
Issue 01 (2021-01-05) Copyright © Huawei Technologies Co., Ltd. i
Page 3

APM
User Guide Contents
Contents
1 Before You Start....................................................................................................................... 1
2 Permissions Management..................................................................................................... 2
2.1 Creating a User and Granting Permissions.....................................................................................................................2
2.2 Creating a Custom Policy..................................................................................................................................................... 3
3 Application Overview............................................................................................................. 5
3.1 Dashboard..................................................................................................................................................................................5
3.2 Inventory.................................................................................................................................................................................... 6
4 Topology.................................................................................................................................... 7
5 Tracing......................................................................................................................................11
5.1 Call Chain.................................................................................................................................................................................11
5.2 Method Tracing......................................................................................................................................................................14
6 Transactions............................................................................................................................ 16
7 SQL Analysis........................................................................................................................... 19
8 JVM Monitoring..................................................................................................................... 22
9 ICAgent Installation and
9.1 Agent Management (HUAWEI CLOUD Host).............................................................................................................28
9.1.1 Installing the ICAgent (Linux)....................................................................................................................................... 28
9.1.2 Upgrading the ICAgent (Linux).................................................................................................................................... 32
9.1.3 Uninstalling the ICAgent (Linux)................................................................................................................................. 33
9.2 Agent Management (Non-HUAWEI CLOUD Host)...................................................................................................35
9.2.1 Installing the ICAgent...................................................................................................................................................... 35
9.2.2 Upgrading the ICAgent....................................................................................................................................................38
9.2.3 Uninstalling the ICAgent.................................................................................................................................................39
9.3 Collection Conguration.....................................................................................................................................................40
9.4 Conguration Center........................................................................................................................................................... 41
Conguration.......................................................................... 28
10 Alarm Center........................................................................................................................ 43
10.1 Viewing Alarms................................................................................................................................................................... 43
10.2 Viewing Events.................................................................................................................................................................... 46
10.3 Setting Alarm
Issue 01 (2021-01-05) Copyright © Huawei Technologies Co., Ltd. ii
Notication.............................................................................................................................................. 47
Page 4

APM
User Guide 1 Before You Start
1 Before You Start
This document describes how to use Application Performance Management
(APM).
Topology The call and dependency relationships between applications are
displayed, and abnormal instances can be automatically
discovered.
Call Chain Information such as the call status, duration, and API is displayed,
helping you further locate fault causes.
TransactionsKey metrics of transactions are displayed and Application
Performance Index (Apdex) values intuitively reect users'
satisfaction with applications.
● When a transaction is abnormal, an alarm is reported.
● For transactions with poor user experience, faults can be
located based on topology and tracing.
Method
Tracing
SQL
Analysis
JVM
Monitoring
Developers are able to locate method-level performance
problems online.
Database performance problems caused by abnormal SQL
statements are analyzed. The topology displays the key metrics
of databases and SQL statements.
The memory and thread metrics of the JVM running environment
are monitored in real time, enabling you to quickly detect
problems such as memory leakage and thread exceptions.
● The topology displays the JVM metrics of instances.
● When a JVM metric is abnormal, an alarm is reported.
Issue 01 (2021-01-05) Copyright © Huawei Technologies Co., Ltd. 1
Page 5

APM
User Guide 2 Permissions Management
2 Permissions Management
2.1 Creating a User and Granting Permissions
This section describes the ne-grained permissions management provided by
Identity and Access Management (IAM) for your Application Performance
Management (APM). With IAM, you can:
Prerequisites
● Create IAM users for employees based on the organizational structure of your
enterprise. Each IAM user has their own security credentials, providing access
to APM resources.
● Grant only the permissions required for users to perform a task.
● Entrust a cloud account or service to perform professional and
on your APM resources.
If your account does not need individual IAM users, then you may skip over this
chapter.
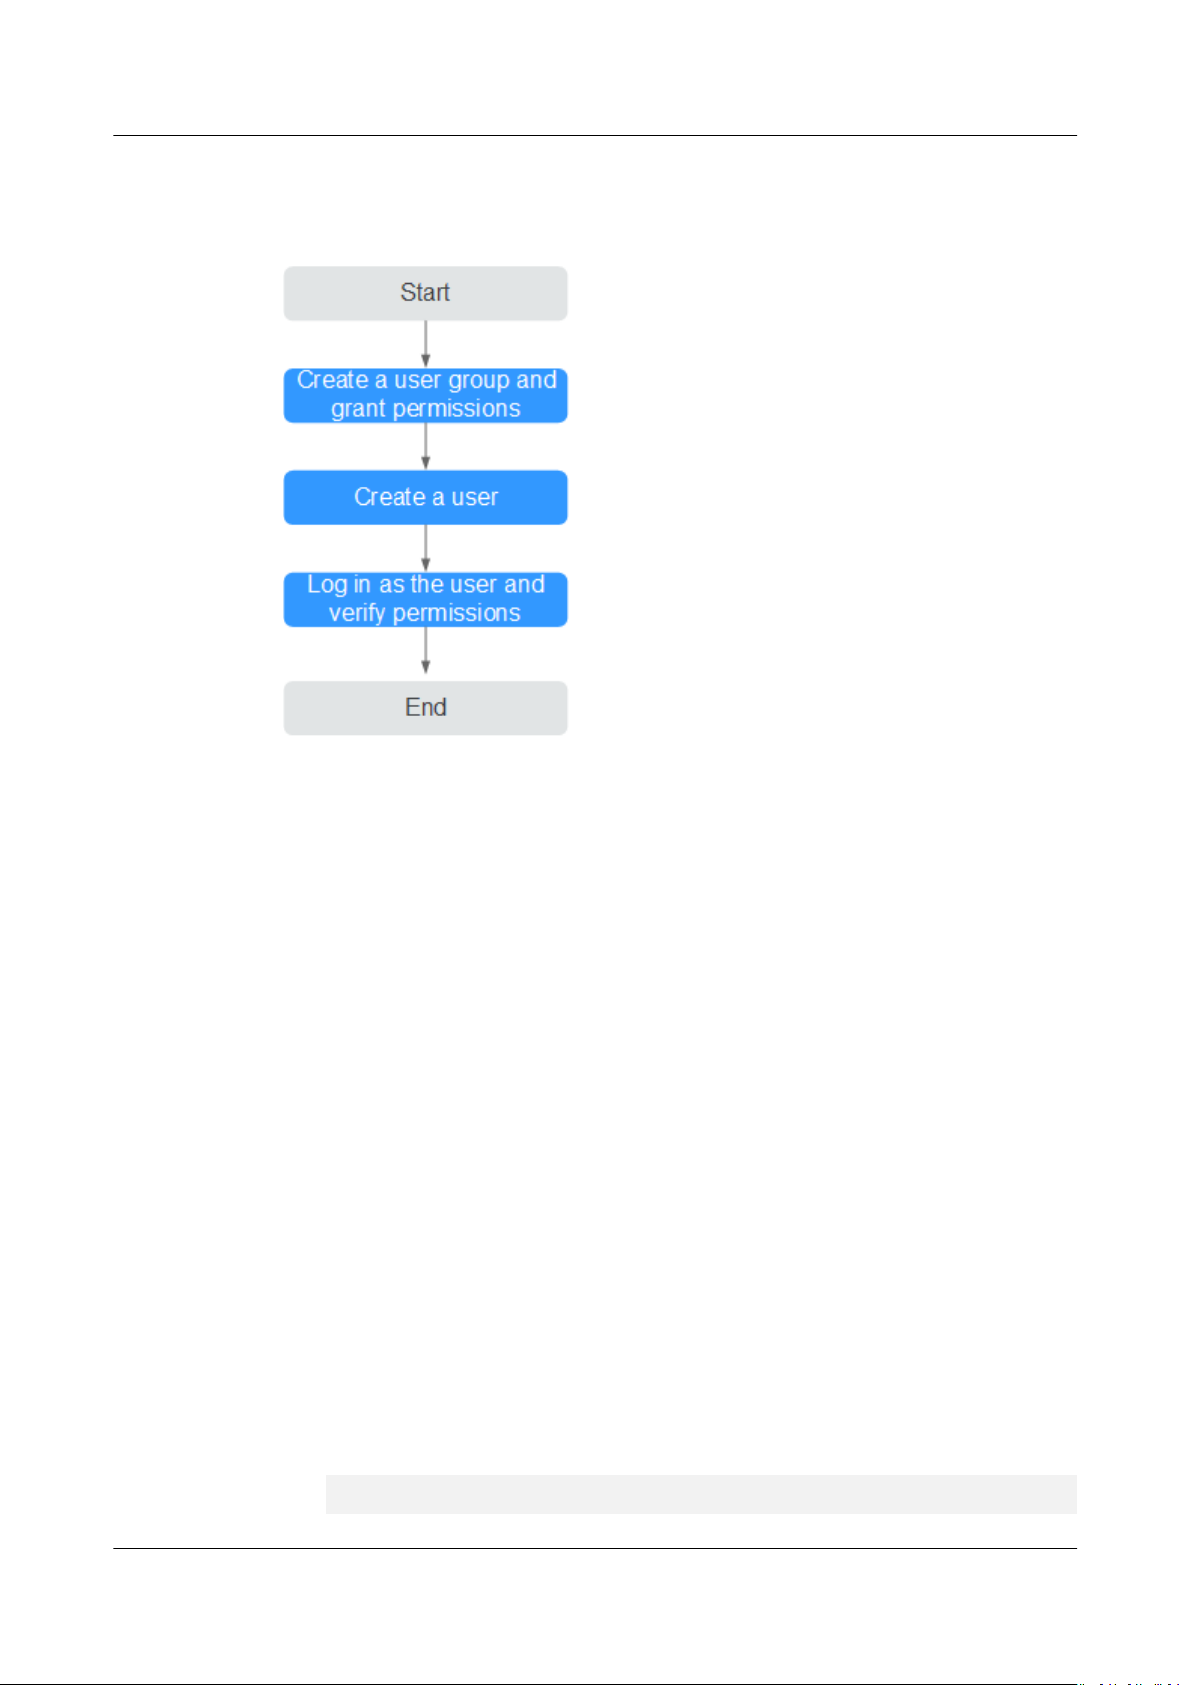
This section describes the procedure for granting permissions (see Figure 2-1).
Before assigning permissions to user groups, you should learn about the APM
permissions listed in Permissions Management. For the system permissions of
other services, see System Permissions.
ecient O&M
Issue 01 (2021-01-05) Copyright © Huawei Technologies Co., Ltd. 2
Page 6
APM
User Guide 2 Permissions Management
Process
Figure 2-1 Granting APM permissions
1. Creating a User Group and Assigning Permissions
Create a user group on the IAM console, and assign the APM
ReadOnlyAccess policy to the group.
2. Creating an IAM User
Create a user on the IAM console and add the user to the group created in 1.
3. Logging In Using an IAM User and Verifying Permissions
Log in to the APM console as the created user, and verify that it has only the
read permissions for APM.
2.2 Creating a Custom Policy
Custom policies can be created as a supplement to the system policies of
Application Performance Management (APM). For the actions supported for
custom policies, see Permissions Policies and Supported Actions.
You can create custom policies in either of the following two ways:
● Visual editor: Select cloud services, actions, resources, and request conditions
without the need to know policy syntax.
● JSON: Edit JSON policies from scratch or based on an existing policy.
For details, see Creating a Custom Policy. The following section contains
examples of common APM custom policies.
Example Custom Policies
● Example 1: Allowing a user to install the ICAgent
{
"Version": "1.1",
Issue 01 (2021-01-05) Copyright © Huawei Technologies Co., Ltd. 3
Page 7

APM
User Guide 2 Permissions Management
"Statement": [
{
"Eect": "Allow",
"Action": [
"apm:icmgr:create"
]
}
]
}
● Example 2: Denying collection component uninstallation
A deny policy must be used in conjunction with other policies to take
eect. If
the permissions assigned to a user contain both Allow and Deny actions, the
Deny actions take precedence over the Allow actions.
To grant a user the APM FullAccess system policy but forbid the user to
uninstall collection components, create a custom policy that denies the
uninstallation of collection components and grant both the APM FullAccess
and deny policies to the user. Because the Deny action takes precedence, the
user can perform all operations except uninstalling collection components.
The following is an example deny policy:
{
"Version": "1.1",
"Statement": [
{
"Eect": "Deny",
"Action": [
"apm:icmgr:delete"
]
}
]
}
● Example 3:
Dening permissions for multiple services in a policy
A custom policy can contain actions of multiple services that are all of the
project-level type. The following is an example policy containing actions of
multiple services:
{
"Version": "1.1",
"Statement": [
{
"Action": [
"aom:*:list",
"aom:*:get",
"apm:*:list",
"apm:*:get"
]
},
{
"Action": [
"cce:cluster:get",
"cce:cluster:list",
"cce:node:get",
"cce:node:list"
]
}
]
}
"Eect": "Allow",
"Eect": "Allow",
Issue 01 (2021-01-05) Copyright © Huawei Technologies Co., Ltd. 4
Page 8
NO TE
APM
User Guide 3 Application Overview
3 Application Overview
3.1 Dashboard
An application is a logical group of the same or similar services categorized based
on service requirements. You can put services that
one application for performance management. For example, you can put accounts,
products, and payment services into the Mall application.
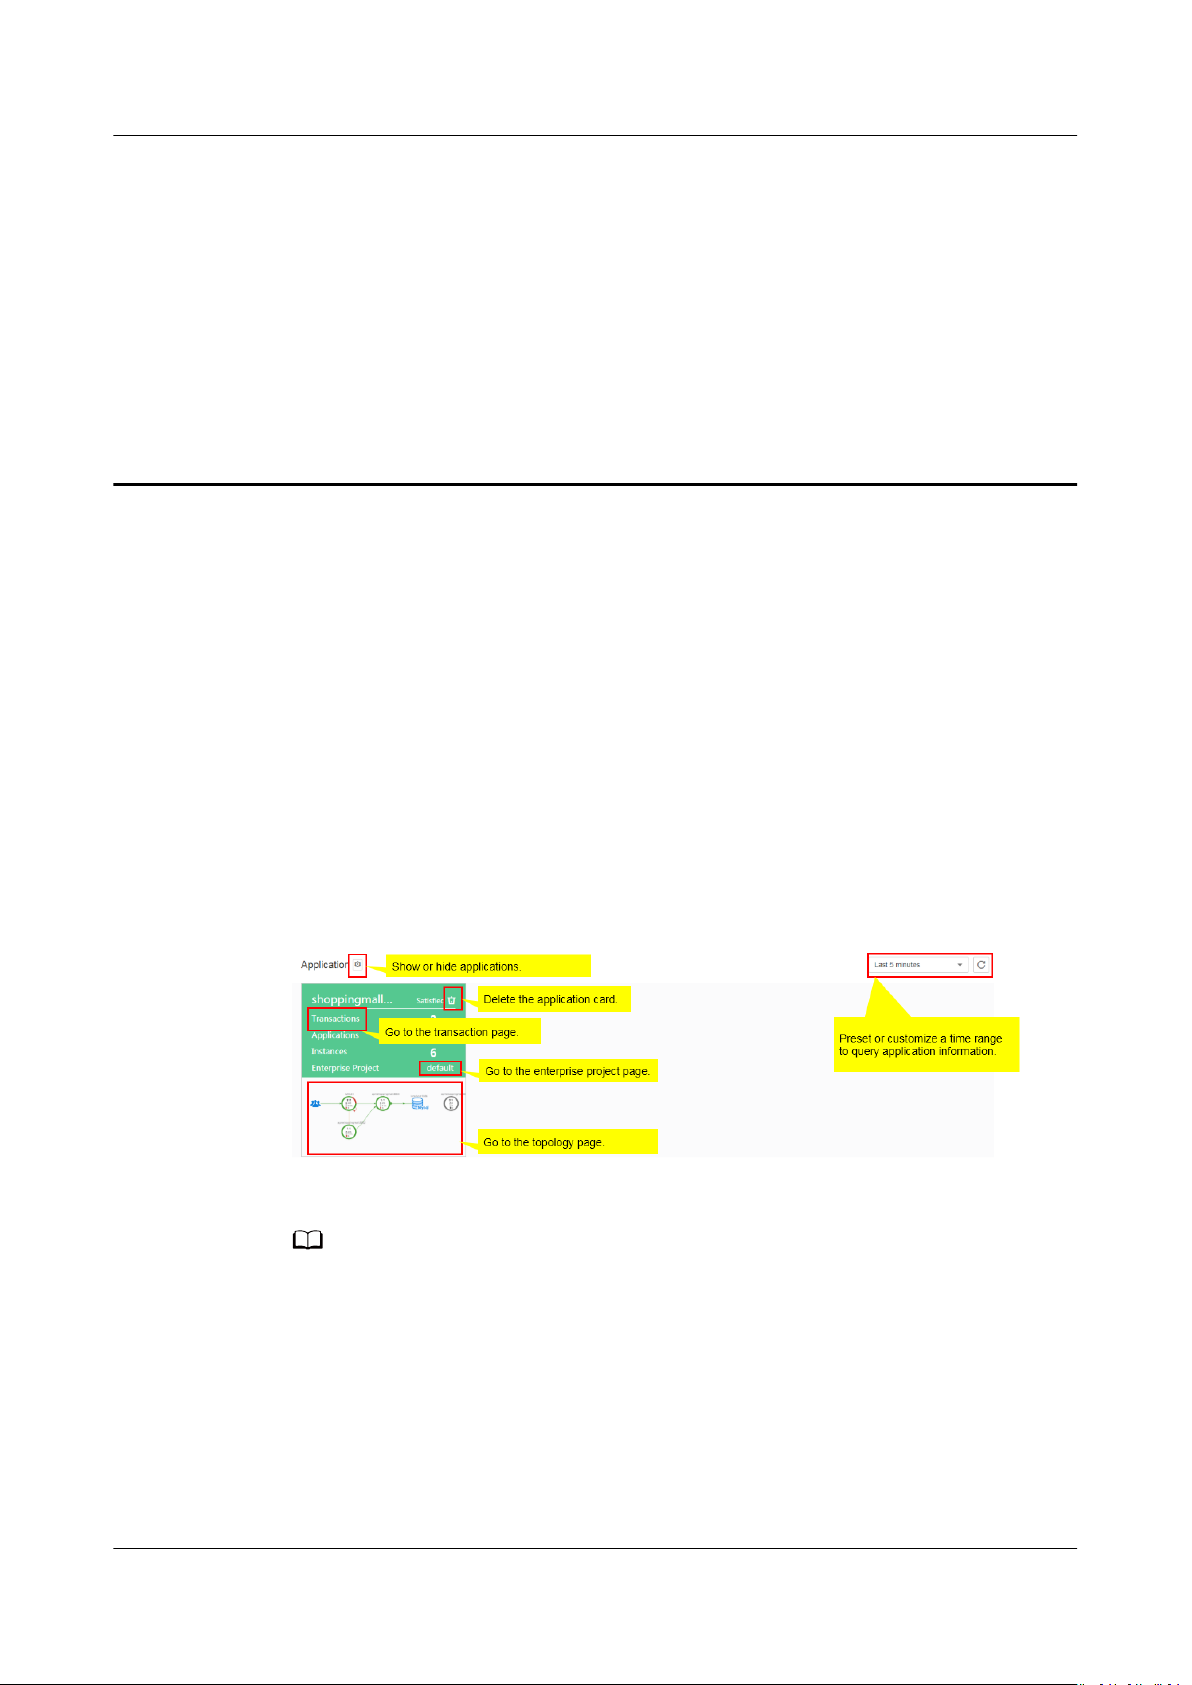
You can quickly obtain the health status of applications through the dashboard.
On the Dashboard page, you can perform the following operations:
Figure 3-1 Dashboard page
fulll the same function into
The Enterprise Project option is displayed only when you have enabled the enterprise
project function. After this function is enabled, both historical and new probe applications
are added to the default enterprise project by default. To change the enterprise project to
which an application belongs, click Enterprise Project on the application card to go to the
enterprise project page and migrate the Application Performance Management (APM)
application. Enterprise Project Management Service (EPS) provides a
manage cloud resources and personnel by enterprise project. The default project is default.
For details about how to enable, create, and manage enterprise projects, see Enterprise
Management User Guide.
You can delete a service card in the following scenarios:
Issue 01 (2021-01-05) Copyright © Huawei Technologies Co., Ltd. 5
unied method to
Page 9
APM
User Guide 3 Application Overview
● The service connected to APM has been deleted.
● The ICAgent has been uninstalled and service data does not need to be
collected.
If the service connected to APM is still running, the service card will be displayed
again three minutes after it is deleted.
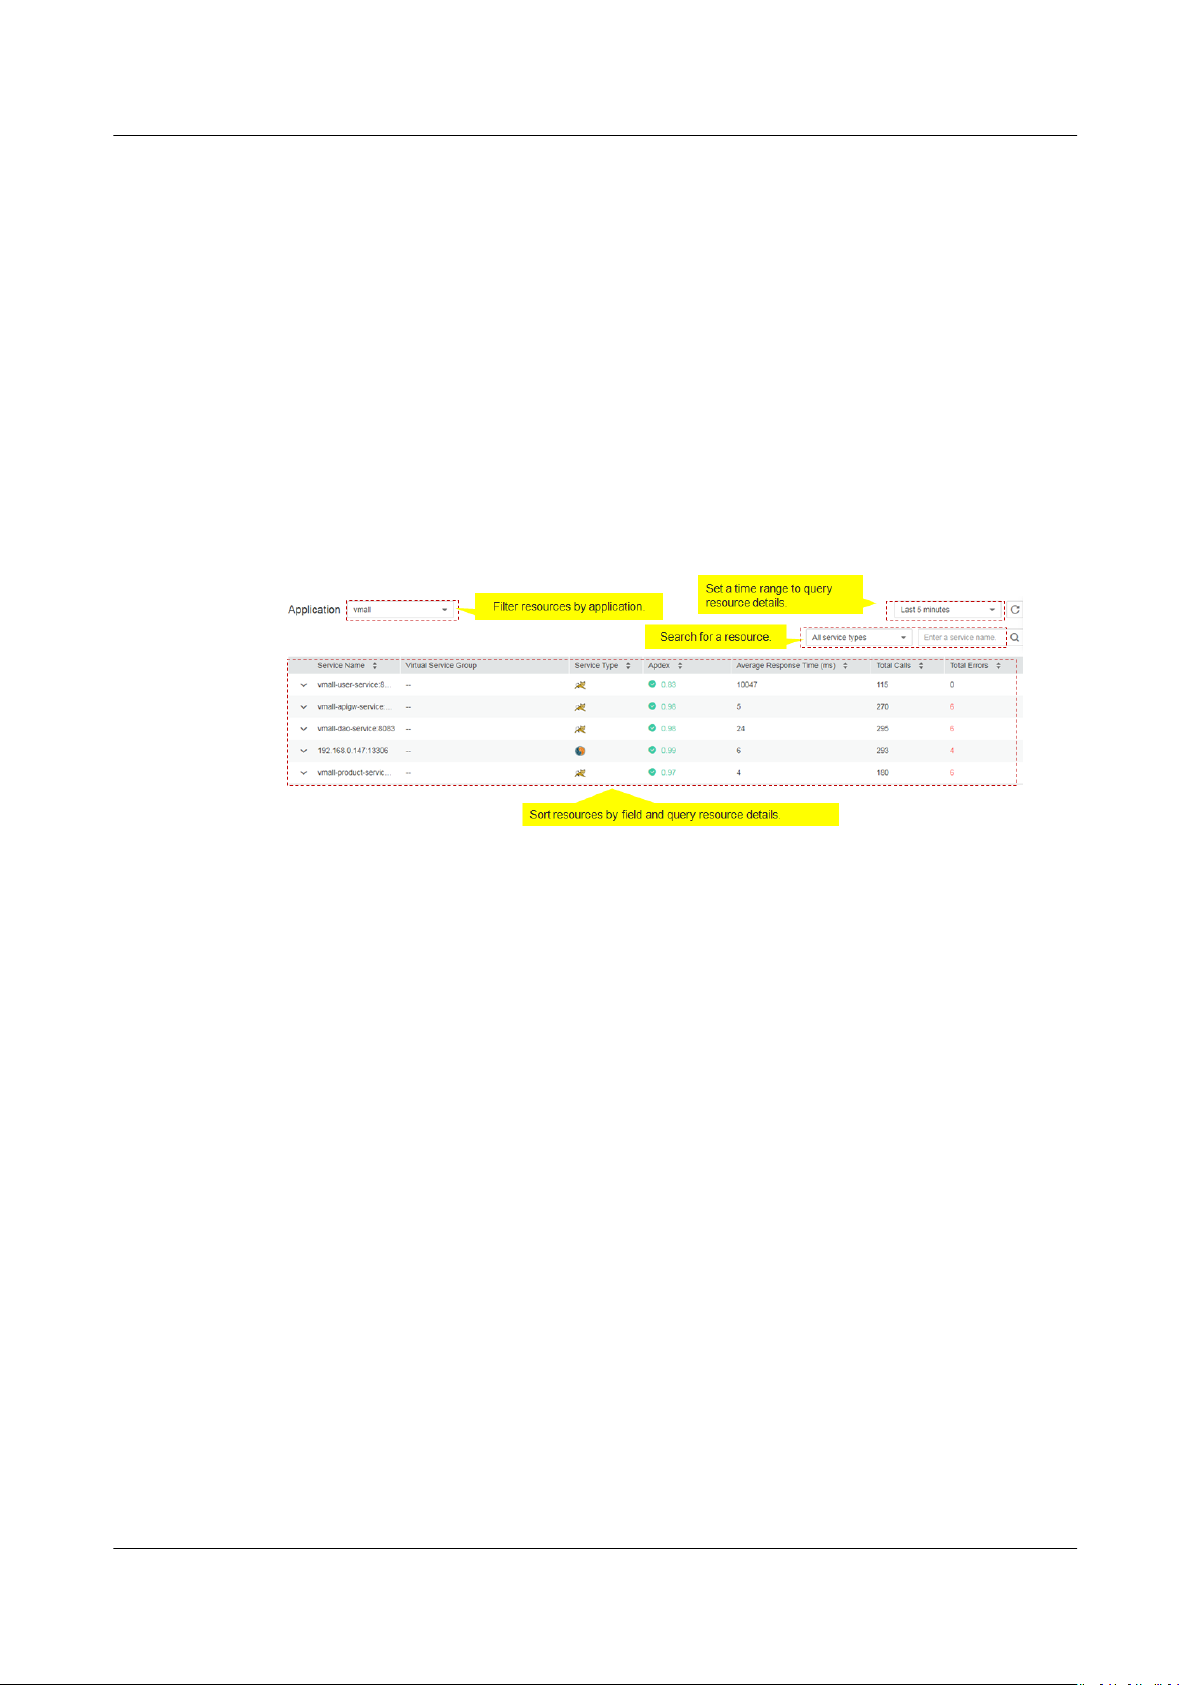
3.2 Inventory
The Inventory page displays metrics such as the service type, resource ID,
response time, calls, and errors, facilitating fault locating.
Figure 3-2 Inventory page
Issue 01 (2021-01-05) Copyright © Huawei Technologies Co., Ltd. 6
Page 10
APM
User Guide 4 Topology
4 Topology
A topology graphically displays call and dependency relationships between
applications. In a topology, each circle represents a service, each segment in a
circle represents an instance, and each arrow represents a call relationship.
Application Performance Management (APM) supports calls between applications.
The topology can display service call relationships across applications. When a
circle represents an application, right-click the circle and choose View Application
to go to the topology page.
Topology Page
Dierent colors on the circle represent dierent health statuses of instances.
Colors are determined by Application Performance Index (Apdex) values. If an
Apdex value is closer to 1, the corresponding application is healthier.
1. Table 4-1 provides topology description.
Issue 01 (2021-01-05) Copyright © Huawei Technologies Co., Ltd. 7
Page 11
APM
User Guide 4 Topology
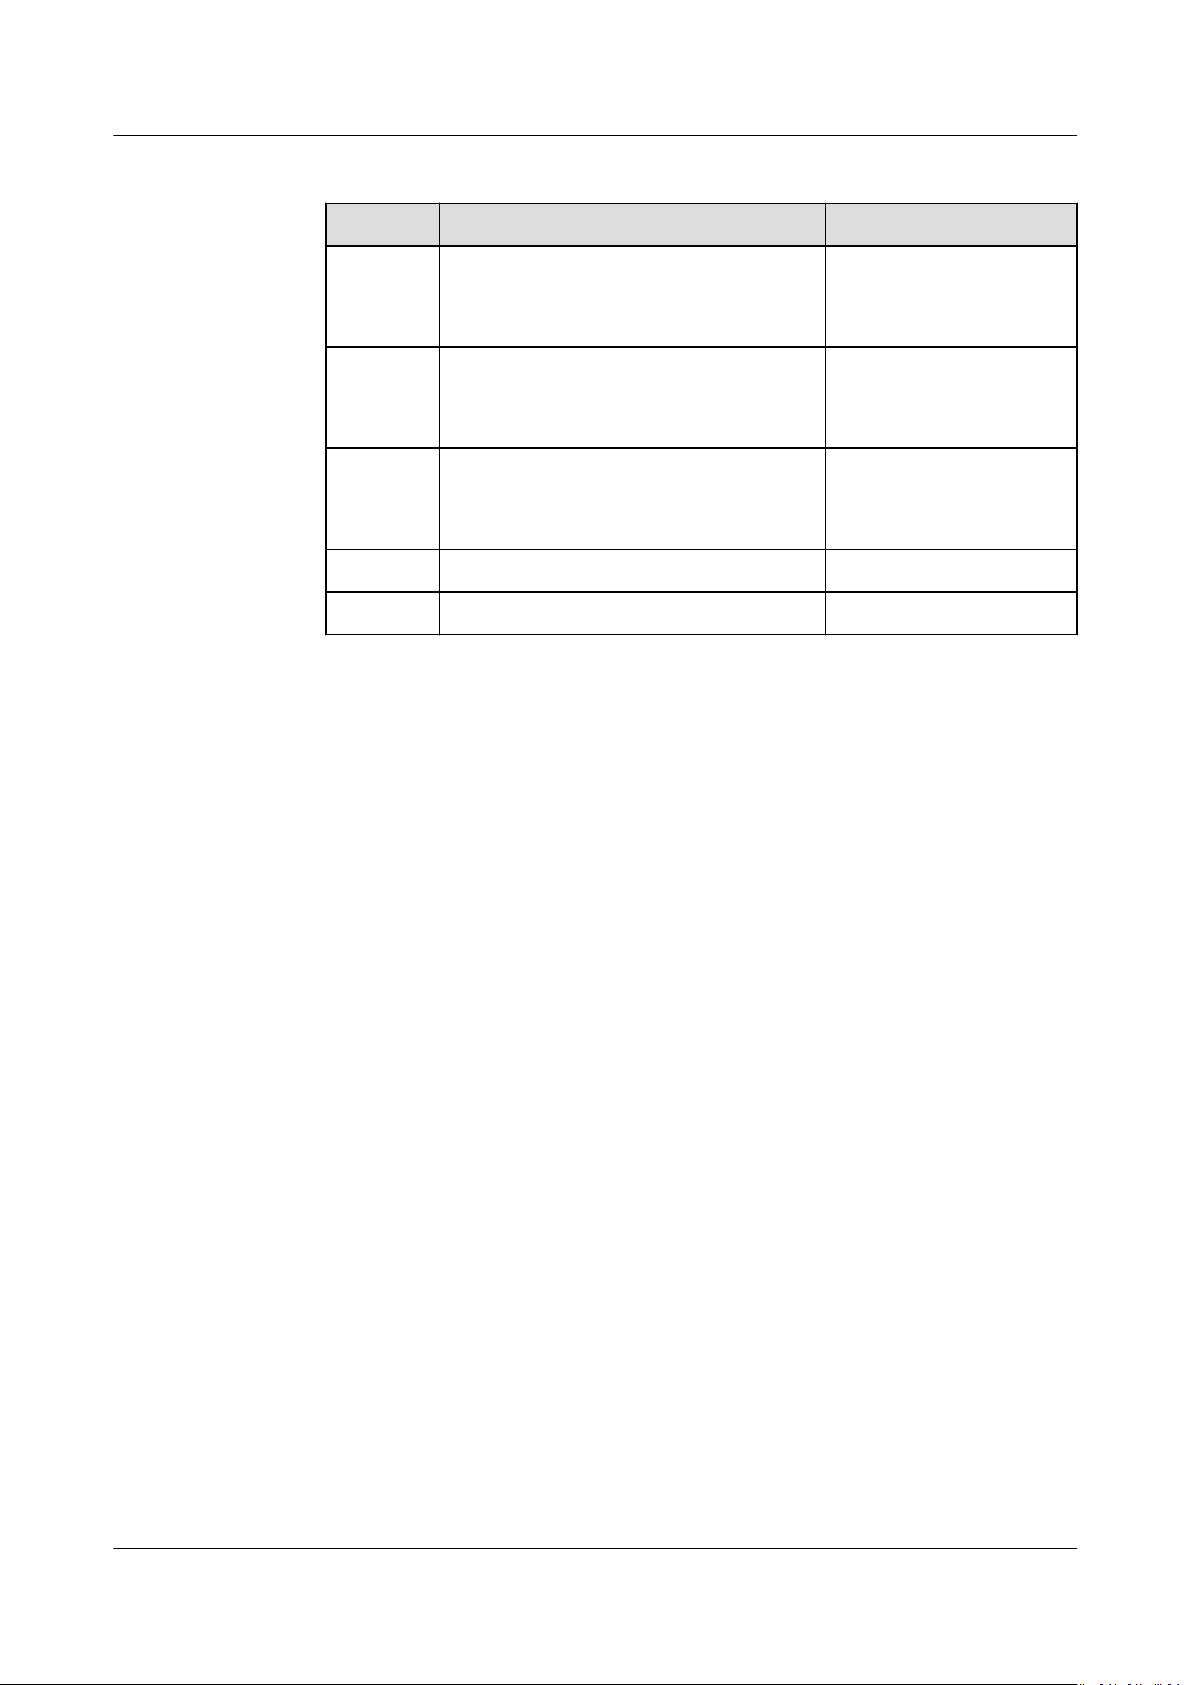
Table 4-1 Topology description
Color Instance Call
Green 0.75 ≤ Apdex ≤ 1
The instance responds quickly when it
is called.
Yellow 0.3 ≤ Apdex < 0.75
The instance responds slowly when it
is called.
Red 0 ≤ Apdex < 0.3
The instance responds very slowly
when it is called.
Gray The instance is not called. N/A
Black The instance is deleted. N/A
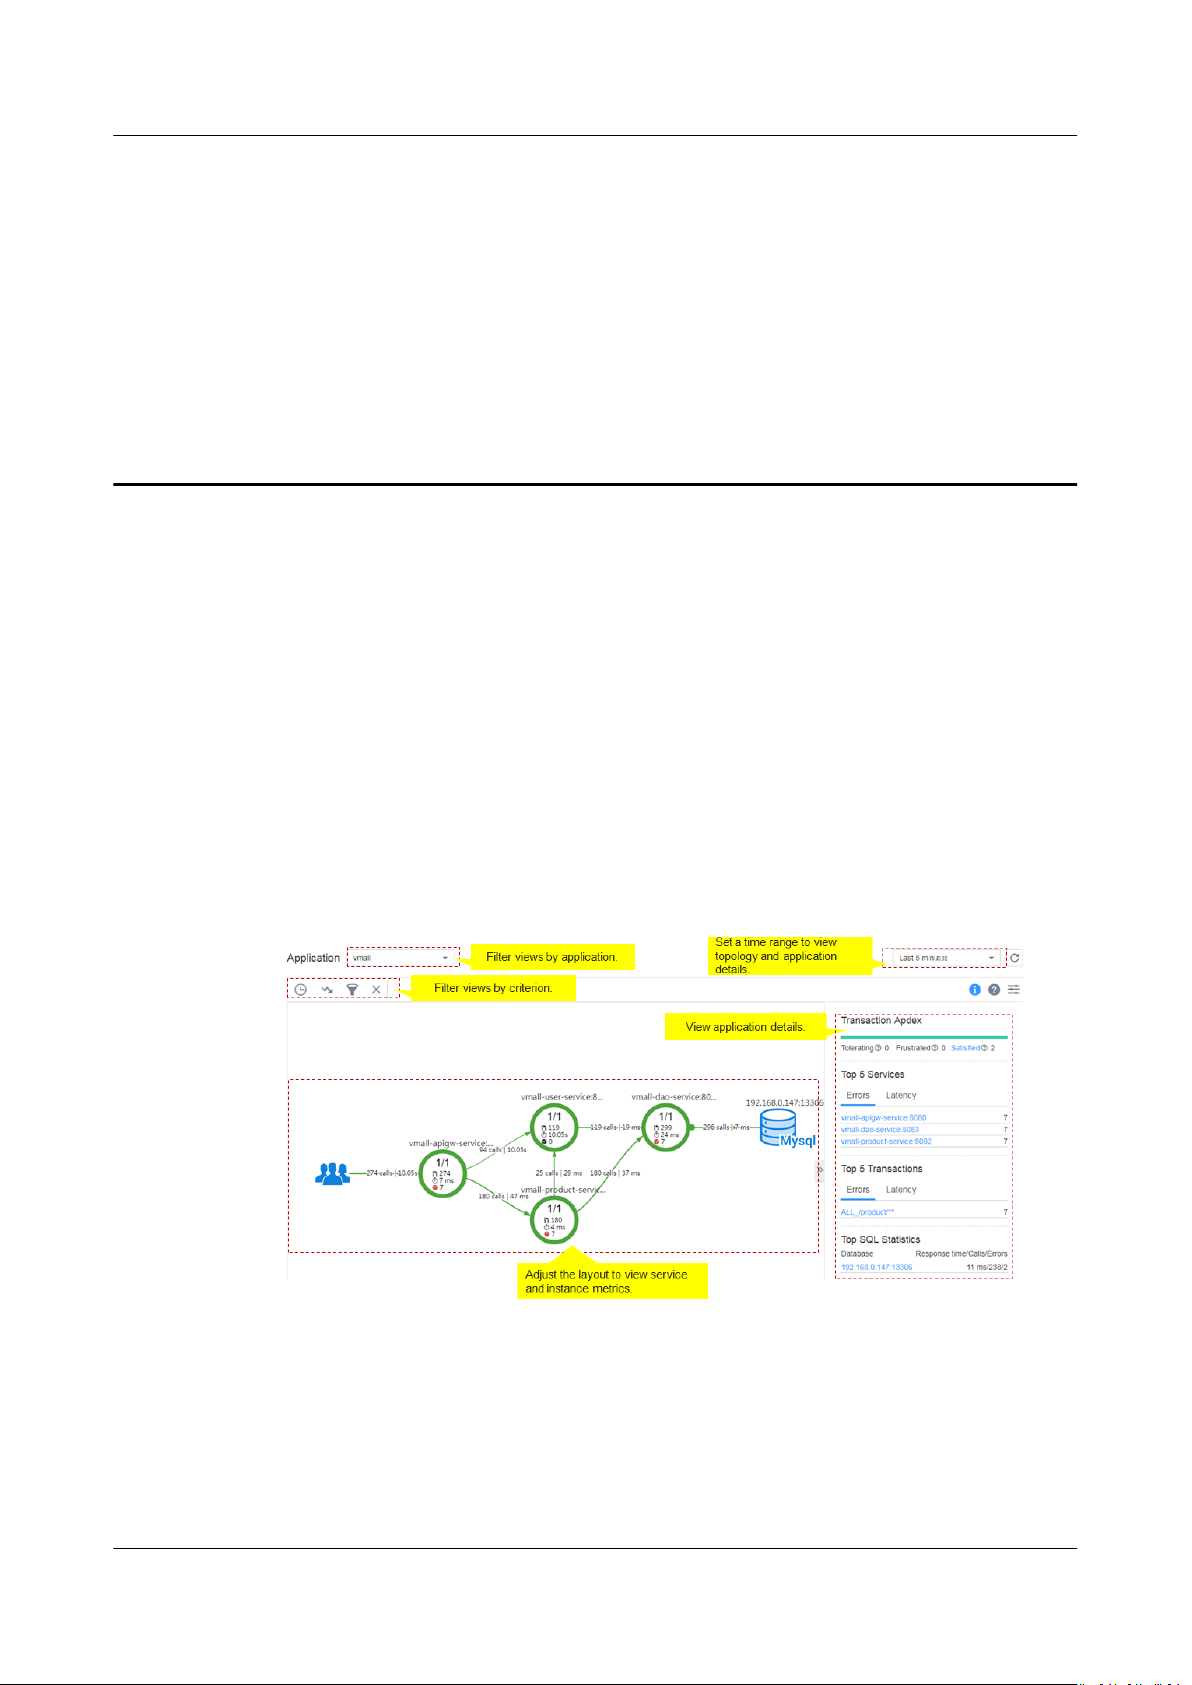
2. On the right of the topology page, set a time range to view the following
topology details of an application:
– Transaction Apdex
– Top 5 services ranked by errors and latency
– Top 5 transactions ranked by errors and latency
– Top 5 SQL statements ranked by response time, calls, and errors
3. In the topology, click a circle (a service) to view metric data, including Service
Level Agreement (SLA) metrics, basic service metrics, and transaction details.
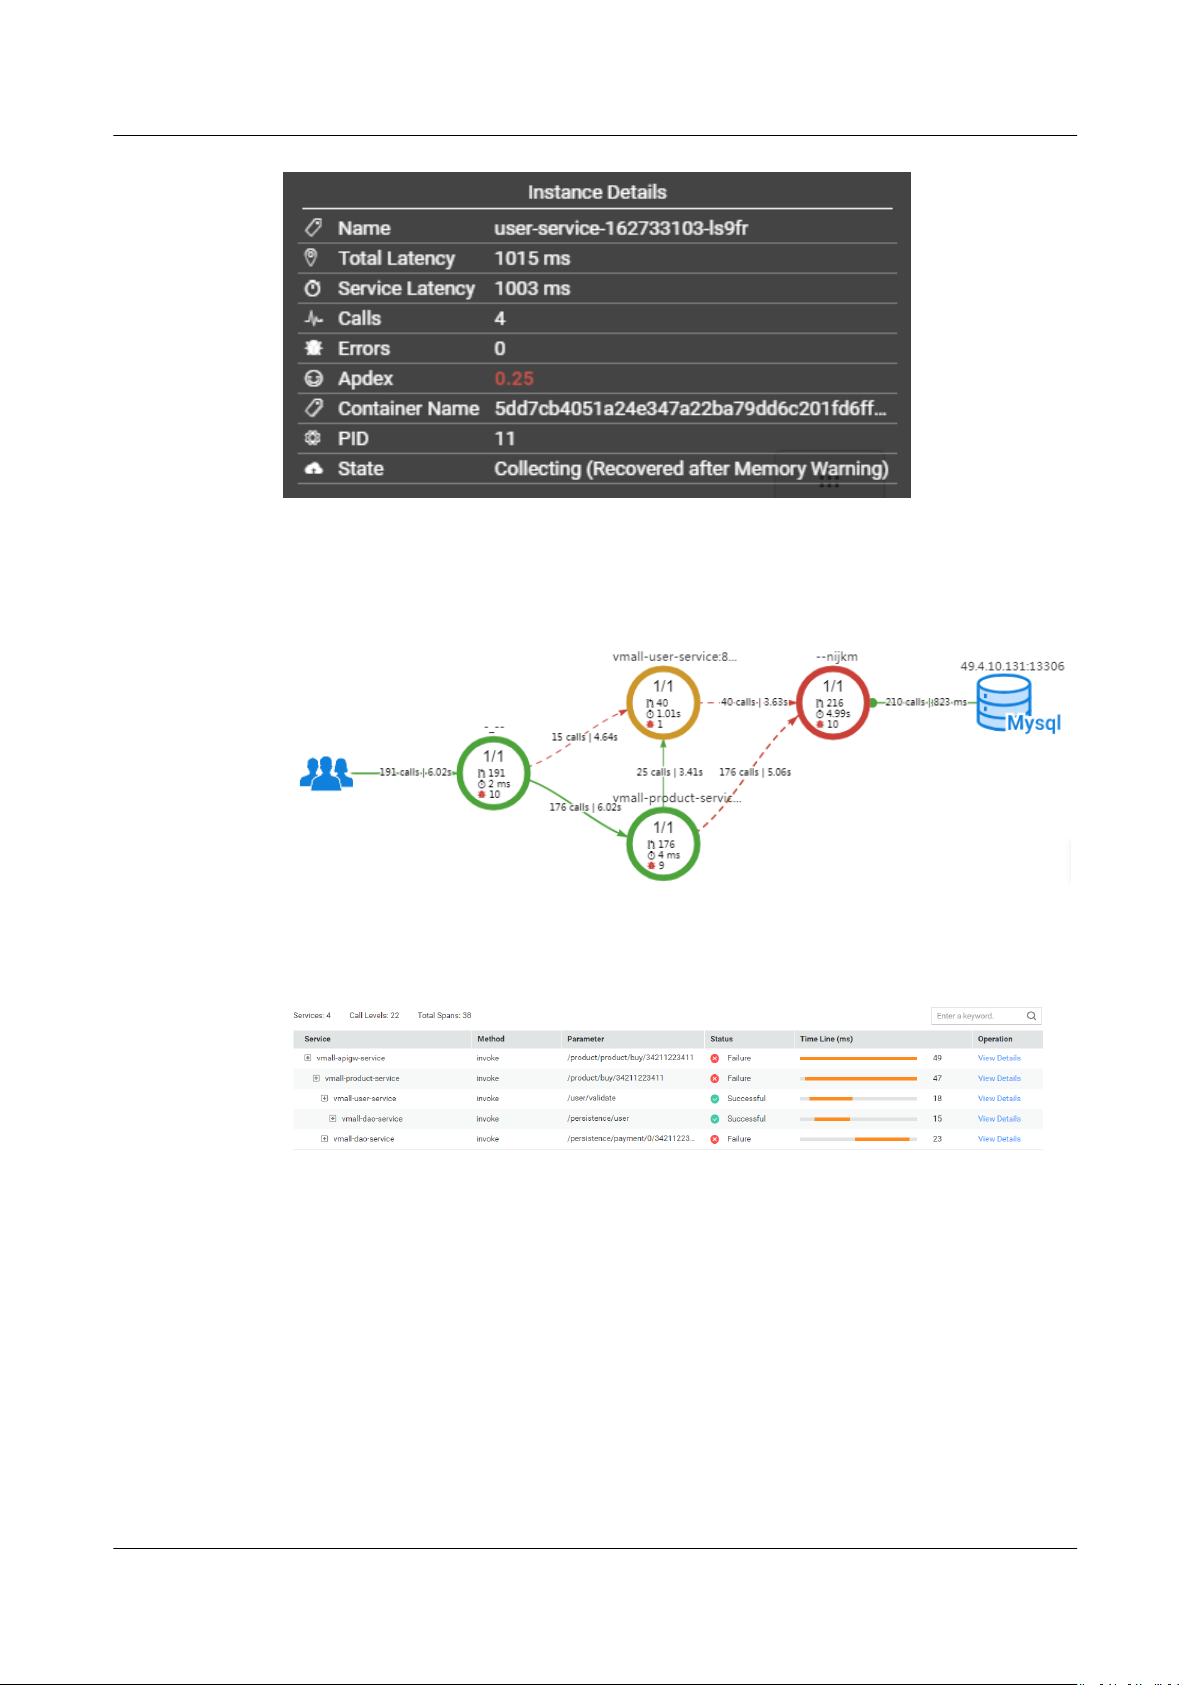
4. In the topology, click a segment (an instance) in a circle to view metric data,
including basic instance metrics, JVM metrics, node metrics, and transaction
details.
0.75 ≤ Apdex ≤ 1
Quick response.
0.3 ≤ Apdex < 0.75
Slow response.
0 ≤ Apdex < 0.3
Very slow response.
Locating Faults Using the Topology
The following describes how to locate an instance with a slow response:
Step 1 Log in to the APM console.
Step 2 In the navigation pane, choose Topology.
Step 3 In the upper right corner of the topology page, set a time range during which a
problem occurs.
Step 4 Check the instance with a long execution time (that is, the instance highlighted in
red) in the topology.
Issue 01 (2021-01-05) Copyright © Huawei Technologies Co., Ltd. 8
Page 12
APM
User Guide 4 Topology
Step 5 (Optional) For the service containing multiple instances, right-click the service and
choose Expand from the shortcut menu to view call relationships between
instances to preliminarily identify the abnormal instance.
Step 6 Choose Find Call-Chain from the shortcut menu. On the page that is displayed,
further locate the fault based on call duration and other parameters.
----End
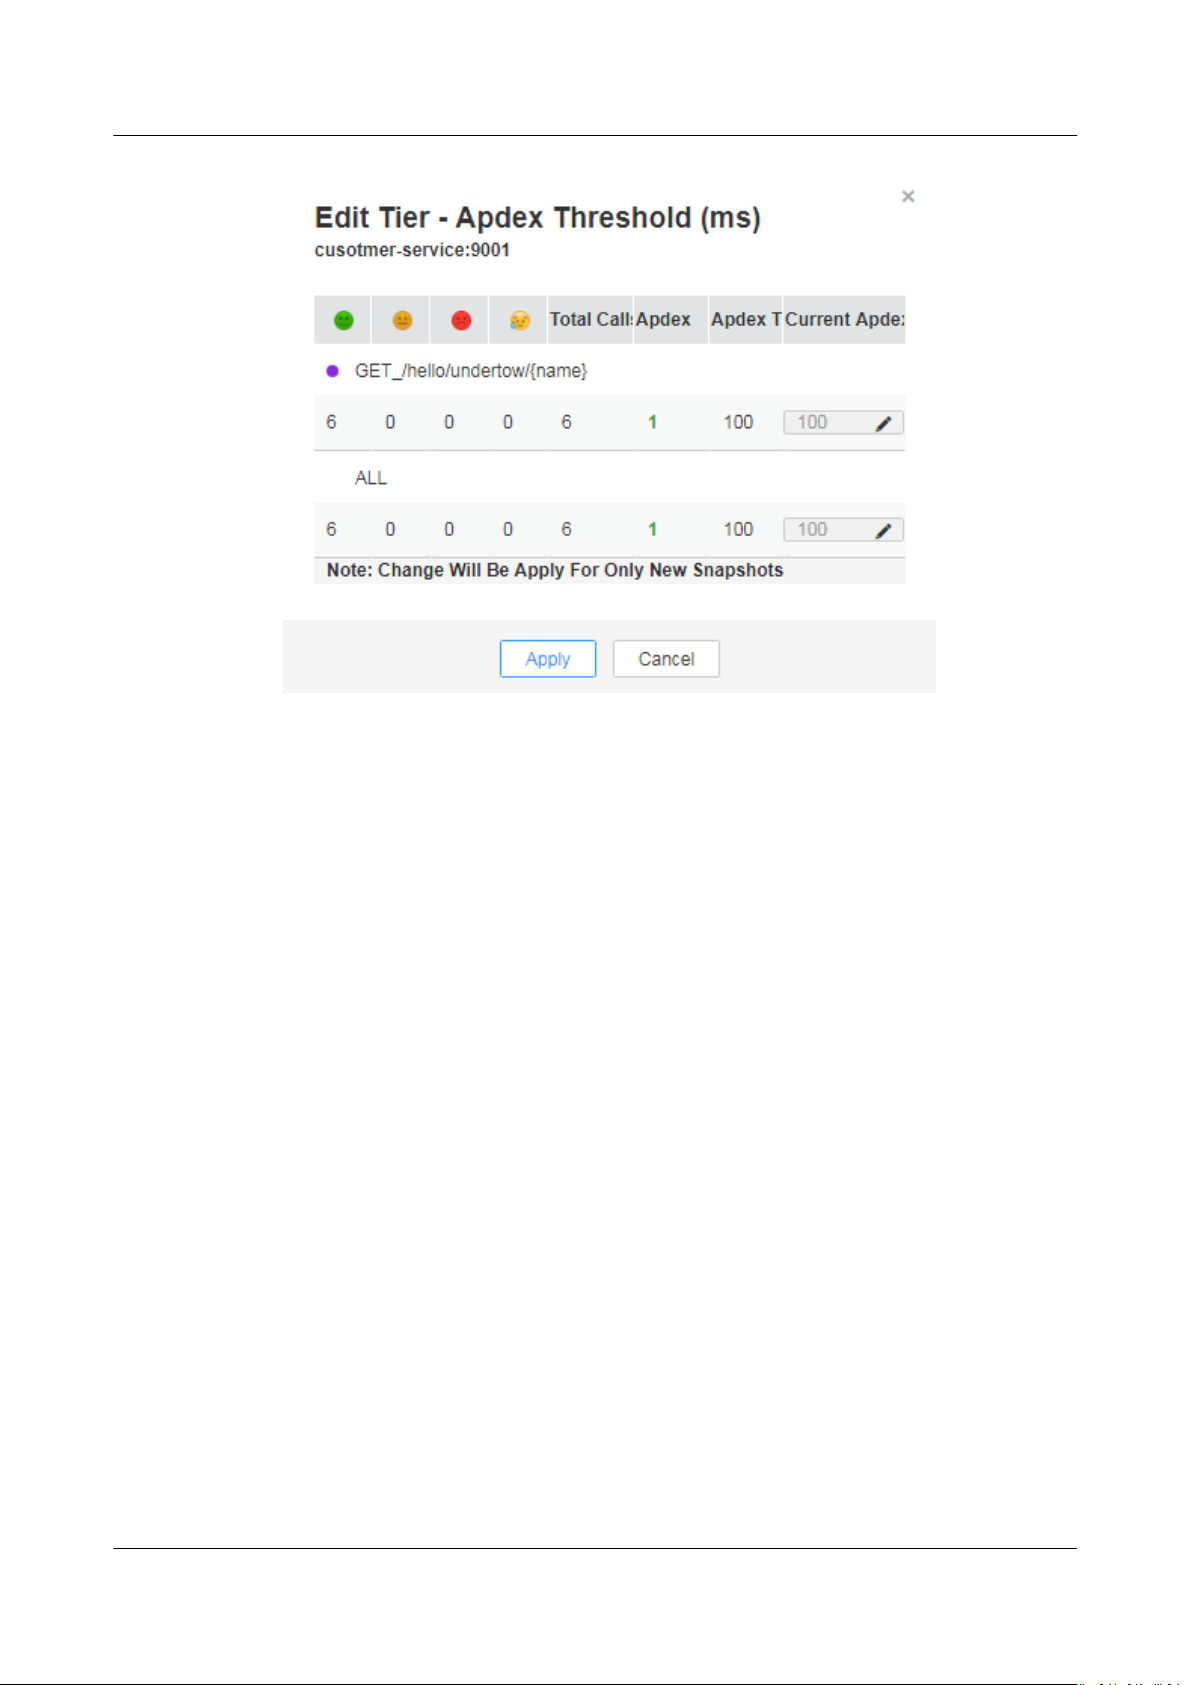
Conguring Transaction Apdex Threshold
The response time of dierent transactions is dierent. APM enables you to
congure dierent Apdex thresholds for dierent transactions. For example, if a
login takes more than 50 ms, the response is slow. If a query transaction takes
more than 10 ms, the response is slow. In this case, you need to set
Apdex thresholds for the login and query transactions.
Step 1 In the topology page, move the mouse cursor over a circle, right-click it, and click
Edit Threshold.
Step 2 Modify the transaction Apdex threshold and click Apply.
dierent
Issue 01 (2021-01-05) Copyright © Huawei Technologies Co., Ltd. 9
Page 13
APM
User Guide 4 Topology
----End
Issue 01 (2021-01-05) Copyright © Huawei Technologies Co., Ltd. 10
Page 14
APM
User Guide 5 Tracing
5 Tracing
5.1 Call Chain
With the tracing function, Application Performance Management (APM) traces
and records service calls, comprehensively monitors key metrics such as call status
and latency, and visually restores the execution traces and statuses of service
requests in distributed systems, so that you can quickly locate performance
bottlenecks and faults.
Locating Performance Bottlenecks
Step 1 Log in to the APM console.
Step 2 In the navigation pane, choose Tracing > Call Chain.
Step 3 In the upper right of the Call Chain page, select the desired time range,
application, and service from three drop-down lists, and click Search.
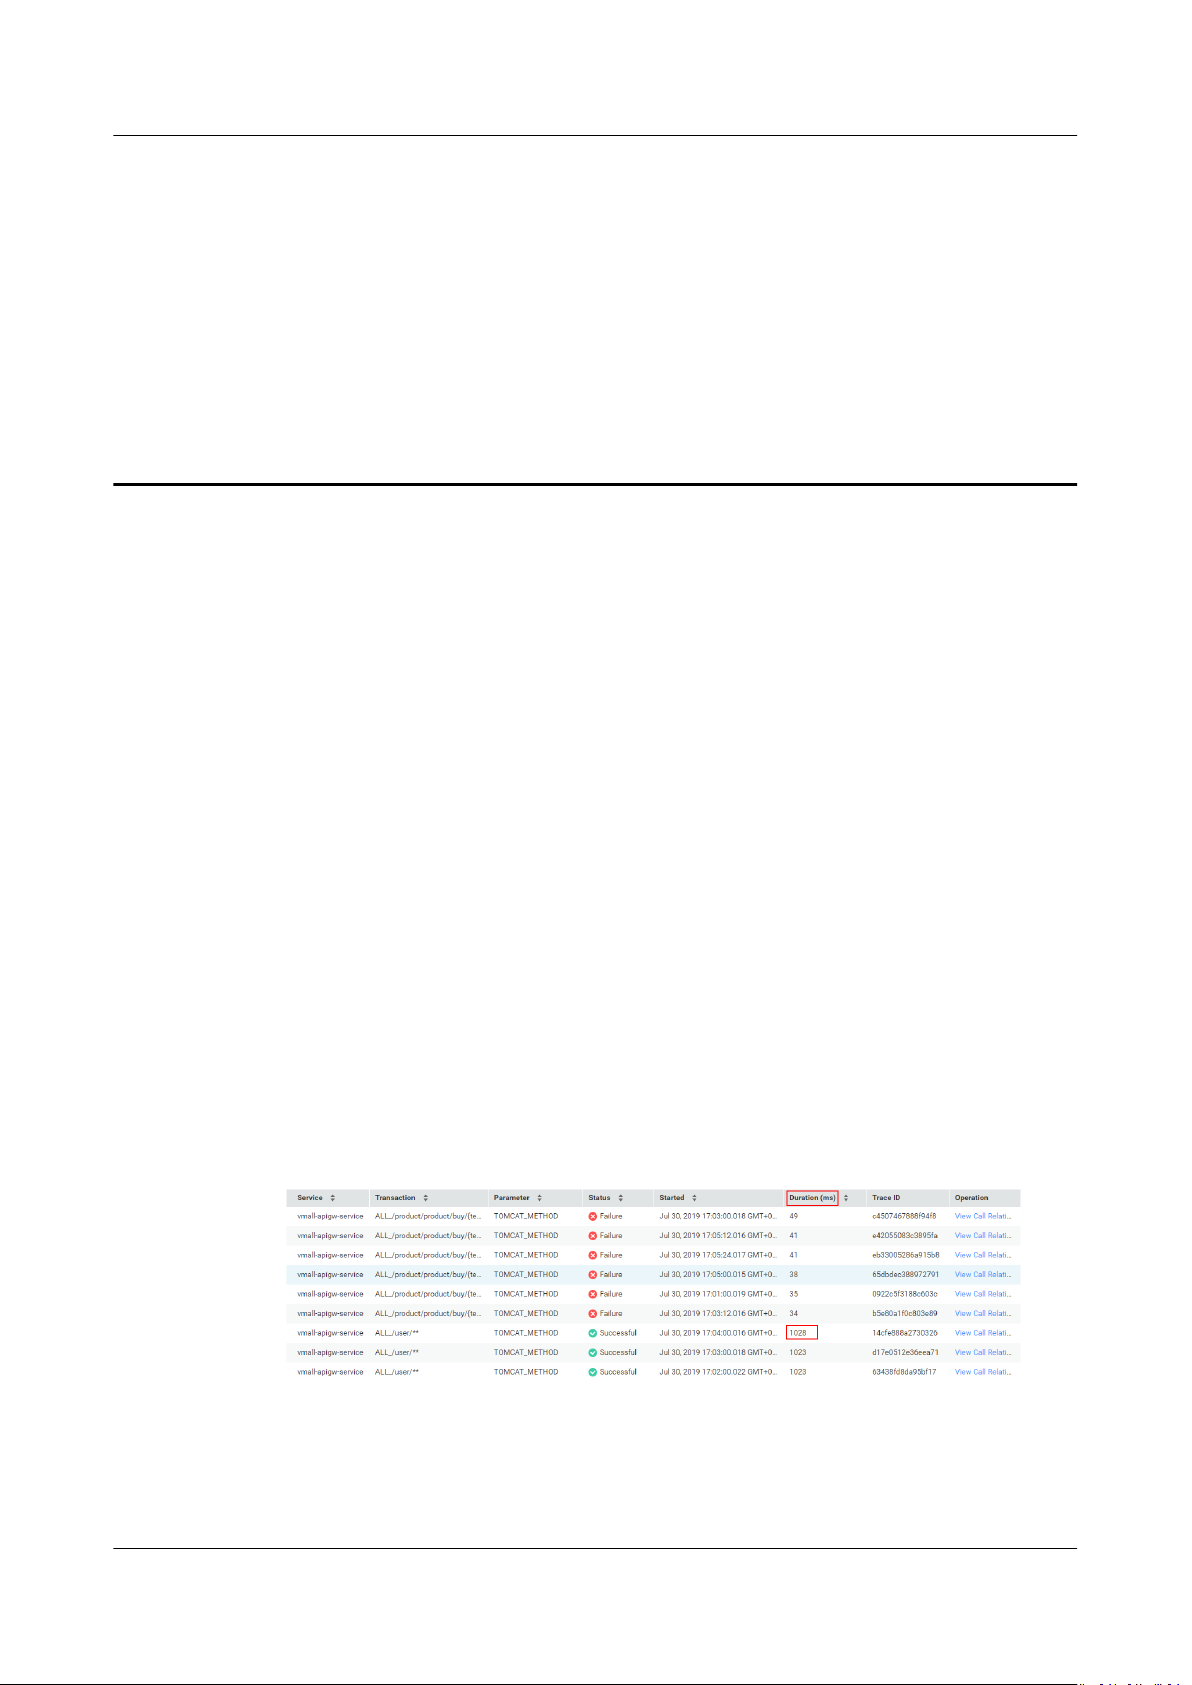
Step 4 (Optional) On the Call Chain page, click Advanced in the upper right corner, set
lter criteria, and click Search.
Step 5 Identify a service with long call duration and then locate the performance
bottleneck.
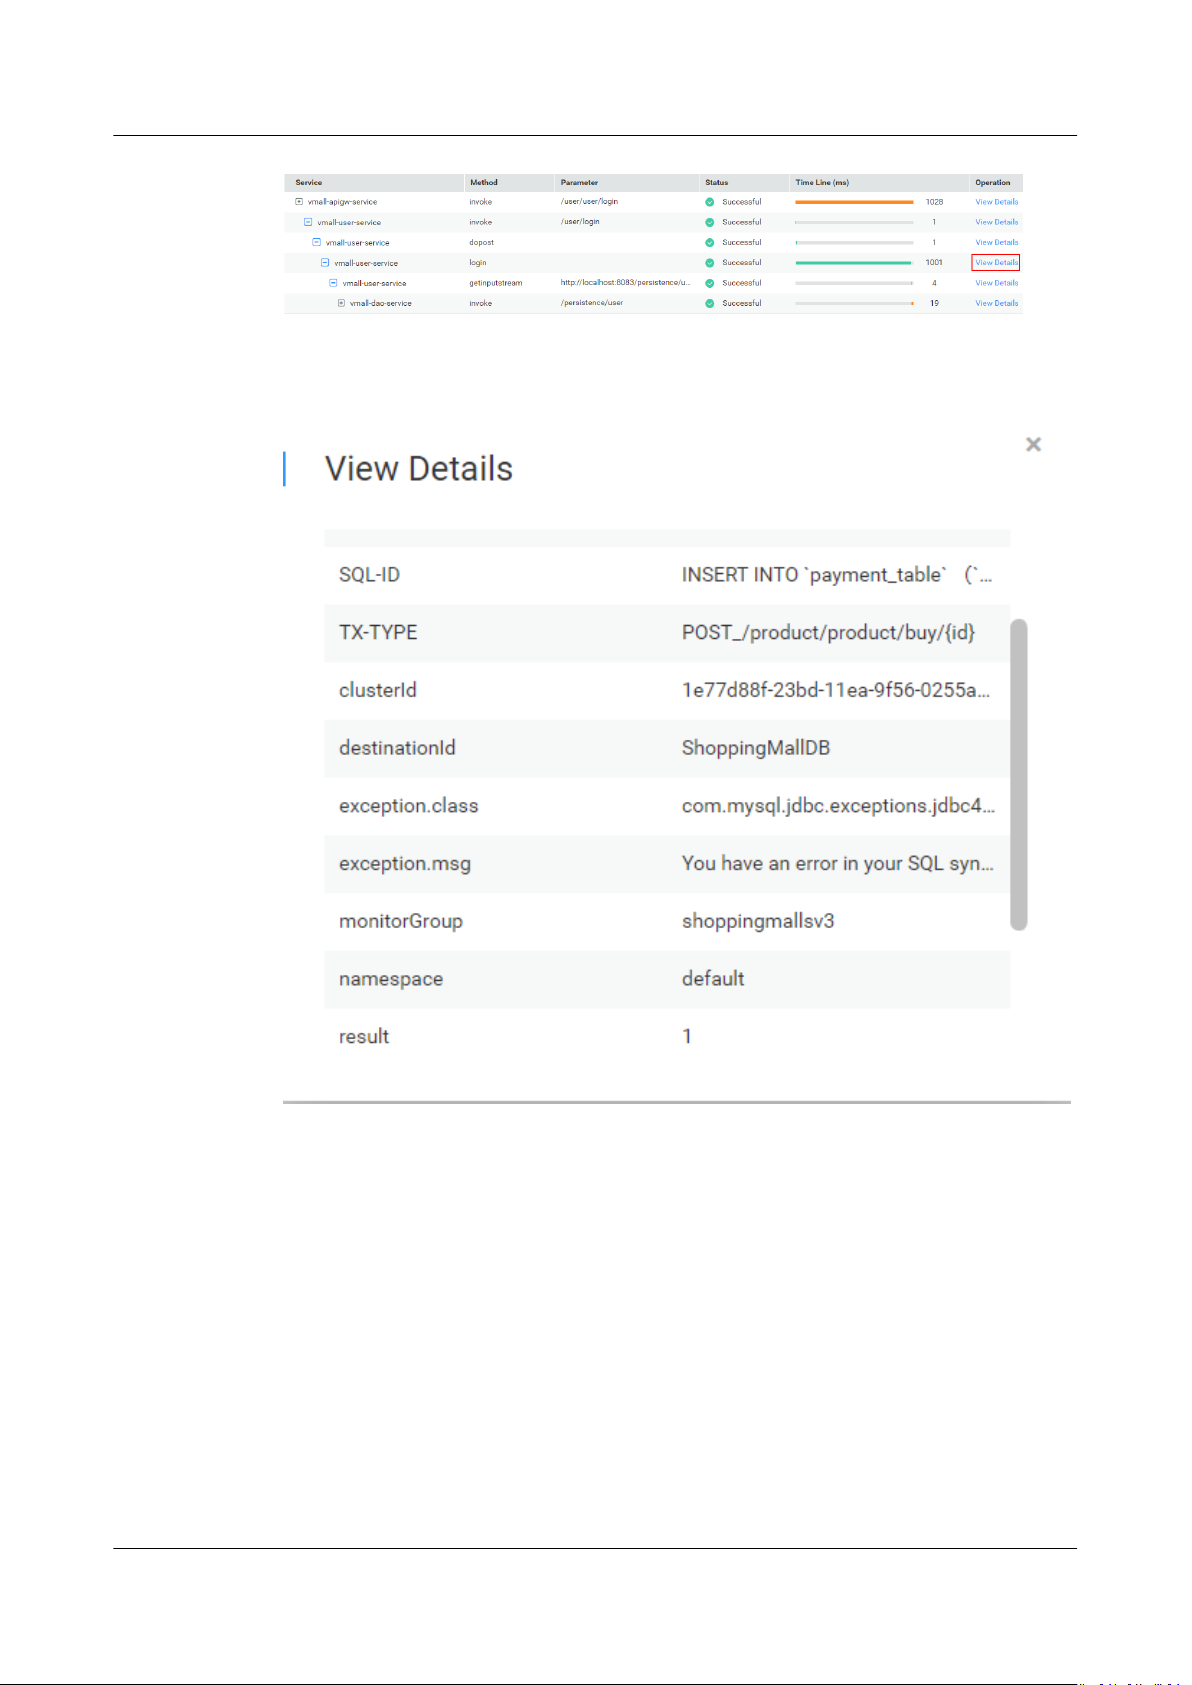
Step 6 Click View Call Relationship in the Operation column of the target service.
Step 7 (Optional) View additional information to further locate the cause.
Issue 01 (2021-01-05) Copyright © Huawei Technologies Co., Ltd. 11
Page 15
APM
User Guide 5 Tracing
On the call relationship page that is displayed, click View Details in the
Operation column to view call details.
----End
Locating Faults
Step 1 Log in to the APM console.
Step 2 In the navigation pane, choose Tracing > Call Chain.
Step 3 In the upper right of the Call Chain page, select the desired time range,
application, and service from three drop-down lists, and click Search.
Step 4 (Optional) On the Call Chain page, click Advanced in the upper right corner, set
lter criteria, and click Search.
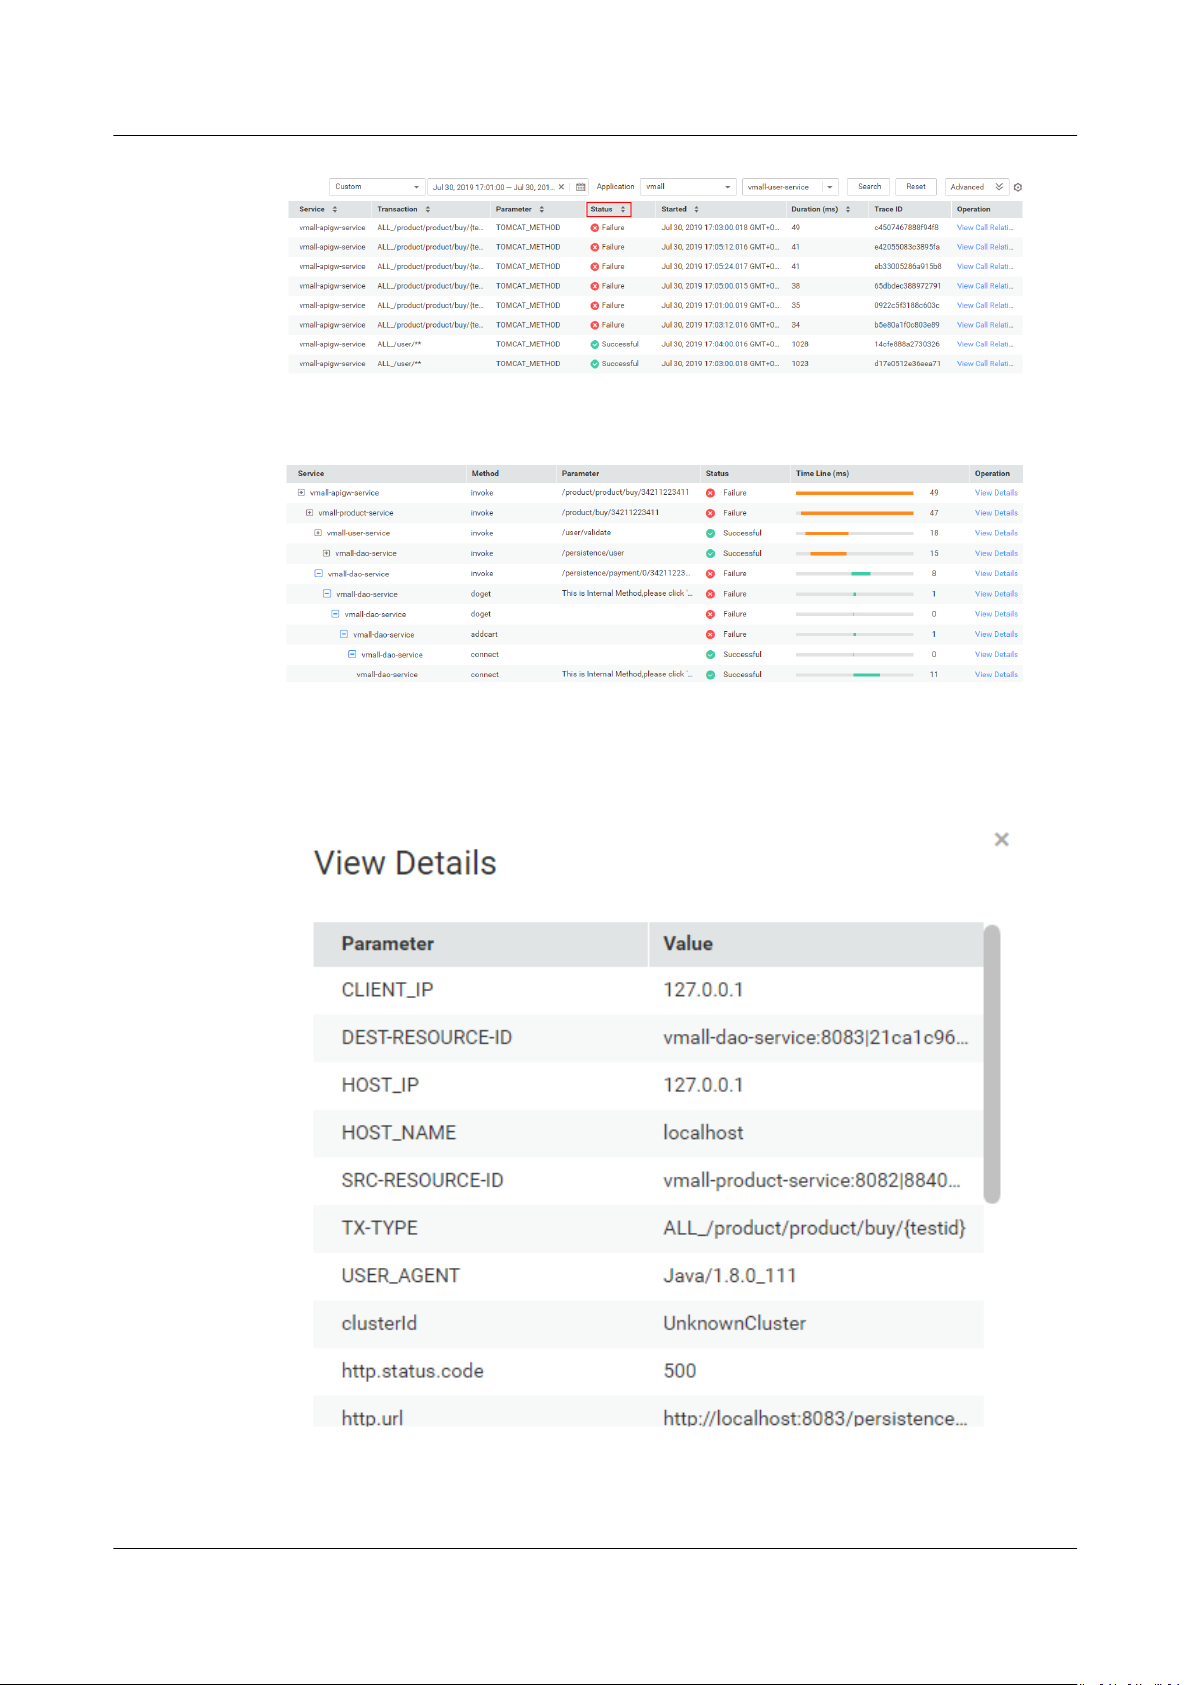
Step 5 Check the service status in the Status column and
Issue 01 (2021-01-05) Copyright © Huawei Technologies Co., Ltd. 12
nd out the faulty service.
Page 16
APM
User Guide 5 Tracing
Step 6 Click View Call Relationship in the Operation column, check whether the return
value is normal, and locate the fault.
Step 7 (Optional) View additional information to further locate the cause.
On the call relationship page that is displayed, click View Details in the
Operation column to view call details.
----End
Issue 01 (2021-01-05) Copyright © Huawei Technologies Co., Ltd. 13
Page 17

NO TE
APM
User Guide 5 Tracing
5.2 Method Tracing
Method tracing is used to dynamically trace a method of a class. When the
method of this class is called, Application Performance Management (APM)
collects the call data of the method based on
using probes, and displays the call data on the Call Chain page. Method tracing is
used to help application developers locate method-level performance problems
online.
APM traces the APIs of most third-party open-source components, but does not
specic methods in your applications. To monitor important methods in
trace
applications or methods of some third-party open-source components that are not
supported by APM, you need to customize method tracing. After the conguration
is complete, you can view the call data of the method on the Call Chain page.
Step 1 Log in to the APM console.
Step 2 In the navigation pane, choose Tracing > Method Tracing.
Step 3 Customize a method tracing rule and start method tracing.
congured method tracing rules
On the Method Tracing page, click Add Method Tracing Rule, set parameters,
and click OK.
● If Method Parameter is not set, all information about the methods using the same
name is collected by default.
● If Value is not set, the values of methods are not
● If Collect Method Stack Info is enabled, the call stack information about methods is
collected.
● If Collect All Matched Call Info is enabled, all tracing method information is collected.
If this function is disabled, tracing method information is collected based on the
sampling ratio set during Collection
Conguration.
ltered during collection.
Step 4 Preliminarily locate service performance problems based on the displayed call
duration and status.
Issue 01 (2021-01-05) Copyright © Huawei Technologies Co., Ltd. 14
Page 18

APM
User Guide 5 Tracing
Step 5 Click View Call Relationship in the Operation column to view the method-level
call relationships.
----End
Issue 01 (2021-01-05) Copyright © Huawei Technologies Co., Ltd. 15
Page 19
APM
User Guide 6 Transactions
6 Transactions
A transaction is usually an HTTP request. The process is as follows: user request >
web server > database > web server > user request. In real life, a transaction is a
one-time task. A user completes a task by using an application. In the example of
an e-commerce application, querying a commodity is a transaction, and making a
payment is also a transaction.
To complete a transaction, you may call multiple services. Any slow or error call
may lead to slow responses. During routine O&M, you can analyze the
transactions with slow responses to locate and solve application problems, thereby
improving user experience.
Transaction Insights Page
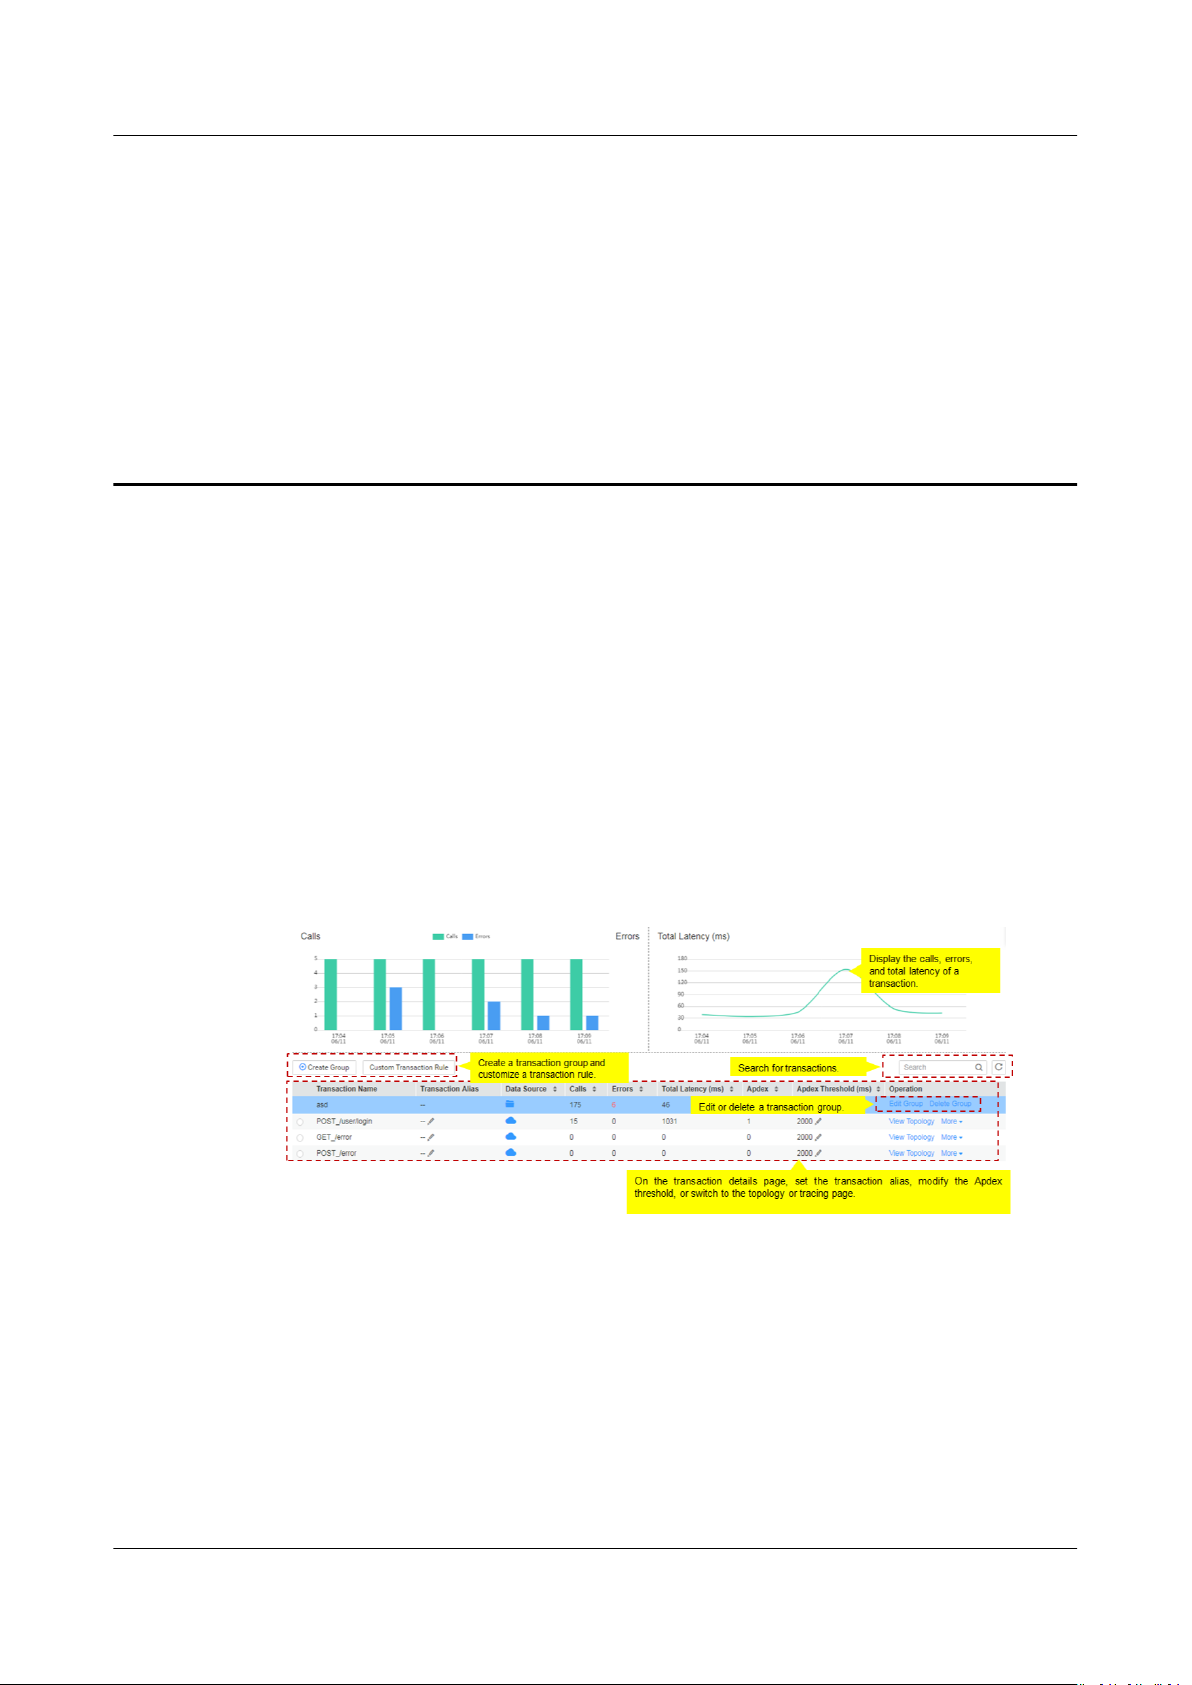
Figure 6-1 Transaction insights page
1. Set a time range to view the following transaction details of an application:
– Calls and errors
– Total latency
2. Click Create Group, select a transaction to move it to the new group, and
then name the group.
3. Click View Topology to view the topology of the transaction.
4. Click More in the Operation column and select View Call Relationship from
the drop-down list to view the tracing data of the transaction.
Issue 01 (2021-01-05) Copyright © Huawei Technologies Co., Ltd. 16
Page 20

APM
User Guide 6 Transactions
Analyzing Faults Based on Transactions
The following describes how to analyze a transaction with an extremely slow
response:
Step 1 Log in to the APM console.
Step 2 In the navigation pane, choose Transactions.
Step 3 On the Transactions page, select a transaction with an extremely slow response
from the transaction list.
Step 4 Click View Topology in the Operation column to view the topology and instance
details of the transaction.
Step 5 Right-click an instance with an extremely slow response and choose Find Call-
Chain from the shortcut menu. On the page that is displayed, further locate the
fault based on call duration and other parameters.
----End
Customizing Transactions
To precisely
customize transactions and classify requests into dierent transactions. When the
collector receives requests, custom transactions will be calculated
Step 1 On the Transactions page, click Custom Transaction Rule. A transaction consists
of the request method and regular expression. It is in the format of {Request
Method}_/{pattern}. Example: When the request methods are GET and POST and
the regular expression is /{name}, the transaction is GET,POST_/{name}.
dene transactions and collect tracing data, use the URI template to
rst.
Issue 01 (2021-01-05) Copyright © Huawei Technologies Co., Ltd. 17
Page 21

NO TE
APM
User Guide 6 Transactions
Step 2 Select one or more request methods. Request methods include GET, PUT, DELETE,
POST, HEAD, CONNECT, OPTIONS, PATCH, TRACE, and Select all. Select all
indicates all request methods.
Step 3 In the Regular Expression text box, enter a transaction rule and click OK. In this
way, the custom transaction rule is added successfully.
The regular expression uses the URI template matching mode of the Spring MVC
framework. Example: @RequestMapping(path="/owners/{ownerId}/pets/{petId}",
method=RequestMethod.GET), where ownerId and petId are variables.
To add multiple custom transaction rules, click Add Rule.
● A transaction rule must be 1 to 50 characters long. It must start with a slash (/) but
cannot end with a slash. Only letters, digits, and special characters (?*|={}&) are allowed.
● Both the question mark (?) and asterisk (*) can be used for fuzzy search. One question
mark represents one character, one asterisk represents 0 to N characters between two
slashes in a URI, and double asterisks represent
enter /rst/*, /rst/test can be returned but /rst/test/test cannot. When you enter /
rst/**, both /rst/test and /rst/test/test can be returned.
innite characters. Example: When you
----End
Issue 01 (2021-01-05) Copyright © Huawei Technologies Co., Ltd. 18
Page 22
APM
User Guide 7 SQL Analysis
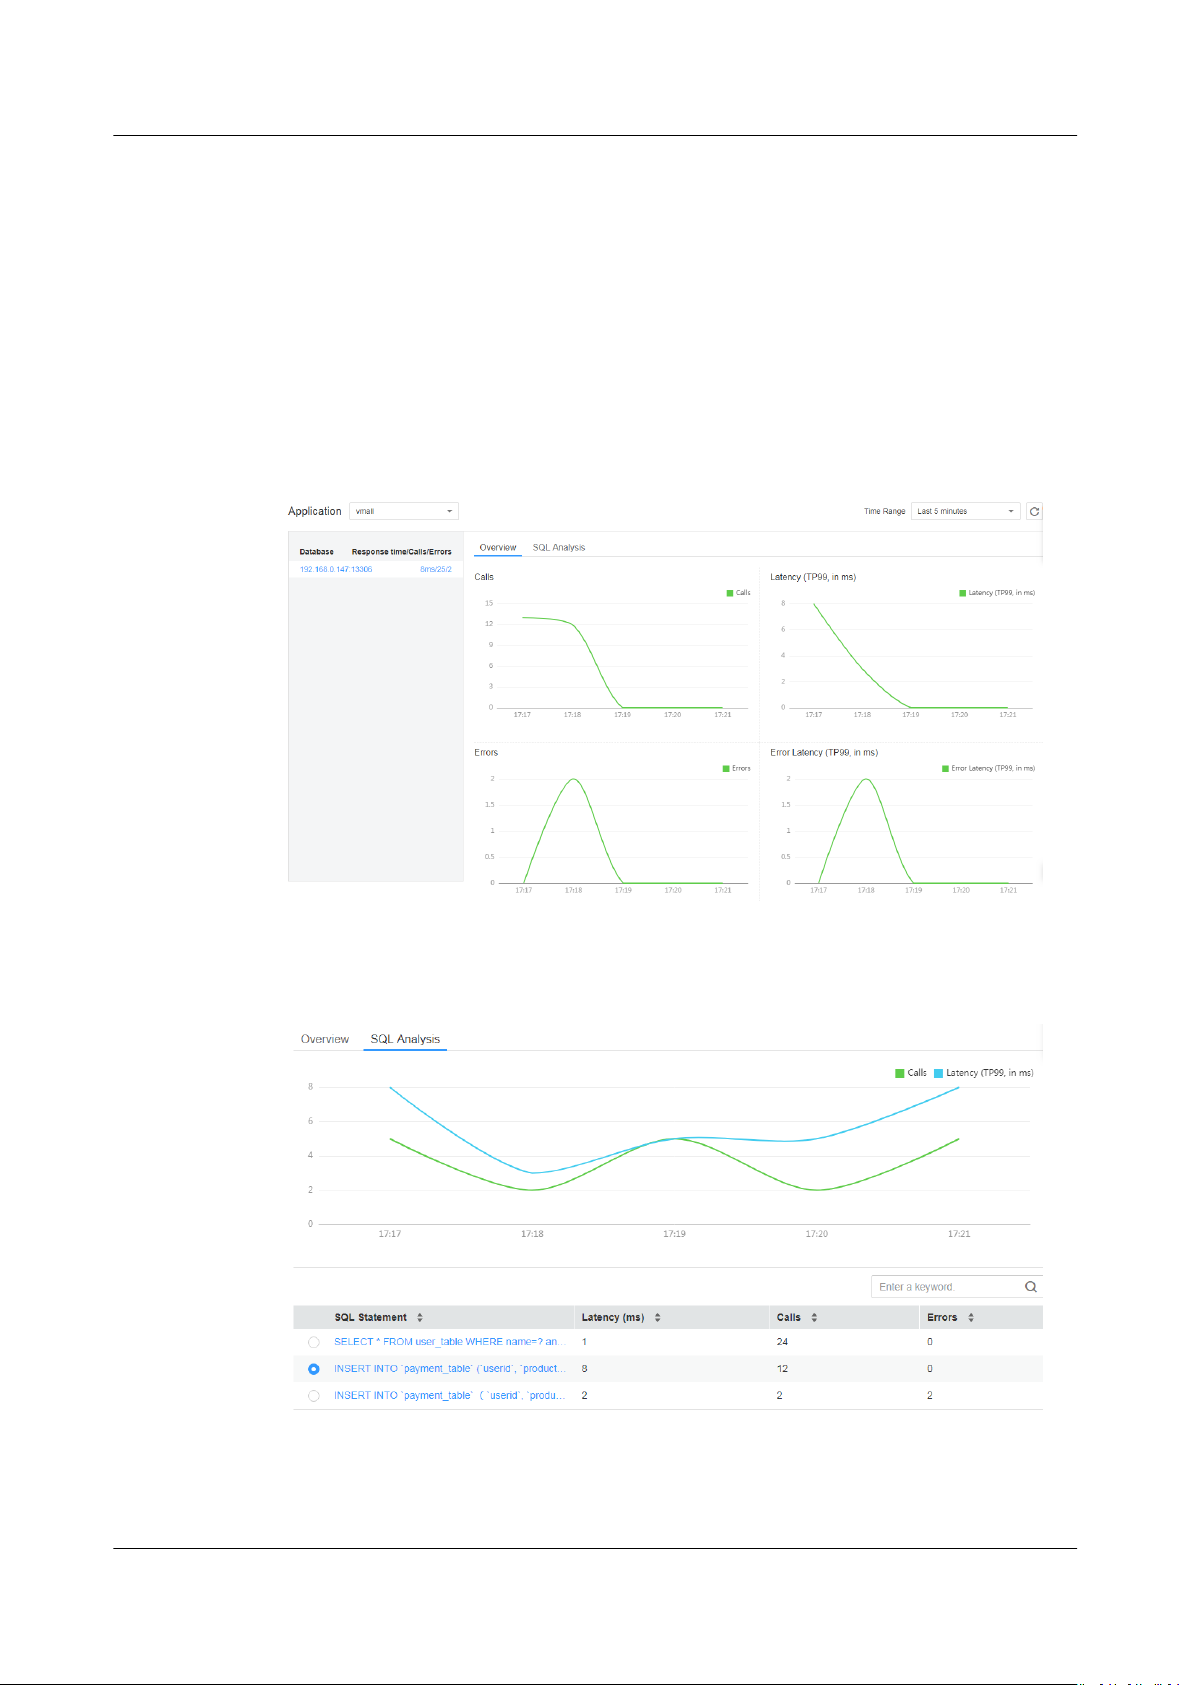
7 SQL Analysis
Application Performance Management (APM) displays key metrics, such as SQL
statement calls, response time, and errors for analyzing database performance
problems caused by slow or error SQL statements. SQL analysis supports MySQL,
Oracle, and PostgreSQL relational databases only.
SQL Page
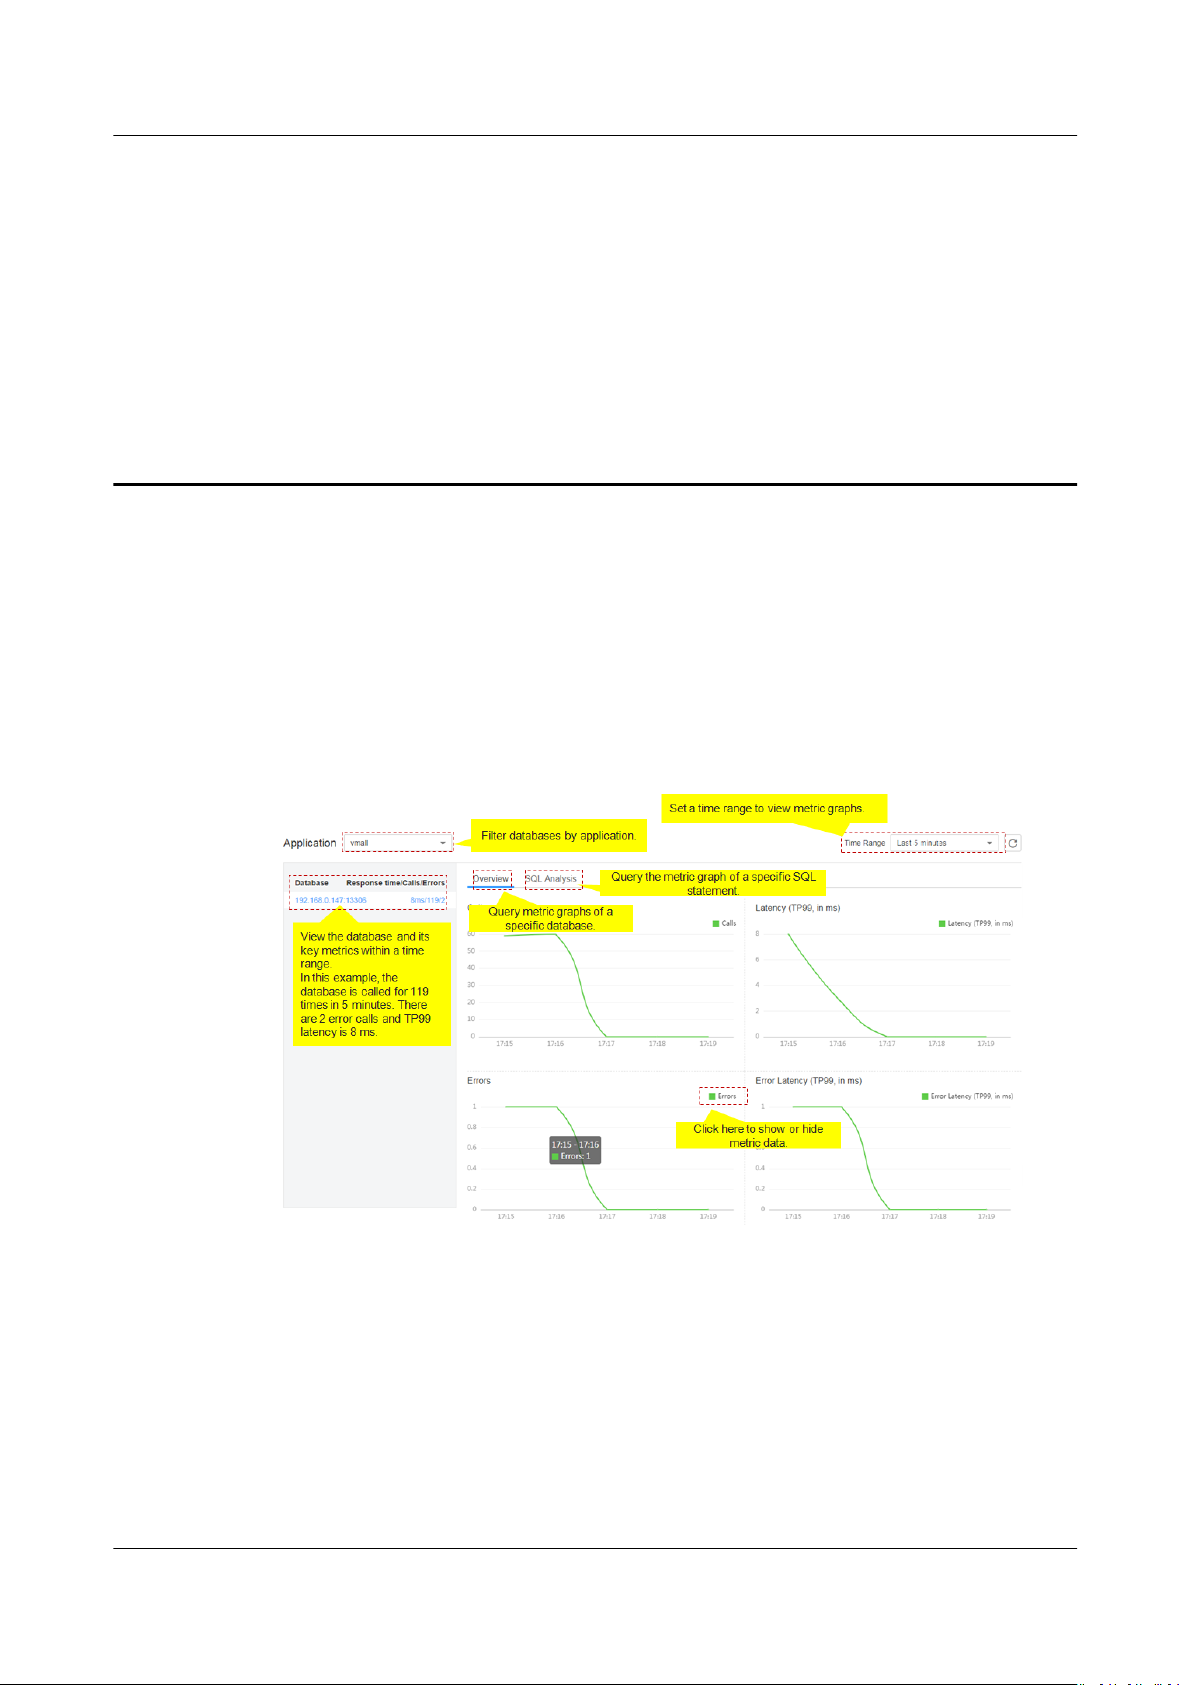
Figure 7-1 SQL page
Analyzing Abnormal SQL Statements
When an SQL statement of a database is abnormal, performance problems such
as service timeout may occur. During routine O&M, you can monitor key metrics,
such as error duration and latency of databases, locate the SQL statements that
take a long time to execute, operate at low
then analyze and optimize them.
The SQL analysis function determines whether to collect SQL data. Before
performing the following operations, ensure that this function is enabled.
Issue 01 (2021-01-05) Copyright © Huawei Technologies Co., Ltd. 19
eciency, or fail to be called, and
Page 23
APM
User Guide 7 SQL Analysis
Otherwise, no SQL data can be queried. This function is enabled by default. If it is
disabled, choose Agent > Conguration in the navigation pane and then enable
it.
Step 1 Log in to the APM console.
Step 2 In the navigation pane, choose SQL Analysis.
Step 3 On the SQL Analysis page, select the time range during which a problem
occurred.
Step 4 On the Overview tab page, locate the faulty database in the application based on
key metrics. If a database requires long response time and has many call errors,
performance problems may occur.
Step 5 Analyze the problem cause.
Click the SQL Analysis tab, and locate the abnormal SQL statement in the SQL
statement list.
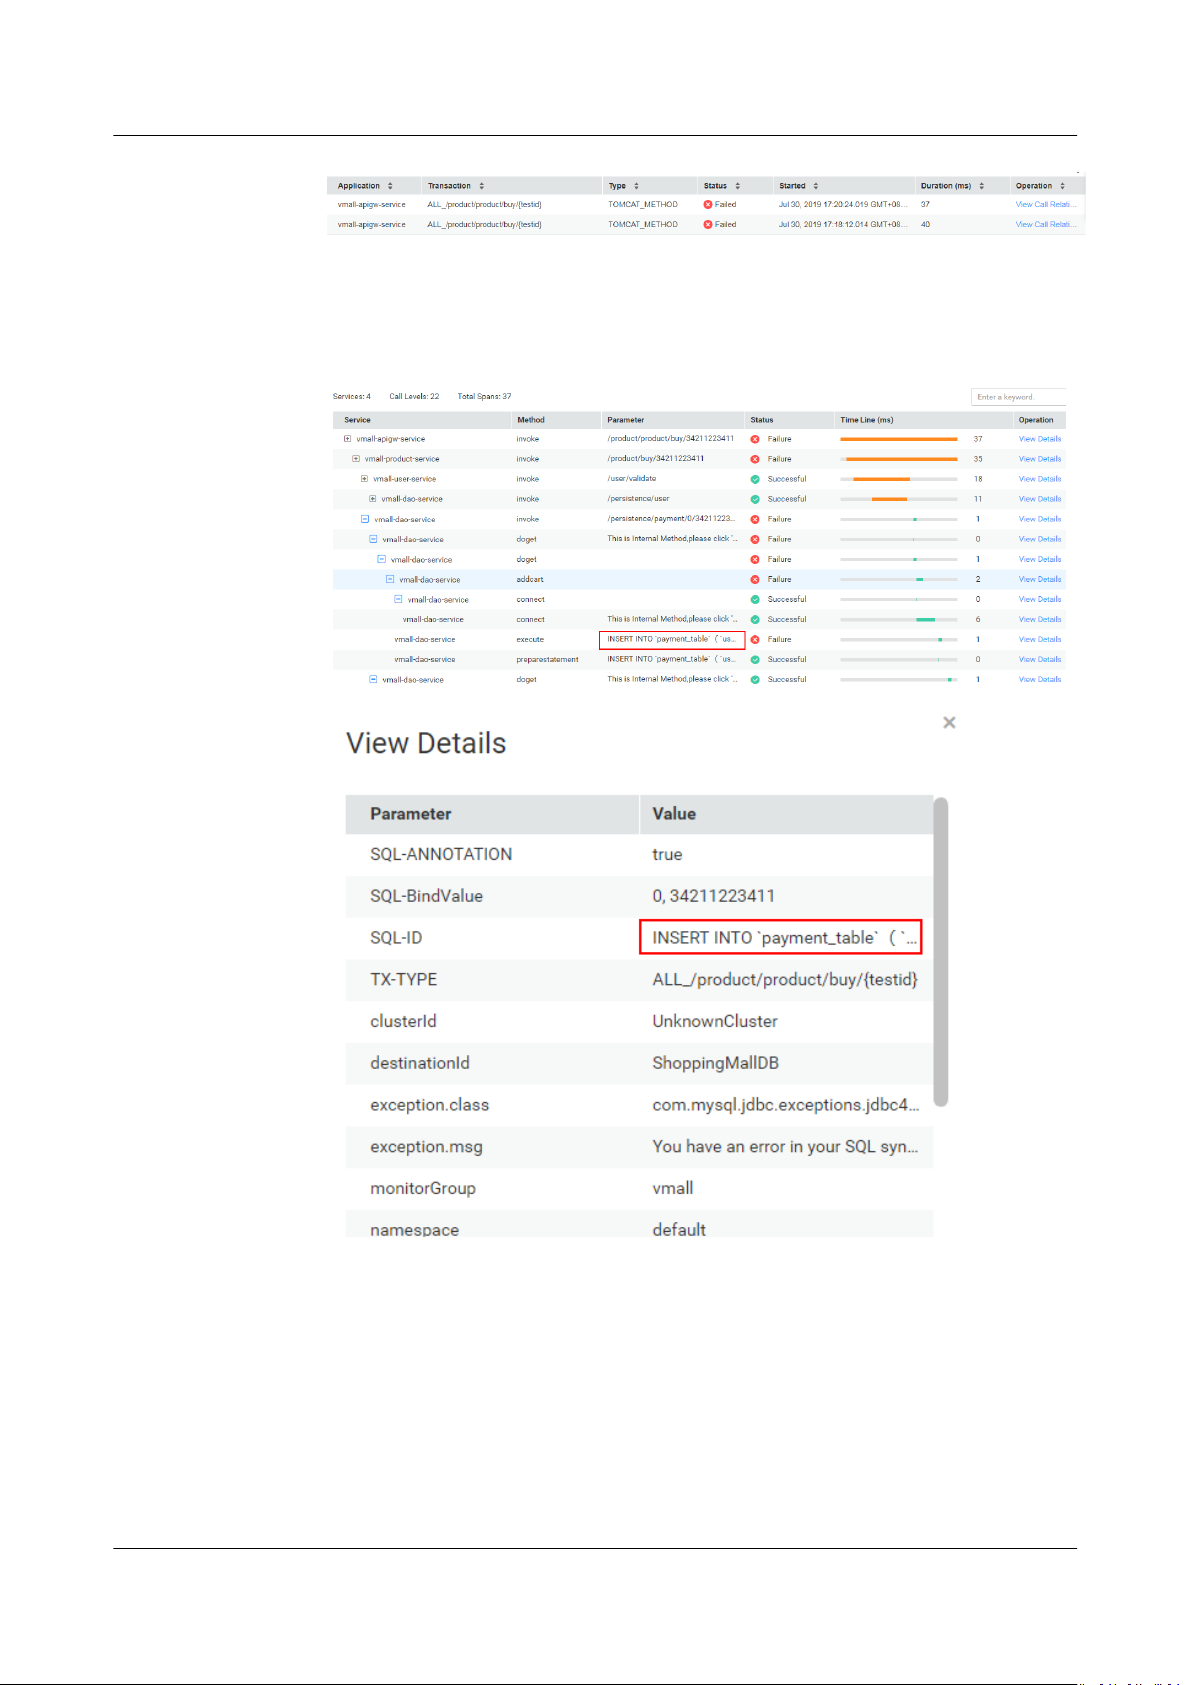
Step 6 Further analyze the cause.
1. Click the abnormal SQL statement to go to the Call Chain page and check
the impact of this statement on the entire service.
Issue 01 (2021-01-05) Copyright © Huawei Technologies Co., Ltd. 20
Page 24
APM
User Guide 7 SQL Analysis
2. Click View Call Relationship in the Operation column to nd out the
method of the abnormal SQL statement. Analyze the cause of the abnormal
SQL statement in this method. For example, check whether the index is used,
data volume is overlarge, syntax is correct, or deadlock occurs. Then, optimize
the SQL statement accordingly.
----End
Issue 01 (2021-01-05) Copyright © Huawei Technologies Co., Ltd. 21
Page 25
APM
User Guide 8 JVM Monitoring
8 JVM Monitoring
JVM monitoring displays the memory and thread metrics of the JVM running
environment based on Java applications. You can monitor metric trends in real
time for performance analysis.
On the Memory and Thread tab pages, you can respectively view the memory
and thread graphs to quickly locate problems such as memory leakage and thread
exceptions.
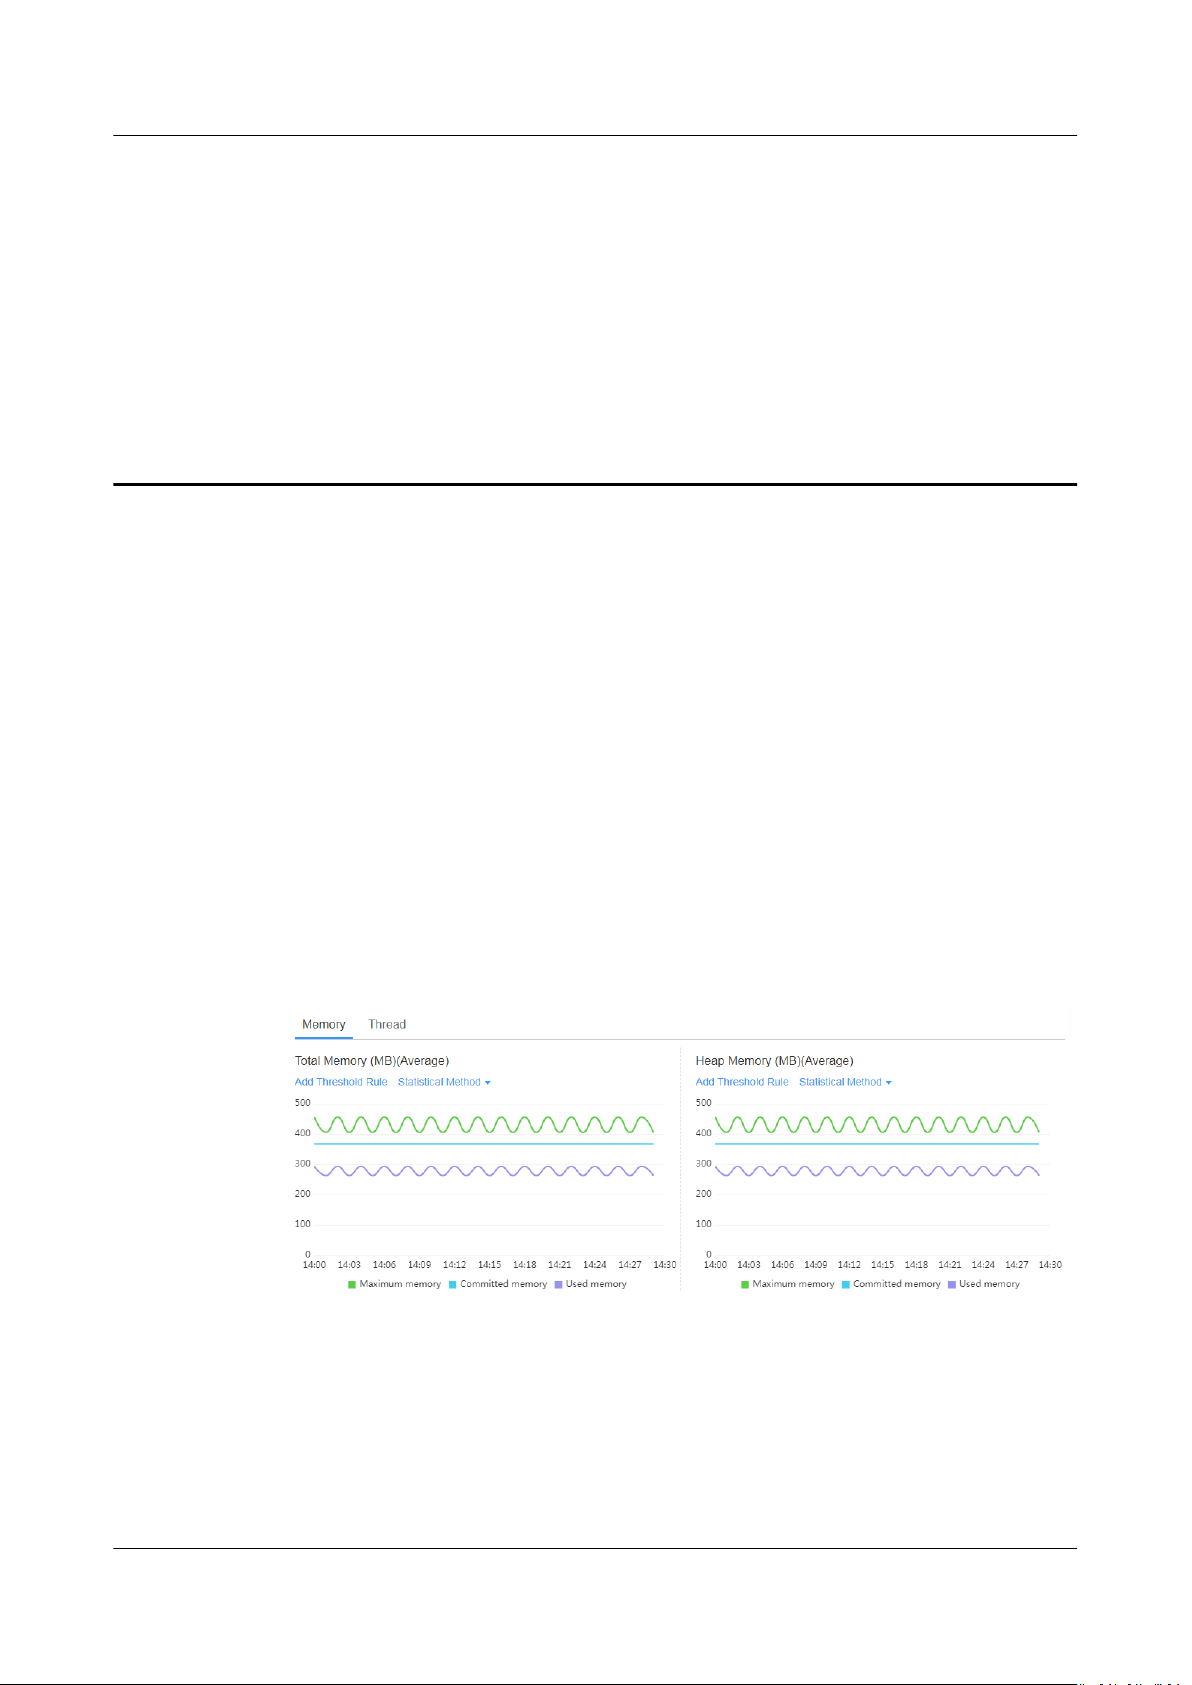
Memory Graphs
As shown in Figure 8-1, in a selected time range, the trends of the maximum,
committed, and used memory in
memory, heap memory, and non-heap memory spaces) of an instance are
displayed. In addition, the garbage collection (GC) duration and times are also
displayed.
Figure 8-1 Memory graphs
JVM memory
dierent JVM memory spaces (such as the total
JVM memory consists of heap and non-heap memory.
● Heap memory: A heap is the data area where the JVM is running. It allocates
memory for all instances and arrays. Heap memory of objects is reclaimed by
an automatic memory management system called garbage collector. Heap
space consists of eden space, survivor space, and tenured space.
Issue 01 (2021-01-05) Copyright © Huawei Technologies Co., Ltd. 22
Page 26

APM
User Guide 8 JVM Monitoring
● Non-heap memory: Memory (excluding heap memory) managed by JVM.
Non-heap space consists of code cache and permanent space (or meta
space).
Java heap is the main area managed by the garbage collector. It is also called
garbage collection heap. GC mode includes full GC and minor GC.
Table 8-1 Memory spaces
Space
Description
Name
Eden
Initially allocates memory from the thread pool to most objects.
space
Survivor
Stores the eden space's objects that are not reclaimed during GC.
space
Tenured
space
Code
Maintains objects that have been stored in the survivor space for a
period of time.
Compiles and stores local code.
cache
Permanent
Stores static data of VMs, for example, classes and method objects.
space
Meta
space
Direct
Stores local class metadata. In versions later than Java 8,
permanent space is replaced by meta space.
Resource usage of the direct buer is monitored.
Buer
Full GC Indicates the GC performed in the entire heap space (covering
young-, old-, and permanent-generation spaces) when the
memory space is still insucient after memory reclamation.
Minor GC Indicates the GC performed in the young-generation space
(including eden and survivor spaces) when the allocated memory
is insucient.
JVM collects garbage based on generations. JVM heap space is divided into oldand young-generation spaces. More than 90% objects that exist only for a short
period of time are stored in the young-generation space, whereas objects that
have long life cycles are stored in the old-generation space. Young-generation
space is further divided into eden space and two survivor spaces. New objects are
initially allocated to the eden space. The survivor spaces are used as the
buer
between eden space and tenured space. Objects that are survived after several
rounds of GC in the survivor spaces are then transferred to the old-generation
space, as shown in Figure 8-2.
Issue 01 (2021-01-05) Copyright © Huawei Technologies Co., Ltd. 23
Page 27

NO TE
APM
User Guide 8 JVM Monitoring
Figure 8-2 Memory spaces
Thread Graphs
There are two survivor spaces, which are represented by from and to pointers. The to
pointer points to the empty survivor space.
As shown in Figure 8-3, in a selected time range, the trends of new, runnable,
blocked, and waiting threads are displayed.
Figure 8-3 Thread graphs
Issue 01 (2021-01-05) Copyright © Huawei Technologies Co., Ltd. 24
Page 28

APM
User Guide 8 JVM Monitoring
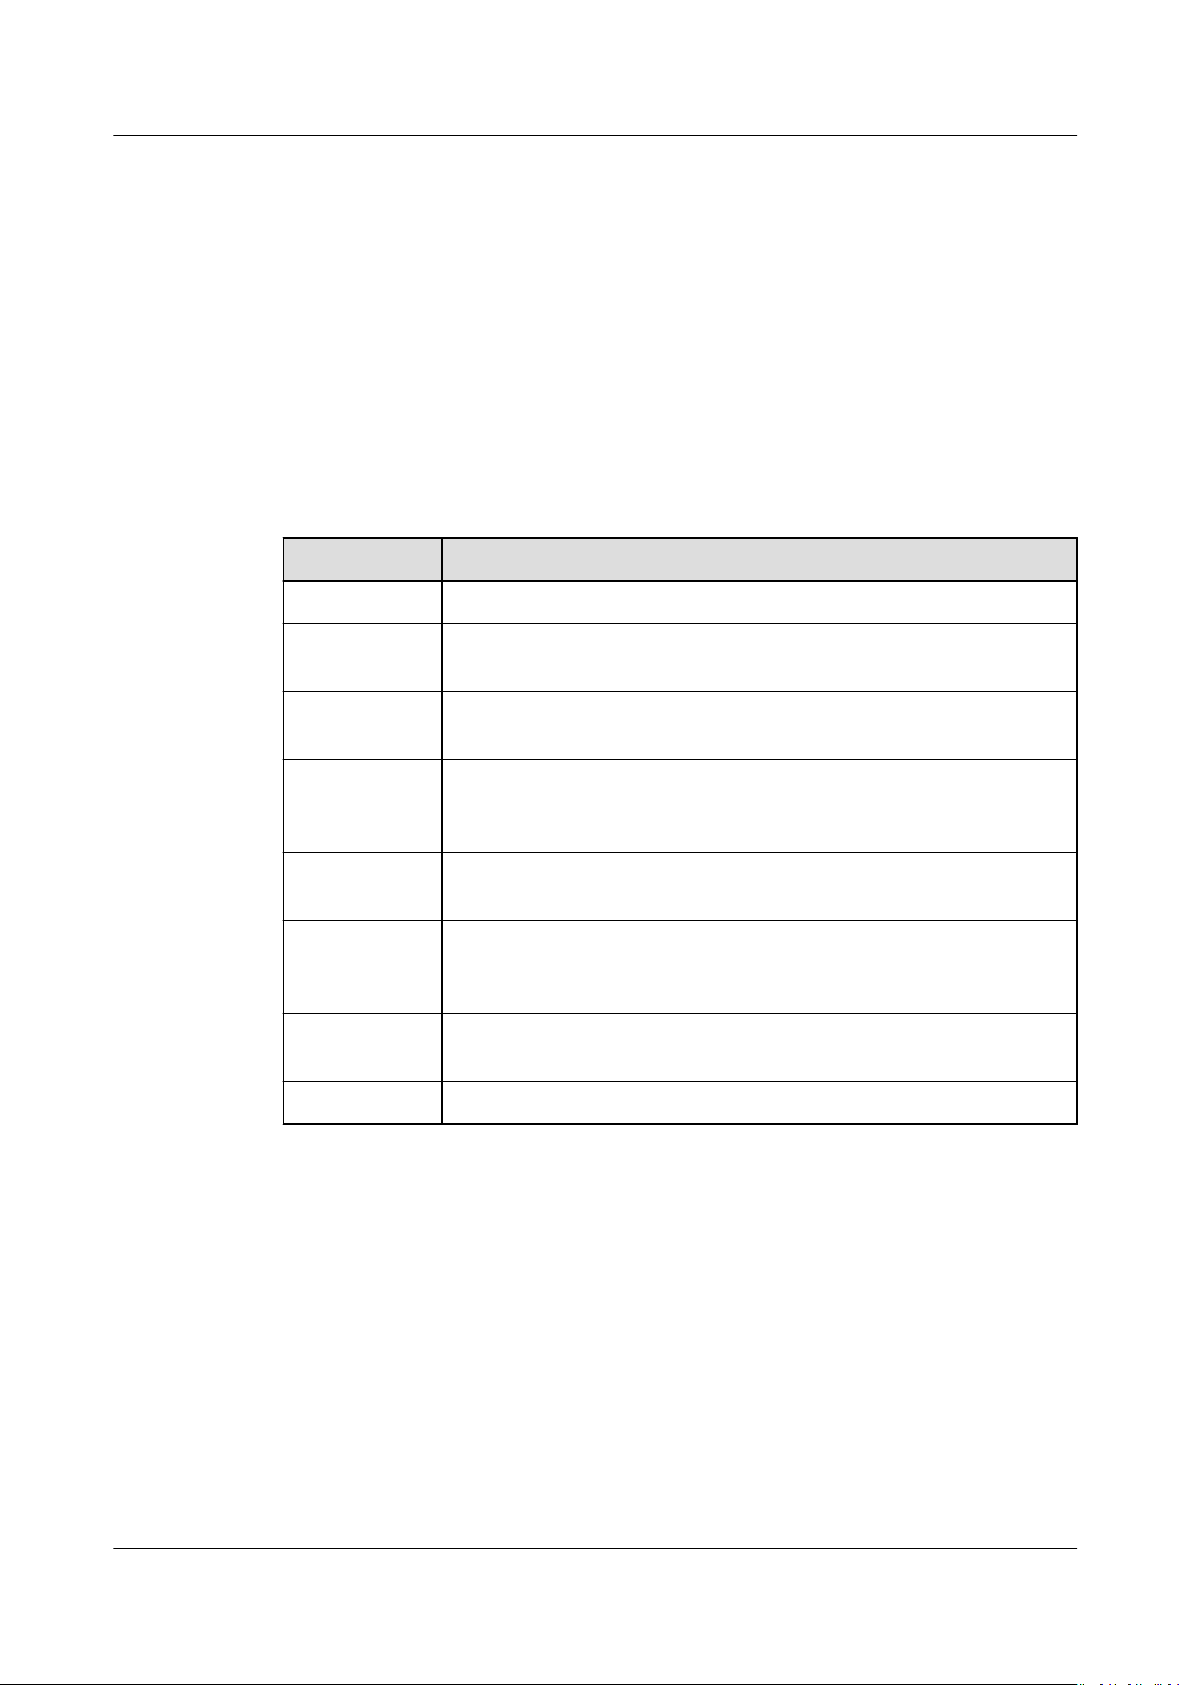
Table 8-2 Threads
Thread
Name
Total threads Both active and standby threads are included. Sticky threads
Deadlock
threads
New threads Number of threads that are newly created.
Runnable
threads
Blocked
threads
Waiting
threads
Timed
waiting
threads
Description
and dedicated threads become standby threads after being
executed.
When two or more threads encounter resource conicts or the
communication between them is abnormal, the system enters
the deadlock state.
Number of threads that can run.
Number of threads that are blocked.
Number of threads that are in the waiting state.
Number of threads that are waiting for another thread to
perform an action for a specied waiting time.
Terminated
threads
Max
connections
Current
connections
Max threads Maximum number of threads that can be executed on Tomcat.
Current
threads
Busy threads Number of threads executed on Tomcat for processing tasks.
Adding a Threshold Rule
You can add threshold rules for all JVM memory and thread metrics. When the
rules are met, alarms are reported, altering you to risks.
Step 1 On the JVM Monitoring page, select an application in the upper left corner, and
then select an instance.
Number of threads that are terminated.
Maximum number of connections that are supported by
Tomcat.
Number of connections that are being occupied on Tomcat.
Number of threads that are being executed on Tomcat.
Step 2 In the trend graph of a memory or thread metric on the right, set a threshold rule.
Specically, click Add Threshold Rule on the top of the trend graph.
Issue 01 (2021-01-05) Copyright © Huawei Technologies Co., Ltd. 25
Page 29

NO TE
APM
User Guide 8 JVM Monitoring
Step 3 Set rule parameters and click Submit, as shown in the following gure. If you
want to receive alarm notications, select Yes when setting Send Notication and
then select a topic.
Description of the Add For Service parameter:
● If this parameter is set to Yes, the threshold rule is applied to the entire service.
● If this parameter is set to No, the threshold rule is applied to a single instance.
Issue 01 (2021-01-05) Copyright © Huawei Technologies Co., Ltd. 26
Page 30

APM
User Guide 8 JVM Monitoring
----End
Issue 01 (2021-01-05) Copyright © Huawei Technologies Co., Ltd. 27
Page 31

APM
User Guide 9 ICAgent Installation and Conguration
9 ICAgent Installation and Conguration
9.1 Agent Management (HUAWEI CLOUD Host)
9.1.1 Installing the ICAgent (Linux)
Prerequisites
Before installing the ICAgent, ensure that the time and time zone of the local
browser are consistent with those of the desired server. If multiple servers are
deployed, ensure that the local browser and multiple servers use the same time
zone and time. Otherwise, the application topology and tracing data on the
console may be incorrect.
Installation Methods
There are two methods to install the ICAgent. The two methods are not applicable
to container nodes created using ServiceStage, or Cloud Container Engine (CCE).
To monitor container nodes through Application Performance Management
(APM), see APM Getting Started. Table 9-1 lists the ICAgent installation
methods.
Table 9-1 Installation methods
Method
Initial
installation
Application Scenario
This installation method is used when the following conditions
are met:
1. An Elastic IP Address (EIP) has been bound to the server. For
details, see Assigning an EIP and Binding It to an ECS.
2. The ICAgent has never been installed on the server.
Issue 01 (2021-01-05) Copyright © Huawei Technologies Co., Ltd. 28
Page 32

NO TE
APM
User Guide 9 ICAgent Installation and Conguration
Method Application Scenario
Inherited
installation
Initial Installation
After you apply for a server on the cloud and install the ICAgent in the Linux
environment, perform the following operations:
Step 1 Obtain an Access Key ID/Secret Access Key (AK/SK) by using either of the
following methods:
● Obtain a temporary AK/SK by creating an agency. For details, see How Do I
This installation method is used when the following conditions
are met:
You have multiple servers on which the ICAgent is to be
installed. One server is bound to an EIP, but others are not
bound to an EIP. The ICAgent has been installed on the server
bound to an EIP. You can use this method to install the ICAgent
on the servers that are not bound to an EIP.
Obtain the AK/SK by Creating an Agency?.
For each ECS server where the ICAgent is to be installed, you need to bind it to an
agency on the ECS console. The agency relationship takes eect 5 minutes later.
● Obtain a permanent AK/SK by adding access keys. For details, see How Do I
Obtain the AK/SK and Project ID?.
Step 2 Log in to the APM console. In the navigation pane, choose Agent > Management.
Step 3 Click Install ICAgent. On the page that is displayed, set Host to HUAWEI CLOUD
host and OS to Linux.
Step 4 Generate the ICAgent installation command and copy it.
● As shown in Figure 9-1, if you have obtained the permanent AK/SK, set
Installation Mode to Obtain AK/SK and enter the AK/SK in the text box to
generate the ICAgent installation command. Then, click Copy Command.
Figure 9-1 Entering the AK/SK
Issue 01 (2021-01-05) Copyright © Huawei Technologies Co., Ltd. 29
Page 33

NO TE
NO TE
NO TE
APM
User Guide 9 ICAgent Installation and Conguration
Ensure that the AK/SK are correct. Otherwise, the ICAgent cannot be installed.
● If you have obtained the temporary AK/SK, set Installation Mode to Create
Agency and click Copy Command to copy the ICAgent installation command.
Step 5 Use a remote login tool to log in to the server where the ICAgent is to be installed
as the root user and run the preceding command to install the ICAgent.
● If the message "ICAgent install success" is displayed, the ICAgent is successfully installed
in the /opt/oss/servicemgr/ directory. After the ICAgent is successfully installed, choose
Agent > Management in the navigation pane to view the ICAgent status.
● If the installation fails, uninstall the ICAgent according to Uninstalling the ICAgent
(Linux) and then install it again. If the problem persists, contact technical support.
----End
Inherited Installation
If the ICAgent has been installed on a server and the installation package
ICProbeAgent.tar.gz exists in the /opt/ICAgent/ directory of the server, use this
method to install the ICAgent on a remote server with a few clicks.
Step 1 Run the following command (
x.x.x.x
indicates the server IP address) on the server
where the ICAgent has been installed:
bash /opt/oss/servicemgr/ICAgent/bin/remoteInstall/remote_install.sh -ip
x.x.x.x
Step 2 Enter the password of the root user of the server where the ICAgent is to be
installed as prompted.
● If both the expect tool and ICAgent have been installed on a server, the ICAgent is
successfully installed on the remote server after the preceding command is run. If the
ICAgent has been installed on a server, but the expect tool has not, enter the
information as prompted.
● Ensure that the root user can run the SSH and SCP commands on the ECS server where
the ICAgent has been installed to communicate with the remote ECS server where the
ICAgent is to be installed.
● If the message "ICAgent install success" is displayed, the ICAgent is successfully installed
in the /opt/oss/servicemgr/ directory. After the ICAgent is successfully installed, choose
Agent > Management in the navigation pane to view the ICAgent status.
● If the installation fails, uninstall the ICAgent according to Uninstalling the ICAgent
(Linux) and then install it again. If the problem persists, contact technical support.
----End
Inherited Batch Installation
If the ICAgent has been installed on a server and the installation package
ICProbeAgent.tar.gz exists in the /opt/ICAgent/ directory of the server, use this
method to install the ICAgent on multiple remote ECS servers with a few clicks.
Issue 01 (2021-01-05) Copyright © Huawei Technologies Co., Ltd. 30
Page 34

NO TICE
NO TE
APM
User Guide 9 ICAgent Installation and Conguration
1. Ensure that you can run the SSH and SCP commands on the ECS server where
the ICAgent has been installed to communicate with the remote ECS servers
where the ICAgent is to be installed.
2. If you have installed the ICAgent in a server through an agency, you also need
to set an agency for other servers where the ICAgent is to be installed. For
details, see Creating an Agency.
3. Batch installation scripts depend on Python versions. You are advised to
implement batch installation on hosts running Python 2.x. Python 3.x does not
support batch installation.
Prerequisites
The IP addresses and passwords of all ECS servers where the ICAgent is to be
installed have been collected, sorted in the iplist.cfg le, and uploaded to
the /opt/ICAgent/ directory on the ECS server where the ICAgent has been
installed. As shown in the following example, each IP address and password in the
iplist.cfg
le must be separated by a space.
192.168.0.109 password
192.168.0.39 password
● Because the iplist.cfg le contains sensitive information, you are advised to clear it in
time.
● If the passwords of all servers are the same, you only need to list IP addresses in the
iplist.cfg le and enter the password once during execution. If the password of an IP
address is dierent from those of other IP addresses, you need to list both passwords
and IP addresses in the iplist.cfg
● The batch installation function depends on Python 2.7.*. If the system displays a
message indicating that Python cannot be found during the installation, install Python
2.7.* and try again.
(Enter the actual password.)
(Enter the actual password.)
le.
Procedure
Step 1 Run the following command on the server where the ICAgent has been installed:
bash /opt/oss/servicemgr/ICAgent/bin/remoteInstall/remote_install.sh -
batchModeCong
/opt/ICAgent/iplist.cfg
Enter the default password of the root user of the servers where the ICAgent is to
be installed as prompted. If the passwords of all IP addresses have been
congured in the iplist.cfg le, press Enter to skip this step. Otherwise, enter the
default password.
batch install begin
Please input default passwd:
send cmd to 192.168.0.109
send cmd to 192.168.0.39
2 tasks running, please wait...
2 tasks running, please wait...
2 tasks running, please wait...
End of install agent: 192.168.0.39
End of install agent: 192.168.0.109
All hosts install icagent
nish.
Issue 01 (2021-01-05) Copyright © Huawei Technologies Co., Ltd. 31
Page 35
APM
User Guide 9 ICAgent Installation and Conguration
Wait until the message "All hosts install icagent nish." is displayed, which
indicates that the ICAgent has been successfully installed on all the hosts listed in
the conguration le.
Step 2 After the ICAgent is successfully installed, choose Agent > Management in the
navigation pane to view the ICAgent status.
----End
ICAgent Statuses
The following table lists the ICAgent statuses.
Table 9-2 ICAgent statuses
Status Description
Running The ICAgent is running properly.
Uninstalled The ICAgent is not installed. For details about how to install the
ICAgent, see Installing the ICAgent (Linux).
Installing The ICAgent is being installed. This operation takes about 1
minute to complete.
Installation
failed
Upgrading The ICAgent is being upgraded. This operation takes about 1
Upgrade
failed
Oine The AK/SK or ECS agency congurations are incorrect. Ensure
Faulty The ICAgent is faulty. Contact technical support.
Failed to install the ICAgent. Uninstall the ICAgent according to
Uninstalling the ICAgent Through Logging In to a Server
and then install it again.
minute to complete.
Failed to upgrade the ICAgent. Uninstall the ICAgent according
to Uninstalling the ICAgent Through Logging In to a Server
and then install it again.
that such congurations are correct.
9.1.2 Upgrading the ICAgent (Linux)
To ensure better collection experience, Application Performance Management
(APM) will continuously upgrade ICAgent versions. When the Linux system
displays a message indicating that a new ICAgent version is available, perform the
following operations:
Step 1 Log in to the APM console.
Step 2 In the navigation pane, choose Agent > Management.
Step 3 Select Cluster: XXX or Other:
right of the page.
Issue 01 (2021-01-05) Copyright © Huawei Technologies Co., Ltd. 32
user-dened nodes from the drop-down list on the
Page 36

NO TE
APM
User Guide 9 ICAgent Installation and Conguration
Step 4 Upgrade the ICAgent.
● If you select Cluster: xxx in Step 3, directly click Upgrade ICAgent. In this
way, the ICAgent on all hosts in the cluster can be upgraded at a time.
● If you select Other:
then click Upgrade ICAgent.
Step 5 In the displayed Upgrade ICAgent dialog box, click Yes. Wait for about 1 minute
to complete the ICAgent upgrade. When the ICAgent status changes from
Upgrading to Running, the ICAgent is successfully upgraded.
----End
user-dened nodes in Step 3, select a desired host and
9.1.3 Uninstalling the ICAgent (Linux)
If the ICAgent on a server is uninstalled, server O&M will be
topology and tracing functions unavailable. Exercise caution when performing this
operation.
You can uninstall the ICAgent using either of the following methods:
● Uninstalling the ICAgent Through the APM Console: The ICAgent has been
successfully installed, and needs to be uninstalled.
● Uninstalling the ICAgent Through Logging In to a Server: The ICAgent fails
to be installed, and needs to be uninstalled.
● Remotely Uninstalling the ICAgent: The ICAgent has been successfully
installed, and needs to be remotely uninstalled.
● Uninstalling the ICAgent in Batches: The ICAgent has been successfully
installed, and needs to be uninstalled in batches.
Uninstalling the ICAgent Through the APM Console
Step 1 Log in to the Application Performance Management (APM) console. In the
navigation pane, choose Agent > Management.
Step 2 Select Other:
page.
Step 3 Select one or more servers whose ICAgent is to be uninstalled, and click Uninstall
ICAgent. In the Uninstall ICAgent dialog box, click Yes.
user-dened nodes from the drop-down list on the right of the
aected, making
Wait for about 1 minute to complete the uninstallation. When the ICAgent status
changes from Uninstalling to Uninstall, the ICAgent is successfully uninstalled.
To reinstall the ICAgent, wait for 5 minutes after it is uninstalled. Otherwise, the ICAgent
may be automatically uninstalled.
----End
Uninstalling the ICAgent Through Logging In to a Server
Step 1 Log in to the server from which the ICAgent is to be uninstalled as the root user.
Step 2 Run the following command to uninstall the ICAgent:
Issue 01 (2021-01-05) Copyright © Huawei Technologies Co., Ltd. 33
Page 37
NO TE
NO TICE
APM
User Guide 9 ICAgent Installation and Conguration
bash /opt/oss/servicemgr/ICAgent/bin/manual/uninstall.sh;
Step 3 Wait until the message "ICAgent uninstall success" is displayed.
----End
Remotely Uninstalling the ICAgent
In addition to the preceding methods, you can use a method similar to Inherited
Installation to remotely uninstall the ICAgent.
Step 1 Run the following command (
where the ICAgent has been installed:
bash /opt/oss/servicemgr/ICAgent/bin/remoteUninstall/remote_uninstall.sh ip x.x.x.x
Step 2 Enter the password of the root user of the server where the ICAgent is to be
uninstalled as prompted.
● If both the expect tool and ICAgent have been installed on a server, the ICAgent is
successfully uninstalled from the remote server after the preceding command is run. If
the ICAgent has been installed on a server, but the expect tool has not, enter the
information as prompted.
● Ensure that the root user can run the SSH and SCP commands on the Elastic Cloud
Server (ECS) server where the ICAgent has been installed to communicate with the
remote ECS server where the ICAgent is to be uninstalled.
● If the message "ICAgent uninstall success" is displayed, the ICAgent is successfully
uninstalled. After the ICAgent is successfully uninstalled, choose Agent > Management
in the navigation pane to view the ICAgent status.
----End
Uninstalling the ICAgent in Batches
x.x.x.x
indicates the server IP address) on the server
If the ICAgent has been installed on a server and the installation package
ICProbeAgent.zip exists in the /opt/ICAgent/ directory of the server, use this
method to uninstall the ICAgent from multiple remote ECS servers with a few
clicks.
The ECS servers must belong to the same Virtual Private Cloud (VPC) and network
segment.
Prerequisites
The IP addresses and passwords of all ECS servers where the ICAgent is to be
uninstalled have been collected, sorted in the iplist.cfg
le, and uploaded to
the /opt/ICAgent/ directory on the ECS server where the ICAgent has been
installed. As shown in the following example, each IP address and password in the
iplist.cfg
192.168.0.109 password
Issue 01 (2021-01-05) Copyright © Huawei Technologies Co., Ltd. 34
le must be separated by a space.
(Enter the actual password.)
Page 38

NO TE
APM
User Guide 9 ICAgent Installation and Conguration
192.168.0.39 password
● Because the iplist.cfg le contains sensitive information, you are advised to clear it in
time.
● If the passwords of all servers are the same, you only need to list IP addresses in the
iplist.cfg le and enter the password once during execution. If the password of an IP
address is
and IP addresses in the iplist.cfg le.
dierent from those of other IP addresses, you need to list both passwords
(Enter the actual password.)
Procedure
Step 1 Run the following command on the server where the ICAgent has been installed:
bash /opt/oss/servicemgr/ICAgent/bin/remoteUninstall/remote_uninstall.sh batchModeCong /opt/ICAgent/iplist.cfg
Enter the default password of the root user of the servers where the ICAgent is to
be uninstalled as prompted. If the passwords of all IP addresses have been
congured in the iplist.cfg le, press Enter to skip this step. Otherwise, enter the
default password.
batch uninstall begin
Please input default passwd:
send cmd to 192.168.0.109
send cmd to 192.168.0.39
2 tasks running, please wait...
End of uninstall agent: 192.168.0.109
End of uninstall agent: 192.168.0.39
All hosts uninstall icagent
nish.
Wait until the message "All hosts uninstall icagent nish." is displayed, which
indicates that the ICAgent has been successfully uninstalled from all the hosts
listed in the
conguration le.
Step 2 After the ICAgent is successfully uninstalled, choose Agent > Management in the
navigation pane to view the ICAgent status.
----End
9.2 Agent Management (Non-HUAWEI CLOUD Host)
9.2.1 Installing the ICAgent
Prerequisites
● You have purchased an Elastic Cloud Server (ECS) as a jump server.
● The operating system (OS) of the server meets the requirements in
Supported OSs and supports the AMD64 processor architecture.
● The server has been bound to an Elastic IP Address (EIP). For details, see
Assigning an EIP and Binding It to an ECS.
● The time and time zone of the local browser are consistent with those of the
ECS server.
Issue 01 (2021-01-05) Copyright © Huawei Technologies Co., Ltd. 35
Page 39

NO TE
NO TE
APM
User Guide 9 ICAgent Installation and Conguration
Procedure
Before installing the ICAgent on a non-HUAWEI CLOUD host, purchase an ECS
server from HUAWEI CLOUD as a jump server and perform the following
operations:
You are advised to use CentOS 6.5 64bit or later images. The minimum specication is
1vCPUs | 1GB and the recommended one is 2vCPUs | 4GB.
Step 1 Log in to the ECS server and modify its security group rule.
1. On the ECS details page, click the Security Groups tab.
2. On the security group page, click a security group name and click Modify
Security Group Rule.
3. On the security group details page, click Inbound Rules and then Add Rule.
On the page that is displayed, add a security group rule based on Table 9-3.
Table 9-3 Security group rule
Direction Protocol Port Description
Inbound TCP 8149, 8102, 8923,
30200, 30201, and
80
List of ports on
the jump server
to which the
ICAgent sends
data
Enable ports 8149, 8102, 8923, 30200, 30201, and 80 in the inbound direction of the
security group to ensure normal data communication between the non-HUAWEI
CLOUD host and the jump server.
Step 2 In the navigation pane, choose Agent > Management.
Step 3 Select Other: user-dened nodes, click Install ICAgent, and set Host to Non-
HUAWEI CLOUD host.
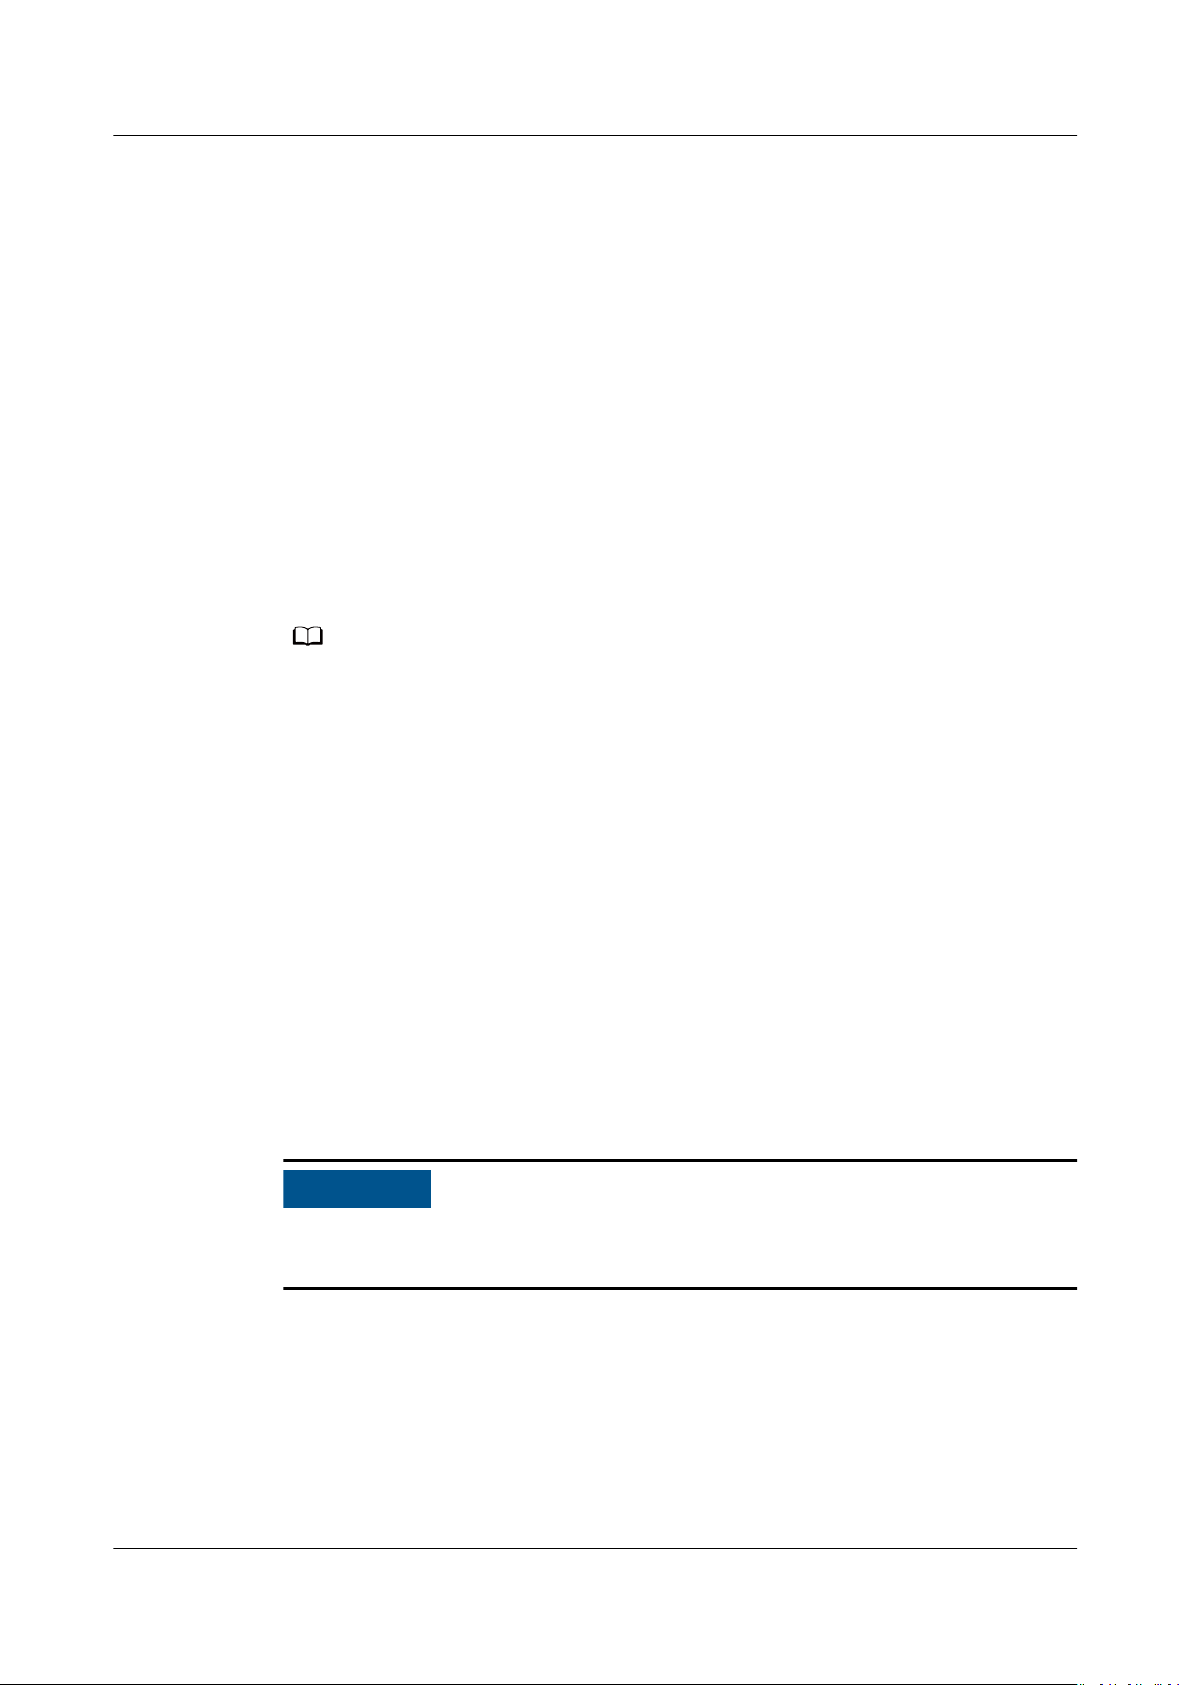
Step 4 Enable forwarding ports on the jump server.
1. As shown in Figure 9-2, enter the private IP address of the jump server to
generate a forwarding command.
Issue 01 (2021-01-05) Copyright © Huawei Technologies Co., Ltd. 36
Page 40
NO TE
NO TE
APM
User Guide 9 ICAgent Installation and Conguration
Figure 9-2 Entering the private IP address of the jump server
The private IP address of the jump server refers to the internal IP address of the
Virtual Private Cloud (VPC) where the jump server locates.
2. Click Copy Command to copy the forwarding command.
3. Log in to the jump server as the root user, and run the SSH tunnel forwarding
command:
ssh -f -N -L {ECS IP address}:8149:{ELB IP address}:8149 -L {ECS IP address}:8102:{ELB IP address}:
8102 -L {ECS IP address}:8923:{ELB IP address}:8923 -L {ECS IP address}:30200:{ELB IP address}:30200 L {ECS IP address}:30201:{ELB IP address}:30201 -L {ECS IP address}:80:icagent-{Region}.obs.
{Region}.myhuaweicloud.com:80 {ECS IP address}
Enter the password of the root user as prompted.
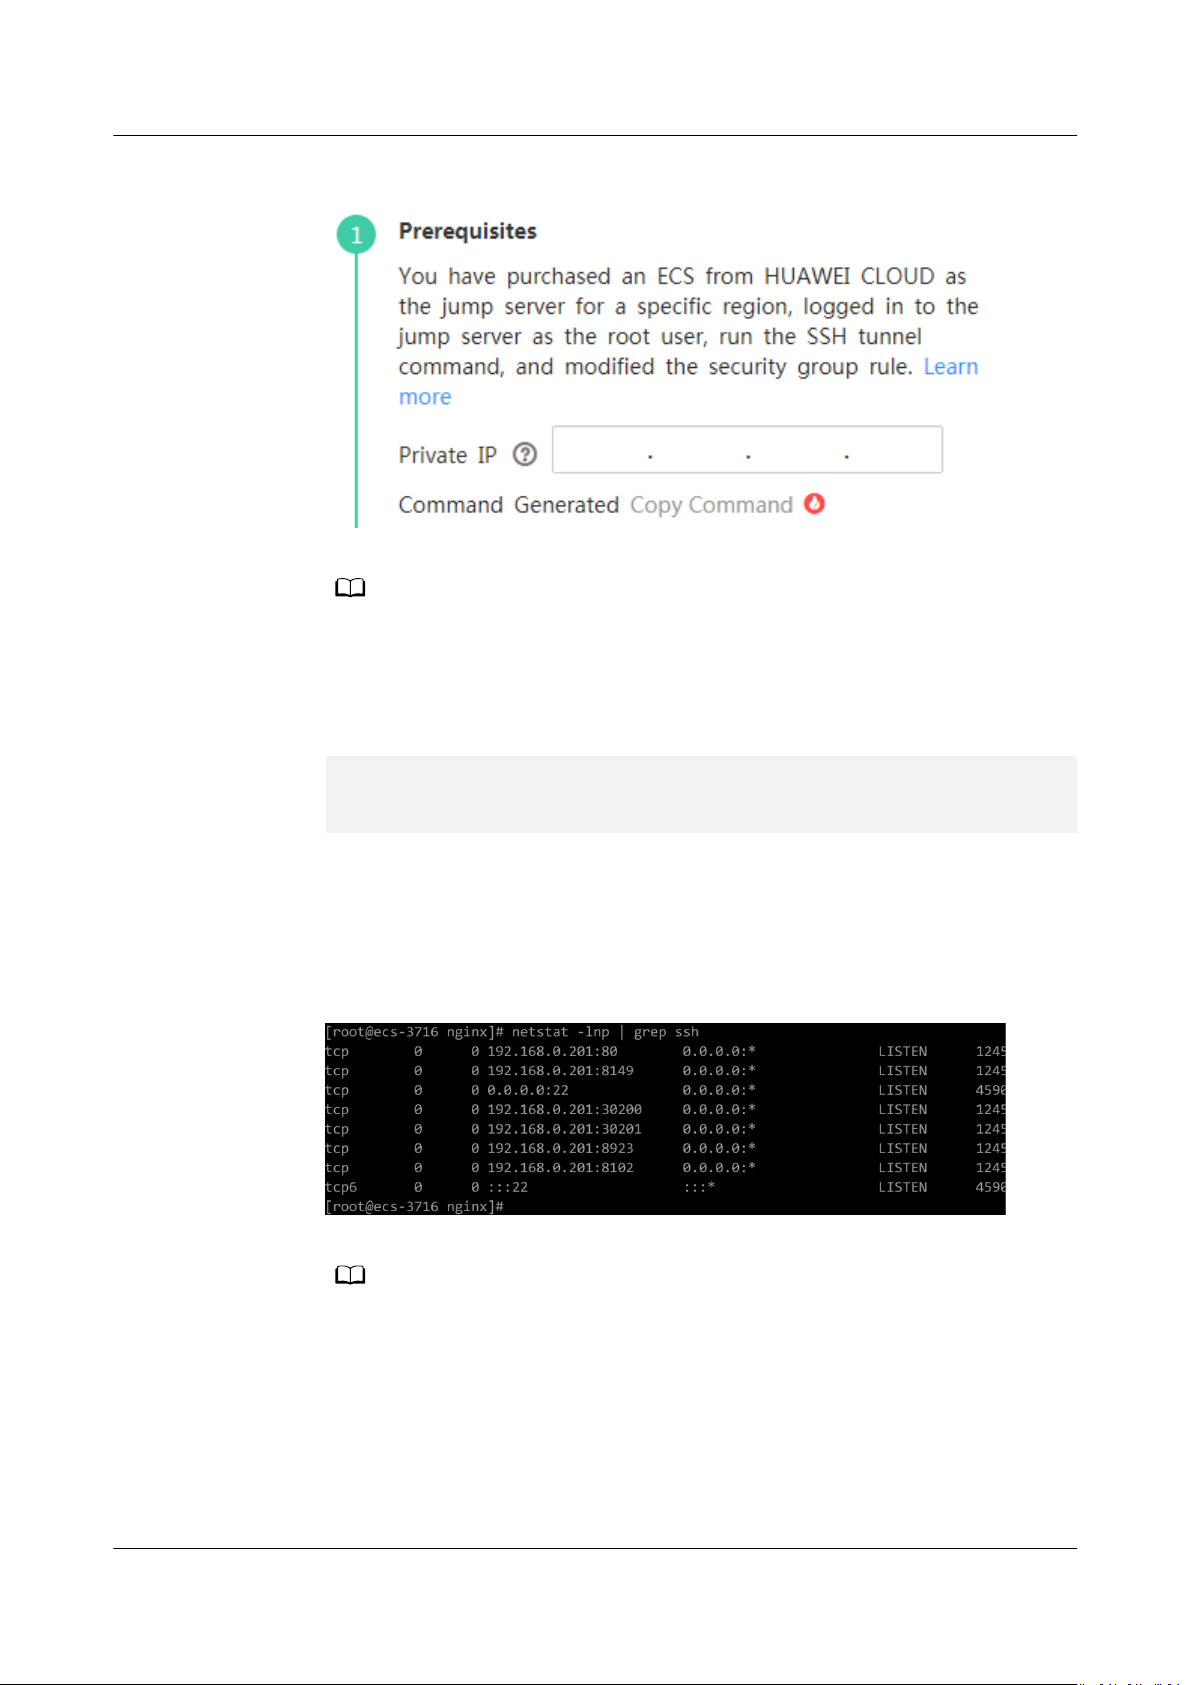
4. Run the netstat -lnp | grep ssh command to check whether corresponding
ports are being listened to. If the results in Figure 9-3 are returned, TCP ports
are enabled.
Figure 9-3
Verication results of TCP ports
– Enter http://ECS IP address in the address bar of the browser. If the access is
successful, the security group rule has taken eect.
– If the jump server is powered o and then restarted, run the preceding command
again.
Step 5 Obtain an Access Key ID/Secret Access Key (AK/SK). For details, see How Do I
Obtain the AK/SK and Project ID?.
Step 6 Generate the ICAgent installation command and copy it.
Issue 01 (2021-01-05) Copyright © Huawei Technologies Co., Ltd. 37
Page 41

NO TE
APM
User Guide 9 ICAgent Installation and Conguration
1. As shown in Figure 9-4, enter the AK, SK, DC, and Connection IP to generate
the ICAgent installation command.
Figure 9-4 Entering the AK/SK
– Ensure that the AK/SK are correct. Otherwise, the ICAgent cannot be installed.
– DC: Custom a DC name for querying hosts more easily.
– Connection IP: For EIP connection, use the EIP of the jump server. For VPC peer
connection, use the internal IP address of the VPC where the jump server locates.
2. Click Copy Command.
Step 7 Use a remote login tool to log in to the server where the ICAgent is to be installed
as the root user and run the preceding command to install the ICAgent.
If the message "ICAgent install success" is displayed, the ICAgent is successfully
installed in the /opt/oss/servicemgr/ directory. After the ICAgent is successfully
installed, choose Agent > Management in the navigation pane to view the
ICAgent status.
----End
9.2.2 Upgrading the ICAgent
To ensure better collection experience, Application Performance Management
(APM) will continuously upgrade ICAgent versions. When the Linux system
displays a message indicating that a new ICAgent version is available, perform the
following operations:
Step 1 Log in to the APM console.
Step 2 In the navigation pane, choose Agent > Management.
Step 3 Select Cluster: XXX or Other:
user-dened nodes from the drop-down list on the
right of the page.
Issue 01 (2021-01-05) Copyright © Huawei Technologies Co., Ltd. 38
Page 42

NO TE
APM
User Guide 9 ICAgent Installation and Conguration
Step 4 Upgrade the ICAgent.
● If you select Cluster: xxx in Step 3, directly click Upgrade ICAgent. In this
way, the ICAgent on all hosts in the cluster can be upgraded at a time.
● If you select Other: user-dened nodes in Step 3, select a desired host and
then click Upgrade ICAgent.
Step 5 In the displayed Upgrade ICAgent dialog box, click Yes. Wait for about 1 minute
to complete the ICAgent upgrade. When the ICAgent status changes from
Upgrading to Running, the ICAgent is successfully upgraded.
----End
9.2.3 Uninstalling the ICAgent
If the ICAgent on a server is uninstalled, server O&M will be aected, making
topology and tracing functions unavailable. Exercise caution when performing this
operation.
You can uninstall the ICAgent using either of the following methods:
● Uninstalling the ICAgent Through the APM Console: The ICAgent has been
successfully installed, and needs to be uninstalled.
● Uninstalling the ICAgent Through Logging In to a Server: The ICAgent fails
to be installed, and needs to be uninstalled.
Uninstalling the ICAgent Through the APM Console
Step 1 Log in to the Application Performance Management (APM) console. In the
navigation pane, choose Agent > Management.
Step 2 Select Other:
page.
Step 3 Select one or more servers whose ICAgent is to be uninstalled, and click Uninstall
ICAgent. In the Uninstall ICAgent dialog box, click Yes.
Wait for about 1 minute to complete the uninstallation. When the ICAgent status
changes from Uninstalling to Uninstall, the ICAgent is successfully uninstalled.
To reinstall the ICAgent, wait for 5 minutes after it is uninstalled. Otherwise, the ICAgent
may be automatically uninstalled.
----End
user-dened nodes from the drop-down list on the right of the
Uninstalling the ICAgent Through Logging In to a Server
Step 1 Log in to the server from which the ICAgent is to be uninstalled as the root user.
Step 2 Run the following command to uninstall the ICAgent:
bash /opt/oss/servicemgr/ICAgent/bin/manual/uninstall.sh;
Step 3 Wait until the message "ICAgent uninstall success" is displayed.
----End
Issue 01 (2021-01-05) Copyright © Huawei Technologies Co., Ltd. 39
Page 43

NO TE
NO TE
APM
User Guide 9 ICAgent Installation and Conguration
9.3 Collection Conguration
To reduce memory, database, and disk space usage, you can implement collection
conguration as required. The collection conguration takes eect for selected
applications.
Procedure
Step 1 Log in to the Application Performance Management (APM). In the navigation
pane, choose Agent >
Step 2 Select an application from the Application drop-down list.
Conguration.
Step 3 Click
This function is enabled by default. When you do not need to collect tracing and topology
data of a specic application, disable this function to reduce resource usage.
to enable data collection.
Step 4 Click to enable the function of collecting normal call chain data.
To reduce the resources consumed by probes, APM collects one more data record
every minute when a transaction is abnormal or the latency is greater than
Application Performance Index (Apdex) Threshold. If this function is enabled,
normal call chain data is sampled and collected. If this function is disabled,
normal call chain data is not collected.
Step 5 Click
to enable memory monitoring.
To prevent probes from aecting service performance in peak hours, enable
memory monitoring. When the instance memory usage is excessively high, probes
enter the hibernation state. You can also click to set the duration and memory
usage.
● Memory usage = Used memory of the Java process/Maximum available memory
● Maximum available memory: Use the smaller value between the available memory
quota of the container and the maximum heap memory of the JVM. The maximum
heap memory of the JVM is the value of -Xmx. The default value is 25% of the
maximum available memory of the JVM.
● The memory usage during collection suspension must be greater than or equal to that
during collection restoration.
Step 6 Click
to enable the function of adding trace IDs to logs.
A trace ID uniquely identies a tracing. When this function is enabled, the system
adds trace IDs to logs. You can accurately search for logs based on trace IDs, such
e1c08cab, e1c08cad, and e1c08cae, as shown in the
as
following gure.
Issue 01 (2021-01-05) Copyright © Huawei Technologies Co., Ltd. 40
Page 44

NO TE
APM
User Guide 9 ICAgent Installation and Conguration
Step 7 Click to enable SQL analysis.
When this function is disabled, no SQL data is aected, but you cannot implement
SQL analysis.
Step 8 Set the HTTP response codes to be ignored.
To prevent unnecessary error reporting, and quickly and accurately locate faulty
tracing, set the HTTP response codes to be ignored. They will not be recorded in
error record tables. Click
click . If there are multiple HTTP response codes, separate them by commas (,).
Step 9 Set the errors and exceptions to be ignored.
To prevent unnecessary error reporting, and quickly and accurately locate faulty
tracing, set the errors and exceptions to be ignored. They will not be recorded in
error record tables. Click
click . If there are multiple types of Java exceptions, separate them by commas
(,). The default value is null.
, enter the HTTP response codes to be ignored, and
, enter the errors and exceptions to be ignored, and
----End
9.4 Conguration Center
Setting Apdex Thresholds
Step 1 Log in to the Application Performance Management (APM) console. In the
navigation pane, choose
Step 2 Select an application from the drop-down list.
Step 3 Set Application Performance Index (Apdex) thresholds. For details, see Basic
Concepts.
● Click
threshold, and click to save the threshold.
● Click
Apdex threshold, and click to save the threshold.
next to Topology Apdex Threshold (ms), enter a topology Apdex
The default topology Apdex threshold is 100 ms.
next to Transaction Apdex Threshold (ms), enter a transaction
Conguration Center.
Issue 01 (2021-01-05) Copyright © Huawei Technologies Co., Ltd. 41
Page 45

NO TE
APM
User Guide 9 ICAgent Installation and Conguration
– The default transaction Apdex threshold is 500 ms.
– This setting takes eect for all transactions of the application. If an Apdex
threshold has been separately set for a transaction, the currently set Apdex
threshold takes
an Apdex threshold for a transaction, do as follows:
1. In the navigation pane, choose Transactions.
2. In the drop-down list in the upper left corner, select the application to which
the transaction belongs.
3. In the transaction list, click
desired transaction, enter an Apdex threshold, and then click
threshold.
eect for all transactions except this transaction. To separately set
in the Apdex Threshold (ms) column of the
to save the
----End
Issue 01 (2021-01-05) Copyright © Huawei Technologies Co., Ltd. 42
Page 46

APM
User Guide 10 Alarm Center
10 Alarm Center
10.1 Viewing Alarms
Flowchart
Alarms are reported when Application Performance Management (APM) or an
external service, such as ServiceStage, or Cloud Container Engine (CCE), is
abnormal or may cause exceptions. Alarms need to be handled. Otherwise, service
exceptions may occur.
Procedure
Step 1 Log in to the APM console.
Step 2 In the navigation pane, choose Alarm Center > Alarm List.
Issue 01 (2021-01-05) Copyright © Huawei Technologies Co., Ltd. 43
Page 47

APM
User Guide 10 Alarm Center
Step 3 View alarms on the Alarm List page.
1. Set a time range to view alarms. There are two methods to set a time range:
Method 1: Use the predened time label, for example, Last 1 hour, Last 6
hours, or Last 1 day. You can choose one based on service requirements.
Method 2: Customize a time range. The time range can be 30 days at most.
2. Set
Step 4 Perform the operations described in Table 10-1 if needed.
Table 10-1 Operations
Operation Method Description
Viewing
alarm
statistics
Clearing
alarms
Viewing
alarm details
lter criteria and click Search to view alarms.
Click Reset to reset lter criteria.
View alarm statistics that
meet specic lter criteria
within a specic time range
through a bar graph.
Click Clear in the Operation
column of a target alarm.
Click View Details in the
Operation column of the
target alarm to view alarm
details.
-
● You can clear an alarm
after the problem that
causes this alarm is
resolved.
● Cleared alarms cannot be
queried.
-
Viewing the
latest alarms
----End
Click on the right of the
page to view the latest three
alarms.
-
Setting Threshold Rules for Transaction Metrics
APM supports alarm reporting when transaction exceptions occur. You can set
threshold rules for transaction metrics. When metric values meet the threshold
rules, alarms will be reported to the alarm center. To view alarms, choose Alarm
Center > Alarm List in the navigation pane. The following uses the Calls metric of
transactions as an example.
Step 1 On the Transactions page, choose More > Modify Threshold in the Operation
column. The Add Threshold page is displayed.
Issue 01 (2021-01-05) Copyright © Huawei Technologies Co., Ltd. 44
Page 48

NO TE
APM
User Guide 10 Alarm Center
Figure 10-1 Adding a threshold rule for a transaction metric
Step 2 Select the Calls metric. Transaction metrics include Calls, Total latency, Errors,
and Apdex.
Step 3 Set the threshold condition: When there are 15 or more calls in 3 minutes, an
alarm will be reported.
Step 4 If you do not need to receive
notications, select Disabled for Notication and
then click OK.
If you want to receive notications, select Enabled. For details, see Setting Alarm
Notication.
----End
Setting Threshold Rules for JVM Metrics
APM supports alarm reporting when JVM memory and thread metrics are
abnormal. You can set threshold rules for JVM metrics. When metric values meet
the threshold rules, alarms will be reported to the alarm center. To view alarms,
choose Alarm Center > Alarm List in the navigation pane. The following uses the
Maximum memory metric of the total memory as an example.
Step 1 On the JVM Monitoring page, click Add Threshold Rule.
Issue 01 (2021-01-05) Copyright © Huawei Technologies Co., Ltd. 45
Page 49
NO TE
APM
User Guide 10 Alarm Center
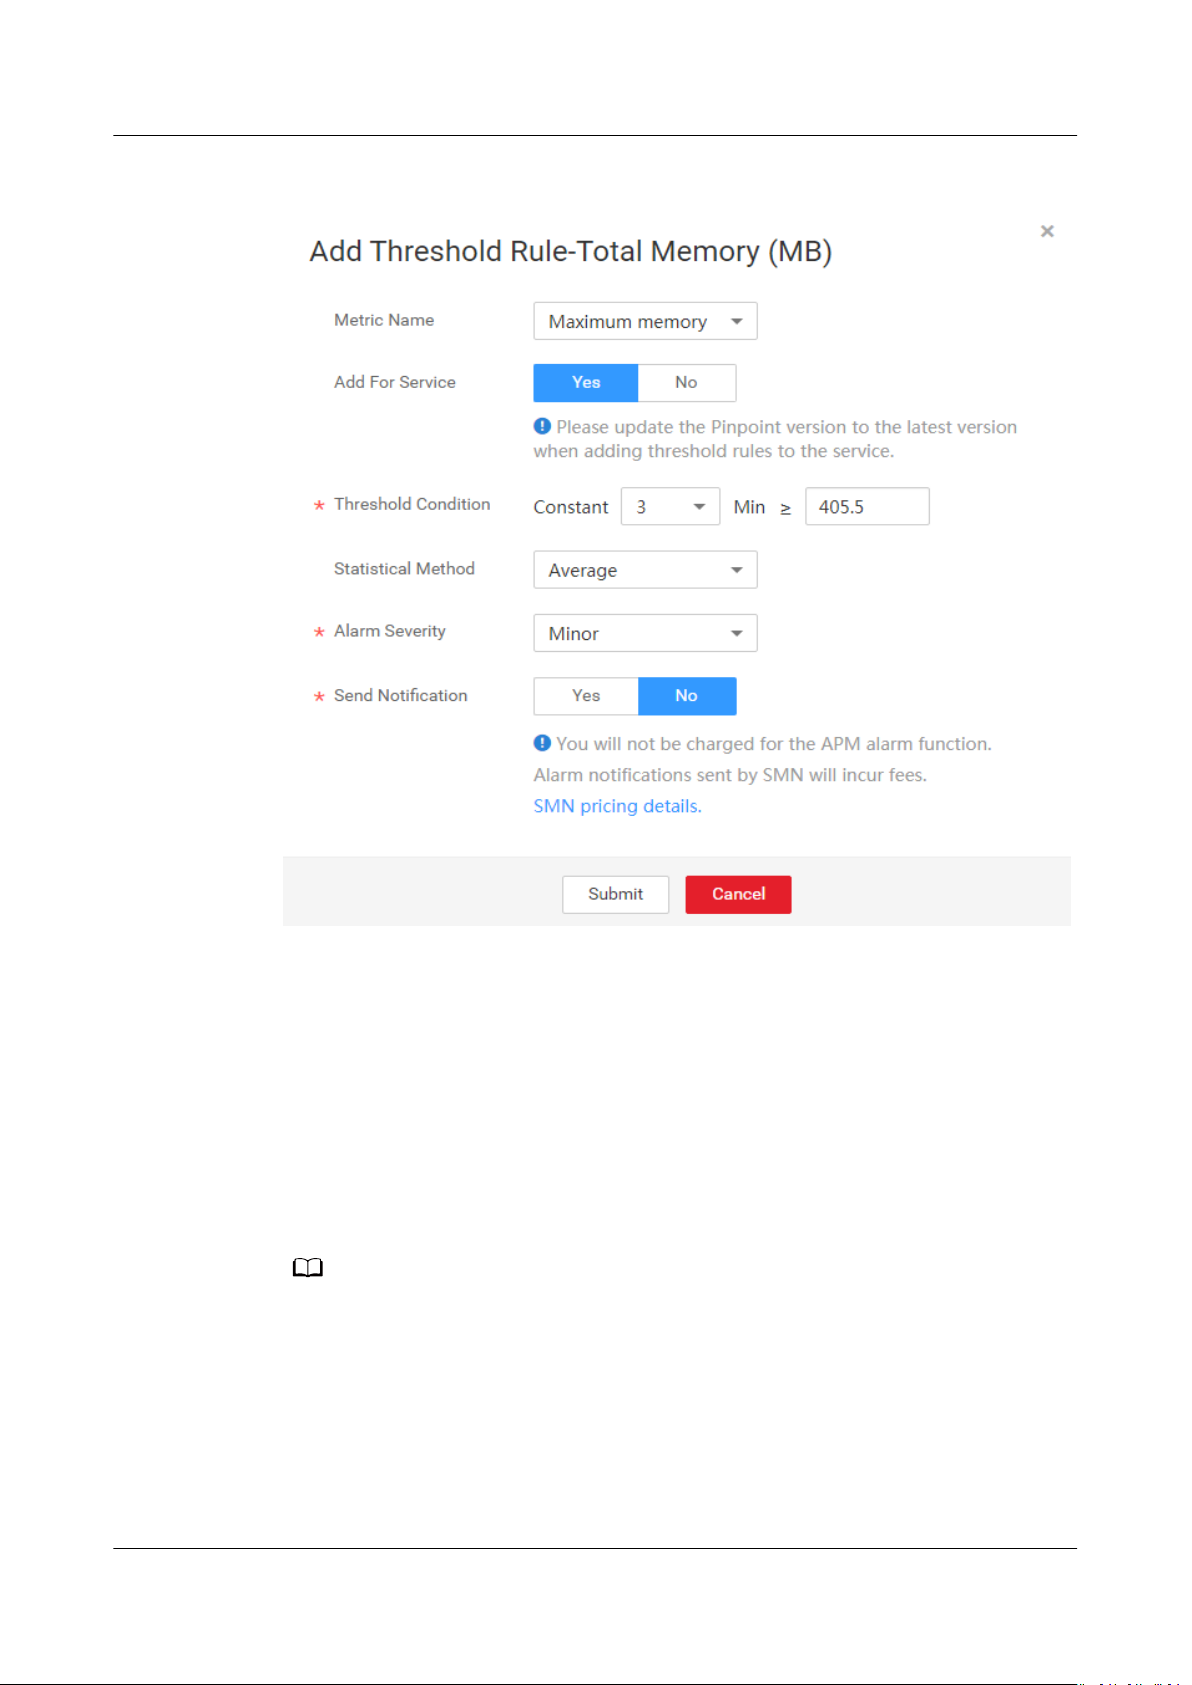
Figure 10-2 Adding a threshold rule
Step 2 On the page that is displayed, select the Maximum memory metric name. Other
options are Committed memory and Used memory.
Step 3 Set the threshold condition: When the total memory is greater than or equal to 15
MB for 3 minutes, an alarm will be reported.
Step 4 Select the Average statistical method. Other options are Maximum and
Minimum.
Step 5 Select the Minor alarm severity. Other options are Critical, Major, and Warning.
Step 6 If you do not need to receive
click Submit.
If you want to receive notications, select Yes. For details, see Setting Alarm Notication.
----End
10.2 Viewing Events
Events generally carry some important information. They are reported when
Application Performance Management (APM) or an external service, such as
notications, select No for Send Notication and
Issue 01 (2021-01-05) Copyright © Huawei Technologies Co., Ltd. 46
Page 50

APM
User Guide 10 Alarm Center
ServiceStage, or Cloud Container Engine (CCE) encounters some changes. Such
changes do not necessarily cause service exceptions. Events do not need to be
handled.
Procedure
Step 1 Log in to the APM console.
Step 2 In the navigation pane, choose Alarm Center > Event List.
Step 3 View events on the Event List page.
1. Set a time range to view events. There are two methods to set a time range:
Method 1: Use the
hours, or Last 1 day. You can choose one based on service requirements.
Method 2: Customize a time range. The time range can be 30 days at most.
2. Set
Step 4 Perform the operations described in Table 10-2 if needed.
Table 10-2 Operations
Operation
Viewing event
statistics
----End
lter criteria and click Search to view events.
Click Reset to reset lter criteria.
predened time label, for example, Last 1 hour, Last 6
Method Description
View event statistics that meet
lter criteria within a specic
time range through a bar
graph.
10.3 Setting Alarm Notication
-
Application Performance Management (APM) supports alarm notication. That is,
a certain type of alarms can be sent to
(SMS) message or email. In this way, they can identify and rectify cluster
exceptions at the earliest time, avoiding service loss.
You can create a maximum of 10
rules reaches 10, delete unnecessary notication rules and create new ones.
If you do not create any notication rule, you cannot receive alarm notications.
In that case, you can only log in to the APM console and choose Alarm Center >
Alarm List to view alarms.
APM enables you to create notication rules only for the alarms listed in Table
10-3.
Issue 01 (2021-01-05) Copyright © Huawei Technologies Co., Ltd. 47
specied users by Short Message Service
notication rules. If the number of notication
Page 51
NO TE
APM
User Guide 10 Alarm Center
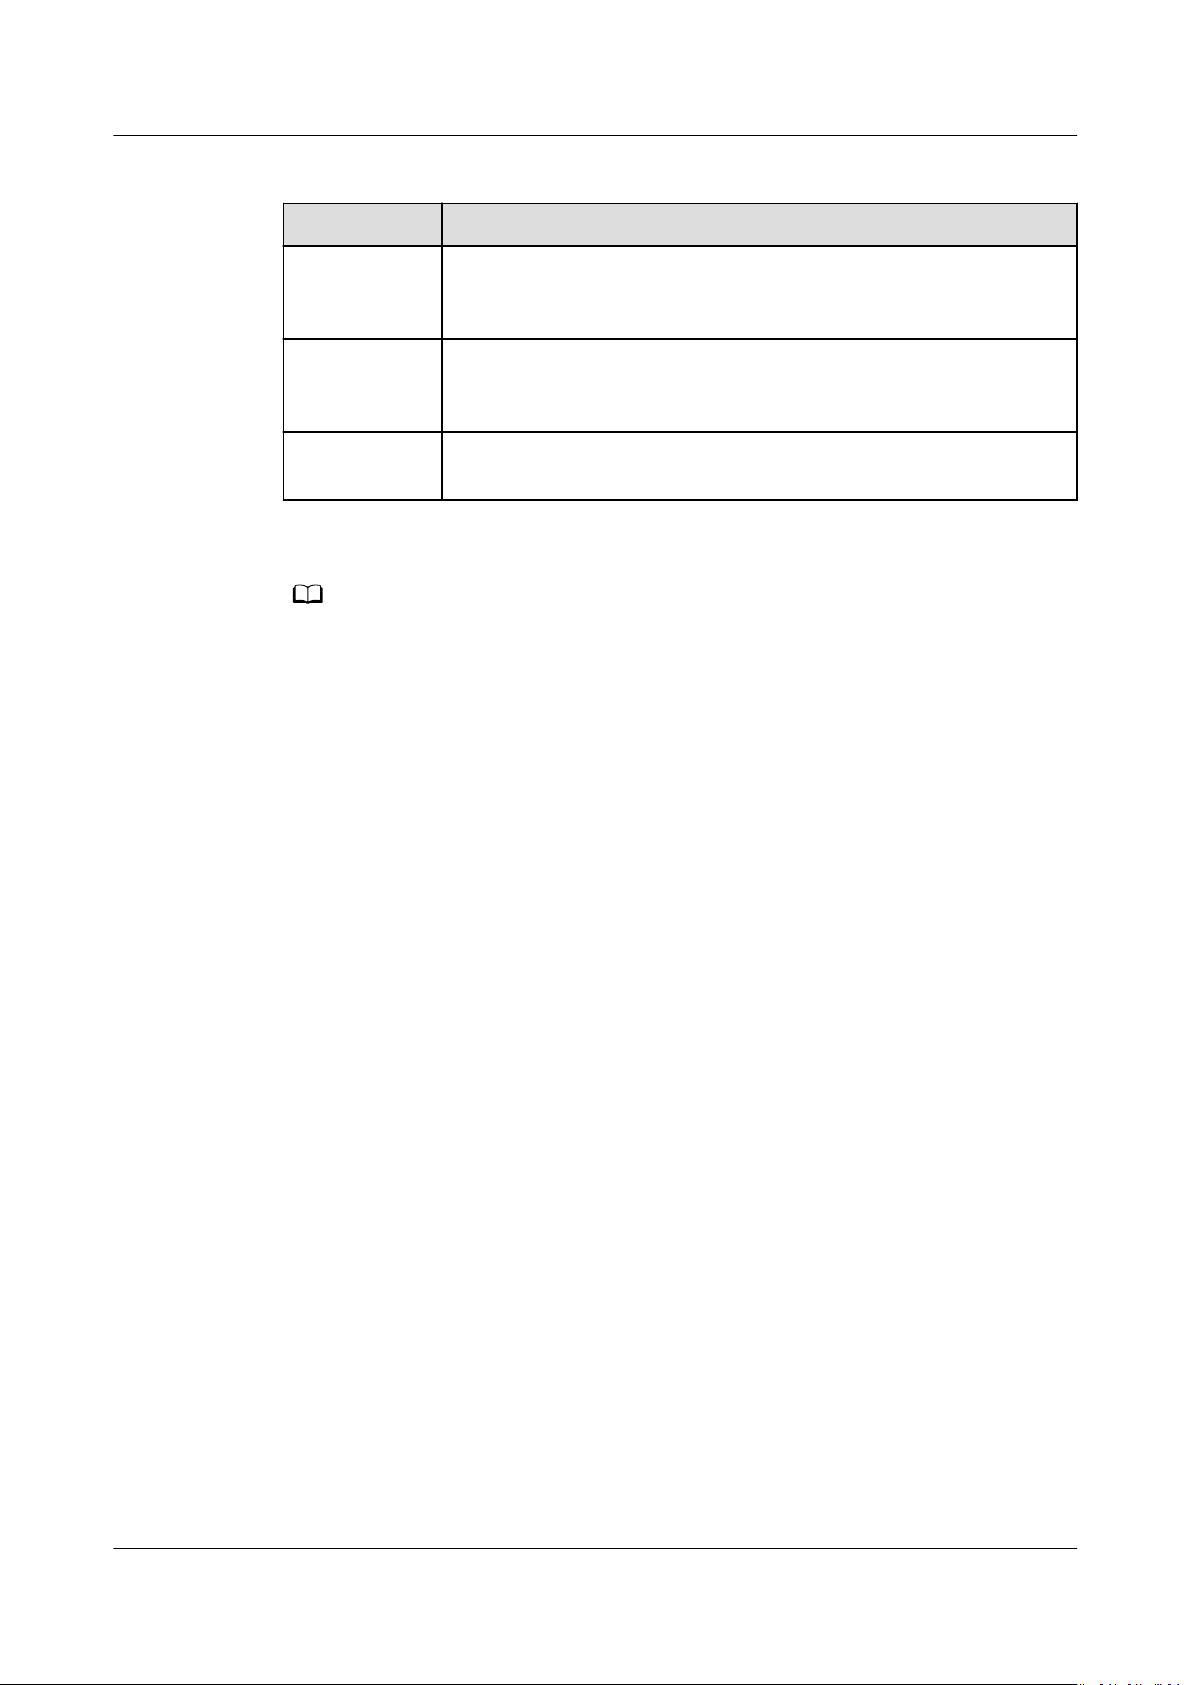
Table 10-3 Alarm types
Alarm Type Description
Probe
hibernation
alarm
Collector
installation
alarm
Threshold
alarm
More types of alarms are being developed.
Creating a Notication Rule
Step 1 Log in to the APM console.
Step 2 In the navigation pane, choose Alarm Center >
Create Notication Rule.
Step 3 Create a topic,
have made such congurations, skip this step.
congure a topic policy, and add subscribers to the topic. If you
Generated when the probe is in hibernation state.
Generated when the ICAgent fails to be installed, upgraded, or
uninstalled, or is abnormal.
Generated when a threshold rule is triggered.
Notication Rules, and click
1. Access the Simple Message Notication (SMN) console: When APM is
interconnected with SMN, click Create SMN Topic to access the SMN console.
2. Create a topic: In the navigation pane of the SMN console, choose Topic
Management > Topics. Then click Create Topic. On the page that is
displayed, enter a topic name and click OK. For details, see Creating a Topic.
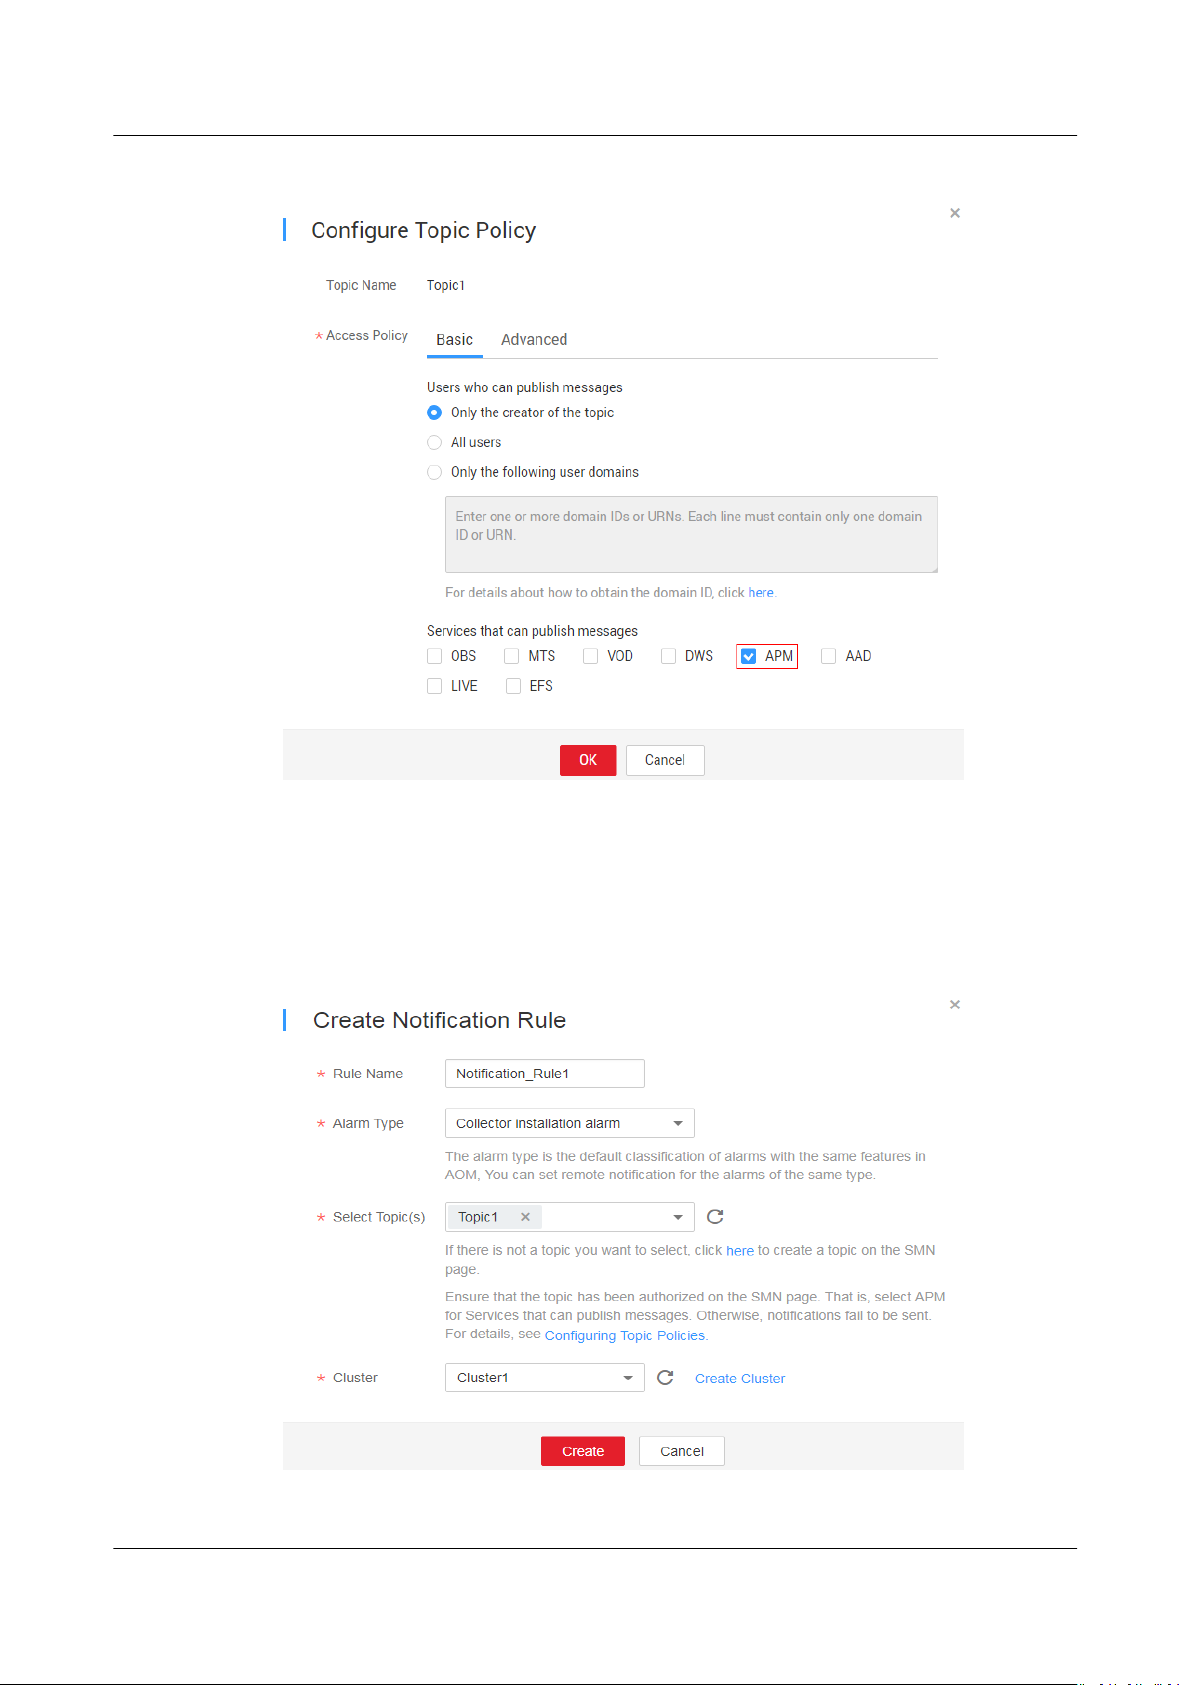
Congure a topic policy according to Figure 10-3. Otherwise, alarm
3.
notications will fail to be sent. Then, add subscribers, that is, SMS message
or email receivers of alarm
notications. For details, see Conguring Topic
Policies, and Adding a Subscription. In this way, when an exception occurs in
a cluster, APM can broadcast the alarm information to the subscribers in real
time.
Issue 01 (2021-01-05) Copyright © Huawei Technologies Co., Ltd. 48
Page 52
APM
User Guide 10 Alarm Center
Figure 10-3 Conguring a topic policy
Step 4 Enter a rule name, select an alarm type (for details, see Table 10-3), select the
topic created in Step 3, customize a cluster to be monitored, and click Create, as
shown in Figure 10-4.
After the
generated, APM automatically sends
Figure 10-4 Creating a
notication rule is created, if an alarm that meets the notication rule is
notications by SMS message or email.
notication rule
----End
Issue 01 (2021-01-05) Copyright © Huawei Technologies Co., Ltd. 49
Page 53
APM
User Guide 10 Alarm Center
More Operations
After creating a notication rule, you can also perform the operations described in
Table 10-4.
Table 10-4 Related operations
Operation Description
Modifying a
notication
rule
Deleting a
notication
rule
Searching for
a notication
rule
Click Modify in the Operation column.
● To delete a notication rule, click Delete in the Operation
column.
● To delete one or more notication rules, select it or them
and click Delete above the notication rule list.
Enter a keyword of the notication rule name in the search box
in the upper right corner and click
.
Issue 01 (2021-01-05) Copyright © Huawei Technologies Co., Ltd. 50
 Loading...