

Page 1

Using EMS HA Monitors
B5735-90001
August 1997
© Copyright 1997 Hewlett-Packard Company
Page 2

Legal Notices
The information contained in this document is subject to change without notice.
Hewlett-Packard makes no warranty of any kind with regard to this manual,
including, but not limited to, the implied warranties of merchantability and fitness
for a particular purpose. Hewlett-Packard shall not be liable for errors contained
herein or direct, indirect, special, incidental or consequential damages in connection
with the furnishing, performance, or use of this material.
Copyright © 1997 Hewlett-Packard Company.
This document contains information which is protected by copyright. All rights are
reserved. Reproduction, adaptation, or translation without prior written permission
is prohibited, except as allowed under the copyright laws.
Corporate Offices:
Hewlett-Packard Co.
3000 Hanover St.
Palo Alto, CA 94304
Use, duplication or disclosure by the U.S. Government Department of Defense is
subject to restrictions as set forth in paragraph (b)(3)(ii) of the Rights in Technical
Data and Software clause in FAR 52.227-7013.
Rights for non-DOD U.S. Government Departments and Agencies are as set forth in
FAR 52.227-19(c)(1,2).
Use of this manual and flexible disc(s), compact disc(s), or tape cartridge(s)
supplied for this pack is restricted to this product only. Additional copies of the
programs may be made for security and back-up purposes only. Resale of the
programs in their present form or with alterations, is expressly prohibited.
A copy of the specific warranty terms applicable to your Hewlett-Packard product
and replacement parts can be obtained from your local Sales and Service Office.
2
Page 3

Contents
1. Installing and Using EMS
What are EMS HA Monitors? . . . . . . . . . . . . . . . . . . . . . . . . . . . . . . . . . .12
The Role of EMS HA Monitors in a
High Availability Environment. . . . . . . . . . . . . . . . . . . . . . . . . . . . . . . . .14
Installing and Removing EMS HA Monitors . . . . . . . . . . . . . . . . . . . . . .15
Installing EMS HA Monitors. . . . . . . . . . . . . . . . . . . . . . . . . . . . . . . . .15
Removing EMS HA Monitors. . . . . . . . . . . . . . . . . . . . . . . . . . . . . . . . .16
Using EMS HA Monitors. . . . . . . . . . . . . . . . . . . . . . . . . . . . . . . . . . . . . .17
Configuring EMS Monitoring Requests
Outside of MC/ServiceGuard. . . . . . . . . . . . . . . . . . . . . . . . . . . . . . . .18
Selecting a Resource to Monitor. . . . . . . . . . . . . . . . . . . . . . . . . . . . .19
Using Wildcards . . . . . . . . . . . . . . . . . . . . . . . . . . . . . . . . . . . . . . . . .20
Creating a Monitoring Request . . . . . . . . . . . . . . . . . . . . . . . . . . . . .21
How Do I Tell EMS When to Send Events?. . . . . . . . . . . . . . . . . . . .22
What is a Polling Interval?. . . . . . . . . . . . . . . . . . . . . . . . . . . . . . . . .23
Which Protocols Can I Use to Send Events? . . . . . . . . . . . . . . . . . . .23
What is a Notification Comment? . . . . . . . . . . . . . . . . . . . . . . . . . . .24
Copying Monitoring Requests . . . . . . . . . . . . . . . . . . . . . . . . . . . . . .25
Modifying Monitoring Requests . . . . . . . . . . . . . . . . . . . . . . . . . . . . .25
Removing Monitoring Requests . . . . . . . . . . . . . . . . . . . . . . . . . . . . .25
Configuring MC/ServiceGuard Package Dependencies . . . . . . . . . . . .26
2. Monitoring Disk Resources
Disk Monitor Reference. . . . . . . . . . . . . . . . . . . . . . . . . . . . . . . . . . . . . . .33
Physical Volume Summary . . . . . . . . . . . . . . . . . . . . . . . . . . . . . . . . . .34
Physical Volume and Physical Volume Link Status. . . . . . . . . . . . . . .36
Logical Volume Summary . . . . . . . . . . . . . . . . . . . . . . . . . . . . . . . . . . .37
Logical Volume Status . . . . . . . . . . . . . . . . . . . . . . . . . . . . . . . . . . . . . .38
Logical Volume Number of Copies. . . . . . . . . . . . . . . . . . . . . . . . . . . . .39
3
Page 4

Contents
Rules for Using the EMS Disk Monitor
with MC/ServiceGuard. . . . . . . . . . . . . . . . . . . . . . . . . . . . . . . . . . . . . . . 40
Rules for RAID Arrays . . . . . . . . . . . . . . . . . . . . . . . . . . . . . . . . . . . . . 42
Adding PVGs to Existing Volume Groups . . . . . . . . . . . . . . . . . . . . 43
Creating Volume Groups on Disk Arrays Using PV Links . . . . . . . 44
Creating Logical Volumes . . . . . . . . . . . . . . . . . . . . . . . . . . . . . . . . . 45
Rules for Mirrored Individual Disks . . . . . . . . . . . . . . . . . . . . . . . . . . 46
Creating Disk Monitoring Requests . . . . . . . . . . . . . . . . . . . . . . . . . . . . 47
Disk Monitoring Request Suggestions. . . . . . . . . . . . . . . . . . . . . . . . . 48
Resources to Monitor for RAID Arrays . . . . . . . . . . . . . . . . . . . . . . . . 51
Resources to Monitor for Mirrored Disks . . . . . . . . . . . . . . . . . . . . . . 53
Resources to Monitor for Lock Disks . . . . . . . . . . . . . . . . . . . . . . . . . . 55
Resources to Monitor for Root Volumes. . . . . . . . . . . . . . . . . . . . . . . . 56
3. Monitoring Cluster Resources
Cluster Monitor Reference. . . . . . . . . . . . . . . . . . . . . . . . . . . . . . . . . . . . 58
Cluster Status . . . . . . . . . . . . . . . . . . . . . . . . . . . . . . . . . . . . . . . . . . . . 59
Node Status. . . . . . . . . . . . . . . . . . . . . . . . . . . . . . . . . . . . . . . . . . . . . . 60
Package Status . . . . . . . . . . . . . . . . . . . . . . . . . . . . . . . . . . . . . . . . . . . 61
Creating Cluster Monitoring Requests. . . . . . . . . . . . . . . . . . . . . . . . . . 62
4. Monitoring Network Interfaces
Network Monitor Reference. . . . . . . . . . . . . . . . . . . . . . . . . . . . . . . . . . . 64
Configuring Network Monitoring Requests . . . . . . . . . . . . . . . . . . . . . . 66
4
Page 5

Contents
5. Monitoring System Resources
System Monitor Reference . . . . . . . . . . . . . . . . . . . . . . . . . . . . . . . . . . . .68
Number of Users. . . . . . . . . . . . . . . . . . . . . . . . . . . . . . . . . . . . . . . . . . .69
Job Queues . . . . . . . . . . . . . . . . . . . . . . . . . . . . . . . . . . . . . . . . . . . . . . .70
Filesystem Available Space . . . . . . . . . . . . . . . . . . . . . . . . . . . . . . . . . .71
Creating System Resource Monitoring Requests. . . . . . . . . . . . . . . . . . .72
6. Troubleshooting
EMS Directories and Files . . . . . . . . . . . . . . . . . . . . . . . . . . . . . . . . . . . .74
Logging and tracing. . . . . . . . . . . . . . . . . . . . . . . . . . . . . . . . . . . . . . . . . .76
EMS Logging . . . . . . . . . . . . . . . . . . . . . . . . . . . . . . . . . . . . . . . . . . . . .76
EMS Tracing. . . . . . . . . . . . . . . . . . . . . . . . . . . . . . . . . . . . . . . . . . . . . .77
Performance Considerations. . . . . . . . . . . . . . . . . . . . . . . . . . . . . . . . . . .78
System Performance Issues. . . . . . . . . . . . . . . . . . . . . . . . . . . . . . . . . .78
Network Performance Issues. . . . . . . . . . . . . . . . . . . . . . . . . . . . . . . . .78
Testing Monitor Requests. . . . . . . . . . . . . . . . . . . . . . . . . . . . . . . . . . . . .79
Testing Disk Monitor Requests . . . . . . . . . . . . . . . . . . . . . . . . . . . . . . .79
Testing Cluster Monitor Requests. . . . . . . . . . . . . . . . . . . . . . . . . . . . .79
Testing Network Monitor Requests. . . . . . . . . . . . . . . . . . . . . . . . . . . .79
Testing System Resource Monitor Requests. . . . . . . . . . . . . . . . . . . . .79
Making Sure Monitors are Running . . . . . . . . . . . . . . . . . . . . . . . . . . .80
Glossary
5
Page 6

Contents
6
Page 7

Table 1
Printing History
Printing Date Part Number Edition
August 1997 B5735-90001 Edition 1.
This edition documents material related to installing and configuring the Event
Monitoring Service (EMS).
This printing date and part number indicate the current edition. The printing date
changes when a new edition is printed. (Minor corrections and updates which are
incorporated at reprint do not cause the date to change.) The part number changes
when extensive technical changes are incorporated.
New editions of this manual will incorporate all material updated since the previous
edition.
HP Printing Division:
Enterprise Systems Division
Hewlett-Packard Co.
19111 Pruneridge Ave.
Cupertino, CA 95014
7
Page 8

8
Page 9

Preface
This guide describes how to install and configure the Event Monitoring Service to
monitor system health, and how to use EMS in conjunction with availability
software such as MC/ServiceGuard and IT/O:
• Chapter 1, “Installing and Using EMS” presents the exact steps required to
install and use the software on your system or cluster.
• Chapter 2, “Monitoring Disk Resources”, gives guidelines on using the disk
monitor, including using it with MC/ServiceGuard.
• Chapter 3, “Monitoring Cluster Resources”, gives guidelines on using the
cluster monitor.
• Chapter 4, “Monitoring Network Interfaces”, gives guidelines on using the
network interface monitor.
• Chapter 5, “Monitoring System Resources”, gives guidelines on using the
system resource monitor for monitoring users, job queues and available
filesystem space.
• Chapter 6, “Troubleshooting”, gives guidelines on reading log files, and testing
monitor requests.
Related Publications
The following documents contain additional related information:
• Clusters for High Availability: A Primer of HP-UX Solutions (ISBN
0-13-494758-4). HP Press: Prentice Hall, Inc., 1996.
• Disk and File Manag ement Tasks on HP-UX (ISBN 0-13-518861-X). HP Press;
Prentice Hall, Inc., 1997.
• Managing MC/ServiceGuard (HP Part Number B3936-90019).
• HP OpenView IT/Operations Administrators Task Guide (P/N B4249-90003)
• Configuring OPS Clusters with MC/LockManager (HP Part Number
B5158-90001).
• Managing Highly Available NFS (HP Part Number B5125-90001)
• http://www.hp.com/go/ha external web site for information about
Hewlett-Packard’s high-availability technologies where you can documents
such as Writing Monitors for the Event Monitoring Service (EMS)
9
Page 10

Problem Reporting If you have any problems with the software or documentation, please contact your
local Hewlett-Packard Sales Office or Customer Service Center.
10
Page 11

1 Installing and Using EMS
EMS HA Monitors (Event Monitoring Service High Availability Monitors) aids in
providing high availability in an HP-UX environment by monitoring particular
system resources and then informing target applications (e.g. MC/ServiceGuard)
when the resources they monitor are at critical user-defined values.
11
Page 12

Installing and Using EMS
What are EMS HA Monitors?
What are EMS HA Monitors?
EMS HA Monitors (Event Monitoring Service High Availability Monitors) are a set
of monitors and a monitoring service that polls a local system or application
resource and sends messages when events occur. An event can simply be defined as
something you want to know about. For example, you may want to be alerted when
a disk fails or when available filesystem space falls below a certain level. EMS
allows you to configure what you consider an event for any monitored system
resource.
The advantage EMS has over built-in monitors is that requests can be made to send
events to a wide variety of softw are using multiple protocols (opcmsg, SNMP, TCP,
UDP). For example, you can configure EMS so that when a disk fails a message is
sent to MC/ServiceGuard and IT/Operations. These applications can then use that
message to trigger package failover and to send a message to an administrator to fix
the disk.
EMS HA Monitors consist of a framework, a collection of monitors, and a
configuration interface that runs under SAM (System Administration Manager). The
framework starts and stops the monitors, stores information used by the monitors,
and directs monitors where to send events. A standard API provides a way to add
new monitors as they become available, or to write your own monitors; see the
document Writing Monitors for the Event Monitoring Service (EMS) available from
the high availability web site: http://www.hp.com/go/ha
Figure 1-1 Event Monitoring Services High Availability Monitors
Client, such as
SAM interface to EMS,
MC/ServiceGuard package configuration
Target, such as
IT/Operations,
MC/ServiceGuard
12 Chapter 1
Framework
Registrar
API
MONITORS
Resource
dictionary
System and
application
resources
Page 13

Installing and Using EMS
What are EMS HA Monitors?
Monitors are applications written to gather and report information about specific
resources on the system. They use system information stored in places like
/etc/lvmtab and the MIB database. When you make a request to a monitor, it
polls the system information and sends a message to the framework, which then
interprets the data to determine if an event has occurred and sends messages in the
appropriate format.
EMS HA Monitors work best in a high availability environment; it aids in quickly
detecting and eliminating single points of failure, and monitors resources that can be
used as MC/ServiceGuard package dependencies. However, EMS HA Monitors can
also be used outside a high availability environment for monitoring the status of
system resources.
A set of monitors is shipped with EMS: disk, cluster, network interface, and system
resource monitors. Other Hewlett-Packard products are bundled with monitors that
fit into the EMS framework, such as ATM and HP OSI Transport Service 9000. You
can also write your own monitor; see Writing Monitors for the Event Monitoring
Service (EMS).
Chapter 1 13
Page 14

Installing and Using EMS
The Role of EMS HA Monitors in a High Availability Environment
The Role of EMS HA Monitors in a
High Availability Environment
The weakest link in a high availability system is the single point of f ailure. EMS HA
Monitors can be used to report information that helps you detect loss of redundant
resources, thus exposing single points of failure, a threat to data and application
availability.
Because EMS is a monitoring system, and does not do anything to modify the
system, it is best used with additional software that can take action based on the
events sent by EMS. Some examples are:
• EMS HA Monitors and MC/ServiceGuard
MC/ServiceGuard uses the EMS monitors to determine the health of resources,
such as disks, and may fail over packages based on that information.
Configuration of EMS monitoring requests for use with MC/ServiceGuard
packages is done from the Cluster area for Package Configuration in SAM, or by
editing the ASCII package configuration file.
However, if you also want to be alerted to what caused a package to fail over, or
you want to monitor events that affect high availability you need to create
requests from the SAM interface in the Resource Management area as described
in “Using EMS HA Monitors” on page 17, and in subsequent chapters.
MC/ServiceGuard may already be configured to monitor the health of nodes,
services, and subnets, and to make failover decisions based on resources status.
Configuring EMS monitors provides additional MC/ServiceGuard failover
criteria for certain network links and other resources.
• EMS HA Monitors with IT/Operations or Network Node Manager
EM HA Monitors S can be configured to send events to IT/Operations and
Network Node Manager.
• EMS HA Monitors with your choice of system management software
Because EMS can send events in a number of protocols, it can be used with any
system management software that supports either SNMP traps, or TCP, or UDP
messages.
14 Chapter 1
Page 15

Installing and Using EMS
Installing and Removing EMS HA Monitors
Installing and Removing EMS HA Monitors
NOTE T o make best use of EMS HA Monitors, install and configure them on all systems in
your environment. Because EMS monitors resources for the local system only, you
need to install EMS on every system to monitor all systems.
EMS HA Monitors run on HP 9000 Series 800 systems running HP-UX version
10.20 or later.
Hardware, such as disks and LAN cards, should be configured and tested before
installing EMS HA Monitors.
Installing EMS HA Monitors
The EMS HA Monitor bundle (P/N B5735AA-APZ) and license
(P/NB5736AA-APZ) version A.01.00 contains these products:
EMS-Core the EMS framework
EMS-Config the SAM interface to EMS
EMS-Disk Monitor the disk monitor, associated dictionary and files
EMS-MIB Monitor the cluster, network, and system resource monitors,
associated dictionary and files
To install EMS product, use swinstall, or the Software Management area in
SAM.
If you have many systems, it may be easier to install o ver the netw ork from a central
location. Create a network depot according to the instructions in Managing HP-UX
Software with SD-UX, rlogin or telnet to the remote host, and install over the
network from the depot.
When monitors are updated, or you install a monitor on top of an existing monitor,
your requests are retained. This is part of the functionality provided by the
persistence client; see “Making Sure Monitors are Running” in Chapter 6.
Note that updated monitors may have new status values that change the meaning of
your monitoring requests.
Chapter 1 15
Page 16

Installing and Using EMS
Installing and Removing EMS HA Monitors
Removing EMS HA Monitors
Use swremove or the Software Management tools under SAM to remove EMS.
Note that because the monitors are persistent, that is, they are always automatically
started if they are stopped, it is likely you will have warnings in your removal log
file that say, “Could not shut down process” or errors that say “File
/etc/opt/resmon/lbin/p_client could not be removed.” Even if you see these
warnings, monitors are removed and any dirty files are cleaned up on reboot.
16 Chapter 1
Page 17

Installing and Using EMS
Using EMS HA Monitors
Using EMS HA Monitors
There are two ways to use EMS HA Monitors:
• Configure monitoring requests from the EMS interface in the Resource
Management area of SAM.
• Configure package dependencies in MC/ServiceGuard by using the Package
Configuration interface in the High Availability Clusters subarea of SAM or by
editing the package ASCII configuration file.
The following are prerequisites to using EMS:
• Disks need to be configured using the LVM (Logical Volume Manager).
• Network cards need to be configured.
• Filesystems need to have been created and mounted.
Resource classes are structured hierarchically, similar to a filesystem structure,
although they are not actually files and directories. The classes supplied with this
version of EMS are listed in Figure 1-2. Resource instances are listed in bold, and
instances that are replaced with an actual name are in bold italics.
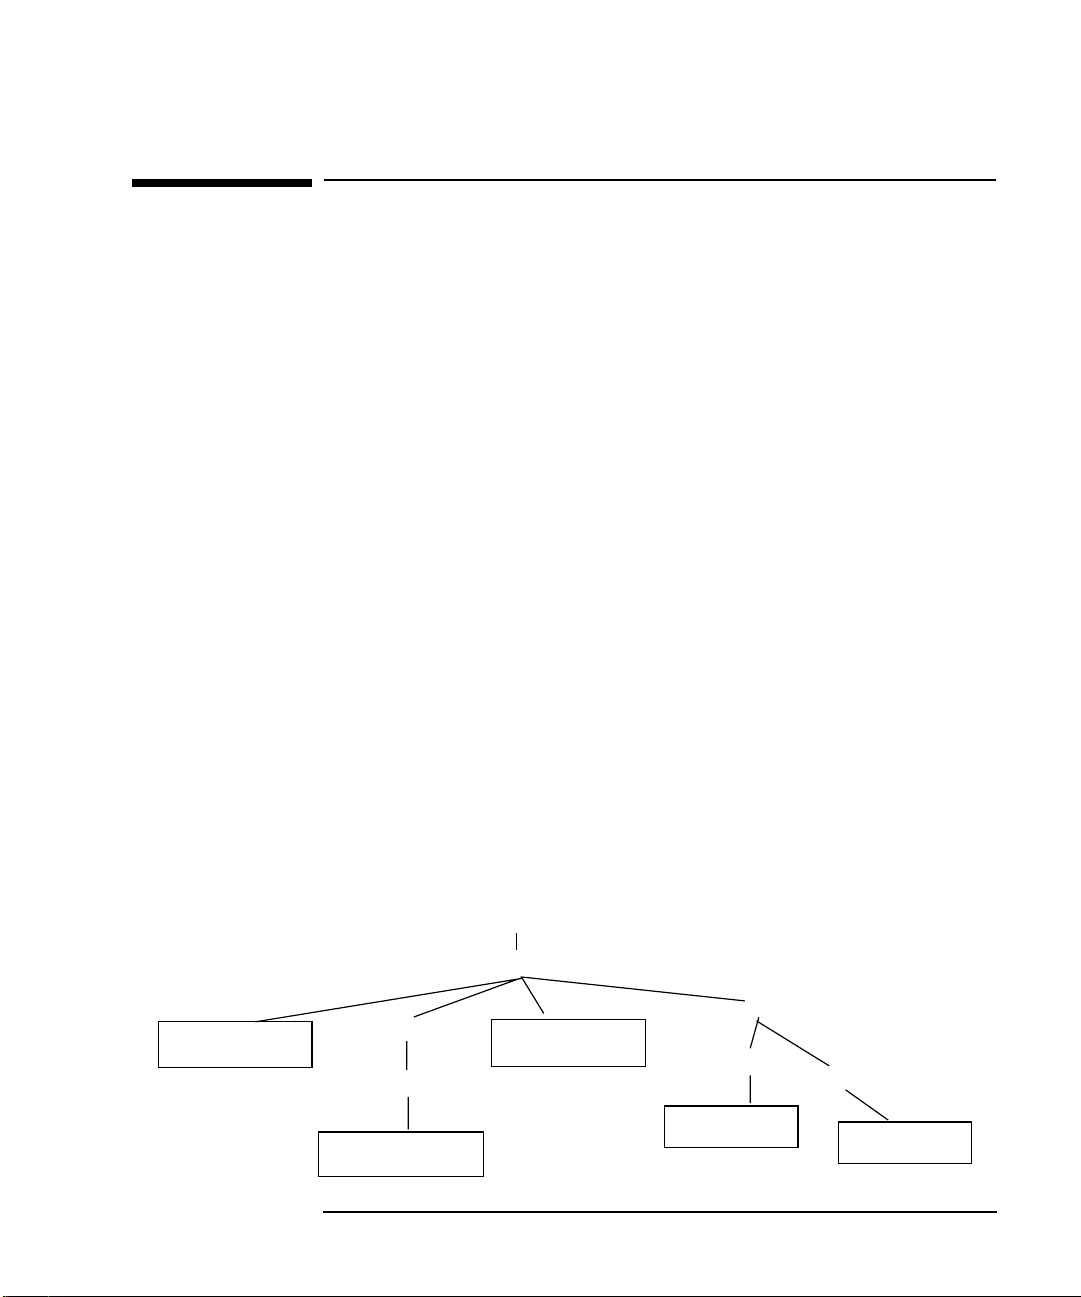
Figure 1-2 Event Monitoring Service Resource Class Hierarchy
/vg
contains all logical volume, disk
and PVlink, and volume group
summary status
/vgName
/lv
/copies
/status
/lvName
/lvName
/pv_summary
/lv_summary
/pv_pvlink
/status
/deviceName
The full path of a resource includes the class, subclasses, and instance. An example
of a full resource path for the physical volume status of the device
/dev/dsk/c0t1d2 belonging to volume group vgDataBase, would be
/vg/vgDataBase/pv_pvlink/status/c0t1d2.
Chapter 1 17
contains all package,
node, and cluster
status
/package
/localNode
/status
/packageName
/clusterName
/status
/clusterName
/status
/net/cluster
contains network
interface status
/interfaces
/lan
/status
/LANname
/jobQueue1Min
/jobQueue5Min
/jobQueue15Min
/system
contains all job
queue, user, and
filesystem status
/filesystem
/availMB
/numUsers
/fsName
Page 18

Installing and Using EMS
Using EMS HA Monitors
Configuring EMS Monitoring Requests
Outside of MC/ServiceGuard
This section describes the steps from the SAM interface to EMS to create
monitoring requests that notify non-MC/ServiceGuard management applications
such as IT/Operations.This information for creating requests is also valid for
monitors sold with other products (ATM or OTS, for example) and for user-written
monitors written according to developer specifications in Writing Monitors for the
Event Monitoring Service (EMS).
To start the EMS configuration, double-click on the Event Monitoring Service icon
in the Resource Management area in SAM. The main screen, shown in Figure 1-3,
shows all requests configured on that system; if you haven’t created requests, the
screen will be empty.
Figure 1-3 Event Monitoring Service Screen
18 Chapter 1
Page 19

Installing and Using EMS
Using EMS HA Monitors
Selecting a Resource to Monitor
All resources are divided into classes. When you double-click on Add Monitoring
Request in the Actions menu, the top-level classes for all installed monitors are
dynamically discovered and then listed.
Figure 1-4 The Top Level of the Resource Hierarchy in the Add a Monitoring Request
Screen
Chapter 1 19
Page 20

Installing and Using EMS
Using EMS HA Monitors
Some Hewlett-Packard products, such as ATM or HP OTS 9000, provide EMS
monitors. If those products are installed on the system, then their top-level classes
will also appear here. Similarly, top-level classes belonging to user-written
monitors, created using the EMS Developer’s Kit, will be discovered and displayed
here.
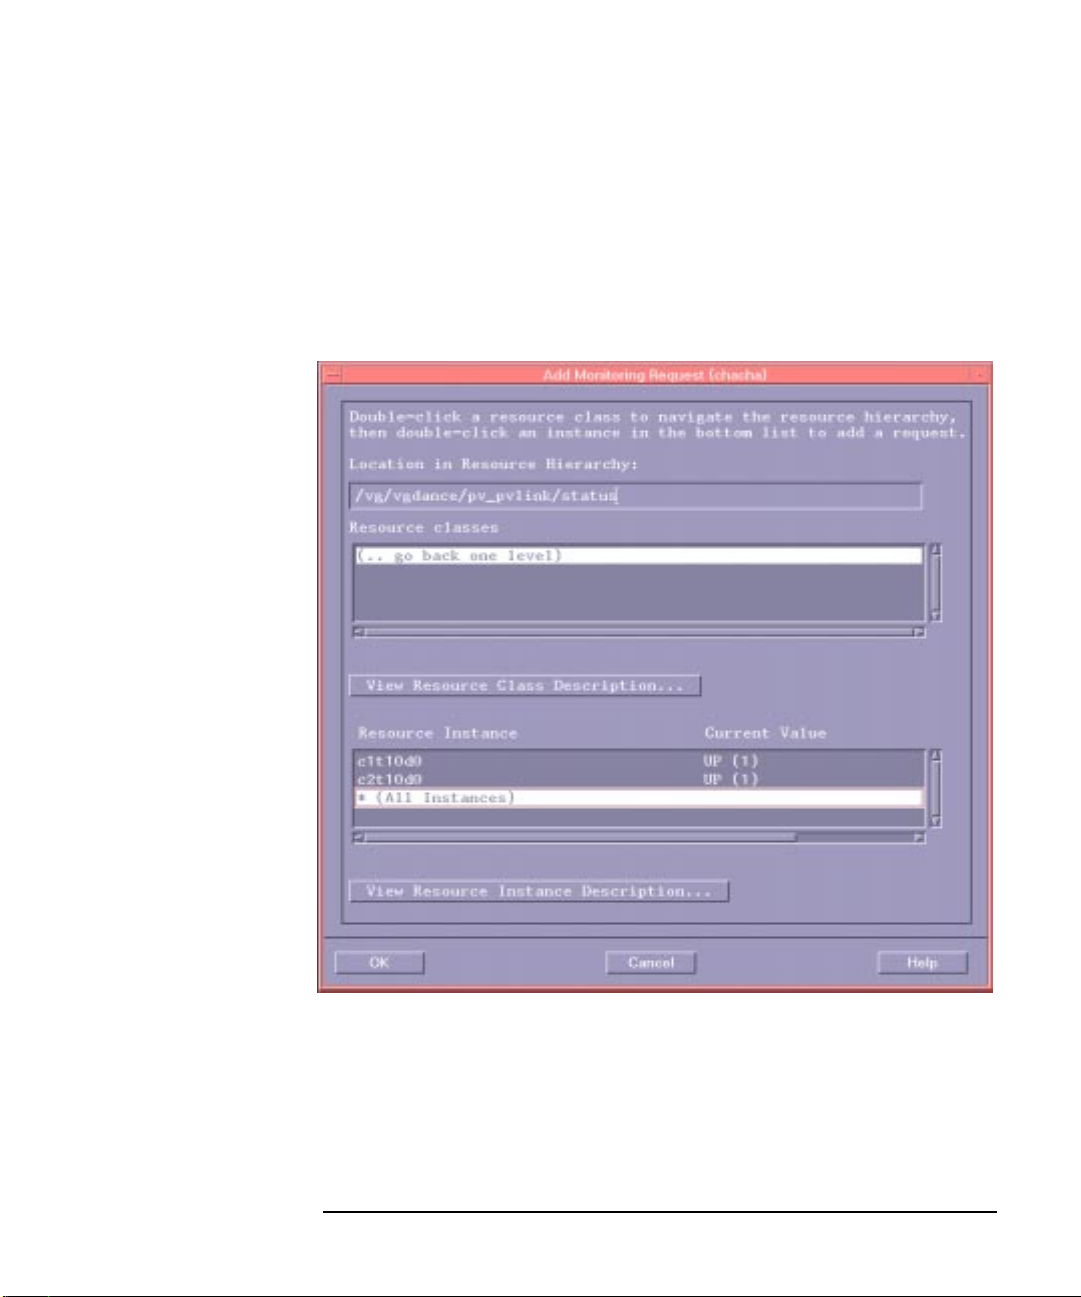
Traverse the hierarchy in the upper part of the screen in Figure 1-4 and select a
resource instance to monitor in the lower part of the screen as in Figure 1-5.
Figure 1-5 Choosing a Resource Instance in the Add a Monitoring Request Screen
Using Wildcards
The * wildcard is a convenient way to create many requests at once. Most systems
have more than one disk or network card, and many have several disks. To avoid
having to create a monitor request for each disk, select * (All Instances) in the
Resource Instance box. See Figure 1-5.
20 Chapter 1
Page 21

Wildcards are available only when all instances of a subclass are the same resource
type.
Wildcards are not available for resource classes. So, for example, a wildcard is
available for the status instances in the /vg/vgName/pv_pvlink/status subclass, but
no wildcard appears for the volume group subclasses under the /vg resource class.
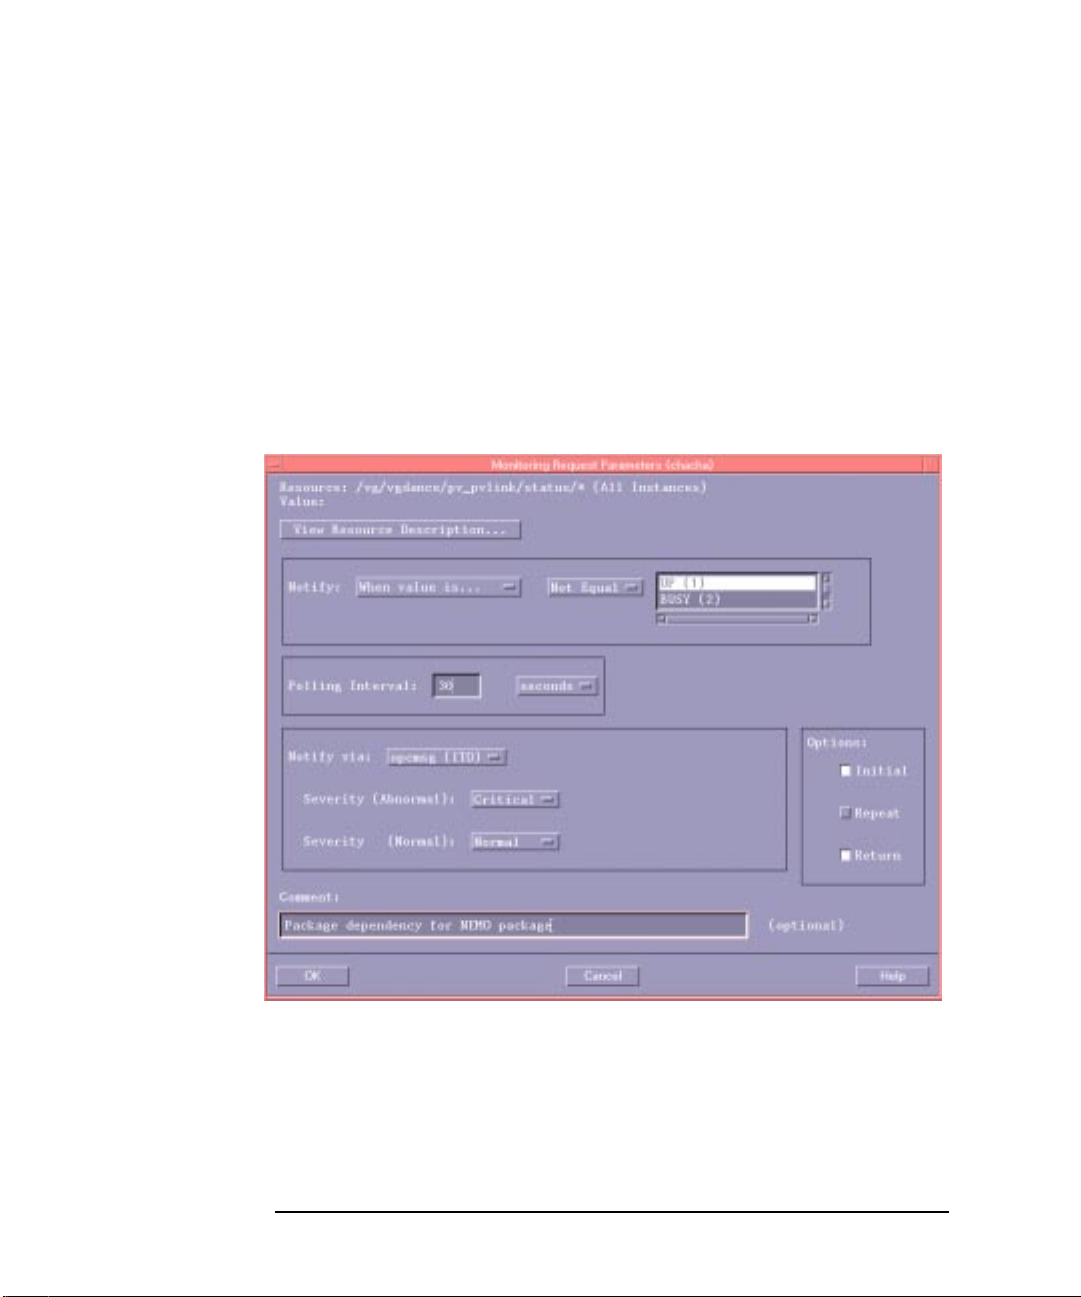
Creating a Monitoring Request
The screen in Figure 1-6 shows where you specify when and how to send events.
The following sections describe the monitoring parameters and some common
applications of them.
Figure 1-6 Monitoring Request Parameters
Installing and Using EMS
Using EMS HA Monitors
Chapter 1 21
Page 22

Installing and Using EMS
Using EMS HA Monitors
How Do I Tell EMS When to Send Events?
While the monitor may be polling disks every 5 minutes, for example, you may only
want to be alerted when something happens that requires your attention. When you
create a request, you specify the conditions under which you receive an alert. Here
are the terms under which you can be notified:
When value is... You define the conditions under which you wish to be
notified for a particular resource using an operator (e.g. =,
not equal, >, >=, <, <=) and a value returned by the
monitor (e.g. UP, DOWN, INACTIVE). Text values are
mapped to numerical values. Specific values are in the
chapters describing the individual monitors.
When value changes This notification might be used for a resource that does
not change frequently, but you need to know each time it
does. For example, you would want notification each time
the number of mirrored copies of data changes from 2 to 1
and back to 2.
At each interval This sends notification at each polling interval. It would
most commonly be used for reminders or gathering data
for system analysis. Use this for only a small number of
resources at a time, and with long polling intervals of
several minutes or hours; there is a risk of affecting
system performance.
If you select conditional notification, you may select one or more of these options:
Initial Use this option as a baseline when monitoring resources such as
available filesystem space or system load. It can also be used to
test that events are being sent for a new request.
Repeat Use this option for urgent alerts. The Repeat option sends an
alert at each polling interval as long as the notify condition is
met. Use this option with caution; there is a risk of high CPU
use or filling log files and alert windows.
Return Use this option to track when emergency situations return to
normal.
22 Chapter 1
Page 23

Installing and Using EMS
Using EMS HA Monitors
NOTE Updated monitors may have new status values that change the meaning of your
monitoring requests, or generate new alerts.
For example, assume you have a request for notification if status > 3 for a resource
with a values range of 1-7. You would get alerts each time the value equaled 4, 5, 6,
or 7. If the updated version of the monitor has a new status value of 8, you w ould see
new alerts when the resource equalled 8.
What is a Polling Interval?
The polling interval determines the maximum amount of elapsed time before a
monitor knows about a change in status for a particular resource. The shorter the
polling interval, the more likely you are to hav e recent data. Ho we v er, depending on
the monitor, a short polling interval may use more CPU and system resources. You
need to weigh the advantages and disadvantages between being able to quickly
respond to events and maintaining good system performance.
The minimum polling interval depends on the monitor’s ability to process quickly.
For most resource monitors the minimum is 30 seconds. Disk monitor requests can
be as short as 1 second.
MC/ServiceGuard monitors resources every few seconds. You may want to use a
short polling interval (30 seconds or less) when it is critical that you make a quick
failover decision.
You may want a polling interval of 5 minutes or so for monitoring less critical
resources.
You may want to set a very long polling interval (4 hours) to monitor failed disks
that are not essential to the system, but which should be replaced in the next few
days.
Which Protocols Can I Use to Send Events?
You specify the protocol the EMS framework uses to send events in the Notify via:
section of the screen in Figure 1-6. The options are:
• opcmsg ITO sends messages to ITO applications via the opcmsg daemon. EMS
defines normal and abnormal differently for each notification type:
• Conditional notification defines all events that meet the condition as
abnormal, and all others as normal.
• Change notification defines all events as abnormal.
• Notification at each polling interval defines all events as normal.
Chapter 1 23
Page 24

Installing and Using EMS
Using EMS HA Monitors
You may specify the ITO message severity for both normal and abnormal events:
• Normal
• W arning
• Critical
• Minor
• Major
The ITO application group is EMS(HP), the message group, HA, and the object
is the full path of the resource being monitored.
See HP OpenView IT/Operations Administrators Task Guide (P/N
B4249-90003) for more information on configuring notification severity.
• SNMP traps
This sends messages to applications using SNMP traps, such as Network Node
Manager. See HP OpenView Using Network Node Manager (P/N J1169-90002)
for more information on configuring SNMP traps. The following traps are used
by EMS:
EMS_NORMAL_OID “1.3.6.1.4.1.11.2.3.1.7.0.1” - Normal notification
EMS_ABNORMAL_OID “1.3.6.1.4.1.11.2.3.1.7.0.2” - Abnormal notification
EMS_RESTART_OID “1.3.6.1.4.1.11.2.3.1.7.0.4” - Restart notification
• TCP and UDP
This sends TCP or UDP encoded events to the target host name and port
indicated for that request. Thus the message can be directed to a user-written
socket program.
Templates for configuring IT/Operations and Network Node Manager to display
EMS events can be found on the Hewlett-P ackard High Availability public web page
at http://www.hp.com/go/ha.
What is a Notification Comment?
The notification comment is useful for sending task reminders to the recipients of an
event. For example, if you have a disk monitor request that reports an alert that an
entire mirror has failed, when that event shows up in IT/Operations, for example,
you may want it to have the name of the person to contact if disks fail. If you have
configured MC/ServiceGuard package dependencies, you may want to enter the
package name as a comment in the corresponding pv_summary request.
24 Chapter 1
Page 25

Installing and Using EMS
Using EMS HA Monitors
Copying Monitoring Requests
There are two ways to use the copy function:
• To create requests for many resources using the same monitoring parameters,
select the monitoring request in the main screen and choose Actions: Copy
Monitoring Request. You need to have configured at least one similar request for
a similar instance. Choose a different resource instance in the Add a Monitoring
Request screen, and click <OK> in the Monitoring Request Parameters screen.
• To create many different requests for the same resource, select the monitoring
request in the main screen and choose Actions: Copy Monitoring Request. You
need to have configured at last one request for that resource. Click <OK> in the
Add a Monitoring Request screen, and modify the parameters in the Monitoring
Request Parameters screen. You may want to do this to create requests that send
events using multiple protocols.
Modifying Monitoring Requests
To change the monitoring parameters of a request, select the monitoring request
from the main screen and select Actions: Modify Monitoring Request.
Removing Monitoring Requests
Select one or more monitoring requests from the main screen and choose Actions:
Remove Monitoring Request. To start monitoring the resource again you must
recreate the request, either by copying a similar request for a similar resource or by
re-entering the data.
Chapter 1 25
Page 26

Installing and Using EMS
Using EMS HA Monitors
Configuring MC/ServiceGuard Package
Dependencies
This section describes how to use SAM to create package dependencies on EMS
resources. This creates an EMS request to monitor that resource and to notify
MC/ServiceGuard when that resource reaches a critical user-defined level.
MC/ServiceGuard will then failover the package. Here are some examples of how
EMS might be used:
• In a cluster where one copy of data is shared between all nodes in a cluster, you
may want to fail over a package if the host adapter has failed on the node
running the package. Because busses, controllers, and disks are shared, package
fail over to another node because of bus, controller, or disk failure would not
successfully run the package. To make sure you have proper failov er in a shared
data environment, you must create identical package dependencies on all nodes
in the cluster. MC/ServiceGuard can then compare the resource “UP” values on
all nodes and fail over to the node that has the correct resources available.
• In a cluster where each node has its own copy of data, you may want to fail o ver
a package to another node for any number of reasons:
• host adapter, bus, controller, or disk failure
• unprotected data (the number of copies is reduced to one)
• performance has degraded because one of the PV links has failed
In this sort of cluster of web servers, where each node has a copy of the data and
users are distributed for load balancing, you can fail over a package to another
node with the correct resources available. Again, the package resource
dependencies should be configured the same on all nodes.
This information for creating requests is also valid for EMS monitors sold with
other products (ATM or OTS, for example) and for user-written monitors written
according to developer specifications in Writing Monitors for the Event Monitoring
Service (EMS).
NOTE You should create the same requests on all nodes in an MC/ServiceGuard cluster.
A package can depend on any resource monitored by an EMS monitor. To create
package dependencies, choose create or modify a package from the Package
Configuration interface under the High Availability Clusters subarea of SAM,
Figure 1-7. You see a new option called “Specify Package Resource Dependencies.”
26 Chapter 1
Page 27

Figure 1-7 Package Configuration Screen
Installing and Using EMS
Using EMS HA Monitors
Click on “Specify Package Resource Dependencies...” to add EMS resources as
package dependencies; you see a screen similar to Figure 1-8. If you click “Add
Resource”, you get a screen similar to Figure 1-7 on page 27.
Chapter 1 27
Page 28

Installing and Using EMS
Using EMS HA Monitors
Figure 1-8 Package Resource Dependencies Screen
When you select a resource, either from the “Add a Resource” screen, or from the
“Package Resource Dependencies” screen by selecting a resource and clicking
“Modify Resource Dependencies...” you get a screen similar to Figure 1-9.
To make a package dependent on an EMS resource, select a Resource Up Value
from the list of A v ailable Resource Values, then click “ Add.” The example in Figure
1-9 shows the possible values for pv_summary. Different resources show different
available “Up” values.
NOTE Make sure you always select UP as one of the UP values. MC/ServiceGuard creates
an EMS request that sends an event if the resource value is not equal to the UP
value.
If you select UP, the package fails over if the value is anything but UP. If you select
UP and PVG-UP, the package fails over if the pv_summary value is not equal to UP
or PVG_UP; in other words, if pv_summary were SUSPECT or DOWN.
The polling interval determines the maximum amount of elapsed time before the
monitor knows about a change in resource status. For critical resources, you may
want to set a short polling interval, for example 30 seconds, which could adversely
affect system performance. With longer polling intervals you gain system
performance, but risk not detecting problems soon enough.
28 Chapter 1
Page 29

Figure 1-9 Resource Parameters Screen
Installing and Using EMS
Using EMS HA Monitors
You can also add resources as package dependencies by modifying the package
configuration file in /etc/cmcluster/pkg.ascii. See Managing
MC/ServiceGuard for details on how to modify this file. A example of the syntax is:
RESOURCE_NAME /vg/vg01/pv_summary
RESOURCE_POLLING_INTERVAL 60
RESOURCE_UP_VALUE = UP
RESOURCE_UP_VALUE = PVG_UP
Chapter 1 29
Page 30

Installing and Using EMS
Using EMS HA Monitors
30 Chapter 1
Page 31

2 Monitoring Disk Resources
This section recommends ways to configure requests to the disk monitor for most
high availability configurations.
31
Page 32

Monitoring Disk Resources
You can monitor the following SE (single-ended) or F/W (fast/wide) SCSI disks:
• Hewlett-Packard High Availability Disk Array, Models 10, and 20
• Hewlett-Packard Disk Array with AutoRAID, Models 12 and 12H
• EMC Symmetrix arrays
• High Availability Storage System
• Single-spindle SCSI disks
HP-IB and HP-FL disks are not supported by the disk monitor. FiberChannel disks
are not yet supported.
You should be familiar with how the physical and logical volumes are configured on
all the nodes in your system and whether disks are configured with redundant PV
links, mirroring, or both, or whether they are standalone disks. See HP-UX System
Administration Tasks. For more information on configuring disks in a high
availability environment, see the technical whitepaper Choosing the Right Disk
Technology in a High A vailability Environment by Bob Sauers. Other information is
available from the high availability web site at http://www.hp.com/go/ha.
32 Chapter 2
Page 33
Monitoring Disk Resources
Disk Monitor Reference
Disk Monitor Reference
The EMS disk monitor reports information on the physical and logical volumes
configured by LVM (Logical Volume Manager). Anything not configured through
LVM is not monitored from the disk monitor. Monitored disk resources are:
• Physical volume summary (/vg/vgName/pv_summary), a summary status of all
physical volumes in a volume group.
• Physical volume and physical volume link status
(/vg/vgname/pv_pvlink/status/deviceName), the status of a given physical
volume or PV links in a volume group.
• Logical volume summary (/vg/vgName/lv_summary), a summary status of all
logical volumes in a volume group.
• Logical volume status (/vg/vgName/lv/status/lvName), the status of a given
logical volume in a volume group.
• Logical volume copies (/vg/vgName/lv/copies/lvName), the number of copies of
data available in a volume group.
Monitoring both the physical and logical volumes allows you to detect failures in
both active and inactive volume groups and logical volumes and correct hardware
problems that put node, application, or data availability at risk.
Figure 2-1 shows the class hierarchy for the disk monitor.
Items in boxes are resource instances that can be monitored.
Items in italics change depending on the names of volume groups, devices, and
logical volumes on the system.
Figure 2-1 Disk Monitor Resource Class Hierarchy
/vg
/vgName
/pv_summary
/pv_pvlinks
/status
/deviceName
Chapter 2 33
/lv_summary
/status
/lvName
/lv/
/copies
/lvName
Page 34

Monitoring Disk Resources
Disk Monitor Reference
Physical Volume Summary
The pv_summary is a summary status of all physical volumes in a volume group.
This status is based on the compiled results of SCSI inquiries to all physical
volumes in a volume group; see “Physical Volume and Physical Volume Link
Status” on page 36.
If you have configured package dependencies in MC/ServiceGuard, this resource is
used to determine package failover based on access to physical disks. (See Chapter 1
for information on configuring MC/ServiceGuard package dependencies.) If you are
using the disk monitor with MC/ServiceGuard, it is important that you configure
physical volume groups (PVGs) to give you the most accurate pv_summary for
MC/ServiceGuard package failover. See “Rules for Using the EMS Disk Monitor
with MC/ServiceGuard” on page 40.
The value in Table 2-1 is used by the disk monitor to determine how conditions
compare in logical operations. For example, you may create a request that alerts you
when the condition is greater than or equal to SUSPECT. The numeric value allows
you to tell which conditions qualify.
Table 2-1 Interpreting Physical Volume Summary
Resource Name /vg/vgName/pv_summary
Condition Value Interpretation
UP 1 All physical volumes containing data are accessible.
PVG_UP 2 At least 1 PV has f ailed; all data is accessible. If more than 1 is down and the
failed PVs are from the same PVG, all data is still accessible.
This condition can only occur in mirrored set or if PV links in PVGs.
SUSPECT 3 Two or more physical volumes from different PVGs are unav ailable; the disk
monitor cannot conclude that all data is available.
For example, on a 2-way mirrored system, if a physical volume fails on each
side of the mirror, data may be available if the failed volumes are holding
different data. But data may be unavailable if the failed volumes hold the
same data. Because the disk monitor only knows disks have failed, and not
what data is on the disks, it marks the volume group SUSPECT.
DOWN 4 Some data missing or no data accessible.
34 Chapter 2
Page 35

Monitoring Disk Resources
Disk Monitor Reference
The pv_summary resource may not be available for a given volume group in the
following cases:
• Devices are on an unsupported bus (such as HP-IB or HP-FL) or an
unrecognized bus, in the case of a new bus technology. The /etc/syslog
entry would say:
diskmond[5699]: pv_summary will be unavailable for /dev/vg00 because there
are physical volumes in this volume group which are on an unrecognized bus.
(DRM-502)
• PVGs (physical volume groups) exist in a volume group, but not all physical
volumes are assigned to a PVG. The /etc/syslog entry would say:
diskmond[18323]: pv_summary will be unavailable for /dev/vgtest because the
physical volume groups (PVGs) in this volume group do not have an equal
number of PVs or there are PVs not in a PVG. (DRM-503)
• Unequal numbers of physical volumes exist in each PVG in the volume group.
The /etc/syslog entry would say:
diskmond[18323]: pv_summary will be unavailable for /dev/vgtest because the
physical volume groups (PVGs) in this volume group do not have an equal
number of PVs or there are PVs not in a PVG. (DRM-503)
Two cases where this would occur are:.
• There are both 2-way and 3-way mirroring in the same volume group.
• Mirrored disks are a different number of physical disks with the same total
disk mi4Gb drive in one PVG and 2 2G drives in the redundant PVG.
All checks for the validity of pv_summary are logged to both /etc/syslog and
/etc/opt/resmon/log/api.log with the name of the local node and the
identifier diskmond.
Chapter 2 35
Page 36

Monitoring Disk Resources
Disk Monitor Reference
Physical Volume and Physical Volume Link Status
Requests to monitor physical volumes and physical volume links give you status on
the individual physical volumes and PV links in a volume group. In the case of most
RAID arrays, this means the monitor can talk to the physical link to a logical unit
number (LUN) in the array. In the case of stand-alone disks, it means the monitor
can talk to the disk itself.
The pv_pvlink status is used to calculate pv_summary. Although it is somewhat
redundant to use both, you might want to have more specific status sent by
pv_summary, and only have status sent on pv_pvlinks if a device is DOWN.
Pv_pvlinks and pv_summary supplement lv_summary by giving status on the
accessibility of both active and inactive volume groups and logical volumes.
To pinpoint a failure to a particular disk, bus, or I/O card, you need to use the disk
monitor alerts in conjunction with standard troubleshooting methods: reading log
files, inspecting the actual devices. The disk monitor uses the data in
/etc/lvmtab to see what is available for monitoring, and /etc/lvmtab does
not distinguish between physical volumes and physical volume links, so you need to
do additional investigation to detect whether a disk, bus, or I/O card has failed.
The value in Table 2-2 is used by the disk monitor to determine how conditions
compare in logical operations. For example, you may create a request that alerts you
when the condition is greater than or equal to BUSY. The numeric value allows you
to tell which conditions qualify.
Table 2-2 Interpreting Physical Volume and Physical Volume Link Status
Resource Name /vg/vgName/pv_pvlink/status/deviceName
Condition Value Interpretation
UP 1 SCSI inquiry was successful.
BUSY 2 SCSI inquiry returned with DEVICE BUSY; the disk monitor will try 3 times
to see if it gets either an UP or DOWN result before marking a device BUSY.
DOWN 3 SCSI inquiry failed; either the bus or disk are not accessible.
When configuring requests from the SAM interface, a wildcard (*) may be used in
place of deviceName to monitor all physical volumes and physical volume links in a
volume group.
36 Chapter 2
Page 37

Monitoring Disk Resources
Disk Monitor Reference
Logical Volume Summary
The logical volume summary tells you how accessible the data is in all logical
volumes in an active volume group. Sometimes the physical connection may be
working, but the application cannot read or write data on the disk. The disk monitor
determines I/O activity by querying LVM, and marks a logical volume as DOWN if
a portion of its data is unavailable.
NOTE The disk monitor cannot determine data accessibility to logical volumes in an
inactive volume group.
The values in Table 2-3 are used by the disk monitor to determine how conditions
compare in logical operations. For example, you may create a request that alerts you
when the condition is greater than or equal to INACTIVE_DOWN.
Table 2-3 Interpreting Logical Volume Summary
Resource Name /vg/vgName/lv_summary
Condition Value Interpretation
UP 1 All logical volumes are accessible, all data is accessible.
INACTIVE 2 The volume group is inactive. This could be because:
• The volume group is active in e xclusive mode on another node
in an MC/ServiceGuard cluster. (This is not valid for clusters
running MC/LockManager, because it can support a volume
group being active on more than one node.) Note that
MC/ServiceGuard does allow a volume group to be active in
read-only mode, if it is already active on another node.
• The volume group was made inactiv e usingvgchange -a n
for maintenance or other reasons.
• There was not a quorum of active physical volumes at system
boot, i.e. not enough disks in the volume group were working.
INACTIVE_DOWN 3 The last time the inactive volume was activated, it was DOWN; at
least one logical volume in the volume was inaccessible
DOWN 4 At least one logical volume in the volume group reports a status of
either INA CTIVE or DOWN. Note that an inactive logical volume
in an active volume group is rare, but possible. See “Logical
Volume Status” on page 38.
Chapter 2 37
Page 38

Monitoring Disk Resources
Disk Monitor Reference
Logical Volume Status
Logical volume status gives you status on each logical volume in a volume group.
While the lv_summary tells whether data in a volume group is available, the
lv/status/lvName will tell you whether specific logical volumes have failed.
The value in Table 2-4 is used by the disk monitor to determine how conditions
compare in logical operations. For example, you may create a request that alerts you
when the condition is greater than or equal to INA CTIVE. The numeric value allo ws
you to tell which conditions qualify.
Table 2-4 Interpreting Logical Volume Status
Resource Name /vg/vgName/lv/status/lvName
Condition Value Interpretation
UP 1 All logical volumes are accessible, all data is accessible.
INACTIVE 2 The logical volume is inactive.
DOWN 3 The logical volume is DOWN, a complete copy of the data is not
available for this logical volume.
When configuring requests from the SAM interface, a wildcard (*) may be used in
place of lvName to monitor all logical volumes in a volume group.
If you split off mirrors from your mirrored configuration, you will see new logical
volume resource instances when the split mirror is created.
38 Chapter 2
Page 39

Logical Volume Number of Copies
The logical volume number of copies is most useful to monitor in a mirrored disk
configuration. It tells you how many copies of the data are available.
MirrorDisk/UX supports up to 3-way mirroring, so there can be from 0 to 3 copies
(see Table 2-5.) In a RAID configuration that is not mirrored using LVM, the only
possible number is 0 or 1; either the data is accessible or it isn’t.
Note that when you configure mirroring in L VM, it lists 0 mirrors to mean you have
one copy of the data. Likewise, 2 mirrors mean you have 3 copies of the data (one
original plus 2 mirrors). The disk monitor is monitoring all copies of data, and
therefore counts the “original” as part of the total number of copies.
Table 2-5 Interpreting Logical Volume Copies
Resource Name vg/vgName/lv/copies/lvName
Condition Interpretation
0 No copies, either physical parts of the disk array have problems,
the lv is inactive, or a physical extent is stale or unavailable.
Monitoring Disk Resources
Disk Monitor Reference
1 One complete copy of data available; if the data is not mirrored,
then all physical extents are fine, if data is mirrored, all other
copies have problems.
2 Two complete copies of data are available; if the data is two-way
mirrored, then all physical disks are up and data is available, if
3-way mirrored, at least one logical extent has a missing or stale
physical extent .
3 All copies of a 3-way mirror are available.
When configuring requests from the SAM interface, a wildcard (*) may be used in
place of lvName to request status for all logical volumes in a volume group.
If you split off mirrors from your mirrored configuration, you will see the number of
copies reduced by 1 when the split mirror is created.
Chapter 2 39
Page 40

Monitoring Disk Resources
Rules for Using the EMS Disk Monitor with MC/ServiceGuard
Rules for Using the EMS Disk Monitor
with MC/ServiceGuard
The disk monitor is designed especially for use with MC/ServiceGuard to provide
package failover if host adapters, busses, controllers, or disks fail. Here are some
examples:
• In a cluster where one copy of data is shared between all nodes in a cluster, you
may want to fail over a package if the host adapter has failed on the node
running the package. Because busses, controllers, and disks are shared, package
fail over to another node because of bus, controller, or disk failure would not
successfully run the package. To make sure you have proper failov er in a shared
data environment, you must create identical package dependencies on all nodes
in the cluster. MC/ServiceGuard can then compare the resource “UP” values on
all nodes and fail over to the node that has the correct resources available.
• In a cluster where each node has its own copy of data, you may want to fail o ver
a package to another node for any number of reasons:
• host adapter, bus, controller, or disk failure
• unprotected data (the number of copies is reduced to one)
• performance has degraded because one of the PV links has failed
For example, in a cluster of web servers where each node has a copy of the data
and users are distributed for load balancing, you can fail over a package to
another node with the correct resources available. Again, the package resource
dependencies should be configured the same on all nodes.
Disk availability is based on pv_summary. See “Configuring MC/ServiceGuard
Package Dependencies” in Chapter 1 for information on configuring package
dependencies.
In addition to configuring disks as MC/ServiceGuard package dependencies, you
may also want to have alerts sent to a system management tool such as HP
OpenView IT/Operations or Network Node Manager. Although MC/ServiceGuard
and EMS work together to provide package failover, they do not send events or log
the source of the failure. Also, failures may not cause a package to fail over, but may
expose a single point of failure that you want to know about. Therefore, it is
recommended you also configure requests from the SAM interface to EMS.
40 Chapter 2
Page 41

Monitoring Disk Resources
Rules for Using the EMS Disk Monitor with MC/ServiceGuard
The pv_summary is calculated based on the compiled results of SCSI inquiries to all
physical volumes in a volume group. To help you determine the best way to
configure your disks for monitoring, here are the assumptions made when
calculating pv_summary:
• PVGs (physical volume groups) are set up to be bus-specific sides of a mirror or
redundant links and have an equal number of physical volumes.
• All logical volumes within a volume group are mirrored in the same way: all
2-way or all 3-way mirroring.
• A package depends on all logical volumes in the volume group.
• The SCSI inquiry will retry on devices that are BUSY. BUSY devices are not
considered UP when calculating pv_summary.
These rules apply when creating PVGs, if they are not followed, pv_summary will
not be available for monitoring:
• If PVGs are used, all physical volumes in a volume group must be in a PVG.
• All PVGs in a volume group must have the same number of physical volumes.
Chapter 2 41
Page 42

Monitoring Disk Resources
Rules for Using the EMS Disk Monitor with MC/ServiceGuard
Table 2-6 is a summary of how pv_summary is calculated where
• n is the number of paths for the volume group in /etc/lvmtab, (physical
volumes, paths, or LUNs).
• p is the number of PVGs physical volume groups in the volume group.
• x is the number of paths currently available from a SCSI inquiry.
To give pv_summary the most accurate picture of data availability, you need to use
PVGs to define your physical volumes as separate access points to data: mirroring
should be PVG strict and arrays should have PV links, with redundant links in a
separate PVG. Note that if you do not configure PV links into separate PVGs, p in
T able 2-6 will al w ays be equal to 1. Therefore any SCSI inquiry that does not return
a value of UP for every path will result in a calculation of DOWN for pv_summary.
Table 2-6 pv_summary Calculations
Case Conclusion State
x = n All physical volumes and all data are available. UP
x=n-(p-1) All data is available. PVG_UP
If there are PVGs, and one PVG has all paths,
n/p <= x <= n-(p-1)
x < n/p Missing some data.
x=0 No data or physical volumes are available.
then all data is available.
If there are PVGs, and none of the PVGs has all
paths, then the disk monitor cannot determine if
all data is available.
Rules for RAID Arrays
RAID configurations must be configured with PV links. PV links are redundant
links attached to separate controllers on the array. If PV links are configured, LVM
automatically switches to the alternate controller when one fails.
To use the EMS disk monitor with MC/ServiceGuard, PV links must be configured
in a separate PVGS (physical volume groups). This new requirement allows
pv_summary to accurately calculate data availability based on physical volume
availability, thus including both ACTIVE and INACTIVE volume groups. If PV
42 Chapter 2
PVG_UP
SUSPECT
DOWN
Page 43

Monitoring Disk Resources
Rules for Using the EMS Disk Monitor with MC/ServiceGuard
links are not configured in separate PVGs, the disk monitor sees all links to the array
as one physical volume, so if one link fails, pv_summary will register DOWN, and
your package will fail over, even if the other link is still up and data is available.
The following sections describe how to make sure your PV links are in physical
volume groups.
Adding PVGs to Existing Volume Groups
If you have already created volume groups, you can create PVGs and put PV links
into them:
1. Create a file called /etc/lvmpvg with permissions 600. See the lvmpvg man
page and HP-UX System Administration Tasks
2. Create an entry for each volume group and assign a different PVG name to each
PV link. The PVG names can be any arbitrary name of your choosing, but must
be unique on the system For example, an array containing 2 volume groups,
vgdance and vgsing, each containing a single LUN and each with 2 PV links
(see Figure 2-4 on page 51) should have the following /etc/lvmpvg file:
VG /dev/vgdance
PVG busA
/dev/dsk/c1t0d0
/dev/dsk/c1t2d0
PVG busB
/dev/dsk/c2t1d0
/dev/dsk/c2t3d0
VG /dev/vgsing
PVG busA
/dev/dsk/c1t0d1
/dev/dsk/c1t2d1
PVG busB
/dev/dsk/c2t1d1
/dev/dsk/c2t3d1
3. Carefully copy the /etc/lvmpvg to each system connected to the disk array.
NOTE Make sure you edit lvmpvg to contain the correct link names in
/dev/dsk/device for that system.
Creating Volume Groups on Disk Arrays Using PV
Links
If you will be monitoring volume groups that use mass storage on disk arrays, you
should use redundant I/O channels from each node, connecting them to separate
controllers on the array. Then you can define alternate links to the LUNs or logical
disks you have defined on the array. Alternate links (known as PV links) to the same
disk should be assigned to different physical volume groups. In SAM, choose the
Chapter 2 43
Page 44

Monitoring Disk Resources
Rules for Using the EMS Disk Monitor with MC/ServiceGuard
type of disk array you wish to configure, and follow the menus to define alternate
links. Be sure to specify a different physical volume group for each link to the same
disk.
The following example shows how to configure alternate links using LVM
commands. In the example, the following disk configuration is assumed:
8/0.15.0 /dev/dsk/c0t15d0 /* I/O Channel 0 (8/0) SCSI address 15 LUN 0 */
8/0.15.1 /dev/dsk/c0t15d1 /* I/O Channel 0 (8/0) SCSI address 15 LUN 1 */
8/0.15.2 /dev/dsk/c0t15d2 /* I/O Channel 0 (8/0) SCSI address 15 LUN 2 */
8/0.15.3 /dev/dsk/c0t15d3 /* I/O Channel 0 (8/0) SCSI address 15 LUN 3 */
8/0.15.4 /dev/dsk/c0t15d4 /* I/O Channel 0 (8/0) SCSI address 15 LUN 4 */
8/0.15.5 /dev/dsk/c0t15d5 /* I/O Channel 0 (8/0) SCSI address 15 LUN 5 */
10/0.3.0 /dev/dsk/c1t3d0 /* I/O Channel 1 (10/0) SCSI address 3 LUN 0 */
10/0.3.1 /dev/dsk/c1t3d1 /* I/O Channel 1 (10/0) SCSI address 3 LUN 1 */
10/0.3.2 /dev/dsk/c1t3d2 /* I/O Channel 1 (10/0) SCSI address 3 LUN 2 */
10/0.3.3 /dev/dsk/c1t3d3 /* I/O Channel 1 (10/0) SCSI address 3 LUN 3 */
10/0.3.4 /dev/dsk/c1t3d4 /* I/O Channel 1 (10/0) SCSI address 3 LUN 4 */
10/0.3.5 /dev/dsk/c1t3d5 /* I/O Channel 1 (10/0) SCSI address 3 LUN 5 */
Assume that the disk array has been configured, and that both the following device
files appear for the same LUN (logical disk) when you run the ioscan command:
/dev/dsk/c0t15d0
/dev/dsk/c1t3d0
Use the following steps to configure a volume group for this logical disk:
1. First, set up the group directory for vgdatabase:
# mkdir /dev/vgdatabase
2. Next, create a control file named group in the directory /dev/vgdatabase, as
follows:
# mknod /dev/vgdatabase/group c 64 0xhh0000
The major number is always 64, and the hexadecimal minor number has the
form
0xhh0000
where hh must be unique to the volume group you are creating. Use an
appropriate hexadecimal number that is available on your system, after the
volume groups that are already configured. On a single system, this might be the
next hexadecimal number, on a cluster, these number must be assigned
cluster-wide, so it should be one of the hexadecimal numbers used in the cluster .
Use the following command to display a list of existing volume groups:
# ls -l /dev/*/group
3. Use the pvcreate command on one of the device files associated with the
LUN to define the LUN to LVM as a physical volume.
# pvcreate /dev/dsk/c0t15d0
It is only necessary to do this with one of the device file names for the LUN.
44 Chapter 2
Page 45

Monitoring Disk Resources
Rules for Using the EMS Disk Monitor with MC/ServiceGuard
4. Use the following commands to create the volume group itself with the first link
assigned to a physical volume group called bus1and the second link assigned to
a physical volume group called bus2:
# vgcreate -g bus1 /dev/vgdatabase /dev/dsk/c0t15d0
# vgextend -g bus2 /dev/vgdatabase /dev/dsk/c0t3d0
LVM will now recognize the I/O channel represented by /dev/dsk/c0t15d0 as the
primary link to the disk; if the primary link fails, LVM will automatically switch to
the alternate I/O channel represented by /dev/dsk/c1t3d0.
Creating Logical Volumes
Use the following command to create logical volumes (the example is for
/dev/vgdatabase):
# lvcreate -L 120 -m 1 -s g /dev/vgdatabase
This command creates a 120 MB mirrored volume named lvol1. The name is
supplied by default, since no name is specified in the command. The -s g option
means that mirroring is PVG-strict, that is, the mirror copies of data will be in
different physical volume groups.
NOTE If you are using disk arrays in RAID 1 or RAID 5 mode, omit the -m 1 option.
Chapter 2 45
Page 46

Monitoring Disk Resources
Rules for Using the EMS Disk Monitor with MC/ServiceGuard
Rules for Mirrored Individual Disks
The following rules apply to configuring mirrored disks for use with
MC/ServiceGuard and EMS monitoring:
• Mirroring must be PVG-strict.
Mirrored volumes must reside on a different bus from the original volume to
avoid a single point of failure and to obtain the best pv_summary value for that
mirror. This is done automatically by LVM if you created the PVGs while
setting up mirroring. See the lvextend man page and Managing
MC/ServiceGuard for more information.
• Logical volumes that are 2-way mirrored should be in separate volume groups
from those that are 3-way mirrored.
Putting differently mirrored volumes in the same volume group mak es it difficult
to accurately interpret the pv_summary data. Take the example of a volume
group containing both 2- and 3-way mirroring. If 2 host adapters fail on that
volume group, it could mean no data available for the 2-way mirrored logical
volume, but one copy still available for the 3-way mirrored volume. The
pv_summary would be wrong for one of those mirrored disk configurations.
• Volume groups representing the same hardware for failover must be created with
exactly the same name on all nodes.
For example a bus connecting 3 nodes to a disk array must be defined as part of
vg01 on all 3 nodes. We also recommend using the same names for PVGs
containing the same actual disks.
Mirrors that have been split off are treated the same by the disk monitor as they are
by LVM. When you split off a mirror you may see a change in the following
resources:
• /vg/vgName/lv/copies/lvName will be reduced by one when the mirror is split
off. If you created a monitoring request for that resource that alerts you when the
number of copies changes or is reduced, you may see an event.
• /vg/vgName/lv/status will have a new /lvName resource instance that represents
the split off mirror.
• /vg/vgName/lv_summary many change depending on the state of the new logical
volume created by the split mirror.
If you restore the split mirror normally using supported LVM commands, the disk
monitor will detect the merged mirror and reports
46 Chapter 2
Page 47

Monitoring Disk Resources
Creating Disk Monitoring Requests
Creating Disk Monitoring Requests
There are two ways to create disk monitor requests from:
• the SAM interface to EMS to send alerts to HP OpenView ITO, ClusterView, or
Network Node Manager.
• MC/ServiceGuard to configure any disk monitor resource as a package
dependency.
These requests are not exclusive: you can configure the disk monitor from both
MC/ServiceGuard and the SAM interface to EMS. In fact, if you are using EMS to
monitor disks for MC/ServiceGuard package dependencies, it is recommended you
also configure EMS to send events to your system monitoring software, e.g. HP
OpenView IT/Operations, so you are alerted when something threatens data or
application availability.
The following sections take some common disk configurations in a high av ailability
environment and give examples of the types of monitor requests you might want to
create.
Chapter 2 47
Page 48

Monitoring Disk Resources
Creating Disk Monitoring Requests
Disk Monitoring Request Suggestions
The examples listed in Table 2-7 are valid for both RAID and mirrored
configurations. For examples on configuring MC/ServiceGuard dependencies, see
Chapter 1, “Configuring MC/ServiceGuard Package Dependencies”.
Table 2-7 Suggestions for Creating Disk Monitor Requests
Monitoring Parameters
To be alerted when...
you are at risk for data
Resources to
monitor
Notify Value Option
pv_summary when value is >=
loss (most common for
use with
lv_summary when value is >=
MC/ServiceGuard)
any disks fail pv_pvlink/status/* when value is not
equal
any disks fail, and you
want to know when
pv_pvlink/status/* when value is not
equal
they are back up
you want regular
reminders to fix
inoperative disks,
controllers, busses,
and host adapters, and
pv_pvlink/status/* at each interval
(use a long
polling
interval, 1 hour
or more)
= DOWN
you want notification
when they are fixed
any logical volume
becomes unavailable
lv/status/* when value is... not
equal
SUSPECT
INACTIVE_
DOWN
UP
UP
UP
RETURN
REPEAT
RETURN
you have lost a mirror
in your 2-way
mirroring environment
lv/copies/* when value is... < 2
48 Chapter 2
Page 49
Monitoring Disk Resources
Creating Disk Monitoring Requests
The following screens step you through creating a disk monitor request. Assume
you want to be alerted when any disks fail and when they are back up. Figure 2-2
shows you can select all instances of pv_pvlink, so you only have to enter the
parameters once for each volume group.You still need to create multiple pv_pvlink
requests, one for each volume group on your system. Click OK to set monitoring
parameters.
Figure 2-2 Example: Selecting All Instances of /vg/vgName/pv_pvlink/status
Chapter 2 49
Page 50
Monitoring Disk Resources
Creating Disk Monitoring Requests
Assume you have a great need to know the status of your system at all times. You
would need a short polling interval, perhaps between 30 and 120 seconds. (If you
notice the disk monitor consumes too much CPU, you may want to set a longer
polling interval.) Assume also that you want an Initial event sent to make sure the
request is configured properly. You would want to set the Return option to send an
event when disks come back up. You would configure the events to use opcmsg
(ITO) protocol because you use HP OpenView IT/Operations as your system
management tool. The parameters for your monitoring request would look like
Figure 2-3.
Figure 2-3 Example: Configuring /vg/vgName/pv_pvlink/status Parameters to Notify
When Disks Fail
All requests are created in a similar way. You need to make sure you perform these
steps for all instances in all volume groups you want to monitor.
50 Chapter 2
Page 51
Monitoring Disk Resources
Creating Disk Monitoring Requests
Resources to Monitor for RAID Arrays
These considerations are relevant to all supported RAID configurations listed at the
beginning of this chapter. To adequately monitor a RAID system, create requests to
monitor at least the following resources for all volume groups on a node:
/vg/vgName/pv_summary This gives you an overview of the status of the entire physical volume
group and is recommended when using EMS in conjunction with
MC/ServiceGuard; see “Rules for Using the EMS Disk Monitor with
MC/ServiceGuard” on page 40.
vg/vgName/pv_pvlink/status/* This gives you the status of each PV link in the array and is redundant
to pv_summary. It is recommended when using EMS outside of the
MC/ServiceGuard environment, or if you require specific status on
each physical device.
vg/vgName/lv_summary This gives you the status of data availability on the array.
Figure 2-4 represents a node with two RAID arrays and two PV links to each are
Figure 2-4 RAID Array Example
Bus A for vgdance:
/dev/dsk/c1t0d0
/dev/dsk/c1t2d0
Bus A for vgdsing:
/dev/dsk/c1t0d1
/dev/dsk/c1t2d1
t0
vgdance
vgsing
Bus A (c1)
lun 0
lun1
Chapter 2 51
node1
Bus B (c2)
t1
lun 0
lun1
Bus B for vgdance:
/dev/dsk/c2t1d0
/dev/dsk/c2t3d0
Bus B for vgsing:
/dev/dsk/c2t1d1
/dev/dsk/c2t3d1
t2
lun 0
lun1
t3
lun 0
lun1
Page 52

Monitoring Disk Resources
Creating Disk Monitoring Requests
Each LUN on the RAID array is in it own volume group: vgdance and vgsing.
Assume this is one node in a 2-node cluster and you want to be notified when there
is a failover, when any physical device fails, and when any logical volume becomes
unavailable.
T o be notified when a package f ails o v er, you must configure an EMS request that is
the same as the package dependency you configured in MC/ServiceGuard. See
Chapter 1, “Configuring MC/ServiceGuard Package Dependencies”. For this
example, assume the package UP values were set as “UP” and “PVG_UP”.
To configure the EMS alerts, create the following requests:
Table 2-8 Sample Disk Monitoring Requests
Monitoring Parameters
Resource
Notify Condition Option
/vg/vgdance/pv_summary when value is... > PVG_UP RETURN
/vg/vgsing/pv_summary when value is... > PVG_UP RETURN
/vg/dance/lv_summary when value is... >= INACTIVE RETURN
/vg/vgsing/lv_summary when value is... >= INACTIVE RETURN
If pv_summary is SUSPECT, you know a physical device fails. If pv_summary
status is SUSPECT , you may want to look at your lv_summary to see if you can still
access all data. If lv_summary is DOWN or IN ACTIVE_DOWN, you do not hav e a
complete copy of data.
52 Chapter 2
Page 53

Monitoring Disk Resources
Creating Disk Monitoring Requests
Resources to Monitor for Mirrored Disks
This section is valid for mirrored disks created with MirrorDisk/UX. Mirroring is
required to be PVG-strict if you are using the disk monitor. Mirrored configurations
that are not PVG-strict will not give you a correct pv_summary.
To adequately monitor mirrored disks, create requests for the following resources
for all volume groups on a node:
/vg/vgName/pv_summary This gives you summary status of all physical volumes in a volume
group. A high availability system must be configured PVG strict. If
not, pv_summary cannot accurately determine disk availability.
vg/vgName/pv_pvlink/status/* This gives you the status of each physical disk and links.
vg/vgName/lv_summary This gives you the status of data availability for logical volumes.
vg/vgName/lv/copies/* This gives you the total number of copies of data currently available.
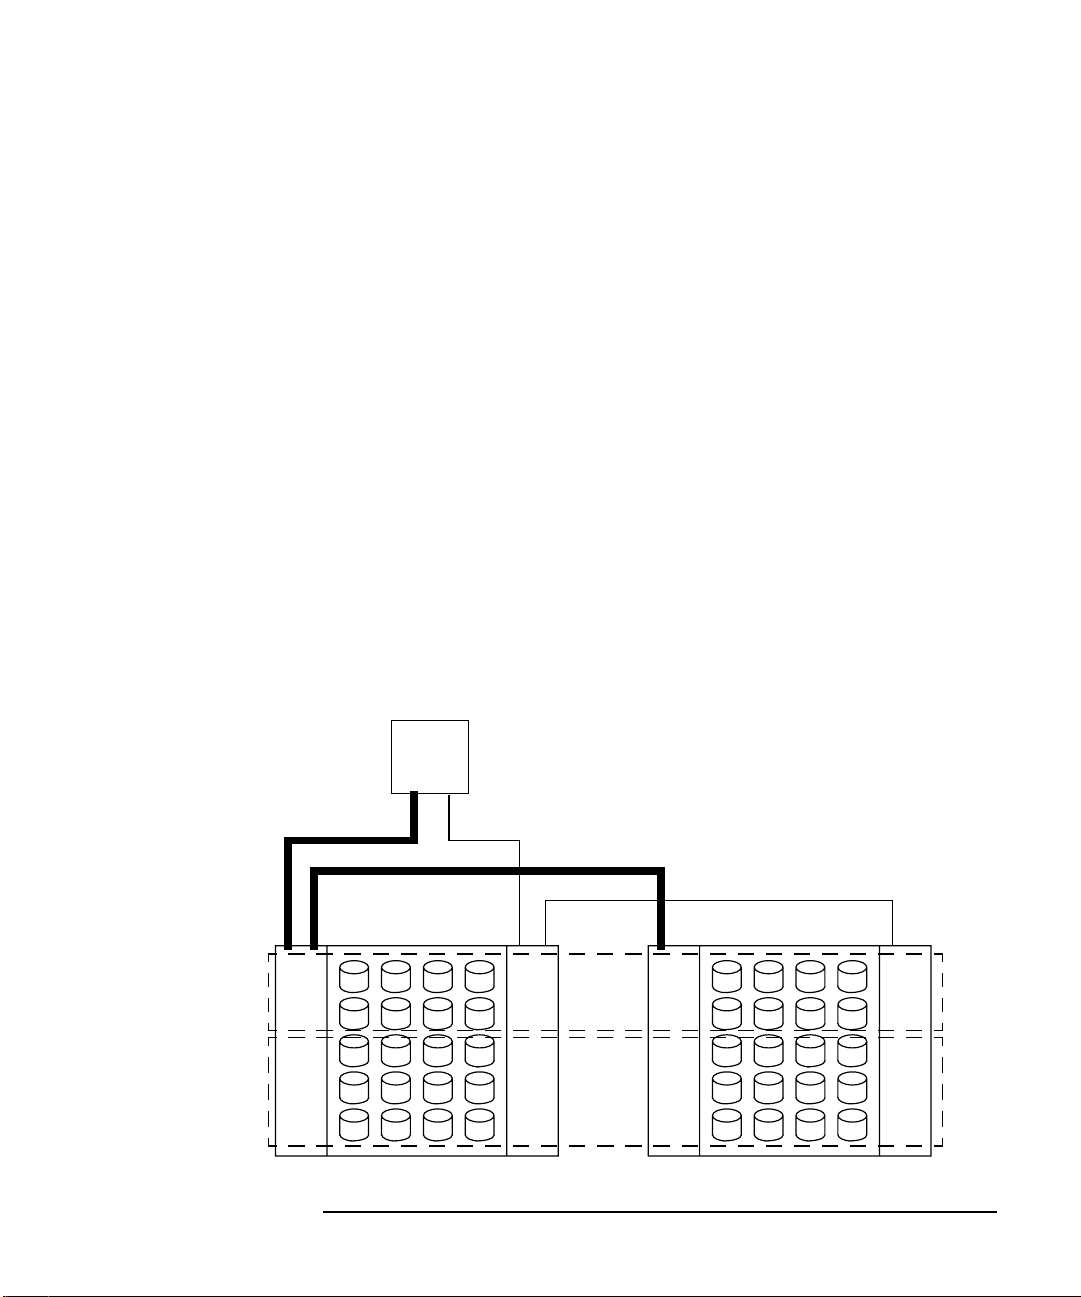
Figure 2-5 represents two nodes with 2-way mirrored configuration with 10 disks on
2 busses. Both copies are in a single volume group. Assume you want to be notified
when any physical device fails, and when you only have one copy of data, or when
there is an MC/ServiceGuard failover. To configure this last request, you must
duplicate your MC/ServiceGuard package dependency. See Chapter 1 “Configuring
MC/ServiceGuard Package Dependencies”.
Figure 2-5 Mirrored Disks Example
node1
/dev/dsk/c0t7d0
/dev/vg01
/dev/dsk/c0t8d0
/dev/dsk/c0t9d0
/dev/dsk/c0t10d0
/dev/dsk/c0t11d0
Chapter 2 53
node2
/dev/dsk/c1t7d0
/dev/dsk/c1t8d0
/dev/dsk/c1t9d0
/dev/dsk/c1t10d0
/dev/dsk/c1t11d0
Page 54

Resource
Monitoring Disk Resources
Creating Disk Monitoring Requests
To configure the EMS alerts, create the following requests on each node:
Monitoring Parameters
Notify Condition Option
/vg/vg01/pv_summary when value is... >= PVG_UP
/vg/vg01/lv_summary when value is... >=
INACTIVE RETURN
/vg/vg01/lv/copies/* when value is... <= 1
Alerts need to be interpreted in relation to each other. In the table above, you would
get an alert when PVG_UP is true. Although all data is available, the condition
PVG_UP implies there are physical volumes that are not functioning and need to be
fixed.You may want to examine lv/copies to see how many copies of data are
accessible and determine how urgently you need to repair the failures. If you have
3-way mirroring and only 1 copy of data is available, for example, you may want to
correct the failure immediately to eliminate the single point of failure. Table 2-9 is
an example of how the disk monitor determines whether data is available in a
mirrored configuration with 5 disks on each bus.
RETURN
RETURN
54 Chapter 2
Page 55

Monitoring Disk Resources
Creating Disk Monitoring Requests
Table 2-9 Example for Interpreting the pv_summary for Mirrored Disks
number of
valid
devices
10 all PVs and data accessible UP
9 1 PV down, all data accessible PVG_UP
8-5 if 5 PVs are from the same PVG, then all data is available PVG_UP
if 2 or more physical volumes from different PVGs are DO WN,
the disk monitor cannot conclude that all data is available
4-1 some data missing
0 no data available
meaning
pv_summary
value
SUSPECT
DOWN
Resources to Monitor for Lock Disks
Lock disks are used as a tie-breaker in a forming or reforming cluster, so if you are
using a lock disk with your cluster, you should request a monitor for that disk and
send an alert to your system management software if the lock disk is unavailable. If
the lock disk is unavailable during cluster formation, the cluster may fail to reform.
Requests to monitor the lock disk might look like this:
Monitoring Parameters
Resource
Notify Condition Option
/vg/vg02/pv_pvlink/c0t0d1 when value is >=
The Repeat value in the Options will send an alert until the lock disk is available.
You need to create a request on each node in the cluster. Because the bus name and
SCSI path to the lock disk may be different on each node, the resource instance may
have a different name. It is merely a different path to the same lock disk.
Chapter 2 55
BUSY RETURN
Page 56

Resource
Monitoring Disk Resources
Creating Disk Monitoring Requests
Resources to Monitor for Root Volumes
In a high availability system, it is recommended that you mirror your root volume,
and have them on separate links in separate PVGs. Note that the root volume should
always be ACTIVE. Requests to monitor the root volume might look like this:
Monitoring Parameters
Notify Condition Option
/vg/vg00/pv_pvlink/c0t0d0 when value is... >=
/vg/vg00/pv_pvlink/c1t0d0 when value is... >=
/vg/vg00/lv_summary when value is... not equal
/vg/vg00/lv/copies/lv01 when value is... < 1
If one of the root volumes is unavailable, you are alerted and told which one has
failed (pv_pvlink/status). If you lose a root disk mirror, you are alerted. You are also
notified when the mirror is restored.
BUSY REPEAT
BUSY REPEAT
UP RETURN
RETURN
56 Chapter 2
Page 57

3 Monitoring Cluster Resources
The EMS cluster monitor gives you the ability to send ev ents regarding the status of
a cluster. If you have OpenView, we recommend using HP ClusterView to monitor
cluster status and receive cluster events. The EMS cluster monitor is primarily for
use with non-OpenView systems, e.g. CA UniCenter.
57
Page 58

Monitoring Cluster Resources
Cluster Monitor Reference
Cluster Monitor Reference
The cluster monitor is useful in environments not running HP OpenView
ClusterView. The cluster monitor reports information on the status of the cluster to
which the local node belongs. The resources monitored are:
• Cluster status, (/cluster/status/clusterName), a summary of the state of all nodes
in the cluster name.
• Local node status, (/cluster/localNode/status/clusterName), the status of a given
node in a cluster; if the node is part of more than one cluster, status is given for
each cluster to which that node belongs.
• Package status, (/cluster/package/status/packageName), the status of an
MC/ServiceGuard package on a node/cluster.
To fix any problems detected by the cluster monitor, refer to Managing MC/Service
Guard.
Figure 3-1 Cluster Monitor Resource Class Hierarchy
/cluster
/status
/clusterName
/localNode
/package
/status
/packageName
Figure 3-1 shows the cluster monitor class hierarchy.
Items in boxes are resource instances that can be monitored.
Items in italics change depending on the names of the clusters and packages on the
system.
58 Chapter 3
/status
/clusterName
Page 59

Monitoring Cluster Resources
Cluster Monitor Reference
Cluster Status
The cluster status is the status of the MC/ServiceGuard cluster to which this node
belongs.The status is from the perspective of the node for which the request was
created.
The MIB variable hpmcClusterState, which is part of the hp-mcCluster MIB,
provides the cluster status information to the monitor.
The cmviewcl -v command displays detailed information about the current
status of the cluster and packages on the cluster.
Table 3-1 Interpreting Custer Status
Resource Name /cluster/status/clusterName
Condition Value Interpretation
UP 1 The node can access the cluster.
UNKNOWN 2 The node may be separated from other active cluster elements (for
example the heartbeat LAN) and has insufficient information to tell if the
cluster is accessible.
DOWN 3 The node cannot access the cluster.
You might request to be notified when the cluster is not up. You could then verify
that the cluster was shut down intentionally.
The minimum polling interval for cluster status is 30 seconds. You may want a
longer interval, especially if system performance is affected.
Chapter 3 59
Page 60

Monitoring Cluster Resources
Cluster Monitor Reference
Node Status
The node status is the current status of a node relative to a particular cluster.
The MIB variable hpmcClusterState, which is part of the hp-mcCluster MIB,
provides the node status information to the monitor.
The cmviewcl -v command displays detailed information about the current
status of the cluster and packages on the cluster.
Table 3-2 Interpreting Node Status
Resource Name /cluster/localNode/status/clusterName
Condition Value Interpretation
RUNNING 1 Node is accessible and operating normally.
INITIALIZING 2 Node’s daemon has started, but is not ready to communicate with
other nodes’ daemons.
RECONFIGURING 3 Node is running protocols to make sure all other nodes agree to the
new membership in the cluster.
INVALID 4 The cluster status may be DOWN.
HALTED 5 Node has been removed from the cluster, with the cmhaltnode
command, for example.
FAILED 6 Node is no longer a member of an active cluster.
You might want to create a request that notifies you when the local node is not
running. You can then verify that the node or MC/ServiceGuard was stopped
intentionally.
The minimum polling interval for cluster status is 30 seconds. You may want a
longer interval, especially if system performance is affected.
60 Chapter 3
Page 61

Monitoring Cluster Resources
Cluster Monitor Reference
Package Status
The package status is the status of each package running on this node.
The MIB variable hpmcClusterState, which is part of the hp-mcCluster MIB,
provides the package status information to the monitor.
The cmviewcl -v command displays detailed information about the current
status of the cluster and packages on the cluster.
Table 3-3 Interpreting Package Status
Resource Name /cluster/package/status/packageName
Condition Value Interpretation
UP 1 The package is running on the local node.
UNKNOWN 2 The package is not running on the local node, but may be running on
another node in the cluster.
DOWN 3 The package is not running on any node in the cluster.
You might want to be notified when the value of any of the packages changes to
UNKNOWN or DOWN, so you can verify that MC/ServiceGuard successfully
migrated the package to another system.
You may see many packages with UNKNOWN status. This is because only the node
running a package has complete status for a package. Other nodes often have
inactive volume groups that make it impossible to have complete knowledge of
package status. If a package is running on another node in the cluster, the current
node may not have complete status on that package, and reports the condition
UNKNOWN.
The minimum polling interval for cluster status is 30 seconds. You may want a
longer interval, especially if system performance is affected.
Chapter 3 61
Page 62

Monitoring Cluster Resources
Creating Cluster Monitoring Requests
Creating Cluster Monitoring Requests
For most MC/ServiceGuard or cluster configurations, we suggest creating the
following requests on each node for each cluster to which the node belongs:
Table 3-4 Recommended Cluster Requests
Resources to monitor
Notify Value Option
Monitoring Parameters
/cluster/status/clusterName when value is not equal
/cluster/localNode/status/clusterName when value is not equal RUNNING
/cluster/package/status/packageName when value is not equal
The INITIAL option is recommended for comparison, so you know the state of all
nodes, clusters, and packages when you first start monitoring them.
UP INITIAL
UP INITIAL
INITIAL
62 Chapter 3
Page 63

4 Monitoring Network Interfaces
The network interface monitor detects whether your LAN interface is up or down. It
allows you to send events to a system management interface as an alternative to
looking in syslog for LAN status.
63
Page 64

Monitoring Network Interfaces
Network Monitor Reference
Network Monitor Reference
The network monitor provides status on the LAN interfaces in a given node. It
monitors all interfaces visible when you run the lanscan command on a system.
Figure 4-1 Network Monitor Resource Class Hierarchy
/net
/interfaces
/lan
/status
/LANname
The MIB variable ifOperStatus, which is part of MIB-2, provides the LAN
interface status to the monitor. The MIB value of TESTING is reported by the
monitor as DOWN.
To verify the operational status of the LAN interface, use the lanscan (1M) or
lanadmin(1M) commands.
Table 4-1 Interpreting LAN Interface Status
Resource Name /net/interfaces/lan/status/LANname
Condition Value Interpretation
UP 1 The LAN interface is sending and receiving packets.
DOWN 2 The LAN interface is not passing operational packets.
EMS HA Monitors depend on TCP/IP (or UDP) to send events to targets such as HP
OpenView IT/Operations or MC/ServiceGuard; see “Which Protocols Can I Use to
Send Events” in Chapter 1. If all LAN interfaces on a subnet fail, notifications may
not be received by a remote target.
64 Chapter 4
Page 65

Monitoring Network Interfaces
Network Monitor Reference
Standby LANs are reported as DOWN unless they have been activated to replace a
failed LAN interface.
The minimum polling interval is 30 seconds.
Chapter 4 65
Page 66

Monitoring Network Interfaces
Configuring Network Monitoring Requests
Configuring Network Monitoring Requests
Table 4-2 recommends monitoring requests for each node. With these requests, you
would see events when a LAN card fails, and again when it came back up, and you
would see an event each hour as long as the LAN card was down. You may elect to
change the polling interval or not to configure a reminder at all.
Table 4-2 Recommended LAN Interface Requests
Monitoring Parameters
Resources to monitor
Notify Value Option
/net/interfaces/lan/status/LANname when value is <
/net/interfaces/lan/status/LANname when value is = DOWN
UP RETURN
REPEAT
Polling
Interval
30 sec.
1 hour
66 Chapter 4
Page 67

5 Monitoring System Resources
The system resource monitor gives you the ability to send events about the number
of users, available file system space, and job queues to help you load balance and
tune your system to keep it available. It is an alternative to reading syslog files to
get this information.
67
Page 68
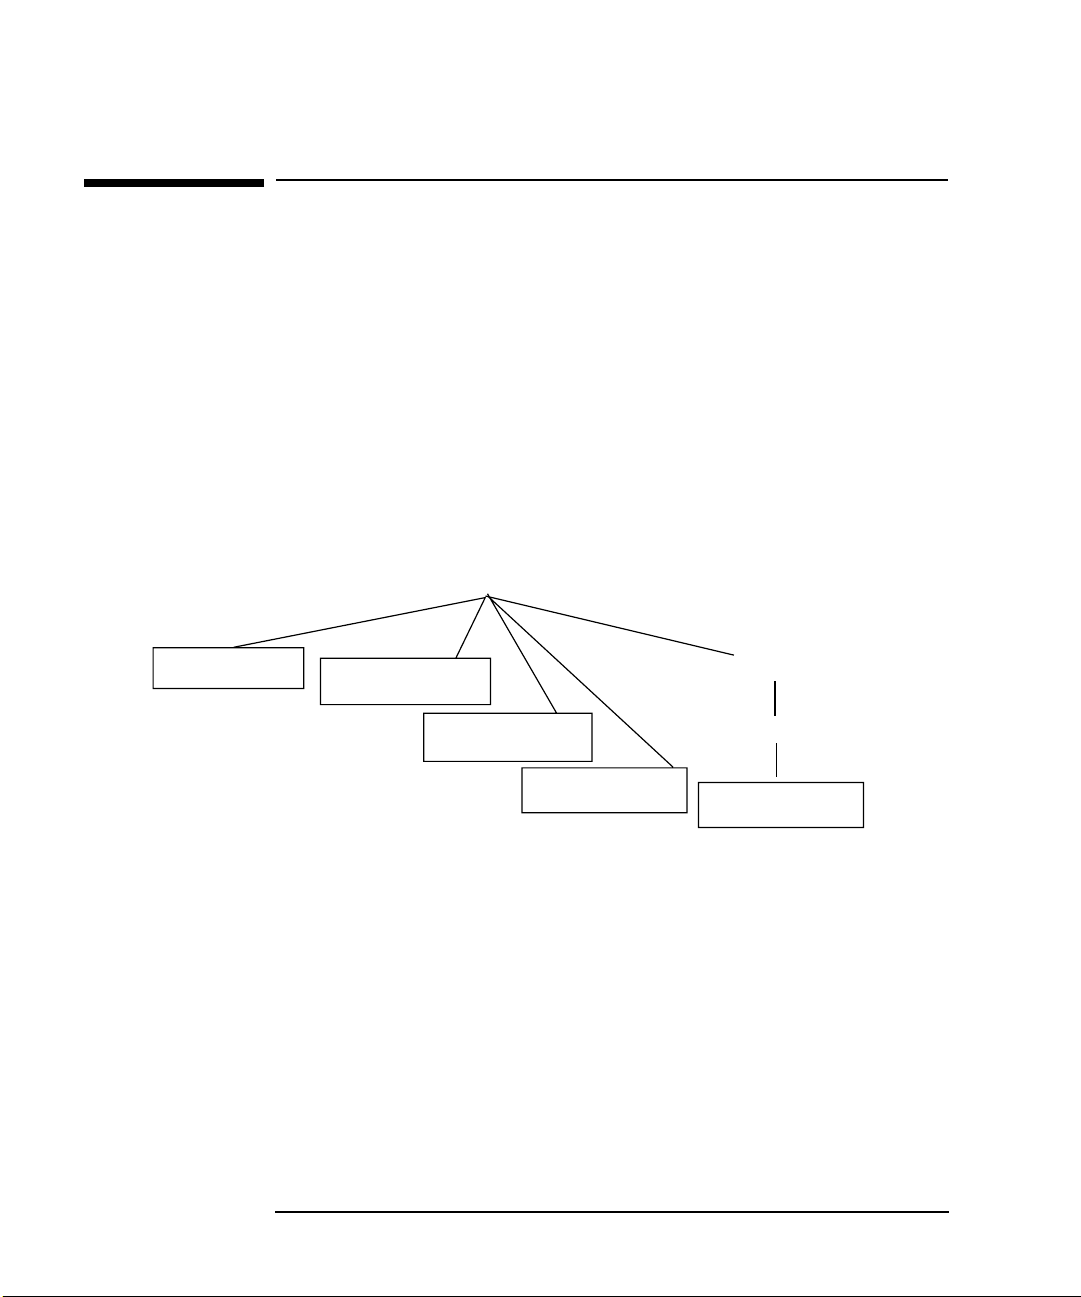
Monitoring System Resources
System Monitor Reference
System Monitor Reference
The system monitor reports information on system resources:
• number of users, (/system/numUsers) tells you the number of users on a given
node.
• job queues, (/system/jobQueue1Min, /system/jobQueue5Min, and
/system/jobQueue15Min) tells you the number of processes waiting for CPU
and performing disk I/O as an average over 1, 5, and 15 minutes respectively.
This is the same as the load averages reported by uptime (1).
• file system free space, (/system/filesystem/availMb/fsName) tells you the
number of megabytes available for use in each filesystemfsName on the system.
Figure 5-1 System Resource Monitor Class Hierarchy
/system
/numUsers
/jobQueue1Min
/jobQueue5Min
/jobQueue15Min
Figure 5-1 shows the system resource monitor hierarchy.
Items in boxes are resource instances that can be monitored. The fsName in italics
changes depending on the names of the file systems.
68 Chapter 5
/filesystem
/availMb
/fsName
Page 69

Monitoring System Resources
System Monitor Reference
Number of Users
The number of users tells you how many users are logged in to a given system.
The MIB variable computerSystemUsers from the hp-unix MIB provides the
resource value to the monitor.
To verify the number of users on the system, use the uptime (1) command.
Table 5-1 Interpreting Number of Users
Resource Name Value Range Interpretation
/system/numUsers integer Total number of users logged in to the node.
Alerts for number of users can be used to check number of users on the system to
determine the best time to run backups or other maintenance, or to disallow more
than a certain number of users on a given system for load-balancing.
The minimum polling interval is 30 seconds. We recommend a longer interval; short
polling intervals may adversely affect system performance.
Chapter 5 69
Page 70

Monitoring System Resources
System Monitor Reference
Job Queues
The job queue monitor checks the average number of processes that have been
waiting for CPU and performing disk I/O over the last 1, 5, or 15 minutes. A value
of 4 in /system/jobQueue5Min means that at the time of polling there was an
average of 4 jobs in the queue over the last 5 minutes.
The MIB variables computerSystemAvgJobs1,
computerSystemAvgJobs5, and computerSystemAvgJobs15 from the
hp-unix MIB provides the resource value to the monitor.
To verify the load averages on the system, use the uptime (1) command.
Table 5-2 Interpreting Job Queues
Resource Name
/system/jobQueue1Min integer Average number of jobs in the queue in the last
/system/jobQueue5Min integer Average number of jobs in the queue in the last 5
/system/jobQueue15Min integer Average number of jobs in the queue in the last 15
The minimum polling interval is 30 seconds. Unless your system load tends to
fluctuate wildly and need load-balancing attention frequently, set a polling interval
greater than or equal to the job queue interval: 1, 5, and 15 minutes, respectively.
Value
Range
Interpretation
minute.
minutes.
minutes.
70 Chapter 5
Page 71

Filesystem Available Space
The filesystem monitor checks the number of megabytes available for use in each
file system on the node. File systems must be mounted and active to be monitored.
File systems mounted over the network, such as NFS file systems, are not
monitored.
The MIB variables fileSystemBavail, and fileSystemBsize from the
hp-unix MIB are used to calculate the number of available Kb in the file systems.
The number is then divided by 1024 to get the number of available Mb.
Table 5-3 Filesystem Available Space
Most common names are:
/system/filesystem/availMb/stand
/system/filesystem/availMb/root
/system/filesystem/availMb/home
/system/filesystem/availMb/opt
/system/filesystem/availMb/tmp_users
/system/filesystem/availMb/usr
/system/filesystem/availMb/var
Monitoring System Resources
System Monitor Reference
Resource Name
You may have more file systems, or different names, depending on how you
configured file systems on your system. You can monitor when a file system starts
filling up so you can clean up old files or add disk space and reconfigure your file
systems.
NOTE Because the “/” character is not valid in a resource name, it is replaced by the “_”
character. So the file system /tmp/users would appear as the resource name
/system/filesystem/availMb/tmp_users. For the same reason the root file system (/)
is replaced by the name “root”.
The minimum polling interval is 30 seconds. We recommend a longer interval; short
polling intervals may adversely affect system performance.
When configuring requests from the SAM interface, a wildcard (*) is available to
monitor all file systems on a system.
Chapter 5 71
Page 72

Monitoring System Resources
Creating System Resource Monitoring Requests
Creating System Resource Monitoring Requests
Table 5-4 shows examples of how you might monitor system resources.
Table 5-4 Examples of System Resource Requests
To be alerted
when...
fewer than 5
users are on the
node, for running
backups
more than 20
users are on the
node, for load
balancing, and
when value
returns to below
20 users
system load is
high
file systems are
running out of
space
Monitoring Parameters
Resources to monitor
Notify Value Option
/system/numUsers when value is < 5
/system/numUsers when value is > 20 RETURN
/system/jobQueue1Min when value is > 7 INITIAL
/system/jobQueue5Min when value is > 4
/system/jobQueue15Min when value is > 3 INITIAL
/system/filesystem/availMb for:
/home
/opt
/root
/stand
/tmp
/usr
/var
when value is < 50
INITIAL
INITIAL
The job queue and file system resources have the INITIAL option set to give a
baseline for comparison. The job queue threshold value decreases for the longer job
queues because the longer something is in the queue, the more likely it is that a node
needs to be load balanced.
72 Chapter 5
Page 73

6 Troubleshooting
This section gives hints on testing your monitoring requests, and gives you some
information about log files and monitor behavior that will help you determine the
cause of problems. For information on fixing problems detected by monitors; see the
list of related publications in the Preface.
73
Page 74

T roubleshooting
EMS Directories and Files
EMS Directories and Files
EMS files are located in /etc/opt/resmon and /opt/resmon. The following
is a description of files and directories that might help you determine the cause of
some problems:
/etc/opt/resmon/config
A file that sets the restart interval for monitor persistence.
/etc/opt/resmon/dictionary
A directory that contains resource dictionaries for the various
monitors. The disk monitor resources are listed in
diskmond.dict and the cluster, network, and system resource
monitors are in the mibmond.dict. If you were writing your
own monitor, the dictionary would go in this directory.
/etc/opt/resmon/lbin
A directory where all the monitor daemons live. Some important
daemons in the directory:
p_client restarts any failed monitors based on information in
the config file.
registrar handles passing monitoring requests to the correct
monitors, and sending qualifying events out in the correct protocol
format.
74 Chapter 6
Page 75

/etc/opt/resmon/log
A directory of log files used by EMS:
client.log stores calls made by clients, such as
MC/ServiceGuard or the SAM interface to EMS.
api.log stores api calls made by monitors.
registrar.log contains errors found when read the resource
dictionary.
/opt/resmon/resls
A command that lists the latest polled status of the specified
resource on a specified system.
Troubleshooting
EMS Directories and Files
Chapter 6 75
Page 76

T roubleshooting
Logging and tracing
Logging and tracing
Use logging for most troubleshooting activities. By default the monitors log to
api.log and client.log. Logging to /var/adm/syslog/syslog.log
is on by default for the disk monitor and off by default for the remaining monitors.
Tracing should only be used when instructed to do so by HP support personnel.
EMS Logging
As mentioned in the previous section, log files in /etc/opt/resmon/log /
contain information logged by the monitors.
Look at the client.log if you seem to be having a problem with the SAM
interfaces to EMS or MC/ServiceGuard. With the default le vel of logging, only audit
and error messages are logged. An example of an audit message is:
User event occurred at Thu Jul 31 16:13:31 1997
Process ID: 10404 (client) Log Level:Audit
+ /vg/vg00/lv/copies/* (8 instances) If (<1), OpC
(m/n), 18000s, Thu Jul 31 16:13:31 1997
The “+” means that request has been added. A “-” indicates a removal. A “-”
followed by a “+” indicates a modification. Events sent to targets are marked with
“.”. Errors are marked with Log Level: Error or Warning.
Look at the api.log if you seem to be having a problem with a specific monitor.
Check for warnings or errors.
Logging to /var/adm/syslog/syslog.log is enabled with the -l option by
default for the disk monitor only. Although it is not recommended, you can turn off
logging modify the diskmond.dict file in
/etc/opt/resmon/dictionary and remove -l from the monitor:
MONITOR: /etc/opt/resmon/lbin/diskmond
Logging to /var/adm/syslog/syslog.log is disabled by default for the
other monitors. To enable logging, modify the mibmond.dict file in
/etc/opt/resmon/dictionary and add -l from the monitor:
MONITOR: /etc/opt/resmon/lbin/diskmond -l
NOTE Logging will occur at every polling interval. This can create a very large syslog
file, so you may only want to use logging when you are troubleshooting.
76 Chapter 6
Page 77

Troubleshooting
Logging and tracing
Entries in /var/adm/syslog/syslog.log are marked with the monitor
daemon name, e.g. diskmond or fsmond, followed by the resource name and logging
data. Additions, deletions, notifications, and changes in resource states are logged.
Errors explaining why a resource is not available for monitoring, or why the monitor
cannot access a resource are also logged in /var/adm/syslog/syslog.log.
Look at the registrar.log if you are having trouble finding resources that you
suspect exist on your system. This log contains any errors that were encountered
when trying to read the dictionary. If a dictionary was corrupted in any way, the
registrar would not be able to read it, and EMS would not be able to find the
resources associated with that dictionary.
EMS Tracing
Tracing is used when debugging monitor code.
Use the -d option to turn on tracing for EMS monitors. Tracing should only be used
at the request of your HP support personnel when trying to determine if there may
be a problem with the EMS HA monitors. To turn on tracing, modify the .dict
file in /etc/opt/resmon/dictionary and add -d to the monitor you would
like to trace:
MONITOR: /etc/opt/resmon/lbin/diskmond -l -d
Kill the monitor process. The monitor will automatically restart with tracing
enabled. T o speed up monitor restart, use theresls command with the top level of
the resource class as an argument, for example, resls /vg.
Tracing is logged to /etc/opt/resmon/log/diskmond.log for the disk
monitor and /etc/opt/resmon/log/mibmond.log for all other monitors
Chapter 6 77
Page 78

T roubleshooting
Performance Considerations
Performance Considerations
Monitoring your system, although an important part of high-availability, consumes
system resources. You must carefully consider your performance needs against your
need to know as soon as possible when a failure threatens availability.
System Performance Issues
The primary performance impact will be related to the polling interval and the
number of resources being monitored. You need to balance your need to quickly
detect failures with your need for system performance and adjust the number of
resources you monitor and the polling intervals accordingly.
For example, pv_pvlink/status resource comprise the pv_summary resource. You
may only want to create one pv_summary monitoring request rather than monitoring
both pv_summary and pv_pvlink/status for all disks.
For polling intervals, you may want to set a short interval, 30 seconds, for resources
for require quick response after failure, and set a longer polling interval, 5 minutes
or more, for all other resources.
Network Performance Issues
Although monitoring is not likely to affect network performance, you may want to
make sure that only necessary messages are being sent. Make sure your monitor
requests are configured such that you are being notified only for things you really
need to know.
78 Chapter 6
Page 79

Troubleshooting
Testing Monitor Requests
Testing Monitor Requests
T o test that events are being sent, use the INITIAL option available with conditional
notification when creating a monitoring request. This option sends an initial event
that you can examine to make sure your request is properly configured and showing
up in the correct system management tool.
An alternative is to use the “At each interval” notification to test that events are
being sent in the correct system management tool. Once you establish that events are
being sent properly, you can modify the request.
Testing Disk Monitor Requests
Configuring the INITIAL option may be enough. However, if you want to test that
events are sent when a disk fails, you may want to detach the b us or power down the
storage devices and see if events are sent to the proper application, or if
MC/ServiceGuard fails over the appropriate package. This is only recommended on
clusters that are off-line, and not being accessed by users.
To test /vg/vgName/lv/copies and /vg/vgName/lv/status, use the vgchange
command to deactivate and activate the volume group and see if the proper alerts
were sent.
Testing Cluster Monitor Requests
Use the cmviewcl -v command to display detailed information about the current
status of the cluster and packages on the cluster. The EMS cluster monitor should
return the same values as this command.
Testing Network Monitor Requests
If you want to test whether events are sent in case of network failure, use the
/usr/bin/ifconfig LANname down command to bring a card down, and
examine the event to make sure it shows up in the correct system management tool.
Testing System Resource Monitor Requests
Use the uptime command to verify the number of user and system load. The EMS
system resource monitor should return the sam values as this command.
Chapter 6 79
Page 80

T roubleshooting
Testing Monitor Requests
Making Sure Monitors are Running
Monitor daemons automatically start when you create a request to monitor
something. Because monitoring is designed to work in a high availability
environment, monitors are written to automatically restart if anything causes them to
fail.
A daemon called p_client restarts all appropriate monitors using the monitor
restart interval defined in /etc/opt/resmon/config. Therefore, a monitor
cannot be permanently stopped or started by a human.
Because the monitors are persistent, monitoring requests are kept when you install a
new monitor or update an existing monitor. If a condition, such as “status > 3” is
being monitored for a resources that has a range of 1-7, and new version of monitor
is installed that supports a new status value, such as “8”, you may start seeing
notifications for “status=8”.
If all monitors are running, you will see the following daemons:
diskmond if you are monitoring physical or logical volumes
clustermond if you are monitoring cluster or node status
pkgmond if you are monitoring MC/ServiceGuard package status
lanmond if you are monitoring network interfaces
mibmond if you are monitoring users or job queues
fsmond if you are monitoring available filesystem space
Clustermond, pkgmond, lanmond, mibmond, and fsmond are implemented via a
program called the MIB monitor. For the MIB monitor to function correctly, the
SNMP Master Agent and the appropriate subagents must be running on the system
being monitored. See snmpdm(1M) for more information.
80 Chapter 6
Page 81

Glossary
A-H
alert An event. A message sent to warn
a user or application when certain
conditions are met.
client The application that creates or cancels requests to monitor particular resources. The consumer of a resource status message. A user of the Resource Monitor framework. This user may browse resources, request status, and make requests to have resources monitored. Examples are MC/ ServiceGuard as it starts a package or the SAM interface to EMS.
event An alert.
I-K
ITO HP OpenView IT/Operations,
formerly known as OperationsCenter.
L
logical extent The basic allocation unit
for a logical volume is called a logical
extent. For mirrored logical volumes,
either two or three physical extents are
mapped for each logical extent,
depending on whether you are using 2way or 3-way mirroring.
logical volume A collection of disk space from one or more disks. Each collection appears to the operating system as a single disk. Like disks, logical volumes can be used to hold file systems, raw data areas, dump areas, or swap areas. Unlike disks, logical volumes can be given a size when they are created, and a logical volume can later be expanded or reduced. Also, logical volumes can be spread over multiple disks.
LUN (Logical Unit Numbers) A logical
disk device composed of one or more
physical disk mechanisms, typically
configured into a RAID level.
LVM (Logical Volume Manager)
Manages disks in volume groups, and
allows you to create logical and physical
volume groupings.
M
MIB (Management Information Base).
A document that describes objects to be
managed. A MIB is created using a
grammar defined in “Structure of
Management Information” (SMI)
format. This grammar concisely defines
the objects being managed, the data
types these objects take, descriptions of
how the objects can be used, whether
the objects are read-only or read-write,
and identifiers for the objects.
Glossary 81
Page 82

Glossary
MIB II (MIB2) A MIB that defines
information about the system, the
network interface cards it contains,
routing information it contains, the TCP
and UDP sockets it contains and their
states, and various statistics related to
error counts. This MIB is widely
adopted and is served by most IPaddressed devices. Most system and
network resources managed by EMS
HA Monitors are taken from this MIB.
monitor See resource monitor.
N-P
notification See alert.
physical extent LVM divides each
physical disk into addressed units called
physical extents.
physical volume A disk that has been initialized as an LVM disk.
PVG (physical volume group) A grouping of physical devices: host adapters, busses, controllers, or disks, that allow LVM to manage redundant links or mirrored disks and access the redundant hardware when the primary hardware fails.
PV links A method of LVM configuration that allows you to provide redundant SCSI interfaces and buses to
disk arrays, thereby protecting against
single points of failure in SCSI cards
and cables.
polling The process by which a monitor obtains the most recent status of a
resource.
Q-R
registrar The registrar process
provides the link between resource
status consumers (clients) and resource
status providers (resource monitors).
The central part of the resource monitor
framework which uses the resource
dictionary to act as an intermediary
between client systems and resource
monitors.
resource May be any entity a monitor application developer names. Examples include a network interface, CPU statistics, a MIB object, or a network service.
resource class A category of resources useful during configuration. For example, /net/interfaces/lan/status is provided as a resource class.
resource dictionary A file describing the hierarchy of resources that can be monitored and the processes that perform the resource monitoring.
82 Glossary
Page 83

Glossary
resource instance The actual
monitorable resource. For example, /net/
interfaces/lan/status/lan0 may refer to a
particular network interface installed on
the monitored system.
resource monitor A framework for selecting resources of interest and monitoring them according to the user's criteria. When the resource value matches the user's criteria, a notification is sent according to the user's instructions.
The process that is used to obtain the
status of a resource and send event
notifications if appropriate. A monitor
checks resources on the local system.
The resource monitor maps the physical
resource into a standard interface
understood by the HA subsystem.
S-T
users as logical volumes. A volume
group can be activated by only one node
at a time unless you are using MC/
LockManager. MC/ServiceGuard can
activate a volume group when it starts a
package. A given disk can belong to
only one volume group. A logical
volume can belong to only one volume
group.
target The target application is notified when a monitored resource reaches the condition for which notification was requested. For example, a target application could be MC/ServiceGuard
or IT/Operations (ITO).
U-Z
volume group In L VM, a set of physical
volumes whose extents are grouped
together and then made available to
Glossary 83
Page 84

Glossary
84 Glossary
Page 85

Index
A
alternate links
creating volume groups with
44
API for EMS
api.log file
C
calculating pv_summary
classes
cluster resources
system resources
client.log file
cluster
cluster monitor
example requests
package status
cluster monitor request
testing
cluster status
ClusterView
configuring EMS with MC/
ServiceGuard
configuring monitoring requests
18
copying requests
creating a monitoring request
21
creating disk monitoring
requests
creating logical volumes
creating package dependencies
26
creating volume groups
D
dictionary
disk arrays
creating volume groups with
disk monitor
creating requests
, 76
, 17, 20
, 26, 40
, 79
, 12, 74
PV links
, 12
, 42
, 58
, 68
, 76
, 57
, 62
, 61
, 59
, 57
, 40
, 25
, 47
, 45
, 44
, 44
, 47
disk configuration rules
example requests
lock disk requests
,
RAID rules
requests for mirrored disks
requests for RAID arrays
resource classes
root volume disk requests
rules for mirrors
sample monitoring
disk monitor request
testing
disk space monitoring
disk supported by disk monitor
32
E
EMS
basic
files and directories
installing
logging
prerequisites
,
removing
restarting
,
SAM interface
system requirements
testing monitoring requests
tracing
EMS, high availability
,
F
files and directories containing
EMS monitors
framework
H
hierarchy
system resources
hierarchy, resources
, 42
parameters
, 79
, 12
, 15
, 76
, 17
, 16
, 80
79
, 77
, 12
, 20
, 50
, 18
, 48
, 33
, 46
, 74
, 68
, 55
, 74
, 17
, 71
, 15
, 14
, 41
, 51
, 53
, 56
high availability
I
initial notification
installing EMS
IT/Operations
IT/Operations severities
L
lan monitoring request
examples
lock disks
log files
logging
,
logical volume
logical volume summary
logical volumes
lv/copies
lv/status
lv_summary
LVM, rules for using with disk
lvmpvg file
M
,
MC/ServiceGuard
MC/ServiceGuard, rules for
MirrorDisk/UX
mirrors
moidfying requests
monitor
monitor daemon names
monitor daemons
, 74, 75
, 76
creating
creating for a cluster
logical volume status
monitor
using with EMS
example requests
number of copies
rules for using with disk
monitor
split off
, 13
, 15
, 14, 23, 40
, 66
, 55
, 45
, 39
, 37
, 41
, 43
, 39
, 46
, 38, 39, 46
, 14
, 22
, 23
, 37
, 45
, 38
, 14, 26, 34
, 40
, 53
, 39
, 25
, 80
, 74
Index 85
Page 86

Index
monitor persistence, 15, 80
monitor request
example disk monitor request
50
monitoring disk space
monitoring filesystem space
monitoring request
cluster status
copying
creating
creating comments
for clusters
for disk monitor
for lock disks
for mirror disks
for root volmes
lan interfaces
modifying
node status
number of users
package status
polling interval
removing
system resources
testing
monitoring system load
monitors
updating
N
node status
notification
dependency on TCP
when packages fail over
notification comment
notification options
notification protocol
SNMP
Notify at each interval
Notify if value is...
Notify when value changes
, 25
, 21
, 57
, 25
, 60
, 25
, 79
, 23
, 60
, 22
, 24
, 71
, 59
, 24
, 47
, 55
, 53
, 56
, 64
, 69
, 61
, 23
, 68
, 68, 70
, 64
, 52
, 24
, 22
, 23
, 22
, 22
, 71
, 22
O
options for notification
,
P
p_client
package configuration file
package dependencies
package dependies
package failover
package status
performace
persistence
physical volume status
physical volume summary
polling interval
protocol, sending notification
PV links
pv_pvlink status
pv_summary
pv_summary calculations
pv_summary not available
pv_summary, for mirroring
pv_summary, not available
PVG
R
RAID
RAID rules with EMS
registrar.log file
removing EMS
removing requests
repeat notification
, 15, 80
34
creating
, 26
, 40
, 61
, 78
, 15, 23, 80
, 23, 28, 78
cluster status
filesystem monitor
, 59, 60, 61
, 36, 42
creating volume groups with
44
, 36
, 34
, 41, 42
adding
adding a PVG
example monitoring requests
51
, 43
, 77
, 16
, 40
, 71
, 25
, 22
, 22
, 29
, 28, 29,
, 36
, 34
, 42
, 41
, 35
, 35
, 42
resource
as MC/ServiceGuard
dependency
creating monitoring requests
18
selecting
selecting multiple resources
UP values
resource classes
cluster
disk monitor
system resources
resource dictionary
resource monitor
restarting EMS
return notification
S
SAM interface to EMS
, 23
SAM interface to MC/
,
SCSI inquiry
selecting a resource
severities for notification
SNMP traps
split off mirrors
standby LAN
supported disks
syslog file
system load
system load, monitoring
system resource monitor
filesyststem space
job queue
number of users
,
system resource monitor
T
testing cluster monitoring
, 19
49
, 58
ServiceGuard
, 76
examples
requests
, 26
,
,
, 28
, 17, 20
, 33
, 68
, 12, 74
, 13
, 80
, 22
, 18
, 27
, 36
, 19
, 23
, 24
, 38, 39, 46
, 65
, 32
, 70, 78
, 68
, 71
, 70
, 69
, 72
, 59
86 Index
Page 87

Index
testing job queue monitoring
requests
testing lan monitoring requests
64
testing monitoring requests
testing number of users
monitoring requests
tracing
U
UP value
updating monitors
users, monitoring number on
system
V
volume group
creating
creating for a cluster
volume groups
active
, 70
, 79
, 69
, 77
, 28
, 23
, 69
, 44
, 44
, 37
,
W
wildcard
, 20, 36, 38, 39
Index 87
 Loading...