

Page 1

HP Prime Graphing Calculator
User Guide
Page 2

Edition1
Part Number NW280-200X
Legal Notices
This manual and any examples contained herein are provided "as is" and are subject to
change without notice. Hewlett-Packard Company makes no warranty of any kind with regard
to this manual, including, but not limited to, the implied warranties of merchantability, noninfringement and fitness for a particular purpose.
Hewlett-Packard Company shall not be liable for any errors or for incidental or consequential
damages in connection with the furnishing, performance, or use of this manual or the examples contained herein.
Product Regulatory & Environment Information
Product Regulatory and Environment Information is provided on the CD shipped with this product.
Page 3

Copyright © 2013 Hewlett-Packard Development Company, L.P.
Reproduction, adaptation, or translation of this manual is prohibited without prior written permission of Hewlett-Packard Company, except as allowed under the copyright laws.
Printing History
Edition 1 May 2013
Page 4

Page 5

Contents
Preface
Manual conventions ................................................................ 9
Notice ................................................................................. 10
1 Getting started
Before starting ........................................................................ 9
On/off, cancel operations...................................................... 10
The display .......................................................................... 11
Sections of the display ...................................................... 12
Navigation........................................................................... 14
Touch gestures ................................................................. 14
The keyboard ....................................................................... 15
Context-sensitive menu ...................................................... 17
Entry and edit keys................................................................ 17
Shift keys......................................................................... 19
Adding text...................................................................... 20
Math keys ....................................................................... 20
Menus ................................................................................. 25
Toolbox menus................................................................. 26
Input forms ........................................................................... 26
System-wide settings .............................................................. 27
Home settings .................................................................. 27
Specifying a Home setting ................................................. 31
Mathematical calculations ...................................................... 32
Choosing an entry type ..................................................... 33
Entering expressions ......................................................... 34
Reusing previous expressions and results ............................. 36
Storing a value in a variable.............................................. 39
Complex numbers ................................................................. 40
Sharing data ........................................................................ 40
Online Help ......................................................................... 42
2 Reverse Polish Notation (RPN)
History in RPN mode ............................................................. 44
Sample calculations............................................................... 45
Manipulating the stack........................................................... 47
3 Computer algebra system (CAS)
CAS view............................................................................. 51
Contents 1
Page 6

CAS calculations ...................................................................52
Settings ................................................................................53
4 An introduction to HP apps
Application Library ................................................................ 61
App views ............................................................................ 62
Symbolic view ..................................................................63
Symbolic Setup view ......................................................... 64
Plot view..........................................................................64
Plot Setup view ................................................................. 65
Numeric view................................................................... 66
Numeric Setup view .......................................................... 68
Quick example......................................................................69
Common operations in Symbolic view......................................71
Symbolic view: Summary of menu buttons............................76
Common operations in Symbolic Setup view.............................76
Common operations in Plot view .............................................77
Zoom ..............................................................................78
Trace...............................................................................84
Plot view: Summary of menu buttons....................................86
Common operations in Plot Setup view.....................................86
Configure Plot view ...........................................................86
Common operations in Numeric view ...................................... 90
Zoom ..............................................................................90
Evaluating........................................................................ 92
Custom tables................................................................... 93
Numeric view: Summary of menu buttons............................. 94
Common operations in Numeric Setup view.............................. 95
Combining Plot and Numeric Views.........................................96
Adding a note to an app........................................................ 96
Creating an app.................................................................... 97
App functions and variables ...................................................99
5 Function app
Getting started with the Function app ..................................... 103
Analyzing functions .............................................................109
The Function Variables .........................................................114
Summary of FCN operations.................................................116
6 Advanced Graphing app
Getting started with the Advanced Graphing app ............... 118
7Geometry
Getting started with the Geometry app...................................123
2 Contents
Page 7

Plot view in detail................................................................ 129
Plot Setup view............................................................... 134
Symbolic view in detail........................................................ 136
Symbolic Setup view....................................................... 138
Numeric view in detail......................................................... 138
Geometric objects ............................................................... 141
Geometric transformations ................................................... 148
Geometry functions and commands....................................... 151
Symbolic view: Cmds menu ............................................. 152
Numeric view: Cmds menu.............................................. 160
Other Geometry functions................................................ 164
8 Spreadsheet
Getting started with the Spreadsheet app............................... 171
Basic operations ................................................................. 175
Navigation, selection and gestures ................................... 175
Cell references ............................................................... 176
Cell naming................................................................... 176
Entering content ............................................................. 177
Copy and paste ............................................................. 180
External references .............................................................. 180
Referencing variables...................................................... 181
Buttons and keys ................................................................. 183
Formatting options .............................................................. 184
Spreadsheet functions.......................................................... 186
9 Statistics 1Var app
Getting started with the Statistics 1Var app ............................ 187
Entering and editing statistical data....................................... 191
Computed statistics.............................................................. 194
Plotting .............................................................................. 195
Plot types....................................................................... 196
Setting up the plot (Plot Setup view) .................................. 197
Exploring the graph ........................................................ 197
10 Statistics 2Var app
Getting started with the Statistics 2Var app ............................ 199
Entering and editing statistical data....................................... 204
Numeric view menu items................................................ 205
Defining a regression model................................................. 206
Computed statistics.............................................................. 208
Plotting statistical data ......................................................... 210
Plot view: menu items...................................................... 211
Contents 3
Page 8

Plot setup .......................................................................211
Predicting values.............................................................212
Troubleshooting a plot .....................................................213
11 Inference app
Getting started with the Inference app....................................215
Importing statistics ...............................................................219
Hypothesis tests...................................................................221
One-Sample Z-Test ..........................................................222
Two-Sample Z-Test ..........................................................223
One-Proportion Z-Test ......................................................224
Two-Proportion Z-Test ......................................................225
One-Sample T-Test ..........................................................227
Two-Sample T-Test...........................................................228
Confidence intervals ............................................................229
One-Sample Z-Interval .....................................................229
Two-Sample Z-Interval...................................................... 230
One-Proportion Z-Interval .................................................231
Two-Proportion Z-Interval..................................................232
One-Sample T-Interval......................................................232
Two-Sample T-Interval ......................................................233
12 Solve app
Getting started with the Solve app .........................................235
One equation.................................................................235
Several equations ...........................................................239
Limitations......................................................................240
Solution information............................................................. 240
13 Linear Solver app
Getting started with the Linear Solver app............................... 243
Menu items.........................................................................245
14 Parametric app
Getting started with the Parametric app..................................247
15 Polar app
Getting started with the Polar app .........................................253
16 Sequence app
Getting started with the Sequence app ................................... 257
Another example: A table of cubes ........................................ 261
17 Finance app
4 Contents
Page 9

Getting Started with the Finance app..................................... 263
Cash flow diagrams ............................................................ 265
Time value of money (TVM) .................................................. 266
TVM calculations: Another example....................................... 267
Calculating amortizations..................................................... 268
18 Triangle Solver app
Getting started with the Triangle Solver app ........................... 271
Choosing triangle types ....................................................... 273
Special cases ..................................................................... 273
19 The Explorer apps
Linear Explorer app............................................................. 275
Quadratic Explorer app....................................................... 277
Trig Explorer app................................................................ 280
20 Functions and commands
Keyboard functions ............................................................. 285
Math menu......................................................................... 288
Numbers ....................................................................... 288
Arithmetic...................................................................... 289
Trigonometry.................................................................. 291
Hyperbolic .................................................................... 292
Probability..................................................................... 292
List................................................................................ 297
Matrix........................................................................... 297
Special ......................................................................... 297
CAS menu.......................................................................... 298
Algebra ........................................................................ 299
Calculus ........................................................................ 299
Solve ............................................................................ 302
Rewrite.......................................................................... 304
Integer .......................................................................... 306
Polynomial..................................................................... 307
Plot............................................................................... 311
App menu .......................................................................... 312
Function app functions .................................................... 312
Solve app functions ........................................................ 313
Spreadsheet functions ..................................................... 314
Statistics 1Var app functions ............................................ 330
Statistics 2Var app functions ............................................ 331
Inference app functions ................................................... 332
Finance app functions ..................................................... 333
Contents 5
Page 10

Linear Solver app functions ..............................................334
Triangle Solver app functions ...........................................335
Linear Explorer functions ..................................................336
Quadratic Explorer functions ............................................336
Geometry app function....................................................337
Common app functions....................................................337
Ctlg menu...........................................................................338
Creating your own functions ................................................. 371
21 Variables
Home variables...................................................................377
App variables .....................................................................378
Function app variables ....................................................378
Geometry app variables ..................................................379
Spreadsheet app variables...............................................379
Advanced Graphing app variables ................................... 380
Solve app variables ........................................................380
Statistics 1Var app variables ............................................ 381
Statistics 2Var app variables ............................................ 383
Inference app variables ...................................................385
Parametric app variables ................................................. 387
Polar app variables.........................................................387
Finance app variables .....................................................388
Linear Solver app variables.............................................. 388
Triangle Solver app variables ........................................... 389
Linear Explorer app variables...........................................389
Quadratic Explorer app variables .....................................389
Trig Explorer app variables .............................................. 389
Sequence app variables ..................................................390
22 Units and constants
Units ..................................................................................391
Unit calculations .................................................................. 392
Unit tools............................................................................ 394
Physical constants................................................................ 395
List of constants...............................................................396
23 Lists
Create a list in the List Catalog..............................................399
The List Editor .................................................................401
Deleting lists .......................................................................403
Lists in Home view ...............................................................403
List functions........................................................................405
6 Contents
Page 11

Finding statistical values for lists............................................ 408
24 Matrices
Creating and storing matrices............................................... 412
Working with matrices......................................................... 413
Matrix arithmetic................................................................. 416
Solving systems of linear equations ....................................... 419
Matrix functions and commands............................................ 421
Matrix functions .................................................................. 422
Examples....................................................................... 426
25 Notes and Info
The Note Catalog ............................................................... 429
The Note Editor .................................................................. 430
26 Programming
The Program Catalog .......................................................... 438
Creating a new program ..................................................... 441
The Program Editor ......................................................... 441
The HP Prime programming language ................................... 450
The User Keyboard: Customizing key presses .................... 455
App programs ............................................................... 459
Program commands ............................................................ 464
Commands under the Tmplt menu..................................... 465
Block ............................................................................ 465
Branch .......................................................................... 465
Loop ............................................................................. 466
Variable........................................................................ 470
Function ........................................................................ 470
Commands under the Cmds menu .................................... 470
Strings .......................................................................... 470
Drawing........................................................................ 473
Matrix........................................................................... 480
App Functions ................................................................ 482
Integer .......................................................................... 483
I/O .............................................................................. 485
More ............................................................................ 489
Variables and Programs .................................................. 492
27 Integer arithmetic
The default base ................................................................. 514
Changing the default base............................................... 515
Examples of integer arithmetic .............................................. 516
Integer manipulation............................................................ 517
Contents 7
Page 12

Base functions .....................................................................518
28 Limiting functionality
Exam configurations ............................................................519
Modifying the default configuration...................................520
Creating a new configuration ........................................... 521
Activating Exam Mode .........................................................522
Cancelling exam mode....................................................524
Modifying configurations......................................................524
To change a configuration ...............................................524
Deleting configurations ....................................................524
A Glossary
B Troubleshooting
Calculator not responding ....................................................531
To reset .........................................................................531
To restore factory settings................................................. 531
If the calculator does not turn on .......................................531
Operating limits ..................................................................532
Status messages ..................................................................532
C Product Regulatory Information
Federal Communications Commission Notice..........................535
European Union Regulatory Notice........................................537
Index ...................................................................................541
8 Contents
Page 13

Preface
Manual conventions
The following conventions are used in this manual to
represent the keys that you press and the menu options
that you choose to perform operations.
• A key that initiates an unshifted function is
represented by an image of that key:
e,B,H, etc.
• A key combination that initiates a shifted unction (or
inserts a character) is represented by the appropriate
shift key (
function or character:
Sh initiates the natural exponential function
and
Az inserts the pound character (#)
S or A) followed by the key for that
The name of the shifted function may also be given in
parentheses after the key combination:
SJ(Clear), SY (Setup)
• A key pressed to insert a digit is represented by that
digit:
5, 7, 8, etc.
• All fixed on-screen text—such as screen and field
names—appear in bold:
CAS Settings,
• A menu item selected by touching the screen is
represented by an image of that item:
, , .
Note that you must use your finger to select a menu
item. Using a stylus or something similar will not
select whatever is touched.
XSTEP, Decimal Mark, etc.
Preface 9
Page 14

• Items you can select from a list, and characters on the
entry line, are set in a non-proportional font, as
follows:
Function, Polar, Parametric, Ans, etc.
Notice
• Cursor keys are represented by
You use these keys to move from field to field on a
screen, or from one option to another in a list of
options.
• Error messages are enclosed inverted commas:
“Syntax Error”
This manual and any examples contained herein are
provided as-is and are subject to change without notice.
Except to the extent prohibited by law, Hewlett-Packard
Company makes no express or implied warranty of any
kind with regard to this manual and specifically disclaims
the implied warranties and conditions of merchantability
and fitness for a particular purpose and Hewlett-Packard
Company shall not be liable for any errors or for
incidental or consequential damage in connection with
the furnishing, performance or use of this manual and the
examples herein.
=, \, >, and <.
10 Preface
1994–1995, 1999–2000, 2003–2006, 2010–2013
Hewlett-Packard Development Company, L.P.
The programs that control your HP Prime are copyrighted
and all rights are reserved. Reproduction, adaptation, or
translation of those programs without prior written
permission from Hewlett-Packard Company is also
prohibited.
For hardware warranty information, please refer to the
HP Prime Quick Start Guide.
Product Regulatory and Environment Information is
provided on the CD shipped with this product.
Page 15

Getting started
The HP Prime Graphing Calculator is an easy-to-use yet
powerful graphing calculator designed for secondary
mathematics education and beyond. It offers hundreds of
functions and commands, and includes a computer
algebra system (CAS) for symbolic calculations.
In addition to an extensive library of functions and
commands, the calculator comes with a set of HP apps. A
HP app is a special application designed to help you
explore a particular branch of mathematics or to solve a
problems of a particular type. For example, there is a HP
app that will help you explore geometry and another to
help you explore parametric equations. There are also
1
Before starting
apps to help you solve systems of linear equations and to
solve time-value-of-money problems.
The HP Prime also has its own programming language
you can use to explore and solve mathematical problems.
Functions, commands, apps and programming are
covered in detail later in this guide. In this chapter, the
general features of the calculator are explained, along
with common interactions and basic mathematical
operations.
Charge the battery fully before using the calculator for the
first time. To charge the battery, either:
• Connect the calculator to a computer using the USB
cable that came in the package with your HP Prime.
(The PC needs to be on for charging to occur.)
Getting started 9
• Connect the calculator to a wall outlet using the HPprovided wall adapter.
Page 16

When the calculator is on, a battery symbol appears in
the title bar of the screen. Its appearance will indicate how
much power the battery has. A flat battery will take
approximately 4 hours to become fully charged.
Battery Warning • To reduce the risk of fire or burns, do not
disassemble, crush or puncture the battery; do not
short the external contacts; and do not dispose of the
battery in fire or water.
• To reduce potential safety risks, only use the battery
provided with the calculator, a replacement battery
provided by HP, or a compatible battery
recommended by HP.
• Keep the battery away from children.
• If you encounter problems when charging the
calculator, stop charging and contact HP
immediately.
Adapter Warning • To reduce the risk of electric shock or damage to
equipment, only plug the AC adapter into an AC
outlet that is easily accessible at all times.
• To reduce potential safety risks, only use the AC
adapter provided with the calculator, a replacement
AC adapter provided by HP, or an AC adapter
purchased as an accessory from HP.
On/off, cancel operations
To turn on Press
To cancel When the calculator is on, pressing the J key cancels
the current operation. For example, it will clear whatever
you have entered on the entry line. It will also close a
menu and a screen.
to turn on the calculator.
O
To turn off Press
10 Getting started
SO
To save power, the calculator turns itself off after several
minutes of inactivity. All stored and displayed information
is saved.
(Off) turn the calculator off.
Page 17

The Home View Home view is the starting point for many calculations.
Most mathematical functions are available in the Home
view. Some additional functions are available in the
computer algebra system (CAS). A history of your
previous calculation is retained and you can re-use a
previous calculation or its result.
To display Home view, press
H
.
The CAS View CAS view is the where you use the computer algebra
system. CAS view enables you to perform symbolic
calculations. It is largely identical to Home view—it even
has its own history of past calculations—but the CAS view
offers some additional functions.
To display CAS view, press
K
.
Protective cover The calculator is provided with a slide cover to protect the
display and keyboard. Remove the cover by grasping
both sides of it and pulling down.
You can reverse the slide cover and slide it onto the back
of the calculator. This will ensure that you do not misplace
the cover while you are using the calculator.
To prolong the life of the calculator, always place the
cover over the display and keyboard when you are not
The display
To adjust the
contrast
To clear the display • Press J or O to clear the entry line.
Getting started 11
using the calculator.
To adjust the contrast of the display, press and hold O,
then press the
contrast. The contrast will change with each press of the
or
+
• Press
w
SJ (Clear) to clear the entry line and the
history.
+
key.
or
key to increase or decrea se t he
w
Page 18

Sections of the display
Title bar
History
Menu buttons
Entry line
π
Home view has four sections (shown above). The title bar
shows either the screen name or the name of the app you
are currently using—Function in the example above. It
also shows the time, a battery power indicator, and a
number of symbols that indicate various calculator
settings. These are explained below. The
a record of your past calculations. The
history displays
entry line
displays the object you are currently entering or
modifying. The object could be a parameter, expression,
list, matrix, line of programming code, etc. The
buttons
are options that are relevant to the current
menu
display. These options are selected by tapping the
corresponding menu button. (Only a labeled button has a
function.) You close a menu without making a selection
from it by pressing
Annunciators. Annunciators are symbols or characters
J.
that appear in the title bar. They indicate that certain
settings are current, and also provide time and battery
power information.
Annunciator Meaning
12 Getting started
[Lime green] The angle mode setting is currently
degrees.
[Lime green] The angle mode setting is currently
radians.
Page 19

Annunciator Meaning (Continued)
S
A
a...z
U
1U1U
[Cyan] The Shift key is active. The function
S
shown in blue on a key will be
activated when a key is pressed.
Press
S to cancel shift mode.
CAS [White] You are working in CAS view, not
Home view.
...Z
[orange] The Alpha key is active. The charac-
ter shown in orange on a key will
be entered in uppercase when a
key is pressed. See “Adding text”
on page 20 for more information.
[orange] The Alpha–Shift key combination is
active. The character shown in
orange on a key will be entered in
lowercase when a key is pressed.
See “Adding text” on page 20 for
more information.
U
[Yellow] The user keyboard is active. All the
following key presses will enter the
customized objects associated with
the key. See “The User Keyboard:
Customizing key presses” on page
455 for more information.
[Yellow] The user keyboard is active. The
next key press will enter the customized object associated with the key.
See “The User Keyboard: Customizing key presses” on page 455 for
more information.
[Time] Current time. The default is 24-hour
format, but you can choose
AM–PM
format. See “Home settings” on
page 27 for more information.
Getting started 13
Page 20

Navigation
Annunciator Meaning (Continued)
Battery-charge indicator.
The HP Prime offers two modes of navigation: touch and
keys. In many cases, you can tap on an icon, field, menu,
or object to select (or deselect) it. For example, you can
open the Function app by tapping once on its icon in the
Application Library. However, to open the Application
Library, you will need to press a key:
Selections can often be made either by tapping or by
using the keys. For instance, as well as tapping an icon in
the Application Library, you can also press the cursor
keys—
highlighted, and then press E. In the Application
Library, you can also type the first one or two letters of an
app’s name to highlight the app. Then either tap the app’s
icon or press
Sometimes a touch or key–touch combination is available.
For example, you can deselect a toggle option either by
tapping twice on it, or by using the arrow keys to move to
the field and then tapping a touch button along the bottom
of the screen (in this case ).
Note that you must use your finger to select an item by
touch. Using a stylus or something similar will not select
=,\,<,>—until the app you want to open is
E to open it.
I.
Touch gestures
14 Getting started
whatever is touched.
In addition to selection by tapping, there are other touchrelated operations available to you:
To quickly move from page to page, flick:
Place a finger on the screen and quickly swipe it in the
desired direction (up or down).
Page 21

To pan, drag your finger horizontally or vertically across
the screen.
To quickly zoom in, make an open pinch:
Place the thumb and a finger close together on the
screen and move them apart. Only lift them from the
screen when you reach the desired magnification.
To quickly zoom out, make an closed pinch:
Place the thumb and a finger some distance apart on
the screen and move them toward each other. Only lift
them from the screen when you reach the desired
magnification.
Note that pinching to zoom only works in applications
that feature zooming (such as where graphs are plotted).
In other applications, pinching will do nothing, or do
something other than zooming. For example, in the
Spreadsheet app, pinching will change the width of a
The keyboard
column or the height of a row.
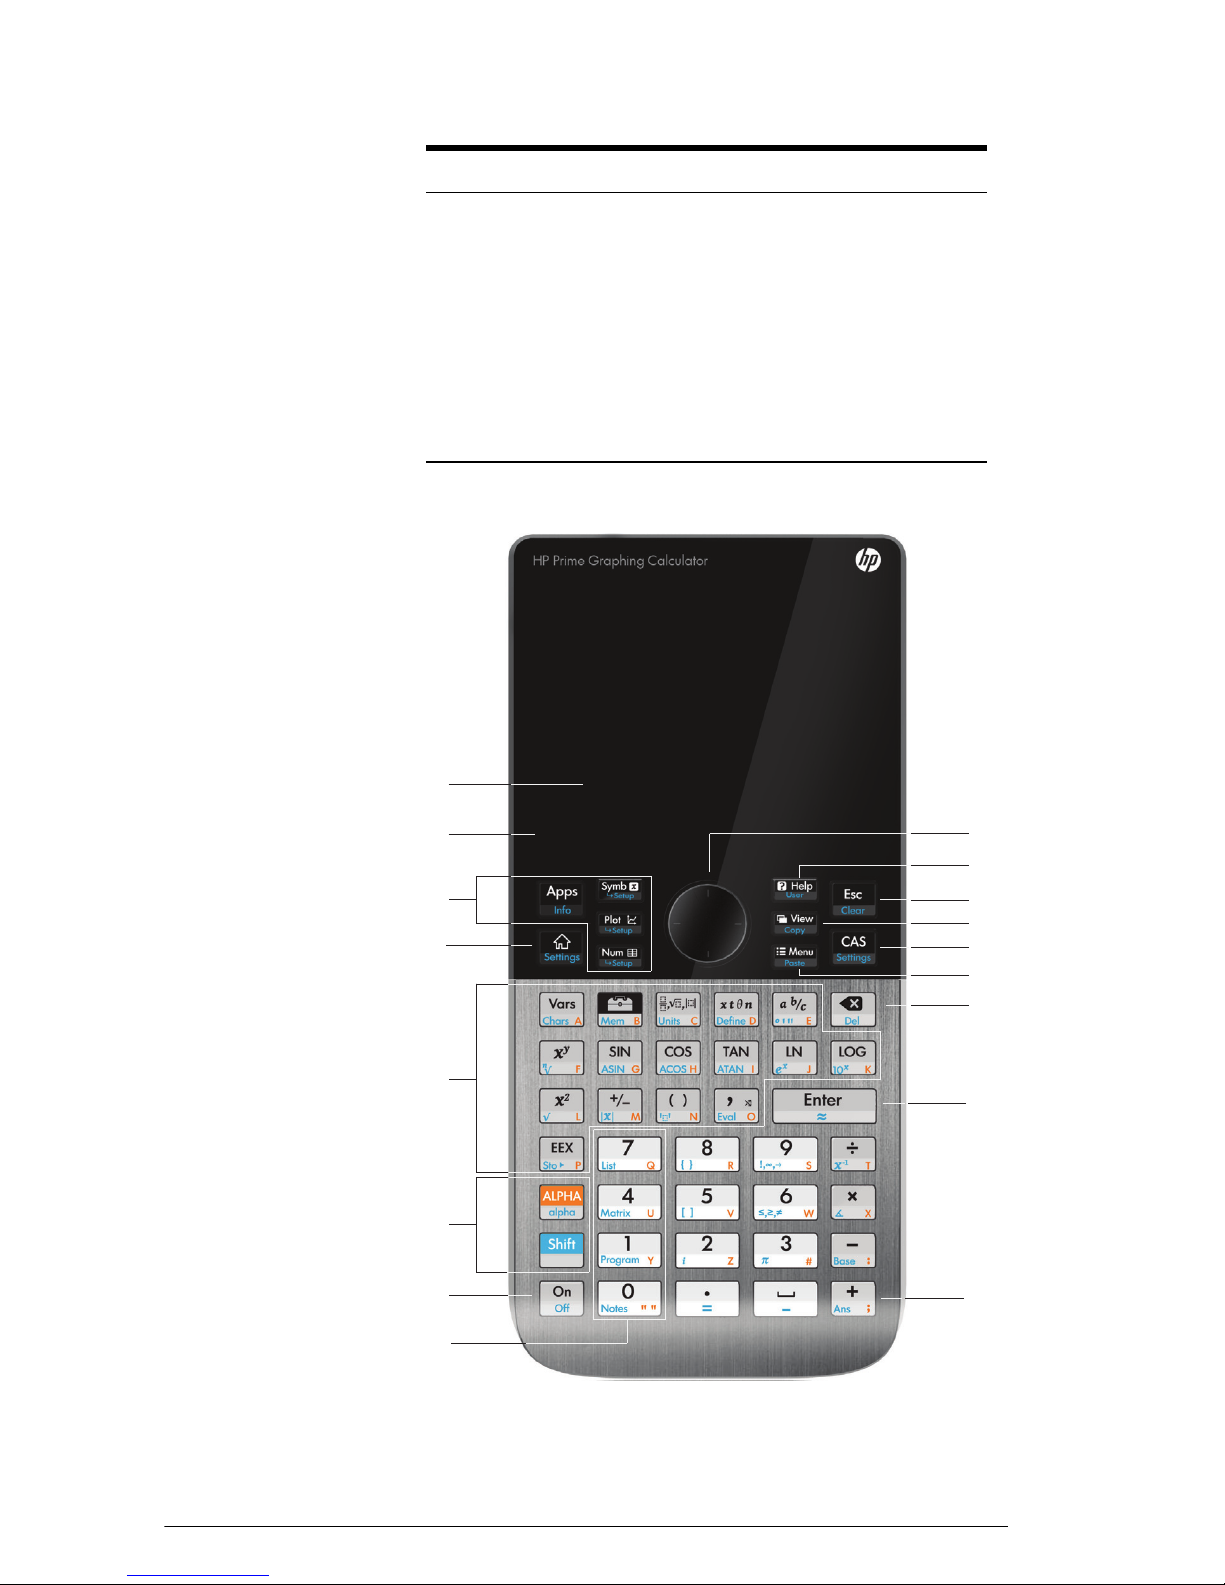
The numbers in the legend below refer to the parts of the
keyboard described in the illustration below the legend.
Number Feature
1 LCD and touch-screen: 320 × 240 pixels
2 Context-sensitive touch-button menu
3 HP Apps keys
4 Home view and preference settings
5 Common math and science functions
6Alpha and Shift keys
7 On, Cancel and Off key
Getting started 15
8 List, matrix, program, and note catalogs
9Last Answer key (Ans)
10 Ent e r key
11 Backspace and Delete key
Page 22
Number Feature
1
2
3
4
5
6
7
8
9
11
13
14
12
15
16
10
17
12 Menu (and Paste) key
13 CAS (and CAS preferences) key
14 View (and Copy) key
15 E s c a p e ( a n d C l e a r) key
16 H e l p ke y
17 Rocker wheel (for cursor movement)
16 Getting started
Page 23

Context-sensitive menu
A context-sensitive menu occupies the bottom line of the
screen.
The options available depend on the context, that is, the
view you are in. Note that the menu items are activated by
touch.
There are two types of buttons on the context-sensitive
menu:
• menu button: tap to display a pop-up menu. These
buttons have square corners along their top (such as
• command button: tap to initiate a command. These
buttons have rounded corners (such as in the
illustration above).
in the illustration above).
Entry and edit keys
The primary entry and edit keys are:
Keys Purpose
N to r Enter numbers
or J Cancels the current operation or
O
E
clears the entry line.
Enters an input or executes an
operation. In calculations,
acts like “=”. When or
is present as a menu key,
E
acts the same as pressing
or .
E
Getting started 17
Page 24

Keys Purpose (Continued)
Q
For entering a negative number. For
example, to enter –25, press
Q25. Note: this is not the same
operation that is performed by the
subtraction key (
w).
F Math template: Displays a palette
of pre-formatted templates representing common arithmetic expressions.
d
Enters the independent variable
(that is, either X, T, or N, depend-
ing on the app that is current).
Sv Relations palette: Displays a palette
of comparison operators and Boolean operators.
Sr Special symbols palette: Displays a
palette of common math and Greek
characters.
Sc Automatically inserts the degree,
minute, or second symbol according to the context.
C Backspace. Deletes the character to
the left of the cursor. It will also
return the highlighted field to its
default value, if it has one.
C
S
SJ
(Clear) Clears all data on the screen
Delete. Deletes the character to the
right of the cursor.
(including the history). On a settings screen—for example Plot
Setup—returns all settings to their
default values.
18 Getting started
Page 25

Keys Purpose (Continued)
<>=\
Sa
Cursor keys: Moves the cursor
around the display. Press
move to the end of a menu or
screen, or
start.
Displays all the available
characters. To enter a character, use
the cursor keys to highlight it, and
then tap . To select multiple
characters, select one, tap ,
and continue likewise before
pressing . There are many
pages of characters. You can jump
to a particular Unicode block by
tapping and selecting the
block. You can also flick from page
to page.
S=
to move to the
S\
to
Shift keys
There are two shift keys that you use to access the
operations and characters printed on the bottom of the
S
and
keys:
Key Purpose
S
.
A
Press S to access the operations
printed in blue on a key. For
instance, to access the settings for
Home view, press
SH.
A Press the A key to access the
characters printed in orange on a
key. For instance, to type Z, press
and then press y. For a
A
lowercase letter, press
and then the letter. To type more
than one letter, press
time to lock the alpha shift.
AS
a second
A
Getting started 19
Page 26

Adding text
The text you can enter directly is shown by the orange
characters on the keys. These characters can only be
entered in conjunction with the
uppercase and lowercase characters can be entered, as
explained in the following.
Keys Effect
A and S keys. Both
A Makes the next character upper-
case
AA Lock mode: makes all characters
uppercase until the mode is reset
S With uppercase locked, makes the
next character lowercase
AS Makes the next character lowercase
ASA Lock mode: makes all characters
lowercase until the mode is reset
Math keys
S With lowercase locked, makes the
next character uppercase
SA With lowercase locked, makes all
characters uppercase until the
mode is reset
A Reset uppercase lock mode
AAA
Reset lowercase lock mode
A
You can also enter text (and other characters) by
displaying the characters palette:
The most common math functions have their own key on
the keyboard (or a key in combination with the
Sa
.
S key).
20 Getting started
Page 27

Example 1: To calculate SIN(10), press e10 an d
press
E
angle measure setting is radians).
Example 2: To find the square root of 256, press
Sj 256 and press
is 16. Notice that the S key initiates the operator
represented in blue on the next key pressed (in this case √
on the
The mathematical functions not represented on the
keyboard are on the
chapter 20, “Functions and commands”, starting on page
283).
Note that the order in which you enter operands and
operators is determined by the entry mode. By default, the
entry mode is textbook, which means that you enter
operands and operators just as you would if you were
writing the expression on paper. If your preferred entry
j key).
. The answer displayed is –0,544… (if your
E
Math, CAS, and Catlg menus (see
. The answer displayed
Math
template
mode is Reverse Polish Notation, the order of entry is
different. (See chapter 2, “Reverse Polish Notation (RPN)”,
starting on page 43.)
The math template key (F) helps
you insert the framework for
common calculations (and for
vectors, matrices, and hexagesimal
numbers). It displays a palette of
pre-formatted outlines to which you add the constants,
variables, and so on. Just tap on the template you want (or
use the arrow keys to highlight it and press
enter the components needed to complete the calculation.
Example: Suppose you want to find the cube root of
945:
1. In Home view, press
F.
E). Then
Getting started 21
2. Select .
The skeleton or framework for your calculation now
appears on the entry line:
3. Each box on the template needs to be completed:
Page 28

3>945
4. Press E to display the result: 9.813…
The template palette can save you a lot of time, especially
with calculus calculations.
You can display the palette at any stage in defining an
expression. In other words, you don’t need to start out with
a template. Rather, you can embed one or more templates
at any point in the definition of an expression.
Math
shortcuts
As well as the math template,
there are other similar screens
that offer a palette of math
characters. For example,
pressing
special symbols palette, shown at the right. Select a
character by tapping it (or scrolling to it and pressing
Sr displays the
E).
A similar palette—the relations
palette—is displayed if you press
Sr. The palette displays operators
useful in math and programming. Again,
just tap the character you want.
Other math shortcut keys include
inserts an X, T, , or N depending on what app you are
using. (This is explained further in the chapters describing
the apps.)
d. Pressing this key
Fractions The fraction key (c) cycles through thee varieties of
22 Getting started
Similarly, pressing
second character. It enters ° if no degree symbol is part of
your expression; enters ′ if the previous entry is a value in
degrees; and enters ″ if the previous entry is a value in
minutes. Thus entering:
Sc40Sc20Sc
36
yields 36°40′ 20″. See “Hexagesimal numbers” on page
23 for more information.
fractional display. If the current answer is the decimal
Sc enters a degree, minute, or
Page 29

fraction 5.25, pressing c converts the answer to the
5
930249
416020
------------------
2
98209
416020
------------------
+
11
8
------
5
Hexagesimal
vulgar fraction 21/4. If you press
c again, the answer
is converted to a mixed number fraction (5 + 1/4). If
pressed again, the display returns to the decimal fraction
(5.25).
The HP Prime will
approximate fraction and
mixed number
representations in cases
where it cannot find
exact ones. For example,
enter to see the
decimal approximation:
2.236…. Press
c once to see and again to see
. Pressing c a third time will cycle back to the
original decimal representation.
Any decimal result can de displayed in hexagesimal
numbers
format; that is, in units subdivided into groups of 60. This
includes degrees, minutes, and seconds as well as hours,
minutes, and seconds. For example, enter to see the
decimal result: 1.375. Now press
1°22′ 30″ . Press
S c again to return to the decimal
S c to see
representation.
The HP Prime will produce the best approximation in cases
where an exact result is not possible. Enter to see the
decimal approximation: 2.236… Press S c to see
2°14′ 9.84 4719″ .
Note that the degree and minute entries must be positive
integers. Decimals are not allowed, except in the seconds.
Note too that the HP
Prime treats a value in
hexgesimal format as a
single entity. Hence any
Getting started 23
operation performed on
a hexagesimal value is
performed on the entire
value. For example, if
Page 30
you enter 10°25′ 26″2, the whole value is squared, not just
510
4
3.21 107–
410
13–
610
23
310
5–
----------------------------------------------- -----
the seconds component. The result in this case is
108 °39′ 26.854445″ .
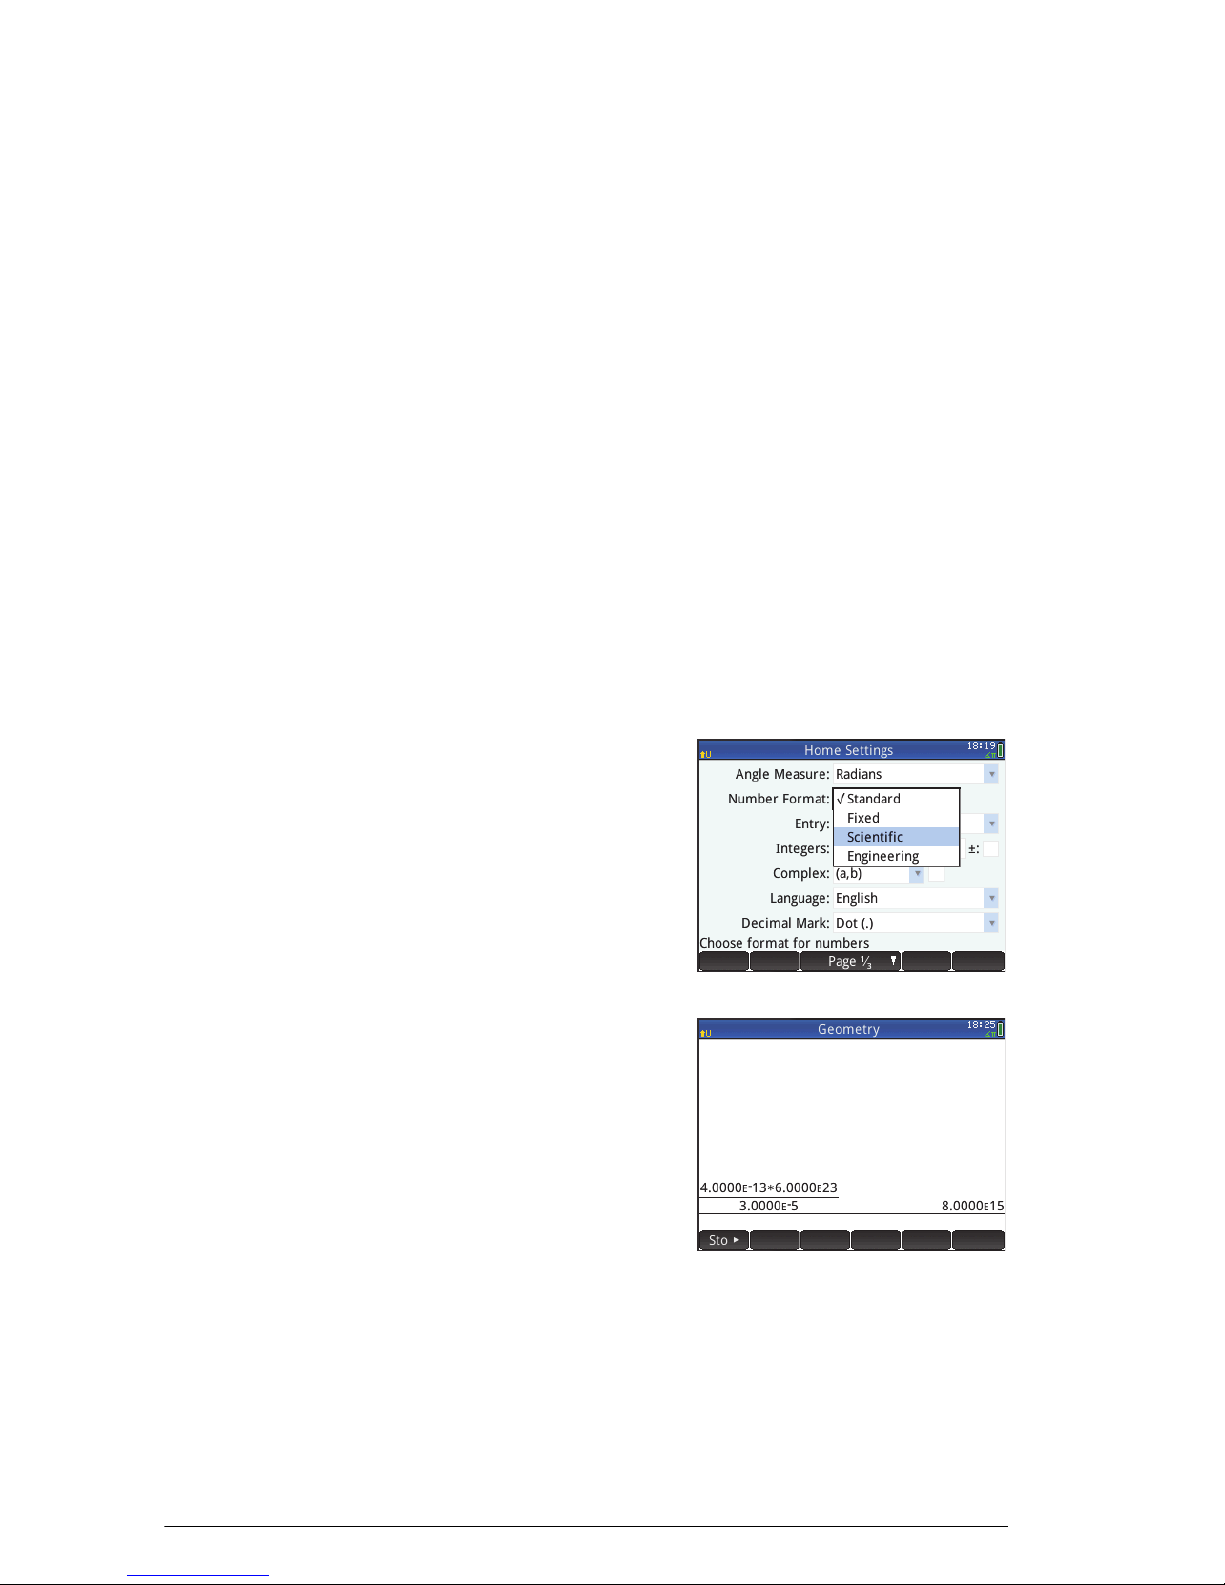
EEX key
(powers of
10)
Numbers like and are expressed in
scientific notation, that is, in terms of powers of ten. This is
simpler to work with than 50 000 or 0.000000 321. To
enter numbers like these, use the
easier than using
Example: Suppose you want to calculate
s10k
B functionality. This is
.
First select Scientific as the number format.
1. O p e n t h e Home Settings window.
SH
2. Select Scientific
from the
Format
3. Return home:
Number
menu.
H
4. Enter 4BQ13
s6B23n
BQ5
3
5. Press
E
The result is
8.0000
equivalent to
8 × 10
E15. This is
15
.
24 Getting started
Page 31

Menus
A menu offers you a
choice of items. As in the
case shown at the right,
some menus have submenus and sub-submenus.
To select from a
menu
Shortcuts • Press
There are two techniques for selecting an item from a
menu:
• direct tapping and
• using the arrow keys to highlight the item you want
and then either tapping or pressing
Note that the menu of buttons along the bottom of the
screen can only be activated by tapping.
immediately display the last item in the menu.
• Press
immediately display the first item in the menu.
• Press S\ to jump straight to the bottom of the
menu.
• Press
• Enter the first few characters of the item’s name to
jump straight to that item.
E
when you are at the top of the menu to
=
when you are at the bottom of the menu to
\
S
to jump straight to the top of the menu.
=
.
To close a menu A menu will close automatically when you select an item
Getting started 25
• Enter the number of the item shown in the menu to
jump straight to that item.
from it. If you want to close a menu without selecting
anything from it, use one of the following techniques:
• To close the last opened menu or sub-menu, press
.
O
• To close all open menus, press
J.
Page 32

Toolbox menus
The Toolbox menus (D) are a collection of menus
offering functions and commands useful in mathematics
Input forms
and programming. The
offer over 400 functions and commands. The items on
these menus are described in detail in chapter 20,
“Functions and commands”, starting on page 283).
An input form is a screen that provides one or more fields
for you to ent er data or sel ect an option. It is an ot her name
for a dialog box.
• If a field allows you to enter data of your choice, you
can select it, add your data, and tap . (There
is no need to tap first.)
• If a field allows you to choose an item from a menu,
you can tap on it (the field or the label for the field),
tap on it again to display the options, and tap on the
item you want. (You can also choose an item from an
open list by pressing the cursor keys and pressing
Math, CAS, and Catlg menus
E when the option you want is highlighted.)
• If a field is a toggle field—one that is either selected
or not selected—tap on it to select the field and tap
on it again to select the alternate option.
(Alternatively, select the field and tap .)
The illustration at the
right shows an input form
with all three types of
Calculator Name
field.
is a free-form data-entry
Font Size provides
field,
a menu of options, and
Textbook Display is a
toggle field.
26 Getting started
Page 33

Reset input
To reset a field to its default value, highlight the field and
form fields
press C. To reset all fields to their default values, press
SJ (Clear).
System-wide settings
System-wide settings are values that determine the
appearance of windows, the format of numbers, the scale
of plots, the units used by default in calculations, and
much more.
There are two system-wide settings: Home settings and
CAS settings. Home settings control Home view and the
apps. CAS settings control how calculations are done in
the computer algebra system. CAS settings are discussed
in chapter 3.
Although Home settings control the apps, you can
override certain Home settings once inside an app. For
example, you can set the angle measure to radians in the
Home settings
Home settings but choose degrees as the angle measure
once inside the Polar app. Degrees then remains the angle
measure until you open another app that has a different
angle measure.
You use the Home
Settings input form to
specify the settings for
Home view (and the
default settings for the
apps). Press
(Settings) to open the
Home Settings input
form. There are four pages of settings.
SH
Getting started 27
Page 34

Page 1
Setting Options
Angle Measure Degrees: 360 degrees in a circle.
Radians: 2 radians in a circle.
The angle mode you set is the angle
setting used in both Home view and
the current app. This is to ensure
that trigonometric calculations done
in the current app and Home view
give the same result.
Number
Format
The number format you set is the format used in all Home view calculations.
Standard: Full-precision display.
Fixed: Displays results rounded to
a number of decimal places. If you
choose this option, a new field
appears for you to enter the number
of decimal places. For example,
123.456789 becomes 123.46 in
Fixed 2 format.
Scientific: Displays results with an
exponent one digit to the left of the
decimal point, and the specified
number of decimal places. For
example, 123.456789 becomes
1.23E2 in Scientific 2
format.
28 Getting started
Engineering: Displays results with
an exponent that is a multiple of 3,
and the specified number of
significant digits beyond the first
one. Example: 123.456E7
becomes 1.23E9 in Engineer-
ing 2 format.
Page 35

Setting Options (Continued)
Entry Textbook: An expression is
entered in much the same way as if
you were writing it on paper (with
some arguments above or below or
others). In other words, your entry
could be two-dimensional.
Algebraic: An expression is
entered on a single line. Your entry
is always one-dimensional.
RPN: Reverse Polish Notation. The
arguments of the expression are
entered first followed by the
operator. The entry of an operator
automatically evaluates what has
already been entered.
Integers Sets the default base for integer
arithmetic: binary, octal, decimal,
or hex. You can also set the number
of bits per integer and whether integers are to be signed.
Complex Choose one of two formats for
displaying complex numbers:
(a,b) or a+b*i.
Language Choose the language you want for
menus, input forms, and the online
help.
Decimal Mark Dot or Comma. Displays a number
as 12456.98 (dot mode) or as
12456,98 (comma mode). Dot
mode uses commas to separate
elements in lists and matrices, and
to separate function arguments.
Comma mode uses periods (dots)
as separators in these contexts.
Getting started 29
Page 36

Page 2
45
62
Setting Options
Font Size Choose between small, medium,
and large font for general display.
Calculator
Enter a name for the calculator.
Name
Textbook
Display
If selected, expressions and results
are displayed in textbook format
(that is, much as you would see in
textbooks). If not selected, expressions and results are displayed in
algebraic format (that is, in onedimensional format). For example,
is displayed as
[[4,5],[6,2]]
in algebraic format.
Menu Display This setting determines whether the
commands on the
Math and CAS
menus are presented descriptively
or in common mathematical
shorthand. The default is to provide
the descriptive names for the
functions. If you prefer the functions
to be presented in mathematical
shorthand, deselect this option.
30 Getting started
Time Set the time and choose a format:
24-hour or
AM–PM format.
Date Set the date and choose a format:
YYYY/MM/DD, DD/MM/YYYY, or
MM/DD/YYYY.
Color Theme
Light: black text on a light back-
ground
Dark: white text on a dark back-
ground
Page 37

Setting Options (Continued)
Appearance Choose a color for the shading
(such as the color of the highlight).
Page 3 Page 3 of the Home Settings input form is for setting
Exam mode. This mode enables certain functions of the
calculator to be disabled for a set period, with the
disabling controlled by a password. This feature will
primarily be of interest to those who supervise
examinations and who need to ensure that the calculator
is used appropriately by students sitting an examination.
It is described in detail in chapter 28, “Limiting
functionality”, starting on page 519.
Page 4 Page 4 of the Home Settings input form is for
configuring your HP Prime to work on a wireless network.
Visit www.hp.com/support for further information.
Specifying a Home setting
This example demonstrates how to change the number
format from the default setting—Standard—to Scientific
with two decimal places.
1. Press
2. Tap on
SH
(Settings) to open the
Home Settings
input form.
Angle
The
Measure
highlighted.
Number
Format
the field. (You could also have pressed
it.)
(either the field label or the field). This selects
field is
\ to select
Getting started 31
Page 38

3. Tap on Number
Format
menu of number
format options
appears.
4. Tap on Scientific.
The option is chosen
and the menu closes. (You can also choose an item
by pressing the cursor keys and pressing
when the option you want is highlighted.)
5. Notice that a number
appears to the right
of the Number
Format field. This is
the number of
decimal places
currently set. To
change the number
to 2, tap on it twice, and then tap on 2 in the menu
that appears.
again. A
E
6. Press
to return to Home view.
H
Mathematical calculations
The most commonly used math operations are available
from the keyboard (see “Math keys” on page 20). Access
to the rest of the math functions is via various menus (see
“Menus” on page 25).
Note that the HP Prime represents 1 × 10
all numbers smaller than this) as zero. The largest number
displayed is 9.99999999999 × 10
displayed as this number.
Where to
start
The home base for the calculator is the Home view (
You can do all your non-symbolic calculations here. You
can also do calculations in CAS view (which uses the
computer algebra system (see chapter 3, “Computer
–499
(as well as
499
. A greater result is
H
).
32 Getting started
algebra system (CAS)”, starting on page 51). In fact, you
can use functions from the
CAS menu (one of the Toolbox
Page 39

menus) in an expression you are entering in Home view,
and use functions from the
Toolbox menus) in an expression you are entering in CAS
view.
Choosing an entry type
The first choice you need to make is the style of entry. The
three types are:
• Textbook
An expression is
entered in much the
same way as if you
were writing it on paper (with some arguments above
or below or others). In other words, your entry could
be two-dimensional, as in the example above.
• Algebraic
An expression is
entered on a single
line. Your entry is
always one-dimensional.
Math menu (another of the
• Advanced RPN (where RPN stands for Reverse Polish
Notation). [Not available in CAS view.]
The arguments of the depression are entered first
followed by the operator. The entry of an operator
automatically evaluates what has already been
entered. Thus you will need to enter a two-operator
expression (as in the example above) in two steps, one
for each operator:
Step 1: 5
calculated and displayed in history.
Step 2:
applied to the previous result.
More information about RPN mode can be found in
chapter 2, “Reverse Polish Notation (RPN)”, starting
on page 43.
Note that on page 2 of the Home Settings screen, you
h – the natural logarithm of 5 is
Szn – is entered as a divisor and
Getting started 33
can specify whether you want to display your calculations
Page 40

in Textbook format or not. This refers to the appearance of
23214 8–
3–
----------------------------
45ln
your calculations in the history section of both Home view
and CAS view. This is a different setting to the Entry setting
discussed above.
Entering expressions
The examples that follow assume that the entry mode is
Textbook.
• An expression can contain numbers, functions, and
variables.
• To enter a function, press the appropriate key, or
open a Toolbox menu and select the function. You
can also enter a function by using the alpha keys to
spell out its name.
• When you have finished entering the expression,
press
E to evaluate it.
If you make a mistake while entering an expression, you
can:
• delete the character to the left of the cursor by
pressing
• delete the character to the right of the cursor by
pressing
• clear the entire entry line by pressing O or J.
Example Calculate
23jw14 S
R
8>>nQ3
k
>h45E
This example illustrates a
number of important
points to be aware of:
C
S
C
34 Getting started
• the importance of
delimiters (such as parentheses)
• how to enter negative numbers
• the use of implied versus explicit multiplication.
Page 41

Parentheses As the example above shows, parentheses are
45 +sin
45sin +
85 9
85 9
automatically added to enclose the arguments of
functions, as in LN(). However, you will need to manually
add parentheses—by pressing
of objects you want operated on as a single unit.
Parentheses provide a way of avoiding arithmetic
ambiguity. In the example above we wanted the entire
numerator divided by –3, thus the entire numerator was
enclosed in parentheses. Without the parentheses, only
14√8 would have been divided by –3.
The following examples show the use of parentheses, and
the use of the cursor keys to move outside a group of
objects enclosed within parentheses.
Entering ... Calculates …
—to enclose a group
R
e45+Sz
eR
45
>+Sz
RSj
85>
s
9
Algebraic
precedence
Sj85s
The HP Prime calculates according to the following order
of precedence. Functions at the same level of precedence
are evaluated in order from left to right.
1. Expressions within parentheses. Nested parentheses
are evaluated from inner to outer.
2. Prefix functions, such as SIN and LOG.
3. Postfix functions, such as !
4. Power function, ^, NTHROOT.
5. Negation, multiplication, and division.
6. Addition and subtraction.
7. A N D a n d N OT .
8. OR and XOR.
9
Getting started 35
9. Left argument of | (where).
Page 42

10. Equ als ( =).
Negative
numbers
Explicit and
implied
multiplication
It is best to press Q to start a negative number or to
insert a negative sign. Pressing
situations, be interpreted as an operation to subtract the
next number you enter from the last result. (This is
explained in “To reuse the last result” on page 37.)
To raise a negative number to a power, enclose it in
parentheses. For example, (–5)
–25.
Implied multiplication takes place when two operands
appear with no operator between them. If you enter AB,
for example, the result is A*B. Notice in the example on
page 34 that we entered 14
multiplication operator after 14. For the sake of clarity, the
calculator adds the operator to the expression in history,
but it is not strictly necessary when you are entering the
expression. You can, though, enter the operator if you
w instead will, in some
2
= 25, whereas –52 =
Sk8 without the
wish (as was done in the examples on page 35). The
result will be the same.
Large results If the result of a calculation is too long to fit on the display
line in history, you can press > to scroll the display to the
right. Pressing
If the result is too tall to be seen in its entirety—for
example, a many-rowed matrix—highlight it and then
press . The result is displayed in full-screen view.
You can now press
bring hidden parts of the result into view. Tap to
return to the previous view.
< scrolls the display to the left.
= and \ (as well as >and <) to
Reusing previous expressions and results
Being able to retrieve and reuse an expression provides a
quick way of repeating a calculation that requires only a
36 Getting started
few minor changes to its parameters. You can retrieve and
reuse any expression that is in history. You can also
retrieve and reuse any result that is in history.
Page 43

To retrieve an expression and place it on the entry line for
editing, either:
• tap twice on it or its result, or
• use the cursor keys to highlight the expression and
then either tap on it or tap .
To retrieve a result and place it on the entry line, use the
cursor keys to highlight it and then tap . Note that
double-tapping a result copies the associated expression
to the entry line.
If the expression or result you want is not showing, press
= repeatedly to step through the entries and reveal those
that are not showing. You can also swipe the screen to
quickly scroll through history.
TIP
Pressing S= takes you straight to the very first entry
in history, and pressing
most recent entry.
S\ takes you straight to the
Using the clipboard Your last four expressions are always copied to the
clipboard and can easily be retrieved by pressing
SZ. This opens the clipboard from where you can
quickly choose the one you want.
Note that expressions and not results are available from
the clipboard. Note too that the last four expressions
remain on the clipboard even if you have cleared history.
To reuse the last
result
Press S+ (Ans) to
retrieve your last answer
for use in another
calculation. Ans
appears on the entry
TIP
Getting started 37
line. This is a shorthand for your last answer and it can be
part of a new expression. You could now enter other
components of a calculation—such as operators, number,
variables, etc.—and create a new calculation.
You don’t need to first select Ans before it can be part of
a new calculation. If you press a binary operator key to
begin a new calculation, Ans is automatically added to
Page 44

the entry line as the first component of the new
2
32
calculation. For example, to multiply the last answer by
13, you could enter
S+ s13E. But the
first two keystrokes are unnecessary. All you need to enter
is s13E.
The variable Ans is always stored with full precision
whereas the results in history will only have the precision
determined by the current Number Format setting (see
page 28). In other words, when you retrieve the number
assigned to Ans, you get the result to its full precision; but
when you retrieve a number from history, you get exactly
what was displayed.
You can repeat the previous calculation simply by pressing
E. This can be useful if the previous calculation
involved Ans. For example, suppose you want to calculate
the nth root of 2 when n is 2, 4, 8, 16, 32, and so on.
To reuse an
expression or result
from the CAS
1. Calculate the square root of 2.
Sj2E
2. Now enter √Ans.
SjS+E
This calculates the fourth root of 2.
3. Press E
repeatedly. Each time
you press, the root is
twice the previous
root. The last answer
shown in the
illustration at the right
is .
When your are working in Home view, you can retrieve
an expression or result from the CAS by tapping Z and
selecting Get from CAS. The CAS opens. Press
until the item you want to retrieve is highlighted and
\
press E. The highlighted item is copied to the cursor
point in Home view.
=
or
38 Getting started
Page 45

Storing a value in a variable
You can store a value in a variable (that is, assign a value
to a variable). Then when you want to use that value in a
calculation, you can refer to it by the variable’s name. You
can create your own variables, or you can take advantage
of the built-in variables in Home view (named A to Z and
) and in the CAS (named a to z, and a few others). CAS
variables can be used in calculations in Home view, and
Home variables can be used in calculations in the CAS.
There are also built-in app variables and geometry
variables. These can also be used in calculations.
Example: To assign
2
to to the variable A:
Szj AaE
Your stored value
appears as shown at the
right. If you then wanted
to multiply your stored
value by 5, you could
enter:
Aas5E.
You can also create your own variables in Home view. For
example, suppose you wanted to create a variable called
2
ME and assign
to it. You would enter:
Szj AQAcE
A message appears asking if you want to create a
variable called ME. Tap or press
confirm your intention. You can now use that variable in
subsequent calculations: ME*3 will yield 303, for
E to
Getting started 39
example.
You can also create variables in CAS view in the same
way. However, the built-in CAS variables must be entered
in lowercase. However, the variables you create yourself
can be uppercase or lowercase.
See chapter 21, “Variables”, starting on page 373 for
more information.
Page 46

As well as built-in Home and CAS variables, and the
1–
variables you create yourself, each app has variables that
you can access and use in calculations. See “App
functions and variables” on page 99 for more
information.
Complex numbers
You can perform arithmetic operations using complex
numbers. Complex numbers can be enterded in any one
of the following forms, where x is the real part, y is the
imaginary part, and i is the imaginary constant, :
• (x, y)
• x + iy or
• x – iy
To enter i:
• press
• press
There are 10 built-in variables available for storing
complex numbers. These are labeled Z0 to Z9. You can
also assign a complex number to a variable you create
yourself.
To store a complex
number in a variable,
enter the complex
number, press ,
enter the variable that
you want to assign the complex number to, and then press
E
ASg
or
Sy.
. For example, to store 2+3i in variable Z6:
R2o3>Ay6E
Sharing data
40 Getting started
As well as giving you access to many types of
mathematical calculations, the HP Prime enables you to
Page 47

create various objects that can be saved and used over
Micro-A: sender Micro-B: receiver
and over again. For example, you can create apps, lists,
matrices, programs, and notes. You can also send these
objects to other HP Primes. Whenever you encounter a
screen with as a menu item, you can select an item
on that screen to send it to another HP Prime.
You used the supplied
USB cable to send
objects from one HP
Prime to another. Note
that the connectors on the ends of the USB cable are
slightly different. The micro-A connector has a rectangular
end and the micro-B connector has a trapezoidal end. To
share objects with another HP Prime, the micro-A
connector must be inserted into the USB port on the
sending calculator, with the micro-B connector inserted
into the USB port on the receiving calculator.
General procedure The general procedure for sharing objects is as follows:
1. Navigate to the screen that lists the object you want
to send.
This will be the Application Library for apps, the List
Catalog for lists, the Matrix Catalog for matrices, the
Program Catalog for programs, and the Notes
Catalog for notes.
2. Connect the USB cable between the two calculators.
The micro-A connector—with the rectangular
end—must be inserted into the USB port on the
sending calculator.
3. On the sending calculator, highlight the object you
want to send and tap .
In the illustration at
the right, a program
named
TriangleCalcs
has been selected in
the Program Catalog
Getting started 41
Page 48

Online Help
and will be sent to the connected calculator when
is tapped.
4. What happens on the receiving calc?
Press W to open the online help. The help initially
provided is context-sensitive, that is, it is always about the
current view and its menu items.
For example, to get help on the Function app, press
select Function, and press
From within the help system you can navigate to other help
topics. You can find help on any key, view, or command.
And tapping displays a hierarchical directory of
all the help topics.
W.
I,
42 Getting started
Page 49

Reverse Polish Notation (RPN)
The HP Prime provides you with three ways of entering objects in
Home view:
• Textbook
An expression is entered in much the same way was if you
were writing it on paper (with some arguments above or
below or others). In other words, your entry could be twodimensional, as in the following example:
• Algebraic
An expression is entered on a single line. Your entry is always
one-dimensional. The same calculation as above would
appear like this is algebraic entry mode:
2
• Advanced RPN (where RPN stands for Reverse Polish
Notation).
The arguments of the expression are entered first followed by
the operator. The entry of an operator automatically
evaluates what has already been entered. Thus you will need
to enter a two-operator expression (as in the example above)
in two steps, one for each operator:
Step 1: 5
displayed in history.
Step 2: Szn – is entered as a divisor and
applied to the previous result.
You choose your preferred entry method from page 1 of the
Home Settings screen (SH). See “System-wide settings”,
starting on page 27 for instructions on how to choose settings.
RPN is available in Home view, but not in CAS view.
h – the natural logarithm of 5 is calculated and
Reverse Polish Notation (RPN) 43
Page 50

The same entry-line editing tools are available in RPN mode as
in algebraic and textbook mode:
• Press
• Press
• Press
• Press SJ to clear the entire entry line.
C to delete the character to the left of the cursor.
SC to delete the character to the right of the
cursor.
J to clear the entire entry line.
History in RPN mode
The results of your calculations are kept in history. This history is
displayed above the entry line (and by scrolling up to
calculations that are no longer immediately visible). The
calculator offers three histories: one for the CAS view and two for
Home view. CAS history is discussed in chapter 3. The two
histories in Home view are:
• non-RPN: visible if you have chosen algebraic or textbook
as your preferred entry technique
• RPN: visible only if you have chosen RPN as your preferred
entry technique. The RPN history is also called the stack. As
shown in the illustration below, each entry in the stack is
given a number. This is the stack level number.
As more calculations are added, an entry’s stack level number
increases.
If you switch from RPN to algebraic or textbook entry, your
history is not lost. It is just not visible. If you switch back to RPN,
your RPN history is redisplayed. Likewise, if you switch to RPN,
your non-RPN history is not lost.
When you are not in RPN mode, your history is ordered
chronologically: oldest calculations at the top, most recent at the
44 Reverse Polish Notation (RPN)
Page 51

bottom. In RPN mode, your history is ordered chronologically by
default, but you can change the order of the items in history. (This
is explained in “Manipulating the stack” on page 47.)
Re-using
results
There ate two ways to re-use a result in history. Method 1
deselects the copied result after copying; method 2 keeps the
copied item selected.
Method 1
1. Select the result to be copied. You can do this by pressing
= or \ until the result is highlighted, or by tapping on it.
2. Press
Method 2
1. Select the result to be copied. You can do this by pressing
E. The result is copied to the entry line and is
deselected.
= or \ until the result is highlighted, or by tapping on it.
2. Tap and select ECHO. The result is copied to the
entry line and remains selected.
Although it might appear that only the result of the previous
calculation is copied to the entry line, the calculation that
produced that result is copied as well and becomes part of the
new calculation. This is so regardless of the method chosen to
copy the item.
Note that while you can copy an item from the CAS history to
use in a Home calculation (and copy an item from the Home
history to use in a CAS calculation), you cannot copy items from
or to the RPN history. You can, however, use CAS commands
and functions when working in RPN mode.
Re-using
calculations
As well as re-using results (discussed in the previous section), you
can copy an entire calculation. The copy is placed on stack level
1 and thus can easily be incorporated in your next calculation.
You can also move an item to stack level 1. These changes to the
stack are explained in “Manipulating the stack” on page 47.
Sample calculations
The general philosophy behind RPN is that arguments are
placed before operators. The arguments can be on the entry line
Reverse Polish Notation (RPN) 45
Page 52

(each separated by a space) or they can be in history. For
example, to multiply by 3, you could enter:
SzX 3
on the entry line and then enter the operator (
entry line would look like this before entering the operator:
However, you could also have entered the arguments separately
and then, with a blank entry line, entered the operator (
Your history would look like this before entering the operator:
If there are no entries in history and you enter an operator or
function, an error message appears. An error message will also
appear if there is an entry on a stack level th at an opera tor needs
but it is not an appropriate argument for that operator. For
example, pressing
an error message.
An operator or function will work only on the minimum number
of arguments necessary to produce a result. Thus if you enter on
the entry line 2 4 6 8 and press
Multiplication needs only two arguments, so the two arguments
last entered are the ones that get multiplied. The entries 2 and 4
are not ignored: 2 is placed on stack level 3 and 4 on stack level
2.
f when there is a string on level 1 displays
s, stack level 1 shows 48.
s). Thus your
s).
Where a function can accept a variable number of arguments,
you need to specify how many arguments you want it to include
in its operation. You do this by specifying the number in
parentheses straight after the function name. You then press
E to evaluate the function. For example, suppose your
stack looks like this:
46 Reverse Polish Notation (RPN)
Page 53

Suppose further that you want to determine the minimum of just
the numbers on stack levels 1, 2, and 3. You choose the MIN
function from the MATH menu and complete the entry as
MIN(3). When you press
three items on the stack is displayed.
Manipulating the stack
A number of stack-manipulation options are available. Most
appear as menu items across the bottom the screen. To see these
items, you must first select an item in history:
E, the minimum of just the last
PICK Copies the selected item to stack level 1. The item below the one
that is copied is then highlighted. Thus if you tapped four
times, four consecutive items will be moved to the bottom four
stack levels (levels 1–4).
ROLL There are two roll commads:
• Tap to move the selected item to stack level 1. This is
• Tap to move the item on stack level 1 to the currently
Reverse Polish Notation (RPN) 47
similar to
duplicate being placed on stack level1. However,
doesn’t duplicate an item. It simply moves it.
highlighted level
PICK, but PICK duplicates the item, with the
ROLL
Page 54

Swap You can swap the position of the objects on stack level 1 with
those on stack level 2. Just press
remains unchanged. Note that the entry line must not be active
at the time, otherwise a comma will be entered.
o. The level of other objects
Stack Tapping displays further stack-manipulation tools.
DROPN Deletes all items in the stack from the highlighted item down to
and including the item on stack level 1. Items above the
highlighted item drop down to fill the levels of the deleted items.
If you just want to delete a single item from the stack, see “Delete
an item” below.
DUPN Duplicates all items between (and including) the highlighted item
and the item on stack level 1. If, for example, you have selected
the item on stack level 3, selecting DUPN duplicates it and the
two items below it, places them on stack levels 1 to 3, and moves
the items that were duplicated up to stack levels 4 to 6.
Echo Places a copy of the selected result on the entry line and leaves
LIST Creates a list of results, with the highlighted result the first element
Show an
item
the source result highlighted.
in the list and the item on stack level 1 the last.
Before After
To show a result in full-screen textbook format, tap .
Tap to return to the history.
[Not working]
Delete an
item
48 Reverse Polish Notation (RPN)
To delete an item from the stack:
1. Select it. You can do this by pressing
is highlighted, or by tapping on it.
= or \ until the item
Page 55

2. Press C.
Delete all
items
To delete all items, thereby clearing the history, press SJ.
Reverse Polish Notation (RPN) 49
Page 56

50 Reverse Polish Notation (RPN)
Page 57

Computer algebra system (CAS)
12–
1
3
---
2
7
---
+
13
21
------
A computer algebra system (CAS) enables you to perform
symbolic calculations. By default, CAS works in exact mode,
giving you infinite precision. On the other hand, non-CAS
calculations, such as those performed in HOME view or by an
aplet, are numerical calculations and are often
approximations limited by the precision of the calculator (to
in the case of the HP Prime). For example, yields
the approximate answer .619047619047 in Home view (with
Standard numerical format), but yields the exact answer in
the CAS.
The CAS offers many hundreds of functions, covering algebra,
calculus, equation solving, polynomials, and more. You select
a function from the
discussed in chapter 20, “Functions and commands”,
beginning on page 283. Consult that chapter for a
description of all the CAS functions and commands.
CAS menu, one of the Toolbox menus
3
CAS view
CAS calculations are done
in CAS view. CAS view is
almost identical to Home
view. A history of
calculations is built and you
can select and copy previous
calculations just as you can
in Home view, as well as
store objects in variables.
To open CAS view, press
K. CAS appears in red at the left
of the title bar to indicate that you are in CAS view rather than
Home view.
The menu buttons in CAS view are:
• : assigns an object to a variable
Computer algebra system (CAS) 51
Page 58

• : applies common simplification rules to reduce an
expression to its simplest form. For example,
simplify(e
• : copies a selected entry ion history to the entry
line
• : displays the selected entry in full-screen mode,
with horizontal land vertical scrolling enabled. The entry
is also presented in textbook format.
CAS calculations
With one exception, you perform calculations in CAS view
just as you do in Home view. (The exception is that there is no
RPN entry mode in CAS view, just algebraic and textbook
modes). All the keys work in the same way in CAS view as
Home view. The primary difference is that the default display
of answers is symbolic rather than numeric.
a + LN(b*ec)
) yields b *EXP(a)* EXP(c).
You can also use the template key (
framework for common calculations (and for vectors and
matrices). This is explained in detail in “Math template” on
page 21.
The most commonly used
CAS functions are available
from the CAS menu, one of
the Toolbox menus. To
display the menu, press
D. (If the CAS menu is not
open by default, tap
.) Other CAS
commands are available from the CATLG menu (another of
the Toolbox menus).
To choose a function, select a category and then a command.
Example 1 To find the roots of 2x
1. With the CAS menu open, select Polynomial and then
Find Roots.
2
+ 3x – 2:
F) to help you insert the
52 Computer algebra system (CAS)
Page 59

The function proot()
appears on the entry
line.
2. Between the
parentheses, enter:
2
ASsj+
3ASsw2
3. Press
E.
Example 2 To find the area under the graph of 5x
x = 3:
1. With the CAS menu open, select Calculus and then
Integrate.
The function int()
appears on the entry
line.
2. Between the
parentheses, enter:
5
ASsjw
6oASso
1o3
3. Press E.
Settings
2
– 6 between x =1 and
Page 1
Computer algebra system (CAS) 53
Various settings allow you to
configure how the CAS
works. To display the
settings, press
modes are spread across
two pages.
Setting Purpose
Angle Measure Select the units for angle measure-
SK. The
ments: Radians or Degrees.
Page 60

Setting Purpose (Cont.)
26
5
-----------
Number Format
(first drop-down
list)
Number Format
(second dropdown list)
Integers (dropdown list)
Integers (check
box)
Select the number format for displayed solutions:
Standard or Scientific or
Engineering
Select the number of digits to display in approximate mode (mantissa + exponent).
Select the integer base:
Decimal (base 10)
Hex (base 16)
Octal (base 8)
If checked, any real number equivalent to an integer in a non-CAS
environment will be converted to
an integer in the CAS. (Real numbers not equivalent to integers are
treated as real numbers in CAS
whether or not this option is
selected.)
Exact If checked, the calculator is in
exact mode and solutions will be
symbolic. If not checked, the calculator is in approximate mode and
solutions will be approximate. For
example, 26
n5 yields in
exact mode and 5.2 in approximate mode.
Complex Select this to allow complex results
in variables.
Use √
If checked, second order polynomials are factorized in complex
mode or in real mode if the discriminant is positive.
54 Computer algebra system (CAS)
Page 61

Setting Purpose (Cont.)
Use i If checked, the calculator is in
complex mode and complex solutions will be displayed when they
exist. If not checked, the calculator
is in real mode and only real solutions will be displayed. For example, factors(x
4
–1) yields
(–1+x),(1+x),(i+x),(–i+x) in com-
plex mode and
(–1+x),(1+x),(1+x
2
) in real mode.
Principal If checked, the principal solutions
to trigonometric functions will be
displayed. If not checked, the general solutions to trigonometric functions will be displayed.
Increasing If checked, polynomials will be
displayed with increasing powers
(for example, –4+x+3x
2+x3
). If not
checked, polynomials will be displayed with decreasing powers
(for example, x
3
+3x2+x–4).
Page 2
Setting Purpose
Recursive
Evaluation
Specify the maximum number of
embedded variables allowed in
an interactive evaluation. See also
Recursive Replacement
below.
Recursive
Replacement
Specify the maximum number of
embedded variables allowed in a
single evaluation in a program.
See also Recursive Evalua-
tion above.
Recursive
Function
Specify the maximum number of
embedded function calls allowed.
Computer algebra system (CAS) 55
Page 62

Setting Purpose (Cont.)
Epsilon Any number smaller than the
value specified for epsilon will be
shown as zero.
Probability Specify the maximum probability
of an answer being wrong for
non-deterministic algorithms. Set
this to zero for deterministic algorithms.
Newton Specify the maximum number of
iterations when using the Newtonian method to find the roots of a
quadratic.
Setting the form
of menu items
One setting that affects the CAS is made outside the CAS
Settings screen. This setting determines whether the
commands on the CAS menu are presented descriptively or by
their command name. Here are some examples of identical
functions that are presently differently depending on what
presentation mode you select:
Descriptive name Command name
Factors List ifactors
Complex Zeros cZeros
Groebner Basis gbasis
Factor by Degree factor_xn
Find Roots proot
The default menu presentation mode is to provide the
descriptive names for the CAS functions. If you prefer the
functions to be presented by their command name, deselect
the Menu Display option on the second page of the Home
Settings screen (see “Home settings” on page 27).
To use an
expression or
result from
Home view
56 Computer algebra system (CAS)
When your are working in CAS, you can retrieve an expression or result from Home view by tapping
Get from Home. Home view opens. Press = or
the item you want to retrieve is highlighted and press E.
Z and selecting
until
\
Page 63

The highlighted item is copied to the cursor point in CAS.
To use a Home
variable in CAS
You can access Home variables from within the CAS. Home
variables are assigned uppercase letters; CAS variables are
assigned lowercase letters. Thus SIN(x) and SIN(X) will yield
different results.
To use a Home variable in the CAS, simply include its name
in a calculation. For example, suppose in Home view you
have assigned variable Q to 100. Suppose too that you have
assigned variable q to 1000 in the CAS. If you are in the CAS
and enter 5*q, the result is 5000. If had entered 5*Q
instead, the result would be 500.
In a similar way, CAS variables can be used in calculations
in Home view. Thus you can enter 5*q in Home view and get
500, even though q is a CAS variable.
Computer algebra system (CAS) 57
Page 64

58 Computer algebra system (CAS)
Page 65

An introduction to HP apps
x2y2+64=
y 2x23x 5++=
Much of the functionality of the HP Prime is provided in packages
called HP apps. The HP Prime comes with 18 HP apps: 10
dedicated to mathematical topics or tasks, three specialized
Solvers, three function Explorers, a spreadsheet, and an app for
recording data streamed to the calculator from an external
sensing device. You launch an app by first pressing
displays the Application Library screen) and tapping on the
icon for the app you want.
What each app enables you to do is outlined in the following,
where the apps are listed in alphabetical order.
App name Use this app to:
4
I (which
Advanced
Graphing
Data Streamer Collect real-world data from scientific
Finance Solve time-value-of-money (TVM) problems
Function Explore real-valued, rectangular functions
Geometry Explore geometric constructions and
Inference Explore confidence intervals and
Explore the graphs of symbolic open
sentences in x and y. Example:
sensors and export it to a statistics app for
analysis.
and amortization problems.
of y in terms of x. Example:
perform geometric calculations.
hypothesis tests based on the Normal and
Student’s-t distributions.
An introduction to HP apps 59
Linear Explorer Explore the properties of linear equations
and test your knowledge.
Page 66

App name Use this app to: (Cont.)
r 24cos=
U
n 1–Un 2–U1
0=
U
2
1=
U
n
U
n 2–
U
n 1–
+=
x 1+ x2x–2–=
Linear Solver Find solutions to sets of two or three linear
equations.
Parametric Explore parametric functions of x and y in
terms of t. Example: x = cos (t) and
y = sin(t).
Polar Explore polar functions of r in terms of an
angle . Example:
Quadratics
Explorer
Explore the properties of quadratic
equations and test your knowledge.
Sequence Explore sequence functions, where U is
defined in terms of n, or in terms of
previous terms in the same or another
sequence, such as and .
Example: , and
Solve Explore equations in one or more real-
valued variables, and systems of equations.
Example:
Spreadsheet To solve problems or represent data best
suited to a spreadsheet.
Statistics 1Var Calculate one-variable statistical data (x)
Statistics 2Var Calculate two-variable statistical data
(x and y)
Triangle Solver Find the unknown values for the lengths
Trig Explorer Explore the properties of sinusoidal
As you use an app to explore a lesson or solve a problem, you
add data and definitions in one or more of the app’s views. All
this information is automatically saved in the app. You can come
back to the app at any time and all the information is still there.
You can also save a version of the app with a name you give it
and then use the original app for another problem or purpose.
See “Creating an app” on page 97 for more information about
customizing and saving apps.
60 An introduction to HP apps
and angles of triangles.
equations and test your knowledge.
Page 67

With one exception, all the apps mentioned above are described
in detail in this user guide. The exception is the DataStreamer
app. A brief introduction to this app is given in the HP Prime
Quick Start Guide. Full details can be found in the HP
StreamSmart 410 User Guide (available on the product CD)
Application Library
Apps are stored in the Application Library, displayed by pressing
I.
.
To open an
app
To reset an
app
1. Open the Application
Library.
2. Find the app’s icon and tap
on it.
You can also use the cursor
keys to scroll to the app
and, when it is highlighted,
either tap or press
E.
You can leave an app at any time and all the data and settings
in it are retained. When you return to the app, you can continue
as you left off.
However, if you don’t want to use the previous data and settings,
you can return the app to its default state, that is, the state it was
in when you opened it for the first time. To do this:
1. Open the Application Library.
2. Use the cursor keys to highlight the app.
3. Tap .
4. Tap to confirm your intention.
You can also reset an app from within the app. From the main
view of the app—which is usually, but not always, the Symbolic
view—press
To sort apps By default, the apps in the Application Library are sorted
chronologically, with the most recently used app shown first. You
can change the sort order to:
• Alphabetically
An introduction to HP apps 61
SJ and tap to confirm your intention.
Page 68

The app icons are sorted alphabetically by name, and in
ascending order: A to Z.
• Fixed
Apps are displayed in their default order: Function,
Advanced Graphing, Geometry … Polar, and Sequence.
Customized apps are placed at the end, after all the built-in
apps. They appear in chronological order: oldest to most
recent.
To change the sort order:
1. Open the Application Library.
2. Tap .
3. From the Sort Apps list, choose the option you want.
To delete an
app
Other
options
The apps that come with the HP Prime are built-in and cannot be
deleted, but you can delete an app you have created. To delete
an app:
1. Open the Application Library.
2. Use the cursor keys to highlight the app.
3. Tap .
4. Tap to confirm your intention.
The other options available in the Application Library are:
•
Enables you to save a copy of an app under a new name.
See “Creating an app” on page 97.
•
Enables you to send an app to another HP Prime. See
“Sharing data” on page 40.
App views
Most apps have three major views: Symbolic, Plot, and Numeric.
These views are based on the symbolic, graphic, and numeric
representations of mathematical objects. They are accessed
through the
keyboard. Typically these views enable you to define a
mathematical object—such as an expression or an open
sentence—plot it, and see the values generated by it.
62 An introduction to HP apps
Y, P, and M keys near the top left of the
Page 69

Each of these views has an accompanying setup view, a view that
enables you to configure the appearance of the data in the
accompanying major view. These views are called Symbolic
Setup, Plot Setup, and Numeric Setup. They are accessed by
pressing
Not all apps have all the six views outlined above. The scope and
complexity of each app determines its particular set of views. For
example, the Spreadsheet app has no Plot view or Plot Setup
view, and the Quadratic Explorer has only a Plot view. What
views are available in each app is outlined in the next six
sections.
Note that the DataStreamer app is not covered in this chapter.
See HP StreamSmart 410 User Guide for information about this
app.
Symbolic view
The table below outlines what is done in the Symbolic view of
each app.
JY, JP, and JM.
App Use the Symbolic view to:
Advanced
Specify up to 10 open sentences.
Graphing
Finance Not used
Function Specify up to 10 real-valued, rectangular
functions of y in terms of x.
Geometry View the symbolic definition of geometric
constructions.
Inference Choose to conduct a hypothesis test or test
a confidence level, and select a type of
test.
Linear Explorer Not used
Linear Solver Not used
Parametric Specify up to 10 parametric functions of x
and y in terms of t.
An introduction to HP apps 63
Polar Specify up to 10 polar functions of r in
terms of an angle .
Page 70

App Use the Symbolic view to: (Cont.)
Quadratics
Explorer
Sequence Specify up to 10 sequence functions.
Solve Specify up to 10 equations.
Spreadsheet Not used
Statistics 1Var Specify up to 5 univariate analyses.
Statistics 2Var Specify up to 5 multivariate analyses.
Triangle Solver Not used
Trig Explorer Not used
Symbolic Setup view
The Symbolic Setup view is the
same for each app. It enables
you to override the system-wide
settings for angle measure,
number format, and complexnumber entry. The override
applies only to the current app.
Not used
Plot view
To change the settings for all
apps, see “System-wide settings” on page 27.
The table below outlines what is done in the Plot view of each
app.
App Use the Polar view to:
Advanced
Graphing
Finance Display an amortization graph.
Function Plot and explore the functions selected in
Geometry Create and manipulate geometric
Plot and explore the open sentences
selected in Symbolic view.
Symbolic view.
constructions.
64 An introduction to HP apps
Page 71

App Use the Polar view to: (Cont.)
Inference View a plot of the test results.
Linear Explorer Explore linear equations and test your
knowledge of them.
Linear Solver Not used
Parametric Plot and explore the functions selected in
Symbolic view.
Polar Plot and explore the functions selected in
Symbolic view.
Quadratics
Explorer
Explore quadratic equations and test your
knowledge of them.
Sequence Plot and explore the sequences selected in
Symbolic view.
Solve Plot and explore a single function selected
in Symbolic view.
Spreadsheet Not used
Statistics 1Var Plot and explore the analyses selected in
Symbolic view.
Statistics 2Var Plot and explore the analyses selected in
Symbolic view.
Triangle Solver Not used
Trig Explorer Explore sinusoidal equations and test your
knowledge of them.
Plot Setup view
The table below outlines what is done in the Plot Setup view of
each app.
An introduction to HP apps 65
App Use the Polar view to:
Advanced
Graphing
Modify the appearance of plots and the
plot environment.
Finance Not used
Page 72

App Use the Polar view to: (Cont.)
Function Modify the appearance of plots and the
plot environment.
Geometry Modify the appearance of the drawing
environment.
Inference Not used
Linear Explorer Not used
Linear Solver Not used
Parametric Modify the appearance of plots and the
plot environment.
Polar Modify the appearance of plots and the
plot environment.
Quadratics
Explorer
Sequence Modify the appearance of plots and the
Solve Modify the appearance of plots and the
Spreadsheet Not used
Statistics 1Var Modify the appearance of plots and the
Statistics 2Var Modify the appearance of plots and the
Triangle Solver Not used
Trig Explorer Not used
Numeric view
Not used
plot environment.
plot environment.
plot environment.
plot environment.
The table below outlines what is done in the Numeric view of
each app.
App Use the Numeric view to:
Advanced
Graphing
66 An introduction to HP apps
View a table of numbers generated by the
open sentences selected in Symbolic view.
Page 73

App Use the Numeric view to: (Cont.)
Finance Enter values for time-value-of-money
calculations.
Function View a table of numbers generated by the
functions selected in Symbolic view.
Geometry Perform calculations on the geometric
objects drawn in Plot view.
Inference Specify the statistics needed to perform the
test selected in Symbolic view.
Linear Explorer Not used
Linear Solver Specify the coefficients of the linear
equations to be solved.
Parametric View a table of numbers generated by the
functions selected in Symbolic view.
Polar View a table of numbers generated by the
functions selected in Symbolic view.
Quadratics
Not used
Explorer
Sequence View a table of numbers generated by the
sequences selected in Symbolic view.
Solve Enter the known values and solve for the
unknown value.
Spreadsheet Enter numbers, text, formulas, etc. The
Numeric view is the primary view for this
app.
Statistics 1Var Enter data for analysis.
Statistics 2Var Enter data for analysis.
Triangle Solver Enter known data about a triangle and
solve for the unknown data.
Trig Explorer Not used
An introduction to HP apps 67
Page 74

Numeric Setup view
The table below outlines what is done in the Numeric Setup view
of each app.
App Use the Numeric Setup view to:
Advanced
Graphing
Specify the numbers to be calculated
according to the open sentences specified
in Symbolic view, and set the zoom factor.
Finance Not used.
Function Specify the numbers to be calculated
according to the functions specified in
Symbolic view, and set the zoom factor.
Geometry Not used
Inference Not used
Linear Explorer Not used
Linear Solver Not used
Parametric Specify the numbers to be calculated
according to the functions specified in
Symbolic view, and set the zoom factor.
Polar Specify the numbers to be calculated
according to the functions specified in
Symbolic view, and set the zoom factor.
Quadratics
Explorer
Sequence Specify the numbers to be calculated
Solve Not used
Spreadsheet Format cells, rows, columns, or the entire
Statistics 1Var Not used
Statistics 2Var Not used
Triangle Solver Not used
68 An introduction to HP apps
Not used.
according to the sequences specified in
Symbolic view, and set the zoom factor.
spreadsheet.
Page 75

App Use the Numeric Setup view to: (Cont.)
r 42
2
coscos=
r 42
2
coscos=
Trig Explorer Not used
Quick example
The following example uses all six app views and should give you
an idea of the typical workflow involved in working with an app.
The Polar app is used as the sample app.
Open the app
1. Open the Application Library by pressing I.
2. Tap once on the icon of the Polar app.
The Polar app opens in Symbolic View.
Symbolic view
The Symbolic view of the Polar app is where you define or specify
the polar equation you want to plot and explore. In this example
we will plot and explore the equation
3. Define the equation by entering:
Symbolic Setup view
4. Press SY.
5. Select Radians from the
4
Szf
2>>
n
>
jE
This equation will draw
symmetrical petals
provided that the angle
measure is set to radians.
The angle measure for this app is set in the Symbolic Setup
view.
Angle Measure menu.
f
An introduction to HP apps 69
Page 76

Plot view
Plot Setup View
6. Press P.
A graph of the equation is
plotted. However, as the
illustration at the right
shows, only a part of the
petals is visible. To see the
rest you will need to change
the plot setup parameters.
7. Press SP.
Numeric View
8. Set the second
RNG field to
4 by entering:
>4Sz
9. Press
P to return to Plot
(
view and see the complete
plot.
The values generated by the
equation can be seen in
Numeric view.
10. Press
Suppose you want to see just
whole numbers for ; in other
words, you want the increment
between consecutive values in
the column to be 1. You set this up in the Numeric Setup view.
70 An introduction to HP apps
M.
Page 77

Numeric Setup View
11 . P r e s s SM.
12. Change the NUMSTEP field
to 1.
13 . P r e s s
M to return to
Numeric view.
You will see that the
column now contains
consecutive integers starting from zero, and the
corresponding values calculated by the equation specified in
Symbolic view are listed in the R1 column.
Common operations in Symbolic view
[Scope: Advanced Graphing, Function, Parametric, Polar,
Sequence, Solve. See dedicated app chapters for information
about the other apps.]
Symbolic view functionality that is common to many apps is
described in detail in this section. Functionality that is available
only in a particular app is described in the chapter dedicated to
that app.
Symbolic view is typically used to define a function or open
sentence that you want to explore (by plotting and/or
evaluating). In this section, the term definition will be used to
cover both functions and open sentences.
Press
Add a definition
With the exception of the Parametric app, there are 10 fields for
entering definitions. In the Parametric app there are 20 fields, two
for each paired definition.
1. Highlight an empty field you want to use, either by tapping
2. Enter your definition.
3. Tap or press
An introduction to HP apps 71
Y to open Symbolic view.
on it or scrolling to it.
If you need help, see “Definitional building blocks” on
page 72.
E when you have finished.
Page 78

Modify a definition
1. Highlight the definition you want to modify, either by tapping
2. Tap .
3. Modify the definition.
Your new definition is added to the list of definitions.
Note that variables used in definitions must be in uppercase.
A variable entered in lowercase will cause an error message
to appear.
on it or scrolling to it.
The definition is copied to the entry line.
4. Tap or press
Definitional building blocks
The components that make up a symbolic definition can come
from a number of sources.
• From the keyboard
You can enter components directly from the keyboard. To
enter 2X
• From user variables
If, for example, you have created a variable called COST,
you could incorporate that into a definition either by typing
it or choosing it from the User menu (one of the sub-menus
of the Variables menu). Thus you could have a definition that
reads F1(X)=X
To select a user variable, press a, tap , select
User Variables, and then select the variable of interest.
• From Home variables
E when you have finished.
2
– 3, just press 2AXjw3.
2
+COST.
Some Home variables can be incorporated into a symbolic
definition. To access a Home variable, press
variable of interest. Thus you could have a definition that
reads F1(X)=X
Home menu.)
Home variables are discussed in detail in chapter 28,
“Troubleshooting”, beginning on page 507.
• From app variables
72 An introduction to HP apps
a, tap
, select a category of variable, and select the
2
+Q. (Q is on the Real sub-menu of the
Page 79

All settings, definitions, and results, for all apps, are stored
as variables. Many of these variables can be incorporated
into a symbolic definition. To access app variables, press
a, tap , select the app, select the category of
variable, and then select the variable of interest. You could,
for instance, have a definition that reads
F2(X)=X
the Function app is substituted for Root when this definition
is evaluated.
App variables are discussed in detail in chapter 28,
“Troubleshooting”, beginning on page 507.
• From math functions
Some of the functions on the Math menu can be
incorporated into a definition. The Math menu is one of the
Toolbox menus (
math function (Size) with a Home variable (L1):
F4(X)=X
the number of elements in the list named L1. (Size is an
option on the List menu, which is a sub-menu of the Math
menu.)
2
+X–Root. The value of the last root calculated in
D). The following definition combines a
2
–SIZE(L1). It is equivalent to x2– n where n is
• From CAS functions
Some of the functions on the CAS menu can be incorporated
into a definition. The CAS menu is one of the Toolbox menus
(
D). The following definition incorporates the CAS
function irem: F5(X)=X
2
+CAS.irem(45,7). (irem is
entered by choosing Remainder, an option on the
Division menu, which is a sub-menu of the Integer menu.
Note that any CAS command or function selected to operate
outside the CAS is given the CAS. prefix.)
• From app functions
Some of the functions on the App menu can be
incorporated into a definition. The App menu is one of the
Toolbox menus (
D). The following definition incorporates
the app function PredY:
F9(X)=X
2
+Statistics_2Var.PredY(6).
• From the Catlg menu
Some of the functions on the Catlg menu can be
incorporated into a definition. The Catlg menu is one of the
Toolbox menus (
D). The following definition incorporates
An introduction to HP apps 73
Page 80

a command from that menu and an app variable:
F6(X)=X
2
+INT(Root). The integer value of the last root
calculated in the Function app is substituted for INT(Root)
when this definition is evaluated.
• From other definitions
You could, for example, define F3(X)as F1(X)*F2(X).
Evaluate a dependent definition
If you have a dependent definition—that is, one defined in terms
of another definition—you can combine all the definitions into
one by evaluating the dependent definition.
1. Select the dependent expression.
2. Tap .
Consider the example at the
right. Notice that F3(X)is
defined in terms of two other
functions. It is a dependent
definition and can be evaluated.
If you highlight F3(X)and tap
, F3(X)becomes
2
2*X
+X+ 2 *(X2–1).
Select or deselect a definition to explore
In the Advanced Graphing, Function, Parametric, Polar,
Sequence, and Solve apps you can enter up to 10 definitions.
However, only those definitions that are selected in Symbolic view
will be plotted in Plot view and evaluated in Numeric view.
You can tell if a definition is selected by the tick (or checkmark)
beside it. A checkmark is added by default as soon as you create
a definition. So if you don’t want to plot or evaluate a particular
definition, highlight it and tap . (Do likewise if you want to
re-select a deselected function.)
Choose a color for plots
Each function and open
sentence can be plotted in a
different color. If you want to
change the default color of a
plot:
74 An introduction to HP apps
Page 81

1. Tap the colored square to the left of the function’s definition.
2. tap .
3. Select the desired color from the color-picker.
Delete a definition
To delete a single definition:
1. Tap once on it (or highlight it using the cursor keys).
You can also select the square by pressing E while
the definition is selected. Pressing
E moves the
selection from the definition to the colored square and from
the colored square to the definition.
2. Press
C.
To delete all the definitions:
1. P r e s s SJ.
2. Tap or press
E to confirm your intention.
An introduction to HP apps 75
Page 82

Symbolic view: Summary of menu buttons
Button Purpose
Copies the highlighted definition to the
entry line for editing. Tap when
done.
To add a new definition—even one that is
replacing an existing one—highlight the
field and just start entering your new
definition.
Selects (or deselects) a definition.
Enters the independent variable in the
[Function only]
[Advanced
Graphing only]
Function app. You can also press
Enters an X in the Advanced Graphing
app. You can also press
d.
d.
[Advanced
Graphing only]
[Parametric only]
[Polar only]
[Sequence only]
[Solve only]
Enters an Y in the Advanced Graphing
app.
Enters the independent variable in the
Parametric app. You can also press
d.
Enters the independent variable in the Polar
app. You can also press
d.
Enters the independent variable in the
Sequence app. You can also press
d.
Enters the equals sign in the Solve app. A
shortcut equivalent to pressing
S..
Displays the selected definition in fullscreen mode. See “Large results” on
page 36 for more information.
Evaluates dependent definitions. See
“Evaluate a dependent definition” on
page 74.
Common operations in Symbolic Setup view
76 An introduction to HP apps
Page 83

[Scope: all apps]
The Symbolic Setup view is the
same for all apps. Its primary
purpose is to allow you to
override three of the system-wide
settings specified on the Home
Settings window.
Press
SY to open Symbolic
Setup view.
Override system-wide settings
1. Tap once on the setting you want to change.
You can tap on the field name or the field.
2. Tap again on the setting.
A menu of options appears.
3. Select the new setting.
Note that selecting the Fixed, Scientific, or
Engineering option on the Number Format menu
displays a second field for you to enter the required number
of significant digits.
You could also select a field, tap , and select the new
setting.
Restore default settings
To restore default settings is to return precedence to the settings
on the Home Settings screen.
To restore one field to its default setting:
1. Select the field.
2. Press
To restore all default settings, press SJ.
C.
Common operations in Plot view
Plot view functionality that is common to many apps is described
in detail in this section. Functionality that is available only in a
particular app is described in the chapter dedicated to that app.
Press
An introduction to HP apps 77
P to open Plot view.
Page 84

Zoom
[Scope: Advanced Graphing, Function, Parametric, Polar,
Sequence, Solve, Statistics 1 Var, and Statistics 2Var. Also, to a
limited degree, Geometry.]
Zooming redraws the plot on a larger or smaller scale. It is a
shortcut for changing the range settings in Plot Setup view. The
extent of most zooms is determined by two zoom factors: a
horizontal and a vertical factor. By default, these factors are both
2. Zooming out multiplies the scale by the factor, so that a greater
scale distance appears on the screen. Zooming in divides the
scale by the factor, so that a shorter scale distance appears on
the screen.
Zoom factors To change the default zoom factors:
Zoom
options
1. Open the Plot view of the app (
2. Tap to open the Plot view menu.
3. Tap to open the Zoom menu.
4. Scroll and select Set
Factors.
The Zoom Factors screen
appears.
5. Change one or both zoom
factors.
6. If you want the plot to be
centered around the current position of the cursor in Plot
view, select Recenter.
7. Ta p o r p r e s s
Zoom options are available from three sources:
• the keyboard
E.
P).
• the menu in Plot view
• the Views menu (
Zoom keys There are two zoom keys: pressing + zooms in and pressing
w zooms out. The extent of the scaling is determined by the
ZOOM FACTOR settings (explained above).
78 An introduction to HP apps
V).
Page 85

Zoom menu In Plot view, tap and tap
an option. (If is not
displayed, tap .)
The zoom options are explained
in the following table. Examples
are provided on “Zoom
examples” on page 81.
Option Result
Center on
Cursor
Redraws the plot so that the cursor is in the
center of the screen. No scaling occurs.
Box Explained in “Box zoom” on page 80.
In Divides the horizontal and vertical scales
by X Zoom and Y Zoom (values set with
the Set Factors option explained on
page 78). For instance, if both zoom
factors are 4, then zooming in results in 1/
4 as many units depicted per pixel.
(Shortcut: press
+.)
Out Multiplies the horizontal and vertical scales
by the X Zoom and Y Zoom settings.
(Shortcut: press
w.)
X In Divides the horizontal scale only, using the
X Zoom setting.
X Out Multiplies the horizontal scale only, using
the X Zoom setting.
An introduction to HP apps 79
Y In Divides the vertical scale only, using the Y
Zoom setting.
Y Out Multiplies the vertical scale only, using the
Y Zoom setting.
Square Changes the vertical scale to match the
horizontal scale. This is useful after you
have done a box zoom, X zoom or Y
zoom.
Page 86

Option Result (Cont.)
Autoscale Rescales the vertical axis so that the display
shows a representative piece of the plot
given the supplied x axis settings. (For
Sequence and Statistics apps, autoscaling
rescales both axes.)
The autoscale process uses the first selected
function to determine the best scale to use.
Decimal Rescales both axes so each pixel is 0.1
units. This is equivalent to resetting the
default values for
XRNG and YRNG.
Integer
Rescales the horizontal axis only, making
each pixel equal to 1 unit.
Trig
Rescales the horizontal axis so that
1 pixel equals /24 radians or 7.5
degrees; rescales the vertical axis so that 1
pixel equals 0.1 units.
Undo Zoom
Returns the display to the previous zoom, or
if there has been only one zoom, displays
the graph with the original plot settings.
Box zoom A box zoom enables you to zoom in on an area of the screen that
you specify.
1. With the Plot view menu open, tap and select Box.
2. Tap one corner of the area you want to zoom in on and then
tap .
3. Tap the diagonally opposite corner of the area you want to
zoom in on and then tap .
The screen fills with the area you specified. To return to the
default view, tap and select Decimal.
Views menu The most commonly used zoom
options are also available on the
Views menu. These are:
• Autoscale
• Decimal
• Integer
• Trig.
80 An introduction to HP apps
Page 87

These options—which can be applied whatever view you are
3 xsin
currently working in—are explained in the table immediately
above.
Testing a
zoom with
split-screen
viewing
A useful way of testing a zoom is
to divide the screen into two
halves, with each half showing
the plot, and then to apply a
zoom only to one side of the
screen. The illustration at the
right is a plot of y = 3sin x. To
split the screen into two halves:
1. O p e n t h e Views menu.
Press
V
2. Select Split Screen:
Plot Detail.
The result is shown at the
right. Any zoom operation
you undertake will be
applied only to the copy of the plot in the right-hand half of
the screen. This will help you test and then choose an
appropriate zoom.
Zoom
examples
Note that you can replace the original plot on the left with the
zoomed plot on the right by tapping
To un-split the screen, press
The following examples show the effects of the zooming options
on a plot of using the default zoom factors (2 × 2). Splitscreen mode (described above) has been used to help you see the
effect of zooming.
Note that there is an Unzoom option on the Zoom menu. Use
this to return a plot to its pre-zoom state. If the Zoom menu is not
shown, tap .
Zoom In
In
Shortcut: press
+
P.
.
An introduction to HP apps 81
Page 88

Zoom Out
Out
Shortcut: press w
X In
XIn
X Out
X Out
Y In
Y Out
YIn
YOut
82 An introduction to HP apps
Page 89

Square
Square
Notice that in this example, the
plot on left has had a YIn zoom
applied to it. The Square zoom
has returned the plot to its
default state where the X and Y
scales are equal.
Autoscale
Autoscale
Decimal
Decimal
Notice that in this example, the
plot on left has had a XIn zoom
applied to it. The Decimal
zoom has reset the default
values for the x-range and y-
range.
Integer
Integer
Trig
Trig
An introduction to HP apps 83
Page 90

Trace
[Scope: Advanced Graphing, Function, Parametric, Polar,
Sequence, Solve, Statistics 1 Var, and Statistics 2Var.]
The tracing functionality enables
you to move a cursor (the trace
cursor) along the current graph.
You move the trace cursor by
pressing
move the trace cursor by tapping
on or near the current plot. The
trace cursor jumps to the point
on the plot that is closest point to where you tapped.
The current coordinates of the cursor are shown at the bottom of
the screen. (If menu buttons are hiding the coordinates, tap
Trace mode and coordinate display are automatically turned on
when a plot is drawn.
or >. You can also
<
to hide the buttons.)
To select a
plot
To evaluate a
definition
If there is more than one plot displayed, press = or \ until the
trace cursor is on the plot you are interested in.
One of the primary uses of the trace functionality is to evaluate a
plotted definition. Suppose in Symbolic view you have defined
F1(X) as (X–1)
what the value of that function is when X is 25.
1. Open Plot view (
2. If the menu at the bottom of the screen is not open, tap
.
3. If more than one definition is plotted, ensure that the trace
cursor is on the plot of the definition you want to evaluate.
You can press
press
= or \ to move the trace cursor from plot to plot.
4. If you pressed
at the bottom of the screen will be closed. Tap to reopen it.
2
–3. Suppose further that you want to know
P).
to see the definition of a plot, and
to see the definition of a plot, the menu
5. Tap .
6. Enter 25 and tap .
7. Ta p .
84 An introduction to HP apps
Page 91

The value of F1(X) when X
is 25 us shown at the
bottom of the screen. .
This is one of many ways the HP
Prime provides for you to
evaluate a function for a specific
independent variable. You can
also evaluate a function in
Numeric view (see page 92). Moreover, any expression you
define in Symbolic view can be evaluated in Home view. For
example, suppose F1(X)is defined as (x –1)
F1(4) in Home view and press
2
(4– 1)
–3 = 6.
E you get 6, since
2
– 3. If you enter
To turn
tracing on or
off
• To turn off tracing, tap .
• To turn on tracing, tap .
If these options are not displayed, tap .
When tracing is off, pressing the cursor keys no longer
constrains the cursor to a plot.
An introduction to HP apps 85
Page 92

Plot view: Summary of menu buttons
Button Purpose
Displays a menu of zoom options. See
“Zoom options” on page 78.
A toggle button for turning off and turning
on trace functionality. See “Trace” on
page 84.
Displays an input form for you to specify a
value you want the cursor to jump to. The
value you enter is the value of the
independent variable.
Displays a menu of options for analyzing a
[Function only]
plot. See “Analyzing functions” on
page 109.
Displays the definition responsible for
generating the selected plot.
A toggle button that shows and hides the
other buttons across the bottom of the
screen.
Common operations in Plot Setup view
This section covers only operations common to the apps
mentioned. See the chapter dedicated to an app for the appspecific operations done in Plot Setup view.
Press
SP to open Plot Setup view.
Configure Plot view
[Scope: Advanced Graphing,
Function, Parametric, Polar,
Sequence, Statistics 1 Var,
Statistics 2Var]
The Plot Setup view is used to
configure the appearance of Plot
view and to set the method by
which graphs are plotted. The
86 An introduction to HP apps
Page 93

configuration options are spread across two pages. Tap
to move from the first to the second page, and
to return to the first page.
Page 1
Tip
When you go to Plot view to see the graph of a definition
selected in Symbolic view, there may be no graph shown. The
likely cause of this is that the spread of plotted values is outside
the range settings in Plot Setup view. A quick way to bring the
graph into view is to press
V and select Autoscale. This
also changes the range settings in Plot Setup view.
Setup field Purpose
TRNG
[Parametric
only]
TSTEP
[Parametric only]
RNG
[Polar only]
Sets the range of T-values to be plotted.
Note that here are two fields: one for the
minimum and one for the maximum value.
Sets the increment between consecutive Tvalues.
Sets the range of angle values to be
plotted. Note that here are two fields: one
for the minimum and one for the maximum
value.
STEP
[Polar only]
SEQPLOT
[Sequence
only]
NRNG
[Sequence
only]
HWIDTH
[Stats 1 Var
only]
HRNG
[Stats 1 Var
only]
Sets the increment between consecutive
angle values.
Sets the type of plot: Stairstep or Cobweb.
Sets the range of N-values to be plotted.
Note that here are two fields: one for the
minimum and one for the maximum value.
Sets the width of the bars in a histogram.
Sets the range of values to be included in a
histogram. Note that here are two fields:
one for the minimum and one for the
maximum value.
An introduction to HP apps 87
Page 94

Setup field Purpose (Cont.)
S*MARK
[Stats 2 Var
only]
Sets the graphic that will be used to
represent a data point in a scatter plot. A
different graphic can be used for each of
the five analyses that can be plotted
together.
XRNG Sets the initial range of the x-axis. Note
that here are two fields: one for the
minimum and one for the maximum value.
In Plot view the range can be changed by
panning and zooming.
YRNG Sets the initial range of the y-axis. Note
that there are two fields: one for the
minimum and one for the maximum value.
In Plot view the range can be changed by
panning and zooming.
XTICK Sets the increment between tickmarks on
the x-axis.
Page 2
YTICK Sets the increment between tickmarks on
the y-axis.
Setup field Purpose
AXES Shows or hides the axes.
LABELS Places values at the ends of each axis to
show the current range of values.
GRID DOTS Places a dot at the intersection of each
horizontal and vertical grid line.
GRID LINES Draws a horizontal and vertical grid line at
each integer x-value and y-value.
CURSOR Sets the appearance of the trace cursor:
standard, inverting, or blinking.
CONNECT
[Stats 2 Var
Connects the data points with straight
segments.
only]
88 An introduction to HP apps
Page 95

Setup field Purpose (Cont.)
METHOD
[Not in either
statistics app]
Graphing methods
The HP Prime gives you the option of choosing one of three
graphing methods. The methods are described below, with each
applied to the function f(x)= 9*sin(e
• adaptive: this gives very
accurate results and is used
by default. With this method
active, some complex
functions may take a while
to plot. In these cases,
menu bar, enabling you to
stop the plotting process if you wish.
• fixed-step segments: this
method samples x-values,
computes their
corresponding y-values, and
then plots and connects the
points.
Sets the graphing method to adaptive,
fixed-step segments, or fixed-step dots.
Explained below.
appears on the
x
).
• fixed-step dots: this works
Restore default settings
[Scope: Advanced Graphing, Function, Parametric, Polar,
Sequence, Solve, Statistics 1 Var, Statistics 2Var, Geometry.]
To restore one field to its default setting:
1. Select the field.
An introduction to HP apps 89
like fixed-step segments
method but does not
connect the points.
Page 96

2. Press C.
To restore all default settings, press SJ.
Common operations in Numeric view
[Scope: Advanced Graphing, Function, Parametric, Polar]
Numeric view functionality that is common to many apps is
described in detail in this section. Functionality that is available
only in a particular app is described in the chapter dedicated to
that app.
Numeric view provides a table
of evaluations. Each definition in
Symbolic view is evaluated for a
range of values for the
independent variable. You can
set the range and fineness of the
independent variable, or leave it
to the default settings.
Zoom
Press
M to open Numeric view.
Unlike in Plot view, zooming in Numeric view does not affect the
size of what is displayed. Instead, it changes the increment
between consecutive values of the independent variable (that is,
the
NUMSTEP setting in the Numeric Setup view: see page 95).
Zooming in decreases the increment; zooming out increases the
increment. The row that was highlighted before the zoom remains
unchanged.
For the ordinary zoom in and zoom out options, the degree of
zooming is determined by the zoom factor. In Numeric view this
is the
NUMZOOM field in the Numeric Setup view. The default value
is 4. Thus if the current increment (that is, the
0.4, zooming in will further divide that interval by four smaller
intervals. So instead of x-values of 10, 10.4, 10,8, 11.2 etc., the
x-values will be 10, 10.1, 10.2, 10.3, 10.4, etc. (Zooming out
NUMSTEP value) is
90 An introduction to HP apps
Page 97

does the opposite: 10, 10.4, 10,8, 11.2 etc. becomes10, 11.6,
13.2, 14.8, 16.4, etc.).
Before zooming After zooming
Zoom
options
In Numeric view, zoom options are available from two sources:
• the keyboard
• the menu in Numeric view.
Note that any zooming you do in Numeric view does not affect
Plot view, and vice versa. However, if you choose a zoom option
from the Views menu (
V) while you are in Numeric view, Plot
view is displayed with the plots zoomed accordingly. In other
words, the zoom options on the Views menu apply only to Plot
view.
Zooming in Numeric view automatically changes the
NUMSTEP
value in the Numeric Setup view.
Zoom keys There are two zoom keys: pressing + zooms in and pressing
w zooms out. The extent of the scaling is determined by the
NUMZOOM setting (explained above).
Zoom menu In Numeric view, tap and
tap an option.
An introduction to HP apps 91
Page 98

The zoom options are explained in the following table.
Option Result
In The increment between consecutive values
of the independent variable becomes the
current value divided by the
NUMZOOM
setting. (Shortcut: press +.)
Out The increment between consecutive values
of the independent variable becomes the
current value multiplied by the
NUMZOOM
setting. (Shortcut: press w.)
Decimal Restores the default NUMSTART and NUMSTEP
values: 0 and 0.1 respectively.
Integer The increment between consecutive values
of the independent variable is set to 1.
Trig • If the angle measure setting is radians,
sets the increment between consecutive
values of the independent variable
to /24 (approximately 0.1309).
Evaluating
• If the angle measure setting is degrees,
sets the increment between consecutive
values of the independent variable to
7. 5.
Undo Zoom
Returns the display to the previous zoom, or
if there has been only one zoom, displays
the graph with the original plot settings.
You can step through the table of evaluations in Numeric view by
pressing
= or \. You can also quickly jump to an evaluation
by entering the independent variable of interest in the
independent variable column and tapping .
For example, suppose in the Symbolic view of the Function app,
you have defined F1(X) as (X–1)
2
–3. Suppose further that
you want to know what the value of that function is when X is 625.
1. Open Numeric view (
M).
2. Anywhere in the independent column—the left-most
column—enter 625.
92 An introduction to HP apps
Page 99

3. Tap .
Custom tables
If you choose Automatic for the NUMTYPE setting, the table of
evaluations in Numeric view will follow the settings in the
Numeric Setup view. That is, the independent variable will start
with the
(These settings are explained in “Common operations in Numeric
Setup view” on page 95.) However, you can choose to build your
own table where just the values you enter appear as independent
variables.
Numeric view is refreshed,
with the value you entered
in the first row and the result
of the evaluation in a cell to
the right. In this example,
the result is 389373.
NUMSTART setting and increment by the NUMSTEP setting.
Deleting
data
1. Open Numeric Setup view.
SM
2. Choose BuildYourOwn from the NUMTYPE menu.
3. Open Numeric view.
Numeric view will be empty.
4. In the independent
column—the left-most
column—enter a value of
interest.
5. Tap .
6. If you still have other values
to evaluate, repeat from step
4.
To delete one row of data in your custom table, place the cursor
in that row and press
C.
To delete all the data in your custom table:
1. P r e s s SJ.
2. Tap or press
An introduction to HP apps 93
E to confirm your intention.
Page 100

Numeric view: Summary of menu buttons
Button Purpose
To modify the increment between
consecutive values of the independent
variable in the table of evaluations. See
page 90.
To edit the value in the selected cell.
[BuildYourOwn
only]
[BuildYourOwn
only]
To overwrite the value in the selected cell,
you can just start entering a new value
without first tapping .
Only visible if
NUMTYPE is set to
BuildYourOwn. See “Custom tables” on
page 93.
To create a new row above the currently
highlighted cell, with zero as the
independent value. You can immediately
start typing a new value.
Only visible if
NUMTYPE is set to
BuildYourOwn. See “Custom tables” on
page 93.
[BuildYourOwn
only]
To sort the values in the selected column in
ascending or descending order. Move the
cursor to the column of interest, tap ,
select Ascending or Descending, and
tap .
Only visible if
NUMTYPE is set to
BuildYourOwn. See “Custom tables” on
page 93.
Toggles the display between medium and
large font.
Toggles between showing the value of the
cell and the definition that generated the
value.
94 An introduction to HP apps
 Loading...