

Page 1
Hewlett-Packard Interpretive Cardiograph
Physician's Guide
ABCDE
HP Part No. M1700-92908
Printed in USA September 1994
Edition 4
E0994
Page 2
Notice
The information in this documentmaychange without
notice.
Hewlett-Packard makes no warrantyofany kind with
regard to this material, including, but not limited to,
the implied warranties of merchantability and tness
for a particular purpose. Hewlett-Packard shall not be
liable for errors herein or for incidental or consequential
damages in connection with the furnishing, performance
or use of this material.
This document contains or refers to proprietary
information which is protected by copyright. All
rights are reserved. Copying or other repro duction
of this document without prior written permission of
Hewlett-Packard Company is prohibited.
c
Copyright 1990, 1991, 1992, 1993, 1994
Hewlett-Packard Company.
Page 3
Printing History
May 1990 Edition 1
September 1990 Edition 2
January 1992 Edition 3
September 1994 Edition 4
iii
Page 4
About This Guide
This guide explains how the clinical ECG reports
are analyzed by an Hewlett-Packard interpretive
cardiograph. It also shows howanHPinterpretive
cardiograph ensures reliable results.
Note
Computerized ECG analysis should always be reviewed
by a qualied physician.
iv
Page 5
Who Should Read
This Guide?
Information Resource
This guide is intended for physicians who read or review
ECGs produced by a Hewlett-Packard interpretive
cardiograph. It also maybeofinterest to other
healthcare professionals who want to know more about
HP's interpretive cardiographs. The following table
shows where you can nd additional information on
related topics.
How to congure the cardiograph. The
cardiograph.
Description of ECL (the programming
language in which the interpretive
ECL Programmers Reference Manual
Hewlett-Packard
criteria is written).
Complete ECL program listing of all
criteria statements.
Operating instructions and guidelines for
the Hewlett-Packard ECG Management
System.
Note
This book discusses several functions that may not b e
Interpretive Criteria Listing
Hewlett-Packard
ECG Management System manuals, or contact
your Hewlett-Packard customer support
representative.
available on your HP interpretive cardiograph, suchas
oppy-disk storage, mo dem data transmission, extended
measurement report, signal averaged ECG, internal
congurations, alternate patient lead sets or patient lead
congurations. Refer to the
your cardiograph for a guide to the functions available
on your cardiograph.
User's Reference Guide
User's Guide
provided with your
. Order from
. Order from
supplied with
v
Page 6
Documentation
Map
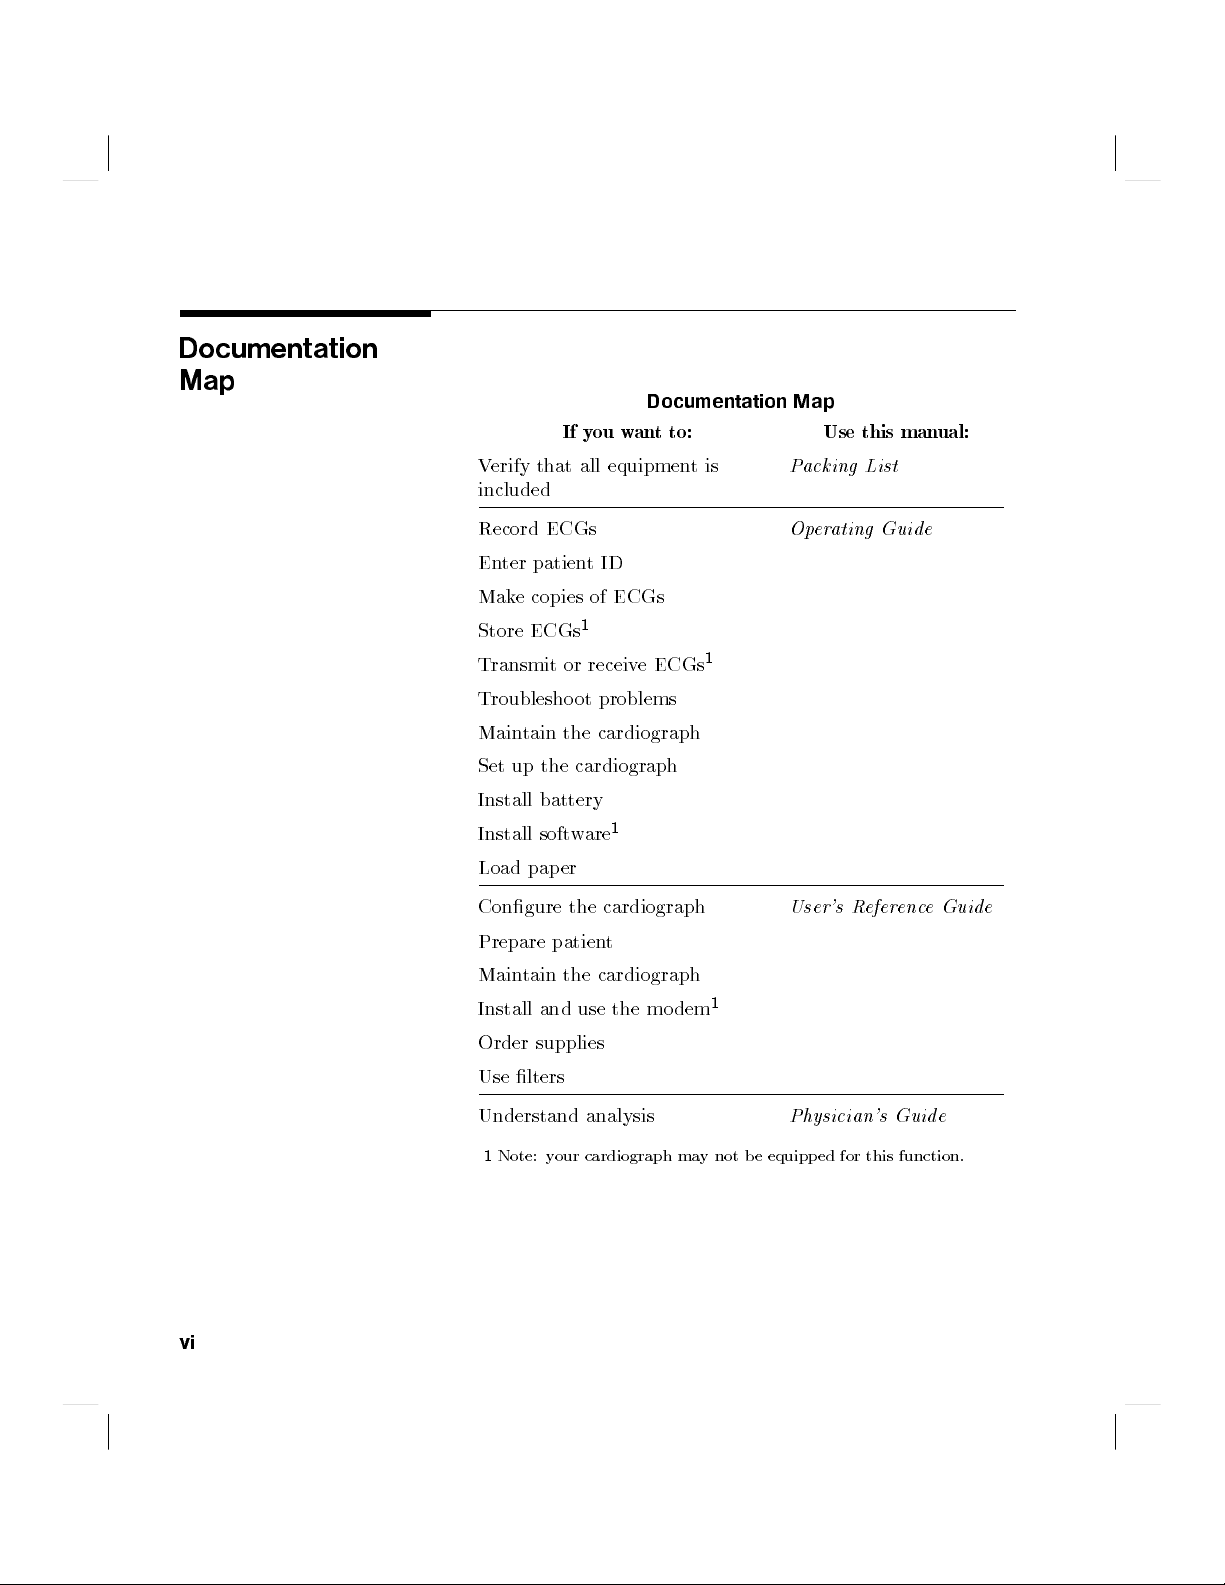
Documentation Map
If you want to: Use this manual:
Verify that all equipmentis
included
Packing List
Record ECGs
Enter patientID
Make copies of ECGs
Store ECGs
1
Transmit or receive ECGs
Troubleshoot problems
Maintain the cardiograph
Set up the cardiograph
Install battery
Install software
1
Load paper
Congure the cardiograph
Prepare patient
Maintain the cardiograph
Install and use the mo dem
Order supplies
Use lters
Operating Guide
1
User's Reference Guide
1
Understand analysis
1
Note: your cardiograph may not be equipp ed for this function.
Physician's Guide
vi
Page 7
Contents
1. Why Use an Interpretive Cardiograph?
What You Can Exp ect of the HP ECG
Analysis Program . . . . . . . . . 1-2
2. How Computerized ECG Interpretation has
Developed
3. Understanding Simultaneous 12-Lead Acquisition
Digitizing the ECG . . . . . . . . . . 3-3
Reducing Artifact . . . . . . . . . . 3-5
Common Mode Rejection . . . . . . 3-5
Using Filters . . . . . . . . . . . . . 3-6
Frequency Response Filters . . . . . 3-7
AC Filter . . . . . . . . . . . . . 3-8
Baseline Wander Filter . . . . . . . 3-8
Artifact Filter . . . . . . . . . . . 3-10
Monitoring ECG Quality . . . . . . . 3-10
4. The HP ECG Analysis Program
Understanding the HP ECG Analysis
Program . . . . . . . . . . . . . 4-2
How the HP Interpretive Cardiograph
Measures ECGs . . . . . . . . . . 4-3
Waveform Recognition . . . . . . . 4-4
Comprehensive Measurements . . . . 4-4
Group Measurements . . . . . . . . 4-4
Lead Measurements . . . . . . . . . 4-5
Atrial Rhythm Analysis . . . . . . . 4-5
Global Measurements . . . . . . . . 4-6
Axis Measurements . . . . . . . . . 4-6
Contents-1
Page 8
The ECG Criteria Language (ECL) . . . 4-7
Categories . . . . . . . . . . . . . 4-7
Sentences . . . . . . . . . . . . . 4-7
Overall Severity . . . . . . . . . . 4-9
Further Information . . . . . . . . . . 4-9
5. The HP Adult ECG Criteria Program
Understanding the HP Adult ECG Criteria
Program . . . . . . . . . . . . . 5-2
Pediatric Age Disclaimer . . . . . . 5-4
Calibration Notice if Not Standard . . 5-4
Technical Quality Statements . . . . 5-5
Electronic Pacemaker . . . . . . . . 5-5
Basic Cardiac Rhythm . . . . . . . 5-5
Premature Beats (Short R-R) . . . . 5-6
Pauses (Long R-R) . . . . . . . . . 5-6
Miscellaneous Arrhythmias . . . . . 5-7
AV Conduction (PR Interval) . . . . 5-8
QRS Axis . . . . . . . . . . . . . 5-9
Ventricular Conduction Delays . . . . 5-10
RightAtrial Enlargement . . . . . . 5-11
RightVentricular Hypertrophy. . . . 5-11
Prominent R or R
0
in V1 . . . . . 5-11
Prominent Q or S in I or V6 . . . . 5-12
RightAtrial Enlargement . . . . . 5-12
Right Axis Deviation in the Frontal
Plane . . . . . . . . . . . . 5-12
ST{T Changes Characteristic of RVH 5-12
Left Atrial Enlargement. . . . . . . 5-12
Left Ventricular Hypertrophy . . . . 5-13
High Voltage in QRS Components . 5-13
Left Axis Deviation in the Frontal
Plane . . . . . . . . . . . . 5-14
Left Atrial Enlargement. . . . . . 5-14
ST{T Changes Characteristic of LVH 5-14
A Prolonged QRS Duration or
Ventricular Activation Time . . 5-14
Chronic Pulmonary Disease . . . . . 5-15
Contents-2
Page 9
Inferior Infarct . . . . . . . . . . . 5-15
Posterior Infarct . . . . . . . . . . 5-16
Lateral Infarct . . . . . . . . . . . 5-17
Anteroseptal and Anterior Infarct . . . 5-17
Anterolateral and ExtensiveAnterior
Infarct . . . . . . . . . . . . . 5-18
Apical Infarct . . . . . . . . . . . 5-19
Tall T Waves . . . . . . . . . . . . 5-19
Drug and Electrolyte Eects . . . . . 5-19
TWave Abnormalities . . . . . . . 5-19
Ischemia . . . . . . . . . . . . . . 5-21
ST Segment Depression . . . . . . . 5-21
Subendocardial Injury . . . . . . . . 5-22
Combined ST and T Abnormalities . . 5-23
Injury and Ischemia . . . . . . . . . 5-23
ST Segment Elevation . . . . . . . . 5-23
Severity . . . . . . . . . . . . . . 5-24
6. The HP Pediatric ECG Criteria Program
Understanding the H-P Pediatric ECG
Criteria Program . . . . . . . . . 6-2
Pediatric ECG Interpretation . . . . 6-4
Calibration Notice if Not Standard . . 6-4
Technical Quality Statements . . . . 6-4
Electronic Pacemaker . . . . . . . . 6-5
Dextrocardia . . . . . . . . . . . . 6-5
Basic Cardiac Rhythm . . . . . . . 6-5
Sinus Rhythms . . . . . . . . . . . 6-5
Atrial Premature Complex . . . . . . 6-6
Ventricular Premature Complex . . . 6-7
PR Interval . . . . . . . . . . . . 6-7
Wol-Parkinson-White Syndrome . . . 6-7
Ventricular Conduction Delay . . . . 6-7
Right Bundle Branch Block . . . . . 6-7
Left Bundle Branch Blo ck . . . . . . 6-8
RightAtrial Enlargement . . . . . . 6-8
RVH: QRS Voltage Criteria . . . . . 6-8
Right Axis Deviation . . . . . . . . 6-9
Contents-3
Page 10
RVH: T Wave Criteria . . . . . . . 6-9
RightVentricular Hypertrophy. . . . 6-9
Left Atrial Enlargement. . . . . . . 6-10
LVH: QRS Voltage Criteria . . . . . 6-10
Left Axis Deviation . . . . . . . . . 6-10
LVH: ST Segment and T Wave Criteria 6-11
Left Ventricular Hypertrophy . . . . 6-11
Biventricular Hypertrophy. . . . . . 6-11
Anterior ST Elevation . . . . . . . . 6-11
Inferior ST Elevation . . . . . . . . 6-12
Anterolateral ST Elevation . . . . . . 6-12
Anterior ST Depression . . . . . . . 6-12
Inferior ST Depression . . . . . . . 6-12
Anterolateral ST Depression . . . . . 6-12
Anterior T Wave Changes . . . . . . 6-13
Inferior T Wave Changes . . . . . . 6-13
Anterolateral T Wave Changes . . . . 6-13
Anatomical Diagnoses . . . . . . . . 6-14
Severity.. . . . . . . . . . . . . 6-14
7. Reading the Printed Rep ort
Auto Interpretive Reports . . . . . . . 7-2
Patient Information . . . . . . . . . 7-3
Basic Measurements . . . . . . . . 7-4
Interpretive Information . . . . . . . 7-5
Calibration Pulse . . . . . . . . . . 7-6
Rhythm Strip . . . . . . . . . . . 7-6
Settings . . . . . . . . . . . . . . 7-7
Auto Rep ort Formats . . . . . . . . 7-8
Extended Measurements Report . . . . 7-10
Manual Reports . . . . . . . . . . . 7-11
Cardiograph Settings . . . . . . . . 7-12
Manual Report Formats . . . . . . . 7-13
Contents-4
Page 11
8. Managing Your ECGs
PageWriter Communications . . . . . . 8-3
ECG Management Systems . . . . . . 8-4
Clinical Rewards . . . . . . . . . . 8-5
CurrentTrends . . . . . . . . . . . 8-6
A. Questions and Answers
B. PatientIDCodeTables
C. The Extended Measurements Rep ort
Morphology Analysis . . . . . . . . . C-3
Individual Lead Measurements . . . . C-3
Cal Factors . . . . . . . . . . . . C-8
Frontal/Horizontal . . . . . . . . . C-9
Analysis Statement Co des . . . . . . C-10
Rhythm Analysis . . . . . . . . . . . C-10
Group Measurements . . . . . . . . C-10
Group Flags . . . . . . . . . . . . C-13
Global Rhythm Parameters . . . . . C-14
Rhythm Grouping of Beats . . . . . C-16
D. Understanding the M1754A Signal-Averaging
Process
Introduction . . . . . . . . . . . . . D-1
M1754A ECG Signal Averaging . . . . D-3
Signal Acquisition . . . . . . . . . D-3
SAECG Technique . . . . . . . . D-3
Lead System . . . . . . . . . . . D-3
SAECG Signal Path . . . . . . . D-4
Signal Amplication . . . . . . D-5
Signal Digitization . . . . . . . D-5
Signal Conditioning . . . . . . . D-5
Template Selection . . . . . . . . . D-6
Signal Averaging . . . . . . . . . . D-7
Beat Rejection . . . . . . . . . . D-8
Noise Reduction . . . . . . . . . D-10
Filtering . . . . . . . . . . . . . . D-11
Contents-5
Page 12
Measurements . . . . . . . . . . . D-13
QRS Duration . . . . . . . . . . D-13
Terminal RMS Voltage . . . . . . D-14
Low Amplitude Signal Duration . . D-15
Total RMS Voltage . . . . . . . . D-17
Understanding the M1754A ECG
Signal-Averaging Rep ort . . . . . . D-18
Patient Information . . . . . . . . . D-19
Report Settings . . . . . . . . . . D-20
Individual Lead and Vector
Measurements . . . . . . . . . . D-20
Unltered Leads . . . . . . . . . . D-21
Absolute Filtered Leads . . . . . . . D-21
Vector Magnitude . . . . . . . . . D-21
Bibliography. . . . . . . . . . . . . D-22
Glossary
Index
Contents-6
Page 13
Figures
3-1. Ten Seconds of 12 Leads on an Auto 3x4
Report. . . . . . . . . . . . . . 3-1
3-2. Ten Seconds of 12 Leads on an Auto 6x2
Report. . . . . . . . . . . . . . 3-2
3-3. Digitizing the ECG. . . . . . . . . . 3-3
3-4. The Filter Box on the ECG Report. . . 3-7
4-1. The HP ECG Analysis Pro cess. . . . 4-1
4-2. ECG Morphology Measurements. . . . 4-3
7-1. A Typical Interpretive Report. . . . . 7-2
7-2. An Auto 3x4 Report. (3x4) . . . . . 7-8
7-3. An Auto 3x4 Report with a Rh
ythm
Strip. (3x4, 1R) . . . . . . . . . 7-8
7-4. An Auto 3x4 Report with 3 Rh
ythm
Strips. (3x4, 3R) . . . . . . . . 7-9
7-5. An Auto 6x2 Report. (6x2) . . . . . 7-9
7-6. An Extended Measurements Report
(Morphology). . . . . . . . . . . 7-10
7-7. An Extended Measurements Report
(Rhythm). . . . . . . . . . . . 7-11
7-8. A Manual 3-Lead Format. . . . . . . 7-13
7-9. A Manual 6-Lead Format. . . . . . . 7-14
7-10. A Manual 12-Lead Format. . . . . . 7-14
8-1. Managing ECGs. . . . . . . . . . . 8-2
A-1. A Cabrera Report. (6x2) . . . . . . A-5
A-2. Frontal Plane Lead Axes. . . . . . . A-5
C-1. An Extended Measurements Report.
(Morphology) . . . . . . . . . . C-2
C-2. ECG Morphology Measurements. . . . C-3
C-3. An Extended Measurements Report.
(Rhythm) . . . . . . . . . . . C-10
Contents-7
Page 14
D-1. The Signal-Averaging Process. . . . . D-4
D-2. The Noise Reduction Curve. . . . . . D-10
D-3. The Vector Magnitude Waveform. . . D-12
D-4. QRS Duration. . . . . . . . . . . . D-13
D-5. Terminal RMS Voltage. . . . . . . . D-15
D-6. Low Amplitude Signal Duration. . . . D-16
D-7. The RMS Voltage. . . . . . . . . . D-17
D-8. The SAECG Rep ort. . . . . . . . . D-18
Contents-8
Page 15
Tables
5-1. Calibration . . . . . . . . . . . . 5-4
5-2. Borderline and Abnormally Prolonged
PR Intervals (ms) . . . . . . . . 5-8
5-3. T Wave Abnormality Lo calization . . 5-20
5-4. ST Segment Depression Localization . 5-22
5-5. ST Segment Elevation Lo calization . . 5-24
6-1. Calibration . . . . . . . . . . . . 6-4
6-2. Age vs. Ventricular Rate for Sinus
Rhythms . . . . . . . . . . . . 6-6
7-1. Basic Measurements . . . . . . . . 7-4
7-2. Calibration Signals . . . . . . . . . 7-6
B-1. Patient ID Fields . . . . . . . . . . B-2
B-2. Medication and Diagnosis Codes . . . B-3
B-3. Race Co des . . . . . . . . . . . . B-4
B-4. Severity Co des . . . . . . . . . . . B-4
D-1. Rep ort Settings . . . . . . . . . . D-20
D-2. Individual Lead and Vector
Measurements . . . . . . . . . . D-20
Contents-9
Page 16

Page 17
Why Use an Interpretive Cardiograph?
While a computer-interpreted ECG rep ort is not a
substitute for overreading by a qualied physician,
computerized interpretation is a very useful tool in
improving physician and sta productivity. The
program's basic measurements and interpretation can
help the physician save time when overreading reports.
The HP ECG Analysis program is highly eectiveat
screening normal ECGs. ECGs requiring comment
already have the initial computerized commentary on
them, so the physician has a head start on the nal
interpretation.
The HP ECG Analysis Program makes quick and
consistent measurements of the ECG. It makes detailed
measurements over the entire ECG, providing more data
for a more accurate interpretation. The program can
help identify problem areas for the physician. This saves
time for the physician or editing technician who may
only need to add, delete or mo dify a few statements.
1
Those who read ECGs infrequently may nd the
interpreted rep orts to be useful training to ols. They can
refer to reasons asso ciated with each statement for the
rationale for why a particular condition was suggested.
Why Use an Interpretive Cardiograph? 1-1
Page 18
What You Can
Expect of the HP
ECG Analysis
Program
The HP ECG Analysis Program provides an analysis of
the amplitudes, durations and morphologies of the ECG
waveform. The ECG waveform analysis is based upon
standards of interpretation of these parameters as well as
upon calculations of the electrical axis and relationship
between leads.
Just as cardiologists may disagree on interpretations,
occasionally there is some disagreementbetween an
interpretation given by the computer program and that
made by a cardiologist. The interpreted ECG is a tool to
assist the physician in making a clinical diagnosis. It is
best used in conjunction with the physician's knowledge
of the patient, the results of the physical examination,
the ECG tracing, and other ndings.
1-2 Why Use an Interpretive Cardiograph?
Page 19
How Computerized ECG Interpretation has
Developed
Development of computer-assisted ECG analysis began
in the 1960s. Initially only used in research facilities,
computer interpretation has developed into an accepted
tool for physicians.
Hewlett-Packard entered the computerized ECG analysis
eld in 1968 when it obtained and oered sev
existing analysis programs. In 1975 Hewlett-Packard
introduced one of the rst commercially available
systems to provide long-term ECG storage. ECGs were
stored, retrieved and managed on this rst HP 5600C
ECG Management system. The system analyzed ECGs
using the existing analysis programs. Hewlett-Packard
was able to identify some unique contributions it could
make to the eld of ECG analysis, which resulted in
the 1978 introduction of the ECG Criteria Language
(ECL). ECL enabled HP to write the Hewlett-Packard
Adult Criteria program, which replaced all of the earlier
programs.
2
eral
In 1980 Hewlett-Packard intro duced the HP 4700
PageWriter cardiograph, which digitally acquired ECGs.
In 1983 it became p ossible to transmit ECGs digitally
over phone lines to the HP 5600C ECG Managemen
system.
How Computerized ECG Interpretation has Developed 2-1
t
Page 20
Computerized ECG interpretation b ecame available
on the cardiograph in 1983 when Hewlett-Packard
introduced the HP 4760AI PageWriter Intelligent
cardiograph. The proven ECG analysis program from
the HP 5600C was implemented on the HP 4760AI
cardiograph. Hewlett-Packard's Pediatric Criteria
program was also introduced in 1983 for b oth the HP
ECG Management system and the cardiograph.
Your HP interpretive cardiograph continues the tradition
of improving the p erformance of the analysis program.
The ECG Measurement program has been enhanced and
is now in its seventh revision. Simultaneous twelve-lead
acquisition allows detection of waveform onsets and
osets more accurately. The additional waveform
information helps to dene each beat's components
better in the measurements section of the analysis. This
increased denition produces more consistent results
overall.
The Criteria program continues to evolve. Since its
initial release, the program has undergone several
changes. The current release is the eighth revision of
the Adult analysis criteria and the fourth revision of
the Pediatric analysis criteria. Suggestions made byan
advisory group of respected electro cardiographers are
evaluated regularly for inclusion in subsequent releases.
2-2 How Computerized ECG Interpretation has Developed
Page 21
Understanding Simultaneous 12-Lead Acquisition
Computer-assisted ECG analysis begins with acquiring
high quality, accurate ECG waveforms. Your HP
interpretive cardiograph simultaneously acquires up to
16 ECG leads (depending on the mo del) and analyzes 12
leads. Although the printed recording doesn't show it,
the Hewlett-Packard ECG Analysis Program uses the
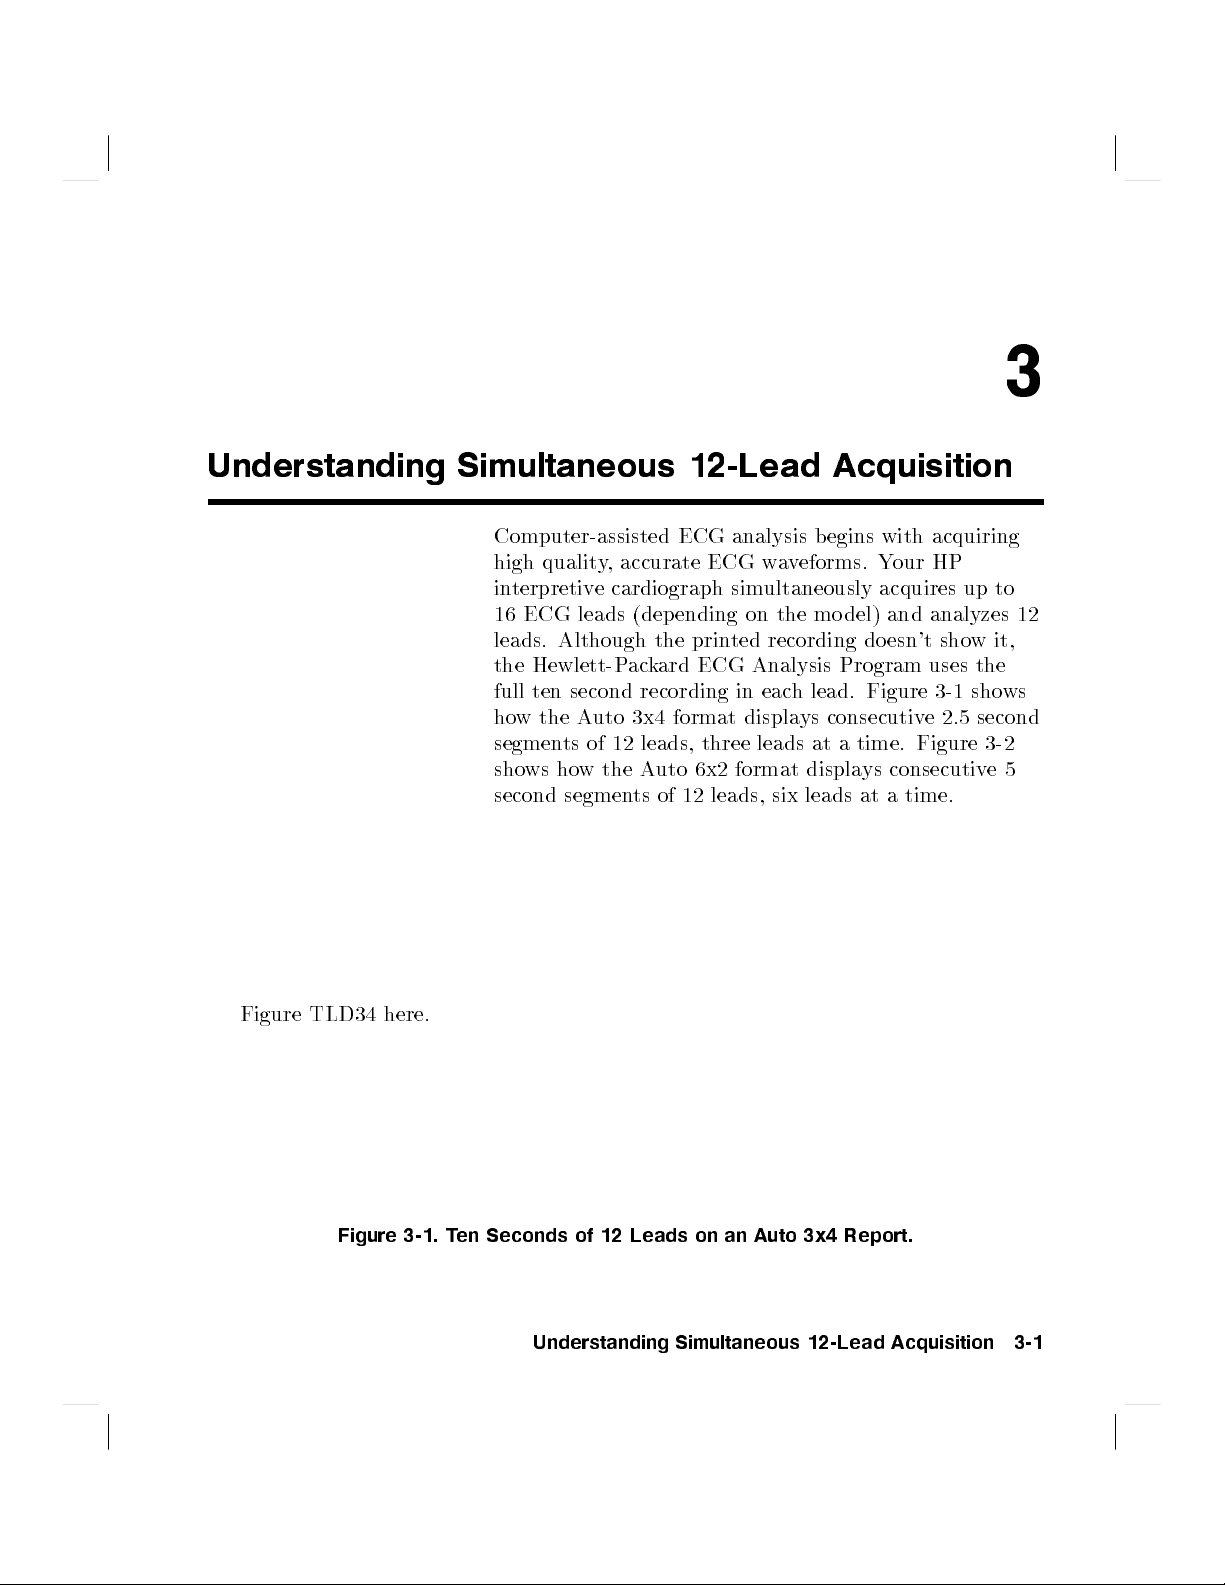
full ten second recording in each lead. Figure 3-1 shows
how the Auto 3x4 format displays consecutive 2.5 second
segments of 12 leads, three leads at a time. Figure 3-2
shows how the Auto 6x2 format displays consecutive5
second segments of 12 leads, six leads at a time.
3
Figure TLD34 here.
Figure 3-1. Ten Seconds of 12 Leads on an Auto 3x4 Report.
Understanding Simultaneous 12-Lead Acquisition 3-1
Page 22
Figure TLD62 here.
Figure 3-2. Ten Seconds of 12 Leads on an Auto 6x2 Report.
Besides the conventional 12 leads, your cardiograph may
have the capability to use one of the following sets of
supplemental leads:
pediatric leads V4R, V3R, V7
or Frank leads X, Y, Z
or research leads VX1, VX2, VX3, VX4
The p ediatric leads may b e used for conrming certain
right-sided interpretations in pediatric and, o ccasionally,
in adult applications. The research leads provide four
additional V-type leads that may be placed at your
discretion and recorded simultaneously with the standard
12 leads. Because their lo cation is not preassigned as
with the pediatric leads, they are simply labeled VX1
through VX4. The Frank leads, X, Y, and Z,
3-2 Understanding Simultaneous 12-Lead Acquisition
Page 23
capture a three-dimensional, orthogonal view of the
heart's electrical activity. If they are available on your
cardiograph, any of these supplemental leads can be
displayed as rhythm strips with the conventional 12-lead
ECG. Regardless of which supplemental set of leads you
choose, all ECG waveforms are acquired simultaneously.
Digitizing the ECG
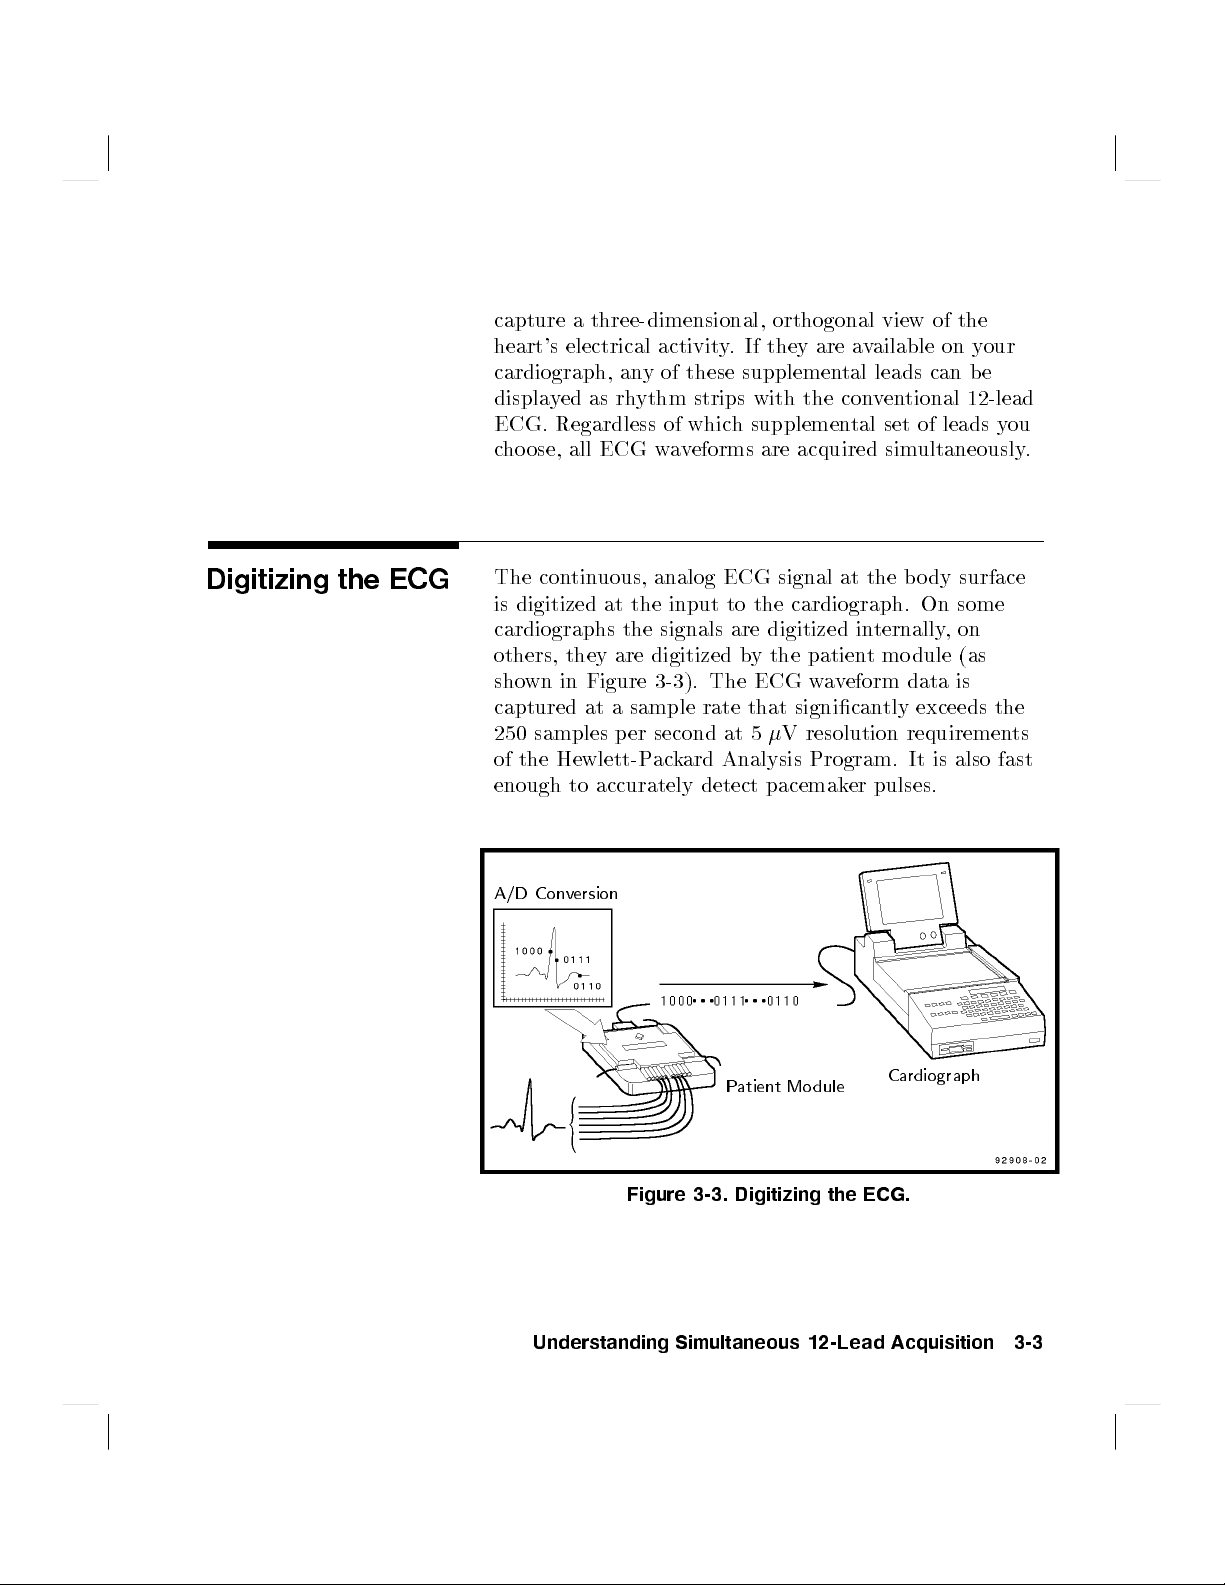
The continuous, analog ECG signal at the bo dy surface
is digitized at the input to the cardiograph. On some
cardiographs the signals are digitized internally,on
others, they are digitized by the patient module (as
shown in Figure 3-3). The ECG waveform data is
captured at a sample rate that signicantly exceeds the
250 samples per second at 5V resolution requirements
of the Hewlett-Packard Analysis Program. It is also fast
enough to accurately detect pacemaker pulses.
A/D Conversion
Patient Mo dule
Cardiograph
Figure 3-3. Digitizing the ECG.
Understanding Simultaneous 12-Lead Acquisition 3-3
Page 24
As the ECG is converted to digital form, it is digitally
ltered. Not only is this approach more exible, it
provides superior results when compared to analog
ltering. The HP cardiograph's digital signal processing
ensures the most accurate reproduction of the patient's
ECG waveforms.
The American Heart Association's 1989
Recommendations for standardization and specications
in automated electrocardiography: bandwidth and digital
signal processing,
for adult ECGs to 125 Hz and for infant ECGs to
150 Hz. These recommendations are met by the data
acquisition scheme in all HP interpretive cardiographs.
The HP interpretive cardiograph's input circuitry has
a dynamic range that meets or exceeds current AAMI
standards.
extended the recommended bandwidth
3-4 Understanding Simultaneous 12-Lead Acquisition
Page 25
Reducing Artifact
Electrical interference, patient respiration, patient
movement and muscle tremors can add noise and artifact
to the ECG signal. Poor quality electro des or inadequate
patient preparation can also degrade the ECG signal.
Your HP interpretive cardiograph has b een carefully
designed to substantially reduce artifact and accurately
record the ECG signal.
Common Mode
Rejection
Some of the noise sources that interfere with the ECG
signal are common to each electrode attached to the
patient. To the extent that they have an identical eect
on the ECG signal in each lead, they are removed
from the ECG by the cardiograph's input circuitry as
the signal is acquired and digitized. The amountof
reduction of these
common mode
signals is referred to as
the common mode rejection ratio. The common mo de
rejection ratio of your HP interpretive cardiograph's
input circuitry meets or exceeds current AAMI
standards.
The eects of ACinterference on the ECG are twofold,
common mode and dierential mode. The interference
which is common to all electrodes (common mo de) is
removed in the HP interpretive cardiograph's input
circuitry.Even though this circuitry greatly reduces
common mode noise, go od ECG technique is still
important. In the case of dierential mode, the magnetic
elds associated with electrical p ower interact with
the lead wires. This induces electrical signals which
appear as high frequency noise on the ECG. Ho
wmuch
distortion there is depends on the size of the loop
created by the lead wire and its orientation. A go od way
to prevent this distortion is to align the lead wires with
the patient's bo dy.
Understanding Simultaneous 12-Lead Acquisition 3-5
Page 26
Using Filters
Computerized signal processing in the HP interpretive
cardiograph removes noise and artifact while minimizing
distortion of the ECG waveform. A sophisticated set of
digital lters can be selected by the op erator (or during
conguration) to optimize the ECG waveform. Digital
lters have the advantage over traditional analog lters
in their abilit y to be nely tuned to selected frequencies.
Unlike analog lters, digital lters are very stable over
time and temperature, meaning that ECGs taken under
various conditions will receive the same high quality
ltering.
With the exception of the AC lter, whichisvery
selective, there is always some tradeo in ltering
between delity and clarit y of the ECG trace. The more
ltering applied to the signal, the greater the possibility
of removing details of the ECG signal with noise of the
same frequency.
There are a variety of noise sources which can potentially
degrade the repro duction of the ECG signal. Sev
types of lters can be used in y
cardiograph to counteract them and reduce the artifact
in the ECG. In the lower right-hand corner of the HP
interpretive ECG report is a bo
about the ltering options used on each ECG. Note that
your PageWriter mayor may not have all of these lters.
our HP interpretive
x containing information
eral
3-6 Understanding Simultaneous 12-Lead Acquisition
Page 27
Insert artwork here.
Figure 3-4. The Filter Box on the ECG Report.
Frequency Response
Filters
These lters suppress frequencies at the high and lo
ends of the ECG signal spectrum. The a
frequency response lter settings are 40, 100 and 150 Hz.
In 1989, the American Heart Association recommended
that frequencies up to 125 Hz be recorded for adult
ECGs and that frequencies up to 150 Hz be recorded
for pediatric ECGs (American Heart Asso ciation's 1989
Recommendations for standardization and specications
in automated electrocardiography: bandwidth and digital
signal processing
records and analyzes all ECGs with frequencies up
to 150 Hz. The 40 and 100 Hz lters only aect the
printed report. They result in a smoother-lo oking ECG
waveform, at the expense of eliminating some of the ne
detail in the signal. Small deections, notches, and slurs
may b e distorted or may disapp ear altogether if one of
these lters is selected for the Auto frequency response.
). Your HP interpretive cardiograph
vailable high
w
Understanding Simultaneous 12-Lead Acquisition 3-7
Page 28
The available low frequency response lter settings are
0.05, 0.15, and 0.5 Hz. The 0.5 Hz lter is also the
baseline wander lter. The low frequency response lter
settings aect analyzed and printed ECGs.
The frequency response of the ECG is indicated in the
ECG rep ort's lter box.
AC Filter
Baseline Wander
Filter
The AC lter adaptively detects the ACinterference in
the ECG signal and very selectively removes it without
aecting the ECG. This lter aects analyzed and
printed ECGs.
The AC lter removes interference created by the
magnetic elds associated with electrical power
interacting with the lead wires. The frequency of the
ACinterference is very stable at 60 or 50 Hz, so the A
C
lter can remove the AC noise and leave the ECG signal
intact.
The line power, or AC, lter is indicated in the second
position of the ECG report lter bo
"(your cardiograph may also report the congured
\
line frequency 50 or 60). If the lter bo
xby the symbol
x does not
contain this symbol, the AC lter was not used for the
ECG.
Baseline wander is the term used to describe the slow
(typically 0.1{0.2 Hz) drifting of the ECG baseline up or
down during the ECG recording. Baseline wander may
result from patient respiration or from other sources.
Severe baseline wander can make it dicult to determine
the true wave shap es in the ECG.
3-8 Understanding Simultaneous 12-Lead Acquisition
Page 29
Early analog attempts to suppress the eects of baseline
wander resulted in \smearing" the QRS complex
into the ST segment. In 1975, the American Heart
Association addressed this problem by recommending
that frequencies as low as 0.05 Hz be preserved in the
ECG signal to prevent the then common ST segment
distortion. (American Heart Association's 1975
Recommendations for standardization of leads and of
specications for instruments in electrocardiography and
vectorcardiography.
)
Since the advent of digital ECG acquisition in the
1980's, eective baseline wander suppression techniques
that do not distort the ST segmenthave been a part
of Hewlett-Packard's cardiographs. While the lower
frequency limit of 0.15 Hz, whichwe recommend for
normal use, eliminates baseline wander from most ECGs,
you may occasionally need extra suppression. The
4
Filter
5
key on the key panel can b e congured to allow the
operator to turn on the baseline wander lter when
needed. The baseline wander lter suppresses frequencies
below 0.5 Hz. It aects analyzed and prin
ted ECGs.
The baseline wander lter is represented by a \W" in the
ECG report's lter box.
Note
Because of the continuous recording of the ECG in
Manual mo de, a dierent 0.5 Hz (baseline wander)
lter that may distort the ST segmentmust be used.
Therefore, do not attempt to interpret the contour
aspects of Manual ECGs at this setting. If contour
analysis is important in Manual mode, use the 0.05 Hz
Manual frequency response setting which minimizes the
ST segment distortion. Regardless of the low frequency
setting in Manual mo de, the rhythm characteristics of
the ECG are accurately recorded.
Understanding Simultaneous 12-Lead Acquisition 3-9
Page 30
Artifact Filter
The Artifact lter removes skeletal muscle artifact. This
source of noise is the most dicult to eliminate because
it has the same frequencies as the ECG signals. The
Artifact lter, while eliminating skeletal muscle artifact,
also removes low amplitude, high frequency components
from the ECG.
Specically, the lter removes up to 50V of signals
in the frequency range from 5 Hz to 150 Hz which can
aect P waves as well as the entire QRS-T complex. Use
the Artifact lter only as a last resort for ECGs which
would otherwise b e unreadable due to signican
t levels
of muscle artifact. The Artifact lter only aects ECG
data on the printed ECG report and not ECG data that
is analyzed.
Monitoring ECG
Quality
The letter \F" in the far left position in the lter bo
x
indicates that the Artifact Filter was applied to this
ECG.
The HP interpretive cardiograph monitors ECG trace
quality throughout the lead attachment, ECG acquisition
and analysis process to ensure that you receive the
highest possible quality ECG trace. There are four
possible ways that trace quality problems are indicated,
depending on howyour cardiograph is equipped:
on the patient mo dule display during electro de
attachment
on the preview screen before recording the ECG
on the keyboard display during analysis
in the analysis statements on the printed report
3-10 Understanding Simultaneous 12-Lead Acquisition
Page 31

In most cases, the operator can use these cardiograph
features to eliminate noise quality problems by
modifying lead placement or improving patient
preparation.
While attaching lead wires to the patient, the operator
receives constant feedback ab out leads with po or contact
and noisy lead wires on the patient module display
and/or on the preview screen. Electrodes that are o are
denoted by an \X" on the patient mo dule display,or
a straight line on the preview screen. On the patient
module, noisy lead wires are indicated with a series of
bars; the taller the bars, the noisier the signal. On
the preview screen, noisy lead wires are indicated b
poor ECG signals. With this immediate feedbac
y
k, the
operator can correct problems b efore the ECG trace is
acquired, analyzed and printed. This saves the operator
time and paper.
The real-time ECG traces in all leads can be view
the preview screen before analysis and prin
ting. Three
ed on
leads are displayed at one time and the op erator can
scroll through all congured leads in groups of three to
check the quality of the actual ECG tracings visually
.
When an Auto ECG is requested, the preview screen will
display the Auto 3x4 ECG tracing that will be analyzed
and printed. The op erator can press the
4
Stop
5
key and
correct visible noise problems.
The HP interpretive cardiograph attempts to preacquire
ECG data by immediately using the data from the most
recent ten seconds if there is good electrode contact for
all leads. Preacquisition saves operator time if go od
ECG signals are available prior to requesting the Auto
ECG.
Understanding Simultaneous 12-Lead Acquisition 3-11
Page 32

During analysis, the cardiograph further checks to
determine if the trace quality is adequate for go od ECG
measurements. The ECG is analyzed for muscle artifact,
AC noise, baseline wander, and leads-o. Any noise
problems not corrected by the operator are detailed in
the interpretive statements on the ECG analysis report.
If the noise conditions are sucient to prevent ECG
analysis, the ECG will be printed without analysis. The
operator must then correct the noise problem and retake
the ECG.
On some PageWriter models, the qualitycheck presents
an advisory message on the display. If the data is
acceptable on all 12 leads, the message is
ECG ok
.
Otherwise, the types of noise and the leads or lead
groups in which the noise o ccurs are indicated. If the
noise is severe enough that analysis results could be
impaired, then
Retry
is displayed at the end of the
advisory message. At this point the op erator can press
4
5
and correct the noise problem before retaking the
Stop
ECG.
The qualit y checks available on the HP interpretive
cardiograph aid the operator in eliminating noise
problems encountered throughout the pro cess of taking
an ECG. They allow the op erator to correct noise
problems by mo difying ECG technique before the ECG
is printed. The operator can use these features to ensure
that a high quality ECG is recorded.
3-12 Understanding Simultaneous 12-Lead Acquisition
Page 33

The HP ECG Analysis Program
The HP ECG Analysis Program produces precise,
accurate and consistent ECG measurements. The
program further provides interpretive statements that
highlight key areas of concern for your review. However,
this tool is more helpful if you understand how and
whyitworks and howyou can b est use its capabilities.
Figure 4-1 shows this process. (Note that Operator
Feedback and Extended Measurements report are not
available on some PageWriter models.)
ECG &
Patient
Data
HP ECG Analysis Program
4
Feedback
To
Operator
Quality
Monitor
Measurements
Figure 4-1. The HP ECG Analysis Process.
Criteria
Extended
Measurement
Matrix
The HP ECG Analysis Program 4-1
Interpretive
Report
Overreader
Page 34

Understanding the
HP ECG Analysis
Program
The analysis process begins with the simultaneous
acquisition of the ECG's 12 conventional leads. It
then pro ceeds through four steps before producing the
interpreted ECG report. These steps are:
1.
Quality Monitor
{ examines the technical qualityof
each ECG lead.
2.
Pattern Recognition
{ locates and identies the
various waveform components.
3.
Measurement
{ measures each comp onent of the
waveform and performs basic rhythm analysis,
producing a comprehensive set of measurements.
4.
Interpretation
{ uses the extended measurements,
with information about the patient such as age and
sex, to select those interpretive statements from the
criteria program which summarize the ndings for the
ECG.
Hewlett-Packard provides two standard criteria
programs, adult and pediatric, for your HP interpretive
cardiograph. Future updates to these programs or
entirely new programs can b e installed easily in y
our
cardiograph, if is equipped with a exible disk.
Patient information, including age, sex, height, weight,
medications (Rx co des) and previous diagnoses (Dx
codes), are used by the criteria programs in selecting the
interpretive statements. (Rx codes and Dx codes may
not be available on some PageWriter models.)
4-2 The HP ECG Analysis Program
Page 35

How the HP
Interpretive
Cardiograph
Measures ECGs
The HP interpretive cardiograph calculates
measurements for all the waveforms that you see on the
Auto 3x4 report. Every beat in every lead is measured
individually, allowing the natural variations among
beats to contribute to the representative measurements.
This is in contrast to other measurement methods in
which a representative b eat is constructed and then
measurements are made only for the constructed beat.
In the HP interpretive cardiograph, representative
group, lead and global measurements are calculated from
combinations of the comprehensive set of measurements
for each b eat. The ECG criteria program can use an
combination of these three types of measurements, which
enhances the exibility and p ower of its interpretive
capabilities.
y
Figure 4-2. ECG Morphology Measurements.
The HP ECG Analysis Program 4-3
Page 36

Waveform
Recognition
The rst step of the measurement program involves
waveform recognition and beat detection. A boundary
indicator waveform in which QRS complexes and
pacemaker spikes are enhanced is derived from all
leads over the ten-second analysis perio d. After the
approximate QRS complex and pacemaker spike
locations are known, another boundary indicator
waveform that enhances P and T wave detection is
derived. Approximate P wave, QRS complex and T wave
regions are then determined for each beat in the ECG.
Comprehensive
Measurements
Group Measurements
After the approximate waveform lo cations are known,
they are further rened to determine precise onsets
and osets for eachwaveform. Once onsets and osets
are known, amplitude, duration, area and shape are
calculated for every P wave, QRS complex, T wave and
ST segmentinevery lead that you see on the Auto 3x4
report. Waveform irregularities such as notches, slurs,
delta waves and pacemaker spikes are also noted for
every beat. A table of all these measurements is created,
from which the representative measurements are
calculated.
After all the beats have b een measured, each beat in the
ECG is classied into one of verhythm groups based on
rate and morphology parameters. Each group consists
of beats with similar R-R intervals, durations, and
shapes, except that all paced beats are grouped together,
regardless of other parameters. Group 1 represents
the type of beat that is most normal or predominan
t
and groups 2 through 5 represent other beat types.
The group into which each b eat is classied is noted
under the heading \Rhythm Grouping of Beats" on the
Extended Measurements report. Group measurements
4-4 The HP ECG Analysis Program
Page 37

are calculated byaveraging the measurements for all
the beats in each of the groups and are reported in the
Rhythm Analysis section of the Extended Measurements
report.
Lead Measurements
Atrial Rhythm
Analysis
Representative measurements for each of the 12 leads are
calculated from the comprehensive set of measurements
for all the beats in the ECG. Only the beats of the
predominant group (Group 1) are used. If a particular
lead (as shown on the Auto 3x4 report) do es not have
any Group 1 b eats, a beat group with similar parameters
is used, if possible. The measurement program tries
to select a beat group for whic
h the beats are not
paced. Only if all beats in the ECG are paced will the
measurements b e for paced beats. If there are paced and
non-paced beats in an ECG, only the non-paced b eats
will be measured, whichmay result in leads for whichno
measurements are rep orted.
In each lead, the measurements for all the beats
belonging to the selected beat group are a
veraged. The
lead measurements are representative of the dominant
waveform present in each lead and are reported in
the Morphology Analysis section of the Extended
Measurements rep ort.
Atrial rhythm is determined by examining leads V1,
aVF, II and II I in succession until the program can
report conclusively that there are multiple P waves, that
there are no P waves, or that there is one P waveper
QRS complex. If a conclusive result is achieved, then the
last lead analyzed will be used to calculate group and
global atrial rhythm parameters. If no conclusive result
is achieved, no atrial rhythm parameters are calculated.
The HP ECG Analysis Program 4-5
Page 38

Global Measurements
The global measurements for the ECG, including
the frontal and horizontal plane axis measurements,
are reported to the right of the lead measurements
in the Morphology Analysis section of the Extended
Measurements report.
These interval, duration, and segment measurements
are weighted averages of the lead measurements. The
global rate reported is the mean ventricular rate over the
entire ECG unless the ECG criteria program determines
that one of the group mean ventricular rates is more
representative of the underlying rh
ythm.
Axis Measurements
Although it is most convenient to use waveform
amplitudes when making axis measurements manually,
using the areas of the waveforms yields more accurate
results. The HP interpretive cardiograph uses the
waveform areas from the lead measurements in
calculating the P, QRS and T axes, while the sum of
the ST onset, middle and end amplitudes is used in
calculating the ST axis. For the frontal plane axis
measurements, which use the limb leads, nine lead pairs,
all at least 60 degrees apart, are used to estimate the
axes. The resulting estimates are examined to ensure
that they converge to a single result. If so, they are
averaged to form the representative axis measurement.
The horizontal plane axis measurements, which use leads
V1{V6, are calculated similarly from seven lead pairs.
The representative measurements are rep orted on the
Extended Measurements report. A printed example
and a brief explanation of this rep ort are in Chapter
7,
Reading the Printed Rep ort
Extended Measurements Rep ort
. App endix C,
The
explains each of the
measurements on the report in more detail.
4-6 The HP ECG Analysis Program
Page 39

The ECG Criteria
Language (ECL)
The ECG Criteria Language (ECL) is a
medically-oriented computer language developed
specically by Hewlett-Packard for the denition of
electrocardiographic criteria. First introduced in 1978,
the HP ECG Analysis Program, using ECL, was one of
the rst commercially-available expert systems.
The primary ob jective of ECL is to allow criteria
denition byphysicians with little or no knowledge
of computer programming. Basically, it provides a
way through which ECG criteria may be expressed in
a form that both a cardiologist and a computer can
read. Consistently-used terminology was chosen to
describe ECG criteria for the foundation of ECL. This
terminology was chosen from a broad base of users as
well as electro cardiography texts.
Categories
Sentences
At the highest level, criteria expressed in ECL are
broken into medically signicant categories that are like
the chapters of an electro cardiography textb ook.
Within each category is a series of sentences in which
the criteria are expressed. These sentences allow the
program to PRINT an interpretive statement when
the criteria are met, to SUPPRESS a statementin
the presence of a higher-priority statement, to GOTO
another point in the program, or to perform calculations
and assign (SET) the result to a variable for use later in
the program. The PRINT sentence has this form:
PRINT<interpretive statement>IF<medical criteria>;
The HP ECG Analysis Program 4-7
Page 40

For example, the following statement causes an inferior
infarct statement to b e printed on the report if the
criteria are met:
PRINT #IMI10 BO
\Consider inferior infarct"
. \Small Q waves in II, III, aVF"
IF (Q:DURATION . . . ;
where IMI10 is the statement code corresponding to
the statement enclosed in quotation marks and BO
stands for a severity of borderline signicance for this
statement. In this example the interpretive statement
is \Consider inferior infarct". The reason statement,
\Small Q waves in I I, II I, aVF", summarizes the detailed
criteria which follow the IF.
Interpretive statements on the rep ort are preceded by
3
either a \.", as shown in this example, or a \$" or a \
".
Statements preceded by a \$" or a \3" call attention
to certain technical aspects of the ECG which are of
interest to the overreader, but not essential for the nal
report. These statements are automatically suppressed
by the HP 5600C ECG Management system after the
ECG rep ort has been conrmed.
A cardiologist reading an ECG can immediately
discount many classes of interpretation. However,
the computer-based program must check them all
sequentially. Within a category, the criteria for
interpretive statements become more and more
restrictive from beginning to end. Consequently, criteria
met for any given ECL statement in a category
4-8 The HP ECG Analysis Program
Page 41

automatically suppress any previous statements (in that
category) that had been selected for printing. Thus, each
category can only be represented on the nal report
by one statement at most. This statement is the last
one encountered whose medical criteria were true based
on the measurements, earlier decisions, and patientID
information.
Overall Severity
Further
Information
Each statement selected for the interpretive rep ort has
an associated severity. The severities of all selected
statements are considered by a set of rules in the criteria
program to determine the ECG's overall severity. This
severity is printed on each page of the interpretive
report.
The HP 5600C ECG Management System supports
the complete developmentenvironment for ECL
programs. ECL programs modied or developed on
the ECG Management System can be used with the
HP interpretive cardiograph. For further information
about the ECL programming language, please refer
to the
Programmer's Reference Manual
Model 5600C ECG Criteria Language (ECL)
.
The HP ECG Analysis Program 4-9
Page 42

Page 43

The HP Adult ECG Criteria Program
Development of the Hewlett-Packard Adult ECG
Criteria Program began in 1971 as a combined eort
between Hewlett-Packard and a worldwide panel of
cardiologists. The program is written in the ECG
Criteria Language (ECL), whichwas created by
Hewlett-Packard to follow the logical pro cess used by
skilled physicians to analyze ECGs. The design of the
program and a complete developmentenvironment
allow it to b e modied easily on the HP 5600C ECG
Management System.
The adult ECG program was rst intro duced into the
clinical environment in 1978 as part of the HP 5600C
ECG Management System. It has evolved through the
years into the sophisticated program available today.
The program has also been available as part of the
Hewlett-Packard PageWriter intelligent cardiograph
family since 1983. Now in its eighth release, the
Hewlett-Packard adult ECG program has been used
worldwide to analyze an estimated 16 million ECGs
annually.
5
The HP Adult ECG Criteria Program 5-1
Page 44

Understanding the
HP Adult ECG
Criteria Program
This chapter contains brief descriptions of the
ma jor categories of interpretive statements in the
Hewlett-Packard adult ECG program. Reviewing these
descriptions will help you understand the program's
breadth of scope and depth of analysis in various areas
of ECG interpretation. You will then be b etter able to
use Hewlett-Packard's computer-assisted ECG analysis
eectively in your daily ECG overreading activities.
The criteria used to select the interpretive statements
in this program use the full range of measurements in
the measurement matrix. These include durations,
amplitudes, areas, and other parameters described in
Appendix C,
The Extended Measurements Rep ort
.
For clarity and conciseness, the following summaries
are not comprehensive. Rather, when describing the
criteria logic where the signicantvalues vary, only
one measurementvalue is mentioned and it is labeled
\(typical)". The typical value is the one that is most
generally applied in the logic. You will then be better
able to use Hewlett-Packard's computer-assisted ECG
analysis eectively in your daily ECG overreading
activities.
In the criteria logic there are many situations in which
an interpretive statement that is otherwise qualied to
be printed, is suppressed by more signicant conditions
that override the initial statement. For example, left
bundle branch blo ck will prevent the printing of many
statements including all of those relating to ventricular
hypertrophy, most infarcts, T wave abnormalities, ST
deviations, etc. These suppressive conditions generally
are not addressed in the categories discussed in this
chapter.
5-2 The HP Adult ECG Criteria Program
Page 45

The following categories, representing clinically
relevant statements and some technical statements and
disclaimers, are described in the following sections.
Pediatric Age Disclaimer
Calibration Notice if not Standard
Technical Quality Statements
Electronic Pacemaker
Basic Cardiac Rhythm
Premature Beats (Short R-R)
Pauses (Long R-R Interval)
Miscellaneous Arrhythmias
AV Conduction (PR Interval)
QRS Axis
Ventricular Conduction Delays
RightAtrial Enlargement
RightVentricular Hypertrophy
Left Atrial Enlargement
Left Ventricular Hypertrophy
Chronic Pulmonary Disease
Inferior Infarct
Posterior Infarct
Lateral Infarct
Anterior Septal and Anterior Infarct
Anterolateral and External Anterior MI
Apical Infarct
Tall T Waves
Drug and Electrolyte Eects
TWave Abnormalities
Ischemia
ST Segment Depression
Subendocardial Injury
Combined ST and T Abnormalities
Injury and Ischemia
ST Segment Elevation
Severity
The HP Adult ECG Criteria Program 5-3
Page 46

Pediatric Age
Disclaimer
The Hewlett-Packard Adult ECG criteria program
is intended for use on ECGs of adults. The
Hewlett-Packard Pediatric ECG criteria are selected for
use on ECGs of patients under 16 years old. If adult
criteria are selected and if the patient is less than 16
years old, a statement is printed to remind you that no
attempt will be made to interpret signs of infarction or
ST{T abnormalities.
On the cardiograph, the patient's age can be entered in
units of hours, days, weeks, months, or years. It also
maybe entered as the year of birth, in whic
h case an age
in years will be calculated by the cardiograph.
Calibration Notice if
Not Standard
Calibration Nominal
Half standard 5 mm/mV 4.75{5.25 mm/mV 5%
Standard 10 mm/mV 9.5{10.5 mm/mV 5%
Double standard 20 mm/mV 19.0{21.0 mm/mV 5%
If the age is entered improp erly or not at all, the patien
is assumed to be more than 35 y
ears old.
This category checks the calibration pulse in each
channel of the ECG. Except for the case where both
the limb leads and the precordial leads are at standard
calibration (10 mm/mV), a statement describing the
calibration for the ECG is included in the report.
Table 5-1. Calibration
Value
Allowed
Range
6
%
t
5-4 The HP Adult ECG Criteria Program
Page 47

Technical Quality
Statements
This category contains non-clinical statements which
are intended to identify ECGs with technical problems
and prevent them from being interpreted by the medical
criteria.
Electronic Pacemaker
Basic Cardiac Rhythm
This category relies on the ECG measurements to detect
paced ECGs. For ECGs which are predominantly-paced
there is no further consideration of medical criteria.
For demand-paced ECGs in which there are enough
non-paced beats, no further rhythm analysis is
attempted. However, the non-paced beat measurements
are used in the remaining categories to c
heck for other
abnormalities in the ECG.
One statement describing the basic cardiac rhythm is
selected from this category based on the morphology and
rhythm measurements made from the ECG.
Interpretive statements regarding the basic cardiac
rhythm are generated based on the interrelationships of
the various measurements and determinations. These
statements include those related to:
Tachycardia, bradycardia, and varying rate
Sinus, atrial, supraventricular, junctional and
ventricular rhythms
Second and third degree AV block (rst degree blockis
addressed in the AV Conduction category)
AV disso ciation
Atrial brillation
Atrial utter
Bigeminy and Trigeminy patterns
The HP Adult ECG Criteria Program 5-5
Page 48

A normal P axis measurement(030 to 120 degrees
in the frontal plane) is assumed to indicate a
sinus-originated P wave while an abnormal P axis
signies an atrial or a junctional origin.
Tachycardia is generally dened as a rate of 100 b eats
per minute (bpm) or higher; bradycardia as slower than
50 bpm. For a more denitive discussion of tachycardia
and bradycardia see the recommendations of the
\Task Force on Standardization of Terminology and
Interpretation" as published in the
Cardiology
, January 1978.
American Journal of
Premature Beats
(Short R-R)
Pauses (Long R-R)
Interpretive statements in this category relate to
premature beats. These are recognized when the
preceding R-R interval is shorter than the average R-R
interval of a background ventricular rate that is basically
regular. A 15% (typical) or greater reduction in R-R
interval is considered signicant.
Premature b eats with normal QRS duration (QRSD) are
considered to be atrial or junctional in origin depending
on the presence or absence of a P w
ave. Those with
longer than normal QRSD are considered to be either
ventricular in origin or to be aberrant supraventricular in
origin.
Long R-R intervals are signicant if they are more than
140% (typical) of the average R-R in a background
ventricular rate that is basically regular. They are
considered to indicate either a sinus arrest or an
intermittentAV block. Interpretive statements in this
category indicate either escape b eats or t
ypes of second
degree AV blo ck.
5-6 The HP Adult ECG Criteria Program
Page 49

The presence or absence of a P waveaswell as the
duration of the QRS indicates the origin of an escape
beat. Atrial and supraventricular escapes will showaP
wave and a normal QRSD. Junctional escape will show
no P wave, but a normal QRSD. A prolonged QRSD
indicates a ventricular origin of the escap e beat.
Dierent second degree AV blo cks are indicated on
the basis of more P waves than QRS complexes. A
statement indicating Mobitz I (Wenckebach) second
degree AV blo ck depends on progressively longer PR
intervals preceding the long R-R interval.
Miscellaneous
Arrhythmias
This category provides interpretive statements related to
arrhythmias that are not covered in the preceding Basic
Cardiac Rhythm, Premature Beats, or Pauses categories.
Statements relating to interpolated b eats depend on the
measurement program recognizing that such beats are
present. It recognizes the beats if there are consecutiv
R-R intervals that are approximately one half the
average R-R of a background ventricular rate that is
basically regular.
Aberrant complexes are recognized when the R-R
interval is only slightly decreased but the QRSD is
prolonged, as if it were of ventricular origin.
e
The HP Adult ECG Criteria Program 5-7
Page 50

AV Conduction (PR
Interval)
All statements in this category are based on the
measurement of a prolonged PR interval, with the
exception of one statement which identies ECGs with
accelerated AV conduction.
The PR interval varies slightly according to age and
heart rate. The following table denes the limits:
Table 5-2.
Borderline and Abnormally Prolonged PR
Intervals (ms)
Age
(years)
0{15 200{210 190{200 185{195 180{190
16{60 210{220 200{210 195{205 190{200
over 60 220{230 210{220 205{215 200{210
Left Value = PR Interval Upper Limit (Borderline)
RightValue = PR Interval Upper Limit (1st degree AV
Block)
1{50 51{90 91{120 over 120
Heart Rate (bpm)
5-8 The HP Adult ECG Criteria Program
Page 51

QRS Axis
The mean electrical vector (mean QRS axis) is
calculated in the frontal and horizontal planes. The
normal frontal axis range varies with age and body
build. The frontal QRS axis in young persons will
tend to the right. The frontal QRS axis in old persons
will tend to the left. In addition, the QRS axis in
thin persons will tend to b e more to the right than in
heavy persons. A frontal QRS axis between030 and
+90 degrees is considered normal, generally sub ject
to modication by age and build. Frontal QRS axis
measurements counterclockwise from030 will be
considered to be deviated to the left and those cloc
from +90 will be considered to be deviated to the righ
Interpretive statements based on frontal QRS axis
measurements are made describing left and right
deviation as well as sup erior, horizontal, and vertical
directions.
Statements involving p osterior axis, arm lead reversal
and dextrocardia are based on the horizontal plane axis
measurements as well as the frontal plane measurements.
These statements are skipp ed if the ECG is paced, if the
patientisinaventricular rhythm or if the mean QRS
axis is well within the normal range (30 to 80 degrees,
clockwise, in the frontal plane).
kwise
t.
The HP Adult ECG Criteria Program 5-9
Page 52

Ventricular
Conduction Delays
A QRS duration (QRSD) greater than 100 ms is
common to all of the interpretations in this category
except for isolated Left Anterior Fascicular Block
(LAFB) and Left Posterior Fascicular Blo ck (LPFB)
which are present in the absence of a prolonged QRS.
Otherwise, any denitive blockinterpretation requires
that the QRSD exceed 120 ms. A QRSD between 110
and 120 ms is considered incomplete blo ck and between
100 and 110 ms is considered marginal intraventricular
conduction delay.
LAFB interpretations are asso ciated with left
ward
deviation of the mean frontal QRS axis b etween040 and
240 (typical) degrees counterclockwise.
interpretations are asso ciated with rightward deviation
of the mean frontal QRS axis b etween 120 and 210
(typical) degrees clo ckwise.
RBBB interpretations are always associated with the
terminal portion of the QRS being directed to the righ
t,
i.e. dominant negative (Q, S) forces in I, aVL, and V6
and p ositive forces in V1.
LBBB interpretations are always associated with the
terminal portion of the QRS being directed to the left,
i.e. dominant positive (R, R
0
) forces in I, aVL and V6
and negative forces (Q, S) in V1.
LAFB and LPFB may b e recognized in combination
with RBBB.
The Wol-Parkinson-White conduction abnormalityis
also recognized in this category based on the occurrence
of delta waves in multiple leads and a QRS duration
more than 100 ms. A short PR (PR segment<55 ms or
PR interval<120 ms) reduces the required number of
leads with delta waves required to detect this condition.
5-10 The HP Adult ECG Criteria Program
Page 53

Right Atrial
Enlargement
Large P waves are considered suggestive of RAE. The
minimum voltage considered signicant is 0.24 mV
(typical). P wave duration and amplitude are examined
in all leads.
Larger P waves lead to more severe interpretive
statements regarding the likeliho od of RAE.
Right Ventricular
Hypertrophy
Rightventricular hypertrophy statements are made on
the basis of the presence of several ndings:
The presence of a prominen
t R or R
0
in lead V1
The presence of a prominent negative voltage in either
of leads I or V6
Right atrial enlargement
Right axis deviation in the frontal plane
ST{T changes characteristic of RVH
The statements to b e printed regarding RVH are
determined by the combinations of the above ndings.
Stronger statements result when multiple ndings are
present.
Prominent R or R0in V1
An R that is more than 75% the size of the Q or S is
signicant. An R0larger than 20 ms and 0.30 mV is
signicant. A QRS with a positive comp onent larger
than the negative comp onent (i.e., a p ositive QRS area )
is highly signicant.
The HP Adult ECG Criteria Program 5-11
Page 54

Prominent Q or S in I or V6
AQ,S,orS0larger than 40 ms and 0.20 mV is
signicant. A QRS with a negative component larger
than the positive component (i.e., a negative QRS area)
is highly signicant.
Right Atrial Enlargement
This nding is determined by the presence of RAE from
the RightAtrial Enlargement category.
Right Axis Deviation in the Frontal Plane
This nding is determined by a frontal QRS axis
between 111 and 269 degrees (clo ckwise).
ST{T Changes Characteristic of RVH
This nding is determined by an examination of leads
II, aVF, V1, V2, and V3 for the presence of negative
ST and T values typical of the rightventricular strain
pattern.
Left Atrial
Enlargement
All leads are examined for the duration and the
amplitude of both the initial and terminal portions of
a biphasic P wave. Durations over 110 ms combined
with amplitudes over 0.10 mV are considered signicant
though not necessarily abnormal unless they are present
in multiple leads. A notched P wave adds to the
signicance of the other values.
Lead V1 is specically examined for duration, amplitude
and area of the negative component of the T wave.
Though durations of over 30 ms and amplitudes over
0.09 mV can be considered signicant, the area of this
negative componentmust be greater than 0.60 Ashman
5-12 The HP Adult ECG Criteria Program
Page 55

units to be considered LAE. An Ashman unit is the area
of 1 square millimeter at normal speed (25 mm/sec) and
normal sensitivity (10 mm/mV). An Ashman unit equals
40 ms x 0.1 mV.
Left Ventricular
Hypertrophy
Left Ventricular Hypertrophy statements are made on
the basis of a point score derived from several ndings:
High voltage in QRS components
Left axis deviation in the frontal plane
Left atrial enlargement
ST{T changes characteristic of LVH
Prolonged QRS duration or ventricular activation time
(VAT)
Higher point scores result in more severe statements
regarding the likelihood of LVH.
High Voltage in QRS Components
Voltage values for the QRS comp onents that are
considered excessively high vary with the leads involved
and whether the deection is positive or negative. In
frontal leads the minimum value that is considered
excessive is a p ositive deection of more than 1.20 mV in
lead aVL.
Precordial leads V1 and V2 are examined for negative
deections (Q or S) and V5 and V6 are examined
for positive deections (R or R0). These values are
considered individually and anyvalue greater than
2.50 mV is considered signicant. In addition, the
negative values in V1, V2 and the positive v
alues in V5,
V6 are added together. Any total for Q or S in V1 plus
RorR0in V5 or V6 that exceeds 3.50 mV is signicant.
A total of Q or S in V2 plus R or R0in V5 or V6 must
exceed 4.0 mV to be signicant.
The HP Adult ECG Criteria Program 5-13
Page 56

Higher voltages will result in more points for qualifying
statements regarding LVH.
Because higher voltages are normal for young persons,
age is given consideration in the recognition of LVH.
The younger the patient, the more stringent are the
requirements for an LVH statement.
Left Axis Deviation in the Frontal Plane
This nding is determined by a frontal QRS axis
between031 and090 in the absence of any statement
indicating either anterior fascicular blo ck or inferior
infarct.
Left Atrial Enlargement
This nding is determined by a statement from the Left
Atrial Enlargement category indicating the presence of
LAE. This feature is ignored in the presence of mitral
valvular disease, atrial utter, or atrial brillation.
ST{T Changes Characteristic of LVH
This nding is determined by an examination of leads
I, aVL, V4, V5, and V6 for the presence of negative
ST and T values typical of the left ventricular strain
pattern.
A Prolonged QRS Duration or Ventricular Activation Time
This nding is determined by a QRS duration of 95 to
120 ms, and a VAT longer than 55 ms. It is ignored if
any bundle branch block statement has b een made.
The statements to b e printed regarding LVH are
determined by the combinations of the above ndings
that are present.
5-14 The HP Adult ECG Criteria Program
Page 57

Chronic Pulmonary
Disease
All frontal leads are examined for QRS peak-to-peak
voltage. If no lead has a value exceeding 0.60 mV the
ECG is considered borderline lowvoltage. If no value
exceeds 0.50 mV the ECG is considered denite low
voltage, an abnormal nding.
All precordial leads are examined for QRS peak-to-p eak
voltage. If no lead has a value exceeding 1.00 mV the
ECG is considered denite lowvoltage, an abnormal
nding.
Combinations of lowvoltage statements, and the
presence of rightward deviation of the frontal P and
QRS axes and right atrial enlargement, may lead
to statements suggesting the likeliho od of c
hronic
pulmonary disease.
Inferior Infarct
Leads II, II I. and aVF are examined for Q w
ave presence
and size (amp x dur), the relative amplitudes of the Q
and R, the presence of T wavechanges (attened or
inverted), and the presence of an elevated or depressed
ST segment.
As the Q waves become larger and/or show in more
leads, and the R waves become less prominent the
interpretive statements b ecome stronger.
For inferior Q waves to be considered signicant, at
least one of them must be longer than 25 ms in duration
and more than 1/6 the amplitude of the asso ciated R.
For any infarct statement to qualify, at least one Q
wavemust b e longer than 35 ms and more than 1/5 the
amplitude of the R wave.
The HP Adult ECG Criteria Program 5-15
Page 58

A leftward direction of the axis of the initial portion
of the QRS adds to the likelihoo d of an inferior infarct
statement.
Twave and ST changes are used to estimate the age of
the infarct. Increased T waveinversion and larger ST
segment deviations will generate statements indicating
more recent infarction.
Sex and age inuence the detection of inferior infarct in
that b eing male and/or young makes normal Q waves
more likely in the inferior leads.
Posterior Infarct
Leads V1 and V2 are examined for the relative and
absolute sizes of the R and S waves, an absentor
insignicantQwave (less than 10 ms and 0.05 mV), and
a positiveTwave. A prominentR(typical is three times
the size of the S), in the presence of an insignican
tQ
(typical is<10 ms,<0.05 mV), and an uprightT,
might generate a statement suggesting the likelihoo d
of a p osterior infarct (PMI). There are no statemen
denitely indicating the presence of a PMI. In ev
ts
aluating
the signicance of the R wave, the duration is given
more emphasis than the amplitude.
Indications of LVH or RVH will decrease the likelihoo d
of a PMI statement.
Sex and age inuence the detection of a p osterior infarct
in that being male and/or young makes prominentR
waves more likely in V1 and V2.
5-16 The HP Adult ECG Criteria Program
Page 59

Lateral Infarct
Leads I, aVL, V5 and V6 are examined for Q wave
presence and size (amp x dur), the relative amplitudes
of the Q and R, the presence of T wavechanges
(attened or inverted), and the presence of an elevated
or depressed ST segment.
For lateral Q waves to be considered signicant there
must b e at least one that is longer than 35 ms and more
than 0.10 mV in amplitude. In addition it must havean
amplitude that is at least 20% as large as that of the R
wave.
As the Q waves become larger and/or show in more
leads, and the R waves become less prominent, the
interpretive statements b ecome stronger.
Twave and ST changes are used to estimate the age of
the infarct. Increased T waveinversion and larger ST
segment deviations will generate statements indicating
more recent infarction.
Sex and age inuence the detection of lateral infarct in
that being male or young or both makes normal Q waves
more likely in the lateral leads.
Anteroseptal and
Anterior Infarct
Leads V1, V2, V3, and V4 are examined for Q w
ave
presence and area, the relative and absolute sizes of
the R and S, whether the QRS area is negative or
positive, the presence of T wavechanges (attened or
inverted), and the presence of an elevated or depressed
ST segment.
For anyanteroseptal or anterior Q wave to b e considered
signicant, it must be longer than 30 ms (typical) in
duration and over 0.07 mV in amplitude.
Positive ndings that o ccur in V1 and V2 will tend to
be reported as anteroseptal statements while those that
occur in V3 and V4 will tend to be rep orted as anterior
statements.
The HP Adult ECG Criteria Program 5-17
Page 60

As the Q waves become larger and/or show in more
leads, and the QRS progression from negative to
positive becomes more shifted laterally, the interpretive
statements become stronger for infarction in the anterior
region.
Twave and ST changes are used to estimate the age of
the infarct. Increased T waveinversion and larger ST
segment deviations will generate statements indicating
more recent infarction.
Anterolateral and
Extensive Anterior
Infarct
Leads V3, V4, V5, and V6 are examined for Q w
ave
presence and size (amp x dur), the relative and absolute
sizes of the R and S, whether the QRS area in V3 is
negative or p ositive, the presence of T w
avechanges
(attened or inverted), and the presence of an elevated
or depressed ST segment.
For anyanterolateral Q wave to be considered signicant
it must be longer than 30 ms (typical) in duration and
over 0.07 mV in amplitude.
As the Q waves become larger and/or show in more
leads, the interpretive statements b ecome stronger for
infarction.
Positive ndings in all six precordial leads will lead
to statements describing extensiveanterior infarct
conditions.
Sex and age inuence the detection of anterolateral
infarct in that being male and/or young makes normal Q
waves more likely in the anterolateral leads.
Twave and ST changes are used to estimate the age of
the infarct. Increased T waveinversion and larger ST
segment deviations will generate statements indicating
more recent infarction.
5-18 The HP Adult ECG Criteria Program
Page 61

Apical Infarct
Only one statement is contained in this category and it
indicates an apical infarct in the presence of signicant
Qwaves (>25 ms,>0.10 mV) in four of these ve
leads: I I, aVF, V4, V5, and V6.
Tall T Waves
Drug and Electrolyte
Effects
All leads are examined for the presence of positiv e T
waves with amplitudes that exceed 1.20 mV, or for
positive T waves that exceed 0.50 mV and are also more
than half the size of the peak-to-peak QRS voltage. The
presence of suchTwaves can lead to statements calling
attention to the p ossibility of metab olic, electrolyte or
ischemic abnormalities.
Measurements of QT interval as corrected for heart
rate, and measurements associated with ST segment
depression and T wavechanges are examined for values
characteristic of the eects of quinidine, procainamide,
digitalis and abnormal calcium and potassium levels.
Interpretive statements are made calling attention to the
possible correlation b etween the ndings and clinical
conditions.
The presence of an Rx code indicating use of quinidine,
procainamide or digitalis will favor interpretive
statements calling attention to the ndings compatible
with the eects of those drugs.
TWave Abnormalities
All leads are examined for T wave amplitude, the
relative amplitude of the T and the QRS, and whether
the T is negative or p ositive. The fron
tal axis of the
Twave and its relation to the frontal QRS axis is also
measured.
The HP Adult ECG Criteria Program 5-19
Page 62

Reduced T wave amplitude, both absolute and relative
to the QRS, as well as negative T waves, are considered
to b e abnormal ndings. Minimal changes in one or a
few leads will lead to less severe statements. As the
changes become more prominent in magnitude and the
number of aected leads increase, the statements become
more severe.
A frontal T axis that is not b etween010 and 100
degrees or a QRS-T angle greater than 90 degrees may
result in a statement indicating nonspecic T wave
abnormalities.
ECGs of persons younger than 16 years are excluded
from the least severe statements because suchTwave
ndings can be considered normal.
Whenever possible the location of T w
will be indicated as part of the in
ave abnormalities
terpretive statements.
Though not rigidly dened, the localization will generally
t the following:
Table 5-3. T Wave Abnormality Localization
Location I II II I aVR aVL aVF V1 V2 V3 V4 V5 V6
Anterior X X X
Anterolateral X X X X X X X
Lateral X X X X
Inferior X X X
A concurrent statement regarding RVH, LVH, LBBB,
RBBB, any infarct, or any statement associated with
drug therapy or electrolyte imbalance will impact this
category by tending to suppress T wave statements. This
is more true for the less severe T wave statements than
for the more severe T wave statements.
5-20 The HP Adult ECG Criteria Program
Page 63

Ischemia
This category contains statements calling attention to
the likelihood of ischemia. None of these statements
involveany new examination of measurements. All
ischemia statements in this category are determined
by the qualication of a statement or combination
of statements in the preceding category,TWave
Abnormalities. The degree of likelihood of ischemia
is based on the severity of the qualifying T wave
statements.
ST Segment
Depression
All leads are examined for negative values in the ST
segment. The values examined include the following
points in the ST segment:
The onset of the ST segment (the J point)
The p oint midwaybetween the onset and the end of
the ST segment
80 ms past the J point
The end of the ST segment (the beginning of the T
wave)
Besides negative values in the ST segment, other features
are examined:
The slop e of the ST segment in degrees
The shap e of the ST segment (straight, concaveupor
concavedown)
The smallest negative ST deection considered
signicant is 0.03 mV.
The HP Adult ECG Criteria Program 5-21
Page 64

As the negativity of the ST segment increases, more
severe statements are generated. Minor depression of
the segment pro duces statements with a severitycode
of Otherwise Normal. Increasing depression pro duces
statements progressing through Borderline to Abnormal.
Whenever possible the location of ST abnormalities
will be indicated as part of the interpretive statements.
Though not rigidly dened, the localization will generally
t the following:
Table 5-4. ST Segment Depression Localization
Location I II II I aVR aVL aVF V1 V2 V3 V4 V5 V6
Anterior X X X
Anterolateral X X X X X X X X
Lateral X X X X
Inferior X X X
A concurrent statement regarding RVH, LVH, LBBB,
RBBB, any new infarct, or any statement asso ciated
with drug therapy or electrolyte imbalance will impact
this category by tending to suppress ST depression
statements. This is more true for the less severe ST
depression statements than for the more severe ones.
Subendocardial Injury
This category contains statements calling attention
to the likelihood of subendo cardial injury. None of
these statements involveany new examination of
measurements. All subendo cardial injury statements
in this category are determined by the qualication
of a statement or combination of statements in the
preceding category, ST Segment Depression. The degree
of likelihood of subendo cardial injury is based on the
severity of the qualifying ST depression statements.
5-22 The HP Adult ECG Criteria Program
Page 65

Combined ST and T
Abnormalities
This category contains statements calling attention to
the presence of both ST segment and T wavechanges.
None of these statements involveany new examination
of measurements. All statements in this category
are determined by the qualication of a combination
of statements in the T Wave Abnormalities and ST
Segment Depression categories. The severity of the
statements in this category are dep endent on the severity
of the qualifying ST and T wavechanges.
Injury and Ischemia
ST Segment Elevation
This category contains statements calling attention to
the possibility of subendocardial injury and/or isc
hemia.
None of these statements involveany new examination
of measurements. All statements in this category
are determined by the qualication of a combination
of statements in the T Wave Abnormalities and ST
Segment Depression categories.
All leads are examined for positive v
alues in the ST
segment and for negative T waves. The ST segment
measurements examined include the deection at the
onset of the ST segment (the J point), and the deection
at a point 80 ms after the J poin
t. The slope of the ST
segment in degrees is also examined.
The smallest positive ST deection considered signicant
is 0.05 mV.
When ST elevation is small (0.05 mV to approximately
0.25 mV) the statements are considered of Borderline
severity while larger deections are considered to b e
Abnormal.
When inverted T waves are associated with ST elevation,
the statement will include subepicardial injury as a
possibility.
If many leads show ST elevation, the statement will
include pericarditis as a p ossibility.
The HP Adult ECG Criteria Program 5-23
Page 66

Whenever possible, the location of ST elevation and
subepicardial injury will be indicated as part of the
interpretive statements. Though not rigidly dened, the
localization will generally t the following:
Table 5-5. ST Segment Elevation Localization
Location I II II I aVR aVL aVF V1 V2 V3 V4 V5 V6
Anterior X X X
Anterolateral X X X X X X X
Lateral X X X X
Inferior X X X
Severity
This is the nal category of the ECL program. The
overall severity for the entire ECG is determined based
on the severity of the statements whichhave been
selected for the report. Each statement which appears
on the ECG report carries one of the following sev
NO { Normal
ON { Otherwise Normal
BO { Borderline
AB { Abnormal
DE { Defective
NS { No Severity Assigned
The severity that is assigned to the ECG interpretive
report as a whole is generally the same as the most
severe statement in the report. The severitymaybe
advanced one level from Otherwise Normal to Borderline
or from Borderline to Abnormal if three or more
statements on the report have the lesser severity.
erities:
5-24 The HP Adult ECG Criteria Program
Page 67

The HP Pediatric ECG Criteria Program
Pediatric ECG interpretation criteria are particularly
well-suited for computer-assisted analysis because of
their complex, age-dependent nature. Developmentof
the Hewlett-Packard Pediatric ECG Criteria Program
began in 1975 as a natural adjunct to the adult program.
The program is written in the ECG Criteria Language
(ECL) whichwas created by Hewlett-Packard to follow
the logical process used by skilled physicians to analyze
ECGs. The design of the program and a complete
developmentenvironment allow it to b e modied easily
on the Hewlett-Packard ECG Management System.
The pediatric ECG program was rst introduced
into the clinical environment in 1983 as part of the
Hewlett-Packard ECG Management System and the
PageWriter cardiograph.
6
The HP Pediatric ECG Criteria Program 6-1
Page 68

Understanding the
H-P Pediatric ECG
Criteria Program
This chapter contains brief descriptions of the
ma jor categories of interpretive statements in the
Hewlett-Packard p ediatric ECG program. Reviewing
these descriptions will help you understand the
program's breadth of scope and depth of analysis in
various areas of ECG interpretation. You will then be
better able to use Hewlett-Packard's computer-assisted
ECG analysis eectively in your daily ECG overreading
activities.
The criteria used to select the interpretive statements
in this program use the full range of measurements in
the measurement matrix. These include durations,
amplitudes, areas, and other parameters described in
Appendix C,
The Extended Measurements Rep ort
.For
clarity and conciseness in the summaries that follow,
the detailed logic of the program will not be described.
Rather, when describing the criteria logic where the
signicantvalues vary, only one measurementvalue will
be mentioned and it will be lab eled \(typical)". The
typical value is the one that is most generally applied in
the logic.
In the criteria logic there are many situations in which
an interpretive statement that is otherwise qualied to
be printed, is suppressed by other qualifying conditions
that override the initial statement. These suppressive
conditions generally are not addressed in the categories
discussed in this chapter.
6-2 The HP Pediatric ECG Criteria Program
Page 69

The following categories, representing clinically
relevant statements and some technical statements and
disclaimers, are described in the following sections.
Pediatric ECG Interpretation
Calibration Notice if not Standard
Technical Quality Statements
Electronic Pacemaker
Dextrocardia
Sinus Rhythms
Atrial Premature Complex
Ventricular Premature Complex
PR Interval
Wol-Parkinson-White Syndrome
Ventricular Conduction Delay
Right Bundle Branch Block
Left Bundle Branch Blo ck
RightAtrial Enlargement
RVH: QRS Voltage Criteria
Right Axis Deviation
RVH: T Wave Criteria
RightVentricular Hypertrophy
Left Atrial Enlargement
LVH: QRS Voltage Criteria
Left Axis Deviation
LVH: ST Segment and T Wave Criteria
Left Ventricular Hypertrophy
Biventricular Hypertrophy
Anterior ST Elevation
Inferior ST Elevation
Anterolateral ST Elevation
Anterior ST Depression
Inferior ST Depression
Anterolateral ST Depression
Anterior T Wave Changes
Inferior T Wave Changes
Anterolateral T Wave Changes
Anatomical Diagnoses
Severity
The HP Pediatric ECG Criteria Program 6-3
Page 70

Pediatric ECG
Interpretation
The Hewlett-Packard Pediatric ECG criteria program is
intended for use on ECGs of children from birth to age
15. If an age is entered that is invalid, the interpretation
will be based on an assumed age of 15 years. A special
statement noting this assumption is printed instead of
the standard notice that the ECG is being interpreted
with p ediatric criteria.
The patient's age can be entered at the cardiograph in
units of hours, days, weeks, months, or years. It also
maybe entered as the year of birth, in which case an age
in years will be calculated b
y the cardiograph.
Calibration Notice if
Not Standard
Calibration Nominal
Half standard 5 mm/mV 4.75{5.25 mm/mV 5%
Standard 10 mm/mV 9.5{10.5 mm/mV 5%
Double standard 20 mm/mV 19.0{21.0 mm/mV 5%
Technical Quality
Statements
This category checks the calibration pulse in each
channel of the ECG. Except for the case where both
the limb leads and the precordial leads are at standard
calibration (10 mm/mV), a statement describing the
calibration for the ECG is included in the report.
Table 6-1. Calibration
Value
Allowed
Range
6
%
This category contains non-clinical statements which
identify ECGs with technical problems and prevent them
from b eing interpreted by the medical criteria program.
6-4 The HP Pediatric ECG Criteria Program
Page 71

Electronic Pacemaker
This category relies on the ECG measurements to
detect ECGs which are paced. For ECGs which are
predominantly-paced there is no further consideration
of medical criteria. For demand-paced ECGs in which
there are enough non-paced beats, no further rhythm
analysis is attempted. However, the non-paced b eat
measurements are used in the remaining categories to
check for other abnormalities in the ECG.
Dextrocardia
Basic Cardiac Rhythm
Sinus Rhythms
Dextrocardia is suggested if the frontal P axis is between
90 and 180 degrees, and either lead I or V6 has a small
negative P wave, and b oth leads I and V6 ha
ve a large
Swave(>0.6 mV), and the P wave is larger in lead II
than in lead II I.
One statement describing the basic cardiac rhythm is
selected from this category based on the morphology and
rhythm measurements made from the ECG.
Interpretive statements regarding the basic cardiac
rhythm are generated based on the interrelationships of
the various measurements and determinations.
Sinus versus atrial rhythm statements are based on the
frontal P axis. If the P axis is bet
ween 0 and 90 degrees
the rhythm is considered to be of sinus origin. Outside
this range the rhythm is considered to be either atrial or
supraventricular.
Sinus arrhythmia is detected when there is a minor but
signicantvariation in rate within the ten second perio d
analyzed, and the P axis is normal.
The HP Pediatric ECG Criteria Program 6-5
Page 72

Heart rates slower than the normal range are considered
bradycardia and those higher are considered tachycardia
as shown in the table below:
Table 6-2.
Age vs. Ventricular Rate for Sinus Rhythms
Heart Rate (bpm)
Age Range Bradycardia Normal Tachycardia
Atrial Premature
Complex
0 { 23 hours
1{7days
8 { 30 days
1{2mo.
3 { 11 mo.
1{2yr.
3{4yr.
5{7yr.
8 { 11 yr.
12 { 15 yr.
93 94{145
99 100{175
114 115{190
123 124{190
109 110{178
97 98{163
64 65{132
64 65{115
59 60{107
59 60{102
146
176
191
191
179
164
133
116
108
103
If there is a beat with essentially the same morphology
as the basic background b eat but with a rate that is
faster (thus, premature), an interpretive statementis
made for a premature atrial complex. More than one
of this type b eat within the ten seconds analyzed will
produce a statement regarding multiple premature atrial
complexes.
6-6 The HP Pediatric ECG Criteria Program
Page 73

Ventricular Premature
Complex
An interpretive statement is made for premature
ventricular complex if there is a beat that has a longer
QRS duration than the background complex, has an
aberrant shape and a faster rate (thus, premature).
More than one of this type beat within the ten seconds
analyzed will produce a statement regarding multiple
premature ventricular complexes.
PR Interval
Wolff-Parkinson-White
Syndrome
Ventricular
Conduction Delay
Right Bundle Branch
Block
Upper limits for a normal PR interval vary from 130 ms
in a newborn to 180 ms in a 15 year old. PR intervals
longer than the upper limit for the patien
t's age will
produce a statement regarding prolonged PR interval for
age. However, a PR interval of 210 ms or longer will,
in all age groups, produce a statement regarding rst
degree AV blo ck.
The presence of delta waves along with a shortened
PR interval (less than 120 ms) and a QRS duration
longer than 90 ms will produce a statemen
t regarding
Wol-Parkinson-White syndrome.
A QRS duration between 100 ms and 190 ms in a
patient less than one year, or a QRS duration between
110 ms and 190 ms in a patient 1 to 15 years old will
produce a statement regarding ventricular conduction
delay for age.
The presence of a ventricular conduction delay for age
and either an RSR0or no negative component at all (no
Q or S) in V1 will produce a righ
statement. In order for the RSR
t bundle branch blo ck
0
to be signicant, the
R0must be at least 20 ms in duration and 0.15 mV in
amplitude.
The HP Pediatric ECG Criteria Program 6-7
Page 74

Left Bundle Branch
Block
A statement indicating left bundle branch block will be
made in the presence of:
aventricular conduction delay for age,
a QRS axis for the terminal 40 ms between090 and
+90 degrees (clockwise),
a short (<20 ms) or absent S in I, aVL, V5, V6, and
a small or absentRwave in V1, V2, V3.
In the absence of a statement regarding LBBB, a mean
QRS axis b etween060 and090 degrees will result in a
left anterior superior fascicular block statement.
Right Atrial
Enlargement
RVH: QRS Voltage
Criteria
High amplitude P waves will pro duce a right atrial
enlargement statement. Leads I, II, I II, aVF, V1, and
V2 are examined. At least one must haveaPwave
larger than 0.25 mV in amplitude with a P w
ave larger
than 0.20 mV in another lead as conrmation.
Six dierent age groups are established with appropriate
voltage criteria for each group. A total of 24 dierent
conditions meet the criteria for the presence of adequate
RVH voltage in the varying age groups. Factors
considered in meeting these conditions are:
the absolute size of R and R0in V1 and/or V2
the absolute size of S in V6
the relative sizes of R and S in V1 and/or V6
the presence of a QR pattern in V1
This category is bypassed in the presence of any RBBB
statement.
6-8 The HP Pediatric ECG Criteria Program
Page 75

Right Axis Deviation
The mean QRS axis is considered in making the
determination of right axis deviation (RAD). Three
age groups with three dierent ranges for RAD are
established as follows:
Birth to 5 days: 181 to 269 degrees clo ckwise
6days to 30 days: 161 to 269 degrees clockwise
1 month to 15 years: 135 to 269 degrees clockwise
RVH: T Wave Criteria
Right Ventricular
Hypertrophy
RVH T wave criteria are met as follows:
5days to 4 years V1 T wave amplitude>+0.10 mV,
and b oth V5 and V6 T wave
amplitude>0.01 mV, and no T
0
in
either V1, V5 or V6
5to8years V1 T wave amplitude>0.15 mV,
and b oth V5 and V6 T wave
amplitude>0.01 mV, and no T
0
in
either V1, V5 or V6
The detection of RVH is made on the basis of the
presence of qualifying statements in the RVH Voltage,
RAD, and RVH T Wave Criteria categories. Various
combinations of statements from these categories will
produce statements varying in severity from borderline
to abnormal. The likelihood of RVH increases as the
severity of the qualifying statements increases.
The HP Pediatric ECG Criteria Program 6-9
Page 76

Left Atrial
Enlargement
A large negative comp onent to the P wavein V1 is
used to call attention to the likelihoo d of left atrial
enlargement. Negative P waves longer than 40 ms in
duration and larger than 0.08 mV in amplitude are
signicant when they combine to produce a negative area
of more than 4.00 ms-mV.
LVH: QRS Voltage
Criteria
Left Axis Deviation
Values considered signicantasLVH voltages are:
S amplitude more than 2.5 mV in V1
S amplitude more than 3.5 mV in V2
R amplitude more than 3.0 mV in V5
R amplitude more than 2.3 mV in V6
R amplitude more than 3.0 mV in I, II, aVL, or aVF
S amplitude more than 2.5 mV in V1
S amplitude in V1 plus R amplitude in V5 more than
4.5 mV
A combination of a 0.40 mV Q and a 1.0 mV R in
either V5 or V6
These LVH voltage criteria are used regardless of the
patient's age. This category is bypassed in the presence
of RBBB or LBBB.
The mean QRS axis is considered in making the
determination of left axis deviation. Four age groups
with dierent ranges for LAD are established as follows:
Birth to 30 days:090 to +60 degrees clockwise
1 to 2 months:090 to +40 degrees clockwise
3 to 5 months:090 to +20 degrees clockwise
6 months to 15 years:090 to 0 degrees clockwise
6-10 The HP Pediatric ECG Criteria Program
Page 77

LVH: ST Segment and
TWave Criteria
Leads I, aVL, V4, V5, and V6 are examined for ST
segment and T wavechanges characteristic of LVH.
Positive ndings are of twotypes:
a mid ST segment elevation, with a large positive T
wave or:
a slight mid ST segment depression that is upsloping,
with a negative T wave.
Left Ventricular
Hypertrophy
Biventricular
Hypertrophy
Anterior ST Elevation
The determination of LVH is made on the basis of the
presence of qualifying statements in the LVH Voltage,
LAD, and LVH ST Segment and T Wave Criteria
categories. Various combinations of statements from
these categories will produce statements of varying
severity and certainty regarding the presence of LVH.
Associated RVH should be considered when anyLVH
statement is combined with a large R (>1.0 mV) in V1.
Similarly, associated LVH should b e considered when
RVH statements are combined with both a signicantQ
wave(>10 ms and>0.07 mV) and a large R wave
(>1.0 mV) in V6. Biventricular hypertrophy should
also be considered when the combined amplitudes of R
and S exceed 6.0 mV in two of leads V2, V3, or V4.
Leads V2, V3, V4, and V5 are examined for ST
elevation. ST elevation of more than 0.15 mV in
these leads produces a statement suggesting a normal
variation.
The HP Pediatric ECG Criteria Program 6-11
Page 78

Inferior ST Elevation
Leads I I, II I, and aVF are examined for ST elevation.
ST elevation of more than 0.15 mV in these leads
produces a statement suggesting nonspecic ST changes
that are probably normal.
Anterolateral ST
Elevation
Anterior ST
Depression
Inferior ST
Depression
Anterolateral ST
Depression
Leads I, aVL, V2, V3, V4, V5, and V6 are examined
for ST elevation. ST elevation of more than 0.15 mV
in these leads produces one of two statements. One
suggests normal variation; the other is of borderline
severity and suggests probable asso ciation of ST changes
with LVH.
Leads V2, V3, V4 and V5 are examined for ST
depression. ST depression of more than 0.20 mV in
these leads produces a statement suggesting possible
subendocardial injury.
Leads I I, II I, and aVF are examined for ST depression.
ST depression of more than 0.20 mV in these leads
produces a statement suggesting possible subendo cardial
injury.
Leads I, aVL, V2, V3, V4, V5, and V6 are examined for
ST depression. ST depression of more than 0.20 mV
in these leads produces one of two statements, eachof
borderline severity. One suggests p ossible subendocardial
injury; the other is in asso ciation with LVH and suggests
that the ST changes are probably secondary to LVH.
6-12 The HP Pediatric ECG Criteria Program
Page 79

Anterior T Wave
Changes
Leads V1, V2, V3, V4, and V5 are examined for negative
Twaves. As negative values increase from 0.01 mV
to more than 1.0 mV, the statements change from
\nonspecic" T wavechanges with a severity of Normal,
to \anterior ischemia" with a severity of Borderline.
Inferior T Wave
Changes
Anterolateral T Wave
Changes
Leads II, II I, and aVF are examined for negative
Twavevalues. As negative values increase from
0.10 mV to more than 1.0 mV, the statements change
from \Nonspecic T wavechanges" with a severity
of Borderline, to \Consider Inferior Isc
severity of Abnormal.
Leads I, aVL, V2, V3, V4, V5, and V6 are examined
for T wavevalues. Positivevalues more than 1.0 mV
indicate a probably normal T wavevariant. Negative
values call attention to the p ossibility of ischemia, with
increasing severity codes as the negative values increase
from 0.01 mV to more than 1.0 mV. Statemen
from those referring to \Nonspecic T w
with a severity of Borderline to \Consider Anterolateral
Ischemia" with a severity of Abnormal.
hemia" with a
ts range
avechanges"
The HP Pediatric ECG Criteria Program 6-13
Page 80

Anatomical
Diagnoses
The likeliho od of various congenital cardiac conditions
is suggested on the basis of varying combinations of
atrial enlargement, ventricular hypertrophy, conduction
patterns, axis determinations, and QRS morphological
features.
Severity
This is the nal module of the ECL program where
the overall severity for the entire ECG is determined
based on the severity of the statements whichhave been
selected for the report. Each statement which appears
on the ECG report carries one of the following severities:
NO { Normal
ON { Otherwise Normal
BO { Borderline
AB { Abnormal
DE { Defective
NS { No severity assigned
The severity that is assigned to the ECG interpretive
report as a whole is generally the same as the most
severe statement in the report. The severitymaybe
advanced one level from Otherwise Normal to Borderline
or from Borderline to Abnormal if three or more
statements on the report have the lesser severity.
6-14 The HP Pediatric ECG Criteria Program
Page 81

Reading the Printed Report
This chapter describ es the printed reports produced on
the HP interpretive cardiograph. There are three types
of clinical reports that the cardiograph can print:
7
Interpretive Report
information, a ten-second ECG waveform, and a set
of standard waveform measurements and interpretive
statements.
Extended Measurements Rep ort
on some models, shows all the waveform measurements
the HP interpretive cardiograph makes on an ECG,
including morphology and rhythm measurements. These
measurements are used to generate the interpretive
statements printed on the Auto report.
Manual Rep ort
also print a continuous ECG waveform in a variety of
formats.
This report can include patient
This report, available
The HP interpretive cardiograph can
Reading the Printed Report 7-1
Page 82

Auto Interpretive
Reports
Insert artwork here.
Interpretive reports show up to six blocks of information,
as shown below. The operator can congure the HP
interpretive cardiograph so it do es not prompt for
(and therefore does not print) any patient information
except patient ID. The op erator can also congure the
cardiograph to include or omit various combinations of
the basic measurements, the interpretive statements and
the reasons statements. Note that your PageWriter may
or may not have all of these capabilities.
Figure 7-1. A Typical Interpretive Report.
A. Patient ID Information
B. Basic Measurements
C. Interpretive Information
D. Calibration Pulse
E. Rhythm Strip
F. Settings
7-2 Reading the Printed Report
Page 83

Patient Information
This information is entered (or updated) by the
technician when the ECG is taken. A complete listing
of patient information codes is listed in App endix B,
PatientIDCodeTables.
Some patient information app ears to the right of the
interpretive information. This information can be
changed when conguring the cardiograph. It includes
the following information:
User A Label Lab el such as \Smoker?" or \Temp?"
that appears in ID entry process.
Limited to eightcharacters.
User B Label Label such as \Smoker?" or \Temp?"
that appears in ID entry process.
Limited to eightcharacters.
Requested by This eld displays the name of the
physician who requested the report.
Limited to 16 characters.
Edited This memo prints if the patientID
information has been edited since it was
rst entered.
Reading the Printed Report 7-3
Page 84

Basic Measurements
This block gives standard interval and duration
measurements in milliseconds, and limb lead axis
measurements in degrees. These are representative
values for the dominant beat pattern in the ECG. For
more information on how representative measurements
are derived, refer to \How the HP Interpretive
Cardiograph Measures ECGs" in Chapter 4.
Table 7-1. Basic Measurements
Item Description Units
RATE Heart rate beats per
minute
PR PR interval milliseconds
QRSD QRS duration milliseconds
QT QT interval milliseconds
QTc QT interval corrected for rate milliseconds
P Frontal P axis degrees
QRS Frontal mean QRS axis degrees
T Frontal T axis degrees
7-4 Reading the Printed Report
Page 85

Interpretive
Information
This block contains:
The interpretive statements whichmaybe
accompanied by,
\Reasons" statements summarizing the conditions that
produced eachinterpretive statement.
This block can also include the following types of
technical information:
Calibration statements
indicating the scaling of the
ECG trace. For example:
All leads HALF standard calibration.
All channels = 5 mm/mV.
Quality statements
indicating signal problems that
occurred during the recording. For example:
Artifact in lead(s) I III aVL
Severity statement
indicating the ECG's classication.
The severity that is assigned to the ECG interpretive
report is generally the same as the most sev
statement in the report. This is alwa
ys the last
ere
statement in this blo ck. The Criteria dene ve
severity levels. In order of severity, they are:
Normal ECG
Otherwise Normal ECG
Borderline ECG
Abnormal ECG
Defective ECG
Reading the Printed Report 7-5
Page 86

Calibration Pulse
This is the rectangular waveform shown in each line
of ECG trace. It shows howmuch the cardiograph
deected the trace in response to a 1 mV calibration
pulse applied to the acquisition circuitry.
The shap e of the calibration pulse reects the scaling
of the trace. (Set with the
4
ECG Size
5
or the
4F55
keys
depending on your cardiograph.). If the calibration pulse
is square, the chest leads and limb leads were recorded at
the same scale. If the calibration pulse is stepped, the
cardiograph recorded the chest leads at half the scale
of the limb leads. The follo
wing table shows how the
calibration pulse indicates ECG sensitivity.
Table 7-2. Calibration Signals
V Leads/ECG Size
ECG Size
Full Half
mm/mV
5
10
20
Rhythm Strip
The HP interpretive cardiograph can print ten seconds
of one lead or of three leads at the bottom of the Auto
report. This additional trace is a rhythm strip. Rhythm
strips show the same ten seconds of ECG data as in the
Auto report.
7-6 Reading the Printed Report
Page 87

Settings
Information about the settings at which the ECG was
taken is listed at the bottom of the Auto rep ort. Note
that your PageWriter cardiograph may not have all these
settings available.
LOC
Speed:
Limb:
Chest:
Filter box
Faulty Electrode
HP708
This label includes a lo cation co de
and a cart number.
Indicates the speed at which the
ECG was printed. Auto reports
can be printed at 25 mm/sec or
50 mm/sec.
Limb lead sensitivity setting. Can be
5, 10, or 20 mm/mV.
Chest lead sensitivity setting. Can
be 2.5, 5, 10, or 20 mm/mV.
Indicates which lters were active
when the ECG was recorded.
F
Artifact lter.
W
Baseline wander lter.
60
0.5{40 Hz
AC lter
Auto frequency lters
Leads o indication.
This is the measurements program
(7) and criteria (08) versions used by
the cardiograph.
00016
This is the sequence number, which
indicates the number of ECGs taken
as of the current rep ort since the
software was last installed.
Reading the Printed Report 7-7
Page 88

Auto Report Formats
Insert artwork here.
The ECG trace can be printed in any of the following
formats.
Figure 7-2. An Auto 3x4 Report. (3x4)
Insert artwork here.
Figure 7-3. An Auto 3x4 Report with a Rhythm Strip. (3x4, 1R)
7-8 Reading the Printed Report
Page 89

Insert artwork here.
Figure 7-4. An Auto 3x4 Report with 3 Rhythm Strips. (3x4, 3R)
Insert artwork here.
Figure 7-5. An Auto 6x2 Report. (6x2)
Reading the Printed Report 7-9
Page 90

Extended
Measurements
Report
Insert artwork here.
The Extended Measurements report gives a complete
listing of the measurements the cardiograph made to
derive the interpretation of an ECG. This report is
especially useful if you want to examine the logic of the
given interpretation. Refer to your cardiograph's
Reference Guide
Note that your PageWriter cardiograph may not have
this capabilit y.
An explanation of each eld of the report is in Appendix
C,
The Extended Measurements Report.
for information on printing this rep ort.
User's
Figure 7-6. An Extended Measurements Report (Morphology).
7-10 Reading the Printed Report
Page 91

Insert artwork here.
Figure 7-7. An Extended Measurements Report (Rhythm).
Manual Reports
When the operator starts a Manual report, the HP
interpretive cardiograph prints the ECG until the
operator stops the recording.
Manual reports show up to three types of information:
Patient information
ECG trace
Settings information
Reading the Printed Report 7-11
Page 92

Manual ECGs include the same patient information as
on Auto ECGs. This information appears ab ove the
waveform. Manual reports are not analyzed, so they do
not provide measurement information or interpretive
statements. The calibration pulse appears at the
beginning of the ECG trace.
Cardiograph Settings
The cardiograph settings appear ab ove the waveforms on
Manual reports. Note that your PageWriter cardiograph
may not have all these settings available.
LOC
This lab el is at the bottom of the
Manual report page. It includes the
location code and cart number.
Speed:
Indicates the sp eed at which the
ECG was printed. Manual reports
can be printed at 5, 10, 25, or 50
mm/sec.
Limb:
Limb lead sensitivity. Can b e 5, 10,
or 20 mm/mV.
Chest:
Chest lead sensitivity. Can be 2.5, 5,
10, or 20 mm/mV.
Filter box
Indicates which lters were active
when the ECG was recorded.
F
Artifact lter.
W
Baseline wander lter.
60
AC lter
Faulty Electro de
00019
7-12 Reading the Printed Report
0.5{40 Hz
Manual frequency lters
Leads o indication.
This is the sequence number, which
indicates the number of ECGs taken
as of the current report since the
software was last installed.
Page 93

Manual Report
Formats
Insert artwork here.
Manual reports can haveany combination of three, six,
or 12 leads. These Manual report formats are shown in
the following gures:
Figure 7-8. A Manual 3-Lead Format.
Reading the Printed Report 7-13
Page 94

Insert artwork here.
Insert artwork here.
Figure 7-9. A Manual 6-Lead Format.
Figure 7-10. A Manual 12-Lead Format.
7-14 Reading the Printed Report
Page 95

Managing Your ECGs
Besides producing lo cal hardcopy reports, many
HP interpretive cardiographs can be linked to
Hewlett-Packard ECG Management Systems. On some
PageWriter models, ECGs may b e stored to exible
disk for permanent archival, storage or transmission.
You maywant to send your ECGs to another site for
clinical review, long-term storage and retrieval, or for
management. Figure 8-1 shows the ECG management
process. (Note that Operator Feedback is not available
on some PageWriter models.)
The method of transfer can vary, depending on your
requirements and the capabilities of your cardiograph:
8
storage on exible disk: can be used b
interpretive cardiograph for subsequent retrieval and
for batch ECG transmission
local transmission through direct connect cable.
remote transmission via telephone mo dem.
ECGs can be received byany of Hewlett-Packard's ECG
Management Systems and WorkStations, or by some
models of HP interpretive cardiographs. ECGs stored to
exible disk by non-interpretive PageWriter cardiographs
can both be analyzed and transmitted in batc
disk-equipped HP interpretive cardiograph.
Managing Your ECGs 8-1
y the HP
hbya
Page 96

ECG &
Patient
Data
Feedback
To
Operator
ECG Reports To
Cart Printer
Quality
Monitor
Measurements
HP ECG Analysis Program
Criteria
Serial Comparison
Previous
ECG Report
For Serial
Comparison
Cardiologist
Editing
Previous ECG
Report Dispatcher
Reports
To
Extended
Measurement
Matrix
Conrmed
Diagnostic
Report
Active
Patient
Files
Hospital
Wards
Physicians
Oces
Figure 8-1. Managing ECGs.
Unconrmed Report
and Trace, Previous
ECGS
Permanent
Patient Files
On Line
Remote
Hospitals
Other
Subscribers
8-2 Managing Your ECGs
Page 97

PageWriter
Communications
ManyHPinterpretive cardiographs incorp orate a digital
transmission scheme to provide exibility and guarantee
error-free ECG transmission. ECG storage space and
telephone connect time are minimized by the use of
non-distorting compression algorithms.
An important part of the transmission proto col is its
error detection and handling capabilities. The lower level
of the protocol packages each block of data with CRC
(cyclic redundancy check) codes, and any detected error
results in retransmission of data. If a block cannot be
transmitted without error after numerous attempts have
been made, the link is terminated and the operator is
notied.
The upper level of the proto col supports an expandable
command interpreter that allows the transmission of
ECGs, analysis reports and measurement matrices from
cardiograph to cardiograph, cardiograph to an ECG
Management System, and ECG Management System to
a cardiograph. For example, following ECG transmission
from the patient's b edside, a physician can receive
a previous ECG from the system for an immediate
comparison.
Managing Your ECGs 8-3
Page 98

ECG Management
Systems
When an ECG is received and stored bya
Hewlett-Packard ECG Management System several
functions can be initiated.
reports can be automatically generated. When, where,
and in which format are all under your control.
a previous ECG (or ECGs) can be retrieved and
appended to the current report for immediate review.
ECGs can be edited. Using Hewlett-Packard's ECL
statement library or using free-form text, the ECG can
be mo died with overreading comments.
Automatic dispatch. The nal rep ort, with any
necessary comments or corrections can be returned to
its originating location, and/or to other sites sharing
the ECG Management Network.
ECGs can be archived for long-term storage. The
system can archive many thousands of ECGs,
automating a very lab or intensive process.
ECGs can be used for clinical research.
8-4 Managing Your ECGs
Page 99

Clinical Rewards
On a practical level, ECG management will assist
the cardiologist or physician in the recovery of ECG
information. Those who use ECG Management systems
have found that automating their ECG ling system
signicantly reduces the number of misplaced ECGs.
This, combined with the greater speed and consistency
associated with computerized record management, has
resulted in a 3% to 15% improvement in recaptured
billings for these institutions.
Automated ECG departments can further help the
cardiologist when overreading ECGs. Our experience has
shown that a doctor can overread up to three times more
quickly with computerization. Ultimately this means
more time with the patient.
There are benets to be gained in the areas of clinical
research. Having thousands of ECGs on line and
available for study on very specic parameters (How
many male patients over 60 years have rst degree
AV block?) enables drug trials, therapeutic care and
teaching improvements to be realized very easily. Sucha
statistically signicant p opulation has encouraged many
of the largest drug companies in the world to employ
Hewlett-Packard systems in their research. Most of the
information that appears on the nal rep ort ma
as a search eld. Furthermore, searches may b e made
on search result les, thus allowing multiple detailed
secondary levels of examination.
y be used
Managing Your ECGs 8-5
Page 100

Current Trends
Worldwide, health-care facilities are under mounting
governmental pressure to reduce costs and manage
themselves more eciently.Aswould be expected, they
are relying heavily on information systems to assist them
in this challenge. In the cardiology department, sta
productivity related to the management and storage
of test data from high-volume tasks such as ECG
processing are especially improved.
Networking these products oers a unique solution
to the institution lo oking to manage their expanding
ECG volume eectively, and to respond to the
overreading demands of smaller surrounding institutions.
Transaction logging prevents loss of ECGs.
Previously, the high cost of large centralized ECG
Management systems limited them to only the
largest hospitals. However, the decreasing cost of
technology will now allowvendors to oer solutions to
all institutions, regardless of size. As these solutions
develop, Hewlett-Packard customers can continue to
expect a high standard of compatibility. This means that
the manyyears of ECGs stored on your current system
will not b e lost in a transition to our next generation
products.
8-6 Managing Your ECGs
 Loading...