

Page 1

HP Caliper User Guide
Release 5.7
HP Part Number: 769153-001
Published: March 2014
Edition: 5.7
Page 2

© Copyright 2014 Hewlett-Packard Development Company, L.P.
Confidential computer software. Valid license from HP required for possession, use or copying. Consistent with FAR 12.211 and 12.212, Commercial
Computer Software, Computer Software Documentation, and Technical Data for Commercial Items are licensed to the U.S. Government under
vendor's standard commercial license. The information contained herein is subject to change without notice. The only warranties for HP products
and services are set forth in the express warranty statements accompanying such products and services. Nothing herein should be construed as
constituting an additional warranty. HP shall not be liable for technical or editorial errors or omissions contained herein.
UNIX is a registered trademark of The Open Group.
Intel® and Itanium® are registered trademarks of Intel Corporation or its subsidiaries in the United States and other countries.
Page 3
Contents
HP secure development lifecycle....................................................................12
About This Document...................................................................................13
1 HP Caliper at a Glance............................................................................17
What is HP Caliper?...............................................................................................................17
What Does HP Caliper Run On?..............................................................................................19
Supported Hardware and Operating Systems........................................................................19
Supported Compilers and Application Environments...............................................................19
Summary of HP Caliper Features..............................................................................................20
2 Getting Started with the HP Caliper Command-Line Interface..........................21
Example: Running fprof on a Short Program, with Default Output..................................................21
Example: Adding Instructions to an fprof Report..........................................................................25
Types of Measurements...........................................................................................................27
Global Measurement..........................................................................................................27
Sampled Measurements......................................................................................................27
Precise Measurements (HP-UX only) .........................................................................27
What to Look for in Using HP Caliper.......................................................................................28
Syntax for caliper Command....................................................................................................28
Basic Tasks: A Quick Reference................................................................................................29
Starting HP Caliper............................................................................................................29
Stopping HP Caliper..........................................................................................................29
Showing HP Caliper Options...............................................................................................29
Creating a Call Graph Profile with HP Caliper.......................................................................29
Creating a Text Report for Analysis.......................................................................................30
Creating a Report Based on Your Collected Data...................................................................30
Using the HP Caliper Advisor...................................................................................................30
Restrictions on Using HP Caliper...............................................................................................30
Additional HP Caliper Commands............................................................................................31
Getting Information About HP Caliper.......................................................................................31
3 Getting Started with the HP Caliper GUI......................................................32
What Is the HP Caliper GUI?...................................................................................................32
Window Basics......................................................................................................................32
Projects View .................................................................................................................33
Collect View ..................................................................................................................34
Analyze View ................................................................................................................35
Advisor View .................................................................................................................36
Console View ................................................................................................................37
Diagnostics View ...........................................................................................................38
Help View .....................................................................................................................38
Tips for Using Views...........................................................................................................39
Making Measurements............................................................................................................39
Hints on How to Make Measurements...................................................................................39
Exploring Performance Data.....................................................................................................40
Getting Performance Tuning Advice...........................................................................................40
Getting Help..........................................................................................................................41
Starting the GUI.....................................................................................................................41
Native (Local) GUI.............................................................................................................41
Remote GUI......................................................................................................................41
Contents 3
Page 4

4 HP Caliper Measurement Configuration Files................................................43
Measurement Configuration Files Provided with HP Caliper..........................................................43
Overview Measurement...........................................................................................................45
Simultaneous fprof Sampling on Multiple PMU Counters..............................................................46
Location of Measurement Configuration Files..............................................................................46
Specifying Option Values in Measurement Configuration Files..................................................46
Using the Command Line to Override Measurement Configuration File Parameters......................47
5 HP Caliper Options..................................................................................48
Basic Information About Options..............................................................................................48
Multiple Ways to Specify HP Caliper Option Values...............................................................48
Hierarchy for Processing an Option Value.............................................................................49
-d or --database......................................................................................................................49
-e or --duration........................................................................................................................49
-f or --options-file.....................................................................................................................50
-h or -?..................................................................................................................................50
-H or --help.............................................................................................................................50
-m or --metrics.........................................................................................................................50
-m cpu_event.....................................................................................................................50
-m event_set (HP-UX only) .......................................................................................51
-o or --output-file......................................................................................................................51
-p or --process.........................................................................................................................52
-r or --report-details..................................................................................................................52
-r for PMU Histogram Reports..............................................................................................52
-r for Function Coverage Reports..........................................................................................52
-s or --sampling-spec................................................................................................................53
-v or --version..........................................................................................................................54
-w.........................................................................................................................................54
--advice-classes.......................................................................................................................54
--advice-cutoff.........................................................................................................................55
--advice-details.......................................................................................................................55
--analysis-focus........................................................................................................................55
--branch-sampling-spec............................................................................................................55
--bus-speed (HP-UX only) ....................................................................................................56
--callpath-cutoff ......................................................................................................................56
--context-lines..........................................................................................................................57
--cpu-aggregation (HP-UX only) ....................................................................................57
--cpu-counter..........................................................................................................................57
--cpu-details(HP-UX only) .............................................................................................57
--csv-file.................................................................................................................................57
Examples..........................................................................................................................58
--dcache-data-profile................................................................................................................58
--database.............................................................................................................................58
--dcache-hits ..........................................................................................................................58
--dcache-stores .......................................................................................................................58
--dbrp....................................................................................................................................58
--db-save................................................................................................................................59
--debug-file-path=....................................................................................................................59
--description-details ................................................................................................................59
--details.................................................................................................................................59
--detail-cutoff...........................................................................................................................59
Example...........................................................................................................................60
--duration...............................................................................................................................60
--etb-freeze-delay....................................................................................................................60
Example...........................................................................................................................61
4 Contents
Page 5

--etb-walkback-cycles...............................................................................................................61
--event-defaults........................................................................................................................61
Example...........................................................................................................................62
--exclude-caliper (HP-UX only) ......................................................................................62
--exclude-idle (HP-UX only) ..........................................................................................62
--fold.....................................................................................................................................62
--frame-depth..........................................................................................................................62
--group-by..............................................................................................................................62
--help....................................................................................................................................63
--hotpaths...............................................................................................................................63
--ibrp.....................................................................................................................................63
--info.....................................................................................................................................64
--inlines (HP-UX only) ..................................................................................................64
--join.....................................................................................................................................64
--jre ......................................................................................................................................64
--kernel-path...........................................................................................................................64
--kernel-stack (HP-UX only) ...........................................................................................65
--latency-buckets......................................................................................................................65
--measure-on-interrupts (HP-UX only) .............................................................................65
--memory-usage=(HP-UX only) ......................................................................................65
--metrics.................................................................................................................................66
--module-default......................................................................................................................66
--module-exclude.....................................................................................................................66
--module-include.....................................................................................................................66
--module-search-path...............................................................................................................67
--noinlines..............................................................................................................................67
--omr.....................................................................................................................................67
--options-file............................................................................................................................68
--output-file.............................................................................................................................68
--overflow-block.......................................................................................................................68
--per-module-data....................................................................................................................68
--percent-columns....................................................................................................................68
--percent-sample......................................................................................................................68
--prim-cutoff............................................................................................................................68
--process................................................................................................................................69
--process-cutoff........................................................................................................................69
Example...........................................................................................................................70
--read-init-file..........................................................................................................................70
--report..................................................................................................................................70
--report-details........................................................................................................................70
--rule-files...............................................................................................................................70
--sampling-spec.......................................................................................................................70
--scope..................................................................................................................................70
Using --scope system for System-Wide Measurements..............................................................71
Limitations in Using --scope system...................................................................................72
--search.................................................................................................................................72
--skip-functions .......................................................................................................................72
--sort-by.................................................................................................................................72
--source-path-map....................................................................................................................73
--stop-functions(HP-UX only) ................................................................................................73
--summary-cutoff......................................................................................................................73
--sw-process-list=.....................................................................................................................74
--system-model (Linux only)........................................................................................................74
--system-usage=(HP-UX only) ........................................................................................74
--term-display..........................................................................................................................75
Contents 5
Page 6

--threads................................................................................................................................75
--traps-reported.......................................................................................................................75
--user-regions (HP-UX only) .................................................................................................76
--version.................................................................................................................................76
6 Using the HP Caliper Advisor.....................................................................77
What Is the HP Caliper Advisor?..............................................................................................77
Example of an HP Caliper Advisor Report..................................................................................77
Steps in Using the Advisor.......................................................................................................78
Command Line to Invoke the Advisor.........................................................................................79
Getting Started with the Advisor: Examples................................................................................81
Simplest Example...............................................................................................................81
More Typical Examples.......................................................................................................81
Explanation of Report Output..............................................................................................82
How to Read an Advisor Report................................................................................................83
Suggestions for Using the HP Caliper Advisor.............................................................................84
How the HP Caliper Advisor Works..........................................................................................85
7 Using the HP Caliper Advisor in the GUI.....................................................86
Basic Steps in Using the HP Caliper Advisor in the GUI...............................................................86
Making Performance Measurement Runs....................................................................................86
Selecting Performance Data to Analyze [Optional] .....................................................................87
Generating Advice.................................................................................................................89
Reviewing and Acting on the Advice.........................................................................................90
8 Configuring HP Caliper ............................................................................92
Specifying Option Values with a .caliperinit Initialization File........................................................92
Example of a .caliperinit File...............................................................................................92
Setting Constants in the .caliperinit File.................................................................................93
Configuring Data Collection.....................................................................................................94
Specifying Which CPU Events to Measure.............................................................................94
Shortening CPU Event Names.........................................................................................94
Specifying Which Load Modules to Collect Data For..............................................................95
Default Settings for Load Module Data Collection..............................................................95
How to Specify Load Module Names...............................................................................96
Controlling Granularity of Data Collection and Reports...........................................................97
Specifying Processes to Measure..........................................................................................97
Process Tree Report.......................................................................................................97
Syntax for -p Option......................................................................................................98
Using -p some ..............................................................................................................99
Examples of the -p Option ...........................................................................................100
Using HP Caliper in Your Build Process...............................................................................100
Using HP Caliper in Testing and Quality Assurance.........................................................100
Using HP Caliper to Generate Test Suite Reports.............................................................101
Attaching to a Running Process to Perform Measurements......................................................101
How to Display Reference Information About CPU Counters or HP Caliper Report Types.................102
Options for the caliper info Command................................................................................102
-c or --cpu-counter........................................................................................................102
-d or --details..............................................................................................................103
-o or --output-file..........................................................................................................103
-r or --report................................................................................................................103
-s or --search...............................................................................................................103
Examples of the caliper info Command...............................................................................103
HP Caliper Environment Variables...........................................................................................104
9 Controlling the Content of Reports.............................................................105
Layout of an HP Caliper Text or CSV Report.............................................................................105
6 Contents
Page 7

Metrics You Can Use for Report Sorting and Cutoffs..................................................................106
Module-Centric Reports.........................................................................................................109
Process Summary.................................................................................................................110
Function Details....................................................................................................................111
Disassembly Listing...............................................................................................................111
Branch Targets in Disassembly Listings................................................................................112
Source Position Correlation....................................................................................................112
Source Line Data.............................................................................................................112
Address Types Shown............................................................................................................112
How Functions Are Named in Reports.....................................................................................113
Unnamed Functions..........................................................................................................113
Unknown Functions..........................................................................................................113
VSE Information Shown in Report Output (HP-UX only) ..................................................113
HyperThreading Information for Dual-Core Itanium 2 and Itanium 9300 Quad-Core Processors Shown
in Report Output...................................................................................................................114
How HP Caliper Saves Data in Databases...............................................................................115
Names and Locations for the Databases.............................................................................115
Changing the Default Name and Location......................................................................115
Creating Reports from Multiple Databases...............................................................................116
Using the caliper report Command to Create a Report from One or More Databases................117
Using the caliper merge Command to Merge Data From Multiple Collection Runs....................117
Using the caliper diff Command to Difference Data Collected in Two Databases......................119
Example of How to Use the caliper diff Command...........................................................121
10 Producing a Sampled Call Graph Profile Analysis.....................................122
How Sampled Call Graph Profile Analysis Works.....................................................................122
Differences Between scgprof and cgprof..................................................................................122
Running the HP Caliper Sampled Call Graph Profile..................................................................123
Sampled Call Graph Text Report Example ...............................................................................123
Sampled Call Graph Profile Report Details...............................................................................132
Flat Profile Part of the Report..............................................................................................132
Call Graph Part of the Report............................................................................................132
Hot Call Paths Part of the Report........................................................................................132
Function Indexes..............................................................................................................132
Diagnostic Messages........................................................................................................133
gprof Fallacy and Possibly Misleading Results...........................................................................133
11 Producing a Sampled Call Stack Profile Analysis.......................................134
Running HP Caliper to Produce a Call Stack Profile...................................................................134
Call Stack Profile Text Report Example for HP-UX.......................................................................134
Call Stack Profile Text Report Example for Linux........................................................................142
Call Stack Profile Report Details..............................................................................................149
Flat Profile Part of the Report..............................................................................................149
Blocking Primitives Summary Part of the Report....................................................................149
Thread Synchronization Primitive's Holder and Waiter Thread Analysis (HP-UX 11.31 only)....149
Hot Call Paths Part of the Report........................................................................................150
Call Graph Part of the Report............................................................................................151
Function Indexes..............................................................................................................151
Avoids gprof Fallacy.............................................................................................................151
Limitations to Using cstack.....................................................................................................151
Pstack like functionality..........................................................................................................151
12 Performing CPU Metrics Analysis (HP-UX only) ................................153
13 HP Caliper Features Specific to HP-UX (HP-UX only) .........................154
Measuring Memory Usage Concurrently with Other Measurements (HP-UX only) ....................154
Examples of the --memory-usage= Option............................................................................155
Contents 7
Page 8

Example Report Output.....................................................................................................156
How to Read the Reports..................................................................................................156
System Memory Configuration Table..............................................................................156
Process Memory Usage Table.......................................................................................157
Measuring System Usage Concurrently with Other Measurements (HP-UX only) .......................158
Example Report Output.....................................................................................................158
Interpreting the Data........................................................................................................160
Attaching to a Running Process to Perform Precise Measurements (HP-UX only) .......................160
Taking PMU Samples in Your Code (HP-UX only) .........................................................161
Triggering PMU Samples in Specific Code Regions...............................................................161
Precautions When Using Triggered Samples...................................................................162
Restricting PMU Measurements to Specific Code Regions.......................................................163
14 Documentation feedback.......................................................................166
A HP Caliper Diagnostic and Warning Messages..........................................167
ERROR #28: Caliper Invalid Measurement Combination............................................................167
Instructions Labeled STUB.......................................................................................................167
Mispredicted Branches..........................................................................................................167
PMU Sample Hits Outside Function Range...............................................................................169
scgprof Reports Require Kernel Patch (HP-UX only) ..............................................................169
B Descriptions of Measurement Reports........................................................171
alat Measurement Report Description......................................................................................171
Example Command Line for Text Report..............................................................................171
Example Command Line for CSV Report..............................................................................171
alat Metrics Summed for Entire Run....................................................................................171
Metrics for Integrity Servers Itanium 2 Systems.................................................................172
Metrics for Integrity Servers Dual-Core Itanium 2 and Itanium 9300 Quad-Core Processor
Systems......................................................................................................................172
Metrics for Integrity Servers Intel® Itanium® 9500 Processors Systems ...............................173
alat Measurement Report Metrics.......................................................................................174
How ALAT Metrics Are Obtained.......................................................................................175
branch Measurement Report Description..................................................................................175
Example Command Line for Text Report..............................................................................175
Example Command Line for CSV Report..............................................................................175
branch Metrics Summed for Entire Run................................................................................175
Metrics for Integrity Servers Itanium 2 Systems.................................................................175
Metrics for Integrity Servers Dual-Core Itanium 2 and Itanium 9300 Quad-Core Processor
Systems......................................................................................................................176
Metrics for Integrity Servers Intel® Itanium® 9500 Processors Systems ...............................177
branch Measurement Report Metrics...................................................................................179
How branch Metrics Are Obtained.....................................................................................180
cgprof Report Description (HP-UX only) .......................................................................180
Example Command Line for Text Report..............................................................................180
Example Command Line for CSV Report..............................................................................180
HP Caliper Call Graph Profile Results Accuracy...................................................................180
Call Graph Profile Metrics.................................................................................................181
cpu Measurement Report Description (HP-UX only) .......................................................183
Example Command Lines for Text Report.............................................................................184
Example Command Line for CSV Report..............................................................................184
CPU Event Sets................................................................................................................184
cstack Measurement Report Description...................................................................................186
Example Command Line for Text Report..............................................................................186
Example Command Line for CSV Report..............................................................................186
cstack Measurement Report Metrics....................................................................................186
8 Contents
Page 9

cycles Measurement Report Description ..................................................................................188
Example Command Line for Text Report..............................................................................189
Example Command Line for CSV Report..............................................................................189
cycles Metrics Summed for Entire Run.................................................................................189
Metrics for Integrity Servers Intel Itanium 9300 processors Systems and older......................189
Metrics for Integrity Servers Intel® Itanium® 9500 Processors Systems ...............................190
cycles Measurement Metrics..............................................................................................192
How cycles Metrics Are Obtained......................................................................................192
dcache Measurement Report Description.................................................................................193
Example Command Line for Text Report..............................................................................193
Example Command Line for CSV Report..............................................................................193
dcache Metrics Summed for Entire Run...............................................................................194
Metrics for Integrity Servers Itanium 2 Systems ................................................................194
Metrics for Integrity Servers Dual-Core Itanium 2 and Itanium 9300 Quad-Core Processor
Systems......................................................................................................................194
Metrics for Integrity Servers Intel® Itanium® 9500 Processors Systems ...............................195
dcache Measurement Report Metrics..................................................................................196
Example dcache Reports...................................................................................................198
Using the --dcache-data-profile Option to Produce a Data Summary........................................199
Using the --dcache-stores Option to Produce a Data Cache Store Profile .................................200
How Data Cache Metrics Are Obtained.............................................................................200
How Latency Bucket Metrics Are Obtained.....................................................................201
How the Data Summary Information Is Obtained.............................................................201
dtlb Measurement Report Description......................................................................................201
Example Command Line for Text Report..............................................................................201
Example Command Line for CSV Report..............................................................................201
dtlb Metrics Summed for Entire Run....................................................................................202
Metrics for Integrity Servers Itanium 2 Systems.................................................................202
Metrics for Integrity Servers Dual-Core Itanium 2 and Itanium 9300 Quad-Core Processor
Systems......................................................................................................................202
Metrics for Integrity Servers Intel® Itanium® 9500 Processors Systems ...............................203
dtlb Measurement Report Metrics.......................................................................................204
How Data TLB Metrics Are Obtained..................................................................................205
ecount Measurement Report Description..................................................................................206
Example Command Line for Text Report..............................................................................206
Example Command Line for CSV Report..............................................................................206
ecount Metrics Summed for Entire Run................................................................................206
Metrics for Integrity Servers Itanium 2 Systems.................................................................206
Metrics for Integrity Servers Dual-Core Itanium 2 and Itanium 9300 Quad-Core Processor
Systems......................................................................................................................206
Metrics for Integrity Servers Intel® Itanium® 9500 Processors Systems................................207
fcount Measurement Report Description (HP-UX only) ....................................................208
Example Command Line for Text Report..............................................................................209
Example Command Line for CSV Report..............................................................................209
fcount Measurement Report Metrics....................................................................................209
fcover Measurement Report Description (HP-UX only) ....................................................209
Example Command Line for Text Report..............................................................................209
Example Command Line for CSV Report..............................................................................209
fcover Measurement Report Metrics....................................................................................209
Unknown Source Files.......................................................................................................210
-r for Function Coverage Reports........................................................................................210
fprof Measurement Report Description.....................................................................................210
Example Command Line for Text Report..............................................................................210
Example Command Line for CSV Report..............................................................................211
fprof Metrics Summed for Entire Run...................................................................................211
Contents 9
Page 10

Metrics for Integrity Servers Itanium 2 Systems.................................................................211
Metrics for Integrity Servers Dual-Core Itanium 2 and Itanium 9300 Quad-Core Processor
Systems......................................................................................................................211
Metrics for Integrity Servers Intel® Itanium® 9500 Processors Systems ...............................212
fprof Measurement Metrics................................................................................................213
How fprof Metrics Are Obtained........................................................................................214
icache Measurement Report Description...................................................................................215
Example Command Line for Text Report..............................................................................215
Example Command Line for CSV Report..............................................................................215
icache Metrics Summed for Entire Run................................................................................215
Metrics for Integrity Servers Itanium 2 Systems.................................................................215
Metrics for Integrity Servers Dual-Core Itanium 2 and Itanium 9300 Quad-Core Processor
Systems......................................................................................................................216
Metrics for Integrity Servers Intel® Itanium® 9500 Processors Systems ...............................217
icache Measurement Report Metrics...................................................................................218
Function Details...............................................................................................................219
How Instruction Cache Metrics Are Obtained......................................................................219
itlb Measurement Report Description.......................................................................................219
Example Command Line for Text Report..............................................................................220
Example Command Line for CSV Report..............................................................................220
itlb Metrics Summed for Entire Run.....................................................................................220
Metrics for Integrity Servers Itanium 2 Systems.................................................................220
Metrics for Integrity Servers Dual-Core Itanium 2 and Itanium 9300 Quad-Core Processor
Systems......................................................................................................................220
Metrics for Integrity Servers Dual-Core Intel® Itanium® 9500 Processors Systems ................221
itlb Measurement Report Metrics........................................................................................222
Function Details...............................................................................................................223
How Instruction TLB Metrics Are Obtained...........................................................................223
pmu_trace Measurement Report Description.............................................................................224
Example Command Line for Text Report..............................................................................224
Example Command Line for CSV Report..............................................................................224
scgprof Measurement Report Description.................................................................................224
Example Command Line for Text Report..............................................................................224
Example Command Line for CSV Report..............................................................................224
scgprof Measurement Report Metrics (Flat Profile).................................................................224
scgprof Measurement Report Metrics (Call Graph Profile)......................................................225
traps Measurement Report Description ....................................................................................227
Example Command Line for Text Report..............................................................................228
Example Command Line for CSV Report..............................................................................228
traps Metrics Summed for Entire Run...................................................................................228
traps Measurement Metrics................................................................................................230
How traps Metrics Are Obtained ......................................................................................231
C Event Set Descriptions for CPU Metrics (HP-UX only) .........................232
brpath Event Set...................................................................................................................232
Metrics Available from this Measurement............................................................................232
brpred Event Set...................................................................................................................233
Metrics Available from this Measurement............................................................................233
c2c Event Set.......................................................................................................................235
Metrics Available from this Measurement............................................................................235
cpi Event Set........................................................................................................................236
Metrics Available from this Measurement............................................................................237
cpubus Event Set..................................................................................................................238
Metrics Available from this Measurement............................................................................238
cspec Event Set....................................................................................................................239
10 Contents
Page 11

Metrics Available from this Measurement............................................................................239
dispersal Event Set................................................................................................................240
Metrics Available from this Measurement............................................................................240
dspec Event Set....................................................................................................................241
Metrics Available from this Measurement............................................................................242
fp Event Set..........................................................................................................................243
Correspondence Between Floating-Point Instructions and Operations.......................................243
Metrics Available from this Measurement............................................................................244
l1dcache Event Set...............................................................................................................245
Metrics Available from this Measurement............................................................................245
l1icache Event Set................................................................................................................246
Metrics Available from this Measurement............................................................................247
l2cache Event Set.................................................................................................................248
Metrics Available from this Measurement............................................................................248
l2dcache Event Set...............................................................................................................250
Metrics Available from this Measurement............................................................................250
l2icache Event Set................................................................................................................251
Metrics Available from this Measurement............................................................................252
l3cache Event Set.................................................................................................................253
Metrics Available from this Measurement............................................................................253
Metrics Available for Intel Itanium 2 and dual core Itanium 2 processor systems..................253
Metrics Available for Intel® Itanium® 9500 series systems ...............................................255
memreq Event Set.................................................................................................................255
Metrics Available from this Measurement............................................................................255
queues Event Set..................................................................................................................256
Metrics Available from this Measurement............................................................................257
snoop Event Set....................................................................................................................258
Metrics Available from this Measurement............................................................................258
Metrics Available for Intel Itanium 2 and dual core Itanium 2 processor systems..................258
replay Event Set....................................................................................................................259
Metrics Available from this Measurement ...........................................................................259
stall Event Set.......................................................................................................................259
Metrics Available for Intel Itanium 2 and dual core Itanium 2 processor systems.......................260
Metrics Available for Intel® Itanium® 9500 series systems ....................................................261
sysbus Event Set...................................................................................................................261
Metrics Available from this Measurement............................................................................262
threadswitch Event Set...........................................................................................................263
Metrics Available for Intel Itanium 2 and dual core Itanium 2 processor systems.......................264
Metrics Available for Intel® Itanium® 9500 series systems ....................................................265
tlb Event Set.........................................................................................................................266
Metrics Available from this Measurement............................................................................266
Glossary..................................................................................................268
Index.......................................................................................................273
Contents 11
Page 12

HP secure development lifecycle
Starting with HP-UX 11i v3 March 2013 update release, HP secure development lifecycle provides
the ability to authenticate HP-UX software. Software delivered through this release has been digitally
signed using HP's private key. You can now verify the authenticity of the software before installing
the products, delivered through this release.
To verify the software signatures in signed depot, the following products must be installed on your
system:
• B.11.31.1303 or later version of SD (Software Distributor)
• A.01.01.07 or later version of HP-UX Whitelisting (WhiteListInf)
To verify the signatures, run: /usr/sbin/swsign -v –s <depot_path>. For more information,
see Software Distributor documentation at http://www.hp.com/go/sd-docs.
NOTE: Ignite-UX software delivered with HP-UX 11i v3 March 2014 release or later supports
verification of the software signatures in signed depot or media, during cold installation.
For more information, see Ignite-UX documentation at http://www.hp.com/go/ignite-ux-docs.
Page 13

About This Document
This document describes how to use HP Caliper to measure the performance of native applications
running on HP-UX and Linux Integrity servers.
NOTE: For the latest version of this document, go to the HP Caliper Web site at the following
URL and click on Documentation in the Product Information box:
http://hp.com/go/caliper
This document is sometimes updated after a release. The document publication date appears on
the title page.
Intended Audience
This document is written for software developers who want to improve the performance of their
application programs. It assumes that you are familiar with compilers and with performance analysis
concepts. It is not necessary for you to have used a performance analysis tool before to use HP
Caliper.
New and Changed Information in This Edition
New Information
The HP Caliper 5.7 release has the following improvements:
• Improved accuracy in some of the CPU metrics measurement for Intel® 9500 processors.
• Quality improvements and defect fixes.
Deprecated Options
None
Deleted Information
None.
Document Organization
For information to help you get started, read these chapters:
• “HP Caliper at a Glance” (p. 17) provides an introduction to HP Caliper.
• “Getting Started with the HP Caliper Command-Line Interface” (p. 21) helps you get started
using the HP Caliper command-line interface.
• “Getting Started with the HP Caliper GUI” (p. 32) introduces you to the HP Caliper graphical
user interface (GUI).
For more advanced information, read these chapters:
• “HP Caliper Measurement Configuration Files” (p. 43) describes the measurement configuration
files provided with HP Caliper.
• “HP Caliper Options” (p. 48) describes the HP Caliper options in alphabetical order.
13
Page 14

For information about the HP Caliper Advisor, read this chapter:
• “Using the HP Caliper Advisor” (p. 77).
For information about how to configure HP Caliper to collect data and report the results, read these
chapters:
• “Configuring HP Caliper ” (p. 92) describes how you can configure HP Caliper to collect
data.
• “Controlling the Content of Reports” (p. 105) describes how to control the content of reports
based on the data collected.
For information about how to run particular measurements, read these chapters:
• “Producing a Sampled Call Graph Profile Analysis” (p. 122) describes how to use HP Caliper
to produce a sampled call graph profile analysis.
• “Producing a Sampled Call Stack Profile Analysis” (p. 134) describes how to use HP Caliper
to produce a sampled call stack profile analysis.
• “Performing CPU Metrics Analysis ” (p. 153) describes how to measure CPU metrics on
HP-UX.
For information about HP Caliper features specific to HP-UX, read this chapter:
• “HP Caliper Features Specific to HP-UX ” (p. 154).
Also see these appendixes:
• “HP Caliper Diagnostic and Warning Messages” (p. 167) describes some diagnostic and
warning messages you might receive.
• “Descriptions of Measurement Reports” (p. 171) provides descriptions of reports produced for
all of the HP Caliper measurements.
• “Event Set Descriptions for CPU Metrics ” (p. 232) contains descriptions for the output of
each event set available with the cpu measurement.
Typographic Conventions
This document uses the following typographic conventions:
$ The system prompt for the Bourne, Korn, and POSIX shells.
audit(5) A manpage. The manpage name is audit, and it is located in
Section 5.
Command A command name or qualified command phrase.
Computer output Text displayed by the computer.
Ctrl+x A key sequence. A sequence such as Ctrl+x indicates that you
must hold down the key labeled Ctrl while you press another key
or mouse button.
ENVIRONMENT VARIABLE The name of an environment variable, for example, PATH.
ERROR NAME The name of an error, usually returned in the errno variable.
File name The name of a file, a measurement, or an event set.
Key The name of a keyboard key. Return and Enter both refer to the
same key.
Term The defined use of an important word or phrase.
User input Commands and other text that you type.
14
Variable The name of a placeholder in a command, function, or other
syntax display that you replace with an actual value. An example
is program, where the actual file name will vary.
Page 15

GUI item A graphical user interface (GUI) item such as a button or menu
name.
[] The contents are optional in syntax. If the contents are a list
separated by |, you must choose one of the items.
{} The contents are required in syntax. If the contents are a list
separated by |, you must choose one of the items.
... The preceding element can be repeated an arbitrary number of
times.
| Separates items in a list of choices.
Related Documents
The complete HP Caliper documentation set contains the following:
• HP Caliper Quick Start
• HP Caliper User Guide
• HP Caliper Advisor Rule Writer Guide
• HP Caliper for HP-UX Release Notes
• HP Caliper for Linux Release Notes
• HP Caliper Ktrace Features Guide
You can get more information about HP Caliper in these ways:
• An HP Caliper man page is provided. Type: man caliper
• Help text:
To get short help text, type caliper -h or caliper -?.
To get long help text, type caliper -H or caliper --help.
• To get help in the HP Caliper GUI, in the Help menu, select:
Help Contents for a listing of types of help you can see, including “getting started” help
◦
and reference help
◦ Context-sensitive Help for help on windows in the GUI
• Useful information is available in the HP Caliper home directory. The default HP Caliper home
directory is /opt/caliper/ on HP-UX and /opt/hp-caliper/ on Linux. See these
subdirectories:
◦ Documentation is located in the doc subdirectory.
◦ The doc/text subdirectory contains the help files for the textual report descriptions as
well as other useful information.
◦ Example files are located in the examples subdirectory.
• You can find the most recent software and information on the HP Caliper Web site at:
http://hp.com/go/caliper
The Usage Notes at the HP Caliper Web site are a collection of technical notes explaining details
about HP Caliper and the performance monitoring unit (PMU) used in HP Integrity servers. See
these examples:
• Using HP Caliper to identify a CPU- or memory-related performance problem
• Using HP Caliper to perform bubble analysis on a simple example program
• Using HP Caliper to measure integer load latency
15
Page 16

• Using HP Caliper to analyze effective floating-point load latency
• Using HP Caliper with an application program to characterize the Itanium memory hierarchy
• Using HP Caliper to measure performance data related to translation lookaside buffers (TLBs)
You can also read these technical reports about the microarchitecture used in HP Integrity servers:
• Dual-Core Update to the Intel® Itanium® 2 Processor Reference Manual for Software
Development and Optimization, Document Number 308065-001.
• Intel® Itanium® 2 Processor Reference Manual for Software Development and Optimization,
Document Number 251110-003.
• Introduction to Microarchitectural Optimization for Intel Itanium 2 Processors Reference Manual,
Document number 251464-001, Intel Corporation, 2002.
• Itanium 2 Processor Microarchitecture, Cameron McNairy and Don Soltis, IEEE Micro, IEEE
Computer Society, March-April 2003, pages 44-55.
• A Methodology for using the Intel Itanium 2 performance counters for bottleneck analysis,
Sverre Jarp, Hewlett-Packard Laboratories, August 2002.
• Performance Profiling for Fun and Profit, Jim Callister and Susith Fernando of Intel Corporation
and Stephane Eranian and David Mosberger of Hewlett-Packard Company, 24 May 2005.
HP Encourages Your Questions
You can get help with using and understanding HP Caliper by sending email to the HP Caliper
development team. Please send questions to caliper-help@cup.hp.com.
You can also see the HP Caliper Technical Support Web page.
16
Page 17

1 HP Caliper at a Glance
What is HP Caliper?
HP Caliper is a general-purpose performance analysis tool for applications on HP-UX and Linux
systems running on HP Integrity Servers. HP Caliper allows you to understand the performance
and execution of your application and to identify ways to improve its run-time performance.
HP Caliper works with any native Integrity Server application. It does not require special compilation
of the program being analyzed and does not require any special link options or libraries. HP
Caliper supports programs compiled with any compiler option.
HP Caliper provides ways to:
• Measure the overall performance of a program
• Identify performance parameters of specific functions in a program
• Guide you in optimizing the performance of a program based on its specific execution profile
HP Caliper has two user interfaces:
• Graphical user interface (GUI)
• Command-line interface (CLI)
These two interfaces are part of the same product. You can mix-and-match your use of the GUI
and the command line.
The GUI can run either natively (locally) on the HP-UX or Linux Integrity server that HP Caliper is
running on, or remotely on a Windows x86 or Linux x86 desktop system.
HP Caliper operates in these modes:
• Data collection
• Report generation
• Performance analysis
The data collection output is saved automatically in a database for possible use later. Report
generation can be done in the data collection run or in separate report generation runs later.
The output data is delivered in multiple report formats, with source and assembly code, and
explanatory help text.
Figure 1 shows the HP Caliper components.
What is HP Caliper? 17
Page 18
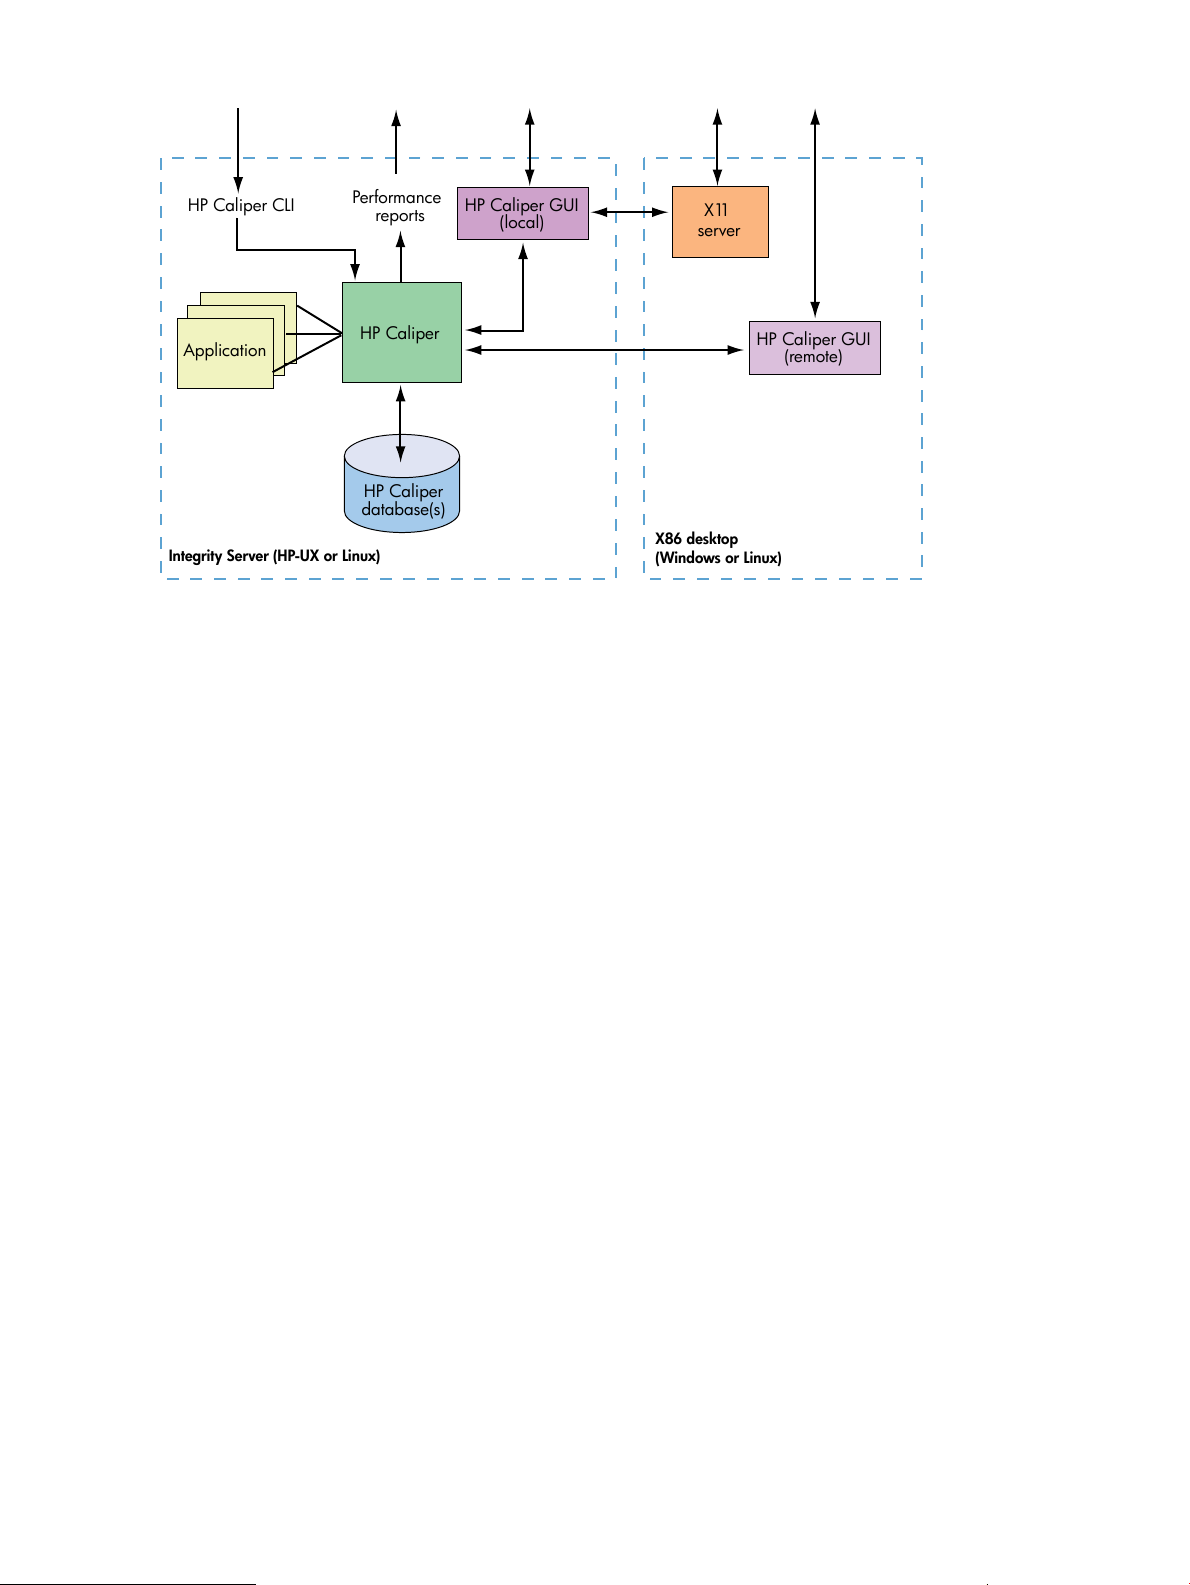
Figure 1 HP Caliper Components (User Interfaces)
HP Caliper CLI
Performance
reports
HP Caliper
database(s)
Integrity Server (HP-UX or Linux)
X86 desktop
(Windows or Linux)
Application
HP Caliper
HP Caliper GUI
(local)
HP Caliper GUI
(remote)
X11
server
HP Caliper selectively measures the processes, threads, and load modules of your application. HP
Caliper performs data collection in one of two modes:
• System-wide: In a system-wide measurement, HP Caliper measures activity across the entire
system, and attributes measurements to the kernel and individual processes where possible.
• Per-process: In a per-process measurement, HP Caliper tracks individual processes and their
children and measures each separately.
HP Caliper uses the performance monitoring unit (PMU) of the Itanium processor family to gather
the requested performance data. This is done primarily through non-intrusive sampling, both
time-based and event-based, as well as exact counts of particular metrics. HP Caliper provides
data on hundreds of events monitored by the PMU.
On HP-UX, it also uses dynamic instrumentation of code for some measurements. It only instruments
the portions of the application that actually get executed, thus eliminating unnecessary
instrumentation overhead.
Reports show measured data by thread, load module, function, statement, and instruction.
HP Caliper uses a single command (called caliper) for all measurements. You specify the type
of measurement and the target program as command-line arguments.
For example:
$ caliper myprog
This command uses a default measurement called scgprof to produce a sampled call graph
profile of the program myprog. The result of the measurement (the output) is saved automatically
in a database. The output database is called scgprof and is placed in a databases directory in
your current directory unless you specify otherwise.
By default, a text report describing the results of the measurement run is sent to stdout.
Using the HP Caliper GUI, you have access to all of HP Caliper's features and options using intuitive
menus and buttons.
HP Caliper has many types of preconfigured measurements that can be performed on a program.
For example, there are measurements to determine cache misses, stalls, and call graphs. You can
further customize your measurements by using HP Caliper options as parameters to the caliper
command.
18 HP Caliper at a Glance
Page 19

In general, HP Caliper runs do one of the following:
• Collect data
• Collect data and generate a report
• Generate a report based on previously collected data
• Analyze previously collected data
For the last item above, HP Caliper provides the HP Caliper Advisor, a rules-based expert system
designed to provide guidance about improving the performance of an application. Users can write
their own rules to analyze applications or use the default rules provided.
The latest version of HP Caliper is available on the HP Caliper home page at:
http://hp.com/go/caliper
What Does HP Caliper Run On?
Supported Hardware and Operating Systems
HP Caliper is supported on HP Integrity systems. HP Caliper does not measure programs compiled
for PA-RISC processors.
HP Caliper is supported on these operating systems:
• HP-UX 11i v2 or later
• Linux version 2.6: RedHat4, Debian 3.0, and SuSE Enterprise Linux 9
HP Caliper can be used in an Integrity Virtual Machine environment on a guest system.
Supported Compilers and Application Environments
On HP-UX, HP Caliper is formally supported for HP C/aC++ and HP Fortran. (These are also the
compilers it is bundled with.) HP Caliper measures code generated by these native and cross
compilers, including inlined functions and C++ exceptions. Instrumentation-based measurements
will only work on applications compiled on these compilers.
On Linux, HP Caliper has been primarily validated with code produced with gcc and g++, and
minimally tested with code produced from the Intel icc compiler.
HP Caliper can generally be used on:
• Programs compiled using HP, Intel, and GNU compilers, with and without optimization.
• Assembly and Java programs.
• Stripped programs, and programs compiled with optimization or debug information or both.
This includes support for both the +objdebug and +noobjdebug options.
• Both ILP32 (+DD32) and LP64 (+DD64) programs, both 32-bit and 64-bit ELF formats.
• Archive-, minshared- or shared-bound executables.
• Single-process and multiprocess applications.
• Single-threaded and multithreaded applications, including MxN threads.
• Applications that fork or vfork or exec themselves or other executables.
• Shell scripts and the programs they spawn.
• Main, static, and dynamic shared libraries.
• Entire run, partial run, and server/daemon programs.
What Does HP Caliper Run On? 19
Page 20

Summary of HP Caliper Features
HP Caliper's most important features include the following:
• Performance data is automatically saved in databases, which you can use to generate reports
without having to remake the measurements. Multiple databases can also be combined for
aggregated results.
• All reports are available in text format and comma-separated-value (CSV) format for use with
spreadsheets.
• The HP Caliper GUI can be used to set up measurements, initiate measurement runs, and
interactively explore collected performance data.
• Performance data can be correlated to your source program by line number.
• You can include or exclude specific load modules, such as libc, when measuring performance.
• Both per-thread and aggregated thread reports are available for most measurements.
• Performance data can be reported by function, sorted to show hot spots.
• You can perform per-process and system-wide measurements, for user or kernel space. The
system-wide measurement data can be attributed to the kernel, processes, or processes and
modules, or not attributed.
• Multiprocess selection capabilities are provided.
• Limited support for dynamically generated code is provided.
• Disassembly listings (template types, symbolic branch targets, branch targets as function offsets,
optional marked branch target instructions) are provided.
• Support for command-line options from a file is provided.
• The ability to attach and detach to running processes for certain measurements is provided.
• You can use the Advisor expert system to analyze applications, using either the default rules
or rules you write yourself.
• On HP-UX, you can restrict PMU measurements to specific regions of your program.
• On HP-UX, there is full support for AAS executables (applications using Adaptive Address
Space).
20 HP Caliper at a Glance
Page 21

2 Getting Started with the HP Caliper Command-Line
Interface
This chapter provides some example programs to show you how to get started using the HP Caliper
command-line interface. The programs are chosen for illustration purposes and are not necessarily
representative of programs you might actually want to analyze.
Example: Running fprof on a Short Program, with Default Output
HP Caliper provides many types of performance measurements. You typically specify which type
of measurement to perform by the first argument to the caliper command.
A good measurement to start with is fprof (flat profile), which will show you the parts of your
application that have the highest CPU usage. When you specify fprof, HP Caliper samples your
application's instruction pointer (IP) at regular intervals (every 500,000 CPU cycles by default)
and reports which functions and source lines incurred the most IP sample hits. Because HP Caliper
uses samples, rather than precise counts, measurement intrusion is kept to a minimum.
To illustrate, let us collect fprof data on a run of an example program called matmul. First, we
will compile matmul with full optimization enabled:
$ /opt/ansic/bin/cc -Aa +O3 -o matmul matmul.c
Now we will have HP Caliper collect performance data for one run of matmul:
$ caliper fprof ./matmul
Once matmul exits, HP Caliper writes a text report to stdout (by default) as shown in
Figure 2 (page 22).
The numbers (which are bold in the PDF version of this guide) are annotations to explain the
report—they are not part of the output you receive. See the list at the end of the report for the
explanations.
Example: Running fprof on a Short Program, with Default Output 21
Page 22

Figure 2 fprof Measurement Report for matmul, with Default Report Output
================================================================================
HP Caliper 4.3.0 Report Summary for Flat Profile
================================================================================
Collection Run 1: (Flat Profile)
2
---------------------------------
Processor Information
3
Machine name: fitzroy
Number of processors: 4
Processor type: Itanium2 9M
Processor speed: 1600 MHz
Virtual machine: no
Run Information
4
Configuration: /opt/caliper/config/fprof
Date: May 05, 2007
Version: HP Caliper - HP-UX Itanium Version 4.3.0 (2007-05-05)
OS: HP-UX B.11.23 U ia64
Database: /home/meagher/.hp_caliper_databases/fprof
Measurement scope: per-process
1
Sampling Specification
5
Sampling event: CPU_CYCLES
Sampling period: 500000 events
Sampling period variation: 25000 (5.00% of sampling period)
Sampling counter privilege: user (user-space sampling)
Data granularity: 16 bytes
Data sampled: IP
--------------------------------------------------------------------------
Metrics Summed for Entire Run
6
---------------------------------------------- PLM
Event Name U..K TH Count
----------------------------------------------CPU_CYCLES x___ 0 659001879
BACK_END_BUBBLE.ALL x___ 0 99866365
BE_EXE_BUBBLE.GRALL x___ 0 1244270
----------------------------------------------PLM: Privilege Level Mask
U/K = user/kernel levels (U: level 3, K: level 0)
The intermediate levels (1, 2) are unused on HP-UX or Linux
x : the metric is measured at the given level (_ : not measured)
TH: event THreshold, determines the event counter behavior,
TH == 0 : counter += event_count_in_cycle
TH > 0 : counter += (event_count_in_cycle >= threshold ? 1 : 0)
----------------------------------------------% of Cycles lost due to stalls (lower is better):
15.15 = 100 * (BACK_END_BUBBLE.ALL / CPU_CYCLES)
% of Cycles stalled due to GR/GR or GR/load dependency (lower is better):
0.19 = 100 * (BE_EXE_BUBBLE.GRALL / CPU_CYCLES)
-----------------------------------------------
Process Summary
7
------------------------------------------% Total Cumulat
IP % of IP
Samples Total Samples Process
-------------------------------------------
100.00 100.00 1319 matmul (pid: 6991)
------------------------------------------[Minimum process entries: 5, percent cutoff: 2.00, cumulative percent cutoff: 100.00]
------------------------------------------================================================================================
Flat Profile Report for matmul
8
================================================================================
Target Application
9
Program: /home/meagher/matmul
Invocation: ./matmul
Process ID: 6991 (started by Caliper)
Start time: 09:31:37 AM
End time: 09:31:38 AM
Termination Status: 1
Last modified: May 5, 2007 at 09:09 AM
Memory model: ILP32
Processor set: default
22 Getting Started with the HP Caliper Command-Line Interface
Page 23

Target Execution Time
10
Real time: 0.428 seconds
User time: 0.415 seconds
System time: 0.008 seconds
Sampling Specification
11
Number of samples: 1319
Data sampled: IP
Metrics Summed for Entire Run
12
---------------------------------------------- PLM
Event Name U..K TH Count
----------------------------------------------CPU_CYCLES x___ 0 659001879
BACK_END_BUBBLE.ALL x___ 0 99866365
BE_EXE_BUBBLE.GRALL x___ 0 1244270
----------------------------------------------PLM: Privilege Level Mask
U/K = user/kernel levels (U: level 3, K: level 0)
The intermediate levels (1, 2) are unused on HP-UX or Linux
x : the metric is measured at the given level (_ : not measured)
TH: event THreshold, determines the event counter behavior,
TH == 0 : counter += event_count_in_cycle
TH > 0 : counter += (event_count_in_cycle >= threshold ? 1 : 0)
----------------------------------------------% of Cycles lost due to stalls (lower is better):
15.15 = 100 * (BACK_END_BUBBLE.ALL / CPU_CYCLES)
% of Cycles stalled due to GR/GR or GR/load dependency (lower is better):
0.19 = 100 * (BE_EXE_BUBBLE.GRALL / CPU_CYCLES)
-----------------------------------------------
Load Module Summary
13
----------------------------------------------% Total Cumulat
IP % of IP
Samples Total Samples Load Module
-----------------------------------------------
96.97 96.97 1279 matmul
2.88 99.85 38 libc.so.1
0.15 100.00 2 dld.so
-----------------------------------------------
100.00 100.00 1316 Total
-----------------------------------------------
Function Summary
14
------------------------------------------------------------------------% Total Cumulat
IP % of IP
Samples Total Samples Function File
-------------------------------------------------------------------------
96.97 96.97 1279 matmul::main matmul.c
2.88 99.85 38 libc.so.1::rand rand.c
------------------------------------------------------------------------[Minimum function entries: 5, percent cutoff: 0.10, cumulative percent cutoff: 100.00]
Function Details
15
--------------------------------------------------% Total Line|
IP IP Slot| >Statement|
Samples Samples Col,Offset Instruction
---------------------------------------------------
96.97 [matmul::main, 0x40009a0, matmul.c]
1279 ~38 Function Totals
----------------------------------------- [/home/meagher/matmul.c]
34 ~16 > mata[i][j] = matb[i][j] = (float) rand() ;
1 ~28 > for (k = 0 ; k < INDEX ; k++) {
1244 ~29 > matres[i][j] =
---------------------------------------------------
2.88 [libc.so.1::rand, 0x4119f60, rand.c]
38 ~57 Function Totals
----------------------------------------- [File not found: /ux/libsobj_i380em/libs/libc/shared_em_32/obj/../../../
../../core/libs/libc/shared_em_32/../core/gen/rand.c]
16
---------------------------------------------- 4 ~57 >
11 ~61 >
18 ~77 >
Example: Running fprof on a Short Program, with Default Output 23
Page 24

3 ~83 >
--------------------------------------------------[Minimum function entries: 0, percent cutoff: 1.00, cumulative percent cutoff: 100.00]
1
HP Caliper 4.3.0: Report Summary for Flat Profile: The heading for the report, including
the HP Caliper version number and the measurement (Flat Profile).
2
Collection Run 1: (Flat Profile): The heading for the run.
3
Processor Information: Information about your processor.
4
Run Information: Information about the run.
5
Sampling Specification: Information about what was being measured.
6
Metrics Summed for Entire Run: Metrics for the entire run are summed:
• CPU_CYCLES is the number of elapsed processor cycles. (CPU_CYCLES is known as
CPU_OP_CYCLES.ALL on the Integrity servers dual-core Itanium 2 and Itanium 9300
quad-core processors.)
• BACK_END_BUBBLE.ALL is full pipe bubbles in the main pipe.
• BE_EXE_BUBBLE.GRALL is full pipe bubbles in the main pipe due to execution unit stalls.
7
Process Summary:
8
Flat Profile Report for matmul: This is a low-level report for the single process that is measured
for this collection run.
For each collection run, one low-level report is produced for each process. A low-level report
can be: data for a single process, data for a group of “matching” processes, or a
module-centric view of all processes.
9
Target Application: Information about your application.
10
Target Execution Time: How long the run took.
11
Sampling Specification: Information about what was being measured.
12
Metrics Summed for Entire Run: Metrics for the entire run are summed. CPU_CYCLES is the
number of elapsed processor cycles. (CPU_CYCLES is known as CPU_OP_CYCLES.ALL on
the Integrity servers dual-core Itanium 2 and Itanium 9300 quad-core processors.)
BACK_END_BUBBLE.ALL is full pipe bubbles in the main pipe. BE_EXE_BUBBLE.GRALL is
full pipe bubbles in the main pipe due to execution unit stalls.
13
Load Module Summary:
• % Total IP Samples: Percent of the total IP samples attributable to a particular load
module.
• Cumulat % of Total: Running sum of the percent of total IP samples account for by the
particular load module and those listed above it.
• IP Samples: Total number of IP samples attributed to the particular load module.
14
Function Summary:
• % Total IP Samples: Percent of the total IP samples attributable to a particular function.
• Cumulat % of Total: Running sum of the percent of total IP samples account for by the
particular function and those listed above it.
• IP Samples: Total number of IP samples attributed to the particular function.
15
Function Details:
• % Total IP Samples: Percent of the total IP samples attributable to a particular function.
• IP Samples: Total number of IP samples attributed to the particular function.
24 Getting Started with the HP Caliper Command-Line Interface
Page 25

• Line | Slot | Col,Offset
The column contains one of these:
◦ A source-code line number for rows showing statements
◦ An instruction slot number for rows showing instructions not on a bundle boundary
◦ A source-code column number followed by an offset from the beginning address
of a function for rows showing instructions on a bundle boundary
• >Statement | Instruction: The column contains either a source statement, preceded by
“>”, or a disassembled instruction. Statements that are out of order due to optimization
are preceded by “*>”.
16
“File not found” error: Here, the application called a routine in libc, but the source code
for that library routine is not available. This is a common error and you can usually ignore
it.
Example: Adding Instructions to an fprof Report
Notice that, by default, only source statements were shown in the Function Details section. If you
would also like to see disassembled instructions, then you can re-report the collected data using
the -r option. The -r option takes one of the following qualifiers: statement (report source
statements), instruction (report disassembled instructions), or all (report both source and
instructions).
HP Caliper saves the latest collected data and uses that by default when generating a report. It
does not re-run the application and collect new data.
We will also specify an output file using the -o option:
$ caliper fprof -o out.txt -r all
In the resulting report output file (out.txt), you will find an fprof report that shows IP sample
counts down to the instruction level. “fprof Measurement Report for matmul, with IP Sample Counts
for One Function” (p. 26) shows a section of the report that contains IP sample counts for one
function.
The numbers (which are bold in the PDF version of this guide) are annotations to explain the
report—they are not part of the output you receive. See the list at the end of the report for the
explanations.
Example: Adding Instructions to an fprof Report 25
Page 26

Figure 3 fprof Measurement Report for matmul, with IP Sample Counts for One Function
Function Details
--------------------------------------------------% Total Line|
IP IP Slot| >Statement|
Samples Samples Col,Offset Instruction
---------------------------------------------------
96.88 [matmul::main, 0x40009a0, matmul.c]
1275 ~38 Function Totals
------------------------------------------
3
[/home/meagher/matmul.c]
4
(32) ~16 *> mata[i][j] = matb[i][j] = (float) rand() ;
~9,0x0280:0 M nop.m 0
:1 M nop.m 0
:2 F_(p6) fcvt.xf f6=f6 ;;
5
2 ~9,0x0290:0 M nop.m 0
:1 M nop.m 0
:2 F_ fma.s f6=f6,f1,f0 ;;
~9,0x02a0:0 M stfs [r47]=f6,4
:1 M stfs [r48]=f6,4
:2 B_ br.call.sptk.many rp=b7 ;;
6
~ ~ ~ ~ ~ ~ ~ ~
~9,0x02e0:0 M nop.m 0
:1 M nop.m 0
:2 F_(p6) fcvt.xf f6=f6 ;;
4 ~9,0x02f0:0 M nop.m 0
:1 M nop.m 0
:2 F_ fma.s f6=f6,f1,f0 ;;
~9,0x0300:0 M stfs [r47]=f6,4
:1 M stfs [r48]=f6,4
:2 B_ br.call.sptk.many rp=b7 ;;
.
.
.
.
---------------------------------------------------
3.04 [libc.so.1::rand, 0x4119f60, rand.c]
40 ~57 Function Totals
------------------------------------------
1
2
1
Identifies the function (main) for which disassembly is shown. Specifies the function's load
module (matmul), starting address (0x40009a0), and source file (matmul.c.
2
Shows total IP sample hits (1275) and starting line number (38) for the function. A tilde (~)
preceding a line number (~38) indicates that the line number is approximate due to
optimization.
3
Names the source file of function main.
4
Shows sample IP hits (41) for statement at line 16 (~ indicates the line number is approximate
due to optimization) of matmul.c. Sample IP hits for statements are shown in parentheses;
sample IP hits for instructions are not.
Source lines are preceded by >. If a source line is out of order or is associated with multiple,
noncontiguous instructions, the source line is also preceded by an asterisk (*>).
5
Shows sample IP hits (4) for the instruction bundle starting at function offset 0x0290, where
the associated source column is ~9 (~ indicates the source column is approximate due to
optimization). Instructions are preceded by template information: in this case, M for slot 0 and
slot 1, and F_ for slot 2.
6
Shows a discontinuity marker, which indicates that some instruction bundles without associated
data have been left out of the report. (To report all disassembly, use the --context-lines
option.)
26 Getting Started with the HP Caliper Command-Line Interface
Page 27

Types of Measurements
HP Caliper is capable of three types of performance measurement:
• A global measurement of total run metrics
• A sampled measurement based on the granularity you specify
• A precise measurement of every execution path in your code (HP-UX only)
See Table 1 (page 44).
Global Measurement
A global measurement gives you a single value for a specific metric of your program, such as total
CPU time used.
The only global measurement available in HP Caliper is ecount (total CPU time).
A global measurement is best used for:
• Comparing the effect of different types of test data that your program processes
• Comparing the benefits of different compile-time optimization settings
• Detecting performance regressions caused by program modifications
You can use a global measurement to help you identify what performance areas of your program
to investigate further.
The advantage of a global measurement is that it does not affect your program's performance.
The disadvantage of a global measurements is that it does not identify specific parts of your program
that might benefit from optimization.
Sampled Measurements
A sampled measurement measures your program's performance at regular intervals, based on
CPU events, recording the current program location and selected performance metrics.
A sampled measurement is best used for:
• Identifying where your program is spending time
• Identifying approximately where events such as cache misses occur
• Determining the performance effect and location of branch mispredictions
You can use sampled measurements to focus your analysis on specific parts of your program.
The advantage of sampled measurements is that they can help you localize performance issues in
your program.
The disadvantage is that they might miss very fast, seldom-called code. You might need to adjust
HP Caliper settings, such as the sampling frequency, to help locate events in your code.
Sampled measurements also require more resources, such as system memory, which might affect
the run-time performance of your program or limit the amount of information you can collect.
You can control the tradeoff between resource usage and accuracy of the results by changing the
sample interval.
Precise Measurements
A precise measurement gives you exact information about what is happening and where events
are happening in your program. When you use a precise measurement, HP Caliper dynamically
instruments your binary program while it is running to enable the collection of information.
Types of Measurements 27
Page 28

Precise measurements are best used for:
• Identifying the most and least used functions in your program
• Identifying all the branch paths executed in the program
Collecting precise measurements requires more system resources than sampled measurements.
Collecting precise measurements also affects the performance of the program being measured.
The performance effects may vary from a few percent to 300 percent, depending on how much
measurement you request. These performance effects mean that programs making assumptions
about the running time of their code might behave differently when run under HP Caliper.
What to Look for in Using HP Caliper
A useful approach for tuning performance is to start with easy-to-perform global measurements to
identify likely areas for tuning. Then you can use more specific measurements on areas of concern.
For example, you might start by making global measurements on a variety of events, such as:
• CPU cycles
• Instruction execution counts
• Data cache misses
• Instruction cache misses
• Branch mispredictions
The results of the global measurements will quickly identify which factors most affect your program's
performance.
The next step is to make sampled measurements on the top performance factors you have identified.
You can vary the sample rates to find the approximate location of the problem or problems. Usually,
this is sufficient to locate trouble spots.
You can also focus on hot spots. A hot spot is an instruction or set of instructions that has a higher
execution count than most other instructions in a program. For example, code that is inside a loop
will likely be executed more times than straight-line code. Usually the “hotness” is measured with
CPU cycles, but it could also be measured with metrics such as cache misses.
When tuning performance, you first focus on hot spots because a small change in a hot spot,
multiplied by its higher execution frequency, produces a larger improvement than making the same
change in an instruction that is rarely executed.
Here are some useful things to look for in a report:
• If the percent of cycles lost due to stalls (in the Metrics Summed for Entire Run) is high—greater
than 50 percent—the program's performance could probably be improved.
• Although the values in the IP Samples column of the Function Details do not represent actual
execution counts, you can still use the values as a relative ranking of how often particular lines
are executed. The IP Samples values will vary slightly with each run, but they can help you
identify which parts of your code have the most effect on your application's performance.
Syntax for caliper Command
The basic command-line syntax for making measurements with HP Caliper is:
caliper measurement [caliper_options] program [program_arguments]
where:
measurement The name of a measurement that contains information about what you
want HP Caliper to measure and report.
For more information, see “HP Caliper Measurement Configuration
Files” (p. 43).
28 Getting Started with the HP Caliper Command-Line Interface
Page 29

caliper_options Parameters used to customize the performance analysis.
For more information, see “HP Caliper Options” (p. 48).
program The name of the executable program you want HP Caliper to measure.
program_arguments Any number of arguments expected by your executable.
You can use an options file to specify command-line information, including the measurement,
options, program, and program arguments. See “-f or --options-file” (p. 50) for details.
For more information, see “Configuring HP Caliper ” (p. 92).
Basic Tasks: A Quick Reference
Here is a list of basic tasks and the HP Caliper commands you can use to perform them.
Starting HP Caliper
Once installed, the easiest way to access HP Caliper is to type caliper. For example:
$ caliper myprog
This runs the default measurement, scgprof, on your program in your current directory and
produces a text report to stdout. To run another measurement, just type it:
$ caliper fcount myprog
Stopping HP Caliper
To stop HP Caliper before it finishes measuring your program, enter Ctrl-C, or from another
process use this command:
$ kill -s INT caliper_process_ID
Either of these methods stops the measurement run. HP Caliper then processes the data collected
up to the point where it was stopped and generates a report. There could be a significant delay
before the HP Caliper process terminates.
To stop HP Caliper immediately, without generating data, use this command:
$ kill -s TERM caliper_process_ID
CAUTION: If HP Caliper is measuring processes using instrumentation on HP-UX (that is, generating
a precise measurement), stopping HP Caliper will cause it to forcibly terminate all processes that
are being measured. Any resources used by the processes, such as shared memory segments,
temporary files, and so forth, will not be cleaned up.
For PMU-only measurements, HP Caliper will simply detach from the processes and stop. The
processes will continue normally.
Showing HP Caliper Options
For HP Caliper short help, including a list of the most commonly used options and measurements,
use:
$ caliper -h
For HP Caliper long help, use:
$ caliper -H
Creating a Call Graph Profile with HP Caliper
To create a call graph profile with HP Caliper, use either of these commands:
$ caliper scgprof [caliper_options] program [program_arguments]
or
$ caliper cgprof [caliper_options] program [program_arguments]
Basic Tasks: A Quick Reference 29
Page 30

The first command produces a call graph by sampling. The second command (on HP-UX only)
produces an exact call graph. They both produce an enhanced gprof-like output.
Creating a Text Report for Analysis
To save the report produced by HP Caliper to a file, specify an output file name:
$ caliper measurement -o filename [caliper_options] program [program_arguments]
Creating a Report Based on Your Collected Data
By default, HP Caliper saves the results of a measurement to a database. This allows you to generate
reports with different settings without having to re-run your application.
To create reports based on the database, specify the caliper report command and the report
options you want to use. For example, the following command creates a report based on the last
database you created:
$ caliper report [caliper_report_options]
For more information, see “How HP Caliper Saves Data in Databases” (p. 115).
Using the HP Caliper Advisor
One way to get started using HP Caliper quickly is to use the HP Caliper Advisor. See “Using the
HP Caliper Advisor” (p. 77).
Restrictions on Using HP Caliper
Some restrictions are:
• When HP Caliper detaches from a process, it can affect the I/O relationship between the user
and that process. An example is an application that reads stdin from the user; e.g., caliper
ecount top If HP Caliper is sent a SIGINT (or the --duration option is given), it will
detach from the 'top' process, which will break the I/O between the user and 'top'. Text typed
into the terminal window will no longer be sent to the 'top' process, and the curses library
used by 'top' will break the stty settings in the terminal window.
• Shared library support does not include instrumented measurements ( cgprof, and fcount
measurements) of the dld.so and uld.so system libraries.
• It is not possible to debug an application while it is being measured by HP Caliper.
• These measurements measure and report only aggregated results of multithreaded programs:
ecount•
• fcount
• fcover
• HP Caliper only measures native Integrity servers programs, not PA-RISC programs running
in emulation mode.
• HP Caliper might not be able to measure handwritten assembly code that performs address
arithmetic or does not follow the standard run-time conventions.
• HP Caliper cannot make measurements for dynamically generated code with these
measurements:
• cgprof
• fcount
• fcover
30 Getting Started with the HP Caliper Command-Line Interface
Page 31

Additional HP Caliper Commands
In addition to the caliper measurement command, there are three more HP Caliper commands
you can use. For information about these commands, including required syntax, see the references
below:
• caliper info
Displays reference information about the CPU counters or reports. See “How to Display
Reference Information About CPU Counters or HP Caliper Report Types” (p. 102).
• caliper report | merge | diff
Creates a report from an HP Caliper database. See “Creating Reports from Multiple Databases”
(p. 116).
• caliper advise
Invokes the HP Caliper Advisor, a rules-based expert system to give guidance about improving
the performance of an application. See “Using the HP Caliper Advisor” (p. 77).
Getting Information About HP Caliper
You can get more information about HP Caliper in these ways:
• An HP Caliper man page is provided. Type: man caliper
• To get short help text, type caliper -h or caliper -?.
To get long help text, type caliper -H or caliper --help.
• To get help in the HP Caliper GUI, in the Help menu, select:
Help Contents for reference help◦
◦ Context-sensitive Help for context-sensitive help
• Useful information is available in the HP Caliper home directory. The default HP Caliper home
directory is /opt/caliper/ on HP-UX and /opt/hp-caliper/ on Linux:
◦ Documentation is located in the doc subdirectory.
◦ The doc/text subdirectory contains the help files for the textual report descriptions and
other useful information.
◦ Example files are located in the examples subdirectory.
• You can find the most recent software and information on the HP Caliper Web site at:
http://hp.com/go/caliper
Additional HP Caliper Commands 31
Page 32

3 Getting Started with the HP Caliper GUI
In addition to the command-line interface, HP Caliper supports a full-featured, intuitive graphical
user interface (GUI). This chapter describes how to get started using the GUI.
For information on the command-line interface, see Chapter 2 (page 21).
What Is the HP Caliper GUI?
The GUI has the same underlying measurement technology and capabilities as the command-line
interface. With the GUI, however, you can dynamically interact with HP Caliper. Using the GUI,
you can:
• Set up and save specifications for collecting data
• Initiate measurement runs
• Graphically explore performance data after it has been collected
• Manage your collection specifications and performance databases
The HP Caliper GUI and command-line interface are part of the same product; only the user
interfaces are different. You can mix-and-match your use of the GUI and the command line. For
example, you can make a measurement and graphically explore the collected data with the GUI,
then generate a printable text report from the same data with the command line. Or, you can use
the command-line HP Caliper within your build script and later explore the performance results
using the GUI.
The HP Caliper GUI is an Eclipse RCP application. The GUI is actually a separate program that
communicates with the command-line HP Caliper. The GUI can run either natively (locally) on the
HP-UX or Linux Integrity server that HP Caliper is running on, or remotely on a Windows x86 or
Linux x86 desktop system. The GUI uses the native “look and feel” of the platform it is run on.
Although the HP Caliper GUI looks different on different systems, the functionality and operation
are identical.
Figure 4 shows an example of what the GUI looks like.
See the following for help in getting started:
• “Window Basics” (page 32)
• “Making Measurements” (page 39)
• “Exploring Performance Data” (page 40)
• “Getting Performance Tuning Advice” (page 40)
• “Getting Help” (page 41)
• “Starting the GUI” (page 41)
Window Basics
The main window of the HP Caliper GUI is divided up into views. A view is a tabbed page that
groups related tasks. These views and their icons are:
• Projects view
• Collect view
• Analyze view
• Advisor view
• Console view
32 Getting Started with the HP Caliper GUI
Page 33

• Diagnostics view
• Help view
As is typical of most GUIs, the HP Caliper GUI lets you reconfigure, resize, and reposition all of
the views to suit your needs. Views that are not currently needed can be closed (and reopened
when needed) to make more room for others.
Here is an example of the GUI window showing most of the views, slightly rearranged from their
default locations:
Figure 4 HP Caliper GUI
Projects View
The Projects view helps you manage your performance information by storing it in projects. A
project consists of one or more folders and can contain two types of information:
• Collection specifications
• Measurement runs
A project is stored in a directory called a workspace.
A collection specification, represented by , is all the information used to make a measurement.
A measurement run folder, represented by , contains information about the types of data available
for a single measurement run. It can also contain the collection specification used to collect the
data in the folder. This allows you to easily rerun a measurement.
You can save collection specifications without collecting data by selecting the menu item File→Save
Collection Specification As. Collection specifications saved separately from collection runs are
stored in a folder in your project. This folder is called Saved Collection Specifications, represented
by .
A dataset is a set of performance data collected by a single HP Caliper measurement run. Examples
of datasets are: Run Summary, Memory Usage, Process Tree, Histogram, Call Graph, and so forth.
Window Basics 33
Page 34

Each HP Caliper measurement run produces several datasets. These datasets are shown in the
Projects view for each run.
The figure below shows the Projects view:
Figure 5 Projects View
Collect View
The Collect view allows you to set up and make performance measurements. It consists of a series
of tabbed pages (which are not themselves views) containing all the information needed to run
your application and all the measurement parameters that you can control. By default, the Collect
view appears to the right of the Projects view, overlaying the Analyze and Advisor views.
You can traverse the Collect view tabs using Next and Previous buttons (which skip tabbed pages
that do not apply to a given measurement), or you can select tabs directly. Required fields are
typically indicated by red labels, and the Start button (for starting the measurement) becomes active
when you have provided all required information.
The figure below shows the Collect view with the Target tab selected:
34 Getting Started with the HP Caliper GUI
Page 35

Figure 6 Collect View
Analyze View
The Analyze view lets you explore the performance data you collect. When displayed, the Analyze
view is located, by default, to the right of the Projects view, overlaying the Collect and Advisor
views. Any performance data you have available for viewing is shown in the Projects view.
To open the Analyze view, double-click a performance data icon of interest in the Projects view.
When you double-click additional icons belonging to the same measurement run, new tabbed
pages are opened up in the Analyze view to show the data.
The name given to the Analyze view is that of the measurement run for which data is shown. You
can open multiple Analyze views, one for each measurement run shown in the Projects view.
Multiple types of data are shown in the Analyze view in tabbed pages with the following names:
Process Tree, Memory Usage, CPU Metrics, CPU EventsHistogram, Call Graph, and Call Stack
Graph.
The figure below shows the Analyze view with the Histogram tab selected. Notice that the name
of the Analyze view in the figure is “Sampled Call Graph Run (fitzroy, 5/22/06 7:58 PM),” which
indicates the type of data collected, the system it was collected on, and the time and date it was
collected.
Window Basics 35
Page 36

Figure 7 Analyze View
Advisor View
The Advisor view contains a set of suggestions for improving the performance of your application
based on the data collected so far.
When displayed, the Advisor view is located, by default, to the right of the Projects view, overlaying
the Collect and Analyze views.
To open the Advisor view, click on the Generate Advice button or toolbar choice. This will
analyze the collected data and produce advice output.
The figure below shows the Advisor view:
36 Getting Started with the HP Caliper GUI
Page 37

Figure 8 Advisor View
Console View
The Console view displays any output your application writes to standard output and standard
error streams. You can also use the Console view to provide any input your application expects
to read from standard input. The Console view is below the Collect view, by default, and is visible
when your application is being measured.
The figure below shows the Console view:
Figure 9 Console View
Window Basics 37
Page 38

Diagnostics View
The Diagnostics view contains any warning messages that HP Caliper might generate when
measuring your application or retrieving its performance data for viewing. By default, this view
overlays the Console view at the bottom of the GUI window. Any errors produced will appear in
popup dialogs.
The figure below shows the Diagnostics view:
Figure 10 Diagnostics View
Help View
The Help view contains classic help information on how to use the GUI, what to do next, what the
measurements mean, and so forth. This view appears on either the right side of the GUI window
or in its own window, depending on the type of help requested.
The figure below shows the Help view:
Figure 11 Help View
38 Getting Started with the HP Caliper GUI
Page 39

Tips for Using Views
All views have the following features:
• Each view has its own Maximize and Minimize buttons (top right), and many views have their
own pull-down menus (also top right).
• Double-clicking a view's tab causes the view to take up the entire GUI window. Double-clicking
a view's tab a second time returns it to its previous size and restores the previous GUI layout.
This feature is particularly useful when viewing performance data.
• Any view can be moved out of the main window of the GUI.
Motif, however, does not support this, so this feature is not available when running the GUI
natively on HP-UX.
To move a view out of the main window, press and hold mouse button 1 over a view's tab,
drag the view out of the main window, and release mouse button 1. You can return the view
to the main window by again dragging the view (using the view's tab) back to the main
window.
• You can retrieve views you have closed by selecting Window→Show View. To restore all
views to their default state, select Window→Reset View Locations.
Making Measurements
The HP Caliper GUI guides you in selecting what measurement you would like to make and in
setting all of the associated measurement parameters. There are defaults for all parameters, which
are sufficient for most applications. You use the Collect view to set up and control measurement
runs.
Making a measurement is often as simple as entering the application’s name and arguments on
the Target page of the Collect view, selecting the type of measurement you wish to make on the
Measurement page, and clicking on the Start button.
The GUI also allows you to attach to existing processes to make measurements. You can also
perform system-wide measurement of all processes and the kernel.
Hints on How to Make Measurements
Here is some general advice for making measurements:
• Start with the Target page of the Collect view and use the Next and Previous buttons to navigate
through the Collect view's other tabbed pages. The Next and Previous buttons will skip pages
that are not appropriate for a given measurement or a given processor. (Alternatively, you
can select pages using their tabs. If the text on the tab is grayed out, then the page does not
apply to the given measurement.)
• In general, the Collect view does not allow you to enter information that is invalid. However,
you might give data that is inconsistent or might omit a mandatory setting. In this case, the
labels of affected data fields turn red, as do the tabs of affected pages, and the Start button
is disabled. Look for and correct any red fields.
• You can start a measurement run from any Collect view page as long as there are no fields
in error. There is no need to visit all of the tabbed pages. For the most part, you only need to
set parameters when you want to change their default values.
• An elapsed time meter (Collection running) is shown in the lower right corner of the GUI
window whenever a measurement is running. Only one measurement can be made at a time,
but while one is running you can set up the next measurement you wish to make or explore
already collected performance data.
Making Measurements 39
Page 40

• A measurement run will end whenever one of the following occurs:
The measured application completes.◦
◦ All the attached processes terminate.
◦ The measurement duration you set on the Target page expires.
◦ You select the Kill/Stop button.
The application program being measured will be terminated immediately if you select the Kill
button.
• When a measurement run completes, its performance data is automatically added to the
current project within the Projects view.
Exploring Performance Data
All of the performance measurement data listed in the Projects view is available for exploring in
the Analyze view. This includes data from measurement runs made using the GUI and performance
databases created by the command-line HP Caliper and imported into the GUI.
Each measurement run produces two or more datasets: Run Summary, Process Tree, Histogram,
Call Graph, Memory Usage, and so forth. These are grouped within a folder in the Projects view,
which is given a name appropriate to the measurement made.
The easiest way to view performance data is to expand the folder for the performance run (if it is
not already open) and double-click on the type of data to be displayed. This will cause an Analyze
view to be created and the selected data displayed on a tabbed page within that view. As you
double-click on other types of data within the same performance run, that performance data will
be displayed on other tabbed pages within the same Analyze view. Each measurement run will
get its own, separate Analyze view.
You can navigate through performance data by a combination of any of the following:
• Double-clicking on items to view them or to drill down to the next lower level of detail.
• Selecting using the right mouse button menu to choose from a set of data to view.
• Clicking on tabbed pages to select different types of data.
• Vertical and horizontal scrolling to see data too large to fit in the window.
Many of the performance data viewers also allow you to select which metrics gets graphed and
which metric to use for sorting the data elements.
The general rule of thumb is to start with the Projects view. Then, in the Projects view, select the
dataset to view. Then explore the selected performance data by navigating within the Analyze
view.
Getting Performance Tuning Advice
HP Caliper can analyze the collected performance data and give you advice about tuning your
application or suggest additional measurements which are relevant.
Once you have collected at least one set of performance data, click on the Generate Advice button
or toolbar choice. HP Caliper will analyze the data and open an Advisor view with its advice.
Every time you make another collection run, re-run the analysis to get updated advice.
40 Getting Started with the HP Caliper GUI
Page 41

Getting Help
Several forms of online help are available in the GUI:
• “Getting started” help
Select Help→Help Contents and then choose Getting Started.
• Dynamic/context help
Select Help→Context-sensitive Help or use the F1 key. This help provides detailed information
specific to the view that currently has focus.
• Reference help
Select Help→Help Contents. This help contains indexed and searchable copies of the HP
Caliper User Guide, all of the context-sensitive help, the HP Caliper for HP-UX Release Notes,
the HP Caliper for Linux Release Notes, and the Intel processor reference manuals.
• Tooltips
Every icon, action button, and page tab within the GUI includes a brief tooltip. As your mouse
hovers over one of these items, a short description of the item is displayed in a popup window.
Starting the GUI
There are two distinct but similar versions of the GUI client:
• Native (local) GUI: this GUI client runs on the HP-UX or Linux Integrity server that HP Caliper
is running on
• Remote GUI: this GUI client runs on a Windows x86 or Linux x86 desktop system
There will be a difference in both the “look and feel” and the responsiveness of the GUI, depending
on your network configuration and which client you use.
For either method, you will need to choose a workspace directory for your session, or let HP Caliper
create one for you (named workspace). With the native (local) GUI, HP Caliper will (by default)
place workspace in the directory where you are running HP Caliper. With the remote GUI,
workspace will be created in your username folder in the Documents and Settings folder.
Two subdirectories are created in the workspace directory:
• .metadata, containing information that the GUI needs as an Eclipse application
• Default_Project (native mode) or Default Project (client mode), which is a
placeholder project folder
Native (Local) GUI
This is the simpler method. At a shell prompt on the Integrity server where the measurements will
be made, enter:
$ caliper –g [--jre path]
This starts the GUI in its own X11 window. This window can be displayed directly on the server’s
console or on a remote system that supports the X11 Windows protocol. Optionally, you can
specify the path to the JRE to be used.
Remote GUI
For instructions on how to install the HP Caliper GUI on a Windows or Linux desktop system, see
the README file in the gui_clients subdirectory in the HP Caliper home directory.
Getting Help 41
Page 42

You will need to copy the appropriate GUI client (in the gui_clients subdirectory) to your
Windows or Linux desktop system and unpack it. Then, start the GUI from your desktop using the
following executable file. Invoke it from a shell prompt or double-click it in a folder:
• On Windows: Caliper.exe
• On Linux: Caliper
At startup, the GUI prompts you for the login information needed to connect it to the remote HP
Caliper server on the Integrity system where you want to make measurements. See Figure 12.
Figure 12 Login Screen
To connect to the remote system:
1. Enter the appropriate information for the Integrity server you want to make measurements on
and your username and password on that system. Check the Save password box to save your
password in a secure, encrypted form.
2. Make sure that the Caliper Path value is correct for your system.
3. By default, HP Caliper will execute the standard login scripts. If you do not want this to be
done or you have a unique set of login scripts to be run, then enter your information in Login
Scripts and check or uncheck the Execute Login Scripts box. You can list multiple login scripts,
separated by a comma.
4. Select the Login Protocol (SSH or rexec) that you wish to use for the connection. If you are not
sure, use the default.
5. Click on OK to connect to the Integrity server.
This information is saved in a login configuration for the next time you run the GUI client. Each
login configuration saves:
• The system to log onto
• Your username and (optionally) your password
• Any login scripts that you want executed at login time
• The login protocol
If any of the information is incorrect or if the connection cannot be made for some other reason,
you are notified with an error dialog.
You can use the Add/Delete System button to save multiple login configurations.
42 Getting Started with the HP Caliper GUI
Page 43

4 HP Caliper Measurement Configuration Files
Each run of HP Caliper uses a particular measurement, which you can specify in the command
line. Each measurement corresponds to a particular measurement configuration file supplied by
HP Caliper. The measurement configuration files contain variables that control the types of
measurements performed and the content of the reports.
You can perform all the HP Caliper measurements without looking at or even knowing about the
measurement configuration files, using the default settings in the files.
HP Caliper measurement configuration files are provided with the software kit and reside in the
HP Caliper home directory in the config subdirectory. (By default, the home directory is /opt/
caliper/ on HP-UX and /opt/hp-caliper/ on Linux.)
You can use these existing measurement configuration files or modify them or even create your
own measurement configuration files.
Measurement Configuration Files Provided with HP Caliper
The measurement configuration files provided with HP Caliper and the performance measurements
they take are shown below:
• alat
The alat measurement measures and reports sampled advance load address table (ALAT)
misses. The ALAT keeps track of speculative (that is, advance) loads. An excessive number of
ALAT compares that result in a failed advance load (an ALAT miss) can seriously degrade
performance. See “alat Measurement Report Description” (p. 171).
• branch
The branch measurement measures and reports sampled branch mispredictions. See “branch
Measurement Report Description” (p. 175).
• cgprof (HP-UX only)
The cgprof measurement measures and reports a call graph profile, produced by instrumenting
the application code. See “cgprof Report Description ” (p. 180).
• cpu (HP-UX only)
The cpu measurement measures and reports per-process metrics based on sampled CPU events.
See “Performing CPU Metrics Analysis ” (p. 153).
• cstack
The cstack measurement measures and reports a sampled call stack profile, produced by
periodically sampling the application program counter and each of its thread's call stacks.
See “Producing a Sampled Call Stack Profile Analysis” (page 134) and “cstack Measurement
Report Description” (page 186).
• cycles (Integrity Servers dual-core Itanium 2 processor and Itanium 9300 quad-core processor
only)
The cycles measurement measures and reports a flat profile of the instruction pointers (IPs).
See “cycles Measurement Report Description ” (p. 188).
• dcache
The dcache measurement measures and reports sampled data cache metrics. See “dcache
Measurement Report Description” (p. 193).
Measurement Configuration Files Provided with HP Caliper 43
Page 44

• dtlb
The dtlb measurement measures and reports sampled data translation lookaside buffer (TLB)
misses. See “dtlb Measurement Report Description” (p. 201).
• ecount
The ecount measurement measures and reports total CPU event counts. See “ecount
Measurement Report Description” (p. 206).
• fcount (HP-UX only)
The fcount measurement measures and reports function call counts in a program. See “fcount
Measurement Report Description ” (p. 208).
• fcover (HP-UX only)
The fcover measurement measures and reports function call coverage in a program. See
“fcover Measurement Report Description ” (p. 209).
• fprof
The fprof measurement measures and reports a function profile. See “fprof Measurement Report
Description” (p. 210).
• icache
The icache measurement measures and reports sampled instruction cache metrics. See “icache
Measurement Report Description” (p. 215).
• itlb
The itlb measurement measures and reports sampled instruction TLB misses. See “itlb
Measurement Report Description” (p. 219).
• pmu_trace
The pmu_trace measurement measures and reports traces of sampled PMU data for each
kernel thread. See “pmu_trace Measurement Report Description” (p. 224).
• scgprof
The scgprof measurement measures and reports (an inexact) call graph profile, produced by
sampling the PMU to determine function calls. See “Producing a Sampled Call Graph Profile
Analysis” (p. 122) and “scgprof Measurement Report Description” (page 224).
• traps
The traps measurement collects and reports a profile of traps, interrupts, and faults. See “traps
Measurement Report Description ” (page 227).
These measurement configuration files are grouped into three categories based on the primary
type of measurement, as shown in Table 1 (page 44).
Table 1 Available Measurements in Each Measurement Type
Precise (HP-UX only)SampledGlobal
ecount cgprofalat
fcountbranch
fcovercgprof
cpu
cstack
cycles
dcache
dtlb
fprof
icache
44 HP Caliper Measurement Configuration Files
Page 45

Table 1 Available Measurements in Each Measurement Type (continued)
itlb
pmu_trace
scgprof
traps
NOTE: The cgprof measurement performs both sampled and precise measurements.
The measurements in the sampled category, with the exception of cpu and pmu_trace, show
results grouped by function. A report produced by any of these measurements is referred to as a
PMU histogram report.
The measurements in the precise category use dynamic instrumentation to perform their
measurements.
Overview Measurement
The overview measurement enables collecting fprof, dcache, and cstack data in one single
collection run. To run overview on an application enter:
$ caliper overview -o rpt my_app
The overview measurement multiplexes fprof, dcache, and cstackmeasurements at a time
interval of 1 second. The default switch interval of 1 second can be changed using the
--switch-interval=SECONDS option. After each switch interval, Caliper will switch from one
measurement to the next.
On system-wide runs, Caliper will multiplex fprof and dcache measurements. The following
command line will collect system-wide fprof and dcache data for a duration of 300 seconds:
$ caliper overview -w -e 300 -o rpt
The sampling period of fprof, dcache and cstackmeasurements can be controlled using
the following new options:
--fprof-sampling-spec evt_period[,variation[,cpu_event]]
Precise (HP-UX only)SampledGlobal
--dcache-sampling-spec evt_period[,variation[,cpu_event]]
--cstack-sampling-spec time_period
The syntax of these options is similar to the --sampling-spec option:
evt_period Specifies how many sampling events should occur between samples.
variation Specifies how much to vary the number of events between samples (can be
specified as either an exact count or as a percentage of the sampling rate if
followed by %).
cpu_eventt specifies the CPU event to use for sampling.
time_period Is a sampling period in seconds, milliseconds, or microseconds (specified as
Ns, Nms, orNus, respectively, where N is an integer).
Here is a complete example:
$ caliper overview -o rpt --switch-interval 3 \
--fprof-sampling-spec 1000000 \
--dcache-sampling-spec 20000,5%,DATA_EAR_EVENTS \
--cstack-sampling-spec 250ms my_app
In the above example, the overview measurement will run the fprof measurement for 3 seconds,
dcachemeasurement for 3 seconds, and cstack measurement for 3 seconds continuously until
the program terminates. The fprof measurement will use a sampling interval of 1 million
CPU_CYCLES (or CPU_OP_CYCLES on dual-core Itanium 2 and Itanium 9300 quad-core processors).
The dcachemeasurement will take one sample for every 20000 DATA_EAR_EVENTs and it will
Overview Measurement 45
Page 46

use 5% as the sampling period variation. The cstack measurement will take one sample for every
250 milliseconds.
On HP-UX, the per-process overview measurement requires a 11i v3 system with the kernel patch
PHKL_38072 installed.
Simultaneous fprof Sampling on Multiple PMU Counters
Up until Caliper 5.1, the fprof measurement sampled the instruction pointer (IP) on only one
counter (every 500,000 CPU cycles by default). As of Caliper 5.2, the fprof measurement is
enhanced to support simultaneous IP sampling on mutiple PMU events.
The -s or --sampling-spec option can be used multiple times to specify the list of sampling
events, based on which IP samples are to be collected and reported.
The following example performs simultaneous fprof sampling on an application:
$ caliper fprof -s 500000,25000,CPU_CYCLES -s 600000,25000,IA64_INST_RETIRED -o fprof.out ./a.out
In this example, the HP Caliper fprof measurement run will collect IP samples on two different
PMU events (for every 500000 CPU cycles and for every 600000 retired instructions). In the
generated fprof report, the IP sample hits are reported in individual columns—one for each PMU
counter being sampled.
A user can specify upto 4 sampling events on Itanium2 systems and up to 8 sampling events on
dual-core Itanium 2 and Itanium 9300 quad-core processor systems. Specifying -s options overrides
the default fprof sampling period (500,000 CPU cycles).
While reporting, the --sort-by=sample,cpu_event option can be used to specify the metric
to be used for sorting. The cpu_event can be any of the sampling events specified with -s
options. By default, the report is sorted on the sampling event specified with the first -s option.
Location of Measurement Configuration Files
A measurement is actually the name of a measurement configuration file that contains parameter
settings for the measurement to be made.
When you run HP Caliper, you can simply specify the measurement you want to run. Or, if you
want to use a particular measurement configuration file, you can use a fully qualified path name.
If you specify a path name, either relative or absolute, HP Caliper runs only if it can find the
measurement configuration file in the specified directory. For example:
$ caliper /home/perf/config/ecount myprog
In this example, HP Caliper reports a “file not found” error if the file ecount is not in the /home/
perf/config/ directory.
If you specify a measurement without a path, HP Caliper looks for the named measurement
configuration file in these locations, in this order:
1. Your working directory
2. HP Caliper home directory in the config subdirectory
You can copy the measurement configuration files provided with HP Caliper and then modify them
to make your own customized set of measurement configuration files. You can also set up site-wide
measurement configuration files in addition to the files provided with HP Caliper.
You are free to rename measurement configuration files.
Specifying Option Values in Measurement Configuration Files
You can specify options on the command line, in a measurement configuration file, or in the
.caliperinit file. See “Multiple Ways to Specify HP Caliper Option Values” (p. 48).
46 HP Caliper Measurement Configuration Files
Page 47

Using the Command Line to Override Measurement Configuration File Parameters
You can use the HP Caliper command line to override parameters specified in measurement
configuration files.
For example, to override the sampling_spec setting in pmu_trace, use a command like this:
$ caliper pmu_trace -s period,variation,cpu_event program
To override the events to be measured in ecount on HP-UX, use:
$ caliper ecount -m cpu_event,cpu_event program
To override the kernel stop functions and get all frames in the cstack on HP-UX, use:
$ caliper cstack --stop_functions = "" program
See “Hierarchy for Processing an Option Value” (p. 49).
Location of Measurement Configuration Files 47
Page 48

5 HP Caliper Options
This chapter describes basic information about options and presents them in alphabetical order.
For a listing of the most commonly used options, see the HP Caliper Quick Start reference card.
Basic Information About Options
Options are used to customize the performance analysis. You can specify one or more options on
the command line when you start HP Caliper. You can abbreviate options and their modifiers as
long as they are unambiguous.
Options are preceded on the command line by two hyphens and may be followed by various
modifiers. For example: --database myout. The most commonly used options also have a
single-hyphen form. For example: -d myout. Note that the single-hyphen forms of the options
precede the double-hyphen forms in this chapter.
In general, you can repeat an option on the command line. The command line is processed in
order, with the values from a later option replacing the values from the earlier one. The earlier one
is still processed, though, and must have correct syntax.
You can use an options file to specify command-line information, including the measurement,
options, program, and program arguments. See “-f or --options-file” (p. 50) for details.
You can save option values in an initialization file that HP Caliper automatically uses at startup
for data collection or data reporting runs. This file, .caliperinit, is not required, but is used
if it is available. For more information, see “Specifying Option Values with a .caliperinit Initialization
File” (p. 92).
Multiple Ways to Specify HP Caliper Option Values
You can specify options on the command line, in a measurement configuration file, or in the
.caliperinit file. There are some differences:
• You replace any hyphen (-) in the command-line option name with an underscore (_) in the
measurement configuration file or the .caliperinit file.
• When assigning a value to a variable in the measurement configuration file or the
.caliperinit file, you enclose the value in double quotes unless it is a number or an HP
Caliper constant such as True or False.
• The measurement configuration files and the .caliperinit file are Python files and must
contain executable Python code. Thus, you must use the equals sign (=) in assignment statements
in these files. The equals sign is not necessary with HP Caliper command-line options except
for two: --memory-usage= and --system-usage=.
Examples
Assume these command-line options:
• -s 400000,10%,BRANCH_EVENT (also specified as --sampling-spec
400000,10%,BRANCH_EVENT)
• --context-lines 10
You can replace them in the measurement configuration file or the .caliperinit file with these
lines:
• sampling_spec = "400000, 10%, BRANCH_EVENT"
• context_lines = 10
48 HP Caliper Options
Page 49

Hierarchy for Processing an Option Value
HP Caliper uses this sequential order to process an option value:
1. Default value for an option
2. Option variable setting in the specified measurement configuration file
3. Option variable setting in the .caliperinit file, if the file exists
4. Option value from the command line
Thus:
• The command line overrides everything.
• The .caliperinit file overrides the measurement configuration file.
• The measurement configuration file overrides the default value.
-d or --database
-d database[,unique]
Saves measurement results to the named database in data collection runs.
Performance data is always saved to a database, whether one is explicitly specified or not. You
can use this option to save measurement results to a database that you name instead of to the
default database name. If you specify a relative or absolute pathname, the file will be saved there.
If you do not specify a pathname, the file is saved in the current directory.
This option is particularly useful is you want to preserve measurement runs of the same type.
If you use the unique qualifier, the process ID of the HP Caliper process is appended to the name
of the database it is writing to. There are two situations in which you might want to use this qualifier:
• When you are running HP Caliper many times and do not want to overwrite the database
contents with each run.
• When you are running simultaneous HP Caliper processes, which would (without this qualifier)
try to write to the same database and cause corruption.
If you do not use the -d option, the database file is saved in the databases directory.
Examples
-d foo.db,unique
--database bar.db,unique
These options would result in database names such as the following:
foo.db-14921
bar.db-288
For more information, see “How HP Caliper Saves Data in Databases” (p. 115).
-e or --duration
-e seconds
Elapsed time in real-time seconds before detaching from a running process. When you specify this
option, HP Caliper stops measuring the target processes after the specified duration and reports
the data. When HP Caliper stops measuring, the application continues to run normally.
NOTE: When HP Caliper stops its measurement, I/O processes may be affected. See “Restrictions
on Using HP Caliper” (page 30).
This option is not available for cgprof, fcount, and fcover measurements.
See “Attaching to a Running Process to Perform Measurements” (p. 101) for details.
-d or --database 49
Page 50

-f or --options-file
-file options_file
Specifies a text file containing a list of HP Caliper command-line options separated by spaces or
line breaks.
You can also use an options file to specify an HP Caliper measurement as well as the application
to be profiled and its arguments.
Any option you specify on the command line overrides the corresponding setting in the options
file.
HP Caliper places the contents of the options file in the position occupied by the -f option in the
command line. HP Caliper displays an error if the contents of the options file create an invalid
condition.
For example, if you place the application to be profiled and its arguments in an options file called
myopts, then HP Caliper reports an error given this command line:
$ caliper -f myopts fprof -o out.text
The command succeeds if reordered this way:
$ caliper fprof -o out.text -f myopts
-h or -?
-h or -?
Displays the short version of the help text.
For the long version of the help text, use -H or --help.
-H or --help
-H or --help
Displays the long version of the help text.
For the short version of the help text, use -h or -?.
-m or --metrics
This option has two forms: -m cpu_event and -m event_set
-m cpu_event
This form is used to specify one or more CPU events to measure:
-m cpu_event[[:threshold=int][:privilege-level-mask=level]][,cpu_event[:...]]
You can change the default CPU events recorded for any of the following measurements:
• alat
• branch
• cycles
• dcache
• dtlb
• ecount
• fprof
• icache
• itlb
• pmu_trace
50 HP Caliper Options
Page 51

If you use this option but do not specify an event, or if the option value is set to the empty string
(""), then no metrics will be reported.
You can use the caliper info command to list available CPU events and their descriptions.
cpu_event Specifies a CPU event to measure. The name is not
case-sensitive. For information about CPU events you can
specify, see “Specifying Which CPU Events to Measure”
(p. 94).
threshold=int An integer value that specifies how HP Caliper counts events:
• If the value is zero, HP Caliper counts all events.
• If the value is greater than zero, HP Caliper counts only
the CPU cycles in which the number of events is greater
than or equal to the value you specify.
The default value is zero.
privilege-level-mask=level Determines the privilege level setting for a given counter.
The default is user (counters are measured when your
application runs in user space). The privilege levels are:
• user
• kernel
• all
-m event_set
You use this form of the option only with the cpu measurement.
An event set is a predefined collection of CPU events you specify with the cpu measurement. Use
this form of the option to measure multiple event sets in the same run and to specify a privilege
level for each event set.
-m event_set[:all|user|kernel][,event_set...]
If no event is specified or if the option value is set to the empty string (""), then no metrics will be
reported.
event_set A collection of events.
Use all, user, or kernel to specify the privilege level. The default value is user and kernel.
For details about how to use this form of the -m option, see “Performing CPU Metrics Analysis
” (p. 153).
-o or --output-file
-o outputfile[,append|create][,per-process|shared][,unique]
Specifies the file in which to write HP Caliper text reports.
Default value is stdout.
This qualifier is not case-sensitive, and is abbreviated to
PLM.
You can open the file in one of two modes:
append Adds the report results to the end of an existing file that has the specified name.
create Creates a file with the specified name and writes the report results to the file. Replaces
any existing file with the specified name.
Default value is create.
When you generate multiprocess reports, you can specify whether results are combined in a single
report file or in individual files by process:
-o or --output-file 51
Page 52

per-process Creates individual report files for each process with program name appended
shared Creates a single file containing the results for all processes. This is the default
unique Appends the process ID to the data file name.
When saving information per process, you can specify a nonexistent directory for the file name
and HP Caliper will create the directory and put all the files in the new directory. For example:
-o newdir/outfile,p
This approach creates the newdir directory, which contains the output files for each process
measured.
NOTE: The -o option is also used with the caliper info command and with the caliper
advise command. See “How to Display Reference Information About CPU Counters or HP Caliper
Report Types” (p. 102) and “Command Line to Invoke the Advisor” (p. 79).
-p or --process
-p default|all|root|root-forks|[some:][(OPT1 ,...)]PATTERN
Specifies which processes in the process tree should be measured.
root Measures only the root process.
root-forks Measures the root process and processes forked from it.
to each file.
setting.
The default setting is the same as all.
For more information, see “Specifying Processes to Measure” (p. 97).
-r or --report-details
Specifies the level of program detail in reports.
This option has two forms, depending on how it is used:
• For the Function Details section of a PMU histogram report
• For the fcover report
-r for PMU Histogram Reports
-r [statement][:instruction][none][all]
Default value is -r statement.
statement Shows source statements (if source code exists, or line numbers otherwise) with
associated performance data. Machine instructions are not shown.
You can shorten this option to -rs.
instruction Shows machine instructions. Source statements are not shown.
You can shorten this option to -ri.
none Prevents generation of the Function Details section.
You can shorten this option to -rn.
all Shows all data (source statements and machine instructions) in the Function
Details section.
You can shorten this option to -ra.
-r for Function Coverage Reports
-r [module][:directory][:file][:function][:unknown][none][all]
52 HP Caliper Options
Page 53

Default value is module:directory:file:function:unknown.
module Shows data by load module.
directory Groups data by source directory.
file Generates Summary Report by source file.
function Shows function level detail by source file.
unknown When used together with the other report options, provides additional information
about functions from unknown source files in the summary and detail coverage
reports.
-s or --sampling-spec
-s period
-s rate [,variation [,cpu_event
[[:threshold=int][:privilege-level-mask=level]]]]
Specifies the sampling period.
-s period
The -s period version of this option is used only for two measurements:
• cpu
For the cpu measurement, you can use this option in conjunction with the --event-defaults
option to control how samples are taken. For more information, see “Performing CPU Metrics
Analysis ” (p. 153).
• cstack
For more information, see Chapter 11 (page 134).
period Sampling period in seconds or milliseconds or microseconds, measured in CPU cycles
(for cpu) or real time (for cstack). For example:
• -s 1s (1 second)
• -s 100ms (100 milliseconds)
• -s 1000us (1000 microseconds)
For the cpu measurement, the default period is 8 milliseconds. See also
“--cpu-aggregation ” (p. 57).
For the cstack measurement, the default period is 100 milliseconds.
-s rate
The -s rate version of this option is used for all other measurements.
rate Sampling period: specifically, how many sampling events
should occur between samples. The smaller the rate, the
more chance that HP Caliper will affect your program's
performance while collecting information.
variation Sampling period variation: specifically, how much to vary
the number of events between samples. The variation is
the number or percentage of cpu_counter events that HP
Caliper uses to vary the sampling rate. HP Caliper adds or
subtracts this number from the interval to vary the sampling
frequency.
You can specify the actual number of events by which to
vary the sampling rate, or a percentage of the count by
-s or --sampling-spec 53
Page 54

using a percent symbol (%). For example: -s
CPU_CYCLES,10000,10%
The default value is 5 percent.
cpu_event Specifies a CPU event to measure. The name is not
case-sensitive. For information about CPU events you can
specify, see “Specifying Which CPU Events to Measure”
(p. 94).
threshold=int An integer value that specifies how HP Caliper counts events:
• If the value is zero, HP Caliper counts all events.
• If the value is greater than zero, HP Caliper counts only
the CPU cycles in which the number of events is greater
than or equal to the value you specify.
The default value is zero.
privilege-level-mask=level Determines the privilege level setting for a given counter.
By default, counters are measured when your application
runs in user space (user). The privilege levels available
are:
• user
• kernel
When you specify this option on the command line, you can override all or just part of the
sampling_spec setting in the measurement configuration file or the .caliperinit file. This
allows you to, in effect, create your own default settings.
For example, if the measurement configuration file contains this setting:
sampling_spec = "400000, 10%, BRANCH_EVENT"
and on the command line, you specify only variation:
-s ,5%
the resulting settings would be a rate of 400000, a variation of 5%, and the CPU event
BRANCH_EVENT.
NOTE: Using -s multiple times will not result in sampling on multiple events. If you specify multiple
-s options, only the last one is used.
-v or --version
-v
Prints the HP Caliper version identification. You can also use the what(1) command.
• all
You can abbreviate this qualifier to PLM. This qualifier is
not case-sensitive.
-w
Equivalent to one form of the option for system-wide measurement. The -w option is equivalent to
-–scope system,attr-mod, which is the default for -–scope system. See “Using --scope
system for System-Wide Measurements” (p. 71).
--advice-classes
Used only with the caliper advise command. See “Command Line to Invoke the Advisor”
(p. 79).
54 HP Caliper Options
Page 55

--advice-cutoff
Used only with the caliper advise command. See “Command Line to Invoke the Advisor”
(p. 79).
--advice-details
Used only with the caliper advise command. See “Command Line to Invoke the Advisor”
(p. 79).
--analysis-focus
Used only with the caliper advise command. See “Command Line to Invoke the Advisor”
(p. 79).
--branch-sampling-spec
--branch-sampling-spec rate
[,variation[,cpu_event[[:threshold=int[:privilege-level-mask=level]]]]
Controls the sampling of the branch trace buffer (BTB)/execution trace buffer (ETB), which produces
the statistical call graph. This option is used only with the scgprof measurement.
The default sampling of the BTB is:
branch_sampling_spec "1000, 5%, BRANCH_EVENT"
The default sampling of the ETB is:
branch_sampling_spec "1000, 5%, ETB_EVENT"
which means that every 1000 BRANCH_EVENT CPU events (on the Integrity servers Itanium 2)
and ETB_EVENT CPU events (on the Integrity servers dual-core Itanium 2 and Itanium 9300
quad-core processors) are sampled, using a 5% variation value.
Use this option to change the default.
rate Specifies how many sampling events should occur between
samples.
The default value is 1,000 events.
variation Specifies how much to vary the number of events between
samples. The number or percentage of CPU_counter events
that HP Caliper uses to vary the sampling rate. HP Caliper
adds or subtracts this number from the interval to vary the
sampling frequency.
The default value is 5 percent.
cpu_event Specifies CPU events to measure. The default value is
BRANCH_EVENT (or ETB_EVENT on the Integrity servers
dual-core Itanium 2 and Itanium 9300 quad-core
processors). Do not change this default value: doing so will
result in a useless call graph.
threshold=int An integer value that specifies how HP Caliper counts events.
The default value is zero. Do not change this default value:
doing so will result in a useless call graph.
privilege-level-mask=level Determines the privilege level setting for a given counter.
By default, counters are measured when your application
--advice-cutoff 55
Page 56

This option overrides the branch_sampling_spec setting in the scgprof measurement.
When you specify the setting by using the command-line option, you can override all or just part
of the specification. This allows you to, in effect, create your own default settings.
For example, if the measurement configuration file contains this setting:
branch_sampling_spec = "400000, 10%, BRANCH_EVENT"
and on the command line you specify only variation:
--branch-sampling-spec ,5%
the resulting settings would be a rate of 400000, a variation of 5%, and the CPU event
BRANCH_EVENT.
--bus-speed
[--bus-speed int]
runs in user space (user). The privilege levels available
are:
• user
• kernel
• all
You can abbreviate this qualifier to PLM. The qualifier is not
case-sensitive.
Specifies the bus speed in MHz for the sysbus event set. If you specify the sysbus event set,
you must use this option. For example: --bus-speed 200.
--callpath-cutoff
--callpath-cutoff percent_cutoff[,cum_percent_cutoff[,min_count]]
Specifies cutoff values that limit the hot call paths reported in the Hot Call Paths section of the
cstack, scgprof, and cgprofreports.
This option is used in conjunction with the --sort-by metric option, which you can use to
specify the metric to be used for sorting and cutoffs. See “--sort-by” (page 72).
HP Caliper stops reporting information when it reaches a percent cutoff , cumulative percent cutoff,
or minimum number of call paths. You have these choices:
• You can limit the report only to call paths that exceed a specified percentage of the total for
the sorting/cutoff metric. Once HP Caliper encounters this percentage cutoff, it stops reporting
call paths.
• You can limit the report by having HP Caliper stop reporting call paths once the cumulative
percent of the call paths so far listed exceeds the cumulative percentage cutoff value.
• You can specify an integer for the minimum number of call paths to be displayed.
This option has these parameters:
percent_cutoff The percentage of the total for the sort metric that a given call path
must exceed to appear on the report.
Default value is 1.0.
cum_percent_cutoff The value of the cumulative percentage at which HP Caliper stops
min_count The minimum number of call paths to be displayed.
56 HP Caliper Options
reporting call paths.
Default value is 100.
Default value is 5.
Page 57

For more information, see Chapter 11 (page 134).
--context-lines
--context-lines all|count_source[,count_disassembly]
For a PMU histogram report, specifies the number of source lines to show before and after a source
line entry with associated performance data.
Default value is --context-lines 5 for source-only reports or --context-lines 0 for
reports with disassembly.
Specify all to report all source lines for reported functions.
count_source Number of source lines to show
count_disassembly Number of disassembly lines to show
--cpu-aggregation
--cpu-aggregation count
Specifies how many samples will be aggregated into one sample.
This option is valid only with the cpu measurement.
Default value for count is 125 (125 samples will be aggregated into one sample).
If count is 0 or 1, the samples will not be aggregated.
To specify the sampling period, use the --sampling-spec option.
For more information, see “Performing CPU Metrics Analysis ” (p. 153).
NOTE: This option was formerly known as --cpu-metrics-aggregation. The former option
name is still accepted by HP Caliper, but is deprecated and will be removed in a future release.
--cpu-counter
Used only with the caliper info command. See “How to Display Reference Information About
CPU Counters or HP Caliper Report Types” (p. 102).
--cpu-details
--cpu-details [statistics|means][:samples]
Specifies which statistics to report and whether or not to report the details of each sample.
This option is valid only with the cpu measurement.
The statistics modifier reports all the available statistics: MEAN, STDEV (standard deviation),
90%CI (90% confidence interval), MINIMUM, LOW90, HIGH90, and MAXIMUM.
The means modifier reports only MEAN and STDEV.
Default value is --cpu-details means.
For more information, see “Performing CPU Metrics Analysis ” (p. 153).
NOTE: This option was formerly known as --cpu-metrics-details. The former option name
is still accepted by HP Caliper, but will be removed in a future release.
--csv-file
--csv-file filename[append|create][,per-process|shared][,unique]
Generates report output in Comma Separated Values (CSV) format. You can produce a CSV report
for any HP Caliper measurement.
--context-lines 57
Page 58

The CSV reports are formatted to load in an easy-to-read format in a spreadsheet using a fixed-width
typeface such as Courier or for further processing. The filename is the destination.
You can generate reports in CSV or text formats on any given run.
append Adds the report results to the end of an existing file that has the specified name.
create Creates a file with the specified name and writes the report results to the file.
per-process For multiprocess reports, creates individual report files for each process with
shared Creates a single file containing the results for all processes. This is the default.
unique Appends the process ID to the data file name.
Examples
To generate a CSV report:
caliper measurement --csv-file filename ...
To generate a CSV file from information previously saved in a data file:
$ caliper report --csv-file filename datafilename
--dcache-data-profile
Specifies that the dcache measurement should report a Data Summary. The Data Summary report
shows data cache samples aggregated to global variables and process regions such as stack,
heap, data, and so forth.
This option is used only with the dcache measurement. By default, dcache does not report a data
summary. This option was formerly known as --data-summary. The former option name is still
accepted by HP Caliper, but is deprecated and will be removed in a future release.
For more information, see “dcache Measurement Report Description” (page 193).
Replaces any existing file with the specified name.
program name appended to each file.
--database
See “-d or --database” (p. 49).
--dcache-hits
Specifies that the dcache measurement should report data cache "hits" i.e. no of accesses in the
FLD(L1 data) cache.
This option is used only with the dcache measurement. By default, dcache measurement does not
report a data cache hit. This option is enabled only on Intel® Itanium® 9500 processor systems.
--dcache-stores
Specifies that the dcache measurement should report data cache store miss profile instead of data
cache load profile.
This option is used only with the dcache measurement. By default, dcache measurement reports
data cache load profile. With this option you can see the number of stores which missed the FLD(L1
data) cache. This option is enabled only on Intel® Itanium® 9500 processor systems.
--dbrp
--dbrp=DBRP_INDEX,PLM,ADDR_MATCH,ADDR_MASK,PROC_FLAGS
Specifies the bits to program the PMU's data address range matching registers. Forces event
monitoring to be constrained by data address ranges.
DBRP_INDEXX can be 0, 1, 2 or 3. It identifies one of the four Data Breakpoint Registers (DBRs)
used to specify the desired address range.
58 HP Caliper Options
Page 59

PLM specifies the privilege level setting. The privilege levels available are: "user",
ADDR_MATCH is the 64-bit address to match.
ADDR_MASK is the 56-bit address mask to apply before matching the ADDR_MATCH bits.
PROC_FLAGS is a comma-separated list of none , d, io, or iod.
This option is not available on Intel® Itanium® 9500 processors systems.
--db-save
--db-save-details [syms][:code][:src][:all]
Allows you to save in the database containing your measurements, additional information for use
in reporting. This option must be used when the measurement is first made. You can then generate
reports or view reports in the GUI without needing access to the system where data was collected.
• syms — Saves symbol information about each load module.
• code — Saves the executable text segment (code) of each load module. This argument also
• src — Saves source line attribution data for each load module. This argument also implies
"kernel", and "all".
none indicates no constraint. d indicates data address matching only. io
indicates instruction address and opcode matching. iod indicates instruction
address, opcode and data address matching.
implies the syms argument.
the code and syms arguments.
• all — Same as the src argument.
--debug-file-path=
Specifies a directory to search for the +objdebug object files in.
NOTE: With this HP Caliper option, you must use a qualifier or an equals sign ('='). You cannot
use --debug-file-path as the option. You must use --debug-file-path=.
--description-details
--description-details all|[target][:times][:sampling][:images][:none]
Specifies the level of detail reported for per-process or per-application summary.
The default value is --description-details target:times:sampling.
Previously available options [:processor][:run][:help] have been deprecated and have
no effect on report.
--details
Used only with the caliper info command. See “How to Display Reference Information About
CPU Counters or HP Caliper Report Types” (p. 102).
--detail-cutoff
--detail-cutoff percent_cutoff[,cum_percent_cutoff[,min_count]]
Specifies cutoff values that limit the functions reported in the Function Details section of a PMU
histogram report. This option is used in conjunction with the --sort-by metric option, which
you can use to specify which metric you want to be used for sorting and cutoffs.
--db-save 59
Page 60

HP Caliper stops reporting information when it reaches either a percent cutoff or a cumulative
percent cutoff:
• You can limit the report only to functions that exceed a specified percentage of the total for
the sorting/cutoff metric. Once HP Caliper encounters this percent cutoff, it stops reporting
functions.
• You can limit the report by having HP Caliper stop reporting functions once the cumulative
percent of the functions so far listed exceeds the cumulative percent cutoff value.
You can also specify an integer for the minimum number of functions to be displayed for all load
modules.
For details, see “Metrics You Can Use for Report Sorting and Cutoffs” (p. 106).
percent_cutoff The percentage of the total for the sorting/cutoff metric that a given
function must exceed to appear on the report. This is shown as percent
cutoff on reports.
Default value is 1.0.
This value only takes effect if the Percent of Total column is selected
for the report.
cum_percent_cutoff The value of the cumulative percentage at which HP Caliper stops
reporting results. This is shown as cumulative percent cutoff on reports.
Default value is 100.
This value only takes effect if the Cumulative percent column is
selected for the report.
min_count Sets the minimum number of functions to be displayed for all load
Example
If you specify:
$ caliper fprof --detail-cutoff ,80 wordplay
The contents of the Function Details section is a list of functions containing:
• The functions that account for 80 percent of the total IP samples in the wordplay program.
• Only those functions that each account for more than one percent of total samples for all load
modules. Because percent_cutoff was not specified, HP Caliper used the default value,
1 percent.
--duration
See “-e or --duration” (p. 49).
--etb-freeze-delay
--etb-freeze-delay integer
Controls the number of cycles of programmable delay for the Integrity servers dual-core Itanium 2
and Itanium 9300 quad-core processors' execution trace buffer (ETB) from the point of the rest of
the PMU freeze.
Use this option to change the way in which the ETB collects the samples. When you specify a
nonzero value with this option, the ETB will continue to collect instruction pointer (IP) samples for
the specified number of cycles from the point of the rest of the PMU freeze.
See also “--etb-walkback-cycles” (p. 61).
modules. This is shown as minimum function entries on reports.
Default value is zero.
60 HP Caliper Options
Page 61

Example
To produce a flat profile based on execution stalls due to GR/GR or GR/load:
$ caliper cycles -ra -s 100000,5%,BE_EXE_BUBBLE.GRALL
--etb-freeze-delay 12 --etb-walkback-cycles 22
Choosing correct values for the --etb-freeze-delay and --etb-walkback-cycles options
requires knowledge of the Integrity servers dual-core Itanium 2 or Itanium 9300 quad-core processor
pipeline. For information about the ETB and how it is configured to collect IP values, see Performance
Profiling for Fun and Profit.
--etb-walkback-cycles
--etb-walkback-cycles integer
Controls the number of cycles to walk back when iterating from the most recent execution trace
buffer (ETB) entry to the oldest ETB entry.
Use this option to change the way in which HP Caliper picks the instruction pointer (IP) samples
from the 16 IP entries in an ETB sample. When iterating from the most recent entry, HP Caliper
computes the cumulative elapsed cycles by adding up each entry's bubble cycles plus one cycle
per entry. When an entry is reached for which the cumulative elapsed cycles is greater than or
equal to the integer specified in this option, that entry is picked as the IP sample.
For more information and an example, see “--etb-freeze-delay” (p. 60).
--event-defaults
--event-defaults [privilege-level-mask=level][:threshold=int]
Controls where and when HP Caliper measures events while your application is executing. You
can use this option to set the default privilege level for all PMU events (including the sampling
event).
privilege-level-mask=level Determines the privilege level setting for a given counter.
By default, counters are measured when your application
runs in user space (user) The privilege levels available
are:
• user
• kernel
• all
You can abbreviate this qualifier to PLM. The qualifier is not
case-sensitive.
threshold=int An integer value that specifies how HP Caliper counts events.
• If the value is zero, HP Caliper counts all events.
• If the value is greater than zero, HP Caliper counts only
the CPU cycles in which the number of events is greater
than or equal to the value you specify.
The default value is zero.
--etb-walkback-cycles 61
Page 62

Example
Assume that you want to capture samples containing the:
• Number of cycles during which three or more FP_OPS_RETIRED events occurred, while
executing in kernel space
• Number of cycles during which four or more NOPS_RETIRED events occurred, in user space
• Total number of NOPS_RETIRED at all levels
In addition, assume that you want the samples to be captured every time 10,000 cycles occur,
during which two or more IA64_INST_RETIRED events occur, at all privilege levels.
Use this combination of options:
caliper pmu_trace
--event-defaults PLM=all:threshold=3
--metrics FP_OPS_RETIRED:PLM=kernel,NOPS_RETIRED:PLM=user:TH=4,NOPS_RETIRED:TH=0
--sampling-spec 10000,,IA64_INST_RETIRED:TH=2
--exclude-caliper
--exclude-caliper True|False
Specifies whether to include, in measurements, the activity due to the HP Caliper process.
Used only with the --scope system option.
The default value is True (HP Caliper process activity is excluded).
See “--scope” (p. 70).
--exclude-idle
--exclude-idle True|False
Specifies whether to include, in measurements, the periods during which a given CPU is executing
the idle loop. Inclusion takes effect for each CPU separately.
Used only with the --scope system option.
The default value is True (idle loop activity is excluded).
See “--scope” (p. 70).
--fold
The --[no]fold option is deprecated. The closest equivalent to this option is the new --group-by
option.
--frame-depth
--frame-depth count
Specifies the maximum number of stack frames to unwind while collecting call stack samples.
This option is used only with the cstack measurement.
The default depth is 32.
--group-by
--group-by executable | module | none
Specifies how “matching” processes or modules should have their data combined in reports.
(Matching processes or modules are processes or modules that have the same basename.)
This option can be used anytime you use the caliper command to produce a report (including
the default stdout report). It can also be used when you use the following commands to create
a report from one or more databases: caliper report, caliper merge, and caliper
diff.
62 HP Caliper Options
Page 63

executable Specifies that “matching” processes should have their data combined when
possible.
This is the default for all HP Caliper reports and for all caliper report,
caliper merge, and caliper diff commands.
module Specifies that “matching” modules should have their data combined. This produces
a module-centric report. In a module-centric report, there is no data about
individual processes in the collection runs. Instead, all matching modules with
data that can be merged are grouped together, across processes.
The following HP Caliper measurements cannot be combined across processes
or modules:
• cgprof(HP-UX only)
• cpu(HP-UX only)
• pmu_trace
• scgprof
Collections with the above measurements will always be processed as if
--group-by none were specified.
See “Module-Centric Reports” (page 109).
none Specifies that data from matching processes or modules should not have their
data combined. This is used only for the caliper and caliper report
commands.
See “Creating Reports from Multiple Databases” (page 116).
--help
See “-H or --help” (p. 50).
--hotpaths
--hotpaths
Specifies whether or not the hot call paths section should appear in callgraph measurement reports.
The default value is True. This option is used only with the cgprof, and scgprof reports.
--ibrp
--ibrp=IBRP_INDEX,PLM,ADDR_MATCH,ADDR_MASK
Specifies the bits to program the PMU's instruction address range matching registers. Forces event
monitoring to be constrained by instruction addresses ranges.
IBRP_INDEX can be 0, 1, 2 or 3. It identifies one of the four Instruction Breakpoint Register
PLM specifies the privilege level setting. The privilege levels available are: "user",
ADDR_MATCH is the 64-bit address to match.
ADDR_MASK is the 56-bit address mask to apply before matching the ADDR_MATCH bits. The
pairs (IBRPs) used to specify the desired address range.
"kernel", and "all".
HP Caliper option --_debug-pmu-settings will dump the exact bits
programmed into the PMUs registers. This is helpful in verifying the bits
programmed into the opcode matching and address matching registers.
For more information about opcode matching, instruction address range and
data address range matching, see the following Intel documentation: Dual-Core
Update to the Intel Itanium 2 Processor Reference Manual for Software
Development and Optimization, Document Number 308065-001. http://
--help 63
Page 64

--info
--inlines
download.intel.com/design/Itanium2/manuals/30806501.pdf and Intel Itanium
2 Processor Reference Manual for Software Development and Optimization,
Document Number 251110-003. http://www.intel.com/design/itanium2/
manuals/251110.htm
--info
Causes HP Caliper to append help information to the end of textual reports.
--[no]inlines
Causes HP Caliper to collect data for inline functions.
The default value is --noinlines.
You can use this option with the following measurements: alat, branch, cgprof, dcache,
dtlb, fprof, fcount, icache, itlb, and scgprof.
For the cgprof and fcount measurements, this option should be specified during data collection
as well as reporting, because the inline functions must be instrumented at collection time for the
data to be available at report time. For the other measurements, this option needs to be specified
only during reporting (though it can also be specified during data collection).
In reports, entries for inline functions are preceded with the following: { inline }. This notation
is particularly useful if a particular function is called both inline and not inline. (There is no special
notation for the function when it is not called inline.)
To obtain information regarding inline functions that HP Caliper can use, you must compile your
program with -g and the optimization level should not exceed +O1.
--join
The --join option is deprecated. Instead, you should use the caliper report | merge |
diff command. See “Creating Reports from Multiple Databases” (page 116).
--jre
--jre path
Specifies the JRE path to be used when invoking the local GUI client. This option is used only with
the caliper -g command.
HP Caliper searches for the JRE in this order:
1. Path specified by the --jre path option
2. Path specified by the JAVA_HOME environment variable
3. Path specified by the PATH environment variable
--kernel-path
--kernel-path path
When using the --event-defaults option with the privilege-level-mask set to kernel
or all, specifies the path to the kernel file you want HP Caliper to use for symbol lookup and
disassembly.
64 HP Caliper Options
Page 65

By default, HP Caliper uses this kernel file for symbol lookup and disassembly:
• /stand/current/vmunix
NOTE: On Linux, a default kernel path is not defined for a sampling level of kernel or all,
so reports show only kernel module and function information for samples. To show disassembled
instructions for kernel modules, use the –-kernel-path option.
To produce an uncompressed kernel image for HP Caliper to work with, do the following:
TMP_FILE=path_to_use_for_kernel_image
gunzip -c /boot/efi/.../vmlinuz > $TMP_FILE
caliper ... --kernel-path $TMP_FILE
--kernel-stack
--kernel-stack True|False
Specifies whether to extend the callstack samples collection into kernel space. By default, both the
userspace and kernelspace callstack samples will be collected. This option is used only with the
cstack measurement.
--latency-buckets
--latency-buckets True|False
Specifies whether or not the latency bucket information should appear in dcache measurement
reports.
This option is used only with the dcache measurement.
The default value is --latency-buckets True (the information appears).
For more information, see “dcache Measurement Report Description” (page 193).
--measure-on-interrupts
--measure-on-interrupts on|off|only
Controls whether the performance monitoring unit (PMU) is enabled or disabled while processing
interrupts/traps.
This option is used with the measurements that depend on the PMU for their data: alat, branch,
cpu, cycles, dcache, dtlb, ecount, fprof, icache, itlb, pmu_trace, and scgprof.
on The PMU is enabled during interrupt processing, and enabled during regular processing.
off The PMU is disabled during interrupt processing, and enabled during regular processing.
only The PMU is enabled only during interrupt processing, and disabled during regular
processing.
The default is on for the cpu measurement, no matter which --scope option you use.
For all the other measurements, the default is on if you use the --scope system option, and
off if you use the --scope process option.
This option is not available on Linux. The behavior on Linux is equivalent to
--measure-on-interrupts on.
--memory-usage=
--memory-usage=all|[begin][:timed][:end][:PERIOD[s|m|h]]
Controls the collection and reporting of memory usage data.
--kernel-stack 65
Page 66

NOTE: With this HP Caliper option, you must use a qualifier or an equals sign (=). You cannot
use --memory-usage as the option. You must use --memory-usage=.
If you specify --memory-usage=, then --memory-usage=all is assumed.
Use of this option causes two different sets of memory measurements to be taken, each reported
in its own table in the report:
• Overall memory available (and currently in use and free) on the system
• Memory currently being consumed by the process(es) being measured by a particular HP
Caliper run
For details, see “Measuring Memory Usage Concurrently with Other Measurements ” (p. 154).
--metrics
See “-m or --metrics” (p. 50).
--module-default
--module-default all|none
Specifies the default setting for load module inclusion in the measurement.
If --module-default none is set, then HP Caliper excludes all modules and only looks at the
--module-include list.
If --module-default all is set, then HP Caliper includes all modules and only looks at the
--module-exclude list.
See “Specifying Which Load Modules to Collect Data For” (p. 95).
--module-exclude
--module-exclude module1:module2:...
Specifies explicitly the load modules to be excluded from measurement.
You can specify module names in several ways:
• As a simple file name (libapplib1.so) that matches libraries of this name in any directory
• As a full-path file name (/home/dev/libs/libapplib1.so) that matches only this one
specific library
• As a full-path directory name (/usr/lib/) that matches all libraries within this directory or
any lower subdirectories
For measurements that get their data from the PMU (that is, most of the HP Caliper measurements),
this option will show no data in the Function Summary/Details sections for the selected modules.
However, this does not mean that samples did not occur in these modules.
See “Specifying Which Load Modules to Collect Data For” (p. 95).
--module-include
--module-include module1:module2:...
Specifies explicitly the load modules to be included in the measurement.
You can specify module names in several ways:
• As a simple filename (libapplib1.so) that matches libraries of this name in any directory
• As a full-path file name (/home/dev/libs/libapplib1.so) that matches only this one
specific library
• As a full-path directory name (/usr/lib/) that matches all libraries within this directory or
any lower subdirectories
66 HP Caliper Options
Page 67

See “Specifying Which Load Modules to Collect Data For” (p. 95).
--module-search-path
--module-search-path directory[:directory[:...]]
Specifies a list of directories to search when a load module file (executable or shared library)
cannot be found by using the path obtained from the process. This typically happens if the measured
process uses chroot(2) or chdir(2) and then loads libraries or executes other binaries using
relative paths.
NOTE: In --scope system measurements on HP-UX, HP Caliper cannot locate an executable
or a shared library if it is invoked using a relative path. In addition, at certain times, executables
and shared libraries cannot be located even if they are specified with complete paths. This problem
is due to limitations in APIs provided to collect information about executables and shared libraries
associated with a process on HP-UX.
If this problem occurs, the result can be a large number of samples reported as “unattributed” in
--scope system reports. The workaround is to use the --module-search-path option to
specify a list of directories where the executables and shared libraries for the processes can be
located.
--noinlines
See “--inlines ” (p. 64).
--omr
--omr=OPCODE_MATCH_CHANNEL,MIFB,OPCODE_MATCH,OPCODE_MASK[,PROC_FLAGS]
Specifies the bits to program the PMU's opcode matching registers. Forces PMU event monitoring
to be constrained based on Itanium processor encoding (opcode) of an instruction.
OPCODE_MATCH_CHANNEL is 0 or 1. 0 corresponds to PMC 8 on Itanium2, and PMC 32 and
33 on Integrity servers dual-core Itanium 2 and Itanium 9300
quad-core processor. 1 corresponds to PMC 9 on Itanium2, and
PMC 34 and 35 on Integrity servers dual-core Itanium 2 and
Itanium 9300 quad-core processor.
MFIB is a combination of characters 'm', 'i', 'f' and 'b'. It is used to
specify whether to match M-slot, I-slot, F- slot or B-slot instructions.
OPCODE_MATCH is the opcode bit value against which the instruction encoding is
to be matched. On Integrity servers dual-core Itanium 2 and
Itanium 9300 quad-core processor, it is an integer of 41-bits or
less. On Itanium2, it is an integer of 27-bits or less.
OPCODE_MASK is the mask bit value to apply to the instruction encoding before
matching the OPCODE_MATCH bits. On Integrity servers dual-core
Itanium 2 and Itanium 9300 quad-core processors, it is an integer
of 41-bits or less. On Itanium2 processors, it is an integer of 27-bits
or less.
PROC_FLAGS is a comma-separated separated list of "inv", "ign", "ibrp0",
"ibrp1", "ibrp2" or "ibrp3". The values "inv" and "ign" set the
"inv" and "ig_ad" bits of the opcode match register. These bits
are cleared by default. The values "ibrp0", "ibrp1", "ibrp2" and
"ibrp3" will clear the corresponding bits in the opcode match
configuration register. These bits are set by default..
--module-search-path 67
Page 68

--options-file
See “-f or --options-file” (p. 50).
--output-file
See “-o or --output-file” (p. 51).
--overflow-block
--overflow-block True|False
Specifies whether the target application should be blocked when the PMU sampling buffer is full.
The default is TRUE (i.e., the target application will be blocked until HP Caliper has completed
processing all the samples in the buffer). This option is valid only for PMU based per-process
measurements on Linux.
--per-module-data
--per-module-data True|False
Specifies that all function histograms will be reported by load module instead of the default of
reporting across load modules. Applies only to a PMU histogram report.
--percent-columns
--percent-columns total|cumulative|total:cumulative
Controls whether or not the % Total and Cumulat % of Total columns appear in reports.
The % Total column shows the percent of the total value of a given metric that is attributable to a
given program object. The Cumulat % of Total column shows a running sum of the percent of the
total value of a given metric attributable to the given program object and those listed above it.
Specify total to have reports include a % Total column.
Specify cumulative to have reports include a Cumulat % of Total column.
The default is total:cumulative.
--percent-sample
--percent-sample=threads|process
Displays per thread data with percentages calculated for samples collected for each thread or for
the process. The default value is process. It is helpful if an application has distinct groups of
threads that perform different tasks entirely, so displaying their IP statistics as a percentage of
individual threads is more relevant.
--prim-cutoff
--prim-cutoff percent_cutoff[,cum_percent_cutoff[,min_count]]
Specifies cutoff values that limit the blocking primitives reported in the Primitives section of the
cstack report.
HP Caliper stops reporting information when it reaches a percent cutoff, cumulative percent cutoff,
or minimum number of primitives. You have these choices:
• You can limit the report only to primitives that exceed a specified percentage of the total for
the blocking samples. Once HP Caliper encounters this percentage cutoff, it stops reporting
primitives.
• You can limit the report by having HP Caliper stop reporting call paths once the cumulative
percent of the primitives so far listed exceeds the cumulative percentage cutoff value.
• You can specify an integer for the minimum number of primitives to be displayed.
68 HP Caliper Options
Page 69

This option has these parameters:
percent_cutoff The percentage of the total for the blocked samples that a given
cum_percent_cutoff The value of the cumulative percentage at which HP Caliper stops
min_count Sets the minimum number of primitives to be displayed.
This cutoff also controls the number of holder and waiter thread entries reported for thread
synchronization primitives (HP-UX only).
For more information, see Chapter 11 (page 134)
--process
See “-p or --process” (p. 52).
--process-cutoff
--process-cutoff percent_cutoff[,cum_percent_cutoff[,min_count]]
primitive must exceed to appear in a report. This is shown as percent
cutoff on reports.
Default value is 1.0.
reporting results. This is shown as cumulative percent cutoff on reports.
Default value is 100.
Default value is 10.
Specifies a cutoff value that limits the processes reported in the Process Summary section of a PMU
histogram report. This option is used in conjunction with the --sort-by metric option, which
you can use to specify which metric you want to be used for sorting and cutoffs.
HP Caliper stops reporting information when it reaches either a percent cutoff or a cumulative
percent cutoff:
• You can limit the report only to processes that exceed a specified percentage of the total for
the sorting/cutoff metric. Once HP Caliper encounters this percent cutoff, it stops reporting
processes.
• You can limit the report by having HP Caliper stop reporting processes once the cumulative
percent of the processes so far listed exceeds the cumulative percent cutoff value.
You can also specify an integer for the minimum number of processes to be displayed.
percent_cutoff The percentage of the total for the sorting/cutoff metric that a given
process must exceed to appear on the report. This is shown as percent
cutoff on reports.
Default value is 2.0.
This value takes effect only if the Percent of Total column is selected
for the report.
cum_percent_cutoff The value of the cumulative percentage at which HP Caliper stops
reporting results. This is shown as cumulative percent cutoff on reports.
Default value is 100.
This value takes effect only if the Cumulative percent column is
selected for the report.
min_count Sets the minimum number of processes to be displayed. This is shown
as minimum process entries on reports.
Default value is 5.
If --group-by executable is specified (which is the default), then all processes with the same
basename will have a single entry in the Process Summary.
--process 69
Page 70

If --group-by none is specified, then the Process Summary section will potentially have multiple
entries for processes with the same basename.
For more information, see “Metrics You Can Use for Report Sorting and Cutoffs” (p. 106).
Example
If you specify:
$ caliper fprof --process-cutoff ,80,0 -w
The contents of the Process Summary section is a list of processes containing:
• The processes that account for 80 percent of the total IP samples of all the processes running
in the system.
• Only those processes that each account for more than two percent of total samples. Because
percent_cutoff was not specified, HP Caliper used the default value, 2 percent.
--read-init-file
--read-init-file True|False
Determines whether HP Caliper reads the .caliperinit initialization file at startup. Set to False
to ignore the .caliperinit file. Default value is True.
For more information, see “Specifying Option Values with a .caliperinit Initialization File” (p. 92).
--report
Used only with the caliper info command. See “How to Display Reference Information About
CPU Counters or HP Caliper Report Types” (p. 102).
--report-details
See “-r or --report-details” (p. 52).
--rule-files
Used only with the caliper advise command. See “Command Line to Invoke the Advisor”
(p. 79).
--sampling-spec
See “-s or --sampling-spec” (p. 53).
--scope
--scope
process|system|pset=pset_id[:pset_id:...][,attr-mod|attr-proc|attr-none]
Specifies the scope of what HP Caliper measures. HP Caliper can measure activity on individual
processes (process scope, or per-process measurement) or on all CPUs in the system (system
scope, or system-wide measurement), or on HP-UX systems, on the specified processor sets (psets).
The default is --scope process.
process The subject of measurements is processes, specifically the
threads of execution that make up those processes.
With --scope process, the default privilege level is
user, but you can change this with the
--event-defaults option.
system The subject of measurements is user and kernel activity on
70 HP Caliper Options
all CPUs in the system, at any privilege level you choose.
Page 71

(You can specify the privilege level as user, kernel, or
all with the --event-defaults option. The default value
is all.) Every processor set (pset) is measured.
The samples can be attributed to processes, or to processes
and modules, or not attributed. For example:
• --scope system,attr-mod
Measure for system activity, and attribute samples to
processes and modules within those processes whenever
possible. Samples will be attributed to functions within
those modules, and assembly and source listings in the
Function Details sections are available.
If you use the --scope system option, --scope
system,attr-mod is the default.
The --scope system,attr-mod option can also
be specified as -w.
• --scope system,attr-proc
Measure for system activity, and attribute samples to
processes (but not to modules within those processes)
whenever possible. No Function Details sections are
available, because attribution of samples is not done
on specific modules.
• --scope system,attr-none
Measure for system activity, but do no attribution to
individual processes running on the system. The only
sample attribution possible is to kernel modules.
Therefore, this qualifier makes sense only if the privilege
level is kernel or all.
When the scope is system, the command-line arguments
program and program_args should not be provided.
pset
pset_id[:pset_id:...]
For details on how to use --scope system, see “Using --scope system for System-Wide
Measurements.”
The subject of measurement is user and kernel activity on
all CPUs belonging to the specified processor sets (psets).
(You can change the privilege level using the
--event-defaults option). For example, --scope
pset 0:1 measures all CPUs belonging to psets 0 and 1.
You can use the psrset -i command to find the processor
assignment for all processor sets in the system.
Using --scope system for System-Wide Measurements
When the scope is system, you can specify whether you want the samples to be attributed to the
processes they belong to, or to the processes and the modules of those processes, or not attributed.
Using --scope system is a good first measurement method, allowing you to drill down and
measure individual applications.
With --scope system, the reports for processes and modules look similar to per-process HP
Caliper collection runs. A report is produced for each process or module that HP Caliper recognizes
as a process or module. In addition, a report for the system as a whole is produced, which contains
samples that HP Caliper could not attribute to any individual process.
--scope 71
Page 72

When --scope system is used, for most measurements, HP Caliper measures all user and kernel
activity: either all user and kernel activity or individual processes or the modules of those processes.
When --scope system is used, HP Caliper continues collecting data until you stop it with Ctrl-C.
You can also specify the number of seconds to collect data with the -e option.
For example, to create a Flat Profile (fprof) report for all activity on the system for 20 seconds:
$ caliper fprof -o fprof.txt --event-defaults PLM-kernel --scope system -e 20
HP Caliper also provides two options (used only with the --scope system option) that help you
limit the information it collects. For more information, see “--exclude-caliper ” (p. 62) and
“--exclude-idle ” (p. 62).
Limitations in Using --scope system
• You cannot use the --scope system option if another HP Caliper process is running on
the system. Using the --scope system option also prevents another HP Caliper process
from starting until the kernel measurement finishes.
• On HP-UX, you can only use the --scope system option when logged in as the root user.
(On Linux, you do not need to be root user.)
• In --scope system measurements on HP-UX, HP Caliper cannot locate an executable or
a shared library if it is invoked using a relative path. In addition, at certain times, executables
and shared libraries cannot be located even if they are specified with complete paths. This
problem is due to limitations in APIs provided to collect information about executables and
shared libraries associated with a process on HP-UX.
If this problem occurs, the result can be a large number of samples reported as “unattributed”
in --scope system reports. The workaround is to use the --module-search-path option
to specify a list of directories where the executables and shared libraries for the processes
can be located.
• On Linux, you cannot use the --exclude-caliper and --exclude-idle options to
exclude time spent in HP Caliper processing and in the idle loop. (These options are both set
to False and cannot be changed.) Thus, you cannot directly compare --scope system
measurements between HP-UX and Linux.
--search
Used only with the caliper info command. See “How to Display Reference Information About
CPU Counters or HP Caliper Report Types” (p. 102).
--skip-functions
--skip-functions func1[, func2, ...]
Specifies one or more functions that are of no interest. If a call stack sample contains any of the
specified functions as a leaf entry, HP Caliper will skip the function while reporting the call stack
profile.
The maximum number of functions that can be specified is 100.
For more information, see Chapter 11 (page 134).
--sort-by
--sort-by metric
--sort-by metric,cpu_event
Specifies that performance data is to be sorted by values of the specified metric.
For more information, see “Available Metrics for Report Sorting and Cutoffs” (page 108).
72 HP Caliper Options
Page 73

--source-path-map
--source-path-map pathmap1[:pathmap2:...]
Specifies the path map to use for finding source files used for reporting source statements.
Applies to any PMU histogram report, which is the only kind of report that references source code.
Path map entries are separated by a colon (:) and applied in order until HP Caliper finds a file
match.
• Simple entries are prepended to file names.
• You can provide substitute paths by using comma-separated entries. HP Caliper substitutes
the path to the left of the comma with the path to the right of the comma.
• Perl regular expressions are allowed in the left half of a substitution.
--stop-functions
--stop-functions func1[,func2, ...]
As of Caliper 5.2, the kernel unwinding is turned on by default in cstack measurement. When
HP Caliper is run as root, the cstack measurement now records and reports both user and kernel
space portions of the call stack.
The --stop-functions option is used to specify the list of kernel stop functions beyond which
the call stack frames are obvious, and there is no interest in showing them. This list is used to avoid
unnecessary kernel unwinding. While collecting kernel frames, the unwinding is stopped once any
of the specified kernel stop functions is reached.
The default kernel stop functions are specified in the cstack configuration file. They are real_sleep, sleep_pc, sleep, ksleep, sleep_one, ksleep_one, swtch,
swtch_to_thread, sleep_park.
--summary-cutoff
--summary-cutoff percent_cutoff[,cum_percent_cutoff[,min_count]]
Specifies cutoff values that limit the functions reported in the Function Summary section of a PMU
histogram report. This option is used in conjunction with the --sort-by metric option, which
you can use to specify which metric you want to be used for sorting and cutoffs.
HP Caliper stops reporting information when it reaches either a percentage cutoff or a cumulative
percentage cutoff:
• You can limit the report only to functions that exceed a specified percentage of the total for
the sorting/cutoff metric. Once HP Caliper encounters this percentage cutoff, it stops reporting
functions.
• You can limit the report by having HP Caliper stop reporting functions once the cumulative
percent of the functions so far listed exceeds the cumulative percentage cutoff value.
You can also specify an integer for the minimum number of functions to be displayed for all load
modules.
percent_cutoff The percentage of the total for the sort metric that a given function
must exceed to appear on the report.
Default value is 0.1.
This value only takes effect if the percent-of-total column is selected
for the report.
cum_percent_cutoff The value of the cumulative percentage at which HP Caliper stops
reporting results.
Default value is 100.
--source-path-map 73
Page 74

min_count Sets the minimum number of functions to be displayed for all load
For example, if you specify the command line:
caliper fprof --summary-cutoff ,80 wordplay
The contents of the function summary section will be a list of functions containing:
• The functions that account for 80 percent of the total IP samples in the wordplay program.
• Only those functions that each account for more than 0.1 percent of total samples for all load
modules. Since percent_cutoff was not specified, HP Caliper used the default value, 0.1
percent.
--sw-process-list=
--sw-process-list=pid[,pid[,...]]
Specifies a list of processes to analyze, in the system-wide mode (-w option). A comma-separated
list of process ids (pids) following '=' specifies the processes to be analyzed. This option is used
to reduce the overhead of Caliper in the system-wide mode.
This value only takes effect if the cumulative percent column is selected
for the report.
modules.
Default value is 5.
NOTE: With this HP Caliper option, you must use a qualifier or an equals sign ('='). You cannot
use --sw-process-list as the option. You must use --sw-process-list=.
--system-model (Linux only)
--system-model model-number,number-of-cells
Specifies the system model number and number of locality domains for reporting latency buckets
with the dcache measurement.
This option is necessary if you want HP Caliper to report system-specific latency buckets on Linux.
If you do not use this option, a default set of latency buckets will be used.
On HP-UX, HP Caliper automatically obtains the model number using the model command.
For more information, see “dcache Measurement Report Description” (page 193).
Example
--system-model rx8640,1
--system-usage=
--system-usage=[all][:runstatus][:cpu][:io][:syscalls]
Controls the collection and reporting of system usage data.
runstatus Measure how much time each process spent running, eligible to run but not running,
and waiting.
cpu Measure how much of each process or thread was spent on each CPU and how
often the process or thread was moved to another CPU.
io Measure how much of each process or thread was spent on I/O reads and writes.
syscalls Measure the count and time spent in every system call called by a process.
all Measure everything specified by runstatus and syscalls.
The default value is all.
74 HP Caliper Options
Page 75

NOTE: With this HP Caliper option, you must use a qualifier or an equals sign (=). You cannot
use --system-usage as the option. You must specify --system-usage=.
If you specify --system-usage=, then --system-usage=all is assumed.
For details, see “Measuring System Usage Concurrently with Other Measurements ” (page 158).
--term-display
The --term-display option is no longer supported.
--threads
--threads sum-all|all
Enables per-thread reporting.
Default value is all.,
all Collect and report data per thread.
sum-all Collect and report data summed across all threads.
For a multithreaded program, the Function Summary and the Function Details sections
of reports show information across threads in addition to the per-thread Function
Summary and Function Details sections.
sum-all measures multithreaded applications as one entity. That is, HP Caliper
produces a single report with the results of all threads aggregated together.
This option is supported for these measurements:
• alat
• branch
• cstack
• dcache
• dtlb
• fprof
• icache
• itlb
--traps-reported
--traps-reported trap1[,trap2,...,trap6]
Specifies which traps HP Caliper should report information about when the traps measurement
is run.
You can specify the names of 1 to 6 comma-separated traps. (A trap in this context is a trap,
interrupt, or fault.)
Available on Integrity servers dual-core Itanium 2 and Itanium 9300 quad-core processors only.
If you do not use this option when you run the traps measurement, by default the top 6 traps are
reported.
When the traps measurement is run , information about all 34 traps is collected. The
--traps-reported option only dictates what is reported. You can get a report on different traps
from the same database, using different caliper report runs.
By default, the traps report is sorted on the number of samples in the first trap in the trap list (the
Samples per Trap column in the report). To sort on the total number of trap samples (the Trap
Samples column), use the --sort-by samples option.
--term-display 75
Page 76

For information about all the traps you can specify, see “traps Measurement Report Description ”
(page 227).
--user-regions
--user-regions default|rum-sum
For runs involving the PMU, specifies whether the data should be collected for the entire run
(--user-regions default), or only in regions delimited by the PMU enable/disable instructions
rum and sum.
For more information, see “Restricting PMU Measurements to Specific Code Regions” (p. 163).
--version
See “-v or --version” (p. 54).
76 HP Caliper Options
Page 77

6 Using the HP Caliper Advisor
This chapter introduces you to the HP Caliper Advisor and provides some example programs to
show you how to get started using the Advisor from the command line. For information on how to
use the Advisor in the HP Caliper graphical user interface (GUI), see Chapter 7 (page 86).
For details about how to write rules for the Advisor, see the HP Caliper Advisor Rule Writer Guide.
What Is the HP Caliper Advisor?
The HP Caliper Advisor is a rules-based expert system designed to provide guidance about
improving the performance of an application. It does not make any performance measurements
itself. Instead, it analyzes the data collected by previous HP Caliper runs. It can answer questions
such as:
• Where do I begin to understand my program's performance?
• What does a particular metric mean?
• What is the “normal” range for a particular performance metric?
• Which measurement(s) should I make next?
• I know that a particular performance problem is happening, and what can I do to change it?
• I made a change, but did it really improve the performance of my application?
The Advisor analyzes individual executable programs. Future releases of HP Caliper are expected
to provide advice on system and shared library performance issues.
Limitations to Keep in Mind
The HP Caliper Advisor can only analyze the performance data it is given. It is possible that an
existing performance problem might be “hidden” from analysis and, therefore, not reported on.
Some of the advice given might not be applicable in your situation. The performance issue(s) found
are valid, but might be simply a characteristic of your application and not a problem.
Example of an HP Caliper Advisor Report
Example 1 shows an example of an HP Caliper Advisor report.
What Is the HP Caliper Advisor? 77
Page 78

Example 1 HP Caliper Advisor Report
===========================================================================
HP Caliper 4.3.0 Advisor Report for my_app
===========================================================================
Analysis Focus
Executable: /tmp/my_app
Last modified: August 15, 2004 at 03:10 PM
Processor type: Itanium2 9M
Processor speed: 1599 MHz
OS version: HP-UX 11.23
Performance Databases
/home/me/.hp_caliper_databases/cpu - March 23, 2005 at 11:17 AM
/home/me/.hp_caliper_databases/fprof - March 23, 2005 at 07:52 PM
Rule Files
default - Default Caliper Advisor rules
@ /opt/caliper/rules
-------------------------------------------------------------------------- Index Class Analysis
---------------------------------------------------------------------------
23.9 cpu Function profile [cpu_fprof_1]
The following functions account for 23.9% of the CPU cycles
used by the application. Improving the algorithm(s) used in
these routines and/or increasing the compiler optimization
level can improve performance.
11.9% compare_items
8.2% search_dbase
3.8% new_item_insert
Use the following Caliper command to get a source listing of
the 'hot spots' in these routines:
caliper report fprof
---------------------------------------------------------------------------
16.6 memory ITLB misses [mem_itlb_general]
The percentage of ITLB misses (16.6%) is higher than normal.
This may indicate a poor setting for the virtual memory
instruction page size.
Try adding "+pi 4M" to the application's link command.
--------------------------------------------------------------------------* Note: 1 piece of advice was not printed due to cutoff limits and/or
selection criteria.
--------------------------------------------------------------------------[Minimum index: 5.0, minimum count: 5, maximum count: 15]
---------------------------------------------------------------------------
Steps in Using the Advisor
The Advisor is part of an iterative process of building, measuring, understanding, and tuning an
application's performance, as shown in Figure 13 (page 79).
78 Using the HP Caliper Advisor
Page 79

Figure 13 Steps in Using the Advisor
Make
sugg ested
chang es
Make
sugg ested
per formanc e
runs
Gai n better
und erstandin g
of appl ication
per formanc e
Start
Buil d
appl icat ion
One or more
HP Calip er
per formanc e
runs
HP Calip er
Advisor
End
To use the HP Caliper Advisor, you perform these steps:
1. Build the application with an initial set of compiler/linker options.
2. Make one or more HP Caliper measurement runs on the application, keeping track of the
names of the databases where the performance data is kept.
3. Run the Advisor, using the databases containing the performance data. The advice is output
(printed) in a report file from the Advisor, with this kind of information:
• Explanations of the performance problems indicated by the performance data collected
• Suggestions for changes to the application code, compiler options, linker options, and
so forth for improving the identified performance problems
• Suggestions for additional performance runs to further investigate the identified or other
potential performance problems
4. Based on the advice you receive from the Advisor, do either of the following:
• Change the application code and/or build options and start over at step 1 with the
revised application and a new set of performance measurements and databases.
or:
• Make new performance measurements in step 2, saving the data to a new database,
and rerun the Advisor.
5. Continue making adjustments as long as you keep receiving meaningful data.
Command Line to Invoke the Advisor
The command line is:
$ caliper advise [advise_options] [database_list]
where advise_options are:
--advice-classes [all]|[[general][:cpu][:memory][:io][:system]]
--advice-cutoff min-index[,min-count[,max-count]]
--advice-details [all]|[[description][:improvement][:measurement]
[:explanation][:rule]]
--analysis-focus [executable:]name|all[,[executable:]name],...
Command Line to Invoke the Advisor 79
Page 80

–o outputfile[,append|create]
--rule-files rulefile1[,rulefile2,...]
For these options:
--advice-classes Specifies which classes of advice are printed. It can be all or any
combination of general, cpu, memory, io, or system, separated
by colons (:).
The default is all.
--advice-cutoff Specifies how much of the advice to print. All advice is sorted by its
index value (the greater the index, the greater the importance).
min-index specifies the lowest index value of advice to print.
min-count gives the minimum number of advice items to print while
max-count gives the maximum number. min-count takes precedence
over min-index, so if only a few pieces of advice apply, some with
an index less than min-index might be printed.
The defaults are 5.0 for min-index, 5 for min-count, and 15 for
max-count.
--advice-details Specifies what portions of advice messages are printed. It can be all
or any combination of description, improvement, measurement,
explanation, or rule, separated by colons (:). Advice messages
don’t necessarily contain all of these portions.
The default is all.
--analysis-focus Specifies which application object(s) to analyze and report on. Currently,
only executable programs can be analyzed, so specifying the default
focus type of executable is optional. The object name can be all
or a specific, simple executable name such as my_app. One or more
executables can be specified with this option, separated by commas
(,).
The default is executable:all.
-o Specifies the name of the report file produced by the Advisor. The report
file is in text format. The Advisor will either create a new file (create)
or append to an existing file (append).
The default file is stdout and the default action is create.
Can also be specified as --output-file outputfile.
--rule-files Specifies the name or names of existing rule files to use for the analysis.
One or more rule files can be given, separated by commas (,). A rule
file can be a customized rule file in your own personal rules directory
or a standard HP Caliper rule file in the HP Caliper directory. A rule file
can be either a simple filename or a relative or absolute path name.
For a simple filename, directories are searched in this order: (1) the
current directory, (2) the personal rules directory ~/caliper_advisor,
and (3) the rules subdirectory in the HP Caliper home directory.
database_list is a set of one or more HP Caliper databases to analyze. If the databases are
specified by name (with or without a path), they are looked for at those locations. If they are
specified only by name, they are looked for in these locations, in this order: (1) current directory,
then (2) databases directory. If no databases are specified by name, all the databases in the
databases directory are analyzed.
For information about what the options mean, see “How to Read an Advisor Report” (p. 83).
80 Using the HP Caliper Advisor
For a relative or absolute path name, no searching is done.
Page 81

As with the HP Caliper command-line options, each of the Advisor’s command-line options has a
variable counterpart in the .caliperinit file that can set an option value. The variable name
is the same as the option, with hyphens (-) replaced with underscores (_). Later uses of the same
command-line option or .caliperinit file variable overrides earlier uses.
Getting Started with the Advisor: Examples
To run the Advisor, you need to make one or more HP Caliper measurement runs on an application.
Simplest Example
Assume that you have made these data collection runs:
$ caliper cpu my_app
$ caliper fprof my_app
$ caliper ecount my_app
The output databases are saved in the databases directory by default and are named cpu, fprof,
and ecount.
Then, you run the Advisor using this command:
$ caliper advise
HP Caliper looks in the databases directory for databases and produces an analysis of all current
HP Caliper runs, using all the databases in the databases directory. If no databases are found,
you receive an error message telling you that there are no runs to analyze.
The analysis report is produced on stdout.
NOTE: You will receive an error message specifying that the “global name 'dbase_dir' is not
defined” if the default databases directory contains old performance data. To correct this problem,
you should delete the old performance data in the databases directory or specify a different
database path. For information on how to specify a database path, see “Command Line to Invoke
the Advisor” (page 79).
More Typical Examples
These examples are more typical of how you will use the Advisor.
When you first start using the Advisor, you will typically run these measurements:
• On HP-UX systems, use:
$ caliper cpu my_app
$ caliper fprof my_app
• On Linux systems, use:
$ caliper ecount my_app
$ caliper fprof my_app
Next, run the Advisor on the collected performance data:
$ caliper advise
HP Caliper looks for the databases in the databases directory and produces an analysis report on
stdout. If the Advisor recommends an additional measurement run, make the run. For example:
$ caliper dcache my_app
Then, re-run the Advisor to analyze the full set of performance data and produce a more
comprehensive analysis report:
$ caliper advise
If any suggested changes are made to the application, then you can measure and analyze the
revised program:
$ caliper cpu my_new_app
Getting Started with the Advisor: Examples 81
Page 82

or:
$ caliper ecount my_new_app
followed by:
$ caliper fprof my_new_app
$ caliper dcache my_new_app
Then, run the Advisor on the composite performance data:
$ caliper advise
Explanation of Report Output
Figure 14 (page 82) shows the report output from the Advisor. The report is explained further in
“How to Read an Advisor Report” (p. 83).
The numbers (which are bold in the PDF version of this guide) are annotations to explain the
report—they are not part of the output you receive. See the list at the end of the report for the
explanations.
Figure 14 HP Caliper Advisor Report, with Annotations
===========================================================================
HP Caliper 4.3.0 Advisor Report for my_app
===========================================================================
Analysis Focus
Executable: /tmp/my_app
Last modified: August 15, 2004 at 03:10 PM
Processor type: Itanium2 9M
Processor speed: 1599 MHz
OS version: HP-UX 11.23
Performance Databases
/home/me/.hp_caliper_databases/cpu - March 23, 2005 at 11:17 AM
/home/me/.hp_caliper_databases/fprof - March 23, 2005 at 07:52 PM
Rule Files
default - Default Caliper Advisor rules
@ /opt/caliper/rules
---------------------------------------------------------------------------
Index Class Analysis
---------------------------------------------------------------------------
23.9 cpu Function profile [cpu_fprof_1]
The following functions account for 23.9% of the CPU cycles
used by the application. Improving the algorithm(s) used in
these routines and/or increasing the compiler optimization
level can improve performance.
11.9% compare_items
8.2% search_dbase
3.8% new_item_insert
Use the following Caliper command to get a source listing of
the 'hot spots' in these routines:
caliper report fprof
---------------------------------------------------------------------------
16.6 memory ITLB misses [mem_itlb_general]
1
2
3
4
5
6
Try adding "+pi 4M" to the application's link command.
The percentage of ITLB misses (16.6%) is higher than normal.
This may indicate a poor setting for the instruction page size.
---------------------------------------------------------------------------
[Minimum index: 5.0, minimum count: 5, maximum count: 15]
---------------------------------------------------------------------------
1
Application object being analyzed, which
version (when it was last modified), the
82 Using the HP Caliper Advisor
7
5
First piece of advice, set off by a line of
dashes (--------).
Page 83

processor type and speed, and operating
system version.
2
Performance databases being analyzed.
3
Rule files that were used.
4
Advice section, giving performance tuning
advice.
This was run on an HP-UX 11i V2 September 2004 OE system. Reports run on other systems look
similar, except that the specific advice given is unique to the application and the system.
How to Read an Advisor Report
Each Advisor run analyzes one or more application objects. (Currently, only executable objects
can be analyzed.) A separate report is output for each object analyzed. The reports are in
alphabetic name order.
See “HP Caliper Advisor Report, with Annotations” (p. 82) for an example report.
The description section of the report precedes the advice section. The description section is important
because the given set of databases might contain several different executables, different versions
of the same executable, and performance data from the same or different types of systems. The
Advisor reports specifically which version, of which executable, and measured on which system
that the advice applies to. In general, the Advisor selects the most recent version of each executable
it finds in the database(s) and only uses consistent performance data for each analyzed object.
There are three elements to a piece of advice:
6
Second piece of advice, set off by a line of
dashes (--------).
7
Cutoff settings, which specify how much of the
advice to print.
• Index
The index value represents the approximate importance of a particular piece of advice. The
values typically range from 0.0 to 100.0. The index value does not indicate the improvement
that could be achieved if the improvement suggestion is followed. It is a rough means of
ordering the relevance of various unrelated performance issues. You can use the Advisor
--advice-cutoff command-line option to specify what the minimum index value should
be.
• Class
All advice is classified as to what area of application performance it applies to. Every piece
of advice belongs to an advice class, which is one of the following:
◦ General: advice that doesn’t fit into a single category or can’t easily be classified
◦ CPU: items pertaining to non-memory CPU cycles
◦ Memory: for memory-related performance issues
◦ IO: for any I/O advice
◦ System: advice relating to system calls, system resources, process management, and so
forth
You can use the Advisor --advice-classes command-line option to specify which classes
of advice should be included in the report.
• Analysis
This is where the performance advice is printed.
An example is shown below.
The numbers (which are bold in the PDF version of this guide) are annotations to explain the
report—they are not part of the output you receive. See the list at the end of the report for the
explanations.
------------------------------------------------------------------------------ Index Class Analysis
How to Read an Advisor Report 83
Page 84

-------------------------------------------------------------------------------
23.9 cpu Function profile 1 [cpu_fprof_1]
The percentage of ITLB misses (16.6%) is higher than normal.
This may indicate a poor setting for the virtual memory
instruction page size.
3
2
Try adding "+pi 4M" to the application's link command.
Use the following Caliper command to get a source listing of
the 'hot spots' in these routines:
caliper report fprof
1
Description: Brief text describing what
4
the advice is about.
2
Rule: Name of the rule that generated
5
this advice.
3
Explanation: What this performance
5
Improvement: What you can do to try
to improve performance in this area.
Measurement: Which additional HP
Caliper measurements might yield more
information in this performance area.
4
area is, what the related metrics
mean, what might affect it, and so
forth.
A given piece of advice will not necessarily contain all of the above information. You can use
the Advisor --advice-details command-line option to specify which information should
be printed.
In “HP Caliper Advisor Report, with Annotations” (p. 82), the first piece of advice is lacking
explanation text, and the second piece of advice is lacking measurement text.
If any pieces of advice were excluded from the report (based on command-line options), that
information is printed at the end of the report.
Suggestions for Using the HP Caliper Advisor
Here are some suggestions for getting the most out of the Caliper Advisor:
• You can analyze measurement data from new and old versions of your application at the
same time. The HP Caliper Advisor will ignore all performance data for older versions of each
executable.
• Make only a few HP Caliper performance measurement runs to start with and let the Advisor
suggest when others are appropriate. This minimizes the number of runs and allows the Advisor
to recommend optimal options (especially sampling rates) to use when making the
measurements.
• Make all of the performance runs on the same type of system. Performance data from runs
made on incompatible systems will be ignored.
• Save each HP Caliper performance run in a separate database. This makes it easier later to
mix-and-match databases for analysis.
• When you re-run the Advisor, be sure to list all of the available, current databases: the initial
ones and all additional ones. This gives the Advisor the most performance data to work with.
• If the application program is rebuilt, then start over with new performance measurements and
new databases. The Advisor will ignore obsolete data, but doing so can slow down processing.
• If a large amount of advice is not printed due to cutoff limits, try increasing the limits to see
other relevant advice. There may be some particularly useful advice just below the cutoff.
• Codify some of your past application-specific performance analysis by writing custom rules.
This customization of the Advisor helps to catch future application performance regressions.
84 Using the HP Caliper Advisor
Page 85

• The ordering of rule files and databases on the command line makes no difference to the
results produced by the Advisor. The only exception is in the case where the databases contain
data from different, incompatible systems for the same executable object.
• If you want to use multiple rule files, consider writing a “super” rule file that merely ‘includes’
the real rule files. If you do this, only the super rule file needs to be given on the command
line. If that rule file is named default, then you don't need to use the --rule-files option.
• You can add frequently used command-line options as variables to the .caliperinit file
to save typing. Just remember that .caliperinit variable names have slightly different
spelling: the command-line-equivalent hyphen (-) is replaced with the underscore (_).
How the HP Caliper Advisor Works
Here is a simplified explanation of how the Advisor works to clarify how analysis objects are
selected and which performance data is used:
1. The command-line options and .caliperinit variable settings are processed and verified.
If there are any errors, they are reported and the run terminates.
If no databases are specified, all the databases in the databases directory are opened and
validated. If there are any errors, the errors are reported and the run terminates. If there is no
data to analyze, the Advisor prints a “how to get started” help message and the run terminates.
2. All the specified databases are opened and validated. If there are any errors, they are reported
and the run terminates.
3. All the databases are scanned for executable objects to analyze that match the selection
criteria. By default, all objects with performance data are analyzed. Alternatively, you can
use the --analysis-focus option or the analysis_focus variable in the .caliperinit
file to choose specific objects to analyze. If multiple versions of the same object exist, the one
with the most recent modification date/time is chosen and the older versions are ignored. The
list of objects to analyze is now sorted in alphabetic name order.
If the Advisor cannot find any of the requested objects in the databases given, the run terminates
with an appropriate message.
4. For each executable object to be analyzed, all consistent performance data for that object is
identified within the databases. To be consistent, only performance data that was collected
on the same type of system (operating system, processor type, and processor speed) is used.
The first measurement instance of each analysis object is used as the system type to match.
Performance data collected on a different type of system is not used in the analysis.
5. All the specified rule files are read and precompiled in the order given by the --rule-files
option or the rule_files variable in the .caliperinit file. If no rule files are provided,
then the default rule file is used.
Each rule file is a Python script containing one or more independent rule functions. When
called later, each rule function retrieves the needed performance data for the object being
analyzed, makes decisions about a possible performance problem, and, if appropriate,
generates one or more advice messages.
6. For each application object to be analyzed, a new report is started, all rule functions are
called for that one object, and all applicable advice is gathered, sorted, and printed.
How the HP Caliper Advisor Works 85
Page 86

7 Using the HP Caliper Advisor in the GUI
This chapter describes how to use the HP Caliper Advisor in the HP Caliper graphical user interface
(GUI). It assumes that you have some familiarity with the Advisor.
For information about the HP Caliper Advisor, see Chapter 6 (page 77).
For information about the HP Caliper graphical user interface (GUI), see Chapter 3 (page 32).
Basic Steps in Using the HP Caliper Advisor in the GUI
Using the Advisor in the GUI is similar to using it by means of the command-line interface, but
easier. The basic steps are:
1. Make one or more HP Caliper performance measurement runs in the GUI, or import previously
collected data.
2. [Optionally] select the performance data that you want analyzed.
3. Click on the Generate Advice button or menu choice.
4. Review and follow the advice given in the Advisor report.
This advice might suggest additional measurement runs to gather more performance data for further
analysis. If so, simply repeat steps 1 through 4.
Making Performance Measurement Runs
The Advisor has a wide range of analysis rules that cover the different measurements that HP
Caliper can make. You might already have an idea of the type of performance problem you have
and might have already made some measurement runs. Start with that data.
If you do not know where to start, the following measurements are good to make:
Sampled call graph (the default measurement)
CPU metrics (HP-UX only)
CPU cycles (flat profile) (Integrity servers dual-core Itanium 2 and Itanium 9300 quad-core processor
systems only)
The more performance data the Advisor has available to analyze, the better the advice it can give.
However, you can start using the Advisor with as little as one set of measurement data. This data
will guide you in additional measurements to make.
Figure 15 shows the HP Caliper GUI.
86 Using the HP Caliper Advisor in the GUI
Page 87

Figure 15 HP Caliper GUI
In this screen shot of the GUI, you can see that three measurement runs have already been made:
two in the Before Changes project (a CPU Cycles Run and a Data Cache Misses Run) and one in
the After Changes project (a CPU Cycles Run).
The application being measured is the HP C/C++ compiler, compiling the “Hello World” program.
The application consists of three processes: cc, ecom, and ld.
Note that these are default measurement runs. That is, no special measurement options were used.
The user entered the compile command to be measured on the Target page of the Collect view,
selected the measurement to make on the Measurement page, and clicked the Start button. The
requested measurement run was made and an index of the new datasets available was added to
the list in the Projects view.
Selecting Performance Data to Analyze [Optional]
By default, the HP Caliper Advisor analyzes data from all of the measurement runs in the current
project. This is typically what you want, so this step is optional.
If you have a special situation, there are two ways to select what performance data the HP Caliper
Advisor analyzes:
• You can select one or more projects (implying all of their measurement runs).
• You can select one or more measurement runs from any project.
Selecting Performance Data to Analyze [Optional] 87
Page 88

In either case, you select an entire project or a measurement run by clicking on its name in the
Projects view. You can select more than one item (on Windows) by holding the Ctrl key while
selecting the additional ones.
Figure 16 shows the Projects view, with a single project, Before Changes, selected. Every
measurement run in the project is also selected.
Figure 16 Projects View, with a Single Project Selected
Figure 17 shows the Projects view, with a single measurement run, Data Cache Misses Run, selected.
Every dataset in the run is also selected.
88 Using the HP Caliper Advisor in the GUI
Page 89

Figure 17 Projects View, with a Single Measurement Run Selected
Generating Advice
The easiest step is getting the HP Caliper Advisor to analyze the selected performance data and
generate advice.
Figure 18 shows the GUI toolbar. The square icon with a blue checkmark inside means check the
performance data. If you “hover ” over the icon, the popup tooltip says Generate Advice. Simply
click on the icon. The Advisor will analyze all of the selected performance data and automatically
bring up an Advisor view with the generated advice.
Figure 18 HP Caliper GUI Toolbar
Figure 19 shows the Advisor menu, which has two actions: Generate Advice and Show Advisor
View.
Generating Advice 89
Page 90

Figure 19 HP Caliper GUI Advisor Menu
Generate Advice does the same thing as the toolbar icon: generate new advice from the selected
performance data and display it in an Advisor view.
Show Advisor View brings up the Advisor view with the advice from the last analysis run. You can
use this option to retrieve the Advisor view if you previously closed it. This action also appears in
the Window/Show View menu.
Reviewing and Acting on the Advice
The hardest part of tuning the performance of an application is figuring out what to do. The HP
Caliper Advisor tries to help with that. By analyzing already collected performance data, the
Advisor tries to guide you to potential performance problems in your application and suggest
possible ways to improve them. It gives three different types of advice:
• Improvement advice suggests specific actions that you can try that might improve a performance
problem. This is the most helpful type of advice.
• Measurement advice suggests a specific HP Caliper measurement to take to further diagnose
a potential problem. If you do make the suggested measurement run(s), then regenerate the
Advisor analysis. Doing so will often trigger some more improvement advice.
• Explanation advice tries to explain what a specific performance metric means and why it
might indicate a problem area. Ideally, this type of advice gives you some insight into a
performance problem.
Not every identified performance problem will include all three types of advice. The advice you
receive depends on the actual situation, the type of problem, and the data currently available.
Figure 20 shows an example Advisor report in the GUI.
90 Using the HP Caliper Advisor in the GUI
Page 91

Figure 20 Advisor Report in the HP Caliper GUI
The individual (potential) performance issues are separated by horizontal lines. The first line of
each section gives five pieces of information: the name of the executable, an index value for the
issue, which category or advice class (CPU, memory, I/O, and so forth) the issue falls in, a brief
description of the performance issue, and the name of the Advisor rule that detected this issue.
This line is followed by from 1 to 3 sections of advice in this order: improvement, measurement,
explanation.
The index value gives the relative importance of the performance issue in your application. The
larger the value, the more significant the issue is. There is no meaning to the number itself; it is
simply a rough way to prioritize the issues. By default, the Advisor report is sorted with the more
important issues (no matter which executable they are in) listed first. The index value is thus the
sort key. You can click on the column headings Executable, Index, or Class to make that item the
sort key. The down arrow on a column heading indicates the sorted column.
When measurement advice is given, it includes the pages and values to change within the Collect
view.
For example, consider this line:
Measurement / Measurement = Data cache misses
Sampling / Rate = 10
This advice tells you to select the Data cache misses measurement on the Collect view's Measurement
page and to set the Rate field on the Sampling page to 10. Of course, you also need to have the
Target page information filled in, but that should still be there from the last measurement run made.
Reviewing and Acting on the Advice 91
Page 92

8 Configuring HP Caliper
HP Caliper gives you multiple methods for configuring how HP Caliper collects data and reports
results.
Specifying Option Values with a .caliperinit Initialization File
If you have an initialization file (called .caliperinit), HP Caliper automatically uses it at startup
for data collection or data reporting runs. Putting the options in an initialization file simplifies the
command line you use. This file is not required, but can be useful.
For example, you can specify your preferred sorting options for each type of report as well as
global settings for all of your reports, such as system library to exclude and output file locations,
and even the name of the application program and its arguments. With your preferences in the
.caliperinit file, you can then simply type:
$ caliper ecount
The resulting report uses your predefined preferences. Using this approach, you can change your
preferences without having to change the HP Caliper command line in a Makefile.
The initialization file must be named .caliperinit. It can be in the current working directory,
your home directory, or in both locations. When you start HP Caliper, it looks first in the working
directory for a .caliperinit file. It then looks in your home directory.
By default, if you have a .caliperinit file, HP Caliper will use it. (That is, the
--read-init-file option is set to True.) You can set this option to False if you do not want
the file read for a particular run.
NOTE: See “Multiple Ways to Specify HP Caliper Option Values” (p. 48) for information about
what you have to do differently to specify options in the .caliperinit file. Also see “Hierarchy
for Processing an Option Value” (p. 49).
Example of a .caliperinit File
A .caliperinit file is a Python script, similar to an HP Caliper measurement configuration file.
Figure 21 (page 93) shows an example .caliperinit file. This file is available in the software
kit in the location examples/startup_file/caliperinit in the HP Caliper home directory.
You can copy the file and edit it to suit your needs. You must rename it to .caliperinit.
92 Configuring HP Caliper
Page 93

Figure 21 .caliperinit File
********************************************************************
#Options applied to all report types.
application ='myapp'
arguments = '-myarg 2'
context_lines = 0,3
summary_cutoff = 1
detail_cutoff =5
source_path_map = '/proj/src,/net/dogbert/proj/src:/home/wilson/work'
#Report-specific options.
if caliper_config_file == 'branch':
sort_by = 'taken'
elif caliper_config_file == 'fprof':
sort_by = 'fcount'
report_details = 'statement'
context_lines = 'all'
# Apply an option to a subset of reports.
if caliper_config_file in ("fcount"):
module_exclude = '/usr/lib/'
********************************************************************
To apply an option to only one type of report, use an if clause specifying the measurement
configuration file name followed by the options for that measurement configuration file. For example,
to specify the program to profile and the arguments to use and sort the results by the fcount
value, you would write this in your .caliperinit file:
if caliper_config_file == 'fcount':
application="/opt/mpi/bin/mpirun"
arguments = "-np 2 /proj/dynopt/test_fe/mpi_hello_world"
sort_by = "fcount"
Setting Constants in the .caliperinit File
There are several constants that you can set in the .caliperinit file or in a measurement
configuration file to give you additional control over reports. These constants, which are not
available from the HP Caliper command line, are:
• disasm_target_name_limit = limit
Specifies the maximum number of characters to print for branch target symbols in the
disassembly listing. (Default: 30.)
• suppress_init_warnings = True|False
If True, no warnings will be issued if unrecognized variables are detected in the measurement
configuration files or the .caliperinit file. Default: False.)
• suppress_statement_data = True|False
If True, no statement-level data will be reported. (Default: False.)
• use_parens_for_statement_data = True|False
If True, statement-level data in reports is placed in parentheses. (Default: True.)
Specifying Option Values with a .caliperinit Initialization File 93
Page 94

Configuring Data Collection
HP Caliper gives you flexible control over the data you collect from your program. The types of
control you have include:
• Particular CPU events to measure. See “Specifying Which CPU Events to Measure” (p. 94).
• Specific load modules you want to collect data for. See “Specifying Which Load Modules to
Collect Data For” (p. 95).
• Granularity of the information. See “Controlling Granularity of Data Collection and Reports”
(p. 97).
• Particular processes to measure. See “Specifying Processes to Measure” (p. 97).
Specifying Which CPU Events to Measure
Names and descriptions of the CPU events that HP Caliper can measure are available in two text
files in the HP Caliper directory.
To measure these events, specify them in command-line options or in a measurement configuration
file.
You can find the list of events in the itanium2_cpu_counters.txt file in the doc/text
subdirectory in the HP Caliper home directory.
Or you can use the caliper info --cpu-counter all command to see all the events
available. For more information, see “How to Display Reference Information About CPU Counters
or HP Caliper Report Types” (p. 102).
To fully understand the semantics of these events, see these documents:
• Intel® Itanium® 2 Processor Reference Manual for Software Development and Optimization
(May 2004), Chapter 11, “Performance Monitor Events.” This document is available at:
http://www.intel.com/design/itanium2/manuals/251110.htm
• Dual-Core Update to the Intel® Itanium® 2 Processor Reference Manual for Software
Development and Optimization (January 2006), Chapter 4, “Performance Monitor Events.”
This document is available at:
http://download.intel.com/design/Itanium2/manuals/30806501.pdf
NOTE: You can specify a maximum of four events at a time, or 12 on Integrity servers dual-core
Itanium 2 and Itanium 9300 quad-core processors. Depending on how the PMU registers are used,
you might be limited to fewer events on any of the Integrity servers.
Shortening CPU Event Names
HP Caliper allows you to shorten CPU event names:
• You can truncate the name to the fewest number of characters that uniquely identify the event,
such as CPU_CY to represent CPU_CYCLES.
• You can abbreviate the name using the first letter of each part of the name to create an
acronym, such as CC to represent CPU_CYCLES.
For example, these two methods are valid ways of specifying CPU_CYCLES:
$ caliper fprof -s 400000,10%,CPU_CY myprogram
$ caliper fprof -s 400000,10%,CC myprogram
When two event names have conflicting abbreviations, HP Caliper appends a number to each
abbreviation to differentiate them. If you specify an ambiguous abbreviation, HP Caliper lists the
abbreviations you can use, as in the following example:
$ caliper fprof -s ,,IIR vand
94 Configuring HP Caliper
Page 95

HP Caliper: usage error:
Ambiguous event abbreviation ("IIR") specified for
"--sampling-spec".
Matches IIR2 (IA64_INST_RETIRED), IIR1 (IA32_INST_RETIRED)
Run caliper -h for help.
To list abbreviations for any given event, use the caliper info command to list the abbreviations:
$ caliper info CPU_CYCLES
=====================================
HP Caliper CPU Counter Information
=====================================
Name: CPU_CYCLES
Abbreviation: CC or CPU_CY
Title: CPU Cycles
Definition: Counts the number of clock cycles.
=====================================
Specifying Which Load Modules to Collect Data For
HP Caliper allows you to restrict data collection to specific load modules. For example, you can
selectively include or exclude data collection for the main executable and any shared library.
Module inclusion or exclusion does not affect the measurements made through the PMU. Counting
and sampling still occurs when code is executed in excluded modules. However, the reports show
condensed data for those modules.
Three command-line options are available to specify inclusions and exclusions:
• --module-default
• --module-include
• --module-exclude
--module-default all|none allows you to specify the default setting for modules that are
not explicitly included or excluded with either
--module-include or --module-exclude.
You can provide either of these arguments:
all any module not explicitly excluded is included
none any module not explicitly included is excluded
If module-default is not present, the default is all.
--module-include
module_list
To explicitly include modules, specify a module_list.
A module_list is a list of module or directory names
separated by colons. For example:
--module-include libc:libcurses:liboci
or
--module-include /usr/lib/
--module-exclude
module_list
To explicitly include modules, specify a module_list.
A module_list is a list of module or directory names
separated by colons. For example:
--module-exclude libc:libcurses:liboci
or
--module-exclude /usr/lib/
Default Settings for Load Module Data Collection
HP Caliper uses these default settings:
Configuring Data Collection 95
Page 96

module-default all
module-include libdl.so
module-exclude
uld.so•
• dld.so
• libsin.so
You cannot override the settings for uld.so, dld.so, and libsin.so.
How to Specify Load Module Names
HP Caliper matches load module names in the following way:
• If you provide a full path for the module name, only an exact match succeeds.
• To imply all modules within a directory and its subdirectories, you provide a directory name
with a trailing slash (/).
• If you do not specify the full path, only the base file name is used to match module names.
For example, if you specify the full path like this:
--module-include /usr/lib/hpux64/libc.so
You get these results:
/usr/lib/hpux64/libc.so match
/usr/lib/hpux64/libc.so.1 no match
/usr/lib/hpux32/libc.so no match
If you provide the base file name without the full path, HP Caliper considers it a match if the base
file name is the suffix of the loaded module or if the base file name is present in the load module's
full path and followed by a period (.).
For example:
--module-exclude libc
gives these results:
/usr/lib/hpux64/libc.so match
/usr/lib/hpux64/libc.so.1 match
Here is another example:
--module-include libcur
gives these results:
/usr/lib/hpux64/
no match
libcurses.so
To match, you would have to specify libcurses.
You can repeat each of these options multiple times. HP Caliper uses the last value of
--module-default given.
If you specify --module-default all, then HP Caliper uses only files specified in the
--module-exclude list.
If you specify --module-default none, then HP Caliper uses only files specified in the
--module-include list.
For example, if you only want to include libc in a measurement, you would use these options:
--module-default none --module-include libc
96 Configuring HP Caliper
Page 97

Controlling Granularity of Data Collection and Reports
You can control the granularity of data collection and reports. If you want finer granularity (that
is, more samples), use the -s option to lower the number of events between samples. For example,
you can change the rate from the default 500,000 cycles to 250,000 cycles to get more samples.
However, the increased sampling might have a negative effect on your application's performance.
If your program is likely to have repeating patterns, such as loops, those patterns might coincide
with the fixed sampling rate, affecting the results. For example, some functions might not be sampled
because the IP is never in the function on the measurement cycle. A solution for this is to vary the
sampling rate by some number of cycles.
For more information, see “-s or --sampling-spec” (p. 53).
Specifying Processes to Measure
The -p option allows you to measure only the parent (that is, the root) process, selected processes
in a process tree, or all processes that are spawned. In addition, HP Caliper provides several ways
to treat processes. You can:
• Measure the selected processes
• Track the processes without measuring them in order to identify interesting child processes
• Ignore specific processes
By default, HP Caliper measures and reports on the parent process and all child processes, including
native Integrity servers-based processes started by PA-RISC-based binaries running in emulation
mode. HP Caliper, however, does not measure the PA-RISC binaries themselves.
To measure the parent process alone, use the -p root option.
By default, HP Caliper produces separate reports for each process and concatenates them to
stdout or the output file specified in the -o (or --output-file) option.
If you want a separate file for each report, use the -o option with its per-process modifier.
(See “-o or --output-file” (p. 51).) This option produces files that use this naming convention:
basename.executablename
For example, the following command on HP-UX:
$ caliper fprof -o COUT,per cc foo.c
produces these files:
COUT contains an overview of the entire collection run
COUT.cc contains report data for all cc processes
COUT.ecom contains report data for the ccom process
COUT.ld contains report data for the ld process
HP Caliper can measure shell script files. By default, HP Caliper measures the shell program and
the programs that the script invokes.
For Fortran MPI programs, by default, HP Caliper measures the mpirun controlling process and
the real application.
Process Tree Report
With multiprocess reports, HP Caliper creates a summary report of the process tree to help you
navigate the reports. The summary includes:
• The process name indented to show lineage.
• The argv0 argument.
• The process ID (PID) and parent process ID (PPID).
Configuring Data Collection 97
Page 98

• The origin column, which identifies whether the process was created via a fork, vfork, or
exec.
• The handling column, which shows whether the process was measured, tracked, or ignored.
• The exit status, which is the final exit code for the process.
Figure 22 (page 98) shows an example process tree report.
Figure 22 Example of a Process Tree Report
Process Tree
-----------------------------------------------------------------------------
Program argv[0] PID PPID Origin Handling ExitStat
-----------------------------------------------------------------------------
cc cc 16725 - start measure 1
cc cc 16726 16725 fork measure n/a
`ld /usr/ccs/bin/ld 16726 16725 exec measure 1
-----------------------------------------------------------------------------
HP Caliper reports the process tree for a multiprocess run, but not for a system-wide run.
Syntax for -p Option
Table 2 (page 98) shows the command-line syntax for the -p option and the corresponding
measurement configuration file syntax.
Table 2 Command-Line and Measurement Configuration File Syntax for -p Option
Measurement Configuration File SyntaxCommand-Line Syntax
• process="default"• -p default
• •-p root process="root"
•• process="root-forks"-p root-forks
• •-p all process="all"
•• process="custom:function_name"-p custom
• •-p custom:function_name process="[some:][(opt1,[opt2,...])]pattern"
• -p [some:][(opt1[,opt2,...])]pattern
When using multiple process=some items, use this syntax in the measurement configuration file:
process=["[some:][(opt1[,opt2,...])]pattern1",
"[some:][(opt3[,opt4,...])]pattern2", ...]
This list explains the syntax for the -p option:
-p default The default behavior is equivalent to -p all.
-p root Measures only the root process.
-p root-forks Measures only the root process and forks from the root
process.
-p all Measures all processes in the process tree. The root of the
process tree is the initial process that HP Caliper creates,
or the one that launches HP Caliper (automatic invocation),
or the one to which HP Caliper attaches (when the pid
argument list is given on the command line).
This is the default setting for all measurements.
-p custom:function_name Allows you to provide a Python function to use as a filter for
-p
[some:][(opt1,...)]pattern
98 Configuring HP Caliper
processes to measure. This option should only be necessary
in rare cases, while -p some: should cover most special
needs.
For simple uses:
Page 99

If you specify multiple -p options, the last one takes precedence.
Using -p some
The syntax for -p some is the most complex.
-p [some:][(opt1[,opt2,...])]pattern
where:
opt1, opt2 represent the options from the following tables that either specify the action to
pattern represents the string that HP Caliper uses to compare with options that require a
When you specify multiple some: arguments for process, the result of each some: argument is
passed the subsequent some: argument, typically reducing the number of matching results.
The (opt1[,opt2,...]) are optional and only required to change the default behavior. The
absence of options is equivalent to providing the options (measure, file).
-p glob1[:glob2:...]
Matches the executable base name of each new process
against each glob pattern. A glob pattern follows the Unix
shell-style rules to expand file names. If one or more of those
patterns match, the process is measured. Otherwise the
process is tracked.
For more information, see “Using -p some ” (p. 99).
take or a condition the process must meet
pattern
Options can be grouped in categories, as shown in the tables below.
Table 3 Action Options Used with -p some
DescriptionOption
Default. Measures the process.measure
track
ignore
The last option specified takes precedence.
The process is not measured. However, HP Caliper learns about events in this process, in particular,
creation of new processes via fork, vfork, and exec.
The process is not measured. HP Caliper does not track events for this process or any child the
process may create.
Table 4 Pattern String Interpretation Options Used with -p some
DescriptionOption
Default. Interprets the string as a “:”-separated list of glob patterns.glob
regexp
The last option specified takes precedence.
HP Caliper interprets the string as a single Python or Perl type regular expression that is used
with search.
Table 5 Name Source Options Used with -p some
DescriptionOption
Default. The name is the executable base name of the process.file
The name is argument 0 of the process.arg0 or argv0
The name is argument 1 of the process or "" (empty string) if there is not such an argument.arg1 or argv1
The last option specified takes precedence.
Configuring Data Collection 99
Page 100

Table 6 Process Origin Options Used with -p some
The default is to match any process origin.
If you specify multiple options, HP Caliper looks for matches for any of the options. For example, (exec,fork)matches
any process that was started with exec or fork from a measured or tracked process.
Examples of the -p Option
• To measure only ecom and ld
$ caliper ecount -p ecom:ld cc hw.c
• To measure only processes starting with the letter “c”:
$ caliper ecount -p "c*" cc hw.c
Reports information for: cc (root), cc (fork), cc (fork), ctcom.
• To measure only processes where the last letter is “m”:
$ caliper ecount -p "(regexp)m$" cc hw.c
Reports only information for: ctcom.
DescriptionOption
Denotes the initial root process.root
Matches any process created by fork of a measured or tracked parent process.fork
Matches any process created by exec of a measured or tracked process.exec
• To measure every process except those created by fork:
$ caliper ecount -p "*" -p "(fork,track)*" cc hw.c
Reports information for: cc (root), ecom, ld.
This command causes HP Caliper to track the process created with fork and if the process
calls exec, the new process is measured, not simply tracked. This is useful when you do not
want to measure the period between fork and exec calls.
• To select based on argv1:
$ cat /path/ls.sh
#!/bin/sh
ls
$ caliper ecount -p "(arg1)*ls.sh" /path/ls.sh
Reports information for: /bin/sh /path/ls.sh, but does not report ls.
• To select based on argv0:
$ caliper ecount -p "(arg0)ora*" ./sqlplus
Reports information on processes having ora as a prefix of their argument 0.
• To detach from unimportant processes:
$ caliper ecount -p "*" -p (ignore)basename ...
HP Caliper does not track or measure children of the detached process.
Using HP Caliper in Your Build Process
You can integrate HP Caliper into your build process by including the HP Caliper commands in
your makefile.
Using HP Caliper in Testing and Quality Assurance
Use these steps with new makefile targets for testing and quality assurance builds:
100 Configuring HP Caliper
 Loading...