

Page 1
TM 11-6625-493-15
DEPARTMENT OF THE ARMY TECHNICAL MANUAL
DS, GS, AND DEPOT MAINTENANCE
MANUAL
FREQUENCY COMPARATOR
CM-77A/USM
This copy is a reprint which includes current
pages from Changes 1 through 4.
HEADQUARTERS, DEPARTMENT OF THE ARMY
SEPTEMBER 1964
Page 2

Page 3

Changes in force C1, C3, and C4
Operators, Organizational, Direct Support,
General Support, and Depot
Maintenance Manual
FREQUENCY COMPARATOR CM977A/USM
(NSN 6625-00-080-7204)
TM 11-6625-493-15, 29 September 1964, is changed as follows:
The title of the manual is changed as shown above.
Page v, The Forms and Records paragraph is
superseded as follows:
TM 11-6625-493-15
C4
HEADQUARTERS
DEPARTMENT OF THE ARMY
ASHINGTON , DC, 9 May 1977
W
0-1. Forms and Records
a. Reports of Maintenance and Unsatisfactory
Equipment. Maintenance forms, records, and reports
which are to be used by maintenance personnel at all
maintenance levels are listed in and prescribed by
TM 38-750.
b. Report of Packaging and Handling Deficien-
cies. Fill out and forward DD Form 6 (Packaging Im-
provement Report) as prescribed in AR 70058/NAVSUPINST 4030.29/AFR 71-13/MCO
P4030.29A, and DSAR 4145.8.
c. Discrepancy in Shipment Report (DISREP) (SF
361). Fill out and forward Discrepancy in Shipment
Report (DISREP) (SF 361) as prescribed in AR 5538/NAVSUPINST 4610.33A/AFR
4610.19B and DSAR 4500.15
The Reporting of Errors paragraph is superseded as
follows:
75-18/MCO
0-2. Reporting of Errors
You can help improve this manual by calling atten tion to errors and by recommending improve-
ments and stating your reasons for the recommendations. Your letter or DA Form 2028 (Recommended
Changes to Publications and Blank Forms) should be
mailed direct to Commander, US Army Electronics
Command, ATTN: DRSEL-MA-Q, Fort Monmouth,
New Jersey 07703. A reply will be furnished direct to
you. After the Reporting of Errors paragraph, add
the following:
0-3. Administrative Storage
Administrative storage of equipment issued to and
used by Army activities shall be in accordance with
TM 740-90-1.
0-4. Destruction of Army Electronics
Materiel.
Destruction of Army electronics materiel to prevent
enemy use shall be in accordance with TM
750-244-2.
0-5. Reporting Equipment improve-
ment Recommendations (EIR)
EIR’s will be prepared using DA Form 2407 (Maintenance Request). Instructions for preparing EIR’s are
provided in TM 38-750, The Army Maintenance
Management System. EIR’s should be mailed direct
to Commander, US Army Electronics Command,
ATTN: DRSEL-MA-Q, Fort Monmouth, New Jersey
07703. A reply will be furnished direct to you.
Page 5-2, Table 5-1 is superseded as follows:
1
Page 4
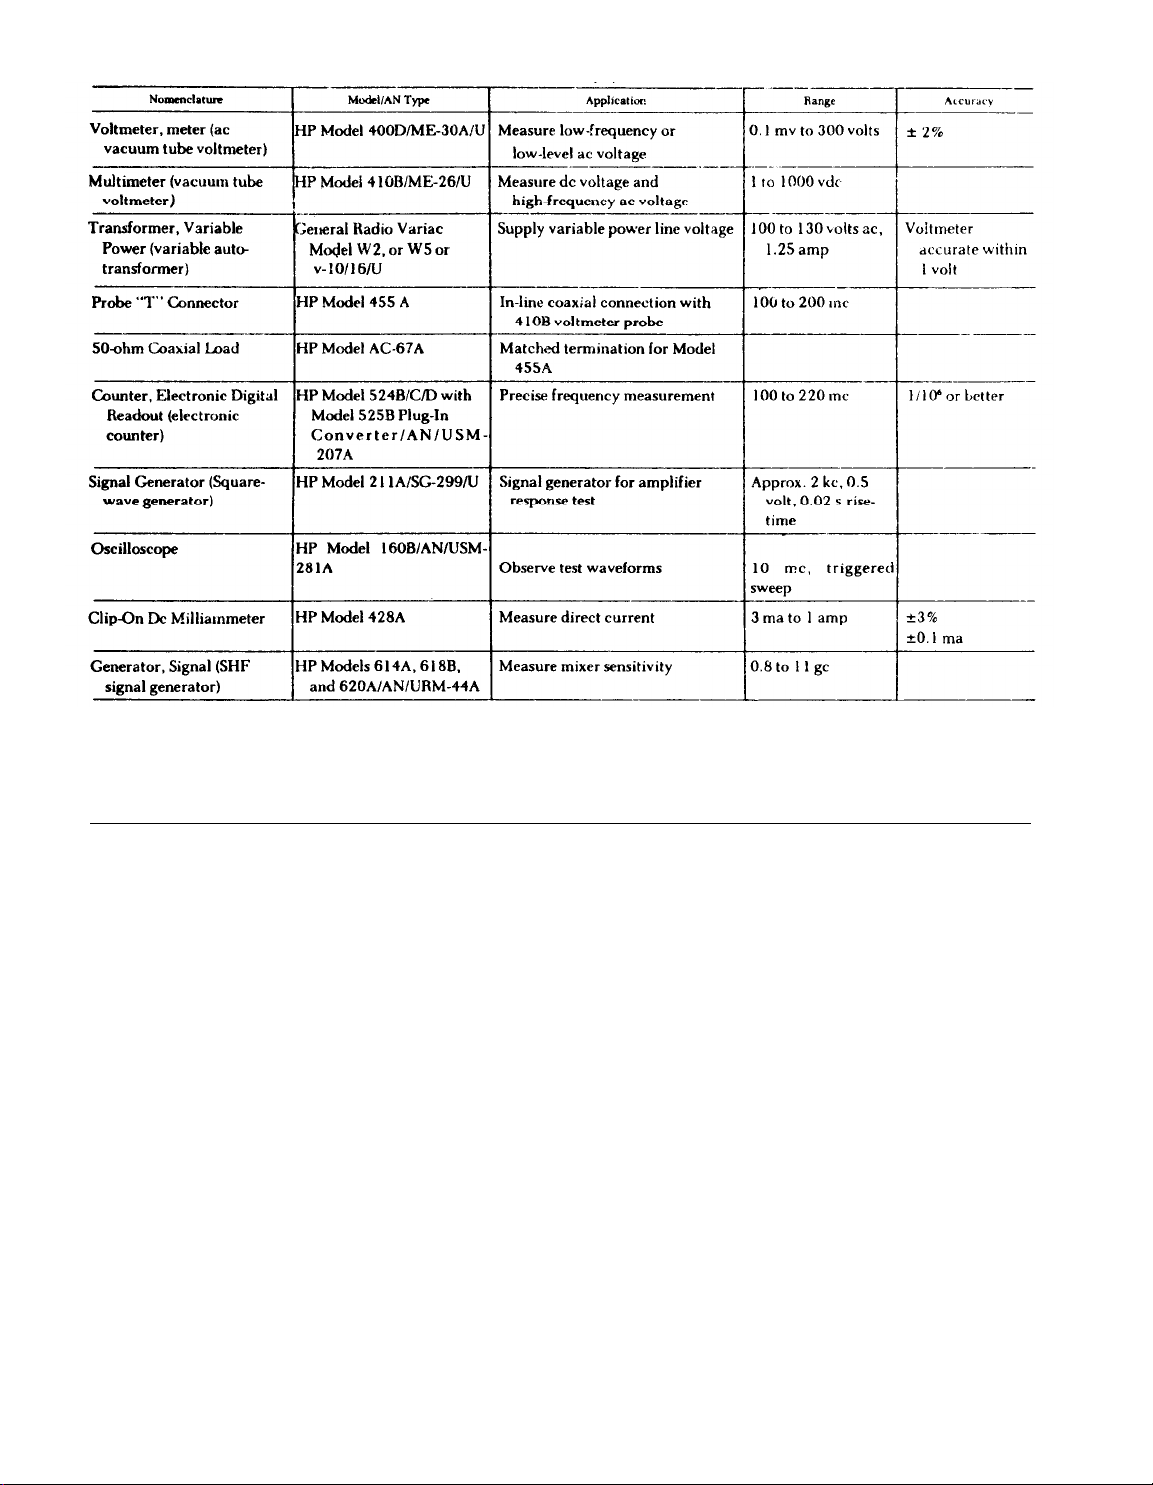
Table 5-1. Test Equipment
Page 5.1-1. Section V.I is superseded as follows:
SECTION V.1
PREVENTIVE MAINTENANCE INSTRUCTIONS
5.1-1. Scope of Organizational
Preventive Maintenance
Preventive maintenance is the systematic care, servicing, and inspection of equipment to prevent the occurrence of trouble, to reduce downtime, and to
assure that the equipment is serviceable.
a. Systematic Care. The procedures given in
tables 5.1-1 and 5.1-2 cover routine systematic care
essential to proper upkeep and operation of the
equipment.
b. Preventive Maintenance Checks and Services.
The preventive maintenance checks and services
tables outline the functions to be performed at
specific intervals. These checks and services are
designed to maintain Army equipment in a combatserviceable condition; that is, in good physical and
operational condition. To assist organizational
maintenance personnel in maintaining combat serviceability, the table indicate what to check, how to
check, and the normal conditions. If the defect cannot be remedied by organizational maintenance personnel, higher category maintenance or repair is required. Records and reports of these checks and services must be made in accordance with TM 38-750.
5.1-2. Preventive Maintenance Checks
and Services Periods
Preventive maintenance checks and services of the
equipment is required on a daily, weekly, and
monthly basis as indicated in a and b below.
Whenever a normal indication is not observed during the performance of the daily, weekly, or monthly
preventive maintenance check, necessary corrective
action must be taken.
a. Daily and Weekly. Table 5.1-1 specifies the
preventive maintenance checks and services that
must be performed daily and weekly or when the
equipment is:
(1) Initially installed.
2
Page 5
(2) Reinstalled after return from higher cate
gory of maintenance and repairs have been performed.
(3) Maintained in a standby (ready for immedi-
ate operation) condition. Perform on a monthly
schedule.
ly 30 calendar days of 8-hour-per-day operation. Ad-
justment of the monthly preventive maintenance in-
terval must be made to compensate for any unusual
operating conditions. For example, if the equipment
is used 16 hours per day, the monthly preventive
(4) Returned to service from limited storage. maintenance checks and services should be per-
b. Monthly. Table 5.1-2 specifies the preventive
maintenance checks and services that must be per-
formed monthly. A month is defined as approximatc-
formed at 15-day intervals. ACM-77A maintained in
a standby condition requires monthly preventive
maintenance, but one in limited storage does not.
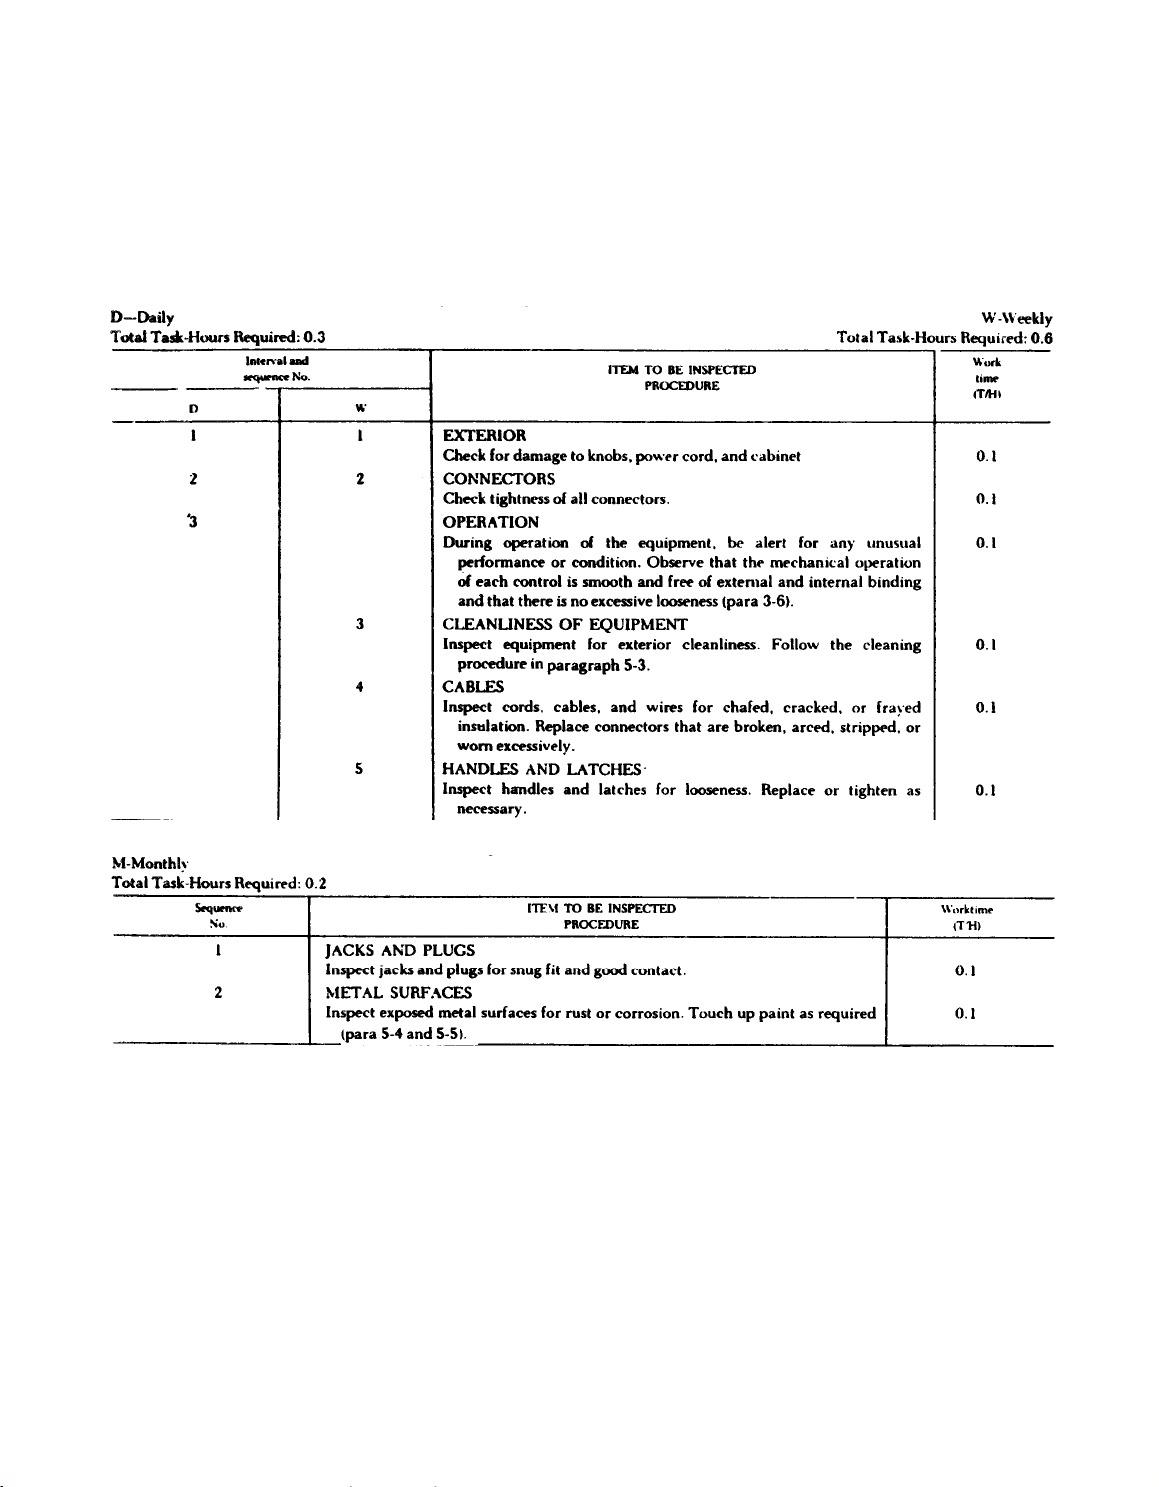
Table 5.1-1. Daily and Weekly Preventive Maintenance Checks and Services
para 3-6
Table 5.1-2. Monthly Preventative Maintenance Checks and Services
para 5-4 and 5-5
5.1-3. Cleaning
Inspect the exterior of the equipment. The exterior
should be clean, and free from dust, dirt, grease, and
fungus.
a. Remove dust and loose dirt with a clean lint-
free cloth.
WARNING
The fumes of trichloroethane are toxic. Provide thorough ventilation whenever used.
paragraph 5-3
DO NOT USE NEAR AN OPEN FLAME.
Trichloroethane is not flammable, but exposure of the fumes to an open flame or hot
metal forms highly toxic phosgene gas.
b. Remove grease, fungus, and ground-in dirt
from the case; use a cloth dampened (not wet) with
trichloroethane. After cleaning, wipe dry with a
clean lint-free cloth.
c. Remove dust or dirt from plugs and jacks with
3
Page 6

a soft-bristled brush.
CAUTION
Do not press on the face (glass) of the
cathode ray tube when cleaning; the cathode
ray tube may become damaged.
d. Clean the front panel and control knobs; use a
soft clean lint-free cloth. If necessary, dampen the
cloth with water. Mild soap may be used for more effective cleaning.
cloth .
Wipe dry with a clean lint-free
5.1-4. Paints and Finishes
When the CM-77A/USM requires repainting,
refinishing, or touchup painting, refer to Federal
Standard No. 595a for a matching color. SB 11-573
lists. painting tools and miscellaneous supplies required for painting.
5.1-5. Touchup Painting Instructions
a. Refer to TB 43-0118 for instructions on paint-
ing and preserving Electronics Command equip-
ment. When touchup painting, a perfect match with
the exact shade of the original paint surface may not
be possible. This may be caused by changes such as
in the original pigment because of oxidation, and differences in manufacture. The prevention of corrosion
and deterioration is the most important consideration in touchup painting; appearance is secondary.
This, however, should not be construed to mean that
appearance of the equipment is not important.
Touckup painting should be accomplished neatly
and the quality of work should be good. Field inspection personnel should make allowances for slight color mismatch where minor touchup has been done,
but not for neglect, poor quality, or where the need
for refinishing is obvious.
b. Remove rust and corrosion from metal surfaces
by lightly sanding them with fine sandpaper. Brush
two thin coats of paint on the bare metal to protect it
from further corrosion.
Page i-2. Appendix 1 is superseded as follows:
APPENDIX A
REFERENCES
The following is a list of references that are available to the operator and organizational, DS, GS, and
depot maintenance personnel of Frequency Comparator CM-77A/USM:
DA Pam 310-4
DA Pam 310-7
SB 11-573
TB 43-180
TB 43-0118
TM 11-6625-200-15
TM 11-6625-258-14
TM 11-6625-274-12
TM 11-6625-316-12
TM 11-6625-320-12
TM 11-6625-366-15
TM 11-6625-412-15-1
Index of Technical Manuals, Technical Bulletins, Supply Manuals (Types 7, 8 and
9), Supply Bulletins, and Lubrication Orders.
US Army Index of Modification Work Orders.
Painting and Preservation Supplies Available for Field Use for Electronics
Command Equipment.
Calibration Requirements for the Maintenance of Army Materiel.
Field Instructions for Painting and Preserving Electronics Command Equipment
Including Camouflage Pattern Painting of Electrical Equipment Shelters
Operator’s, Organizational,
Multimeters ME-26A/U, ME-26B/U, ME-26C/U, and ME-26D/U.
Operator’s, Organizational, Direct Support, and General Support Maintenance
Manual: Signal Generators SG-299/U, SG-299A/U, SG-299B/U, SG-299C/U,
SC-299D/U and SG-299E/U.
Operator’s and Organizational Maintenance Manual: Test Sets, Electron Tube
TV-7/U, TV-7A/U, TV-7B/U, and TV-7D/U.
Operator’s and Organizational Maintenance Manual: Test Sets, Electron Tube
TV-2/U, TV-2A/U, TV-2B/U, and TV-2C/U.
Operator’s and Organizational Maintenance Manual: Voltmeter, Meter
ME-30A/U and Voltmeters, Electronic ME-30B/U, ME-30C/U, and ME-30E/U.
Operator’s, Organizational, EM, CS, and Depot Maintenance Manual: Multimeter
TS-352B/U.
Operator, Organizational, DS, GS, and Depot Maintenance Manual,
Repair Parts and Special Tools List: Radio Test Set AN/URM-44A.
DS, GS, and Depot Maintenance Manual:
Including
4
Page 7

TM 11-6625-700-14-1
TM 11-6625-1703-15
TM 38-750
TM 740-90-1
TM 750-244-2 Procedures for Destruction of Electronics Materiel to Prevent Enemy Use
Page i-3, Appendix II is superseded as follows:
Operator’s, Organizational, Direct Support, and General Support Maintenance
Manual Including Repair Parts and Special Tools List (Including Depot
Maintenance Repair Parts and Special Tools): Digital Readout Electronic
Counter AN/USM-207A (Serial Nos. 1A through 1100A).
Operator, Organizational, DS, GS, and Depot Maintenance Manual Including
Repair Parts and Special Tool Lists: Oscilloscope AN/USM-281A.
The Army Maintenance Management System (TAMMS).
Administrative Storage of Equipment
(Electronics Command).
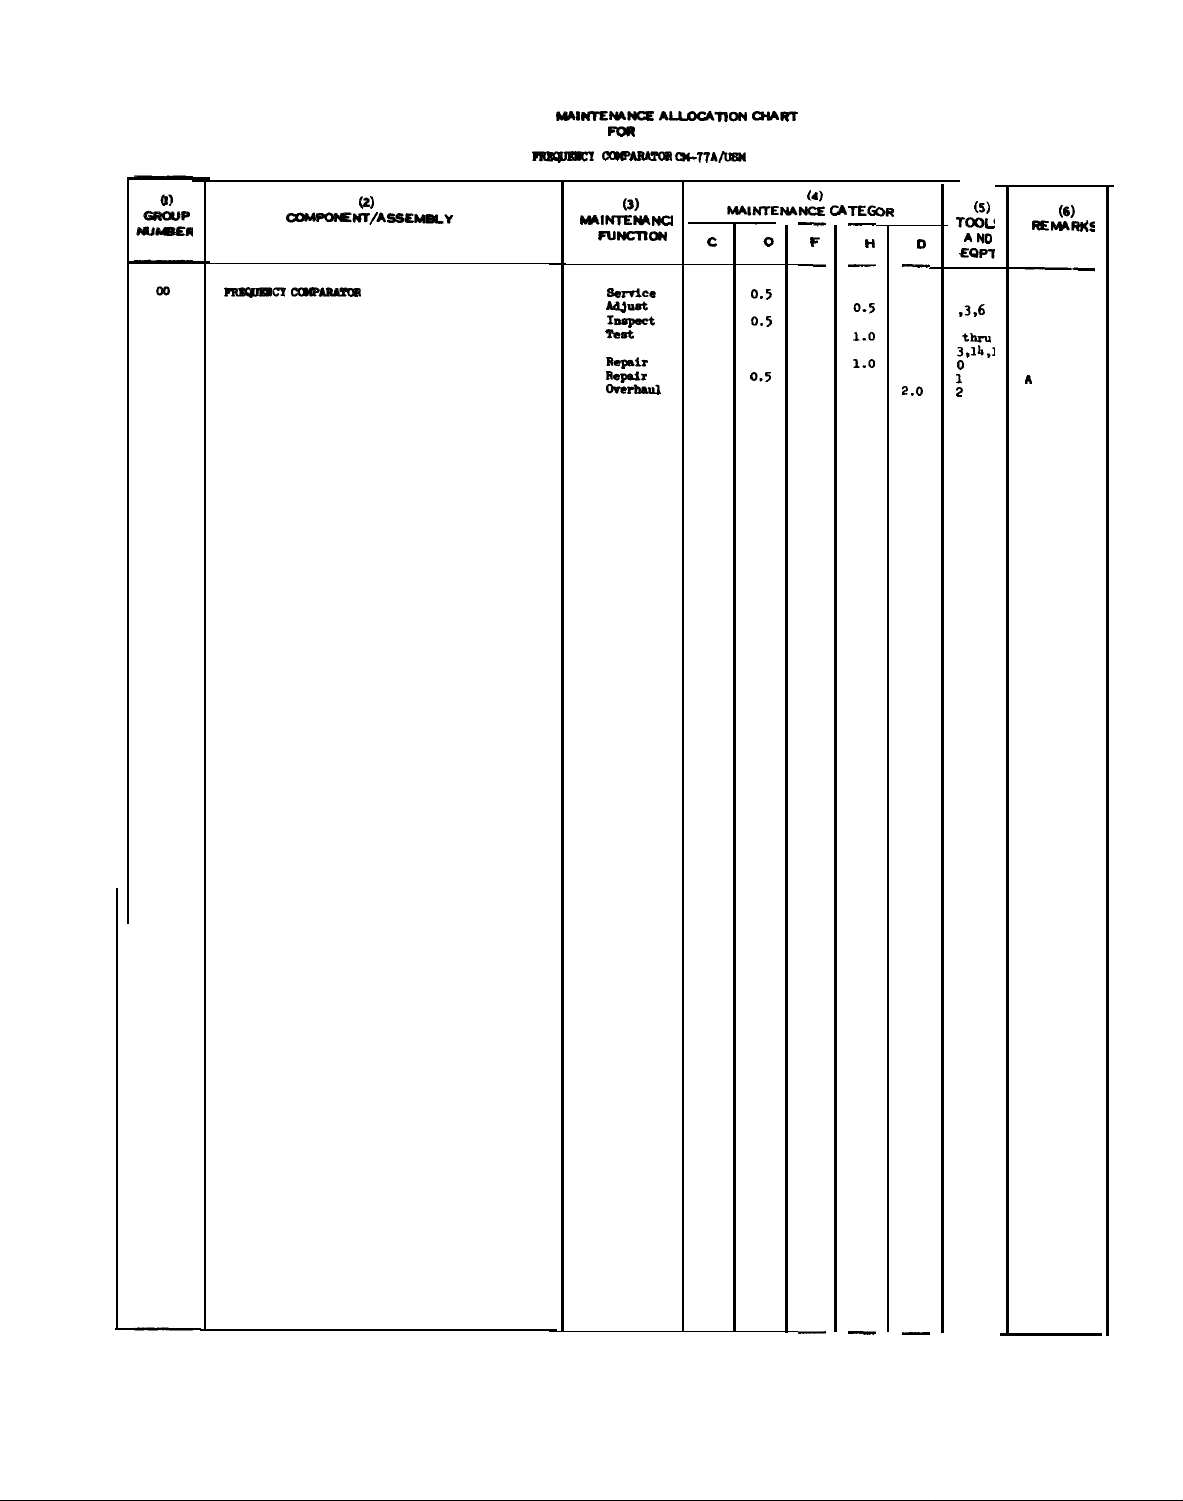
APPENDIX C
MAINTENANCE ALLOCATION
Section I. INTRODUCTION
C-1. General
This appendix provides a summary of the
maintenance operations for CM-77A/USM. It authorizes categories of maintenance for specific maintenance functions on repairable items and components and the tools and equipment required to perform each function. This appendix may be used as an
aid in planning maintenance operations.
C-2. Maintenance Function
Maintenance functions will be limited to and defined
as follows:
a. Inspect. To determine the serviceability of an
item by comparing its physical, mechanical, and/or
electrical characteristics with established standards
through examination.
b. Test. To verify serviceability and to detect incipient failure by measuring the mechanical or electrical characteristics of an item and comparing those
characteristics with prescribed standards.
c. Service. operations required periodically to
keep an item in proper operating condition, i.e., to
clean (decontaminate), to preserve, to drain, to paint,
or to replenish fuel, lubricants, hydraulic fluids, or
compressed air supplies.
d. Adjust. To maintain, within prescribed limits,
by bringing into proper or exact position, or by setting the operating characteristics to the specified
parameters.
e. Align. To adjust specified variable elements of
an item to bring about optimum or desired performance.
f. Calibrate. To determine and cause corrections
to be made or to be adjusted on instruments or test
measuring and diagnostic equipments used in precision measurement. Consists of comparisons of two
instruments, one or which is a certified standard of
known accuracy, to detect and adjust any discrepancy in the accuracy of the instrument being compared.
g. Install. The act of emplacing, seating, or fixing
into position an item, part, module (component or
assembly) in a manner to allow the proper functioning of the equipment or system.
h. Replace. The act of substituting a serviceable
like type part, subassembly, or module (component
or assembly) for an unserviceable counterpart.
i. Repair. The application of maintenance serv-
ices (inspect, test, service, adjust, align, calibrate, re-
place) or other maintenance actions (welding, grind-
ing, riveting, straightening, facing, remachining, or
resurfacing) to restore serviceability to an item by
correcting specific damage, fault, malfunction, or
failure in a part, subassembly, module (component
or assembly), end item, or system. This function does
not include the trial and error replacement of run-
ning spare type items such as fuses, lamps, or elec-
tron tubes.
j. Overhaul. That maintenance effort (service/
action) necessary to restore an item to a completely
serviceable/operational condition as prescribed
by maintenance standards (i.e., DMWR) in appropriate technical publications. Overhaul is normally
the highest degree of maintenance performed by the
5
Page 8

Army. Overhaul does not normally return an item to
like new condition.
k. Rebuild. Consists of those services/actions
necessary for the restoration of unserviceable equipment to a like new condition in accordance with
original manufacturing standards. Rebuild is the
highest degree of materiel maintenance applied to
Army equipment. The rebuild, operation includes the
act of returning to zero those age measurements
(hours, miles, etc.) considered in classifying Army
equipments/components.
C-3. Column Entries
a. Column 1, Group Number. Column 1 lists
group numbers, the purpose of which is to identify
components, assemblies, subassemblies, and modules
with the next higher assembly.
b. Column 2, Component/Assembly. Column 2
contains the noun names of components, assemblies,
subassemblies, and modules for which maintenance
is authorized.
c. Column 3, Maintenance Functions. Column 3
lists the functions to be performed on the item listed
in column 2. When items are listed without maintenance functions, it is solely for purpose of having the
group numbers in the MAC and RPSTL coincide.
d. Column 4, Maintenance Category. Column 4
specifies, by the listing of a “work time” figure in the
appropriate subcolumn(s), the lowest level of maintenance authorized to perform the function listed in
column 3. This figure represents the active time required to perform that maintenance function at the
indicated category of maintenance. If the number or
complexity of the tasks within the listed maintenance
function vary at different maintenance categories,
appropriate “work time” figures will be shown for
each category. The number of task-hours specified by
the “work time” figure represents the average time
required to restore an item (assembly, subassembly,
component, module, end item or system) to a service-
able condition under typical field operating conditions. This time includes preparation time, troubleshooting time, and quality assurance/quality control
time in addition to the time required to perform the
specific tasks identified for the maintenance func-
tions authorized in the maintenance allocation cha
Subcolumns of column 4 are as follows:
C - Operator/Crew
O - Organizational
F - Direct Support
H - General Support
D - Depot
e. Column 5, Tools and Equipment. Column
specifies by code, those common tool sets (not in
dividual tools) and special tools, test, and supper
equipment required to perform the designated func
tion.
f. Column 6, Remarks. Column 6 contains an al
phabetic code which leads to the remark in section
IV, Remarks, which is pertinent to the item opposite
the particular code.
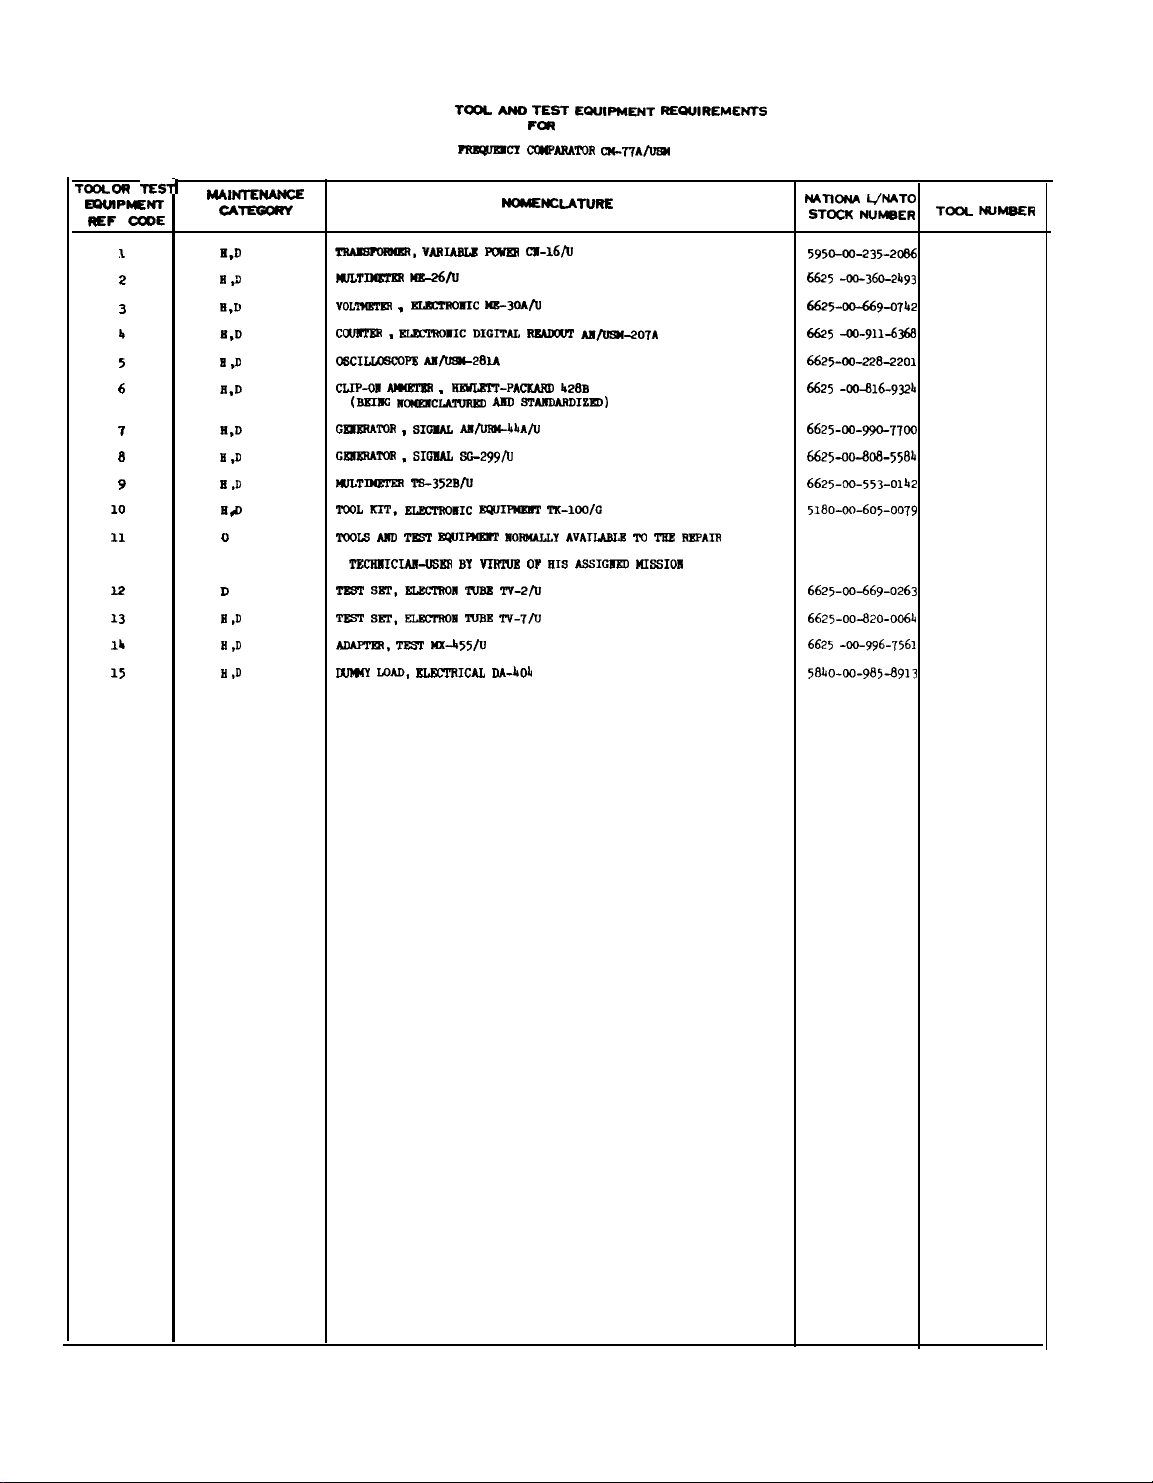
C-4. Tool and Test Equipment
Requirements (Sect. Ill)
a. Tool or Test Equipment Reference Code. The
numbers in this column coincide with the numbers
used in the tools and equipment column of the MAC.
The numbers indicate the applicable tool or test
equipment for the maintenance functions.
b. Maintenance Category. The codes in this column indicate the maintenance category allocated the
tool or test equipment.
c. Nomenclature. This column lists the noun
name and nomenclature of the tools and test equipment required to perform the maintenance functions.
d. National/NATO Stock Number. This column
lists the National/NATO stock number of the specific
tool or test equipment.
e. Tool Number. This column lists the manufacturer’s part number of the tool followed by the
Federal Supply Code for manufacturers (5-digit) in
parentheses.
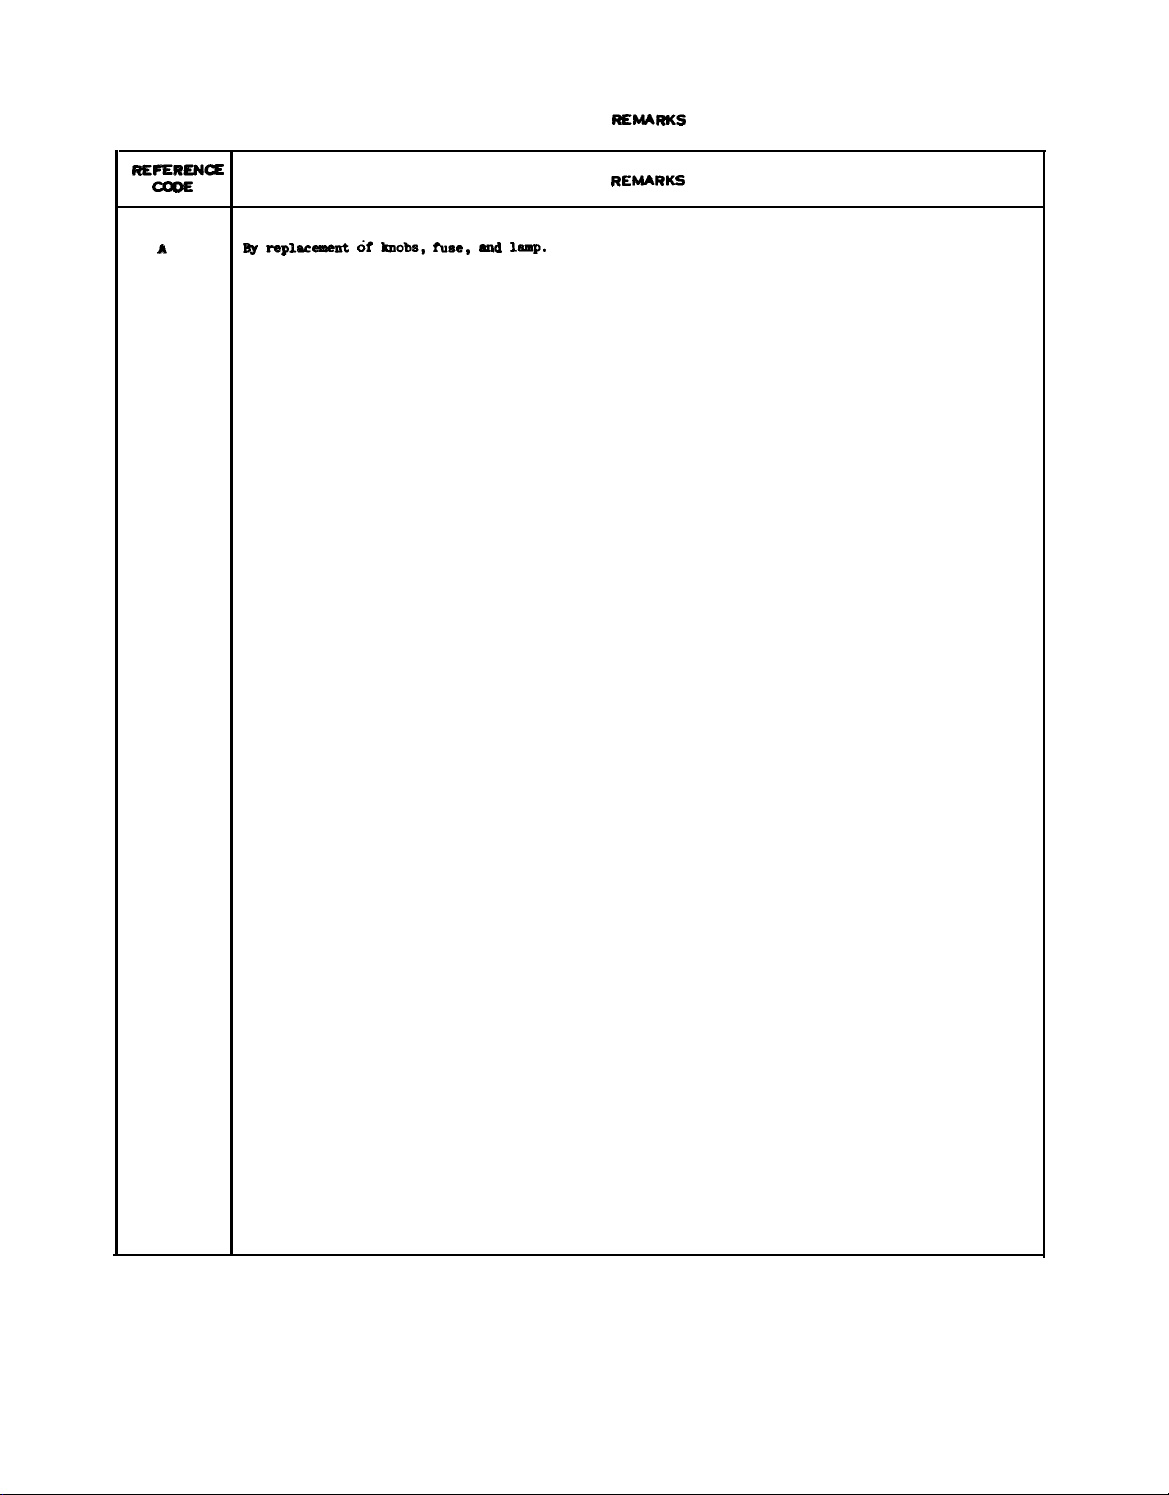
C-5. Remarks (Sect. IV)
a. Reference Code. This code refers to the appropriate item in section II, column 6.
b. Remarks. This column provides the required
explanatory information necessary to clarify items
appearing in section II.
6
Page 9
TM 11-6625-493-15
aMWO?#Em/AssWY
nEuJlacI CmmMlta
@
SECTION II
PRMM6CT CUSNWK#
Wlmllm’a=
Mlrmzmm
Fur4aloN
Gm-rAce
A4ijmt
Inspect
Test
Reqmlr
Rep8Ar
OTerhull
AA-lmmna’4 OiAwr
(M-77A-
(3)
c
—
0.5
0.5
0.5
(4)
—
o
F
—
MAlNTEw4& ~TEG
—
—
0.5
1.0
1.0
(5)
TOOU
A
0
No
+EQl=l
,3,6
thru
3,111,1
0
1
2
H
—
2.0
REM*S
—.
A
(6)
—
—
—
7
Page 10
TCUL
OR
E9UIPKNT
REF
10
11
32
13
lb
15
=E
1
2
3
b
5
6
7
a
9
TEslJ
mAINmmANuz
CATEGORY
E,D
n ,3
B,D
II,D
Ii ,D
E,D
li,D
H ,D
Ii ,D
Ha
0
D
E ,D
H ,D
H ,D
TM 11-6625-493-15
SECTION III.
TOOL
~CI
ANO
TEST
EWIPMSNT
FOR
CWPASATOR CU-77AfLRUl
REQuIREMENTS
NOMENCLATURE
~,
VM~ m cs.16/s
mJLTnQmHl M15-2&U
VOL’IW?2SS ,
c~ , 5RXli011C DIG~m ~
ELmrsosIc ME-3oAru
AI1/SBU-207A
~CILIOBCOPS AS-283A
CLIP-m
AMmm .
(Bs3ffi mxmcLAmmm
SWLEIT-PACKARD b28B
AMO W~DIZSO)
G=TOR , SIOSAL AE/UKl@4hA/U
G_TOS , SIOBAL 21i-299/O
KJLTIM?l’SS TB-352B/S
TOOL KIT,
BLB=2SOEIC ~
TIC-lCQ/G
‘KIDIS MD H IQIIIFUSI?2 IIOWY AVAILABLS ’111 ~ SXPAIR
TBCSSIC3AII-UBSS BY
H sm.
m sm.
SLEcmon mlul Tv-2/s
ELmrsoM mm Tv-7/u
VIRNS OF
HIS ABSIGIISD UIBSIOX4
ADAmm, m Kx-b55/u
tXJWY LOAD, SLW2RICAI, DA-kO~
NATION AUMTO
STOCK NUMSER
5950-DD-235-2DM
6625 -DD-360-2b93
6625-00-66$&0’1112
6625 -aJ-911-636s
6625-00-228-2201
6625 -cQ-s16-93211
6625-00-990-7700
6625-00-808-5584
6625-00-553-0142
5180-00-605-0079
662HM-669-0263
6625-00-820-0064
6625 -W996-7561
58b0-IxI-985-8913
TO(X NUMSER
8
Page 11
TM 11-6625-493-15
RSFERSN=
CaDs
A
SECTION IV.
TW replacement 6f knobs, fuse, and leap.
RSMARKS
REMARKS
9
Page 12

By Order of the Secretary of the Army:
Official:
PAUL T. SMITH
Major General, United States Army
The Adjutant General
Distribution:
Active Army
BERNARD W. ROGERS
General, United States Army
Chief of Staff
USASA (2)
COE (1)
TSG (1)
USAARENBD (1)
TECOM (2)
TRADOC (2)
OS Maj Comd (4)
USACC (4)
MDW (1)
Armies (2)
Corps (2)
Instl (2) except
Ft Gillem (10)
ARNG: State AC (3)
USAR: None
For explanation of abbreviations used, see AR310-50.
Ft Gordon (10)
Ft Huachuca (10)
Ft Carson (5)
SAAD (30)
LBAD (14)
TOAD (14)
SHAD (3)
HISA (Ft Monmouth) (33)
Ft Richardson (ECOM Ofc) (2)
Svc Colleges (1)
USASIGS (5)
USAICS (3)
USAADS (2)
USAFAS (2)
USAARMS (2)
USAIS (2)
USAES (2)
MAAG (1)
USARMIS (1)
USAERDAA (1)
USAERDAW (1)
Sig FLDMS (1)
Units org under fol TOE:-1 ea
11-500(AA-AC)
29-134
29-136
Page 13
Page 14
Page 15
Page 16
Page 17
Page 18
Page 19

THIS MANUAL CONTAINS INFORMATION COPYRIGHTED BY
HEWLETT-PACKARD COMPANY.
TM 11-6625-493-15
TECHNICAL MANUAL )
NO. 11-6625-493-15 )
Foreword . . . . . . . . . . . . . . . . . . . . . . . . . . . . . . . . . . . . . . . . .
Section
I
II
III
GENERAL INFORMATION
1-1.
1-9. Differences in Instruments . . . . . . . . . . . . . . . . .
INSTALLATION
2-1.
2-3. Repacking for Shipment . . . . . . . . . . . . . . . . . . . . . .
2-5.
2-7. Operation from 115- or 230-Volt Line . . . . . . . . . . . . . . . . . . . .
2-10. Operation on Line Frequencies Higher than 120 Cycles
2-12. Installation . . . . . . . . . . . . . . . . . . . . . . . . . . . . . .
OPERATING INSTRUTIONS . . . . . . . . . . . . . . . . . . . . . . . . . .
3-1.
3-3.
3-9.
3-12.
3-14.
3-16.
3-18.
3-26.
3-28.
Introduction . . . . . . . . . . . . . . . . . . . . . . . . .
Unpacking and Inspection . . . . . . . . . . . . . . . . . . . . . . . . .
Power Cable. . . . . . . . . . . . . . . . . . . . . . . . . . . . . . .
Introduction . . . . . . . . . . . . . . . . . . . . . . . . . . . .
Measuring Frequency . . . . . . . . . . . . . . . . . . . . . .
Measuring Fm Carrier Frequency and Limits of Frequency
Measuring Pulsed Rf Signals
Use of Frequency Control Connector . . . . . . . . . . . . . . . . . . . . . .
Extending the Operating Range from 12.4 Gc to 18 Gc . . . . .
Measuring Detailed Characteristics of Fm Signals . . . . . . . .
Generating Harmonics for Other Uses . . . . . . . . . . . . . . . . . . . . .
Measuring frequencies above 18 Gc . . . . . . . . . . . . . . . . .
)
Washington, D.C. 29 September 1964
DS, GS, and Depot Maintenance Manual
Frequency Comparator CM-77A/USM
. . . . . . . . . . . . . . . . . .
. . . . . . . . . . . . . . . . . . . . . . . . . . . .
Per Second . . . . . . . . . . . . . . . . . . . . . . . . . . . . . .
Deviation . . . . . . . . . . . . . . . . . . . . . . . . . . . . .
. . . . . . . . . . . . . . .
HEADQUARTERS,
DEPARTMENT OF THE ARMY
Page
v
1-1
1-1
1-1
2-1
2-1
2-1
2-1
2-1
2-1
2-1
3-1
3-1
3-1
3-8
3-8
3-11
3-11
3-12
3-14
3-14
IV
V
THEORY OF OPERATION . . . . . . . . . . . . . . . . . . . . . . . . . . . . . . . . . . . . . . . . . . .
4-1. Circuit Description . . . . . . . . . . . . . . . . . . . . . . .
MAINTENANCE . . . . . . . . . . . . . . . . . . . . . . . . . . . .
5-1.
5-7.
5-9.
5-11.
5-13.
5-19.
5-21.
5-23.
Introduction . . . . . . . . . . . . . . . . . . . . . . . . . . . . . . . . . .
5-3.
Cabinet Removal . . . . . . . . . . . . . . . . . . . . . . . . . .
5-5.
Periodic Cleaning and Lubrication . . . . . . . . . . . . . . . .
Tube Replacement . . . . . . . . . . . . . . . . . . . . . . .
Troubleshooting . . . . . . . . . . . . . . . . . . . . . . . . . .
Calibration . . . . . . . . . . . . . . . . . . . . . . . . . . .
Power Supply Test and Adjustment . . . . . . . . . . . . . . . . .
Testing Oscillator Output and Dial Calibration . . . . . . . . . .
Measuring Video Amplifier Gain and Response . . . . . . . . . . . . .
Centering Oscilloscope Trace . . . . . . . . . . . . . . . . . . .
4-1
4-1
5-1
5-1
5-1
5-1
5-1
5-1
5-1
5-1
5-3
5-4
5-5
i
Page 20

Section
Page
5-25.
5-27.
5-30.
5-35.
V.1
VI
APPENDIX I. REFERENCES
PREVENTIVE MAINTENANCE INSTRUCTIONS
5.1-1.
5.1-2.
5.1-3.
5.1-4.
5.1-5.
5.1-6.
5.1-7.
5.1-8.
5.1-9.
REPLACEABLE PARTS
6-1.
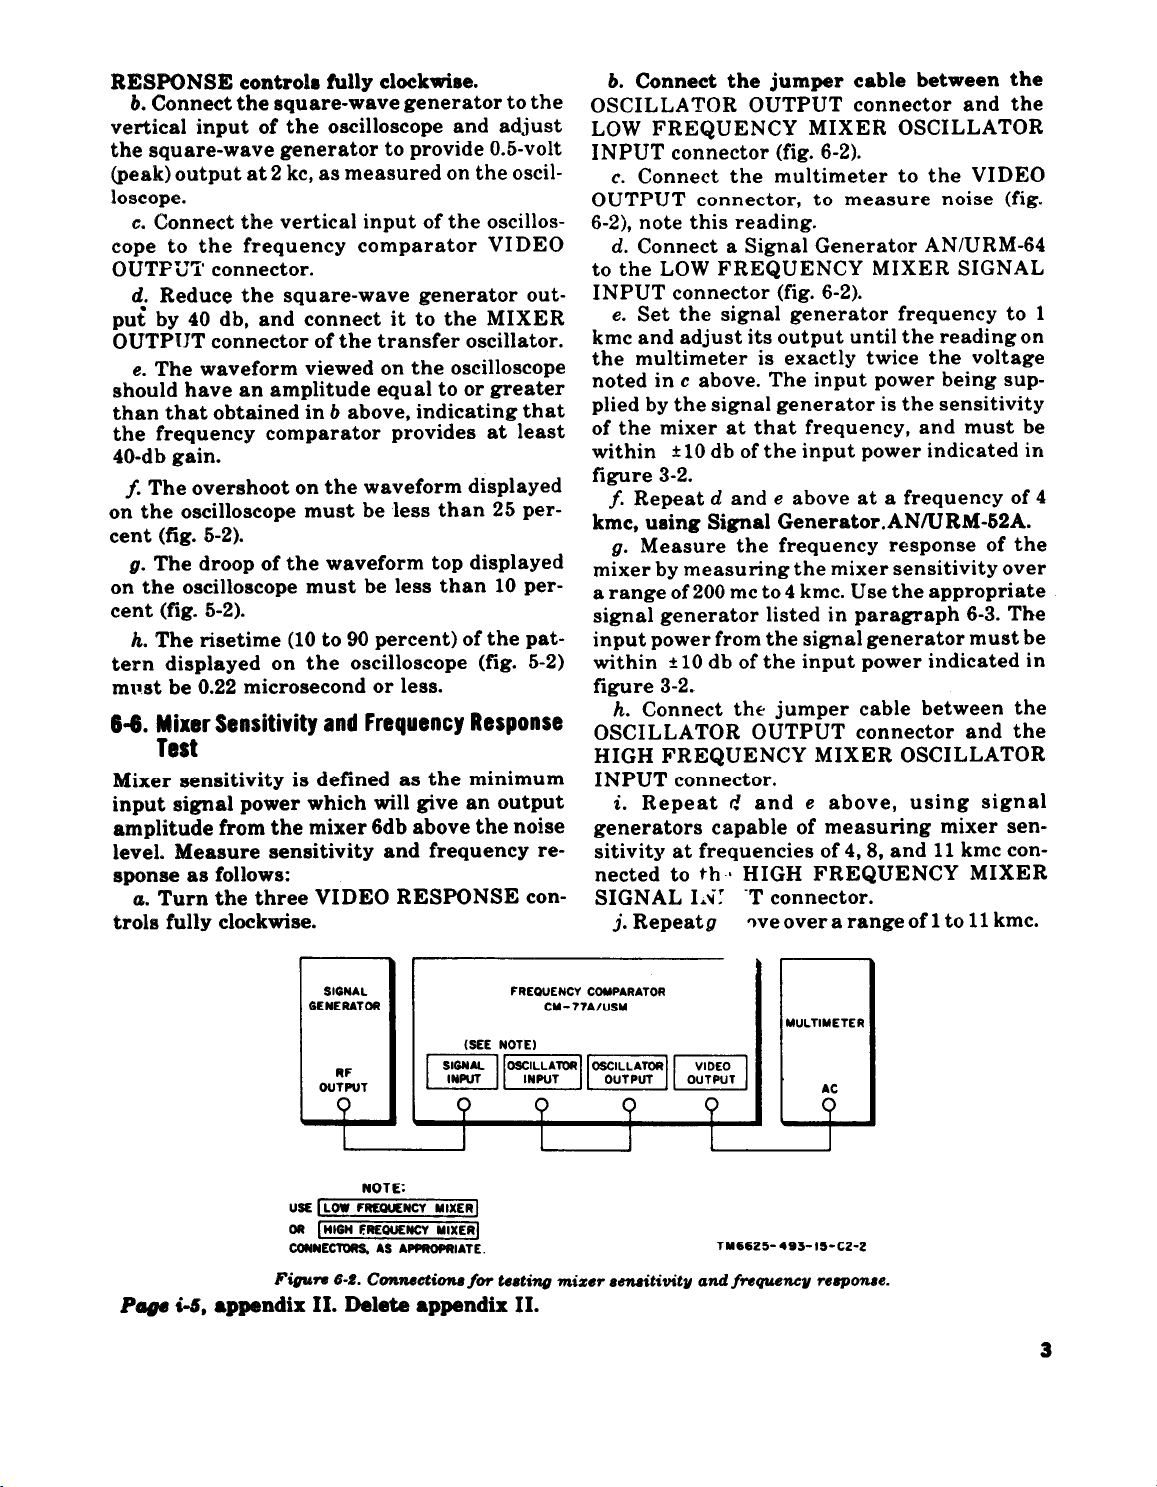
Measuring Mixer Sensitivity and Frequency Response . . . . . .
Replacing Parts in the Low Frequency Mixer . . . . . . . . . . . . . . 5-6
Replacing Parts in the High Frequency Mixer . . . . . . . . . . . . . 5-6
Harmonic Generator Assembly . . . . . . . . . . . . . . . . . . . . . . 5-7
Scope of Maintenance . . . . . . . . . . . . . . . . .... . . . . . . . .
Preventive Maintenance .. . . . . . . . . . . . . . . . . . . . . . . . .
Preventive Maintenance Checks and Services Periods . . . . .
Daily Preventive Maintenance Checks and Services
chart
Weekly Preventive Maintenance Checks and Services
chart
Monthly Preventive Maintenance Checks and Services
chart
Quarterly Preventive Maintenance Checks and
Services Chart
Cleaning . . . . . . . . . . . . . . . . . . . . . . . . . . . . . . . . . . . . . .
Touchup Painting Instructions . . . . . . . . . . . . . . . . . . . . . . . . . .
Introduction . . . . . . . . . . . . . . . . . . . . . . . . . . . . . . . . . . . 6-1
II. MAINTENANCE ALLOCATION
. . . . . . . . . . . . . . . . . . . . . . . . . . . . . . . . . . . . . . . . .
. . . . . . . . . . . . . . . . . . . . . . . . . . . . . . . . . . . . . . . . . . .
. . . . . . . . . . . . . . . . . . . . . . . . . . . .. . . . . . .
. . . . .. . . . . . . . . . . . . . . . . . . . . . . . . .
5-5
. . . . . . . . . . . . . . . . . . . . . . .
. . . . . . . . . . . . . . . . . . . . . . . . . . . . . . . . . . . . . .
. . . . . . . . . . . . . . . . . . . . . . . . . . . . . . . . . . . . .
. . . . . . . . . . . . . . . . . . . . . . . . . . .
.5.1-1
5.1-1
5.1-1
5.1-1
5.1-3
5.1-4
5.1-5
5.1-6
5.1-7
5.1-7
6-1
i-2
i-3
ii
Page 21

Model 540B
List of Illustrations
List of Tables
LIST OF ILLUSTRATIONS
Figure
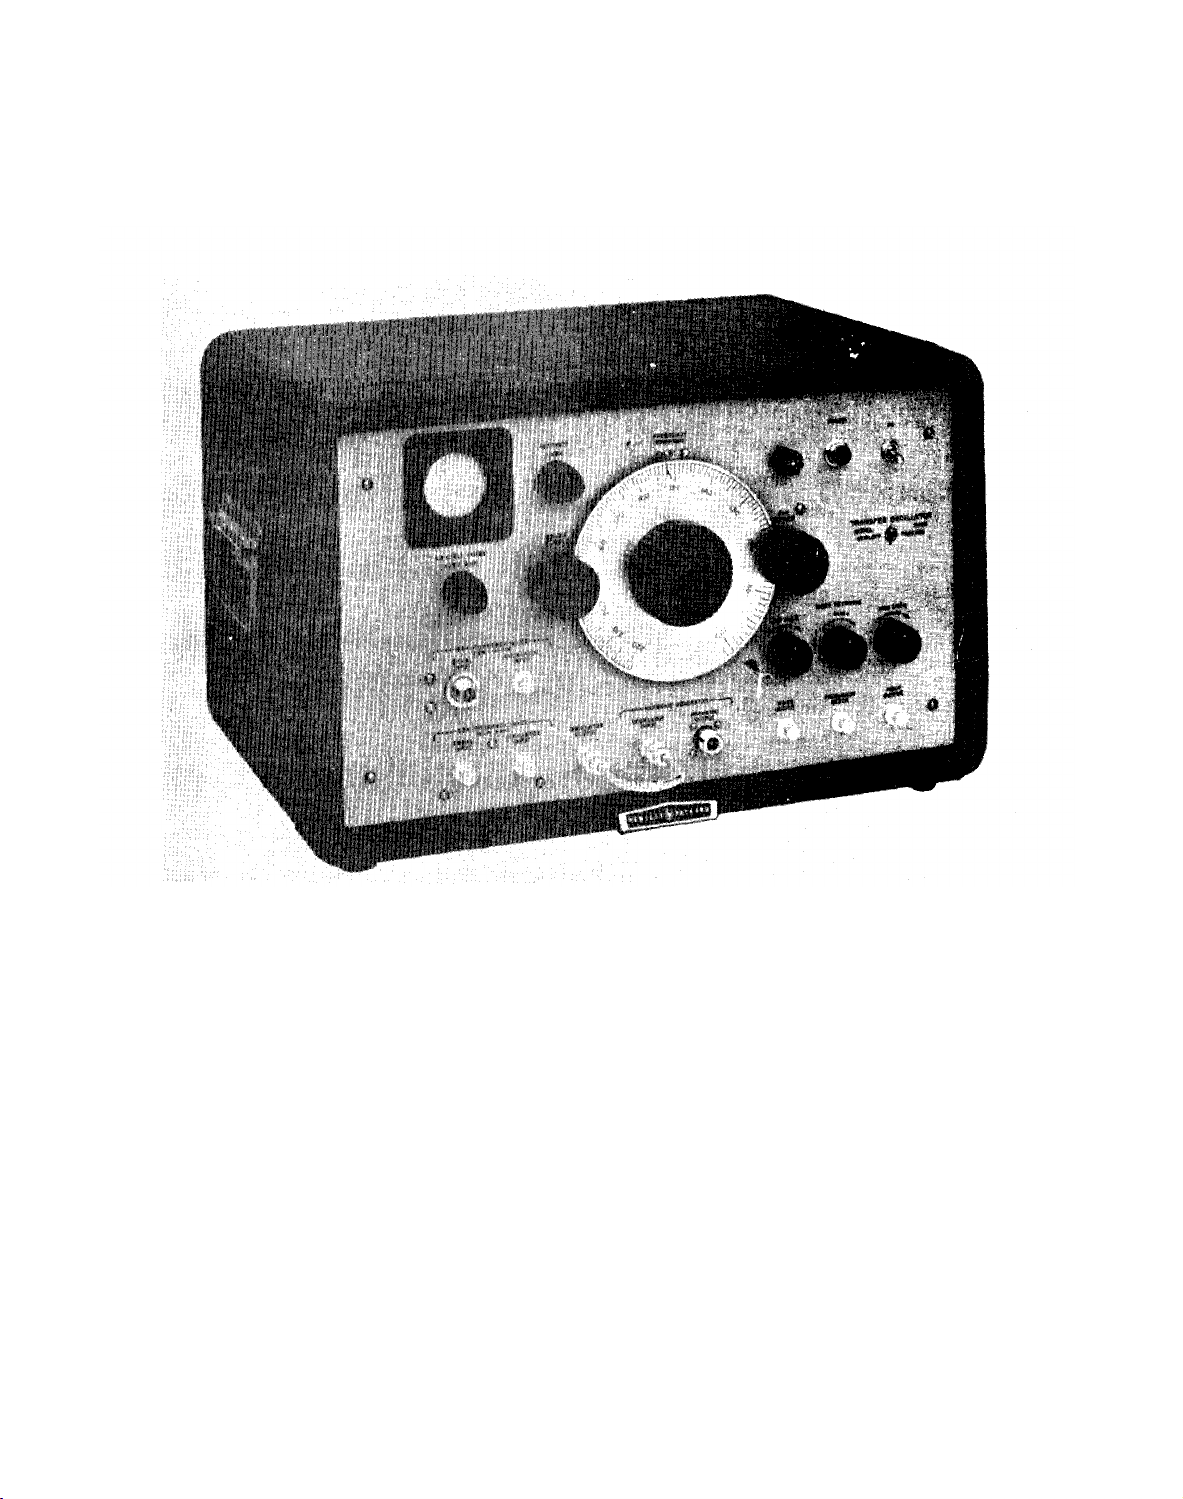
Model 540B, Front View . . . . . . . . . 1-1
1-1.
1-2.
Diagram of Panel Connections and
Functional Groups . . . . . . . . . . . . 1-3
Power Transformer Primary Winding . 2-1
2-1.
Measuring CW and FM Signals . . . . 3-0
3-1.
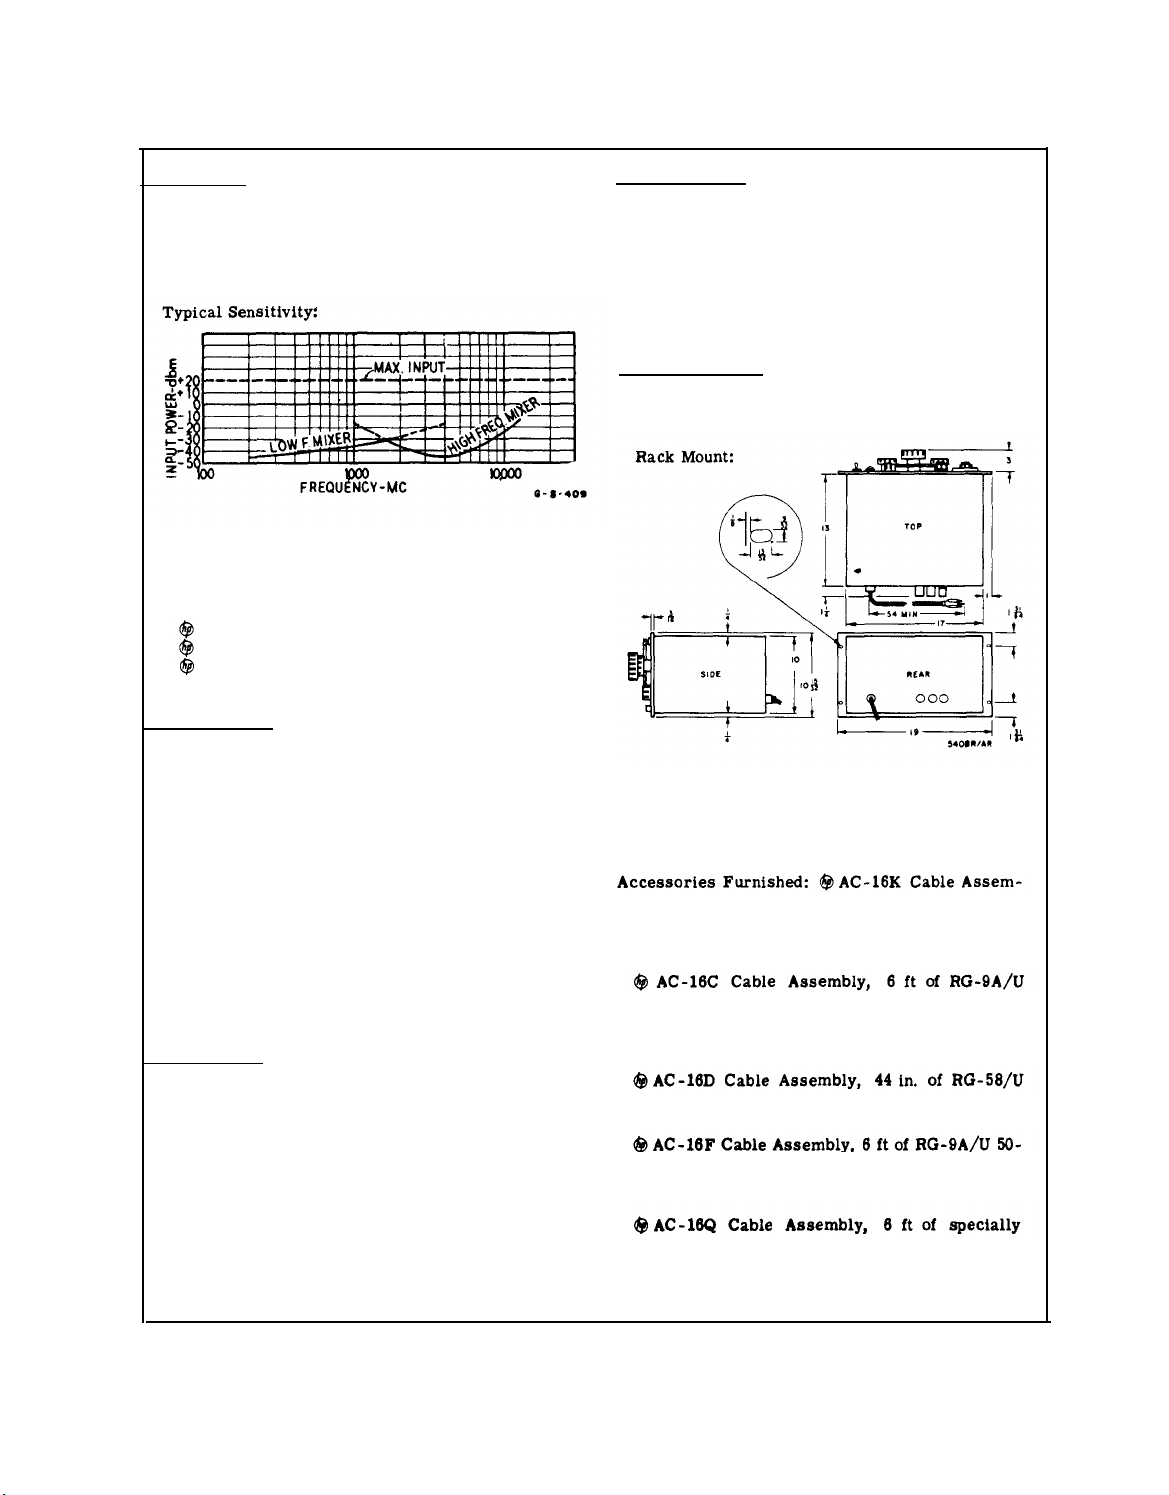
Typical Mixer Input Sensitivity . .. 3-1
3-2.
3-3.
Controls, Indicators and Connectors . . 3-2
Typical Sequence of Oscilloscope Patterns
3-4.
Obtained as Difference Frequency is
Reduced to Zero, with a Stable CS
Input Signal . . . . . . . . . . . . . . . 3-4
Typical Oscilloscope Patterns Obtained
3-5.
when CW Input Signal has some
Frequency Deviation . . . . . . . . . . . 3-4
Nomograph for Determining a Harmonic
3-6.
Number of an Unknown Frequency Between
400 MC and 2 GC from Two Adjacent
Frequencies Obtained with the 540B. . 3-6
Nomograph for Determining a Harmonic
3-7.
Number of Unknown Frequency Between
2 and 5 GC from Two Adjacent Fre-
quencies Obtained withthe 540B . . . . . 3-7
Typical Oscilloscope Patterns Obtained
3-8.
when Input Signal is Frequency-
Modulated . . . . . . . . . . . . . . . . 3-8
Measuring Pulse-Modulated RF Signals. 3-9
3-9.
Typical Patterns Obtained on External
3-10.
Synchronized Oscilloscope, when meas-
ing Pulse-Modulated RF Signals . . . . . 3-10
Page
Figure
Typical Patterns Obtained on External
3-11.
3-12.
3-13.
3-14.
3-15.
3-16.
4-1.
Synchronized Oscilloscope when the
Pulse Presentations of Figure 3-10
are Differentiated at the Oscilloscope
Input . . . . . . . . . . . . . . . . . . . . .
Effect of Resistance Connected Across
FREQUENCY CONTROL Connector. .
Effect of Voltage Connected Across
FREQUENCY CONTROL Connector .
Making Measurements at Frequencies
between 12.4 and 18 GC . . . . . . . . . .
System To Measure Frequency Modu-
lation Characteristics . . . . . . . . . .
Design Information for a Simple
Three-Section Low -Pass Filter . . . .
Transfer Oscillator Block Diagram . .
Location of Measurement and Adjust-
5-1.
ment Points . . . . . . . . . . ..
Waveform Definitions . . . . . . . . . . .
5-2.
Low Frequency Harmonic Mixer . . . .
5-3.
High Frequency Harmonic Mixer . . . .
5-4.
Harmonic Generator . . . . . . . . . . . .
5-5.
Oscillator Assembly . . . . . . . . . . . .
5-6.
Chassis Board, Parts Location . . . .
5-7.
Resistor Board, Parts Location . . . .
5-8.
Voltage and Resistance Diagram . . . .
5-9.
Power Supply, Schematic Diagram. . .
5-10.
Oscillator, Schematic Diagram . . . . .
5-11.
Page
.. 3-10
.. 3-11
.. 3-11
.. 3-12
.. 3-13
.. 3-15
.. 4-1
. . 5-3
. . 5-5
. . 5-6
. . 5-6
. . 5-7
. . 5-8
. .
5-9
. . 5-10
. . 5-11
. .
5-12
5-13
LIST OF TABLES
Number
1-1. Specifications . . . . . . . . . . . . . . .1-2
3-1. Function of Controls, Indicators, and
5-1.
5-2.
5-3. Trouble Localization . . . . . . . . . . 5-5
6-1. Reference Designator . . . . , . . . 6-2
6-2. Replaceable Parts . . . . . . . . . .6-7
Connectors . . . . . . . . . . . . 3-2
Test Equipment . . . . . . . . . . 5-2
Adjustments Required when Tubes
are Replaced . . . . . . . . . . . . . . .5-4
Page
iii
Page 22
Section I
Figure 1-1
Model 540B
iv
Figure 1-1. Model 540B, Front View
Page 23

TM 11-6625-493-15
FOREWORD
Cl
Throughout this manual, reference is made to Model 540B Transfer
oscillator which is a commercial designation and is identical with Frequency
comparator CM-77A/USM. This is a first-edition manual containing preliminary
and unreviewed information compiled by the manufacturer of the equipment.
Judicious caution should be exercised in using the information in this
manual until it is replaced by a revised edition.
Index of Equipment Publications
Refer to the latest issue of DA Pam 31C-4 to determine whether there are
new editions, changes, or additional publications pertaining to the
equipment. Department of the Army Pamphlet No. 310-4 is an index of current
technical manuals, technical bulletins, supply manuals, supply bulletins,
lubrication orders, and modification work orders available through publications supply channels. The index lists the individual parts (-10, -20, -35P,
etc) and the latest changes to and revisions of each equipment publication.
Forms and Records
Reports of Maintenance and Unsatisfactory Equipment. Use equipment
forms and records in accordance with instructions in TM 38-750.
Report of Damaged or Improper Shipment. Fill out and forward DDForm 6
(Report of Damaged or Improper Shipment) as prescribed in AR 700-58 (Army),
NAVSANDA Publication 378 (Navy), and AFR 71-4 (Air Force).
Reporting of Equipment Manual Improvements. The direct reporting, by
the individual user, of errors, omissions, and recommendations for
improving this equipment manual is authorized and encouraged. DA Form 2028
till be used for reporting these improvements. This form may be completed
by using pencil, pen, or typewriter.
triplicate and forwarded by the individual using the manual.
DA Form 2028 will be completed in
The original
and one copy will be forwarded direct to: Commanding General, U. S. Army
Electronics Command, ATTN: AMSEL-MR-(NMP)-MA,
Fort Monnouth, New Jersey
07703.
v
Page 24

Page 25

Model 540B Section I
Paragraphs 1-1 to 1-10
SECTION I
GENERAL INFORMATION
1-1. INTRODUCTION.
1-2.
PURPOSE AND USE. The Hewlett - Packard
Model 540B Transfer Oscillator is an electronic frequency-measuring instrument which, extends the frequency measurement range of the Hewlett - Packard
524 and 5243 series of electronic frequency counters
into the microwave region. The transfer oscillator frequency counter combination measure frequencies
up to 12.4 gigacycles (gc), or with an external mixer,
up to 18 gc, with near-counter accuracy. The Model
540B can also be used without a frequency counter to
measure frequency below 4 gc within about ± 1/2%.
1-3. The method used in the Model 540B Transfer
Oscillator to determine frequency is to zero-beat the
unknown input signal with a harmonic of an extremelystable signal generated in the 540B, and to measure
the 540B fundamental frequency on a counter. Multi-
plying the counter readout by the number of the har-
monic causing the zero-beat gives the input signal frequency. The harmonic number is determined either
from previous knowledge of the input frequency or by
computation. The zero-beat is displayed on the 540B
internal oscilloscope. Typical difference-frequency
displays obtained are shown in figures 3-4 and 3-5.
1-4.
The visual dieplay of the difference frequency
between two signals permits reading microwave carrier frequencies to very close tolerance while the
signal is being amplitude- or frequency-modulated,
or when it contains troublesome e amounts of noise. It
also permits measuring the incidental frequency modulation in amplitude-modulated carriers, the residual
frequency modulation in cw signals and the center frequency and Iimits of deviation in frequency-modulated
signals. When the 540B is used in conjunction with an
external oscilloscope, the carrier frequency of rf
pulses can also be measured to high accuracy. Typical
beat-frequency displays of pulse-modulated carriers
are shown in figures 3-10 and 3-11.
1-5. ACCURACY OF MEASUREMENT. The stability
of the transfer oscillator and the precision with which
it can be adjusted are sufficient that the high accuracy
and resolution of the electronic counters used for readout are utilized over the entire frequency range. Accuracies up to 1 part per million may be expected with
cw signals that are very stable and noise-free. Few
radio-frequency (rf) signals are stable enough to be
measured with such accuracy. Thus, the instability
of the signal being measured is usually the greatest
accuracy-limiting factor.
1-6. When measuring pulsed signals, accuracy de-
pends to some extent on pulse length because measurement can take place only during the pulse. Typical
accuracy obtainable when measuring a stable, pulsed
carrier of 1000 mc is approximately 3 parts per million for a 10-microsecond pulse duration and 10 parts
per million for a 2. 5-microsecond pulse.
1-7. DESCRIPTION OF EQUIPMENT. The trans-
fer oscillator is a single-unit, cabinet-mounted in-
strument.
The electronic circuitry haa four main
groups which can be interconnected by front panel
jumpers for a variety of measurement applications.
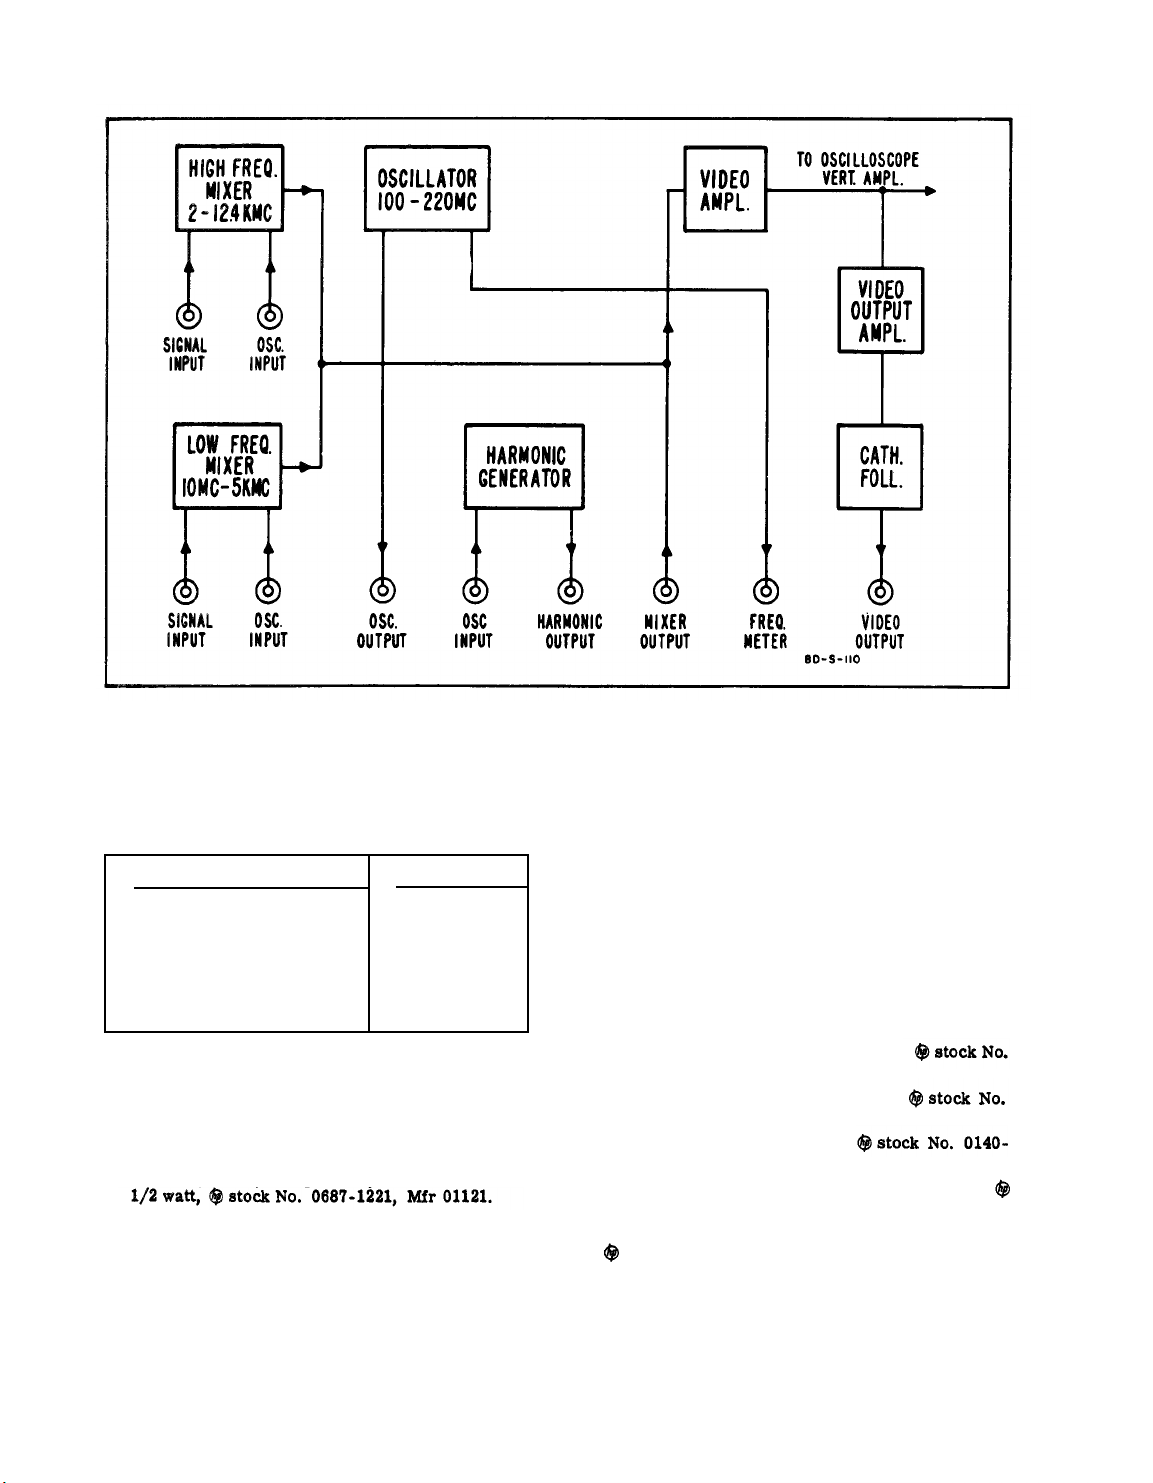
The four groups are shown in the block diagram in
figure 1-2, and listed below:
a. Oscillator Section. An internal oscillator generates a frequency from 100 to 220 mc, which is continuously adjustable by front panel controls. This
frequency is applied to frequency mixers and to an
external frequency counter for accurate frequency
indication.
b. Frequency Mixers. There are two mixers, a
low frequency mixer for input signals from about 10
mc to 5 gc and a high frequency mixer for input sig-
nals from 1 gc to 12.4 gc. The oscillator output is
connected to the proper mixer through a front panel
jumper. The mixer generates harmonics of the oscil-
lator signal which beat with the input signal and pro-
duce low-frequency beat signals which constitute the
mixer output.
c. Amplifier-Oscilloscope Section The amplifier
amplifies the mixer output to display the beat frequency on the built-in oscilloscope. The amplified
mixer output is also available for display on an external oscilloscope.
With the mixer output being
displayed on the oscilloscope, the frequency of the
oscillator can be adjusted until one of its harmonica
produces a zero-beat indication. The zero-beat indi-
cation on the oscilloscope differs in shape as different
types of signals having varying amounts of modulation
or noise are measured.
d. Harmonic Generator. This separate harmonic
generator section may be used to produce higherorder harmonics of the oscillator frequency for external amplification and use.
1-8.
ACCESSORIES FURNISHED. The Model 540B
Transfer Oscillator includes as part of the equipment
a 6-inch coaxial cable jumper with type BNC connectors for use in programming connections between the
jacks on the front panel, and a 4-foot coaxial cable
with type BNC connectors for connecting the transfer
oscillator to the electronic counter.
1-9. DIFFERENCES IN INSTRUMENTS.
1-10. This manual applies directly to 540B Transfer
Oscillators having the serial-number prefix 234. The
manual with the following changes aleo applies to 540B
Transfer Oscillators having serial-prefix numbers
128, 046, 015, 008, and the earlier prefix 129 for
serials between 101 and 597.
00161-2
1-1
Page 26
Section I
Table 1-1
Model 540B
Table 1-1. Specifications
GENERAL
Frequency Range: 10 mc to at least 12.4 gc
Type of Input Signal: CW, AM, FM, or pulse
Maximum Input: 100 mw
Accuracy: Depends on character of unknown sig-
nal, accuracy of comparison, and accuracy with
which fundamental is measured. See discussion
in text.
Auxiliary Equipment:
Model 524 Sertes Electronic Counter
Model 525B Frequency Converter Unit
Model 150A Oscilloscope (for pulse measure-
m ent)
OSCILLATOR
Fundamental Frequency Range: 100 mc to 220 mc
OSCILLOSCOPE
Frequency Range: 100 cps to 200 kc
Vertical Deflection Sensitivity: 5 mv rms per inch
Horizontal Sweep:
External, 1 volt per inch, 20 cps to 5 kc
Internal, power supply frequency with phase
control
MISCELLANEOUS
Dimensions:
Cabinet Mount: 20-3/4 in. wide, 12-1/2 in. high,
15-1/4 in. deep
Harmonic Frequency Range: Above 12.4 gc
Stability: Less than 0.002% change per minute after
30 minutes warmup
Dial: Six-inch diameter, calibrated in l-me in-
crements. Accuracy ± 1/2%
Vernier Dial:
Mechanical - approximately 9:1
Electrical -
approximately ± 125 parts/million
Output: Approximately 2 volts into 50 ohms. Ad-
justed for optimum crystal harmonic generation.
AMPLIFIER
Gain: Adjustable, 40 db maximum
Bandwidth: 100 cycles to 2 megacycles
High Frequency Control: 3-db point adjustable from
below 1 kc to above 2 mc
Low Frequency Control: 3-db point switched from
100 cycles to below 10 kc, then continuously adjustable to above 400 kc
Maximum Undistorted Output: 1 volt rms usable
signal across 1000-obm load
1-2
Weight: Cabinet Mount: 42 lb, shipping 53 lb
Rack Mount:
35 lb, shipping 50 lb
Power Supply: 115 or 230 volts ± 10%, 50 to 1000
cps, approximately 110 watts
bly, 3 ft of RG-58/U 50-ohm coaxial cable termi-
nated at each end with UG-88/U type BNC male
connectors
Accessories Available:
50-ohm coaxial cable terminated at one end with
a UG-21B/U type male connector and with a UG-
23 B/U type N female connector at the other. (For
use at frequencies below 4000- mc. )
50-ohm coaxial cable terminated at one end only
with a UG-88/U type N BNC male connector
ohm coaxial cable terminated at each end with
UG-21B/U type N male. connectors.
(For use
at frequencies; below 4000 mc. )
treated RG-9A/U 50-ohm coaxial cable terminated at each end with UG-21B/U type N male
connectors.
Each cable is tested and selected
for minimum vswr at frequencies above 4000 mc.
00161-2
Page 27
Model 540B
Section I
Paragraph 1-11
Figure 1-2. Diagram of Panel Connections and Functional Groups
1-11. To adapt this manual to instruments with other
instrument serials, make changes as follows:
Instrument Serial No.
129-01577 to 128-02701
046-01191 to 046-01516
015-00698 to 015-01190
008-598 to 008-697
129-00101 to 128-00597
Change No.
1, 2
1, 2
1, 2, 3
1, 2, 3
1, 3, 4
1. S4. Delete slide switch from schematic diagram,
parts lists, table 3-1. Refer to paragraph 2-9 for
details.
Q1, R76, R77, C49. Delete these parts from sche-
matic diagram, parts lists, and replace with R2,
Resistor, fixed, composition, 1200 ohms ± 10%,
2. Gear, frequency drive, large driving; change stock
number in parts lists to G36-H.
Gear, frequency drive, large spring loading; change
stock number in parts lists to G24-G.
Window, frequency dial; change stock number in
parts lists to G99-H.
3.
L8. Delete choke from schematic diagram and
parts Mats. Replace with wire jumper connected
to junction of J13 and L5.
4.
Regulated B+ at Vll pins 3 and 6; change to +225
volts, Decrease by about 7% the values of all tube
socket voltages listed for all tubes except V6, V8,
V10, Vll, V12, and V13.
R12. Change value to 27,000 ohms,
0690-2731.
R17. Change value to 1800 ohms,
0687-1821.
C47. Change value to 470 pf,
0027,
Gear, frequency drive, large driving; change
stock No. in parts lists to 200AB-36B.
Gear, frequency drive, large spring loading; change
stock No. in parts lists to 200AB-36C.
00161-1
1-3/1-4
Page 28

Page 29

Model 540B
Paragraphs 2-1 to 2-13
Section II
SECTION II
INSTALLATION
2-1. UNPACKING AND INSPECTION
2-2.
Unpack the Transfer Oscillator upon receipt
and inspect it for signs of physical damage such as
scratched or dented surfaces, bent or broken projections, etc.
operation of the instrument as a further check for
damage in shipment. Preserve the packing materials
and case for future reshipment. The materials are
designed to give best protection against normal shipping hazards.
2-3. REPACKING FOR SHIPMENT.
2-4. If possible use original packing materials and
carton for repacking. If it is not available, first wrap
instrument in plastic of smooth, heavy paper to pro-
tect surface against scratching. Use liberal quantity
“stuffing” between entire instrument and heavy
of
shipping carton or box. The stuffing materials should
be firm, should prevent motion of the instrument in
the container, and absorb vibration as much as pos-
sible. Seal the shipping carton with steel bands or
heavy tape.
"DELICATE INSTRUMENT”.
2-5. POWER CABLE.
2-6. The Transfer Oscillator is equipped with a
three-conductor power cable which, when plugged into
the appropriate receptacle, grounds the instrument
chassis. The offset round pin on the plug is the ground
connection. To preserve the ground connection when
using a three-pin to two-pin adapter in a two-pin re-
ceptacle, connect the green pigtail lead on the adapter
to ground (the receptacle mounting box may provide
a good ground connection).
Mark the shipping box “FRAGILE” -
When possible, also attempt
and install the jumper marked “230 v“. The connections are easily made on a tie strip mounted next to
the power transformer.
Figure 2-1. Power Transformer Primary Winding
2-10. OPERATION ON LINE FREQUENCIES
HIGHER THAN 120 CYCLES PER SECOND
2-11. The Transfer Oscillator can be operated on any
frequency from 50 to 1000 cycles per second. The in-
ternal sweep for the front-panel oscilloscope gives
adequate phase control with line frequencies up to 120
cps. Above this line frequency, the proper degree of
phase control can still be obtained by decreasing the
value of C24 according to the following equation:
For example: with 400 cps line frequency,
2-7. OPERATION FROM 115- OR 230-VOLT LINE.
2-8. The Transfer Oscillator may be operated on
either 115- or 230-volt line as selected by a slide
switch on the rear of the instrument chassis (earlier
models were not equipped with this switch and required
rewiring of the power transformer primary winding
as described below). The slide switch can be operated with a screwdriver; for operation on 115 volts,
slide switch down so that “115” is exposed; use a 1.25amp fuse. For 230-volt operation, slide switch down
so that “230” is exposed; use a O. 75-amp fuse.
2-9. For Transfer Oscillators having serial number
prefixes 129, 048, 015, and 008, the power transformer primary winding was connected as shown in
figure 2-1 for 115-volt operation. To connect for 230volt operation remove the jumpers marked “115 v“
00161-2
2-12. lNSTALLATION
2-13. No special operating precautions are necessary
for installing the Transfer Oscillator except when it is
to be operated near vibrating machinery. Even though
the precision oscillator in the Model 540B is not prone
to microphonics, its extreme resolution makes very
small frequency changes readily observable, and the
effects of vibration may become apparent. If vibrating
machines disturb frequency measurements, shockmount the Transfer Oscillator by placing the cabinet
model on shock-absorbing material
mounted, the mass of the rack is often sufficient to
reduce vibration to tolerable amounts.
rack-mounting the Transfer Oscillator are given in
Table 1-1, Specifications.
When rack-
Details of
2-1
Page 30

Section III
Figure 3-1
Model 540B
3-0
Figure 3-1. Measuring CW and FM Signals
Page 31

Model 540B
Paragraphs 3-1 to 3-5
Section III
SECTION Ill
OPERATING INSTRUCTIONS
3-1. INTRODUCTlON.
3-2. This section gives step-by-step procedures for
measuring the frequency of the three most common
types of microwave signals, continuous wave, frequency modulated and pulsed signals. The instructions
for measuring c-w signals are basic to all measurements made with the Transfer oscillator and must be
understood before proceeding with any other measurement technique.
special uses of the Transfer oscillator.
Apply no more than 100 milliwatt r-f power
to the Transfer oscillator Input connectors.
To do so will damage the mixer crystal diodes.
3-3. MEASURING FREQUENCY.
3-4. GENERAL. To measure the frequency of an
unknown signal applied to the input of the Transfer
Oscillator, tune the 540B fundamental frequency until
a harmonic of this fundamental beate with the input
signal, then measure the fundamental frequency on an
electronic counter (or read it from the FREQUENCY
dial) and multiply the fundamental by the number of the
harmonic which beat with the input signal; the product
is the frequency of the input signal. When measuring
an input signal for the first time, one of two conditions
exists: 1) the frequency of the input signal is known
approximately and the number of the harmonic causing
the beat can be determined by dividing the approximate
input signal frequency by the fundamental and rounding
off the answer to the nearest whole number; 2) the input
signal frequency is completely unknown and the number
of the harmonic that beats with it must be determined
by tuning the 540B to two adjacent fundamental frequen-
cies whose harmonics zero beat with the input signal,
and computing the number of the harmonic, and the
input frequency.
3-5. To measure the frequency of an input signal refer
to figures 3-1, 3-3 and Table 3-1, and proceed as
follows:
a. Plug in power cable and turn power switch to the
ON position.
b. Select the mixer section which includes the frequency of the signal to be measured. Connect the
jumper cable between the OSCILLATOR OUTPUT and
OSCILLATOR INPUT connectors of this mixer.
Instructions are aleo included for
CAUTION
e. Determine if the input signal level is above 100
milliwatts. If it ie, provide attenuation as shown in
figure 3-1.
CAUTION
DO NOT EXCEED 100 milliwatts to either
SIGNAL INPUT connector.
will destroy the crystal diodes in the mixer.
The minimum signal input power required
to make measurements at various frequencies is shown in figure 3-2.
The values obtainable with a particular mixer may vary
from the average values shown due to different crystal
efficiencies, etc. Generally variations as great as ± 10
db from tbe curves may occur at some frequencies.
*DBM means decibels referred to one milliwatt.
Figure 3-2. Typical Mixer Input Sensitivity
f. Connect the input signal to be measured to the
SIGNAL INPUT connector of the selected mixer.
g. Connect the electronic counter (Hewlett-Packard
Model 524 C/D or equivalent) to the FREQUENCY
METER connector.
h. If the input frequency is known approximately,
divide it by a harmonic number that gives a funda-
mental frequency in the range of the FREQUENCY
dial. Set the FREQUENCY dial to this frequency.
i. Using a 0.01 second counter gate time and minimum display time, tune the COARSE VERNIER control
until a vertical deflection is obtained on the oscillo-
scope. This deflection indicatee that some harmonic
of the transfer oscillator’s fundamental frequency is
sufficiently close to the input signal to produce a
difference-frequency within the bandwidth of the oscilloscope. If more than one such beat frequency is obtainable, use the highest fundamental. Tune as close
to zero beat as is convenient with the COARSE control.
Higher power
C. Set the HORIZ SWEEP INPUT switch on the rear
of the chassis to INT; set the line voltage selector to
the line voltage to be ueed.
d. Set the VIDEO RESPONSE-GAIN and HIGH FRE-
QUENCY controls to maximum clockwise position.
00161-2
j. Using a 0.01 second counter gate time and infinite
dieplay time, tune the FINE VERNIER control to reduce the difference-frequency to as close to zero as
the stability of the measured signal will allow. Press
the counter RESET bution at the instant an exact zero
beat is obtained. This allows the electronic counter
3-1
Page 32

Section III
Figure 3-3
Model 540B
Figure 3-3. Controls. Indicators. and Connectors
Table 3-1. Function of Controls, Indicators, and Connectors (Sheet 1 of 2)
1. ON switch.
In ON position, applies power to
instrument. In down position, removes power
from instrument.
2. POWER indicator light. Glows when power is
applied to instrument.
3. FREQUENCY dial.
Adjusts and indicates the
fundamental frequency generated by the internal
oscillator, in MEGACYLES, within 1/2 percent.
4. COARSE VERNIER dial.
Adjusts the FRE-
QUENCY dial at reduced speed.
3-2
FINE VERNIER dial.
5.
Adjusts the oscillator
frequency electrically +125 cycles per megacycle from the frequency indicated by the FREQUENCY dial.
6.
OSCILLATOR OUTPUT connector.
the fundamental frequency for connection tothe
Low Frequency or High Frequency Mixer, or
Harmonic Generator.
FREQUENCY METER connector. Supplies an
7.
output of the oscillator frequency for connection
to an external electronic counter.
Supplies
00161-2
Page 33

Model 540B
Section III
Table 3-1
Table 3-1. Function of Controls, Indicators, and Connectors (Sheet 2 of 2)
8. HIGH FREQUENCY MIXER OR LOW FREQUENCY OSCILLATOR INPUT connectors. Accepts the fundamental frequency from
the OSCILLATOR OUTPUT connector.
9. LOW FREQUENCY MIXER SIGNAL INPUT
connector. Accepts an input signal of 5 gc or
less whose frequency is to be measured. This
signal is mixed with harmonics of the oscillator
frequency and the resultant signal is supplied at
the MIXER OUTPUT connector.
10. HIGH FREQUENCY MIXER SIGNAL INPUT
connector. Accepts an input signal between 1
and 12.4 gc whoee frequency is to be measured.
This signal is mixed with harmonics of the oscillator frequency and the resultant signal is
supplied at the MIXER OUTPUT connector.
11. HARMONIC GENERATOR OSCILLATOR INPUT
connector. Accepts the signal from the OSCIL-
LATOR OUTPUT connector for generation of
higher-order harmonics obtainable at the HARMONIC OUTPUT connector. When the transfer
oscillator is used for frequency measurement,
the necessary harmonics are generated in the
mixer, and this harmonic generator section is
not used.
12. HARMONIC GENERATOR HARMONIC OUTPUT
connector.
Provides high-order harmonics of
the signal applied to the HARMONIC GENERA-
TOR OSCILLATOR INPUT connector. These
harmonics are for mixing with input signal frequencies above 12.4 gc using an external mixer.
The output of the external mixer is then applied
to the MIXER OUTPUT connector for display.
13. MIXER OUTPUT connector. Supplies the output signal from the Low or High Frequency
Mixer for use by external equipment these
mixer outputs are internally connected to the
amplifier-oscilloscope section for display).
This connector may also receive the output of
an external mixer for display on the internal
oscilloscope.
14. VIDEO OUTPUT BNC connector. Supplies the
amplified output of the mixers for use by ex-
ternal equipment. Gain and bandwidth are controlled by the three VIDEO RESPONSE controls.
15. VIDEO RESPONSE-GAIN control. Controls
amplification of the output from either internal
mixer or from an external mixer connected to
the MIXER OUTPUT jack, which drives the
oscilloscope sod is available at the VIDEO
OUTPUT connector.
16. VIDEO RESPONSE-HIGH FREQ control. Ad-
justs the frequency of the upper 3 db point of
the amplified mixer output signal to the oscilloscope and the VIDEO OUTPUT connector
from below 1 kc to above 2 mc.
NOTE: Although the signal available at the
VIDEO OUTPUT connector has a 2 mc bandwidth the oscilloscope responds only to frequencies up to approximately 200 kc.
17. VIDEO RESPONSE-LOW FREQ control. Adjusts the frequency of the lower 3 db point of
the mixer signal at the MIXER OUTPUT jack;
does not affect the bandwidth of the oscilloscope. At the extreme clockwise position, the
3 db point is switched to 100 cps. Moving off
the extreme CW position the 3 db point is
switched from 100
CPS to 10 kc, and then is
continuously adjustable to above 400 kc as the
control is turned counterclockwise.
18. FOCUS control.
Adjusts the focus of the os-
cilloscope trace.
19. INTENSITY control. Adjusts the intensity of
the oscilloscope trace.
20. HORIZ GAIN control. Adjusts speed to compress or widen the presentation.
21. 60 CYCLE PHASE control. Adjusts the phase
of the internal, power line frequency sweep to
position the zero-beat frequency indication in
the center of the screen.
22. HORIZ SWEEP INPUT toggle switch (on rear
panel).
In INT. position, provides a line-
frequency sine-wave sweep for the oscillo-
scope, with phase adjustable by the front panel
60 CYCLE PHASE control. In EXT. position,
allows a sweep signal to be provided from an
external source connected to HORIZ SWEEP
INPUT connector, and disables the front panel
60 CYCLE PHASE control.
23. HORIZ SWEEP INPUT BNC connector (on rear
panel). Accepts an external sweep signal.
External sweeps must have an external phase
control to position the zero-beat indication.
This is used to synchronize the sweep when
the carrier being measured is modulated at
a rate different from the power line frequency.
24. FREQUENCY CONTROL BNC connector (on
rear panel). Receives an externally-genetated,
adjustable voltage or resistance to adjust the
oscillator output frequency.
The maximum
frequency variation from this control ie less
than 0. 1%.
00161-1
3-3
Page 34

Section III
Paragraph 3-5 (contd)
to measure the, transfer oscillator fundamental frequency at a precise moment, then hold the display.
On stable signals the oscilloscope trace will resemble
figure 3-4. Absolute zero-beat will be obtained when
the oscilloscope trace collapses into the horizontal
Since the frequency of most signals measured
line.
is not stable enough to achieve this indication completely, various looped patterne are obtained as the
measured frequency drifts about the exact point of
zero-beat. Patterns such as illustrated in figure 3-5
are sufficiently close to zero-beat for most measurements, and are more practical to use than attempting
to obtain a perfect zero-beat. Adjust the characteristic of the pattern by adjusting the VIDEO RESPONSEGAIN and HIGH FREQ. controls as desired.
When a very stable cw signal is being measured, the
operator can initially adjust the transfer oscillator
frequency until a beat-frequency presentation similar
to A is obtained. As the operator refines the adjustment wfth the FINE VERNIER control, the oscilloscope
pattern changes as shown in B and then collapses to
almost-straight hortzontal lines, as shown in C when
the true zero-beat is obtained. In practice, few signals are sufficiently stable to permit the simple pattern
of C to be obtained. If the signal being measured has
some residual frequency modulation the beat frequency
patterns shown in figure 3-5 will be obtained.
Model 540B
When the frequency of the unknown signal vanes
slightly (has some residual frequency modulation),
the difference or beat frequency viewed on the oscilloscope also varies, and the exact zero-beat indication till be in the center of a band of difference frequencies all shown simultaneously on the oscilloscope
screen.
indications obtained with signals with varying amounts
of residual frequent y modulation. Parts A and B
show two typical beat-frequency responses from
signals containing very minor amounts of frequency
deviation; part C is the result obtained with a signal
having a larger amount of frequency deviation. The
exact zero-beat point is where the lines in the pattern become expanded horizontally.
responses are obtained, notice first, that a low-beat
frequency is approached, and then the exact zero-beat
point begins to appear. This point moves about on
the screen presentation and then disappears. Note
that the zero-beat is traced twice per sweep, once in
each direction, because the oscilloscope sweep is a
sine wave. The 60 CYCLE PHASE control can be
used to superimpose the two zero-beat traces in the
center of the screen, if the residual frequency modu-
lation occurs at power line frequency. If the zerobeat traces cannot be stopped in one place, refer to
paragraph 3-5 k for instructions for connecting an
external synchronizing signal.
This figure shows examples of zero-beat
When such
Figure 3-4. Typical Sequence of Oscilloscope
Patterns Obtained as Difference Frequency is
Reduced to Zero, with a Stable CS Input Signal
k. The 60 CYCLE PHASE control can be adjusted
to position the zero beat point in the center of the
screen, provided the residual frequency modulation
occure at the power line frequency. If the zero beat
cannot be positioned with the 60 CYCLE PHASE con-
trol, frequency of the residual modulation on the car-
rier is different from the power line frequency. In
thie case the zero-beat point is determined from the
wideet zero-beat indication obtainable in the pattern
that will sweep across the screen. If it ie necessary
to etop the pattern in one place f or adequate measurement, apply to the rear HORIZ SWEEP INPUT connector a signal of the same frequency as the residual
modulation of the cw input. Switch the HORIZ SWEEP
INPUT switch to the EXT. position. The oscilloscope
horizontal sweep will now be synchronized with the
residual modulation of the cw input signal, and the
pattern will be stable. If the residual frequency-
3-4
Figure 3-5. Typical Oscilloscope Patterns
Obtained when CW Input Signal has some
Frequency Deviation
modulation is accompanied bv the amplitude modulation, the amplitude of the overall pattern on the
oscilloscope will be altered without affecting readability or resolution. Amplitude modulation is indicated by a difference in amplitude of the pattern at
the forward and backward traces on the oscilloscope.
If the amplitude modulation occurs at the power line
frequency, the phase control can be adjusted to superimpose the two traces and produce the familiar
trapezoid associated with amplitude modulation. To
measure the residual or the incidental frequency
modulation, see paragraph 3-9.
1. Record the reading on the FREQUENCY dial, or
the number displayed on the Model 524 C/D Frequency
Counter (add the mixing frequency indicated on the
Model 525B Frequency Converter, in accordance with
the frequency converter instruction manual). The
00161-1
Page 35

Paragraphs 3-6 to 3-8
Section III
counter reading is a more exact measurement of the
fundamental frequency being generated by the transfer oscillator.
m. If the input frequency is known well enough that
there can be no ambiguity between harmonics, divide
it by the transfer oscillator fundamental frequency
and round off the answer to the nearest even number.
This is the number of the harmonic that beats with
the input signal. If there is any ambiguity about the
harmonic number, determine the exact harmonic in
steps o through s.
n. Multiply the FREQUENCY dial reading or the
counter indication by the harmonic number to obtain
the exact frequency of the input signal.
o. Slowly increase or decrease the fundamental
frequency until the next adjacent fundamental is found
whose harmonic produces a zero-beat indication.
Watch the oscilloscope closely to assure that a weak
indication of a zero-beat is not passed unnoticed,
Record this fundamental frequency.
p. Using the appropriate nomograph in figures 3-6
and 3-7, locate the higher fundamental frequency recorded in steps 1 and o on the left column and the
lower fundamental frequency recorded above on the
center column.
q. Place a straight-edge across the two points and
intersecting the right hand column. The point of in-
tersection on the right-hand column indicates the
number of harmonic that beats with the input signal
when the FREQUENCY dial is tuned to the higher of
the two fundamental frequencies used.
r. If further assurance of accuracy is required,
such as with input signals containing large amounts
of noise, or if the input frequency is above or below
those included in the nomography, use the first of the
following equations to determine the input frequency,
and the second or third equations to determine the
harmonic.
Equation 1:
Equation 2:
Equation 3:
Note
To obtain accurate answers with the above
equations, the fundamental frequencies must
be read to 0.01% or better. In case the input signal being measured does not have this
order of stability, it may be necessary to
take the average of several fundamental fre quency readings for each beat-producing harmonic.
read to 0.01% or better, the necessary division or multiplication can be carried out in
longhand if highest accuracy is required, or
with a slide rule if this degree of accuracy is
satisfactory.
S
. To check the calculation performed in the step
With the fundamental frequencies
above, measure the next adjacent fundamental whose
harmonic produces a zero-beat indication. Recalculate, using the previously measured adjacent fundamental frequency.
Figures 3-6 and 3-7 are nomography of the
3-6.
equations given in step r of paragraph 3-5. They are
useful if the input frequency is between 400 and 5000
megacycles and can be determined from two adjacent
transfer oscillator fundamental frequencies which produce zero-beat indications. In the nomograph, f
the unknown frequency, f
transfer oscillator frequencies whose harmonics produce zero-beat indications; f
To use the nomograph, locate two adjacent fundamental
is the higher of two adjacent
1
is the lower frequency.
2
x
frequencies which zero-beat with the unknown input
signal. Find the higher of these two frequencies in
left-hand column, the lower in the center column; place
a straight-edge across these two points. The point
where the straight-edge intersects the right-hand
column ie the number of the harmonic which beats
when the transfer oscillator is tuned to fl,
with f
x
Multiply f
quency of the input signal (f
by the harmonic number to obtain the f re -
1
).
x
3-7. Transfer oscillator fundamental frequency can
be read directly from the FREQUENCY dial with 1/2%
accuracy. The dial reading can be used in the above
equations for frequencies up to about 2000 megacycles,
where low-order harmonics are used and the multiplied inaccuracy is reduced. To use the equations
above 2000 mc the electronic counter must be used to
read the fundamental frequency with sufficient accuracy to identify adjacent harmonics. However, if the
harmonic which produces a beat frequency is already
identified,
unknown frequencies above 2000 mega-
cycles can be measured to 1/2% accuracy by reading
the fundamental frequency directly from transfer os-
cillator FREQUENCY dial.
is
= frequency of unknown input signal
= two adjacent fundamental frequencies
f
l
whose harmonics produce zero beat
= harmonic number of f
N
1
N2 = harmonic number of f
00161-1
higher fundamental,
lower fundamental
1
2
3-8. The beat frequencies produced by the mixers
in thie instrument are suitable only for frequency
measurement as described in this manual.
These
outputs are not suitable for amplitude measurements
because the mixers are designed for best frequency
coverage rather than calibrated amplitude responses.
A suitable external mixer must be used for applications where mixer output amplitude measurements
are made.
3-5
Page 36

Section III
Figure 3-6
Model 540B
3-6
Figure 3-6. Nomograph for Determining a Harmonic Number of an
Unknown Frequency Between 400 MC and 2 GC from Two
Adjacent Frequencies Obtained with the 540B
Page 37

Model 540B
Section III
Figure 3-7
Figure 3-7. Nomograph for Determining a Harmonic Number of
Unknown Frequency Between 2 and 5 CC from Two
Adjacent Frequencies Obtained with the 540B
3-7
Page 38

Section III
Paragraphs 3-9 to 3-13
3-9. MEASURING FM CARRIER FREQUENCY
AND LIMITS OF FREQUENCY DEVIATION.
3-10. To obtain readable zero-beat patterns when
measuring the center-frequency and the limits of fre -
quency deviation in frequency-modulation carriers,
the oscilloscope in the Model 540B must be swept by
a signal of the same frequency that modulates the
carrier,
swept at the power line frequency. If the carrier being
measured must be frequency-modulated at a rate different from the power-line frequency, this frequency
signal must also be applied to the HORIZ SWEEP INPUT connector on the rear of the transfer oscillator
chassis and the HORIZ SWEEP INPUT switch must be
set to the EXT. position.
modulation which results in simple zero-beat presentations; non-sinusoidal modulation gives complex
oscilloscope pictures.
3-11. When an external sweep input signal is used,
the 60 CYCLE PHASE control on the front panel is
inoperative, and it may be necessary to externally
adjust the phase of the sweep input signal to produce
a stationary pattern such as shown in figure 3-8. The
oscilloscope presentation obtained when measuring
a frequency-modulated signal indicates much great er
deviationtban when a cw signal with residual frequency
modulation was measured. The width of the zero-beat
point appears much smaller in relation to the full
oscilloscope pattern, as shown in figure 3-8. Make
measurements as follows:
a. Perform steps a through s of paragraph 3-4 to
measure the carrier frequency. Refer to figure 3-8
for typical oscilloscope patterns.
b. Position the zero-beat pattern for the carrier
frequency in the center of the oscilloscope screen.
c. With the FINE VERNIER control adjust the zerobeat indication slowly to one side of the oscilloscope
screen, as shown in figure 3-8, parts B and C. This
is either the lowest or highest frequency present in
the carrier.
d. Compute this frequency as directed in paragraph
3-4, steps 1 through s.
e. Adjust the zero-beat to the opposite side of the
oscilloscope, which corresponds to the limit of deviation on the opposite side of the carrier frequency.
f. Compute frequency as in step d.
3-12. MEASURING PULSED RF SIGNALS.
3-13. The carrier frequency of pulsed rf signals is
measured by displaying a single pulse from the pulse
train as shown in figures 3-10 and 3-11, and adjust-
ing the transfer oscillator until a harmonic produces
a zero-beat indication with the carrier during the
pulse. To observe a single pulse from the pulse train,
an external oscilloscope with triggered sweep must
be used instead of the transfer oscillator oscilloscope.
Proceed as follows:
a. If the pulse width is greater than one micro-
second, connect the VIDEO OUTPUT connector of the
The Model 540B oscilloscope is internally
Use sine-wave frequency
Model 540B
When a frequency modulated signal is being meas-
ured, the beat frequency varies at tbe rate of the
frequency modulation and it is not possible to reduce
the zero-beat indication to a simple horizontal line
as in figure 3-11; instead, the zero-beat indication
aPPears in the center of a band of difference frequen cies similar to those of figure 3-5, but wfth the difference frequencies more tightly packed. The exact
zero-beat point is where the lines in the pattern become expanded horizontally. Parts A and D above
show the zero-beat indic atione prope rly superimposed
while the transfer oscillator is properly tuned to the
carrier center frequency. Tbe amplitude of the difference frequencies on either side of center in D is
decreased because the frequency deviation of the
carrier is so great that display of the difference
frequencies is limited by the bandwidth of the oscilloscope vertical amplifier. Parts B and C show the
presentation of the same signal as part A, as it
appears when the transfer oscillator is properly tuned
first to one limit of frequency deviation and then the
other, in making a measurement of maximum de-
viation above and below carrier frequency.
Figure 3-8.
when Input Signal is Frequency-Modulated
transfer oscillator to the vertical input jack of an
external oscilloscope with triggered horizontal sweep.
See figure 3-9 for a connection diagram.
b. If the pulse width is less than one microsecond,
connect the MIXER OUTPUT connector to an external
wideband amplifier, such as the@ Model 460 AR. Then
connect the output of the amplifier to the vertical in-
put jack of the oscilloscope. The external amplifier
is required because the mixer output contains frequencies beyond the passband of the transfer oscillator amplifier,
c. Connect the external sync jack of the oscilloscope
to the sync output of the pulsed carrier modulator. If
no suitable sync output is available a usable output
Typical Oscilloscope Patterns Obtained
3-8
00161-1
Page 39

Model 540B
Section III
Paragraph 3-13
Figure 3-9. Measuring Pulse-Modulated RF Signals
may be obtained by tapping off a portion of the pulsed
carrier at a suitable point, and detecting the pulse
envelope with a low-pass filter.
This envelope is
suitable for triggering the oscilloscope sweep.
d. Perform steps a through g of paragraph 3-5. For
pulse carriers it is best to be able to adjust the input
power to obtain at optimum oscilloscope pattern. If
too much input power is applied in pulsed if measurements, the detected video pulse may obliterate ths
desired beat frequency in the preeentaUon. Use only
enough power to obtain an easily read zero-beat.
e. If using the internal amplifier, turn all three
VIDEO RESPONSE controls on the transfer oscillator
fully clockwise for maximum gain and bandwidth.
00161-1
f. Adjust the input attenuator, initially, to provide
almost 100 milliwatts of power. It may be necessary
to reduce this input power to obtain an optimum zerobeat pattern.
g. Adjust the fundamental frequency of the transfer
oscillator to obtain the proper zero-beat pattern described below and illustrated in figure 3-10. The
unknown frequency consists of pulses of an rf carrier;
the mixer output consists of the difference frequency,
lasting for the duration of each pulse. As the transfer
oscillator is adjusted to bring a harmonic of the fundamental close to the frequency of the pulsed carrier,
the difference frequency first appears as a sine wave
within a pulse envelope, indicating that the difference
frequency is great enough that several complete cycles
3-9
Page 40

Section III
Paragraph 3-13
When the transfer oscillator frequency is adjusted to
zero-beat wftha pulsed rf signal applied to the system,
the first presentation usually recognized on the oscilloscope is similar to that of part A. In this case,
about five cycles of the difference frequency occur
within each rf pulse envelope. For one-microsecond
pulse this corresponds to a difference frequency of
about 5 mc. As the transfer oscillator is fine-tuned
with the FINE VERNIER control, the number of difference-frequency cycles per pulse decreases as
shown in B, and finally becomes less than one cycle,
as illustrated in C. When the beat frequency is less
than one cycle a pattern like that in D is obtained.
The ideal zero-beat indication is when the pattern
becomes agroupof horizontal traces.
Figure 3-10. Typical Patterns Obtained On
External Synchronized Oscilloscope, when
Measuring Pulse -Modulated RF Signals
fall within one pulse duration interval. As the zerobeat point is approached and the difference frequency
is reduced to the point where less than one cycle comes
within each pulse interval, the waveform within the
pulse envelope changes from sinusoidal (or nearly
vertical) to horizontal.
The lines become nearly
horizontal when the beat frequency is essentially zero,
where the difference frequency has such along period
that it hardly changes within each pulse interval. If
the signal under test were perfectly stable, the zerobeat indication would be one horizontal line within the
pulse envelope. In practice, many horizontal lines
appear.
The optimum zero-beat point occurs when
these horizontal lines have as little slope as possible.
3-10
Model 540B
This presentation of the difference frequency with a
pulsed rf signal dees not require resolution of individual traces to identify the zero-beat. Zero-beat
is indicated when the first envelope of the differen-
tiated signal decays to a sharp point. Parts A, B,
and C illustrate difference frequencies of one, one-
tenth,
and one -hundredth cycle-per-pulsewidth,
respectively, approximately the counterparts of B,
C, and D in figure 3-10. Part C of this figure is
very close to the ideal zero-beat indications.
Figure 3-11. Typical Patterns Obtained on External
Synchronized Oscilloscope when the Pulse Pre-
sentations of Figure 3-10 are Differentiated
at the Oscilloscope Input
h. If the pulse repetition rate ie above 5 kc, horizontal traces at the optimum zero-beat point may be
too crowded for optimum selection of the “best-horizontal” presentation. In this case insert a simple
R-C differentiating circuit ahead of the vertical input
terminal of the oscilloscope as shown in figure 3-9.
The time constant of the R-C differentiating circuit
should be on the order of one-tenth of the pulse width
of the pulsed carrier. The optimum zero-beat point
is then indicated when the first envelope decays to the
sharpest obtainable point as illustrated, in figure 3-11.
If too short a time constant is used, decay to a sharp
point occurs in spite of a relatively high difference
frequency, indicated by a lack of sensitivity of the
FINE VERNIER control over the narrowness of the
decay point. If too long a time constant is used, the
decay point does not narrow even at zero-beat.
i. Carry out the frequency calculation and repeat
measurements for harmonic number determination,
accuracy checks, etc.,
ase directed in steps 1 through
s of paragraph 3-5.
00161-1
Page 41

Model 540B
3-14. USE OF FREQUENCY CONTROL
CONNECTOR.
3-15. This rear panel connector permits electronically adjusting or frequency modulating the fundamen-
tal frequency generated by the transfer oscillator
about 0.1% Variation of tbe oscillator frequency is
accomplished by applying a steady or varying voltage
or resistance, as desired, across the connector. The
effect of this applied voltage or resistance is to alter
the plate-to-ground capacity in the oscillator circuit
to produce a slightly different frequency of oscillation.
A constantly varying voltage or resistance will produce
frequency modulation, while fixed steps of voltage or
resistance will produce incremental changes in the
fundamental frequency. Figures 3-12 and 3-13 sho
typical frequency changes, in percent, produced by
various values of resistance and voltage connected
across the FREQUENCY CONTROL connector. Theee
are typical values which vary from instrument to
instrument.
Paragraphs 3-14 to 3-17
Section III
W
Figure 3-13. Effect of Voltage Connected Across
FREQUENCY CONTROL Connector
c. Connect the unknown frequency in the range of
12.4 to 18 gc to the P-band waveguide input of the
Model 932A. Use an input power greater than the
minimum shown on the graph furnished with the Model
932A, but lese than 100 milliwatts.
NOTE
Figure 3-12. Effect of Resistance Connected
Across FREQUENCY CONTROL Connector
3-16. EXTENDING THE OPERATING RANGE
FROM 12.4 GC TO 18 GC.
3-17. The Model 540B Transfer Oscillator may be
used to measure frequencies from 12.4 to 18 gc by
Model 932A High Frequency Mixer.
This external mixer replaces the internal mixer which
is net suitable above 12.4 gc. To operate the tranefer
oscillator in this range, follow the same operating
procedures as given in the previous paragraphs, but
connect the transfer oscillator as follows (see figure 3-14):
a. Connect the transfer oscillator OSCILLATOR
OUTPUT connector to the OSCILLATOR INPUT connector on Model 932A through low-loss coaxial cable.
Greater watchfulness is required when measuring higher frequencies due to closer spacing
and decreasing strength of the harmonics. In
searching for zero-beat indications produced
by adjacent harmonics, be careful not to skip
an adjacent harmonic and unintentionally
measure a non-adjacent one. As a precaution
tune to a third adjacent harmonic producing
a zero-beat frequency, ae shown in the example below. Uee the highest possible fundamental frequencies of the oscillator for
greatest accuracy.
d. As an example of the fundamental frequencies and
adjacent harmonics that should be used to determine
the frequency of an approximate 18-gc carrier.
b. Connect the VIDEO OUT connector on the Model
932A to the MIXER OUTPUT connector on the transfer
oscillator through low -loss coaxial cable.
00161-1
using the equations given in paragraph 3-5 r for computing the fundamental frequency and the number of the
harmonic causing a zero beat,
3-11
Page 42

Section III
Paragraphs 3-18 to 3-22
Figure 3-14. Making Measurements at Frequencies between 12.4 and 18 gc
Model 540B
From this example it can be seen that an error in harmonic order will be easily detected, even if computations are made on a ten-inch slide rule.
3-18. MEASURING DETAILED CHARACTER-
ISTICS OF FM SIGNALS.
3-19. The transfer oscillator can be used in conjunction with other equipment for accurate measurement
of the detailed characteristics of frequency-modulated
rf carriers. The function of the transfer oscillator in
this system is to reduce the frequency of the carrier
to an intermediate frequency below 100 kilocycles
which retains the essential modulation characteristics.
These characteristics are detected by the 500B fol -
lowed by a low-pass filter, and measured by various
test instruments - voltmeter, oscilloscope, distortion meter, wave analyzer.
3-20. The Hewlett -Packard 500B Frequency Meter
serves as a linear discriminator and converts the
intermediate frequency carrier into a train of constant
amplitude, constant-width output pulses -- one pulse
for each rf input cycle (see figure 3-15). The average
current of these pulses is directly proportional to the
intermediate frequency and is used to operate the
Model 500B’s internal milliammeter, which is cali brated in kc. These pulses are supplied at the 500B’s
PULSE OUTPUT connector and are fed to the low-pass
filter.
3-21. The low-pass filter blocks the 500B’s output
pulse train and passes the average voltage of the
pulses.
The voltage at the filter output varies at the
rate of the original modulating frequency and its a-c
amplitude is directly proportional to the degree of frequency deviation. This voltage is then connected to
additional test instruments (as shown in figure 3-15)
to indicate frequency deviation, carrier drift, wave-
shape harmonic content and distortion.
3-22. To measure frequency deviation using an ac
vacuum tube voltmeter, adjust the dc voltage from the
filter to be 1.414 volts when a 100-kc unmodulated
signal is applied to the 500B. This system is calibrated by loading the output of the low-pass filter with
a 20,000 ohm potentiometer (equal to the 500B’s
PULSE OUTPUT jack characteristic impedance) and
adjusting the dc output of the filter to a predetermined
level for a known unmodulated input frequency.
3-12
00161-1
Page 43

Model 540B
Section III
Figure 3-15
Figure 3-15. System to Measure Frequency Modulation Characteristic
3-13
Page 44

Section III
Paragraphs 3-23 to 3-29
3-23. Abroad indication of carrier drift over nominal
periods of time isobtained by observing the range of
variation of the Model 500B’s meter readings. Drift
measurements may be recorded by plugginga l-ma
recorder into the Model 500B’s RECORDER jack. A
low -pass filter is not required for this application.
because of the filtering already present at the jack.
3-24. Modulation frequencies and waveforms are ob-
served on an oscilloscope connected to the output of
the low-pass filter.
Total distortion and harmonic
content can be measured directly on the Model 330B
Distortion Analyzer and the Model 302A Harmonic
Wave Analyzer. Theee measurements are relative
and hence special calibrating procedures are not
required.
3-25. The cutoff frequency and the sharpness of the
filter depend upon the degree of peak-to-peak carrier
deviation and the highest modulating frequency since
the sum of these two frequencies and the guard band
between them (required by the finite alope of the cut-
off characteristic) must not exceed the 100 -kc pass
band of the Model 500B. The three-section low-pass
filter shown in figure 3-16 is sufficiently sharp to enable its use in a wide variety of applications. The
guard band of this filter is equal to twice the maxi-
mum modulating frequency. Thus the basic fm meas uring system equipped with this filter can handle
modulating frequencies up to 33 kc at very low deviations up to 50 kc at very low modulating frequencies.
If greater peak deviation muet be measured, a filter
can be used or a system of frequency division employed.
The maximum peak deviation this three-section filter
will handle is given by the relationship:
where D
is the maximum peak deviation and F
p
mod
the maximum modulating frequency. For example,
the maximum peak deviation the basic system can
handle with a maximum modulating frequency of 15 kc
is 27.5 kc:
3-26. GENERATING HARMONICS FOR
OTHER USES.
3-27. The oscillator and harmonic generator sections
of the transfer oscillator maybe ueed to produce very
accurate harmonics for calibration and other uses. To
provide these harmonics, connect the OSCILLATOR
Model 540B
Figure 3-16. Design Information for a Simple
Three-Section Low-Pass Filter
OUTPUT connector to the HARMONIC GENERATOR
OSCILLATOR INPUT connector, Harmonics with the
same accuracy as the fundamental frequency (which
3-28. MEASURING FREQUENCIES ABOVE
18 GC.
3-29. Figure 3-17 shows an arrangement for measuring frequencies above 18 gc. Harmonics in the 2-4
gc region are generated in the internal harmonic generator, amplified in the microwave amplifier, and
applied to a tunable waveguide crystal mount which
generates harmonics in the 18-40 gc region. The
cliff erence frequency between one of these harmonics
and the frequency being measured is detected in the
Model 422 crystal detector and applied to the video
amplifier of the 540B for presentation on the internal
oscilloscope.
As the waveguide harmonic generator
and the microwave amplifier both must be tuned, obtaining beat frequency indications is complicated but
practical when the frequency of the unknown is known
approximately.
.
3-14
00161-1
Page 45

SECTION IV
THEORY OF OPERATION
Paragraphs 4-1 to 4-3
Section IV
4-1. CIRCUIT DESCRIPTION.
How the Transfer Oscillator measures fre-
4-2.
quency is best described by reference to the block
diagram in figure 4-1. The 540B oscillator generatee
a very stable fundamental frequency that is adjustable
from 100 to 220 megacycles per second. Thts frequency is monitored by an electronic counter, and aleo
supplied to either one of two crystal-diode mixers, or
to a separate harmonic generator, depending upon the
input frequency to be measured. The crystal mixers
serve both as mixers and harmonic generators. When
an input signal is also applied to the same mixer, mixing action occurs with all harmonice generated from
the oscillator signal. If the difference between the in-
put signal frequency and some harmonic frequency is
less than the bandwidth of the following amplifier, a
response will be seen on the oscilloscope. The fundamental frequency is then adjusted so that the harmonic frequency is exactly the same as the input
frequency and the zero-beat is easily read on the os-
cilloscope display. The oscilloscope sweep is provided
by a sine wave of the power line frequency obtained
from the power transformer. As this sweep allows
synchronizing the display only when the frequency
modulation of the input signal is also at the power line
frequency, provision is made to sweep the oscillo-
scope from an external signal introduced through a
connector on the rear panel, or by use of an external
oscilloscope having a triggered sweep. A second amplifier supplies the same difference frequency to an
output connector for display on the external oscillo-
scope. This output is used for obtaining large syn-
chronized displays of rf pulses.
4-3.
VARIABLE -FREQUENCY OSCILLATOR (100-
220 MC). The fundamental frequency of the transfer
oscillator is generated by an extremely stable, pushpull Hartley oscillator and is brought out to the front
panel at the OSCILLATOR OUTPUT connector. The
signal is then normally coupled through a coaxial
jumper to the OSCILLATOR INPUT connector of one
of the mixers.
The housing for the oscillator, the
tuned circuit components and their mountings have all
Figure 4-1. Transfer Oscillator Block Diagram
00161-3 4-1
Page 46

Section IV
Paragraphs 4-4 to 4-13
been made very rigid and the operating voltages applied to the circuit are well regulated. Although long-
term stability of this oscillator is not an important
factor, it is sufficient to afford 1/2% or better accu-
racy of the main tuning dial calibration.
4-4. Power is extracted from the oscillator by a fixed
probe with its tip magnetically coupled to the oscillator
plate fnductor. The probe provides a 50-ohm impedance
at the front panel OSCILLATOR OUTPUT connector
(J7). Pickup for the signal obtained at the FREQUENCY
METER connector for monitoring purposes is not me-
chanically associated with the oscillator plate circuit
although it is shown to be so on the schematic diagram.
It is simply a resistor loop within the oscillator box.
Coupling is adjusted so there is sufficient signal for
operating the Model 524 Frequency Counter with Model
525B Plug-In Converter.
The oscillator circuit is tuned by a split-stator
4-5.
capacitor (C27) and. a two-turn, center-tapped invar
ribbon inductor (Ll). Trimmer capacitors C3 and C28
at each plate serve primarily to balance plate-toground capacity at the two sides of the plate tank to
obtain maximum output power, and are also used to
shift the calibration at the high-frequency end of the
frequency dial by small amounts. Bias for both oscillator tubes, V1 and V2, is developed across the
common cathode resistor.
metrical, from each plate to the opposite grid. Heater
and plate power are brought in through three separate
rf filter circuits to prevent objectional conducted leakage of rf energy from the oscillator housing.
Signal feedback is sym-
Model 540B
and the video output jack on the rear of the housing.
The 1N416B ie a harmonic generator which supplies
strong SHF harmonics from the oscillator output,
which mix with the incoming signal in the 1N21B.
4-9.
VIDEO AMPLIFIER The video amplifier consists of the five resistance-coupled tube stages, V3,
V4A and B, and V5A and B, two of which are cathode
followers.
imately 2 megacycles with the VIDEO RESPONSE controls set to maximum, and a gain of approximately
40 db is provided with the VIDEO GAIN control set to
maximum.
vide most of the amplification for both the VIDEO
OUTPUT connector and the oscilloscope Vertical Amplifier. Tube V4B with its split load serves two pur-
poses: a cathode follower to drive the low-impedance,
low-frequency cutoff network at the input to video output tube V5, and a plate-loaded amplifier to feed the
vertical oscilloscope amplifier, V6.
4-10. The high-frequency cutoff of the video amplifier
is continuously adjustable by R4 in the grid circuit of
V3 from a maximum of 2 megacycles to a minimum of
1 kilocycle. The low-frequency cutoff point may be
switched from 100 cps to 10 kc by S1 attached to R18.
It is then continuously adjustable from 10 kilocycles
to 400 kc by R18 (located in the grid circuit of V5A).
Tube V5A makes up for the loss of gain in the low-
frequency response network while V5B provides a low
impedance termination at the VIDEO OUTPUT connector on the front panel.
The bandwidth of the amplifier is approx-
The first two stages, V3 and V4A, pro-
4-6. The FINE FREQUENCY VERNIER control is a
mechanical device which rotates a tilted aluminum disk
close to the plate tank inductor thereby affecting the
plate circuit inductance very slightly. A second provision is made for very fine adjustment of the oscillator frequency by C46 and CR2 connected to the FREQUENCY CONTROL connector on the rear chassis.
Fine frequency adjustments can be made by either introducing a small, variable dc voltage or by varying
the dc resistance betweenthis jack and ground, thereby changing the effective plate-to-ground capacity of
the oscillator circuit.
The low frequency mixer assembly consists of
4-7.
a transmission-line coupling between the OSCILLATOR
INPUT and SIGNAL INPUT connectors. The trans-
mission line is inside a housing which holds the mixer
crystal and the difference-frequency output jack on the
rear of the housing. The crystal mounting is a phenolic
sleeve that receives the crystal, pin-end first. The
crystal (a type 1N21B) is pressed into the housing to
contact the junction bar which joins the OSCILLATOR
INPUT and SIGNAL INPUT connectors. The output
connector when threaded onto the housing provides a
slight pressure against the crystal to maintain a good
contact with the junction bar.
4-8.
The high frequency mixer operates over the
range of 1 to 12.4 gc. This mixer assembly consists
of a transmission-line coupling between its corres-
ponding OSCILLATOR INPUT and SIGNAL INPUT con-
nectors.
which holds two crystals (one 1N21B and one 1N416B)
4-2
The transmission line is inside a housing
4-11. OSCILLOSCOPE VERTICAL AMPLIFIER. The
vertical amplifier consists of a single, resistance-
coupled pentode, V6, driving the upper vertical plate
in the cathode-ray tube. This tube provides approximately 100 volts peak-to-peak and 40 decibels of gain
over approximately a 200-kilocycle bandwidth without
compensation.
4-12. OSCILLOSCOPE HORIZONTAL AMPLIFIER
AND SWEEP CIRCUITS. The oscilloscope sweep circuit consists of a 6.3-volt line frequency voltage
source, an adjustable phase-shifing network, R43 and
C 24, and a push-pull amplifier-phase inverter, V8.
Resistance-coupled amplifiers V8A and V8B are cathode coupled in cascade to act both ss a phase-inverter
and push-pull amplifier.
both halves of V8 the plate load resistor for the B sec-
tion is made larger to compensate for the greater
degeneration in this stage.
4-13. POWER SUPPLY, A schematic diagram of the
power supply is shown in figure 5- . The power supply
consists of an electronically regulated + 240 volt supply
for operation of a majority of the circuits, an unregulated + 330 volt supply for amplifiers V6 and V8, an
unregulated -740 volt supply for the cathode-ray tube
V7, and a special, regulated, multivibrator-driven
heater supply for the oscillator tube filaments. The
multivibrator supplies an oscillator filament voltage
independent of line voltage variation. In newer models
a slide switch on the rear panel selects the 1-mc voltage to be used. Power Transformer T1 can be wired
for operation on either 115 of 230 volts.
To obtain equal gain from
00161-3
Page 47

Section III
Figure 3-17
Figure 3-17. Frequency Measurement above 18 gc with the 540B Oscillator
3-15/3-16
Page 48

Page 49

Model 540B Section V
SECTION V
MAINTENANCE
Paragraphs 5-1 to 5-16
5-1. INTRODUCTION.
5-2. The following paragraphs contain instructions
for maintenance of the transfer oscillator. The components of this instrument are conservatively operated
to provide maximum reliability with a minimum of repair. When trouble occurs, a systematic approach in
localizing the trouble to one section of the instrument
will save maintenance time. In most cases, the trouble
will be caused by a defective electron tube, and tube
replacement will then restore operation. A list of the
test equipment required for maintenance is given in
table 5-1.
5-3. CABINET REMOVAL.
5-4.
To remove the transfer oscillator chassis from
the cabinet, rest the instrument on a pad on its back
to gain access to the bottom. Loosen the two large
slotted setscrews in the bottomed e of the panel bezel.
Withdraw these screws about 1/4 inch. The cabinet
is now free and can be lifted off the front panel and
chassis. The rear cover may have to be removed to
gain access to some of the parta on the rear chassis.
WARNING
Be careful when making voltage measurements. Voltages as high as -740 volts dc are
present in the chassis when power is applied.
5-5. PERIODIC CLEANING AND LUBRICATION.
5-6. No Lubrication is required. Once a year, remove the cabinet and carefully biow out accumulated
duet with a low-pressure air stream. Clean the in-
strument with a soft cloth.
5-7. TUBE REPLACEMENT.
5-8. In many cases, instrument malfunction can be
corrected by replacing a defective tube. Before chang-
ing the setting of any internal adjustment, check the
tubes. Adjustments made in an attempt to restore
operation when the cause is a defective tube will often
complicate the repair problem. Check tubes by sub-
stitution rather than by using a tube tester, because
the results obtained with the tube tester may some-
times be misleading. Before removing a tubs, mark
it so that if the substitute tube does not improve op-
eration, the original tubs can be returned to the same
socket. Replace only those tubes proved to be weak
or defective. A circuit adjustment is provided for
those tube positions where variation in tubs character-
istics of the replacement tube may affect circuit per-
formance. Table 5-2 lists the tubes and test or ad-
justments which must be performed after replacement
of each particular tube.
5-9. TROUBLESHOOTING.
5-10. Before troubleshooting the transfer oscillator,
make sure that a trouble is not caused by poor external
connections, line power failure, or malfunctioning of
the other equipment used with the transfer oscillator
or the source of the signal under test.
troubleshooting by localizing the trouble to one of the
main sections of the instrument as directed in table
5-3. When the trouble hae been localized to a par-
ticular section, check the tubes in that section before
taking any other corrective action. If tube replace-
ment doee not eliminate the trouble, make sure that
proper power is being provided by checking all power
supply outputs as directed in paragraph 5-13. Then
carry out detailed checks of the circuit components
other than tubes in the defective section, and continue
to other sections if necessary.
5-11. CALIBRATION.
5-12. PRELIMINARY INSTRUCTIONS. Use the pro-
cedure given in paragraphs 5-13 through 5-3 to test
and adjust each section of the transfer oscillator. Use
the entire procedure in the order given to carry out
a complete calibration check annually. Always check
the power supply section before testing or adjusting
and other section. The test equipment required for
calibration is listed in table 5-1. Equivalent instru-
ments may be substituted for those listed.
5-13. POWER SUPPLY TEST AND ADJUSTMENT.
5-14. Make voltage adjustments
+240 volt or Oscillator Filament Supply voltage is out-
side the limits given. Do not refine either setting if
the voltage is within limits. Always check the oscil-
lator filament supply after resetting the + 240 volt dc
supply.
5-15. TESTING THE +330 VOLT DC SUPPLY.
a. Connect the ground lead of the dc voltmeter to
ground. With the dc probe, measure the + 330 volt dc
supply at the point shown in figure 5-1.
b. Thie supply is unregulated and hae a nominal
voltage of+ 330 volts dc when the line input voltage is
115 volts ac. If the voltage is low, check V10, C43A,
and C43B, or the current being drawn from the supply.
c. Check the total load current at the output from
C43B, using the dc clip-on milliammeter. This total
load current must be less than 100 ma.
5-16. TESTING THE + 240 VOLT DC SUPPLY. (See
paragraph 1-11(4) for earlier model transfer oscillators using +225 volt dc supply. )
a. Connect the transfer oscillator to the Variac and
set the Variac to supply 115 volts ac. Turn on and
allow three-minute warmup.
b. Connect the ground lead of the dc voltmeter to
ground.
Carry out
00161-3
5-1
Page 50

Section V
Paragraph 5-17
Model 540B
Table 5-1. Test Equipment
Nomenclature
AC Vacuum Tube
Voltmeter ME-30
Vacuum Tube
Voltmeter
Model
Model 400D Measure low-frequency or
Model 410B Measure dc voltage and
ME -26
Application
low-level ac voltage
high-frequency ac
voltage
Variable Auto- General Radio
Transformer Variac Model
Supply variable power
line voltage
W2, W5, or V-10 1 volt
Probe “T”
Connector
Model 455A
In-line coaxial connection
with 410B voltmeter
probe
50-ohm Coaxial Model AC-67A Matched termination for
Load
Model 455A
Electronic Model 524B/C/D Precise frequency
Counter
with Model 525B
measurement
Plug-In Converter
AN/USM-26
Square-Wave Model 211A Signal generator for am-
Generator
Oscilloscope Model 160B
plifier response test 0.5 volt, 0.02
Observe test waveforms
AN/USM-105A
Range
0. 1 mv to
Accuracy
± 2%
300 volts
1 to 1000 ydc
100 to 130 volts Voltmeter accu-
ac, 1.25 amp
rate within
100 to 200 mc
100 to 220 mc
1/10
6
or better
Approx 2 kc,
rise time
10 mc, trig-
gered sweep
Clip-On DC
Model 428A
Measure dc current
Milliammeter
SHF Signal
Models 614A,
Measure mixer sensitivity
Generator 618B, and 620A
c. With the dc probe, measure the + 240 volt dc supply at the point shown in figure 5-1. This voltage must
read + 240 ± 9 volts dc.
-
d. If the voltage is not + 240 ± 9 volts tic, adjust R73
in figure 5-1 to bring the voltage within these limits.
e. If the voltage cannot be adjusted and is too low,
check V10 and Vll, and check the load current from
pins 3 and 6 of Vll with the clip-on dc milliammeter.
This current must be less than 90 ma.
f. If the voltage is too high, check V12. If voltage
fluctuates, check V13.
g. Check voltage regulation by adjusting the Variac
to vary the line voltage from 103 to 127 volts ac while
measuring the + 240 volt dc supply. The voltage must
not vary more than ± 1 volt dc.
h. Measure the ac level across the +240 volt supply (at the same points to which the dc vtvm is connected) as the line voltage is varied from 102 to 127
volts ac rms with the Variac. The ac level must not
3 ma to 1 amp
± 3%
± 0.1 ma
0. 8 to 11 gc
exceed 5 millivolts. If ripple exceeds this level, test
Vll, V12, C43, and C41.
5-17. TESTING OSCILLATOR FILAMENT SUPPLY.
The filaments of the tubes in the oscillator circuit are
supplied by a multivibrator circuit which is operated
from the regulated + 240 volts, thereby making the oscillator filament voltage independent of line voltage
variations. However, the multivibrator eutput voltage
is proportional to the value of the + 240 volts and must
be checked if the setting of the +240 volts dc supply is
changed. Since the multivibrator output voltage has a
square waveform, care must be taken in the choice
of a meter used to measure this voltage.
An rmscalibrated meter should be used for this measurement.
A peak-responding meter cannot be used for this measurement. Meters which respond to the average but are
calibrated for rms, such as the Model 400D/H/L recommended in table 5-1, are suitable when used with
the appropriate correction factor. The correction factor is necessary because this type of meter reads 1.11
times the true rms value of a square wave. Hence, if
the actual square wave output voltage is 5.2 volts, this
5-2
00161-3
Page 51

Model 540B
Paragraphs 5-18 to 5-20
Section V
type of average - responding rms - calibrated meter
would read 5.2 x 1.11 = 5.8 volts. Make the test as
follows:
a. Connect a suitable ac vacuum tube voltmeter, as
discussed above, between the lead at the top of the oscillator housing (shown in figure 5-1) and ground.
b. The true voltage at this point must be between
5.0 and 5.4 volts ac rms (5.6-6.0 as read ona Model
400D/H/L. If the voltage is within these limits do not
change the setting. If this voltage is not within these
limits, adjust R55 (figure 5-1) to obtain a true reading
of 5.2 .(5. 8 as read on a Model 400D).
c. If the voltage cannot be adjusted and is too low,
check V9. Also check the load current drawn from
the secondary winding.
d. If step c does not correct the trouble, measure
the load current drawn from the secondary winding by
temporarily connecting a 0.1-ohm resistor in the cir-
cuit between terminal 4 of T2 and ground, and reading
the voltage drop across it. Load current must not ex-
ceed 0.6 ampere (which would correspond to a drop of
60 millivolts across a 0.1-ohm resistor or a voltage
reading of 66.6 millivolts on the Model 400D/H/L).
Remove this resistor when measurement is completed.
5-18. TESTING THE -740 VOLT DC SUPPLY. TMe
supply furnishes unregulated high voltage for the builtin oscilloscope, and should be checked if trace intensity becomes faint.
a. Connect the ground lead of the dc vtvm to ground.
With the dc. probe, measure the -740 volt dc supply at
the point shown in figure 5-1 (the non-grounded terminal of C40).
b. This supply has a nominal voltage of -740 volts
dc when the line voltage is 115 volts ac. If the voltage
is less than 690 volts, check the two semiconductor
rectifiers (CR6 and CR7) located on the bottom of the
left-hand resistor board as viewed from the back of
the instrument.
5-19. TESTING OSCILLATOR OUTPUT AND
DIAL CALIBRATION.
5-20. Following the replacement of tubes V1 or V2 in
the oscillator circuit, the nigh frequency end of the
main tuning dial may be slightly out of calibration and
the output voltage may be too low. Proceed as follows:
a. Turn on tbe transfer oscillator power and allow
20 minutes warmup time.
b. Using& coaxial “T” connector with a type N-to-
BNC adapter on each end, such as the
00161-3
Figure 5-1. Location of Measurement and Adjustment Points
5-3
Page 52

Section V
Paragraphs 5-21 to 5-22
Model 540B
Table 5-2. Adjustments Required when Tubes are Replaced
Circuit
Reference Tube Type
—
V1
V2
V3
V4
V5
V6 6CB6
V7
V8 12AX7 Horizontal Amplifier Check horizontal trace centering, para 5-23
V9
Vl0
Vll
V12 6CB6
6C4/6135 1/2 RF Oscillator
6C4/6135 1/2 RF Oscillator
6C4/6135 lst Video Amplifier
6U8
12AT7
2BP1 Cathode -Ray Tube
6350
5U4
6AS7
Function after Replacement of Tube
Adjust FREQUENCY dial calibration para 5-19
Adjust FREQUENCY dial calibration para 5-19
2nd & 3rd Video Amplifier
and Cathode Follower
4th Video Amplifier and
Cathode Follower
Oscilloscope Vertical
Amplifier
Heater Supply Adjust oscillator filament voltage, para 5-17
Multivibrator
High Voltage Rectifier
Series Voltage Adjust + 240 volt dc supply, paras 5-16, 5-17
Regulator
Voltage Control Adjust + 240 volt dc supply, paras 5-16, 5-17
Check video response, para 5-21
Check vertical trace centering, para 5-23
Adjust horizontal and vertical position of
pattern, para 5-23
none
Test and/or Adjustment Required
para 5-21
para 5-21
V13
plug one of the top ends of the “T” into the OSCILLATOR OUTPUT connector. Terminate the other end of
the top of the “T” with a proper 50-ohm termination,
such as the
c. Unscrew the cap on the end of the ac probe of a
the leg of the “T” connector. Measure the output volt-
age while turning the FREQUENCY dial through its full
frequency range. The voltage must remain between
1.75 and 2.2 volts. If the voltage is below 2.0 volts
at its highest point, replace V1 and/or V2.
d. Connect the front panel FREQUENCY METER
connector to an electronic counter to measure the oscilloscope output frequency.
e. Set the FINE VERNIER dial to the mid-position
of its travel so that its white dot is up.
f. Compare the FREQUENCY dial indication to the
counter reading at each major dial calibration.
g. If the FREQUENCY dial reading is incorrect at
200 megacycles, readjust C3 and C28 (figure 5-1) to
bring the frequency to 200 megacycles. Divide this
adjustment equally between C3 and C28 to prevent dial
error at low frequencies.
5651
Reference Tube Adjust + 240 volt dc supply, paras 5-16, 5-17
h. The oscillator output signal available at the FREQUENCY METER comector must have an amplitude of
at least 0.2 volts when connected to a 50-ohm resistive
termination through 50-ohm coaxial line. Use an os-
cilloscope or the Model 410B Vacuum Tube Voltmeter
for this measurement. If insufficient output is present,
check R51.
5-21. MEASURING VIDEO AM AMPLIFIER GAIN
AND RESPONSE.
5-22. To measure video amplifier response feed a
fast pulse into the transfer oscillator and view the degradation of the waveshape on the oscilloscope. Pro-
ceed as follows:
a. Turn on the transfer oscillator and allow 5 min-
utes warmup; set VIDEO RESPONSE controls fully
clockwise.
b. Connect a square-wave generator to a teat oscil-
loscope and adjust the square-wave generator to provide 0,5 volts (peak) output at 2 kc as measured on the
test oscilloscope.
c. Connect the test oscilloscope to the transfer os-
cillator VIDEO OUTPUT connector.
5-4
00161-3
Page 53

Model 540B
Paragraphs 5-23 to 5-26
Section V
d. Reduce the equare-wave generator output 40 db,
and connect it to the MIXER OUTPUT connector of the
transfer oscillator.
e. The pattern viewed on the test oscilloscope
should have an equal or greater amplitude compared
with step b, indicating that the transfer oscillator provides at least 40 db gain. If the amplifier does not
provide efficient gain check V3, V4, V5, and V6.
Figure 5-2. Waveform Definitions
f. The overshoot on the waveform displayed on the
test oscilloscope must be less than 25% (see figure
5-2). If greater overshoot is present, bend the leads
of capacitor C9 (between tube pins 1 and 2 of V4)
slightly to change that capacitor’s position until the
overshoot has been reduced to less than 25%.
g. The droop of the waveform top displayed on the
test oscilloscope must be less than 10% (see figure
5-2). If it is not, check V3, V4, and C6 and adjust
the value of C6 by padding if necessary.
5-23. CENTERING OSCILLOSCOPE TRACE.
5-24. To center the transfer oscillator oscilloscope
trace, proceed as follows:
a. Turn on the transfer oscillator and allow 5 min-
ute warmup.
b. Adjust oscilloscope controls to obtain a full-width
line on the screen.
c. Adust R32 (see figure 5-1) to center the hori-
zontal position of the line.
d. Adjust R34 (see figure 5-1) to center the ver-
tical position of the line.
5-25. MEASURING MIXER SENSITIVITY AND
FREQUENCY RESPONSE.
5-26. Mixer sensitivity is defined as the minimum
input signal power which will give an output amplitude from the mixer 6 db above the noise level. To
measure sensitivity and frequency response, proceed
as follows:
a. Turn all VIDEO RESPONSE controls fully clock-
wise.
b. Connect the jumper cable between the OSCILLATOR OUTPUT connector and the OSCILLATOR INPUT connector of the mixer to be checked.
c. Connect the ac vtvm to the VIDEO OUTPUT connector, This measurement reads noise.
d. Connect a signal generator of the appropriate
frequency to the SIGNAL INPUT connector of the mixer
being checked. Check the Low Frequency Mixer at
1 and 4 gc, the High Frequency Mixer at 4, 8, and
11 gc.
h. The rise time (10%-90%) of the pattern displayed
on the test oscilloscope must be 0.22
not, check V3 and V4.
e. Adjust the signal generator output until the voltage reading on the ac vtvm is exactly twice the value
noted in step c. The input power being supplied by
Table 5-3. Trouble Localization
Indication of Trouble
Items to Check
Instrument inoperative; POWER light does not glow Check power connections and fuse F1
Check continuity of T1 primary windings
Instrument inoperative; POWER light glows
No horizontal trace appears on oscilloscope
Check power supply output voltages and VI
Check that HORIZ SWEEP INPUT switch is
in INT position
Check V8
Horizontal line appears on oscilloscope but no
Check tubes V3, V4, and V6
vertical trace
Cannot obtain beat frequency
Check oscillator output
Check mixer by using other mixer or
replacing crystal
00161-3
5-5
Page 54

Section V
Paragraphs 5-27 to 5-31
the signal generator at this point is the sensitivity of
the mixer at that frequency.
f. To measure the frequency response of a mixer,
measure sensitivity while adjusting the input signal
frequency to cover the entire range of the mixer.
Typical sensitivity of the mixers is shown in figure
3-2. The sensitivity of individual mixers may vary
at certain frequencies; variations up to ± 10 db are
acceptable.
Mixers with poorer response than this
may be replaced. However, the crystals furnished
with the instrument have been selected for best overall
performance (an absence of points of poor response
throughout the band). If a crystal is replaced to se-
cure higher gain at a particular frequency, keep the
original crystal for general use.
5-27. REPLACING PARTS IN THE LOW
FREQUENCY MIXER.
5-28. REPLACING THE 1N21B CRYSTAL. The low
frequency mixer contains one 1N21B crystal diode
which has been selected to give most uniform har-
monic generation and frequency mixing, and freedom
from dead spots, from 200 mc to 4 gc. The crystal
is easily changed as follows (see figure 5-3):
a. Unscrew the cylindrical portion of the mixer
from the rectangular body to gain access to the crystal.
b. Pull the crystal from the body.
c. Insert replacement crystal 2N21B into the body.
d. Replace the cylindrical cover.
5-29. A replacement crystal may not give exactly the
same sensitivity or noise level. If, after the crystal
is replaced, the noise level is too high or the sensi-
tivity is too low, try another replacement crystal. In
Model 540B
a given crystal sensitivity will vary with the input frequencies; in addition, the sensitivity curve of one crystal will differ from that of another. The selection of a
crystal can thus be for best overall sensitivity across
the full frequency band or for maximum sensitivity in
a chosen narrow band of frequencies. In the latter
case, there may be frequencies outside the chosen
bands where sensitivity drops below normal which are
considered unimportant. Once this crystal is replaced,
the original specified sensitivity across the frequency
band can no longer be guaranteed unless the transfer
oscillator is returned to the factory for recalibration.
5-30. REPLACING PARTS IN THE HIGH
FREQUENCY MIXER.
5-31. REPLACING THE 1N21B CRYSTAL. The high
frequency mixer contains two crystal diodes, one
1N21B and one 1N416B. The two diodes have different
effects on operation and only the 1N21B is field replaceable.
The description of performance given for
the 1N21B in the low-frequency mixer applies also to
the 1N21B in the high - frequency mixer.
Once the
crystal is replaced, the original specified sensitivity
across the frequency band can no longer be guaranteed
unless the transfer oscillator is returned to the factory
for recalibration.
To replace the 1N21B crystal in
the high-frequency mixer, proceed as follows:
a. Refer to figure 5-4; remove the connector cap
from tine filter assembly to gain access to crystal.
b. Being careful to prevent discharge of static electricity through the crystal diode, remove the crystal
from the filter assembly. Such a discharge is only remotely possible and is easily prevented by having one’s
body grounded at the moment the crystal is touched.
c. Insert replacement crystal 1N21B into the filter
assembly and install connector cap on filter assembly.
Figure 5-3. LOW Frequency Harmonic Mixer
5-6
Figure 5-4. High Frequency Harmonic Mixer
00161-3
Page 55

Model 540B
Paragraphs 5-34 to 5-36
Section V
5-32. REPLACING THE lN416B CRYSTAL. The
1N416B crystal may be replaced in the field for emergency operation, but in most
a fine adjustment in penetratio
bly to regain original sensitivity across the full frequency band.
differs from the effect of the 1N21B in that it has
greater effect upon the overall sensitivity and on noise
level, and there is less effect upon sensitivity over
narrow frequency bands (holes).
1N416B crystal, proceed as follows:
a. Refer to figure 5-4; remove the filter assembly
(with connector cap remaining installed) from the
mixer body to gain access to the crystal.
b. Being careful to prevent discharge of static electricity through the crystal diode, remove the crystal
from the mixer body by a straight pull with a longnose pliers. Such static discharge is only remotely
possible and is easily prevented by having one’s body
grounded at the moment the crystal is touched.
c. A replacement 1N416B crystal has a cap on one
end of its body. Remove this cap, noting the capped
end.
d. With a pair of long-nosed pliers, insert replace-
ment crystal into the mixer body, capped end last.
e. Install filter assembly on mixer body.
5-33. REPLACING THE FILTER ASSEMBLY. The
filter assembly on the high-frequency mixer can be
replaced as a unit without need for subsequent adjustment. Do not attempt to repair any internal part of
the filter assembly. The filter assembly contains an
inductor which consists of a short piece of 0.001 inch
diameter copper wire. To check for continuity, use
a 20,000-ohm/volt multimeter on a high range. Excessive current will quickly burn out this wire. To
replace the filter assembly, proceed as follows:
The effect of replacing the 1N416B
the probe assem-
To replace the
a. Loosen both the knurled nuts that secure the
probe assembly to the front panel. Remove outer nut.
b. Remove both BNC cables from rear of mixer
assembly.
c. Remove mounting screws that secure assembly
to the front panel, and remove assembly from transfer
oscillator.
d. Loosen the two #8 allen setscrews on the collar
and remove the probe assembly from the mixer body,
unscrewing inner knurled nut to allow probe assembly
to be removed through panel hole.
e. Install the replacement probe assembly with
care. Do not force it down into the mixer body. After
the probe has touched bottom, lift is slightly less than
1/128 inch (approximately .005 inch), and tighten the
allen setscrews on the collar.
f. Thread inner knurled nut well down on probe assembly so it will not strike panel when being installed
in transfer oscillator.
5-35. HARMONIC GENERATOR ASSEMBLY.
5-36. The 1N21B crystal diode used in the harmonic
generator is selected at the factory to give good har-
monic generation above 1 gc from a 200-mc fundamental. The crystal can be replaced in the field; proceed as follows:
a. Refer to figure 5-5; remove generator body from
the connector.
b. Remove crystal 1N21B from the connector.
c. Insert replacement crystal 2/21B into the
connector.
a. Refer to figure 5-4; remove the connector cap
from the filter assembly.
b. Remove the crystal from the filter assembly.
c. Remove the filter assembly from the mixer body.
d. Install the replacement filter assembly on the
mixer body.
e. Install the crystal in the filter assembly.
f. Install the connector cap on the filter assembly
and connect cable.
5-34, REPLACING AND ADJUSTING THE PROBE
ASSEMBLY. The probe assembly may be replaced in
the field for emergency operation, but requires fine
adjustment of the probe penetration to regain original
sensitivity across the full frequency band. Do not at-
tempt to replace any of the internal parts of the probe
assembly. To replace the probe assembly, proceed
as follows:
00161-3
d. Restore generator body to connector.
Figure 5-5. Harmonic Generator
5-7
Page 56

Section V
Figure 5-6
Model 540B
5-8
Figure 5-6. Oscillator Assembly
00161-3
Page 57

Model 540B
Section V
Figure 5-7
00161-3
Figure 5-7. Chassis Board, Parts Location
5-9
Page 58

Section V
Figure 5-8
Model 540B
5-10
Figure 5-8. Resistor Board, Parts Location
00161-3
Page 59

Model 540B
Section V
Figure 5-9
00161-3
Figure 5-9. Voltage and Resistance Diagram
5-11
Page 60

Section V
Figure 5-10
Model 540B
5-12
Figure 5-10. Power Supply
00161-1
Page 61

Figure 5-11. OscilIator Schematic
(Located in back of Manual)
5-13/5-14
Page 62

Page 63

SECTION V.1
PREVENTIVE MAINTENANCE INSTRUCTIONS
5.1-1. SCOPE OF MAINTENANCE
The maintenance duties assigned to the operator and organizational
repairman of the equipment are listed below together with a reference to the
paragraphs covering the specific maintenance functions.
Daily preventive maintenance checks and services (para 5.1-4).
a.
Weekly preventive maintenance checks and services (para 5.1-5).
b.
Monthly preventive maintenance checks and services (para 5.1-6).
c.
d.
Quarterly preventive maintenance checks and services (para 5.1-7).
e.
Cleaning (para 5.1-8).
f.
Touchup painting (para 5.1-9).
5.1-2.
PREVENTIVE MAINTENANCE
Preventive maintenance is the systematic care, servicing, and inspection
of equipment to prevent the occurrence of trouble, to reduce downtime, and
to assure that the equipment is severiceable.
a. Systematic Care. The procedures given in paragraphs 5.1-4 through
5.1-8 cover routine systematic care and cleaning essential to proper upkeep
and operation of the equipment.
b. Preventive Maintenance Checks and Services. The preventive maintenance
checks and services charts (para 5.1-4 through 5.1-7) outline functions to
be performed at specific intervals.
These checks and services are to
maintain Army electronic equipment in a combat-serviceable condition; that
is, in good general (physical) condition and in good operating condition.
To assist operators in maintaining combat serviceability, the charts indicate
what to check, how to check, and what the normal conditions are; the
References column lists the illustrations, paragraphs, or manuals that
contain detailed repair or replacement procedures.
If the defect cannot be
remedied by performing the corrective actions listed, higher echelon
maintenance or repair is required.
Records and reports of these checks and
services must be made in accordance with the requirements set forth in
TM 38-750.
5.1
PREVENTIVE MAINTENANCE CHECKS AND SERVICES PERIODS
Preventive maintenance checks and services of the equipment are
required daily, weekly, monthly, and quarterly.
5.1-1
Page 64

Page 65

Para 5.1-8.
5.1-3
Page 66

5.1-4
Para 5.1-9.
Page 67

5.1-5
Page 68

5.1-6
TM 38-750.
Page 69

5.1-8. CLEANING
Inspect the exterior of the equipment.
The exterior surfaces should be
clean, and free of dust, dirt, grease, and fungus.
a. Remove dust and loose dirt with a clean soft cloth.
Warning
Provide adequate ventilation.
: Cleaning compound is flammable and its fumes are toxic.
Do not use near a flame.
b. Remove grease, fungus, and ground-in dirt from the case; use a
cloth dampened (not wet) with Cleaning Compound (Federal stock No.
7930-395-9542).
c. Remove dust or dirt from plugs and jacks with a brush.
Caution:
Do not press on the face (glass) of the cathode ray tube when
cleaning; the cathode ray tube may be damaged.
d. Clean the front panel and control knobs; use a soft clean cloth. If
dirt is difficult to remove, dampen the cloth with water; use mild soap if
necessary.
5.1-9. TOUCHUP PAINTING INSTRUCTIONS.
Remove rust and corrosion from metal surfaces by lightly sanding them
with fine sandpaper. Brush two thin coats of paint on the bare metal to
protect it from further corrosion.
Refer to the applicable cleaning and
refinishing practices specified in TM 9-213.
5.1-7
Page 70

Page 71

Model 540B
TM 11-6625-493-15
CODE LIST OF MANUFACTURERS (Sheets 1 of 2)
i-1
Page 72

TM 11-6625-493-15
CODE LIST OF MANUFACTURERS (Sheet 2 of 2
Model 540B
i-2
Page 73

APPENDIX I
REFERENCES
TM 11-6625-493-15
DA Pam 310-4
SB 11-573
TB SIG 364
TM 9-213
TM 11-5134-15
TM 11-5527
TM 11-6625-274-12
TM 11-6625-316-12
TM 11-6625-320-12
TM 33-750
Index of Technical Manuals, Technical Bulletins, Supply Manuals (types
7, 8, and 9), Supply Bulletins, Lubrication Orders, and Modification
Orders.
Painting and Preservation Supplies Available for Field Use for Elec-
tronics Command Equipment.
Field Instructions for Painting and Preserving Electronics Command
Equipment.
Painting Instructions for Field Use.
Organizational, DS, GS and Depot Maintenance Manual: Signal Generators
SG-299/U, SG-299A/U, SG-299B/U, and SG-299C/U.
Multimeters TS-352 U, TS-352A/U, and TS-352B/U.
Operator’s and Organizational Maintenance Manual: Test Sets, Electron
Tube TV-7 U, TV-7A/U, TV-7B/U, and TV-7D/U
Operator and Organizational Maintenance Manual; Test Sets, Electron
Tube TV-2/U, TV-2A/U, TV-2B/U, and TV-2C/U.
Organizational Maintenance Manual: Voltmeter, Meter ME-30A/U and
Voltmeters, Electronic ME-30B/U, ME-30C/U, and ME-30E/U.
Army Equipment Record Procedures.
Page 74

Page 75

APPENDIX II
BASIC ISSUE ITEMS LIST
Section I. INTRODUCTION
TM 11-6625-493-15
1. General
This appendix lists items supplied for initial
operation and for running spares. The list
includes tools, parts, and material issued as
part of the major end item. The list includes
all items authorized for basic operator maintenance of the equipment. End items of equipment are issued on the basis of allowances
prescribed in equipment authorization tables
and other documents that are a basis for requisitioning.
2. Columns
Columns are as follows:
a. Federal Stock Number. This column lists
the 1l-digit Federal stock number.
b. Designation by Model. Not used.
c. Description. Nomenclature or the stand-
ard item name and brief identifying data for
each item are listed in this column. When
requisitioning, enter the nomenclature and description.
d. Unit of issue. The unit of issue is each
unless otherwise indicated and is the supply
term by which the individual item is counted
for procurement, storage, requisitioning, allow-
ances and issue purposes.
e. Expendability. Nonexpendable items are
indicated by NX. Expendable items are not
annotated.
f. Quantity Authorized. Under “Items Comprising an Operable Equipment,” the column
lists the quantity of items supplied for the
initial operation of the equipment. Under
“Running Spare Items” the quantities listed
are those issued initially with the equipment as
spare parts. The quantities are authorized to
be kept on hand by the operator for maintenance of the equipment.
g. Illustration. The “Item No.” column lists
the reference symbols used for identification of
the items in the illustration or text of the
manual.
i-5
Page 76

SECTION II.
i-6
Page 77

i-7
Page 78

Page 79

APPENDIX Ill
MAINTENANCE ALLOCATION
Section I. INTRODUCTION
TM 11-6625-493-15
1. General
a. This appendix assigns maintenance functions to be performed on components, assemblies, and subassemblies by the lowest appropriate maintenance category.
b. Columns in the maintenance allocation
chart are as follows:
(1) Part or component. This column
shows only the nomenclature or standard item name. Additional descriptive
data are included only where clarifi-
cation is necessary to identify the
component. Components, assemblies,
and subassemblies are listed in topdown order. That is, the assemblies
which are part of a component are
listed immediately below that component, and subassemblies which are
part of an assembly are listed immediately below that assembly. Each
generation breakdown (components,
assemblies,
listed in disassembly order or alphabetical order.
(2) Maintenance function. This column
indicates the various maintenance
functions allocated to the categories.
Service. To clean, to preserve, and
(a)
to replenish lubricants.
Adjust. To regulate periodically to
(b)
prevent malfunction.
Inspect. To verify serviceability
(c)
and detect incipient electrical or
mechanical failure by scrutiny.
Test. To verify serviceability and
(d)
to detect incipient electrical or me-
chanical failure by use of special
equipment such as gages, meters,
etc.
Replace. To substitute service-
(e)
able components, assemblies, or
or subassemblies) are
subassemblies, for unserviceable
components, assemblies, or subassemblies.
Repair.
(f)
serviceable condition through correction of a specific failure of unserviceable condition. This function
includes but is not limited to welding, grinding, riveting, straightening, and replacement of parts other
than the trial and error replacement
of running spare type items such as
fuses, lamps, or electron tubes.
Align. To adjust two or more com-
(g)
ponents of an electrical system so
that their functions are properly
synchronized.
(h)
Calibrate. To determine, check, or
rectify the graduation of an instrument, weapon, or weapons system,
or components of a weapons system.
(i)
Overhaul. To restore an item to
completely serviceable condition an
prescribed by serviceability standards. This is accomplished through
employment of the technique of
“Inspect and Repair Omy as Neces-
sary” (IROAN). Maximum utili-
zation
equipment is combined with minimum disassembly of the item during
the overhaul process.
(j) Rebuild. To restore an item to a
standard as near as possible to
original or new condition in appear-
ance, performance, and life expectancy. This is accomplished through
the maintenance technique of complete disassembly of the item, inspection of all parts or
repair or replacement
unserviceable elements
To restore an item to
of diagnostic
and test
components,
of worn or
using origi-
i-9
Page 80

TM 11-6625-493-15
nal manufacturing tolerances and/
or specifications and subsequent
reassembly of the item.
(3)
Operator, organizational, direct support, general support, and depot. The
symbol X indicates the categories re-
sponsible for performing that particu-
lar maintenance operation, but does
not necessarily indicate that repair
parts will be stocked at that level.
Categories higher than those marked
by X are authorized to perform the
indicated operation.
Tools required. This column indicates
(4)
codes assigned to each individual tool
equipment, test equipment, and maintenance equipment referenced. The
grouping of codes in this column of
the maintenance allocation chart indicates the tool, test, and maintenance
equipment required to perform the
maintenance function.
Remarks. Entries in this column will
(5)
be utilized when necessary to clarify
any of the data cited in the preceding
column.
c. Columns in the allocation of tools for
maintenance functions are as follows:
Tools required for maintenance func-
(1)
tions. This column lists tools, test,
and maintenance equipment required
to perform the maintenance functions.
(2)
Operator, organizational, direct support, general support, and depot. The
dagger (†) symbol indicates the categories normally allocated the facility.
Tool code. This column lists the tool
(9)
code assigned.
2. Maintenance by Using
Organizations
When this equipment is used by signal services organizations organic to theater headquarters or communication zones to provide theater
communications, those maintenance functions
allocated up to and including general support
are authorized to the organization operating
this equipment.
i-10
Page 81

SECTION II.
i-11
Page 82

SECTION III.
i-12
Page 83

Section V
Figure 5-11
Page 84

By Order of the Secretary of the Army:
Official:
J. C. LAMBERT,
Major General, United States Army,
The Adjutant General.
Distribution:
Active Amy:
TM 11-6625-493-15
HAROLD K. JOHNSON,
General,
United States Army,
Chief of Staff.
USASA (2)
CNGB (1)
CofT (1)
CofEngrs (1)
TSG (1)
Cofspts (1)
CC-E (2)
USAARMBD (2)
USAARTYBD (2)
USCONARC (2)
USAMC (2)
USAMICOM (2)
USAECOM (2)
USASCC (2)
ARADCOM (2)
ARADCOM Rgn (2)
OS Maj Cored (2)
OS Base Cored (2)
USASMC (3)
USASA 1st Fld Sta (1)
USACDCDA :
Ft Huachuca (1)
Ft Monmounth (1)
USAEMSA (15)
Lexington A Dep (6)
Sacramento A Dep (6)
NG: None.
Tobyhanna A Dep (6)
Letterkenny A Dep (5)
Ft Worth A Dep (5)
Sharpe A Dep (3)
Navajo A Dep (6)
Charleston A Dep (1)
Savanna A Dep (5)
Svc Colleges (1)
11th Air Assault Div (3)
GENDEP (OS) (1)
Sig Sec GENDEP (OS) (4)
Sig Dep (OS) (6)
Chicago Proc Dist (1)
Ft Huachuca (1)
WSMR (1)
USAELRDL (6)
USAERDL (2)
CRREL (2)
Oakland A Tml (5)
Units org under fol TOE:
(2 copies each)
11-15E
11-587
11-692
11-697
USAR: None.
For explanation of abbreviation used, see AR 320-50.
Page 85

Page 86

Page 87

Page 88

Page 89

PIN: 020795-000
 Loading...