

Page 1

User and
Service Guide
Publication number 54615-97009
July 1996 (pdf version Nov 1998)
For Safety Information, Warranties, and Regulatory information,
see the pages behind the index.
© Copyright Hewlett-Packard Company 1993–1996
All Rights Reserved
HP 54615B, HP 54616B, and
HP 54616C
Oscilloscopes
Page 2

A General-Purpose Oscilloscope
The HP 54615B, HP 54616B, and HP 54616C oscilloscopes offer
exceptional waveform viewing and measurements in a small,
lightweight package. These dual channel, 500 MHz bandwidth
oscilloscopes are designed for use in labs where high speed analog and
digital circuits are being tested. These oscilloscopes give you:
1 ns peak detect
•
1 GSa/s sample rate (HP 54615B)
•
2 GSa/s sample rate (HP 54616B and HP 54616C)
500 MHz bandwidth, and 1 ns/div Main and Delayed time bases
•
Selectable input impedance
•
Protection of the internal 50 ohm load
•
Adjustable time nulling to remove the effects of cabling
•
250 MHz single-shot bandwidth (HP 54615B)
•
500 MHz single-shot bandwidth (HP 54616B and HP 54616C)
Color display (HP 54616C)
•
These oscilloscopes are very easy to use because of their familiar
controls and real time display. You can discard your viewing hood as
these oscilloscopes have none of the viewing problems that are
associated with analog oscilloscopes. A bright, crisp display is
obtained at all sweep speeds and delayed sweep magnifications.
Storage is as simple as pressing a button. View events ahead of the
trigger using negative time. Cursors and automatic measurements
greatly simplify your analysis tasks.
You can upgrade this oscilloscope for hardcopy or remote control with
the addition of an interface module. Unattended waveform
monitoring and additional waveform math, such as FFT, can be added
with the addition of one of the Measurement/Storage modules.
Bring your scope and PC together with BenchLink software.
BenchLink, which runs under Windows, allows easy transfer of scope
traces and waveform data to your PC for incorporation into
documents or storage.
ii
Page 3

Accessories supplied
Two 1.5 meter, 10:1 Rugged 500 MHz Passive Probes (HP 10073A)
•
Power cord for country of destination
•
This
•
• Programmer’s Guide
Accessories available
•
•
•
•
•
•
•
•
•
•
•
•
•
User and Service Guide
with Microsoft Windows 3.1 Help file, ascii
help file, and sample programs.
HP 34810A BenchLink/Scope Software (version 1.4 or later)
HP 54650A HP-IB Interface Module
HP 54652B Serial/Parallel Interface Module
HP 54654A Operator’s Training Kit
HP 54657A HP-IB Measurement/Storage Module
HP 54659B Serial/Parallel Measurement/Storage Module
HP 5041-9409 Carrying Case
HP 5062-7345 Rackmount Kit
HP 10020A Resistive Divider (1:1 through 100:1) Passive Probe Kit
HP 10070A 1.5 meter, 1:1 Passive Probe
HP 10444A 10:1 500 MHz, Low Capacitance Miniature Passive
Probe (1.6 m)
HP 1137A 1000:1 1 MHz High Voltage Passive Divider Probe
HP 1141A 1:1 200 MHz Differential Active Probe. Probe power
accessed directly from oscilloscope rear panel.
HP 1144A 10:1 800 MHz Active Probe. Probe power accessed
•
directly from oscilloscope rear panel.
HP 1145A 10:1 750 MHz Small-Geometry Dual Active Probe for
•
surface mount devices. Probe power accessed directly from
oscilloscope rear panel.
iii
Page 4

Options available
Option 001 RS-03 Magnetic Interference Shielding Added to CRT
•
(HP 54615B and HP 54616B only)
Option 002 RE-02 Display Shield Added to CRT (HP 54615B and
•
HP 54616B only)
Option 005 Enhanced TV/Video Trigger
•
Option 101 Accessory Pouch and Front-Panel Cover
•
Option 103 Operator’s Training Kit (HP 54654A)
•
Option 104 Carrying Case (HP 5041-9409)
•
Option 106 BenchLink/Scope Software (HP 34810A)
•
Option 090 Deletes Probes
•
Option 1CM Rackmount Kit
•
Power Cords (see the table of Replaceable Parts in chapter 4,
•
Service)
iv
Page 5

In This Book
This is the User and Service Guide for
the HP 54615B, HP 54616B, and
HP 54616C Oscilloscopes. This guide
contains five chapters.
First Time Users
start guide that gives you a brief
overview of the oscilloscope.
Chapter 1 is a quick
The Oscillos cope at a Glance
1
Operating your Oscillosco pe
2
Using Opti on 005 Enhanced
3
TV/Video Tr igger
Service
4
Performance Characteristics
5
Advanced users
of exercises that guide you through the
operation of the oscilloscope.
TV/Video triggering
how to use enhanced TV/Video triggering
if you have Option 005 installed in your
oscilloscope.
Service technicians
contains the service information for the
oscilloscope. There are procedures for
verifying performance, adjusting,
troubleshooting, and replacing
assemblies in the oscilloscope.
Reference information
the characteristics of the oscilloscope.
Chapter 2 is a series
Chapter 3 shows
Chapter 4
Chapter 5 lists
Glossary
Index
v
Page 6

vi
Page 7

Contents
1 The Oscilloscope at a Glance
To connect a signal to the oscilloscope 1–5
To display a signal automatically 1–7
To set up the vertical window 1–8
To expand the vertical signal 1–10
To set up the time base 1–11
To trigger the oscilloscope 1–13
To use roll mode 1–16
Using Color (HP 54616C only) 1–17
To select the color palettes and observe colors 1–18
To print in color 1–20
2 Operating Your Oscilloscope
To use delayed sweep 2–3
To use storage oscilloscope operation 2–6
To capture a single event 2–8
To capture glitches or narrow pulses 2–10
To trigger on a complex waveform 2–12
To make frequency measurements automatically 2–14
To make time measurements automatically 2–16
To make voltage measurements automatically 2–19
To make cursor measurements 2–23
To remove cabling errors from time interval measurements 2–27
To view asynchronous noise on a signal 2–28
To reduce the random noise on a signal 2–30
To save or recall traces 2–33
To save or recall front-panel setups 2–34
To reset the instrument setup 2–35
To use the XY display mode 2–36
To analyze video waveforms 2–40
Contents-1
Page 8

Contents
3 Using Option 005 Enhanced TV/Video Trigger
To select TV display grid 3–4
To autoscale on a video signal 3–4
To trigger on a specific line of video 3–5
To trigger on all TV line sync pulses 3–7
To trigger on a specific field of the video signal 3–8
To trigger on all fields of the video signal 3–9
To trigger on odd or even fields 3–10
To make cursor measurements 3–12
To use delayed sweep 3–14
To analyze video waveforms with Option 005 3–16
To window in on harmonic distortion using FFT 3–18
To connect to other instruments 3–20
4Service
To return the oscilloscope to Hewlett-Packard 4–4
Verifying Oscilloscope Performance 4–5
To check the output of the
To verify voltage measurement accuracy 4–8
To verify bandwidth 4–10
To verify horizontal ∆t and 1/∆t accuracy 4–13
To verify trigger sensitivity 4–15
To verify Vertical Output on Option 005 4–18
CALIBRATOR
4–6
Adjusting the Oscilloscope 4–21
To adjust the power supply 4–22
To perform the self-calibration 4–25
To adjust the high-frequency pulse response 4–27
To adjust the display (HP 54615B/16B only) 4–29
To adjust the Option 005 offset (R15) 4–31
Contents-2
Page 9

Troubleshooting the Oscilloscope 4–32
To construct your own dummy load 4–33
To check out the oscilloscope 4–34
To clear error messages 4–37
To check the Low Voltage Power Supply 4–41
To run the internal self-tests 4–42
To troubleshoot Option 005 4–45
Replacing Parts in the Oscilloscope 4–45
To replace an assembly 4–46
To remove the fan 4–47
To remove the front panel 4–47
To remove the display 4–49
To remove the system board 4–49
To remove the attenuator 4–50
To remove and replace an acquisition hybrid 4–51
To remove and replace a hybrid connector 4–53
To remove the power supply 4–54
To remove the keyboard 4–55
To remove the handle 4–56
To remove the Option 005 board 4–56
To order a replacement part 4–57
Contents
5 Performance Characteristics
Vertical System 5–2
Horizontal System 5–4
Trigger System 5–5
TV Functions 5–6
XY Operation 5–6
Display System 5–6
Acquisition System 5–7
Contents-3
Page 10

Contents
Advanced Functions 5–8
Power Requirements 5–8
General
General
General
(HP 54615B and HP 54616B only)
(HP 54616C only)
(HP 54615B, HP 54616B, and HP 54616C) 5–12
5–11
5–9
Option 005 General Performance Characteristics 5–13
Option 005 Trigger System 5–14
Glossary
Index
Contents-4
Page 11

1
Perform self-calibration first
For the oscilloscope to perform most accurately in the ambient temperature
where it will be used, the self-calibration procedure described on page 4-25
should first be performed. Allow the unit to operate for at least 30 minutes
before performing the self-calibration.
The Oscilloscope at a Glance
Page 12

The Oscilloscope at a Glance
One of the first things you will want to do with your new oscilloscope
is to become acquainted with its front panel. Therefore, we have
written the exercises in this chapter to familiarize you with the
controls you will use most often.
The front panel has knobs, grey keys, and white keys. The knobs are
used most often and are similar to the knobs on other oscilloscopes.
The grey keys bring up softkey menus on the display that allow you
access to many of the oscilloscope features. The white keys are
instant action keys and menus are not associated with them.
Throughout this book, the front-panel keys are denoted by a box
around the name of the key, and softkeys are denoted by a change in
the text type. For example,
labeled Source under the trigger portion of the front panel, and
Line
is a softkey. The word
display directly above its corresponding softkey.
Source
Line
appears at the bottom of the
is the grey front-panel key
Figure 1-1 is a diagram of the front panel controls and input
connectors.
Figure 1-2 is a status line example. The status line, located at the top
of of the display, lets you quickly determine the setup of the
oscilloscope. In this chapter you will learn to read at a glance the
setup of the oscilloscope from the status line.
Figure 1-3 is a diagram showing which grey keys to press to bring up
the various softkey menus.
1–2
Page 13
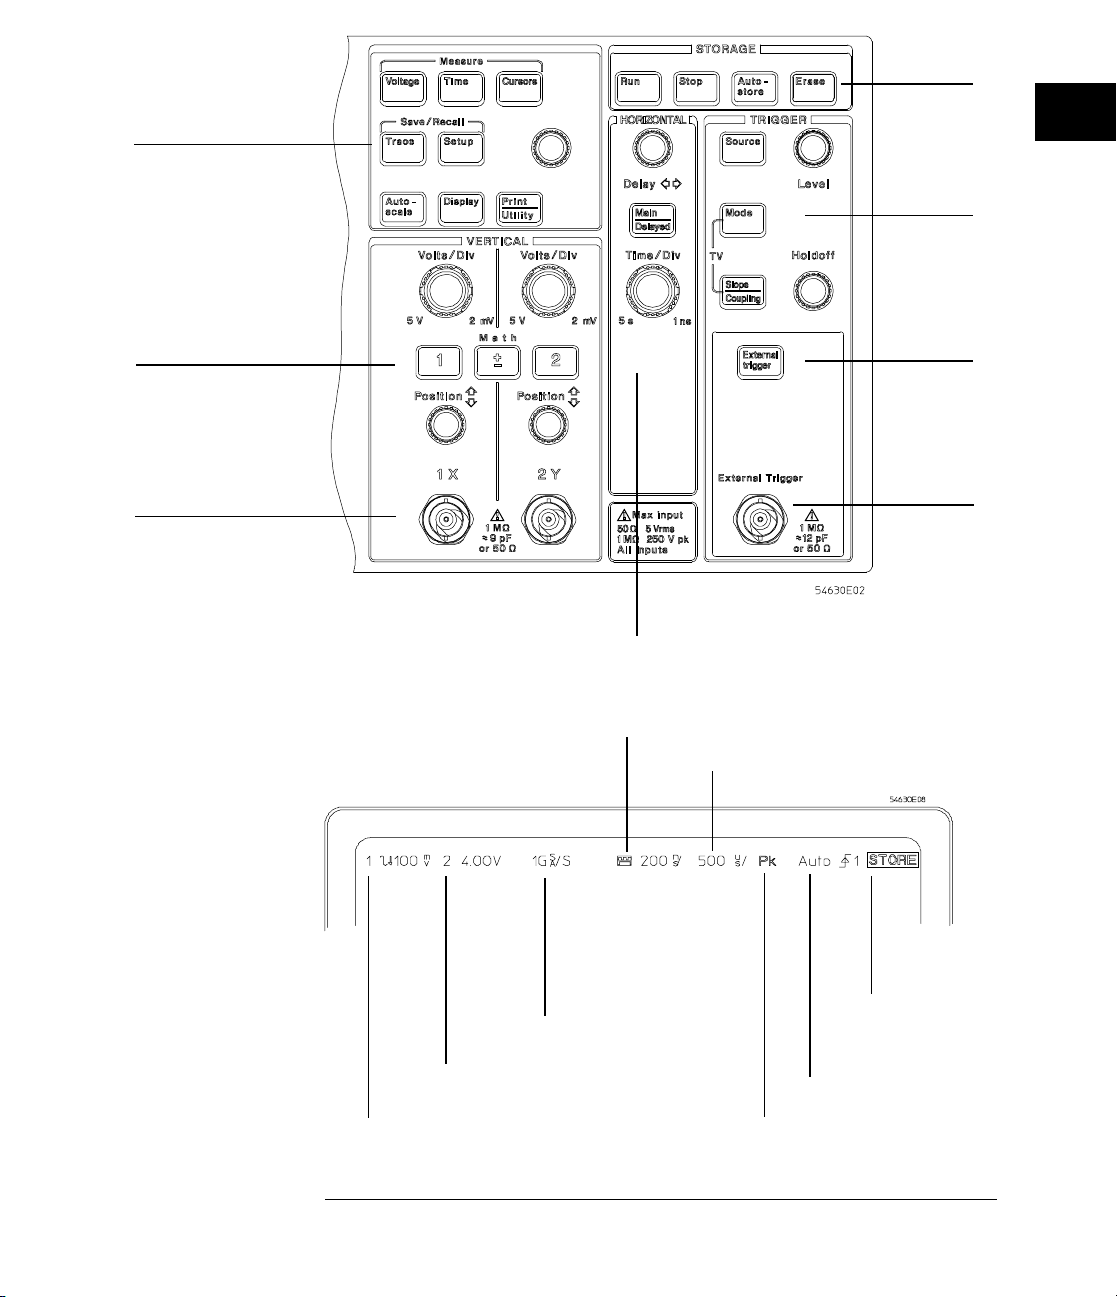
Figure 1–1
General
controls
Storage
keys
Trigger
controls
Channel
controls
Channel
inputs
Front Panel C ont rols
Figure 1–2
External
trigger
control
External
trigger input
Horizontal
controls
Delayed swe ep is on, 200 ns/di v
Main swe ep 500 µs/div
Display Status Line Indicators
Sample rate display
(Main/Delayed)
Auto triggered,
Channel 2 is on, 4 V/div
Channel 1 is on, ac coupled, inverted, 100 mV/div Peak detect is on
positive sl ope,
trigger sour ce is channel 1
Auto st o re is on
1–3
Page 14
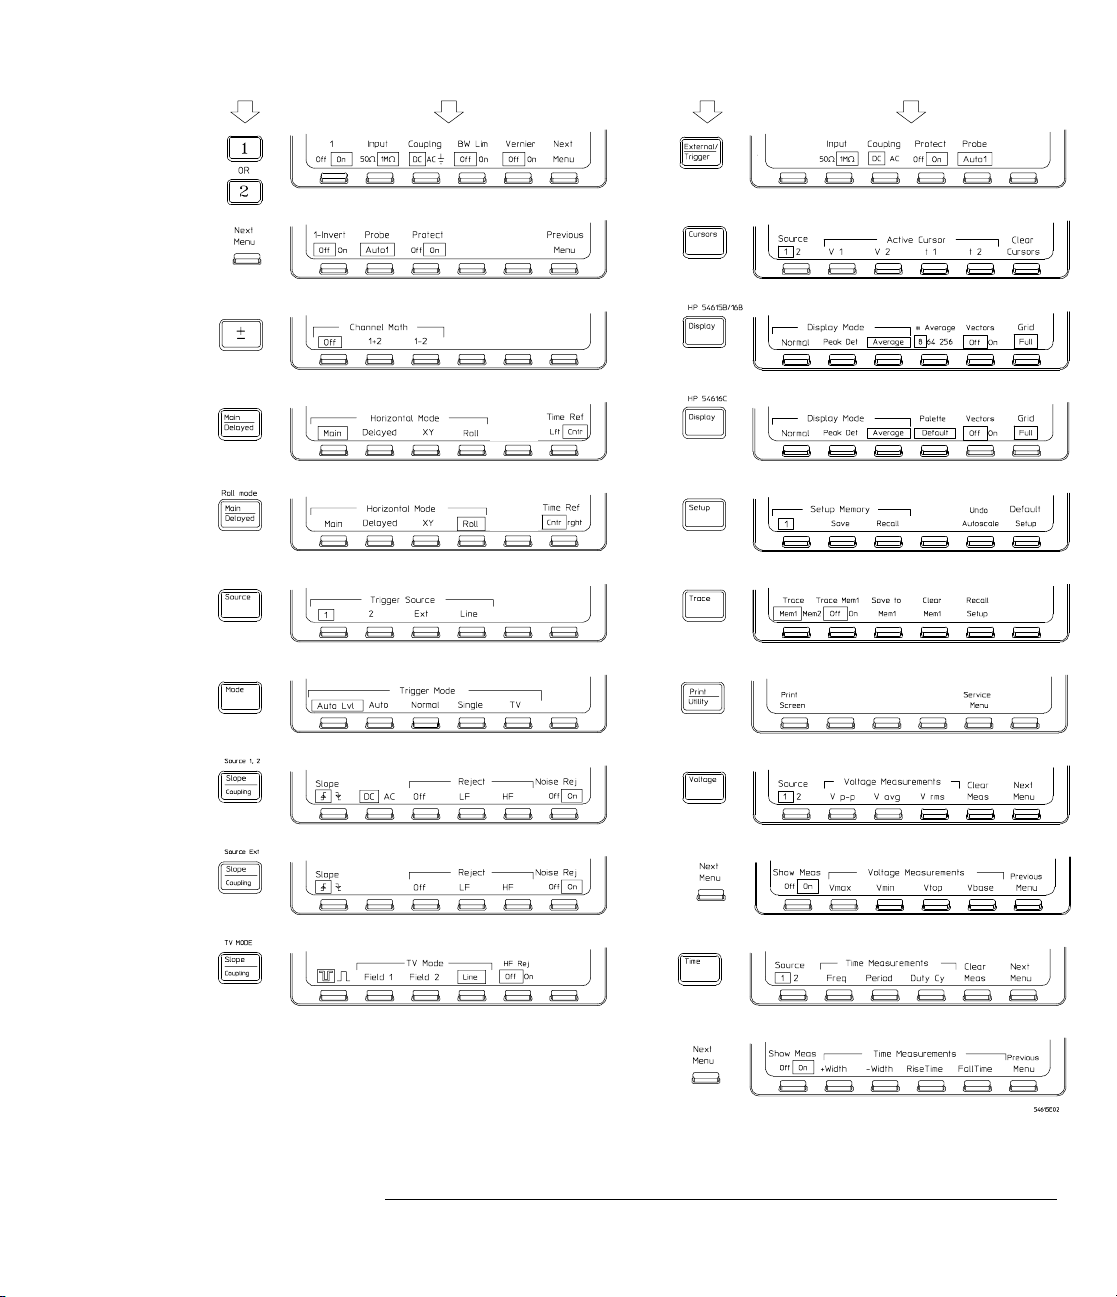
Figure 1– 3
Press this key To obtain this menuPress this key To obtain this menu
Softkey Menu Reference
1–4
Page 15

The Oscilloscope at a Glance
To connect a signal to the oscilloscope
To connect a signal to the oscilloscope
The HP 54615B is a two-channel, 500 MHz bandwidth, 1 GSa/s sample rate
oscilloscope with an external trigger input. The HP 54616Band HP 54616C
are two-channel, 500 MHz bandwidth, 2 GSa/s sample rate oscilloscopes with
an external trigger input. The input impedance of these oscilloscopes is
selectable – either 50Ω or 1 MΩ. The 50Ω mode matches 50Ω cables
commonly used in making high frequency measurements. This impedance
matching gives you the most accurate measurements since reflections are
minimized along the signal path. The 1 MΩ mode is for use with probes and
for general purpose measurements. The higher impedance minimizes the
loading effect of the oscilloscope on the circuit under test. In this exercise
you connect a signal to the channel 1 input.
To avoid damage to your new oscilloscope, make sure that the voltage level of
the signal you are using is less than or equal to 250 V (dc plus the peak ac).
For a complete list of the characteristics see chapter 5, "Performance
Characteristics."
CAUTION
CAUTION
Do not exceed 5 Vrms in 50Ω mode. When input protection is enabled in
50Ω mode, the 50Ω load will disconnect if greater than 5 Vrms is detected.
However the inputs could still be damaged, depending on the time constant
of the signal.
The 50Ω input protection mode only functions when the oscilloscope
is powered on.
•
Use a cable or a probe to connect a signal to channel 1.
•
The oscilloscope has automatic probe sensing . If you are using the
probes supplied with the oscilloscope, or other probes with probe
sensing, then the input impedance and probe attenuation factors will
be automatically set up by the oscilloscope when automatic probe
sensing is turned on. The default setting is to have automatic probe
Auto n
sensing on. This is indicated by the selection of
under the
softkey, where n is 1, 10, 20, or 100.
•
If you are not using automatic probe sensing, then follow these next
two steps.
Probe
1–5
Page 16
The Oscilloscope at a Glance
To connect a si gnal to the oscilloscope
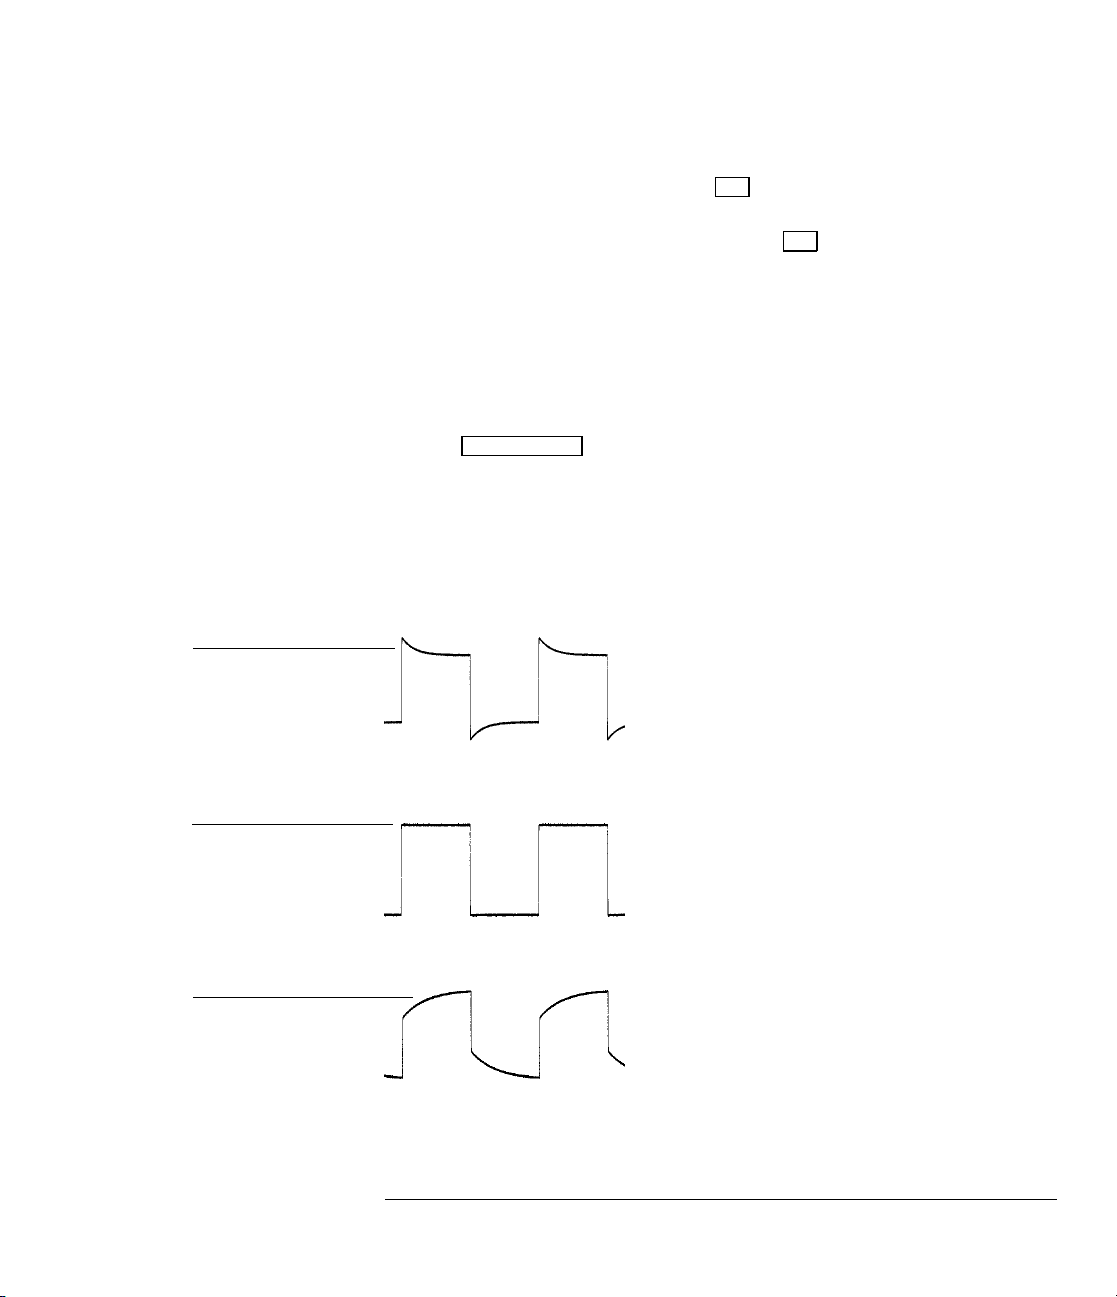
Figure 1–4
Overcompensation
causes pulse peaking.
•
To set the input impedance, press
Ω
impedance of 50
•
To set the probe attenuation factor press
softkey. Next toggle the
or 1MΩ.
Probe
1
. Select the desired Input
1
. Select the
Next Menu
softkey to change the attenuation
factor to match the probe you are using.
You should compensate 10:1 probes to match their characteristics to the
oscilloscope. A poorly compensated probe can introduce measurement
errors. To compensate a probe, follow these steps.
1
Connect the 10:1 probe from channel 1 to the front-panel probe
compensation signal on the oscilloscope.
2
3
Autosc ale
Press
Use a nonmetallic tool to adjust the trimmer capacitor on the probe
for the flattest pulse possible as displayed on the oscilloscope.
.
Figure 1–5
Correct compensation
with a flat pulse top.
Figure 1–6
Undercompensation
causes puls e rol l of f .
1–6
Page 17

The Oscilloscope at a Glance
To display a signal automatically
To display a signal automatically
The oscilloscope has an Autoscale feature that automatically sets up the
oscilloscope to best display the input signal. Using Autoscale requires signals
with a frequency greater than or equal to 50 Hz and a duty cycle greater than
0.5%.
When you press
channels that have signals applied, and selects a time base range based
on the trigger source. The trigger source is selected from inputs that
have a signal applied. The priority of trigger source assignment is
External Trigger, input 1, then input 2. Autoscale will, in both 50Ω and
1MΩ impedance modes, reset the
BW Lim
(
Input protection in 50Ω mode is not affected by Autoscale.
1
Connect a signal to the oscilloscope.
2
Press
When you press
setup to display the signal. However, if you pressed
unintentionally, you can use the
feature, perform the following step.
•
The oscilloscope returns to the configuration in effect before you
pressed
) to
Autosc al e
Setup
Press
Autosc al e
Autosc al e
Off
Verniers
, all
Autosc al e
, then press the
.
.
, the oscilloscope turns on and scales all
Coupling
Off
to
, and Signal Inversion (
, the oscilloscope changes the front-panel
Undo Autoscale
Undo Autoscale
to DC, the Bandwidth Limit
Invert
) to
Autosc al e
feature. To use this
softkey.
Off
.
1–7
Page 18

The Oscilloscope at a Glance
To set up the vertical window
To set up the vertical window
The following exercise guides you through the vertical keys, knobs, and
status line.
1
Center the signal on the display with the Position knob.
The Position knob moves the signal vertically, and it is calibrated. Notice
that as you turn the Position knob, a voltage value is displayed for a short
time indicating how far the ground reference is located from the center of the
screen. Also notice that the ground symbol on the right side of the display
moves in conjunction with the Position knob.
Measuremen t hi nts
If the channel is dc coupled, y ou can quickly measure the dc component of the
signal by si m pl y noting its distance from the gr ound symbol.
If the channel is ac coupled, th e dc component of the s i gnal is removed allowing
you to use gre ater sensitivit y t o di splay the ac component of the si gnal .
1–8
Page 19

The Oscilloscope at a Glance
To set up the vertical window
2
Change the vertical setup and notice that each change affects the
status line differently.
You can quickly determine the vertical setup from the status line in the
display.
Change the vertical sensitivity with the Volts/Div knob and notice that it
•
causes the status line to change.
1
Press
•
A softkey menu appears on the display, and the channel turns on (or
remains on if it was already turned on).
Toggle each of the softkeys and notice which keys cause the status line to
•
change.
Channels 1 and 2 have a vernier softkey that allows the Volt/Div knob
to change the vertical step size in smaller increments. These smaller
increments are calibrated, which results in accurate measurements
even with the vernier turned on.
To turn the channel off, either press
•
left-most softkey.
.
1
a second time or press the
Invert operating hint
When you are tri ggered on the signal you are inv erting, the inver sion applies
only to the displayed waveform, not to the trigger signal. Therefore, the trigger
slope of the displayed waveform is inverted from the trigger slope icon dipl ayed
on the status li ne.
1–9
Page 20

The Oscilloscope at a Glance
To expand the vertical signal
To expand the vertical signal
When changing the Volts/Div for analog channels, you can have the signal
expand (or compress) about the center screen or about the ground point.
•
To expand the signal about center screen, press
Then select
•
To expand the signal about ground, press
select
System Config
System Config
and
Expand Vertical Center
and
Expand Vertical Ground
Print/ Ut il it y
.
Print/ Ut il it y
.
.
. Then
1–10
Page 21

The Oscilloscope at a Glance
To se t up the time base
To set up the time base
The following exercise guides you through the time base keys, knobs, and
status line.
1
Turn the Time/Div knob and notice the change it makes to the status
line.
The Time/Div knob changes the sweep speed from 1 ns to 5 s in a 1-2-5 step
sequence, and the value is displayed in the status line. The sample rate is
also displayed on the status line.
2
Change the horizontal setup and notice that each change affects the
status line differently.
Main/D elayed
Press
•
A softkey menu appears on the display with six softkey choices.
Toggle each of the softkeys and notice which keys cause the status line to
•
change.
.
1–11
Page 22

The Oscilloscope at a Glance
To set up the time base
Turn the Delay knob and notice that its value is displayed in the status line.
•
The Delay knob moves the main sweep horizontally, and it pauses at
0.00 s, mimicking a mechanical detent. At the top of the graticule is a
solid triangle (
▼
) symbol and an open triangle ( ∇ ) symbol. The
▼
symbol indicates the trigger point and it moves in conjunction with the
Delay knob. The ∇ symbol indicates the time reference point. If the
time reference softkey is set to left, the ∇ is located one graticule in
from the left side of the display. If the time reference softkey is set to
center, the ∇ is located at the center of the display. The delay number
tells you how far the reference point ∇ is located from the trigger
▼
point
All events displayed left of the trigger point
.
▼
happened before the
trigger occurred, and these events are called pretrigger information or
negative time. You will find this feature very useful because you can
now see the events that led up to the trigger point. Everything to the
▼
right of the trigger point
is called posttrigger information. The
amount of delay range (pretrigger and posttrigger information)
available is dependent on the sweep speed selected. See "Horizontal
System" in chapter 5, for more details.
1–12
Page 23

The Oscilloscope at a Glance
To trigger th e oscilloscope
To trigger the oscilloscope
The following exercise guides you through the trigger keys, knobs, and status
line.
1
Turn the trigger Level knob and notice the changes it makes to the
display.
As you turn the Level knob or press a trigger menu key, for a short time two
things happen on the display. First, the trigger level is displayed in inverse
video. If the trigger is dc coupled, it is displayed as a voltage. If the trigger is
ac coupled or if LF reject was selected, it is displayed as a percentage of the
trigger range. Second, if the trigger source is turned on, a line is displayed
showing the location of the trigger level (as long as ac coupling or low
frequency reject are not selected).
2
Change the trigger setup and notice that each change affects the
status line differently.
Source
•
Press
.
A softkey menu appears on the display showing the trigger source
choices.
Toggle each of the softkeys and notice that each key causes the status line
•
to change.
Extern al Trigg er
Press
•
A softkey menu appears on the display showing the external trigger
choices.
.
1–13
Page 24

The Oscilloscope at a Glance
To trigger the oscilloscope
Mode
Press
•
A softkey menu appears on the display with five trigger mode choices.
Toggle the
•
line differently. (You can only select TV if the trigger source is either
channel 1 or 2.)
When the oscilloscope is triggering properly, the trigger mode portion
of the status line is blank.
What happens if the oscilloscope los es trigger?
If Auto Level is the trigger mode, Auto flashes i n the status lin e. If dc coupled,
the oscilloscope resets the trigger level to the c ent er of the signal. If ac
coupled, the oscillo sc ope resets the trigger level t o half way between the
minimum and m aximum amplitudes as display ed on the screen. In addition,
every time you press the Auto Level softkey, the oscilloscope resets the trigger
level.
.
Single
and
TV
softkeys and notice that they affect the status
If Auto is the trigger mode, Auto flashes in the status line and the oscilloscope
free runs.
If either Normal or TV is the trig ger m ode, the trigge r setup flashes i n the status
line.
1–14
Page 25

The Oscilloscope at a Glance
To trigger th e oscilloscope
Slope/ Coupli ng
Press
•
A softkey menu appears on the display. If you selected Auto level,
Auto, Normal, or Single as a trigger mode, six softkey choices are
displayed. If you selected TV as a trigger source, five other softkey
choices are available.
Toggle each of the softkeys and notice which keys affect the status line.
•
External trigger input coupling (ac or dc) is selected from the External
•
Trigger menu.
3
Adjust the Holdoff knob and observe how it changes the display.
Holdoff keeps the trigger from rearming for an amount of time that you set.
Holdoff is often used to stabilize the display of complex waveforms. The
Holdoff range is from 300.0 ns to about 13.5 s. When you adjust the Holdoff
knob, the current holdoff time is briefly displayed in inverse video near the
bottom of the display. For an example of using Holdoff, refer to the section,
"To trigger on a complex waveform" on page 2-12.
.
To set a long ho ldoff time, go to a sl ower sweep speed.
The value used to increment the holdoff depends upon the sweep s peed or
time/div sel ection. Howeve r, the actual holdoff v al ue is a fixed num ber; it is not
a percentage of s w eep speed. For a time/div setting of 5 ns/div, the holdoff
increment is 5 0 ns. For a time/div setting of 5 s/div, the holdoff increment is
100 ms.
1–15
Page 26

The Oscilloscope at a Glance
To use roll mode
To use roll mode
Roll mode continuously moves data across the display from right to left. Roll
mode allows you to see dynamic changes on low frequency signals, such as
when you adjust a potentiometer. Two frequently used applications of roll
mode are transducer monitoring and power supply testing.
1
Press
Mode
. Then press the
Auto Lvl
,
Auto
, or
Normal
softkey.
2
Press
3
Press the
The oscilloscope is now untriggered and runs continuously. Also notice that
the time reference softkey selection changes to center and right.
4
Press
In Single, the oscilloscope fills either 1/2 of the display if
the time reference, or 9/10 of the display if
reference, then it searches for a trigger. As soon as a trigger is found, the
display is filled from the reference point (
display. The oscilloscope then stops acquiring data.
You can also make automatic measurements in the roll mode. If time
measurements are made while the data is rolling, slight errors are incurred
(less than 2%.) The most accurate time measurements are made on rolled
data when the acquisition is stopped.
Main/D el ay ed
Roll
softkey.
Mode
Roll mode oper ati ng hints
• Math functions, averaging, and peak detect ar e not available in roll mode.
• Holdoff and horizontal delay are not active in roll mode.
• Both a free ru nni ng (nontriggered) display and a triggered displa y ( available in
the single mode only) are avail able in roll mode.
• Roll mode is available at sw eep speeds of 200 ms/div and slow er for the
HP 54615B and HP 54616B. Roll mode is available at sweep speeds of
500 ms/div and slower for the HP 54616C.
. Then press the
.
Single
softkey.
Cntr
is selected for
Rght
is selected for the time
Cntr
or
Rght
) to the right edge of the
1–16
Page 27

Using Color (HP 54616C only)
With the HP 54616C color oscilloscope, you can select any of the
seven available color palettes to assign colors to channels, cursors,
stored waveforms, and text.
The seven color palettes allow additional customization, which allows
you to easily distinguish between channel waveforms. In addition,
when making measurements on a channel, wherever the channel
number appears on screen, it is highlighted in the selected color.
The color palettes are individually named, and you can choose the
palette that best suits your needs. You can change from the Default
palette to any of the following:
•
Alternate 1 works well for people who are colorblind.
•
The colors in Alternate 2 are compatible with those used in
HP 545xx-series oscilloscopes.
•
Alternate 3 sets the cursors to yellow.
•
Inverse 1 works well for hard copies.
•
Inverse 2 works well for overhead transparencies.
•
A Monochrome palette is also available.
In each palette, different colors are used for cursors, waveforms,
softkeys, and Autostore. The background is always black, unless you
select the Inverse palettes, which use a white background. Softkeys
and the grid are always in white, except in the Inverse palettes, which
set them to black.
This section shows you how to:
•
Select the color palettes and observe colors
•
Print in color
1–17
Page 28

The Oscilloscope at a Glance
To select the color palettes and observe colors
To select the color palettes and observe colors
1
Press
under the
2
Press the
Displa y
Palette
Palette
. The name of the selected palette appears
softkey.
softkey. Continue to cycle through the palettes and
observe colors applied to the cursors, waveforms, and softkeys.
Notice that the softkeys are white in all palettes, except the Inverse palettes,
where they are black.
3
Press the
The graticule is always white, except in the Inverse palettes, where it is black.
4
Toggle the
5
Press
A single color shows all the cursors in the display area.
6
Press
Grid
softkey until
Grid
softkey until
Cursor s
Autost or e
Full
is displayed.
Frame
is displayed.
. Press
Active Cursor t2
Active Cursor V2
then
.
. Turn the Position knob both directions on an
active channel and notice the stored waveform.
The autostored waveforms are displayed in blue when using the Default and
Alternate color palettes, cyan in the Inverse color palettes, and white in the
MonoChrome palette.
7
Press
Autost or e
to turn it off. Then press
Erase
.
1–18
Page 29

The Oscilloscope at a Glance
To select the color palettes and observe colors
The following table shows the color palettes and the palette colors mapped to
the display components.
Table 1-1
Color Palettes and Mapping of Colors to Display Components
Palette Color Display Component Palette Color Display Component
Default green
yellow
magenta
cyan
white
white
white
blue
black
Alternate 1 red
cyan
yellow
magenta
white
white
white
blue
black
Alternate 2 cyan
yellow
green
magenta
white
white
white
blue
black
In the monochrome palette, all of the display components are in white, except the background, which is black.
cursors
waveform1
waveform2
functions
overlapping waveforms
softkeys
graticule
autostor e
background
cursors
waveform1
waveform2
functions
overlapping waveforms
softkeys
graticule
autostor e
background
cursors
waveform1
waveform2
functions
overlapping waveforms
softkeys
graticule
autostor e
background
Alternate 3 yell ow
magenta
cyan
green
white
white
white
blue
black
Inverse 1 magenta
red
blue
green
black
black
black
cyan
white
Inverse 2 black
red
blue
magenta
black
black
black
cyan
white
cursors
waveform1
waveform2
functions
overlapping waveforms
softkeys
graticule
autostor e
background
cursors
waveform1
waveform2
functions
overlapping waveforms
softkeys
graticule
autostor e
background
cursors
waveform1
waveform2
functions
overlapping waveforms
softkeys
graticule
autostor e
background
1–19
Page 30

The Oscilloscope at a Glance
To print in color
To print in color
See also
1
Press
The HP 54616C can print to an HP DeskJet Color printer when using an
Interface Module with either an RS-232 interface or parallel interface (there
are no color printers with an HP-IB interface.)
2
Press the
Print/ Ut il it y
Hardcopy Menu
.
softkey. Then press
Format
until
HP DJColor
displayed.
This selects the HP DeskJet Color Printer format.
3
If you are using a HP 54652B or HP 54659B serial/parallel interface
module, toggle the
4
Press the
The current display will be sent out the parallel port to the HP DeskJet color
printer attached to your oscilloscope, and printed in color.
Refer to the
Function Guide
Previous Menu
Interface Modules for HP 54600-Series Instuments I/O
Destination
softkey, then press the
for other input/output and printing functions.
softkey to either
RS-232
or
Print Scre en
Parallel
softkey.
is
.
1–20
Page 31

2
Operating Your Oscilloscope
Page 32

Operating Your Oscilloscope
By now you are familiar with the
VERTICAL, HORIZONTAL
, and
TRIGGER
groups of the front-panel keys. You should also know how to
determine the setup of the oscilloscope by looking at the status line.
If you are unfamiliar with this information, we recommend you read
chapter 1, "The Oscilloscope at a Glance."
This chapter takes you through two new groups of front-panel keys:
STORAGE
, and the group of keys that contains the Measure,
Save/Recall, and Display keys. You will also add to your knowledge of
the
HORIZONTAL
keys by using delayed sweep.
We recommend you perform all of the following exercises so you
become familiar with the powerful measurement capabilities of your
oscilloscope.
Perform self-calibration first
For the oscilloscope to perform most accurately in t he ambient temperature
where it will be used, the s elf-calibration proced ure described on page 3-25
should first be performed. Al l ow the unit to operat e for at least 30 mi nutes
before performi ng the self-cali bration.
2–2
Page 33

Operating You r Oscilloscope
To use delay ed sweep
To use delayed sweep
Delayed sweep is a magnified portion of the main sweep. You can use
delayed sweep to locate and horizontally expand part of the main sweep for a
more detailed (high resolution) analysis of signals. The following steps show
you how to use delayed sweep. Notice that the steps are very similar to
operating the delayed sweep in analog oscilloscopes.
1
Connect a signal to the oscilloscope and obtain a stable display.
Press
Main/D el ay ed
.
2
3
Press the
The screen divides in half. The top half displays the main sweep, and the
bottom half displays an expanded portion of the main sweep. This expanded
portion of the main sweep is called the delayed sweep. The top half also has
two solid vertical lines called markers. These markers show what portion of
the main sweep is expanded in the lower half. The size and position of the
delayed sweep are controlled by the Time/Div and Delay knobs. The
Time/Div next to the symbol is the delayed sweep sec/div. The delay
value is displayed for a short time at the bottom of the display.
To display the delay value of the delayed time base, either
•
press
To change the main sweep Time/Div, you must turn off the delayed sweep.
•
Delayed sweep operating hint
When in delayed sweep, the dis pl ayed sample r ate applies to the mai n sweep.
The delayed sw eep sample rate i s always equal to or greater than th e m ai n
sweep sample rate. Main and del ayed sweeps are obtained in alt ernate
acquistions.
Single swee p i n delayed mode acquires on trigger for main and one t ri gger for
delayed.
Delayed
Main/D el ay ed
softkey.
or turn the Delay knob.
2–3
Page 34

Figure 2-1
Delayed sw eep
markers
Operating Your Oscilloscope
To use delay ed sweep
Since both the main and delayed sweeps are displayed, there are half as
many vertical divisions so the vertical scaling is doubled. Notice the changes
in the status line.
To display the delay time of the delayed sweep, either press
•
Main/D el ay ed
displayed near the bottom of the display.
4
Set the time reference (
Figure 2-1 shows the time reference set to left. The operation is like the
delayed sweep of an analog oscilloscope, where the delay time defines the
start of the delayed sweep.
or turn the delay knob. The delay value is
Time Ref
) to either left (
Lft
) or center (
Cntr
).
Time reference set to left
2–4
Page 35

Figure 2- 2
Delaye d sw eep
markers
Operating You r Oscilloscope
To use delay ed sweep
Figure 2-2 shows the time reference set to center. Notice that the markers
expand around the area of interest. You can place the markers over the area
of interest with the delay knob, then expand the delayed sweep with the time
base knob to increase the resolution.
Time reference set to center
2–5
Page 36

Operating Your Oscilloscope
To use stora ge oscilloscope operation
To use storage oscilloscope operation
There are four front-panel storage keys. They are white instant action keys
that change the operating mode of the oscilloscope. The following steps
demonstrate how to use these storage keys.
1
Connect a signal to the oscilloscope and obtain a stable display.
2
Press
Autost or e
.
Notice that
For easy viewing, the stored waveform is displayed in half bright and the
most recent trace is displayed in full bright. Autostore is useful in a number
of applications.
Displaying the worst-case extremes of varying waveforms
•
Capturing and storing a waveform
•
Measuring noise and jitter
•
Capturing events that occur infrequently
•
STORE
replaces
RUN
in the status line.
2–6
Page 37

Operating You r Oscilloscope
To use stora ge oscilloscope operation
3
Using the position knob in the Vertical section of the front panel,
move the trace up and down about one division.
Notice that the last acquired waveform is in full bright and the previously
acquired waveforms are displayed in half bright.
To characterize the waveforms, use the cursors. See "To make cursor
•
measurements" on page 2-23.
To clear the display, press
•
To exit the Autostore mode, press either
•
Autost ore
or
Summary of s torage keys
Run
– The oscillosc ope acquires data and displays the most recent tr ace.
Stop – The dis pl ay is frozen.
.
Erase
.
Run
Autostore
full bright and previously acquired waveform s in half bright .
Erase
– The oscilloscope acquires data, displa ying the most recent trace in
– Clears t he di splay.
2–7
Page 38

Operating Your Oscilloscope
To capture a si ngle event
To capture a single event
To capture a single event, you need some knowledge of the signal in order to
set up the trigger level and slope. For example, if the event is derived from
TTL logic, a trigger level of 2 volts should work on a rising edge. The
following steps show you how to use the oscilloscope to capture a single
event.
1
Connect a signal to the oscilloscope.
2
Set up the trigger.
Source
Press
•
Slope/ Coupli ng
Press
•
Turn the Level knob to a point where you think the trigger should work.
•
3
Press
Mode
. Select a trigger source with the softkeys.
. Select a trigger slope with the softkeys.
, then press the
Single
softkey.
4
Press
5
Press
Pressing the Run key arms the trigger circuit. When the trigger conditions
are met, data appears on the display representing the data points that the
oscilloscope obtained with one acquisition. Pressing the Run key again
rearms the trigger circuit and erases the display.
Erase
Run
to clear previous measurements from the display.
.
2–8
Page 39

Operating You r Oscilloscope
To capture a single event
6
If you need to compare several single-shot events,
Autost ore
press
Like the Run key, the Autostore key also arms the trigger circuit. When the
trigger conditions are met, the oscilloscope triggers. Pressing the Autostore
key again rearms the trigger circuit without erasing the display. All the data
points are retained on the display in half bright with each trigger allowing you
to easily compare a series of single-shot events.
After you have acquired a single-shot event, pressing a front-panel key,
softkey, or changing a knob can erase the event from the display. If you
press the Stop key, the oscilloscope will recover the event and restore the
oscilloscope settings.
To clear the display, press
•
To exit the Autostore mode, press either
•
Autost ore
or
indicating that the oscilloscope has exited the Autostore mode.
.
Erase
. Notice that RUN replaces STORE in the status line,
.
Run
Operating hint
With display vectors on, the m aximum singl e-shot bandwidth i s:
HP 54615B – 250 MHz for single- and two-channel operation (1 G S a/s, normal
display, display vectors on.)
HP 54616B/16C – 500 MHz for single- and two-channel operation (2 GSa/s,
normal display, display vectors on.)
With display vecto rs off, the oscilloscopes display the actual captured samples.
2–9
Page 40

Operating Your Oscilloscope
To capture gli tches or narrow pu ls es
To capture glitches or narrow pulses
A glitch is a rapid change in the waveform that is usually narrow as compared
to the waveform. This oscilloscope has two modes of operation that you can
use for glitch capture: peak detect and Autostore.
1
Connect a signal to the oscilloscope and obtain a stable display.
2
Find the glitch.
Use peak detect for narrow pulses or glitches.
To select peak detect, press
•
softkey.
Peak detect operates at sweep speeds from 5 s/div to 500 ns/div.
When operating, Pk is displayed in the status line in inverse video. At
sweep speeds faster than 500 ns/div, Pk is displayed in normal video,
which indicates that peak detect is not operating. However, the
acquisition system is sampling at 1 GSa/s so glitches greater than 1 ns
will not be missed.
Displa y
. Next, press the
Peak Det
Peak detect operating hint
In peak detect, the A/D converte rs are sampling at 1 GSa/s. Howev er, not all
samples are w ri tt en to the display. Only the min a nd the max sample s in each of
the waveform graticules’s 500 pixel columns are written to the displ ay.
2–10
Page 41

Operating You r Oscilloscope
To capture glitches or narrow pul ses
Autostore operating hints
Use Autosto re for the following cases:
Waveforms that are changing.
•
Waveforms that you want to view and compare w i th stored waveform s.
•
Narrow pulses or glitches t hat occur infrequently.
•
Autost ore
Press
•
You can use peak detect and Autostore together. Peak detect
captures the glitch, while Autostore retains the glitch on the display in
half bright video.
3
Characterize the glitch with delayed sweep.
Peak detect functions in both the main sweep and the delayed sweep. To
characterize the glitch with delayed sweep follow these steps.
Main/D elayed
Press
•
To obtain a better resolution of the glitch, expand the time base.
•
To set the expanded portion of the main sweep over the glitch, use the
•
Delay knob.
.
. Next press the
Delayed
softkey.
To characterize the glitch, use the cursors or the automatic measurement
•
capabilities of the oscilloscope.
2–11
Page 42

Operating Your Oscilloscope
To trigger on a complex waveform
To trigger on a complex waveform
The difficulty in viewing a complex waveform is triggering on the signal.
Figure 2-3 shows a complex waveform that is not synchronized with the
trigger.
The simplest trigger method is to trigger the oscilloscope on a sync pulse that
is associated with the waveform. See "To trigger the oscilloscope" on page
1-13. If there is no sync pulse, use the following procedure to trigger on a
periodic complex waveform.
1
Connect a signal to the oscilloscope.
2
Set the trigger level to the middle of the waveform.
3
Adjust the Holdoff knob to synchronize the trigger of the
oscilloscope with the complex waveform.
By setting the Holdoff to synchronize the trigger, the oscilloscope ignores the
trigger that results in figure 2-3, and waits for the trigger that results in figure
2-4. Also notice in figure 2-3 that the trigger is stable, but the waveform is
not synchronized with the trigger.
Holdoff operati ng hints
1 The advantage o f digital holdoff is that it is a fixed num ber. As a result,
changing the ti m e base settings does not affect the hol doff number; so, the
oscilloscope remai ns triggered. In contrast, the holdoff in analog oscilloscopes
is a function of the time base s ett i ng m aking it necessary to readjus t t he holdoff
each time you change the time base setting.
2 The rate of chang e of the holdoff adjus tment knob depends on the time bas e
setting you h ave selected. If you need a lengthy holdoff setting , i ncrease the
time/div sett i ng on the time base, then make your coarse holdoff ad j ustment.
Now switch back to the original time/div sett i ng and make the fine adjustment to
reach the exact am ount you want.
2–12
Page 43
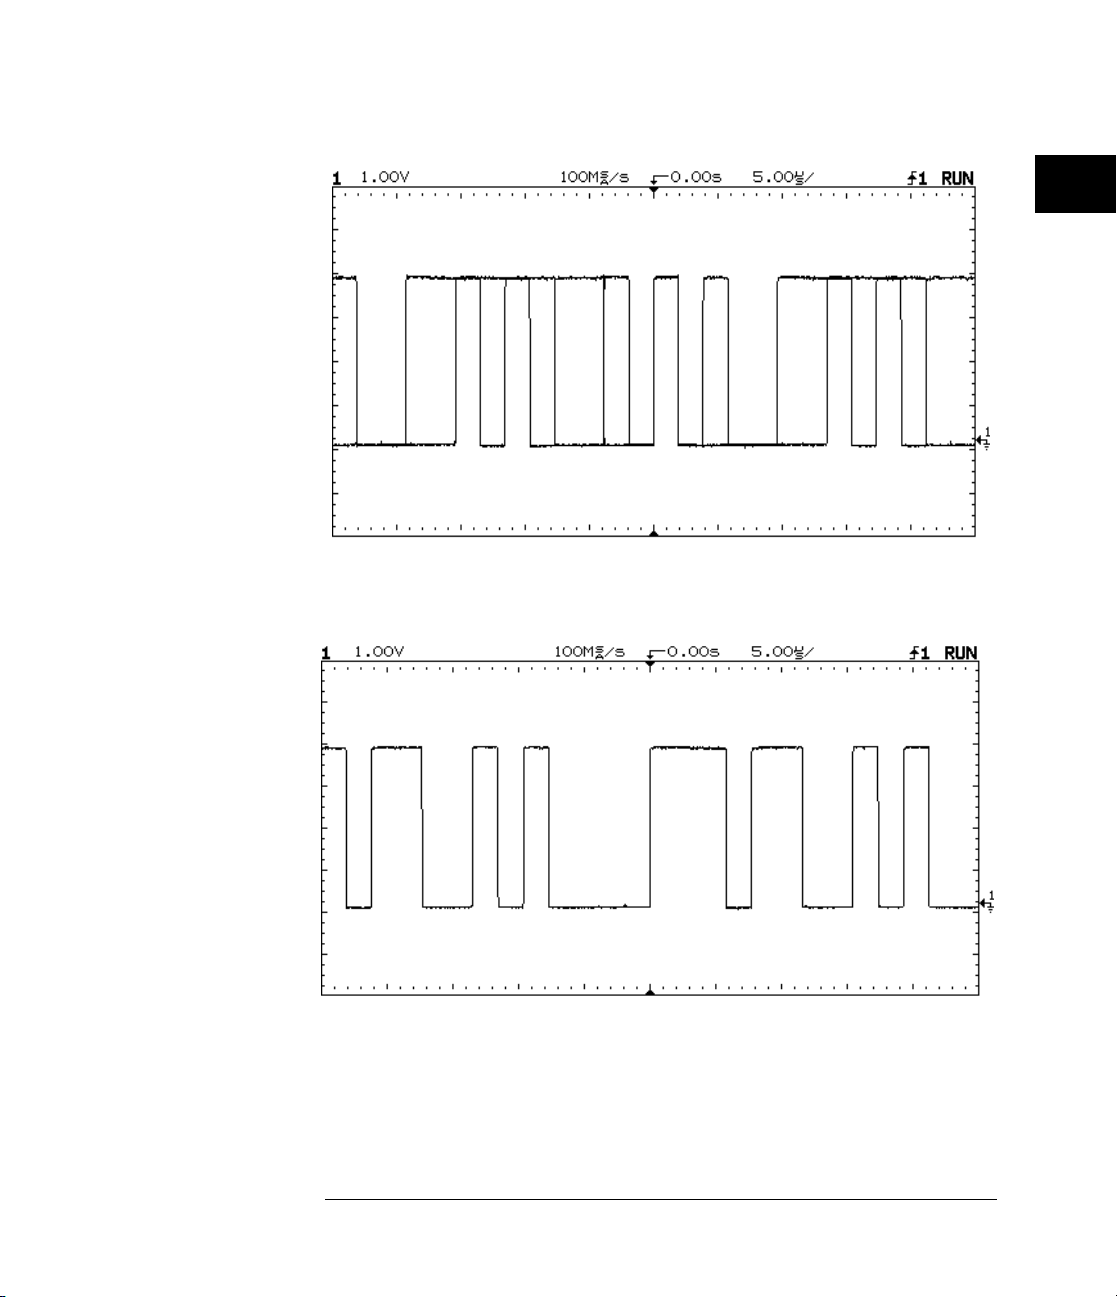
Figure 2-3
Operating You r Oscilloscope
To trigger on a complex wave form
Stable trigger, but the waveform is not synchronized with the trigger
Figure 2-4
Holdoff synchronizes the waveform with the trigger
In Figure 2-4, the holdoff is set to about 25 µs (the duration of the pattern.)
2–13
Page 44

Operating Your Oscilloscope
To make frequ ency measuremen ts automatically
To make frequency measurements automatically
The automatic measurement capability of the oscilloscope makes frequency
measurements easy, as the following steps demonstrate.
1
Connect a signal to the oscilloscope and obtain a stable display.
2
Press
A softkey menu appears with six softkey choices.
3
Toggle the
measurement.
4
Press the
The oscilloscope automatically measures the frequency and displays the
result on the lower line of the display. The number in parentheses after the
word
measurement. The oscilloscope retains in memory and displays the three
most current selected measurements. If you make a fourth measurement,
the left-most is dropped.
Time
Freq
.
Source
softkey to select a channel for the frequency
Freq
softkey.
is the number of the channel that the oscilloscope used for the
2–14
Page 45
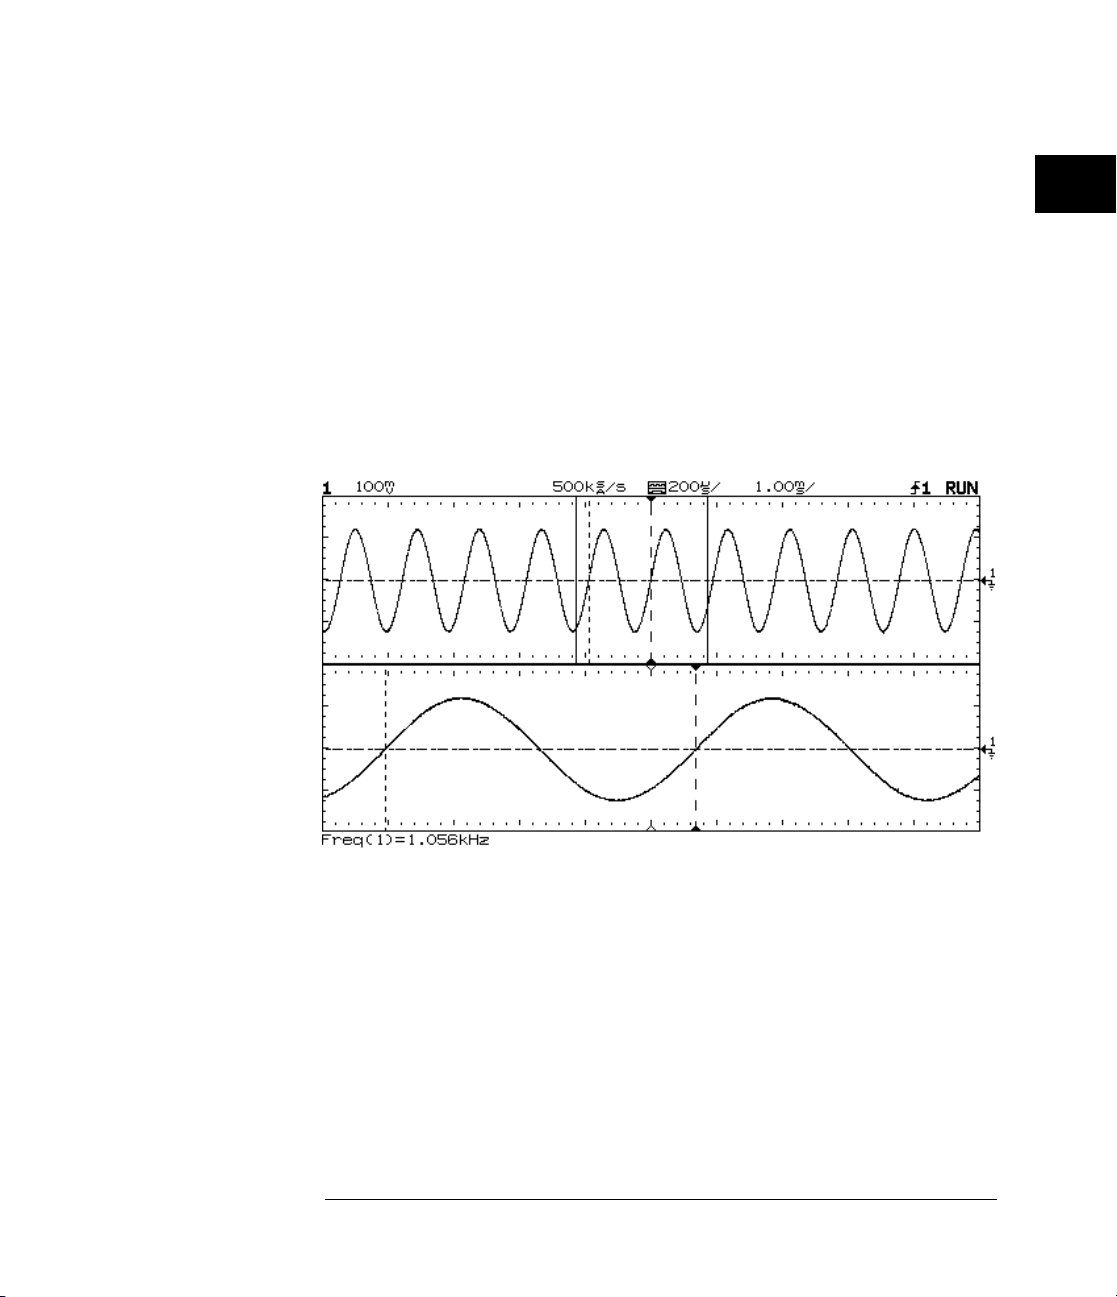
Figure 2-5
Operating You r Oscilloscope
To make frequ ency measuremen ts automatically
Show Meas
If the
waveform that show the measurement points for the right-most
measurement result. If you select more than one measurement, you
can show a previous measurement by reselecting the measurement.
To find the
•
The oscilloscope makes automatic measurements on the first
displayed event. Figure 2-5 shows how to use delayed sweep to
isolate an event for a frequency measurement. If the measurement is
not possible in the delayed time base horizontal mode, then the main
time base is used. If the waveform is clipped, it may not be possible to
make the measurement.
softkey is turned on, cursors are displayed on the
Show Meas
softkey, press the
Next Menu
softkey.
Delayed ti m e base isolates an eve nt for a frequency meas urement
2–15
Page 46

Figure 2-6
Operating Your Oscilloscope
To make time measurements au tomatically
To make time measurements automatically
You can measure the following time parameters with the oscilloscope:
frequency, period, duty cycle, width, rise time, and fall time. The following
exercise guides you through the Time keys by making a rise time
measurement. Figure 2-6 shows a pulse with some of the time measurement
points.
1
Connect a signal to the oscilloscope and obtain a stable display.
When the signal has a well-defined top and bottom (see figure 2-8), the rise
time and fall time measurements are made at the 10% and 90% levels. If the
oscilloscope cannot find a well-defined top or bottom (see figure 2-9), the
maximum and minimum levels are used to calculate the 10% and 90% points.
2–16
Page 47

Operating You r Oscilloscope
To make time measurements autom atically
Press
Time
A softkey menu appears with six softkey choices. Three of the softkeys are
time measurement functions.
Source
Selects a channel for the time measurement.
Time Measurem ents
(frequency),
made at the 50% levels. Refer to figure 2-6.
Clear Meas
removes the cursors from the display.
Next Menu
Press the
Another time measurement softkey menu appears with six additional choices.
Four of the softkeys are time measurement functions.
Show Meas
cursors where the measurement was taken.
Time measure m ent hint
When making time measure ment s in roll mode, the most accurate result s will b e
seen when the w aveform is stop ped.
.
Three time measurement choices are available:
Period
(clear measurement) Erases the measurement results and
Replaces the softkey menu with six additional softkey choices.
Next Menu
(show measurement) Displays the horizontal and vertical
, and
softkey.
Duty C y
(duty cycle). These measurements are
Freq
2
3
2–17
Page 48

Operating Your Oscilloscope
To make time measurements au tomatically
Figure 2-7
Time Measurem ents
+Width, -Width, Rise Time
the 50% levels, whereas rise time and fall time measurements are made at the
10% to 90% levels.
Previous Menu
4
Press the
The oscilloscope automatically measures the rise time of the signal and
displays the result on the display.
The oscilloscope makes automatic measurements on the first displayed
event. Figure 2-7 shows how to use delayed sweep to isolate an edge for a
rise time measurement.
Rise Time
Four additional time measurement choices are available;
Fall Time
, and
Returns to the previous softkey menu.
softkey.
. Width measurements are made at
Delayed sw eep isolates a leading edge for a rise tim e m easurement
2–18
Page 49

Figure 2-8
Operating You r Oscilloscope
To make voltage measuremen ts automatically
To make voltage measurements automatically
You can measure the following voltage parameters automatically with the
oscilloscope: peak-to-peak, average, rms, maximum, minimum, top, and base.
The following exercise guides you through the Voltage keys by making an
rms voltage measurement. Figures 2-8 and 2-9 show pulses with some of the
voltage measurement points.
Figure 2-9
Pulse where the top and bottom are w el l-defined
Pulse where the top and bottom are not w ell-defined
2–19
Page 50

Operating Your Oscilloscope
To make voltage measurements automatically
1
Connect a signal to the oscilloscope and obtain a stable display.
2
Press
A softkey menu appears with six softkey choices. Three of the softkeys are
voltage measurement functions.
Source
Voltage Measurements
Vp-p, Vavg
histograms of the signal.
Clear Meas
display, and removes the horizontal and vertical cursors from the display.
Next Menu
Voltag e
Selects a channel for the voltage measurement.
, and
(clear measurement) Erases any measurement results from the
Replaces the softkey menu with six additional softkey choices.
.
Three voltage measurement choices are available:
Vrms
The measurements are determined by voltage
2–20
Page 51

Operating You r Oscilloscope
To make voltage measuremen ts automatically
Figure 2-10
3
Press the
The oscilloscope automatically measures the rms voltage and displays the
result on the display.
The oscilloscope makes automatic measurements on the first pulse or period
in the display. If a cycle of the waveform cannot be found as shown in the
delayed window in figure 2-10, the measurement is made using the delayed
window as the cycle. Figure 2-10 shows how to use delayed sweep to isolate
a pulse for an rms measurement.
Vrms
softkey.
Delayed sw eep isolates an area of interest for an rms voltage measure m ent
2–21
Page 52

Operating Your Oscilloscope
To make voltage measurements automatically
4
Press the
Another voltage measurement softkey menu appears with six additional
choices. Four of the softkeys are voltage measurement functions.
Show Meas
cursors that show where the measurement was taken on the signal.
Voltage Measurements
available:
Previous Menu
Next Menu
(show measurement) Displays the horizontal and vertical
Vmax, Vmin, Vtop, Vbase
Returns to the previous softkey menu.
softkey.
Four additional voltage measurement choices are
.
2–22
Page 53

Operating You r Oscilloscope
To make curso r m easurements
To make cursor measurements
The following steps guide you through the front-panel Cursors key. You can
use the cursors to make custom voltage or time measurements on the signal.
Examples of custom measurements include rise time measurements from
reference levels other than 10-90%, frequency and width measurements from
levels other than 50%, channel-to-channel delay measurements, and voltage
measurements. See figures 2-11 through 2-16 for examples of custom
measurements.
1
Connect a signal to the oscilloscope and obtain a stable display.
Press
Cursor s
A softkey menu appears with six softkey choices. Four of the softkeys are
cursor functions.
Source
Selects a channel for the voltage cursor measurements.
Active Cursor
cursors, while t1, and t2 are time cursors. Use the knob below
Cursor s
the
softkeys simultaneously, both voltage cursors are selected and the
voltage cursors move together. When you press the t1 and t2 softkeys
simultaneously, both time cursors are selected and the time cursors
move together.
Clear Cursors
display.
.
There are four cursor choices: V1, and V2 are voltage
key to move the cursors. When you press the V1 and
Erases the cursor readings and removes the cursors from the
2
V2
Toggling the Cursor key to sele ct active cursor
If you toggle the front-panel Cursor key, the active cursor will be toggled. For
example, if V1 is selected, pressing the Cursor key will select V2. Pressing t he
cursor key again will select V1.
2–23
Page 54

Figure 2-11
Operating Your Oscilloscope
To make curs or m easurements
Cursors used to measure pulse wid th at l evels other then the 50% points
Figure 2-12
Cursors used to measure the frequenc y of the ringing on a pulse
2–24
Page 55

Figure 2-13
Operating You r Oscilloscope
To make curso r m easurements
Cursors used to make channel-to-channel delay meas ure m ents
Figure 2- 14
The cursors tr ack delayed sweep . Exp and t he di splay with delayed sweep, then characterize
the event of interest with the cursors.
2–25
Page 56

Figure 2-15
Operating Your Oscilloscope
To make curs or m easurements
Pressing t1 and t2 softkeys si m ul t aneously causes the time cursors to mov e together when the
cursor knob is adjusted.
Figure 2-16
By moving the time cursors together, you can check f or pul se width variati ons in a pulse train, as
figures 2- 15 and 2-16 show .
2–26
Page 57

Operating You r Oscilloscope
To remove ca bli ng errors from time interval measurements
To remove cabling errors from time interval
measurements
When measuring time intervals in the nanosecond range, small differences in
cable length can totally obscure the measurement. The following exercise
shows how to remove errors that different cable lengths or characteristics
introduce to your measurement. The Skew control makes it possible to
remove this offset error from your measurement.
This process is also referred to as deskewing.
1
Select Time Reference to Center, with the Graticule turned on.
2
Connect the channels to be nulled to a common test point and obtain
a stable display. A fast edge is a good choice.
Press
Print/ Ut il it y
Self Cal Menu
the
, then select the
softkey. This gives you access to the calibration
3
and skew adjustments.
4
Select
Skew 1 > 2
to adjust channel 2 with respect to channel 1. Rotate
the knob to bring the channels into time alignment. This nullifies the
cable delay.
Service Menu
softkey, then
This adjustm ent is not affected by pressing Autoscale. If the d efault setup is
selected or default calibration factors are loaded , the skew value will return to
zero seconds.
2–27
Page 58

Figure 2-17
Operating Your Oscilloscope
To view asynchronous noise on a signal
To view asynchronous noise on a signal
The following exercise shows how to use the oscilloscope to view
asynchronous noise on a signal that is not synchronous to the period of the
waveform.
1
Connect a noisy signal to the oscilloscope and obtain a stable display.
Figure 2-17 shows a waveform with asynchronous noise at the top of the
pulse.
Asynchronous noise at the top of t he pul se
2–28
Page 59

Operating You r Oscilloscope
To view asynchronous noise on a signal
Figure 2-18
Press
Autost or e
Notice that
Set the
region of the signal.
STORE
Trigger Mode
.
is displayed in the status line.
Normal
to
, then adjust the trigger level into the noise
Decrease the sweep speed for better resolution of the asynchronous
2
3
4
noise.
To characterize the asynchronous noise signal, use the cursors.
•
This is a trig gered view of the as ynchronous noise shown in figure 2-17.
2–29
Page 60

Figure 2-19
3 dB down point
Operating Your Oscilloscope
To reduce the random noise on a signal
To reduce the random noise on a signal
If the signal you are applying to the oscilloscope is noisy (figure 2-21), you
can set up the oscilloscope to reduce the noise on the waveform (figure
2-22). First, you stabilize the displayed waveform by removing the noise
from the trigger path. Second, you reduce the noise on the displayed
waveform.
1
Connect a noisy signal to the oscilloscope and press
Autosc al e
2
Obtain a stable display by removing the noise from trigger path;
Slope/ Coupli ng
press
or the
High frequency reject (
50 kHz (see figure 2-19). You use HF reject to remove high frequency noise
such as AM or FM broadcast stations from the trigger path.
0 dB
HF Reject
.
softkey.
, then select either the
HF Reject
) adds a low pass filter with the 3 dB point at
LF Reject
softkey
Pass
dc
Band
HF reject (trigger path)
2–30
50 kHz
Page 61

Operating You r Oscilloscope
To reduce the random noise on a signal
Figure 2-20
3 dB down point
Figure 2-21
Low frequency reject (
LF Reject
) adds a high pass filter with the 3-dB point at
50 kHz (see figure 2-20). Use LF reject to remove low frequency signals such
as power line noise from the trigger path.
0 dB
Pass
Band
dc
LF reject (t ri gger path)
50 kHz
Noise reject increases the trigger hysteresis band. By increasing the trigger
hysteresis band you reduce the possibility of triggering on noise. However,
this also decreases the trigger sensitivity so that a slightly larger signal is
required to trigger the oscilloscope.
Random nois e on t he di splayed waveform
2–31
Page 62

Figure 2-22
Operating Your Oscilloscope
To reduce the random noise on a signal
3
Use averaging to reduce noise on the displayed waveform.
To use averaging follow these steps.
Displa y
Press
•
Notice that Av appears in the status line.
Toggle the
•
eliminates the noise from the displayed waveform.
The Av letters in the status line indicate how much of the averaging
process is finished by turning to inverse video as the oscilloscope
performs averaging. The higher the number of averages, the more
noise that is removed from the display. However, the higher the
number of averages, the slower the displayed waveform responds to
waveform changes. You need to choose between how quickly the
waveform responds to changes and how much noise there is on the
signal.
# Averag e
, the press the
softkey to select the number of averages that best
Average
softkey.
On this waveform, 256 averages were used to redu ce t he noise
2–32
Page 63

Operating You r Oscilloscope
To save or recall traces
To save or recall traces
The oscilloscope has two pixel memories for storing waveforms. The
following exercise guides you through how to store and recall waveforms
from pixel memories.
1
Connect a signal to the oscilloscope and obtain a stable display.
2
Press
A softkey menu appears with five softkey selections. Four of the softkeys are
trace memory functions.
Trace
Trace Mem
Save to
is saved to a separate memory location.
Clear
Recall Setup
waveform.
3
Toggle the
4
Press the
The current display is copied to the selected memory.
5
Turn on the
The trace is copied from the selected trace memory and is displayed in half
bright video.
Trace
Selects memory 1 or memory 2.
Saves the waveform to the selected memory. The front-panel setup
Erases the selected memory.
.
Turns on or off the selected memory.
Recalls the front-panel setup that was saved with the
Trace
softkey to select memory 1 or memory 2.
Save to
softkey.
Trace Mem
softkey to view the stored waveform.
2–33
Page 64

Operating Your Oscilloscope
To save or recall front-panel setups
The automatic measurement functions do not operate on stored traces.
Remember, the stored waveforms are pictorial information rather than stored
data.
If you have not changed the oscilloscope setup, use the cursors to make
•
the measurements.
If you have changed the oscilloscope setup, press the
•
Then,use the cursors to make the measurements.
Trace memory operating hint
The standard oscilloscope has volatile trace memories. When you add an
interface module to the os cillos cope, the trace memories become nonvolatile.
Recall Setup
softkey.
To save or recall front-panel setups
There are 16 memories for storing front-panel setups. Saving front-panel
setups can save you time in situations where several setups are repeated
many times.
1
Press
2
To change the selected memory location, press either the left-most
softkey or turn the knob closest to the Cursors key.
3
Press the
softkey to recall a front-panel setup.
2–34
Setup
Save
.
softkey to save a front-panel setup, then press the
Recall
Page 65

Operating You r Oscilloscope
To reset the instrument setup
To reset the instrument setup
1
To reset the instrument to the default factory-preset configuration,
Setup
press
.
2
Press the
3
To reset the instrument to the configuration that was present before
pressing
Default Setup
Autoscale
, press the
softkey.
Undo Autoscale
softkey.
Table 2-1
Default Setup configuration set ti ngs
Configuration Item Setting
Cursors Cursors off; tim e r eadout is selected; all cursors are set to time/voltage zero.
Trace memories Both trace mem or y 1 and 2 are off; trace 1 mem ory is selected.
Setup memories Setup memories are off; setup memory 1 is selected.
Graticule Grid set to Full
Autostore Off
Time base Time referen ce center; main, not del ayed sweep; main and del ay value 0; 100 µs/div
main time base; sample rate is 5 MSa/s.
Display Vectors On, Display Mode Normal.
Channels Cha nnel 1 on, Position 0 V, Volts/Div 100 mV .
Trigger Mode Auto Level, Coupling DC, Reject Off, Noise Reject Off.
Trigger Condit i on Rising edge of channel 1
See Also
"To Clear Error Messages" in the troubleshooting section of Service
chapter 4.
2–35
Page 66

Operating Your Oscilloscope
To use the XY dis play mode
To use the XY display mode
The XY display mode converts the oscilloscope from a volts versus time
display to a volts versus volts display. You can use various transducers so the
display could show strain versus displacement, flow versus pressure, volts
versus current, or voltage versus frequency. This exercise shows a common
use of the XY display mode by measuring the phase shift between two signals
of the same frequency with the Lissajous method.
1
Connect a signal to channel 1, and a signal of the same frequency but
out of phase to channel 2.
2
Press
Autosc al e
, press
softkey.
3
Center the signal on the display with the Position knobs, and use the
Volts/Div knobs and the vertical
for convenient viewing.
A
sin θ =
C
or
, where θ = phase shift (in degrees) between the two signals.
B
D
Main/D el ay ed
Vernier
softkeys to expand the signal
, then press the
XY
Figure 2-23
2–36
Page 67

Operating You r Oscilloscope
To use the XY dis play mode
XY display mode operating hint
Before entering xy display m ode, center both channels on screen in the main
sweep and adjust sweep speed to obtain greater t han or equal to 1 cycle of the
lowest frequency input signal on screen.
When you sel ect the XY display m ode, the time bas e i s turned off. Channel 1 is
the X-axis i nput, channel 2 is the Y-axis input.
Figure 2-24
Press
Cursor s
.
Set the Y2 cursor to the top of the signal, and set Y1 to the bottom of
4
5
the signal.
Note the ∆Y value at the bottom of the display. In this example we are using
the Y cursors, but you could have used the X cursors instead. If you use the
X cursors, make sure you center the signal in the Y axis.
2–37
Page 68
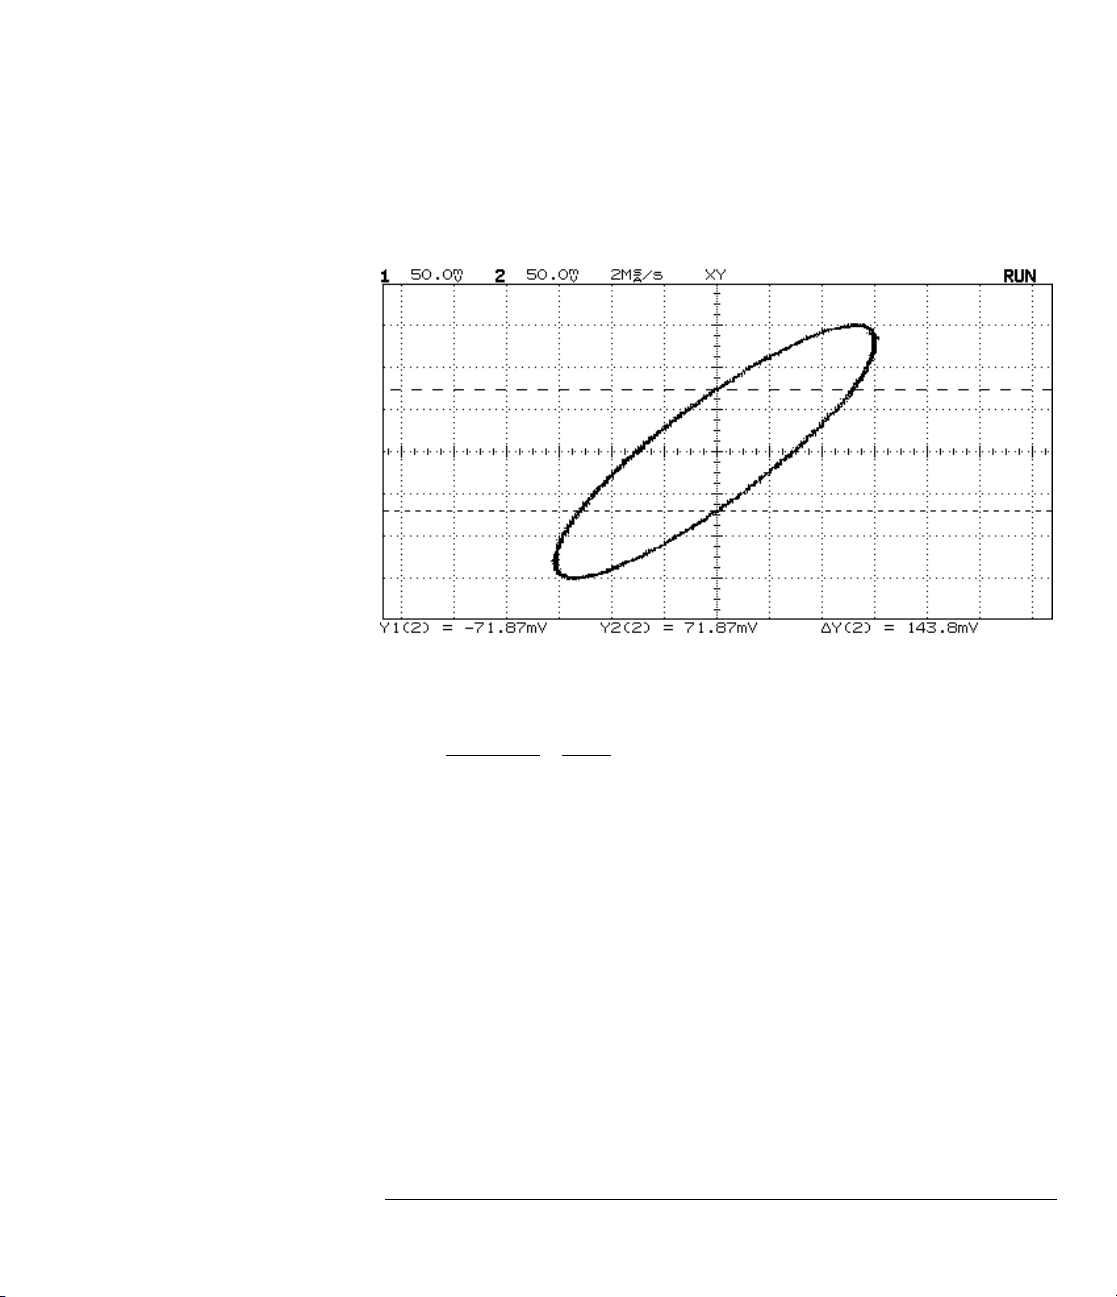
Figure 2-25
Operating Your Oscilloscope
To use the XY dis play mode
6
Move the Y1 and Y2 cursors to the center of the signal.
Again, note the ∆Y value.
7
Calculate the phase difference using formula below.
sin θ =
2–38
second
first
28.64 degrees of phase shift
θ
=
Y
∆
143.8
=
300.0
Y
∆
Page 69

Figure 2-26
Operating You r Oscilloscope
To use the XY dis play mode
Figure 2-27
Signals are 90° ou t of phase
Signals are in phase
2–39
Page 70

Operating Your Oscilloscope
To analyze vi d e o wave fo rms
To analyze video waveforms
Enhanced TV/Vi deo Trigger
This section di scusses basic TV video triggering. If you hav e Option 005
Enhanced TV/Video Tr igger installed in your oscilloscope, refer to Chapter 3
"Using Option 005 Enhanced TV/Video Tri gger."
The TV sync separator in the oscilloscope has an internal clamp circuit. This
removes the need for external clamping when you are viewing unclamped
video signals. TV triggering requires two vertical divisions of display, either
channel 1 or channel 2 as the trigger source, and the selection of internal
trigger. Turning the trigger level knob in TV trigger does not change the
trigger level because the trigger level is automatically set to the sync pulse
tips.
For this exercise connect the oscilloscope to the video output terminals on a
television. Then set up the oscilloscope to trigger on the start of Field 2. Use
the delayed sweep to window in on the vertical interval test signals (VITS),
which are in Line 18 for most video standards (NTSC, PAL, SECAM).
1
Connect a TV signal to channel 1, then press
Autosc al e
.
2
3
4
Press
Press
Press
Polarity
Field 1
Field 2
Line
HF Rej
2–40
Displa y
Mode
Slope/ Co up li ng
Selects either positive or negative sync pulses.
Triggers on the field 1 portion of the video signal.
Triggers on the field 2 portion of the video signal.
Triggers on all the TV line sync pulses.
Controls a 500 kHz low pass filter in the trigger path.
, then press the
, then press the
, then press the
Peak Det
TV
softkey.
softkey.
Field 2
softkey.
Page 71

Figure 2-28
Operating You r Oscilloscope
To analyze video waveforms
5
Set the time base to 200 µs/div, then center the signal on the display
with the delay knob (delay about 800 µs).
Press
Main/D el ay ed
, then press the
Set the delayed sweep to 20 µs/div, then set the expanded portion
6
7
Delayed
softkey.
over the VITS (delay about 920 µs, dependent on broadcast channel).
Frame 2 windowed on the VITS in Line 18
2–41
Page 72

Delay in TV line units hint
The oscilloscope has the ability to display delay in TV-line units. Using the TV
field trigger mode activates this line-counting feature. When Field 1 or Field 2 is
selected as t he trigger source, del ay can be set in t erm s of time or line number.
Both-fields triggering in the oscilloscope hint
The oscilloscope can trigger on the vertical s yn c puls e in
same time. Thi s allows you to view noninterlaced video sig nal s which are
common in computer monitors. To trigger on both sync pulses, press Field 1 and
Field 2 at the s am e time.
TV trigger operating hints
The color burs t changes phase b etween odd (Field s 1 and 3) and even (F i el ds 2
and 4). It look s double-trigge red. Increase the ho l doff to greater than t he frame
width to fine tune your trigger stability. For example, use a holdoff value of
around 63 ms for N TSC, and around 76 ms for PAL.
When looking at live video (usually a field) , use peak detect to im prove the
appearance of the display.
When making cursor measurem ents, use Autost ore since you are usually
looking for p ul se flatness and extremes.
When using li ne trigger, use minimum holdoff to display all t he l i nes. Due to the
relationship between the horiz ontal and vertical sync frequenc i es the display
looks like i t is untriggered, but it is very usef ul for TV waveform a nal ysis and
adjustment because all of the l i nes are displayed.
both TV fields at the
2–42
Page 73

3
Using Option 005 Enhanced
TV/Video Trigger
Page 74

Using Option 005 Enhanced
TV/Video Trigger
Basic T V/video trigg e r ing
This section di scusses Enhanced TV/Video triggering. If you do not have Opti on
005 installed in your oscilloscope, refer to the last section in Chapter 2 "To
analyze video waveforms" for basic TV trigg eri ng procedures.
You can use the Option 005 Enhanced TV/Video trigger with your
oscilloscope. One of the first things you will want to do with your
oscilloscope’s new Option 005 Enhanced TV/Video trigger is to
become acquainted with its menu choices. Therefore, we have
written the exercises in this chapter to familiarize you with its basic
controls.
To use the TV/Video trigger, you must be familiar with your
oscilloscope. In summary, the front panel of the oscilloscope has
knobs, grey keys, and white keys. The knobs are used most often and
are similar to the knobs on other oscilloscopes. The grey keys bring
up softkey menus on the display that allow you access to many of the
oscilloscope features. The white keys are instant action keys and
menus are not associated with them. The status line of the
oscilloscope, located at the top of of the display, lets you quickly
determine the setup of the oscilloscope.
When Option 005 is installed in your oscilloscope, the
menu has the extra
Use NTSC Inst ead of PAL-M
To trigger on a PAL-M signal, use NTSC. The line and field rates are identical.
3–2
Grid
(graticule) choice of TV.
Displa y
Page 75

Using Option 005 Enhanced TV/Video Trigger
Option 005 gives you an Enhanced TV/Video Trigger for the
oscilloscope, allowing highly detailed analysis of TV waveforms. This
option offers:
• NTSC, PAL, PAL-M, SECAM and generic video formats
• Video autoscale
• IRE graticule and IRE cursor readout
• Full bandwidth rear panel output
• Trigger output
• Windowed FFT measurements (with Measurement/Storage module)
Now, in one easy-to-use instrument, you can measure your system’s
video performance as well as use your oscilloscope for troubleshooting
and precision measurements. The oscilloscope’s superior display gives
you bright, easily viewed displays of any part of the video waveform.
No longer do you need to use a viewing hood or to be constantly
adjusting intensity and focus controls.
Analysis of video waveforms is simplified by the oscilloscope’s ability
to trigger on any selected line of the video signal. You can make
additional measurements using the
Vertical
(
you can use the rear-panel, full-bandwidth signal and trigger outputs with a
spectrum instrument or frequency counter for additional measurement
power.
mode in
GENERIC
standard), or
All lines, Fie ld 1, Fi e ld 2, All fields
Line
triggering modes. In addition,
3–3
Page 76

Using Option 005 Enhanced TV /Video Trigger
To select TV di splay grid
To select TV display grid
•
Press
Displa y
, then press the
Grid
softkey until TV is selected.
To autoscale on a video signal
1
Use a cable to connect a TV signal to channel 1.
2
Press
select the
3
To select a TV standard, press
section of the front panel, then press the
the TV standard. Your cho
GENERIC
has been previously selected, you may skip this step.
4
Press
Mode
in the
TRIGGER
Trigger Mode TV
section of the front panel, and
softkey.
Slope/ Coupli ng
Standard
PAL, SECAM
NTSC
ices are
,
in the
softkey to select
, and
is used for other TV/Video standards. If your TV standard
Use NTSC Inst ead of PAL-M
To trigger on a PAL-M signal, use NTSC. The line and field rates are identical.
Mode
Provide correct source matchi ng
, then press the
Video Autos cale
softkey.
TRIGGER
GENERIC
.
Many TV sig nal s are produced from 75Ω sources. To provide corre ct matching
to these sources, an HP 11094B 75Ω load is included as an acces sory. For
oscilloscopes that ha ve selectable input impeda nce, t he 1 MΩ input should be
used with the 75Ω load.
Undo Autoscale
The
to the configuration that was present before pressing
3–4
softkey in the
Setup
menu resets the instrument
Video Autosc ale
.
Page 77

Using Option 005 Enhanced TV/Video Trigger
To trigger on a s pecific line of video
To trigger on a specific line of video
TV triggering requires greater than 1/4 division of sync amplitude, either
channel 1 or channel 2 as the trigger source. Turning the trigger level knob
in TV trigger does not change the trigger level because the trigger level is
automatically set to the sync pulse tips.
One example of triggering on a specific line of video is looking at the vertical
interval test signals (VITS), which are typically in line 18. Another example
is closed captioning, which is typically in line 21.
1
Select the TV display, TV as the trigger mode, and the appropriate
TV standard.
2
Press
panel, then press the
number of the line you want to examine by pressing the
Line
Slope/ Coupli ng
in the
Mode
softkey until
TRIGGER
Line
section of the front
appears. Select the
softkey or by rotating the knob closest to the
Trigger On
Cursor s
key.
3
Press the
to trigger on. Your choices are
Trigger On
softkey to select the TV field of the line you want
Field 1, Field 2
, and
Alt Fld
(alternate
fields).
Alternate trig gering
If Alt Fld is selected, t he oscilloscope will alternately trigger on the selected lin e
number in Fiel d 1 and Field 2. Thi s is a quick way to compare the F i el d 1 VITS
and Field 2 VI TS or to check for the correct insertion of the half lin e at the end of
Field 1.
When using
choices of
GENERIC
Field 1, Field 2
as the TV standard, the
and
Vertical
.
Trigger On
softkey gives you the
3–5
Page 78

Figure 3-1
Using Option 005 Enhanced TV /Video Trigger
To trigger on a s pecific line of video
Triggering on Line 71
Table 3-1 L ine Numbers per Field for Each TV Standard
TV Standard Field 1 Field 2 Alt Fld
NTSC 1 to 263 1 to 262 1 to 26 2
PAL 1 to 313 314 t o 625 1 to 313
SECAM 1 to 313 314 to 625 1 to 313
GENERIC 1 to 1024 1 to 1024 1 to 1024 (Vertical)
Line Number R epresents Count
In GENERIC mode, the line number represents the number of a count instead of
a real line nu m ber. This is refle cted in the label above the softkey changing from
Line to Cnt. In the Trigger On selections, Fiel d 1, Field 2 and Vertical are used to
indicate where the counting st arts. For an interlaced TV syste m , the counting
starts from the rising edge of the first vertical serration pulse of Field 1 and/o r
Field 2. Fo r a non-interlaced TV system, the counting starts aft er the rising edg e
of the vertica l sy nc pulse.
3–6
Page 79

Using Option 005 Enhanced TV/Video Trigger
To trigger on al l TV line sync puls es
To trigger on all TV line sync pulses
To quickly find maximum video levels, you could trigger on all TV line sync
pulses. When All Lines is selected as the TV trigger mode, the oscilloscope
will trigger on the first line that it finds when the acquisition starts.
1
Select the TV display, TV as the trigger mode, and the appropriate TV
standard as described in the previous section, "To autoscale on a
video signal."
2
Press
panel, then press the
Slope/ Coupli ng
Vertical interval can be blocked
The 21 lines i n the Vertical In terval can be bloc ked from this display if the Vert
Rej On mode is select ed. The three color sy nc bursts being displayed insi de the
white bars ar e on vertical inte rval lines. Thes e could be removed by selection of
Vert Rej On.
in the
Mode
softkey until
TRIGGER
All Lines
section of the front
appears.
Figure 3-2
Triggering on All Lines
3–7
Page 80

Figure 3-3
Using Option 005 Enhanced TV /Video Trigger
To trigger on a s pecific field of the v ideo signal
To trigger on a specific field of the video signal
To examine the components of a video signal, trigger on either Field 1 or
Field 2. When a specific field is selected, the oscilloscope triggers on the
rising edge of the first serration pulse in the vertical sync interval in the
specified field (1 or 2).
1
Select the TV display, TV as the trigger mode, and the appropriate
TV standard as described in the section, “To autoscale on a video
signal.”
2
Press
panel, then press the
Slope/ Coupli ng
Mode
in the
TRIGGER
softkey until
section of the front
Field 1
or
Field 2
appears.
Triggering on Fi el d 1
3–8
Equalizing pulses
Serration pul ses
Page 81

Figure 3-4
Using Option 005 Enhanced TV/Video Trigger
To trigger on all fields of the video signal
To trigger on all fields of the video signal
To quickly and easily view transitions between fields, or to find the amplitude
differences between the fields, use the All Fields trigger. The oscilloscope
will trigger on the first field it finds at the start of acquisition.
1
Select the TV display, TV as the trigger mode, and the appropriate TV
standard as described in the section, "To autoscale on a video signal."
2
Press
panel, then press the
Slope/ Coupli ng
Mode
in the
TRIGGER
softkey until
section of the front
All Fields
appears.
Triggering on A ll Fields
3–9
Page 82

Using Option 005 Enhanced TV /Video Trigger
To trigger on odd or even fields
To trigger on odd or even fields
To check the envelope of your video signals, or to measure worst case
distortion, trigger on the odd or even fields. When Field 1 is selected, the
oscilloscope triggers on color fields 1 or 3. When Field 2 is selected, the
oscilloscope triggers on color fields 2 or 4.
1
Select the TV display, TV as the trigger mode, and the appropriate TV
standard as described in the section, "To autoscale on a video signal."
2
Press
panel, then press the
The trigger circuits look for the position of the start of Vertical Sync to
determine the field. But this definition of field does not take into
consideration the phase of the reference subcarrier. When Field 1 is selected,
the trigger system will find any field where the vertical sync starts on Line 4.
In the case of NTSC video, the oscilloscope will trigger on color field 1
alternating with color field 3 (see the following figure). This setup can be
used to measure the envelope of the reference burst.
Slope/ Coupli ng
Mode
in the
TRIGGER
softkey until
section of the front
Field 1
or
Field 2
appears.
Figure 3-5
Triggering on Col or Field 1 Alternating with Color F ield 3
3–10
Page 83

Using Option 005 Enhanced TV/Video Trigger
To trigger on odd or even fields
If a more detailed analysis is required, then only one color field should be
selected to be the trigger. You can do this by using the oscilloscope’s holdoff
control. Using the holdoff settings shown in the following table, the
oscilloscope will now trigger on color field 1 OR color field 3 when Field 1 is
selected. This is known as odd field selection. Even fields will be selected
with Field 2.
Table 3-2
Figure 3-6
Holdoff Settings
Video Standard Fields/Picture Holdoff Range
NTSC 4 33.5 ms to 50.0 ms
PAL 8 80.7 ms to 120 ms
SECAM 4 40.4 ms to 60 ms
PAL-M 8 80.4 ms to 120 ms
The holdoff can be more easily set if the sweep speed is set to 5 ms/div. Once
you have established your desired holdoff time, return to the desired time
base setting. The holdoff setting will remain unchanged.
Triggering on Col or Field 1 using Hol doff
3–11
Page 84

Using Option 005 Enhanced TV /Video Trigger
To make curs or m easurements
To make cursor measurements
The following steps guide you through the front-panel Cursors key. You can
use the cursors to make custom voltage or time measurements on the signal.
Examples of custom measurements include rise time measurements from
reference levels other than 10-90%, frequency and width measurements from
levels other than 50%, channel-to-channel delay measurements, and voltage
measurements. With Option 005 in your oscilloscope, the cursors can also be
calibrated in IRE units.
1
Connect a video signal to the oscilloscope and obtain a stable display.
2
Press
Displa y
, then press the
Grid
softkey to select
TV
.
3
Press
4
Press
A softkey menu appears with six softkey choices. Four of the softkeys are
cursor functions.
Source
calibrated to the Volts/div of the selected channel.
Active Cursor
cursors, t1 and t2 are time cursors. Use the knob below the
press the V1 and V2 softkeys simultaneously or press the t1 and t
softkeys simultaneously.
Clear Cursors
display.
Mode
Cursor s
Selects a channel for the voltage cursor measurements. The cursor is
Cursor s
TV graticule
With the TV grat i cul e ON, the voltage cursors are c al i brated in IRE unit s.
With the TV grat i cul e OFF, the vol tage cursors are cal i brated in volts.
IRE units onl y make sense if the video signal is scaled properl y, such as after a
video autoscale.
, then press the
.
There are four cursor choices: V1 and V2 are voltage
key to move the cursors. To move the cursors together,
Erases the cursor readings and removes the cursors from the
Video Autos cale
softkey.
2
3–12
Page 85

Figure 3-7
Using Option 005 Enhanced TV/Video Trigger
To make curso r m easurements
Color Sync measured with the cursors as 40 IRE
3–13
Page 86

Using Option 005 Enhanced TV/Video Trigger
To use delayed sweep
To use delayed sweep
Delayed sweep is a magnified portion of the main sweep. You can use
delayed sweep to locate and horizontally expand part of the main sweep for a
more detailed (high resolution) analysis of signals, for example multi-burst
frequencies. The following steps show you how to use delayed sweep.
Notice that the steps are very similar to operating the delayed sweep in
analog oscilloscopes.
1
Connect a signal to the oscilloscope and obtain a stable display.
2
Press
Main/Delayed
.
3
Press the
The screen divides in half. The top half displays the main sweep, and the
bottom half displays an expanded portion of the main sweep. This expanded
portion of the main sweep is called the delayed sweep. The top half also has
two solid vertical lines called markers. These markers show what portion of
the main sweep is expanded in the lower half. The size and position of the
delayed sweep are controlled by the Time/Div and Delay knobs. The
Time/Div next to the symbol is the delayed sweep sec/div. The delay
value is displayed for a short time at the bottom of the display.
To display the delay value of the delayed time base, either
•
press
To change the main sweep Time/Div, you must turn off the delayed sweep.
•
Since both the main and delayed sweeps are displayed, there are half as
many vertical divisions so the vertical scaling is doubled. Notice the changes
in the status line.
To display the delay time of the delayed sweep, either press
•
Main/Delayed
displayed near the bottom of the screen.
If the TV graticule is selected, notice that it is presented in both main and
delayed sweeps. For more information on delayed sweep operation, refer to
"To use delayed sweep" in Chapter 2.
Automatic measurements are controlled by the delayed sweep shown in the
following two figures.
Delayed
Main/Delayed
softkey.
or turn the delay knob. The delay value is
or turn the Delay knob.
3–14
Page 87

Figure 3-8
Using Option 005 Enhanced TV/Video Trigger
To use delay ed sweep
Modulated st aircase or 5-step, m easuring sync pul se fall time with delayed sweep
Figure 3-9
Windowed frequency measurement in a multi-burst by use of delayed sweep
3–15
Page 88

Using Option 005 Enhanced TV /Video Trigger
To analyze vi d e o wave fo rms wi th Option 005
To analyze video waveforms with Option 005
The combination of the TV trigger, delayed sweep, and automatic
measurements allow this oscilloscope to precisely analyze video waveforms.
There is no need for external clamping to obtain a stable trigger when you
are viewing unclamped video signals. This is because the TV sync separator
in the oscilloscope has an internal clamp circuit in the trigger path. Because
there is no clamp in the vertical path of your oscilloscope, you will be able to
observe any DC level shifts in the video on the oscilloscope display. To
eliminate this position shifting as the DC component of the video changes,
select AC coupling.
For this exercise, we connect the oscilloscope to the video output terminals
on a television. We set up the oscilloscope to view the second vertical
interval with delayed sweep windowed on the vertical interval test signals
(VITS). Then we make windowed measurements with the delayed sweep.
1
Connect a TV signal to channel 1, and select channel 1 as your trigger
source.
2
Press
panel, then press the
3
Select the desired TV
Slope/ Co up li ng
TV
Standard
in the
softkey.
, such as
TRIGGER
NTSC, PAL
section of the front
, or
SECAM
.
Use NTSC inst ead of PAL-M
To trigger on a PAL-M signal, use NTSC. The line and field rates are identical.
4
Press
3–16
Mode
, then press the
Video Autos cale
softkey.
Page 89
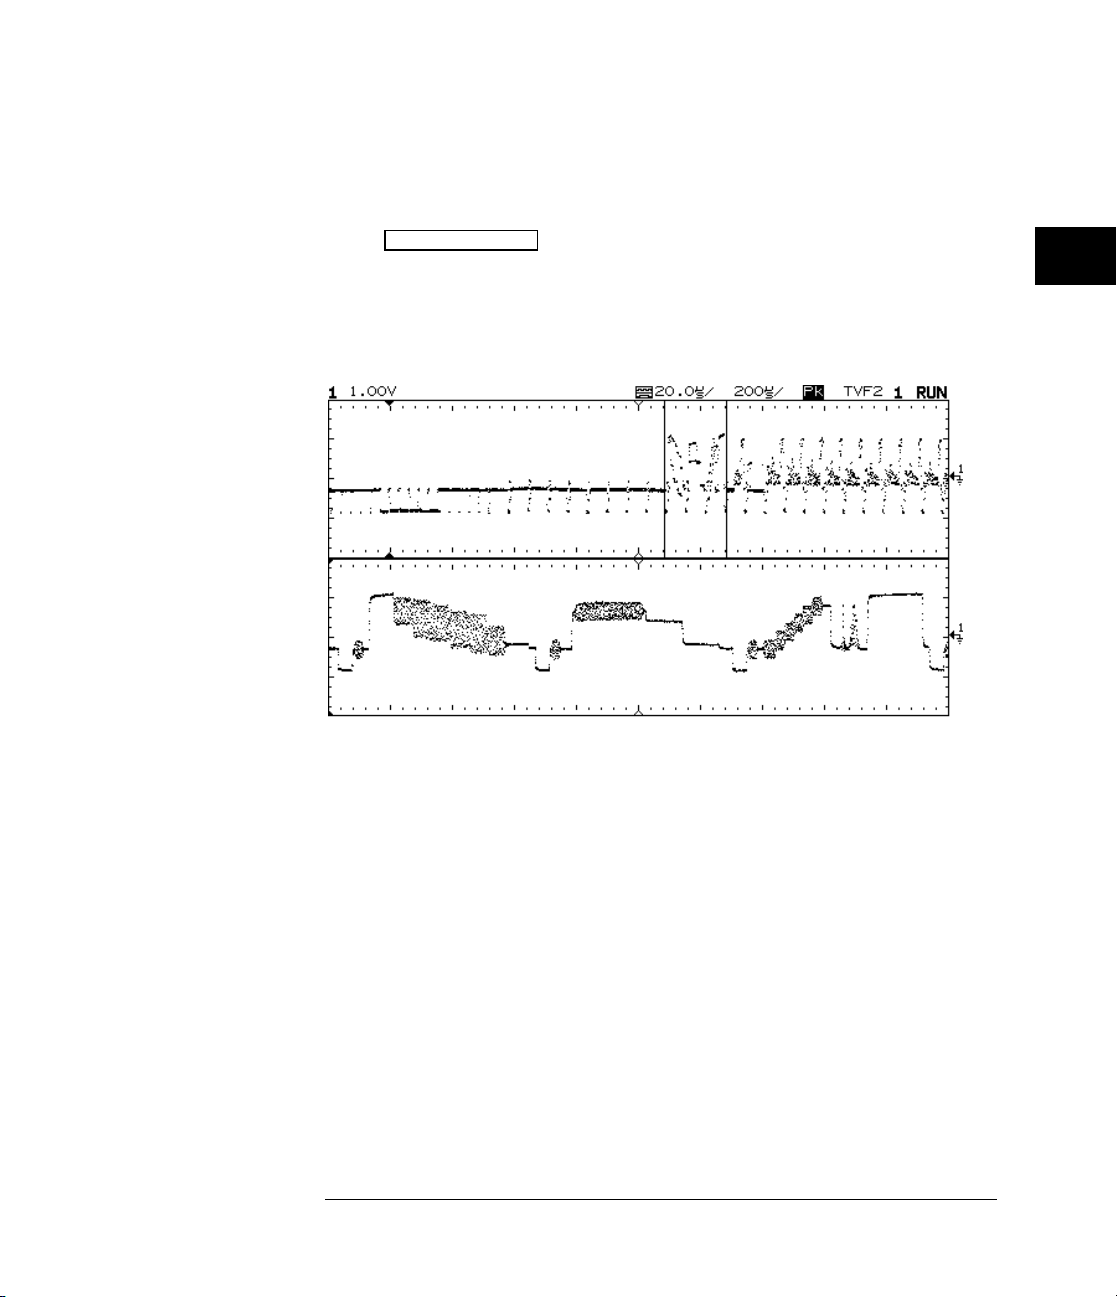
Figure 3-10
This figure shows the
second ve rt i cal
interval test signals
displayed with delayed
sweep.
Using Option 005 Enhanced TV/Video Trigger
To analyze video waveforms with Option 00 5
5
Set the time base to 200 µs/div, then center the signal on the display
with the delay knob (delay about 800 µs).
Press
Main/D el ay ed
, then press the
Set the delayed sweep to 20 µs/div, then set the expanded portion
6
7
Delayed
softkey.
over the VITS (delay about 988.8 µs).
Second VITS Dis pl ayed
3–17
Page 90

Figure 3-11
Using Option 005 Enhanced TV /Video Trigger
To window in on harmonic disto rti on using FFT
To window in on harmonic distortion using FFT
Sine waves that are not perfectly shaped in the time domain generate
harmonics in the frequency domain. Viewing this distortion in the time
domain is usually very difficult, unless the waveform is severely distorted.
However, in the frequency domain, these harmonics are very apparent. Your
oscilloscope, when used with the HP 54657A, HP 54658A, or HP 54659B
Measurement/Storage module, have the ability to perform frequency domain
analysis on a time domain waveform using the Fast Fourier Transform (FFT).
A special case of measuring the harmonic distortion in a sine wave is found in
video applications. The 3.58 MHz color-subcarrier frequency embedded in an
NTSC composite video signal has some amount of harmonic distortion
associated with the subcarrier frequency. To measure just this signal, the
scope’s time/division and delay controls are used to zoom in on the color
burst in the time domain.
The scope contr ols are used to zoom in on t he color burst in the tim e domain
3–18
Page 91

Figure 3-12
Using Option 005 Enhanced TV/Video Trigger
To window in on harmonic distortion using FFT
The FFT function then shows the harmonic content of the subcarrier in the
figure below. Had the time/division and delays controls not been used to
zoom in on the desired subcarrier, the entire video signal (with many
frequency components) would have appeared in the frequency domain
display. These frequency components would have obscured the color
subcarrier and its harmonics. This example illustrates a general technique of
using the time domain controls of the scope to select specific time intervals
for FFT analysis.
The FFT funct io n shows that the har m oni c content of the color busrt is more than 31 dB bel ow the
subcarrier
3–19
Page 92

Using Option 005 Enhanced TV /Video Trigger
To connect to ot her instruments
To connect to other instruments
The rear panel outputs provide an easy way to connect your Option
005-equipped oscilloscope to other instruments such as spectrum analyzers
or frequency counters. To use a frequency counter:
1
Connect the vertical output of the oscilloscope to the counter’s input.
2
Connect the frequency to be measured to channel 1.
3
Press
channel 1. Adjust the counter as required.
The amplitude of the vertical output signal is proportional to the amplitude as
displayed on the oscilloscope.
The trigger source selection is the control that determines which channel’s
signal is present at the vertical output (
the oscilloscope.
Autosc ale
, then select the trigger source to be
VERT OUT
) connector on the rear of
3–20
Page 93

4
Verifying Oscilloscope Performance 4–5
Adjusting the Oscilloscope 4–21
Troubleshooting the Oscilloscope 4–32
Replacing Parts in the Oscilloscope 4–45
Service
Page 94

Service
If the oscilloscope is under warranty, you must return it to
Hewlett-Packard for all service work covered by the warranty. See
"To return the oscilloscope to Hewlett-Packard," on page 4-4. If the
warranty period has expired, you can still return the oscilloscope to
Hewlett-Packard for all service work. Contact your nearest
Hewlett-Packard Sales Office for additional details on service work.
If the warranty period has expired and you decide to service the
oscilloscope yourself, the instructions in this chapter can help you
keep the oscilloscope operating at optimum performance.
This chapter is divided into the following four sections:
Verifying Oscilloscope Performance on page 4-5
•
Adjusting the Oscilloscope on page 4-21
•
Troubleshooting the Oscilloscope on page 4-32
•
Replacing Parts in the Oscilloscope on page 4-45. Service should be
•
performed by trained service personnel only. Some knowledge of
the operating controls is helpful, and you may find it helpful to read
chapter 1, "The Oscilloscope at a Glance."
4-2
Page 95

Table 4-1
Recommende d li st of test equipme nt t o service the osci ll oscope
Service
Equipment Critical sp eci fications Recommended Model/Part Use
Signal gene rator 1 to 500 MHz at 200 mV
HP 8656B Option 001 P
high stability timebase
Digital mul tim eter 0.1 mV res ol ution, better than 0 . 01%
HP 34401A P, A, T
accuracy
Oscilloscope 100 MHz, 1 MΩ input R HP 54600 P, T
Power meter and
1 to 500 MHz ±3% accuracy HP 436A and HP 8482A P
Power sensor
Power supply 14 mV to 35 Vdc, 0.1 mV resolution HP 6114A P
Pulse generator Rise time ≤ 700 ps HP 8131A A
Power splitter Outputs differ < 0.15 dB HP 11667B P
Shorting cap BNC HP 1250-0774 P
Time Mark
Stability 5 ppm after 30 minut es Tektronix TG501A and TM503 B P
Generator
Dummy load
2
Compatible with power supply see note 2 below A
Adapter SMA (f) to BNC (m) HP 1250-1787 A
Adapter BNC (f-f) HP 1250-0080 P, A
Adapter BNC tee (m) (f) (f) HP 1250-0781 P, A
Adapter N (m) to BNC (f), Qty 3 HP 1250-0780 P
Adapter BNC (f) to dual banana (m) HP 1251-2277 P
Adapter Type N (m) to BNC (m) HP 1251-0082 P
Cable BNC, Qty 3 HP 10503A P, A
Cable BNC, 9 inches, Qty 2 HP 10502A P, A
Cable Type N (m) 24 inch HP 11500B P
Adapter
3
BNC (m) to dual banana post HP 10110B P
1
1
P = Use for Performance Verif i cation.
A = Use for Adjustments.
T = Use for Troub l eshooting.
2
See page 4-33 to construct yo ur ow n dummy load.
3
Used fo r Option 005 on ly
4-3
Page 96

Service
To return the os cilloscope to He wl ett-Packard
To return the oscilloscope to Hewlett-Packard
Before shipping the oscilloscope to Hewlett-Packard, contact your nearest
Hewlett-Packard Sales Office for additional details.
1
Write the following information on a tag and attach it to the
oscilloscope.
Name and address of owner
•
Model number
•
Serial number
•
Description of service required or failure indications
•
2
Remove all accessories from the oscilloscope.
The accessories include the power cord, probes, cables, and any modules
attached to the rear of the oscilloscope. Do not ship accessories back to
Hewlett-Packard unless they are associated with the failure symptoms.
3
Protect the control panel with cardboard.
4
Pack the oscilloscope in styrofoam or other shock-absorbing material
and place it in a strong shipping container.
You can use either the original shipping containers, or order materials from
an HP Sales Office. Otherwise, pack the oscilloscope in 3 to 4 inches of
shock-absorbing material to prevent movement inside the shipping container.
5
Seal the shipping container securely.
6
Mark the shipping container as
FRAGILE
.
4-4
Page 97

Verifying Oscilloscope Performance
This section shows you how to verify the electrical performance of the
oscilloscope, using the performance characteristics in chapter 5 as the
standard. The characteristics checked are calibrator, voltage
measurement accuracy, bandwidth, horizontal accuracy, and trigger
sensitivity.
You should verify the performance of the oscilloscope when you first
receive it, and every 12 months or after 2,000 hours of operation.
Also, make sure you allow the oscilloscope to operate for at least 30
minutes before you begin the following procedures.
Perform self-calibration first
For the oscilloscope to meet all of the verifications tests in the ambient
temperature where it will be used, the self-calibration t es ts described on page
4-25 shoul d first be performed. Allow the unit to operate for at least 30 minute s
before performi ng the self-cali bration.
Each procedure lists the recommended equipment for the test. You
can use any equipment that meets the critical specifications.
However, the procedures are based on the recommended model or
part number.
On page 4-19 of this chapter is a test record for recording the test
results of each procedure. Use the test results to gauge the
performance of the oscilloscope over time.
4-5
Page 98

Service
Verifying Oscilloscope Performance
Table 4-2
To check the output of the
In this test you measure the output of the
a multimeter and an oscilloscope. The
self-calibration of the HP 54615B, HP 54616B, and HP 54616C. The accuracy
of the
CALIBRATOR
provide for accurate self-calibration.
The
CALIBRATOR
vertical calibration, and a square wave during delay calibration.
Test limits:
DC calibrator: 5.000 V ±10 mV and 0.000 V ± 500 µV
Delay calibrator: Vp-p = 900 mV ± 150 mV
Vavg = –450 mV ± 75 mV
Frequency = 2.46 kHz ± 100 Hz (HP 54615B/16B)
2.08 kHz
Equipment Re quired
Equipment Critical sp eci fications Recommende d
Digital Multimeter 0.1 mV resolution, better than 0.01% accuracy HP 34401A
Cable BNC HP 10503A
Oscilloscope 100 MHz, 1 MΩ input R HP 54600
is not specified, but it must be within the test limits to
output produces dc voltages between 0 and 5V during
CALIBRATOR
rear-panel CALIBRATOR
CALIBRATOR
±
100 Hz (HP 54616C)
is used for
output with
Model/Part
Connect a multimeter to the rear-panel
1
Press
2
Press the
3
DAC
The multimeter should measure 0.00 V dc ± 500 µV. If the result is not
within the test limits, see "Troubleshooting the oscilloscope," on page 4-32.
4-6
Print/ Utilit y
Service Menu
softkey.
.
softkey, then the
CALIBRATOR
Self T e st
connector.
softkey, and then the
Page 99

Verifying Oscilloscope Performance
Press any key once to advance the test.
4
The multimeter should read 5.000 V ± 10 mV. If the result is not within the
test limits, see "Troubleshooting the oscilloscope," on page 4-32.
Connect an oscilloscope to the rear-panel
5
Press any key once to advance the test.
6
Obtain a stable display on the oscilloscope.
7
Measure Vp--p, Vavg, and the frequency of the signal.
8
If the results are not within the Delay Calibrator test limits stated above, see
"Troubleshooting the oscilloscope," on page 4-32.
Press any key once to end this test.
9
CALIBRATOR
connector.
Service
4-7
Page 100

Service
Verifying Oscilloscope Performance
To verify voltage measurement accuracy
In this test you verify the voltage measurement accuracy by measuring the
output of a power supply using dual cursors on the oscilloscope, and
comparing the results with a multimeter.
Test limits: ±2.4% of full scale*
*
Full scale is defined as 56 mV on the 5 mV/div and 2 mV/div ranges. Full scale on all
other ranges is defined as 8 divisions times the V/div setting.
Table 4-3 Equipment Required
Equipment Critical sp eci fications Recommend ed
Power supply 14 mV to 35 Vdc, 0.1 mV resolution HP 6114A
Digital mult i m et er Better tha n 0. 01% accuracy HP 34401A
Cable BNC, Qty 2 HP 10503A
Shorting cap BNC HP 1250-07 74
Adapter BNC (f) to banana ( m ) HP 1251-22 77
Adapter BNC tee (m) (f) (f) HP 1250-0781
Set up the oscilloscope.
1
Setup
Press
a
Adjust the channel 1 Position knob to place the baseline at
b
, then press the
Default Setup
softkey.
Model/Part
approximately 0.5 division from the bottom of the display.
Set the Volts/Div to the first line of table 4-4.
c
d
Press
Displa y
, press the
Average
softkey, then set
# Average
softkey to 64. Wait a few seconds for the measurement to settle; the
Av
letters in the status line indicate how much of the averaging
process is finished by turning to inverse video as the oscilloscope
performs averaging.
Press
2
Using the cursors knob, set the V1 cursor on the baseline of the
3
Cursor s
, then press the V1 softkey.
signal.
4-8
 Loading...