

Page 1
Advancements in LED Technology
Advancements in LED (Light Emitting Diode) technology have made this source an attractive alternative to traditional light
sources in a variety of applications. One such application is outdoor xtures. This segment includes roadway and decorative
street lighting, as well as general area lighting traditionally occupied by discharge light sources. In comparison to historic
technologies (such as high pressure sodium and metal halide), today’s outdoor LED lighting xtures can provide signicant
energy savings over their useful life.
Another advantage is the long lifetime of today’s LED fixtures.
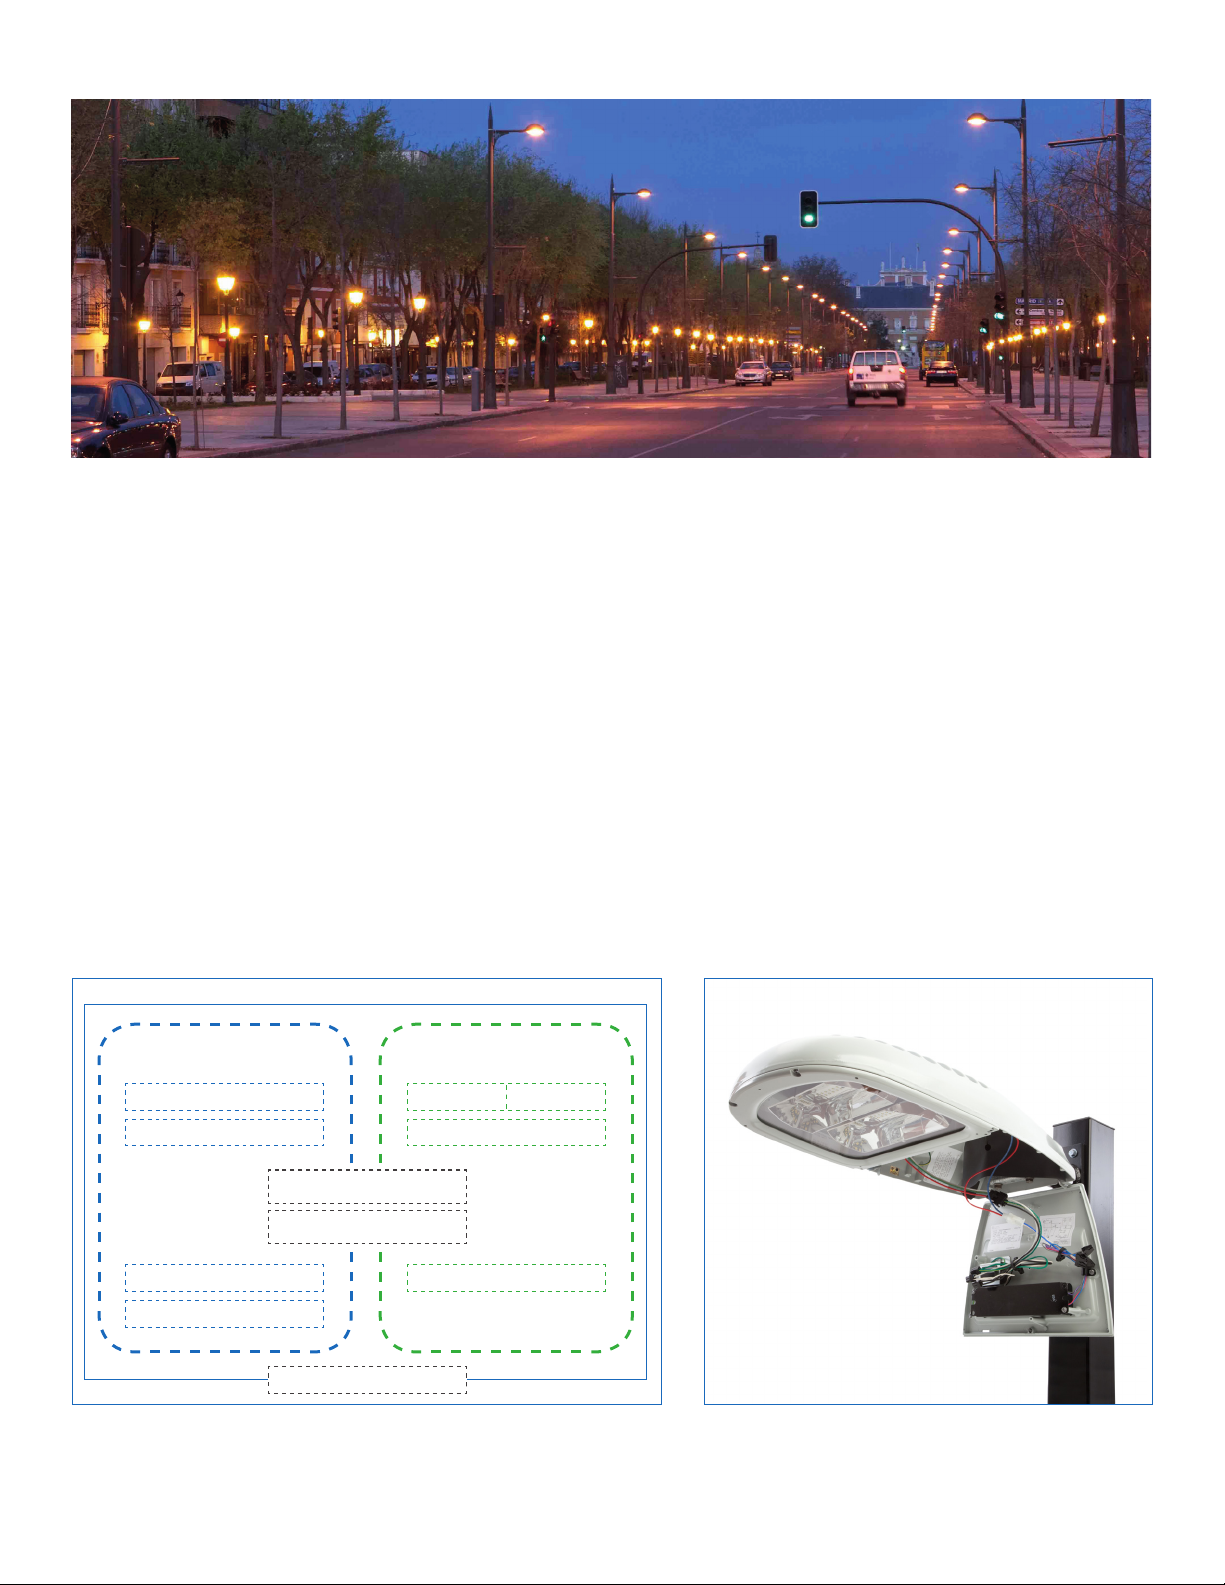
Overall system reliability is comprised of several key subsystems
and their components: the electrical subsystem, the optical
subsystem and the outer enclosure. A simplied block diagram
is shown below as an example to illustrate the relationship
between these subsystems and their corresponding components.
Mechanical Enclosure & Finish Subsystem
Electrical Subsystem
Driver
TVSS Reector
Wiring/Interconnects
Seals/Gaskets
Fuses Lens
Control System
Optical Subsystem
PCB LEDs
This paper addresses the reliability of GE’s outdoor LED lighting
systems through examples of rigorous testing and reliability
modeling, resulting from GE’s deep technical experience as one
of the world’s largest LED systems companies.
Mounting Subsystem
Figure 1: Simplied block diagram of outdoor LED system
Figure 2: Open view of roadway fixture
Page 2
Reliability denitions
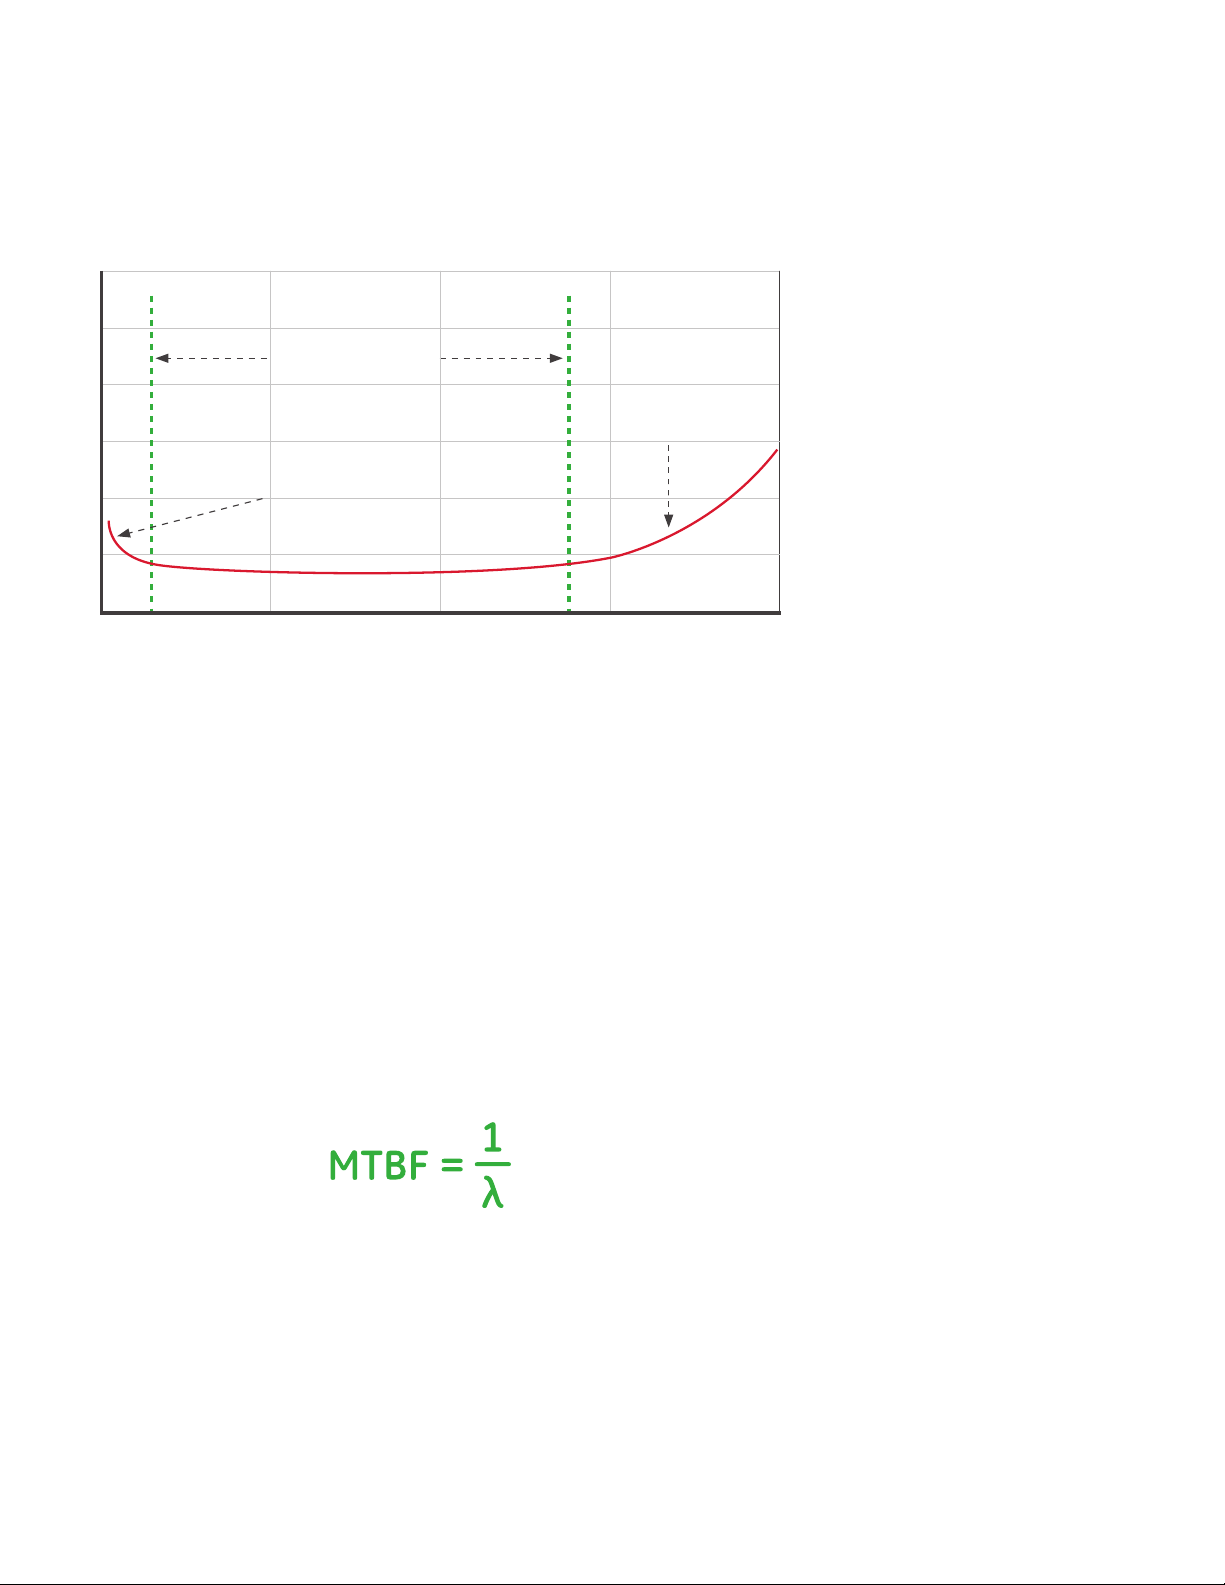
The reliability bathtub curve is often used to depict the expected failure rate of a family
of products over time. This model is comprised of three segments: infant mortality, useful
life and wearout, as illustrated in Figure 3.
Product “useful life”
Approximate constant
failure rate
Product “wearout”
Increasing failure rate
“infant mortality”
Failure Rate
Figure 3: Example of reliability bathtub curve
Decreasing failure rate
Time
Infant mortality is an initial period of failures usually resulting from manufacturing
defects or quality excursions, and has a decreasing failure rate over a relatively short
time frame. Product useful life is shown as the bottom portion of the bathtub curve. It is a
period of random failures with a nearly constant failure rate. The weakest component
in any system will determine the duration of this portion of the curve. At the end of
useful life, wearout failure modes, such as fatigue and material depletion, will cause
the failure rate to increase with time. This nal segment of the curve is called wearout.
Reliability during useful life is often a focus when considering products for a specic
application. In the case of GE outdoor LED systems, an exponential distribution may
be applied to model system reliability. Reliability values are often requested in the form
of an MTBF (Mean Time Between Failures) value. MTBF is often misunderstood since it
is expressed as a time value, but more accurately denes the failure rate during the
useful life of the product. The relationship is illustrated below, where λ is the failure
rate with units of hrs-1.
It is important to note that this failure rate is valid only during the useful life portion of the
bathtub curve where the failure rate is relatively constant. When the failure rate begins to
increase, a product has entered wearout and a dierent mathematical model is needed
to represent this behavior. For this reason, it is important to understand when wearout
failure modes begin. Both component-level and full-system testing are utilized by GE Lighting
engineers to understand and accurately model the reliability of outdoor LED systems.
Page 3

GE reliability philosophy
At GE, the Design for Reliability (DFR) process is key to any product’s development cycle.
For this reason, GE maintains a corporate-level reliability program to train and certify GE
engineers in the important DFR tools and processes. Practitioner and Expert certications
are attainable, with the latter including an additional external accreditation. These certied
professionals carry their reliability toolboxes across the GE businesses, driving a culture
of education and best practice sharing.
GE Lighting leverages the expertise of its certied Reliability Practitioners and Experts to
drive rigor in its internal DFR process. This multistep approach incorporates a variety of
design, analysis and test methods to deliver robust and reliable LED systems.
GE’s DFR process begins by establishing the reliability goals for the product. These
goals are based on a variety of inputs, including benchmarking activities, application
considerations, customer expectations and warranty requirements. Engineers then
analyze the system by developing Functional Block Diagrams (FBDs). These diagrams
help engineers identify the critical subsystems and components in the system and
allocate the appropriate reliability targets. From there, design teams complete an
FMEA (Failure Modes and Eects Analysis) and Parameter Diagram (P-diagram). The
FMEA is a structured analysis that surfaces potential failure modes in a system, while
the P-diagram highlights key inputs, noise variables and control parameters that
aect the system. Both tools help engineers design robust reliability test plans focused
on the critical system elements and most likely failure modes. These test plans often
include both Reliability Growth Testing (RGT) and Reliability Demonstration Testing
(RDT). RGT is used early in the product design cycle to identify potential weak points
or latent defects in a design. This allows engineers to implement corrective actions or
design improvements to make the product more robust. When the design is nalized,
RDT is used to validate the specied reliability goals for the product. This process is
illustrated in Figure 4.
Establish reliability goals
• Benchmarking
• Application considerations
• Market surveys
• Customer expectations
• Warranty requirements
Product-level reliability
requirements
• Develop FBDs
• Identify critical subsystems
and components
• Allocate reliability targets
Figure 4: DFR ow diagram
Reliability gap analysis
• Conduct FMEAs
• Develop P-diagrams
• Perform initial life predictions
Reliability Growth Testing
• Develop & execute test plan
• Analyze results
Reliability Demonstration
Testing
• Develop & execute test plan
• Analyze results
Specified robustness
targets met
Design improvements
(as needed)
Specified reliability
targets demonstrated
Page 4

GE reliability testing
As already stated, there are several key contributors to outdoor LED system reliability.
Each of these contributing factors is scrutinized both individually and together at the
system level to ensure the acceptability of overall system performance and reliability.
Examples of this approach are highlighted in the next several paragraphs.
Electronic drivers
Electronic driver reliability begins with a series of predictive models using tools such as
those in Reliacore’s Relex Reliability Studio or Reliasoft’s® Lambda Predict®. These models
function as design tools used for predicting failure rates based on reliability prediction
standards such as Bellcore/Telcordia and MIL-HDBK-217F as two examples. Engineers
use these tools to make initial reliability estimates of a design, identify potential weak
points, and evaluate the system impact when components or application conditions
are changed. During the design phase, engineers evaluate tradeos and compare
model results to the specied project requirements to select the optimal design for
fabrication and testing.
Drivers are required to pass a variety of well-dened testing requirements before entering
service in GE LED systems. In addition to standard reliability life testing, accelerated test
methods, robustness testing, surge immunity and EMI testing are employed.
ALT (Accelerated Life Test) utilizes elevated stress conditions to more quickly estimate
performance and life at lower nominal conditions by tting the output data to a
statistical model. Common acceleration factors include temperature, humidity and
power cycle testing.
HALT (Highly Accelerated Life Testing) includes a series of progressive steps with
wide-ranging temperatures, rapid thermal cycling, multi-axis vibration testing, power
cycling and other product-specic conditions. This testing is used to determine the
operation and destruct limits of the product.
STRIFE, or Stress Plus Life testing, is also used early
in the development cycle to draw out potential
design or manufacturing weaknesses.
STRIFE, or Stress Plus Life testing, is also used early in the development cycle to draw
out potential design or manufacturing weaknesses. During testing, units are put
through high- and low-temperature cycles over a period of time dened by the
industry standard model for fatigue-induced solder joint failures (known as the
Norris-Landzberg equation).
Page 5

DME (Design Margin Evaluation) is a qualitative reliability tool that measures the margin
between design strength of a unit and key environmental stressors such as ambient
temperature and incoming line voltage. Results can be used to improve the margin
of strength of a given design, as well as to highlight potential design weaknesses or
manufacturing aws.
Test methods such as HALT and DME are typically used as Reliability Growth Tests.
When used early in product design, engineers are able to identify potential failure
modes and then implement corrective actions or design changes to make the
product more robust. Life testing or ALT methods may then be applied as Reliability
Demonstration Tests to validate specied product reliability targets.
LEDs
Component-level qualication testing is performed on any new LED to validate
manufacturer claims and provide long-term reliability data under specified
conditions. Such reliability testing includes thermal shock, powered temperature
cycling and life testing under extreme temperature and humidity conditions.
Optics
The optics used in GE outdoor LED systems undergo a series of thermal soak,
thermal fatigue and water emersion testing to ensure material robustness, even
under elevated stress conditions. This provides condence across a broad range of
application conditions, including temperature excursions in the eld.
Figure 5: GE’s Evolve™ LED Roadway
Scalable Cobrahead
Mechanical enclosure
Fixture-level vibration testing is used to evaluate the mechanical reliability of the
system by simulating conditions that may be encountered during service. Examples
include vibration induced by trac, wind, ground disturbances, shipping and handling,
and accidental impact. Minimum testing of 100,000 cycles per axis for three axes is
designed to simulate normal fatigue conditions over the course of an outdoor
xture’s life, and is in line with ANSI C136.31. Additionally, enclosures undergo ingress
protection (per ANSI C136.25), salt fog testing (per ASTM B117 and D1654) and QUV
testing on the paint system (per ASTM G154 and D523). These accelerated tests are
designed to ensure durability under expected environmental conditions over the
product’s lifetime.
Page 6

Full system reliability testing
GE outdoor LED xtures also undergo full system reliability testing at nominal and
elevated temperatures to ensure robust system-level reliability. This testing also
highlights any potentially harmful interactions among the subsystems and their
components, reducing the likelihood of early life failures. This testing continues
even after products enter the eld, providing a valuable database of long-term
performance and reliability information to further support product claims. To date,
GE outdoor LED systems have accumulated more than 1.4 million unit-hours of
system-level reliability testing.
GE outdoor LED system reliability
In addition to a signicant internal testing database, GE Lighting’s large, global
installed base of outdoor LED systems provides engineers with valuable eld data
across a broad range of application conditions. This feedback loop is an essential
part of GE’s DFR process, as it allows engineers to more accurately design, model
and test systems based on realistic application conditions and incorporate lessons
learned during development of next-generation products.
This approach of applying reliability tools and practices early in product design,
combined with rigorous internal testing and active feedback from the field,
allows GE Lighting to condently deliver outdoor LED systems with world-class
robustness and reliability.
For more information, please visit gelighting.com.
© GE 2013 OLP-3070 2/2014
 Loading...