

Garmin GPSMAP 800 Series, GPSMAP 1000 Series Owner's Manual
GPSMAP® 800/1000 Series
Owner’s Manual
March 2015 Printed in Taiwan 190-01658-00_0C

All rights reserved. Under the copyright laws, this manual may not be copied, in whole or in part, without the written consent of Garmin. Garmin reserves the
right to change or improve its products and to make changes in the content of this manual without obligation to notify any person or organization of such
changes or improvements. Go to www.garmin.com for current updates and supplemental information concerning the use of this product.
Garmin®, the Garmin logo,
echoMAP™,
Garmin.
The
Bluetooth
™
GXM
®
word mark and logos are owned by the Bluetooth SIG, Inc. and any use of such marks by Garmin is under license. iOS® is a registered
BlueChart
, and HomePort™ are trademarks of Garmin Ltd. or its subsidiaries. These trademarks may not be used without the express permission of
®
, g2 Vision®, and MapSource® are trademarks of Garmin Ltd. or its subsidiaries, registered in the USA and other countries.
trademark of Cisco Systems, Inc. used under license by Apple Inc. microSD™ and the microSDHC logo are trademarks of SD-3C, LLC. NMEA®, NMEA 2000®,
and the NMEA 2000 logo are registered trademarks of the National Marine Electronics Association. SiriusXM® is a registered trademark of SiriusXM Radio Inc.
Wi‑Fi® is a registered mark of Wi-Fi Alliance Corporation. All other trademarks and copyrights are the property of their respective owners. Other trademarks and
trade names are those of their respective owners.

Table of Contents
Introduction.....................................................................1
Device Front View.......................................................................1
Device Keys........................................................................... 1
Downloading the Manuals.......................................................... 1
Manual Conventions................................................................... 1
Getting More Information............................................................ 1
Inserting Memory Cards............................................................. 1
Software Update......................................................................... 1
Loading the New Software on a Memory Card...................... 1
Updating the Device Software............................................... 1
GPS Satellite Signals..................................................................2
Selecting the GPS Source..................................................... 2
Customizing the Chartplotter........................................ 2
Customizing the Home Screen................................................... 2
Setting the Vessel Type.............................................................. 2
Adjusting the Backlight............................................................... 2
Adjusting the Color Mode........................................................... 2
Enabling AIS Transmission Test Alerts..................................2
Communication with Wireless Devices........................ 2
Setting Up the Wi‑Fi® Wireless Network.................................... 2
Connecting a Wireless Device to the Chartplotter...................... 2
Changing the Wireless Channel................................................. 2
Using the Garmin Helm App with the Chartplotter...................... 2
Connecting a Bluetooth Wireless Device................................... 2
Disconnecting a Bluetooth Wireless Device............................... 3
Charts and 3D Chart Views........................................... 3
Navigation Chart and Offshore Fishing Chart............................. 3
Zooming In and Out of the Chart........................................... 3
Selecting an Item on the Map Using the Device Keys........... 3
Measuring a Distance on the Chart....................................... 3
Chart Symbols....................................................................... 3
Navigating to a Point on the Chart......................................... 3
Viewing Location and Object Information on a Chart............ 4
Viewing Details about Navaids.............................................. 4
Selecting a Map..................................................................... 4
Premium Charts.......................................................................... 4
Viewing Tide Station Information........................................... 4
Showing Satellite Imagery on the Navigation Chart.............. 5
Viewing Aerial Photos of Landmarks..................................... 5
Automatic Identification System..................................................5
AIS Targeting Symbols.......................................................... 5
Heading and Projected Course of Activated AIS Targets...... 5
Showing AIS Vessels on a Chart or 3D Chart View.............. 6
Activating a Target for an AIS Vessel.................................... 6
Viewing a List of AIS Threats................................................. 6
Setting the Safe-Zone Collision Alarm................................... 6
AIS Distress Signals.............................................................. 6
Turning Off AIS Reception..................................................... 6
Chart and 3D Chart View Settings.............................................. 6
Navigation and Fishing Chart Setup...................................... 7
Waypoints and Tracks Settings on the Charts and Chart
Views..................................................................................... 7
Laylines Settings.................................................................... 7
Overlay Numbers Settings..................................................... 7
Showing a Navigation Inset................................................... 7
Chart Appearance Settings.................................................... 7
Setting the Heading and Course Over Ground Lines............ 8
Other Vessels Settings on the Charts and Chart Views........ 8
Fish Eye 3D Settings............................................................. 8
Navigation with a Chartplotter...................................... 8
Basic Navigation Questions........................................................ 9
Destinations................................................................................ 9
Searching for a Destination by Name.................................... 9
Selecting a Destination Using the Navigation Chart.............. 9
Searching for a Marine Services Destination......................... 9
Stopping Navigation....................................................................9
Waypoints................................................................................... 9
Marking Your Present Location as a Waypoint...................... 9
Creating a Waypoint at a Different Location.......................... 9
Marking and Starting Navigation to an MOB Location........... 9
Viewing a List of all Waypoints.............................................. 9
Editing a Saved Waypoint...................................................... 9
Moving a Saved Waypoint..................................................... 9
Browsing for and Navigating to a Saved Waypoint................ 9
Deleting a Waypoint or an MOB.......................................... 10
Deleting All Waypoints......................................................... 10
Setting and Following a Direct Course Using Go To........... 10
Routes...................................................................................... 10
Creating and Navigating a Route From Your Present
Location............................................................................... 10
Creating and Saving a Route............................................... 10
Viewing a List of Routes and Auto Guidance Paths............ 10
Editing a Saved Route......................................................... 10
Browsing for and Navigating a Saved Route....................... 10
Browsing for and Navigating Parallel to a Saved Route...... 11
Deleting a Saved Route....................................................... 11
Deleting All Saved Routes................................................... 11
Auto Guidance.......................................................................... 11
Setting and Following an Auto Guidance Path.................... 11
Creating and Saving an Auto Guidance Path...................... 11
Adjusting an Auto Guidance Path........................................ 11
Canceling an Auto Guidance Calculation in Progress......... 11
Setting a Timed Arrival.........................................................11
Auto Guidance Line Configurations..................................... 11
Tracks....................................................................................... 12
Showing Tracks................................................................... 12
Setting the Color of the Active Track................................... 12
Saving the Active Track....................................................... 12
Viewing a List of Saved Tracks............................................ 12
Editing a Saved Track.......................................................... 12
Saving a Track as a Route...................................................12
Browsing for and Navigating a Recorded Track.................. 12
Deleting a Saved Track........................................................12
Deleting All Saved Tracks.................................................... 13
Retracing the Active Track................................................... 13
Clearing the Active Track..................................................... 13
Managing the Track Log Memory During Recording........... 13
Configuring the Recording Interval of the Track Log........... 13
Stopping Navigation................................................................. 13
Synchronizing User Data Across the Garmin Marine
Network.....................................................................................13
Deleting All Saved Waypoints, Routes, and Tracks................. 13
Combinations............................................................... 13
Selecting a Combination........................................................... 13
Customizing a Combination Screen......................................... 13
Creating a Custom Combination Screen.................................. 13
Deleting a Combination Screen................................................ 13
Sonar............................................................................. 13
Sonar Views..............................................................................14
Traditional Sonar View......................................................... 14
DownVü Sonar View............................................................ 14
SideVü Sonar View.............................................................. 14
Split-Screen Sonar Views.................................................... 14
Split-Zoom Sonar View........................................................ 14
Split-Frequency Sonar View................................................ 14
Panoptix™ Sonar Views...................................................... 14
Changing the Sonar View......................................................... 15
Creating a Waypoint on the Sonar Screen............................... 15
Measuring Distance on the Sonar Screen................................ 15
Table of Contents i

Pausing the Sonar Display....................................................... 16
Viewing Sonar History.............................................................. 16
Sonar Sharing........................................................................... 16
Selecting a Sonar Source.................................................... 16
Renaming a Sonar Source...................................................16
Customizing the Overlay Numbers........................................... 16
Adjusting the Level of Detail..................................................... 16
Adjusting the Color Intensity..................................................... 16
Adjusting the Range of the Depth or Width Scale.................... 16
Setting the Zoom Level on the Sonar Screen........................... 17
Setting the Scroll Speed........................................................... 17
Sonar Frequencies................................................................... 17
Selecting Frequencies......................................................... 17
Creating a Frequency Preset............................................... 17
Customizing the Panoptix Sonar Views.................................... 17
Adjusting the Appearance of the LiveVü Sonar Views........ 17
Setting the LiveVü Transducer Transmit Angle................... 17
Adjusting the RealVü Viewing Angle and Zoom Level......... 17
Adjusting the Appearance of the RealVü Sonar Views........ 18
Adjusting the RealVü Sweep Speed.................................... 18
Turning On the A-Scope........................................................... 18
Selecting the Transducer Type................................................. 18
Sonar Setup.............................................................................. 18
Sonar Settings..................................................................... 18
RealVü Sonar Settings.........................................................18
LiveVü Sonar Settings......................................................... 18
Sonar Appearance Settings................................................. 18
Sonar Alarm Settings........................................................... 19
Advanced Sonar Settings.................................................... 19
Transducer Installation Settings...........................................19
Sonar Recordings..................................................................... 19
Recording the Sonar Display............................................... 19
Stopping the Sonar Recording............................................. 19
Deleting a Sonar Recording................................................. 19
Playing Sonar Recordings................................................... 19
Depth and Water Temperature Graphs.................................... 19
Setting the Depth and Water Temperature Graph Range and
Time Scales......................................................................... 19
Radar............................................................................. 20
Radar Display Modes............................................................... 20
Transmitting Radar Signals...................................................... 20
Adjusting the Radar Range...................................................... 20
Tips for Selecting a Radar Range........................................ 20
Adjusting the Zoom Scale on the Radar Screen...................... 20
Marking a Waypoint on the Radar Screen................................ 20
Sentry Mode............................................................................. 20
Enabling Timed Transmit..................................................... 20
Setting the Standby and Transmit Times............................. 20
Enabling a Guard Zone........................................................ 21
Defining a Circular Guard Zone........................................... 21
Defining a Partial Guard Zone............................................. 21
Viewing a List of AIS Threats............................................... 21
Showing AIS Vessels on the Radar Screen........................ 21
VRM and EBL........................................................................... 21
Showing the VRM and the EBL........................................... 21
Adjusting the VRM and the EBL.......................................... 21
Measuring the Range and Bearing to a Target Object........ 21
Radar Overlay...........................................................................21
Radar Overlay and Chart Data Alignment........................... 21
Showing the Radar Overlay................................................. 22
Setting a Custom Park Position................................................ 22
Enabling and Adjusting a Radar No Transmit Zone................. 22
Stopping the Transmission of Radar Signals........................... 22
Optimizing the Radar Display................................................... 22
Radar Gain and Clutter........................................................ 22
Echo Trails........................................................................... 23
Radar Display Settings........................................................ 23
Radar Appearance Settings................................................. 23
Front-of-Boat Offset............................................................. 23
Gauges and Almanac Information.............................. 24
Viewing the Compass............................................................... 24
Viewing Trip Gauges................................................................ 24
Resetting Trip Gauges......................................................... 24
Viewing Engine and Fuel Gauges............................................ 24
Customizing Engine Gauge and Fuel Gauge Limits............ 24
Enabling Status Alarms for Engine Gauges........................ 24
Enabling Some Engine Gauge Status Alarms..................... 24
Selecting the Number of Engines Shown in Gauges........... 24
Customizing the Engines Shown in Gauges........................ 24
Configuring the Fuel Gauges Display.................................. 24
Setting the Fuel Capacity of the Vessel............................... 24
Synchronizing the Fuel Data with the Actual Vessel Fuel... 24
Setting the Fuel Alarm......................................................... 24
Viewing the Wind Gauges........................................................ 25
Configuring the Sailing Wind Gauge.................................... 25
Configuring the Speed Source............................................. 25
Configuring the Heading Source of the Wind Gauge........... 25
Customizing the Close-Hauled Wind Gauge....................... 25
Viewing the Environment Gauges............................................ 25
Configuring the Alignment of the Wind Gauge.................... 25
Configuring the Heading Source of the Environment
Gauge.................................................................................. 25
Setting the Barometer Reference Time............................... 25
Tide, Current, and Celestial Information................................... 25
Tide Station Information....................................................... 25
Current Station Information.................................................. 25
Celestial Information............................................................ 25
Viewing Tide Station, Current Station, or Celestial Information
for a Different Date...............................................................25
Viewing Information for a Different Tide or Current
Station.................................................................................. 25
Viewing Almanac Information from the Navigation Chart.... 26
Digital Selective Calling............................................... 26
Networked Chartplotter and VHF Radio Functionality.............. 26
Turning On DSC....................................................................... 26
DSC List....................................................................................26
Viewing the DSC List........................................................... 26
Adding a DSC Contact......................................................... 26
Incoming Distress Calls............................................................ 26
Navigating to a Vessel in Distress....................................... 26
Man-Overboard Distress Calls Initiated from a VHF
Radio....................................................................................26
Man-Overboard and SOS Distress Calls Initiated from the
Chartplotter.......................................................................... 26
Position Tracking...................................................................... 26
Viewing a Position Report.................................................... 26
Navigating to a Tracked Vessel........................................... 26
Creating a Waypoint at the Position of a Tracked Vessel.... 26
Editing Information in a Position Report.............................. 27
Deleting a Position-Report Call............................................ 27
Viewing Vessel Trails on the Chart...................................... 27
Individual Routine Calls............................................................ 27
Selecting a DSC Channel.................................................... 27
Making an Individual Routine Call....................................... 27
Making an Individual Routine Call to an AIS Target............ 27
Media Player................................................................. 27
Opening the Media Player........................................................ 27
Icons.................................................................................... 27
Selecting the Media Source...................................................... 27
Connecting a Bluetooth Wireless Device to the Media
Player................................................................................... 27
ii Table of Contents

Playing Music............................................................................28
Browsing for Music...............................................................28
Setting a Song to Repeat..................................................... 28
Setting All Songs to Repeat................................................. 28
Setting Songs to Shuffle...................................................... 28
Listening to the Radio.......................................................... 28
Opening the MTP Source.................................................... 28
Adjusting the Volume................................................................ 28
Enabling and Disabling Zones............................................. 28
Muting the Media Volume.................................................... 28
Scanning VHF Channels.......................................................... 28
Adjusting the VHF Squelch....................................................... 28
Setting the Device Name.......................................................... 28
SiriusXM® Satellite Radio........................................................ 28
Locating a SiriusXM Radio ID.............................................. 28
Activating a SiriusXM Subscription...................................... 28
Customizing the Channel Guide.......................................... 28
Saving a SiriusXM Channel to the Presets List................... 29
Unlocking SiriusXM Parental Controls................................. 29
SiriusXM Weather......................................................... 29
SiriusXM Equipment and Subscription Requirements.............. 29
Weather Data Broadcasts.........................................................29
Viewing Precipitation Information............................................. 29
Precipitation Views...............................................................29
Storm Cell and Lightning Information....................................... 29
Hurricane Information............................................................... 30
Weather Warnings and Weather Bulletins................................ 30
Forecast Information................................................................. 30
Viewing Forecast Information for Another Time Period....... 30
Viewing a Marine Forecast or an Offshore Forecast........... 30
Weather Fronts and Pressure Centers................................ 30
City Forecasts...................................................................... 30
Viewing Sea Conditions............................................................ 30
Surface Winds......................................................................30
Wave Height, Wave Period, and Wave Direction................ 30
Viewing Forecast Sea Conditions Information for Another
Time Period..........................................................................30
Viewing Fishing Information......................................................31
Surface Pressure and Water Temperature Data................. 31
Forecasting Fish Locations.................................................. 31
Changing the Sea Surface Temperature Color Range........ 31
Visibility Information.................................................................. 31
Viewing Forecast Visibility Information for Another Time
Period...................................................................................31
Viewing Buoy Reports.............................................................. 31
Viewing Local Weather Information near a Buoy................. 31
Creating a Waypoint on a Weather Chart................................. 31
Weather Overlay....................................................................... 31
Turning On the Weather Overlay on a Chart....................... 31
Weather Overlay Settings on the Navigation Chart............. 31
Weather Overlay Settings on the Fishing Chart.................. 31
Viewing Weather Subscription Information............................... 32
Device Configuration................................................... 32
Turning On the Chartplotter Automatically............................... 32
System Settings........................................................................ 32
Display Settings................................................................... 32
GPS Settings....................................................................... 32
Viewing the Event Log......................................................... 32
Viewing System Software Information................................. 32
My Vessel Settings................................................................... 32
Setting the Keel Offset......................................................... 32
Setting the Water Temperature Offset................................. 33
Calibrating a Water Speed Device....................................... 33
Communications Settings......................................................... 33
NMEA 0183..........................................................................33
NMEA 2000 Settings............................................................33
Setting Alarms.......................................................................... 34
Navigation Alarms................................................................ 34
System Alarms..................................................................... 34
Setting the Fuel Alarm......................................................... 34
Setting Weather Alarms....................................................... 34
Units Settings............................................................................34
Navigation Settings................................................................... 34
Other Vessel Settings............................................................... 34
Restoring the Original Chartplotter Factory Settings................ 34
Chartplotter Data Management................................... 34
Copying Waypoints, Routes, and Tracks from HomePort to a
Chartplotter............................................................................... 34
Selecting a File Type for Third-Party Waypoints and Routes... 34
Copying Data from a Memory Card.......................................... 35
Copying Waypoints, Routes, and Tracks to a Memory Card.... 35
Copying Built-In Maps to a Memory Card................................. 35
Backing Up Data to a Computer............................................... 35
Restoring Backup Data to a Chartplotter.................................. 35
Saving System Information to a Memory Card......................... 35
Appendix....................................................................... 35
Registering Your Device........................................................... 35
Cleaning the Screen................................................................. 35
Screenshots.............................................................................. 35
Capturing Screenshots........................................................ 35
Copying Screenshots to a Computer................................... 35
Troubleshooting........................................................................ 35
Restoring the Original Chartplotter Factory Settings........... 35
Viewing System Software Information................................. 35
My device will not acquire GPS signals............................... 35
My device will not turn on or keeps turning off..................... 36
My device is not creating waypoints in the correct
location.................................................................................36
NMEA 0183 Information........................................................... 36
NMEA 2000 PGN Information...................................................36
Software License Agreement................................................... 37
Index.............................................................................. 38
Table of Contents iii


Introduction
WARNING
See the
product box for product warnings and other important
information.
Device Front View
À
Á
Â
Ã
Ä
Å
Important Safety and Product Information guide in the
Automatic backlight sensor
Power key
Device keys
Number pad (available on 10 inch models only)
SD memory card slot
Soft keys
Getting More Information
If you have any questions about your device, you can contact
®
Garmin
The website, www.garmin.com/support
troubleshooting tips to help resolve most issues and answer
most questions.
• Frequently-asked questions (FAQs)
• Software updates
• Owner's and installation manuals
• Service alerts
• Video
• Contact numbers and addresses
Product Support.
, offers many different
Inserting Memory Cards
You can use optional memory cards in the chartplotter. Map
cards allow you to view high-resolution satellite imagery and
aerial reference photos of ports, harbors, marinas, and other
points of interest. You can use blank memory cards to record
sonar data and transfer data such as waypoints, routes, and
tracks to another compatible Garmin chartplotter or a computer.
Open the access flap or door on the front of the chartplotter.
1
Insert the memory card.
2
Press the card in until it clicks.
3
Device Keys
Turns on and off the device when held.
Adjusts the backlight and color mode when quickly pressed
and released.
Zooms out of a chart or view.
Zooms in to a chart or view.
SELECT Acknowledges messages and selects options.
BACK Returns to the previous screen.
MARK Saves the present location as a waypoint.
HOME Returns to the Home screen.
MENU Opens a menu of options for the page, when applicable.
Scrolls, highlights options, and moves the cursor.
Closes a menu, when applicable.
Downloading the Manuals
You can get the latest owner's manual and translations of
manuals from the web.
Go to www.garmin.com/support.
1
Select
2
3
Manuals.
Follow the on-screen instructions to download the manual for
your product.
Manual Conventions
In this manual, the term “select” is used to describe these
actions.
• Using the arrow keys to highlight a menu item, and then
pressing
• Pressing a key, such as
When you are instructed to select multiple items in a series,
small arrows appear in the text. For example, "select
," indicates that you need to select the MENU
Add
key and then select the Add item.
The images in this manual are for reference only and may not
match your device exactly.
SELECT (for hard key devices only).
SELECT or MENU.
MENU
>
item or hard
Close the door.
4
Software Update
You may need to update the device software when you install
the device or add an accessory to the device.
Loading the New Software on a Memory Card
Insert a memory card into the card slot on the computer.
1
Go to www.garmin.com/support/software/marine.html.
2
Select Download next to Garmin Marine Network with SD
3
card.
Read and agree to the terms.
4
Select
5
6
7
Updating the Device Software
Before you can update the software, you must obtain a
software-update memory card or load the latest software onto a
memory card.
1
2
3
4
Download.
Select Run.
Select the drive associated with the memory card, and select
Next
> Finish
Turn on the chartplotter.
After the home screen appears, insert the memory card into
the card slot.
NOTE:
appear, the device must be fully booted before the card is
inserted.
Follow the on-screen instructions.
Wait several minutes while the software update process
completes.
.
In order for the software update instructions to
Introduction 1

The device returns to normal operation after the software
update process is complete.
Remove the memory card.
5
NOTE:
restarts fully, the software update is not complete.
If the memory card is removed before the device
GPS Satellite Signals
When you turn on the chartplotter, the GPS receiver must collect
satellite data and establish the current location. When the
chartplotter acquires satellite signals,
the Home screen. When the chartplotter loses satellite signals,
disappears and a flashing question mark appears over on
the chart.
For more information about GPS, go to www.garmin.com
/aboutGPS
.
appears at the top of
Selecting the GPS Source
You can select your preferred source for GPS data, if you have
more than one GPS source.
Select Settings > System >
1
Select the source for GPS data.
2
GPS > Source
.
Customizing the Chartplotter
Customizing the Home Screen
You can add items to and rearrange items on the Home screen.
From the Home screen, select Customize Home.
1
Select an option:
2
• To rearrange an item, select
move, and select the new location.
• To add an item to the Home screen, select
select the new item.
• To remove an item you have added to the Home screen,
select Remove
, and select the item.
Setting the Vessel Type
You can select your boat type to configure the chartplotter
settings and to use features customized for your boat type.
Select Settings > My Vessel > Vessel Type.
1
Select
2
Powerboat or Sailboat.
Adjusting the Backlight
Select Settings >
1
TIP: Press from any screen to open the backlight settings.
Select an option:
2
• Adjust the backlight level.
• Select
Auto.
System > Display > Backlight
Adjusting the Color Mode
Select Settings
1
TIP:
Press
Select an option.
2
Enabling AIS Transmission Test Alerts
To avoid a large number of test alerts and symbols in crowded
areas such as marinas, you can select to receive or ignore AIS
test messages. To test an AIS emergency device, you must
enable the chartplotter to receive test alerts.
Select Settings > Alarms >
1
Select an option:
2
• To receive or ignore Emergency Position Indicating Radio
Beacon (EPRIB) test signals, select AIS-EPIRB Test.
> System > Display > Color Mode
from any screen to access the color settings.
Rearrange, select the item to
Add, and
.
.
.
AIS
• To receive or ignore Man Overboard (MOB) test signals,
select AIS-MOB Test.
• To receive or ignore Search and Rescue Transponder
(SART) test signals, select AIS-SART Test
.
Communication with Wireless Devices
The chartplotters can create a wireless network to which you
can connect wireless devices.
Some models also can connect to Bluetooth
using the AVRCP profile.
Connecting wireless devices allows you to use Garmin
including BlueChart
www.garmin.com for more information.
®
Mobile and Garmin Helm™. See
Setting Up the Wi‑Fi® Wireless Network
The chartplotters can create a Wi‑Fi network to which you can
connect wireless devices. The first time you access the wireless
network settings, you are prompted to set up the network.
Select Settings >
1
Wi-Fi® Network > Wi-Fi® > On > OK
If necessary, enter a name for this wireless network.
2
Enter a password.
3
You will need this password to access the wireless network
from a wireless device. The password is case-sensitive.
Communications > Wireless Devices >
Connecting a Wireless Device to the Chartplotter
Before you can connect a wireless device to the chartplotter
wireless network, you must configure the chartplotter wireless
network (
You can connect multiple wireless devices to the chartplotter to
share data.
1
2
3
Setting Up the
From the wireless device, turn on the Wi‑Fi
search for wireless networks.
Select the name of your chartplotter wireless network (Setting
Up the Wi‑Fi® Wireless Network).
Enter the network password.
®
Wireless Network).
Wi‑Fi
Changing the Wireless Channel
You can change the wireless channel if you have trouble finding
or connecting to a device, or if you experience interference.
Select Settings
1
Wi-Fi® Network > Advanced > Wi-Fi® Channel
Enter a new channel.
2
You do not need to change the wireless channel of devices
connected to this network.
Using the
> Communications > Wireless Devices >
Garmin Helm App with the
Chartplotter
Before you can control the chartplotter with the Garmin Helm
app, you must download and install the application, and connect
the chartplotter to a mobile device (
Device to the Chartplotter).
Select Settings
1
Helm App
Select an option.
2
Use the application to view or control the chartplotter.
3
> Communications > Wireless Devices >
.
Connecting a Wireless
Connecting a Bluetooth Wireless Device
NOTE: Bluetooth technology is not available on all chartplotter
models.
®
wireless devices
.
technology and
.
apps,
2 Customizing the Chartplotter
You can wirelessly connect the chartplotter to a Bluetooth
device.
Place the Bluetooth device within 33 ft. (10 m) of the
1
chartplotter.
Select Settings > Communications
2
Bluetooth Devices > Bluetooth
If necessary, enter a name for this wireless network.
3
If necessary, enter a password.
4
You will need this password to access the wireless network
from a wireless device. The password is case-sensitive.
Disconnecting a Bluetooth
Select Settings > Communications > Wireless Devices >
1
Bluetooth Devices >
Select a device.
2
Select Forget Device
3
Device List
.
> Wireless Devices >
.
Wireless Device
.
Charts and 3D Chart Views
The charts and 3D chart views that are available depend on the
map data and accessories used.
You can access the charts and 3D chart views by selecting
.
Charts
Navigation Chart: Shows navigation data available on your pre-
loaded maps and from supplemental maps, if available. The
data includes buoys, lights, cables, depth soundings,
marinas, and tide stations in an overhead view.
Perspective 3D: Provides a view from above and behind the
boat (according to your course) and provides a visual
navigation aid. This view is helpful when navigating tricky
shoals, reefs, bridges, or channels, and is beneficial when
trying to identify entry and exit routes in unfamiliar harbors or
anchorages.
Mariner’s Eye 3D: Shows a detailed, three-dimensional view
from above and behind the boat (according to your course)
and provides a visual navigation aid. This view is helpful
when navigating tricky shoals, reefs, bridges, or channels,
and when trying to identify entry and exit routes in unfamiliar
harbors or anchorages.
NOTE:
available with premium charts, in some areas.
Fish Eye 3D
represents the sea floor according to the chart information.
When a sonar transducer is connected, suspended targets
(such as fish) are indicated by red, green, and yellow
spheres. Red indicates the largest targets and green
indicates the smallest.
Fishing Chart: Provides a detailed view of the bottom contours
and depth soundings on the chart. This chart removes
navigational data from the chart, provides detailed
bathymetric data, and enhances bottom contours for depth
recognition. This chart is best for offshore deep-sea fishing.
NOTE:
charts, in some areas.
Radar Overlay: Superimposes radar information on the
Navigation chart or the Fishing chart, when the chartplotter is
connected to a radar. This feature is not available with all
models.
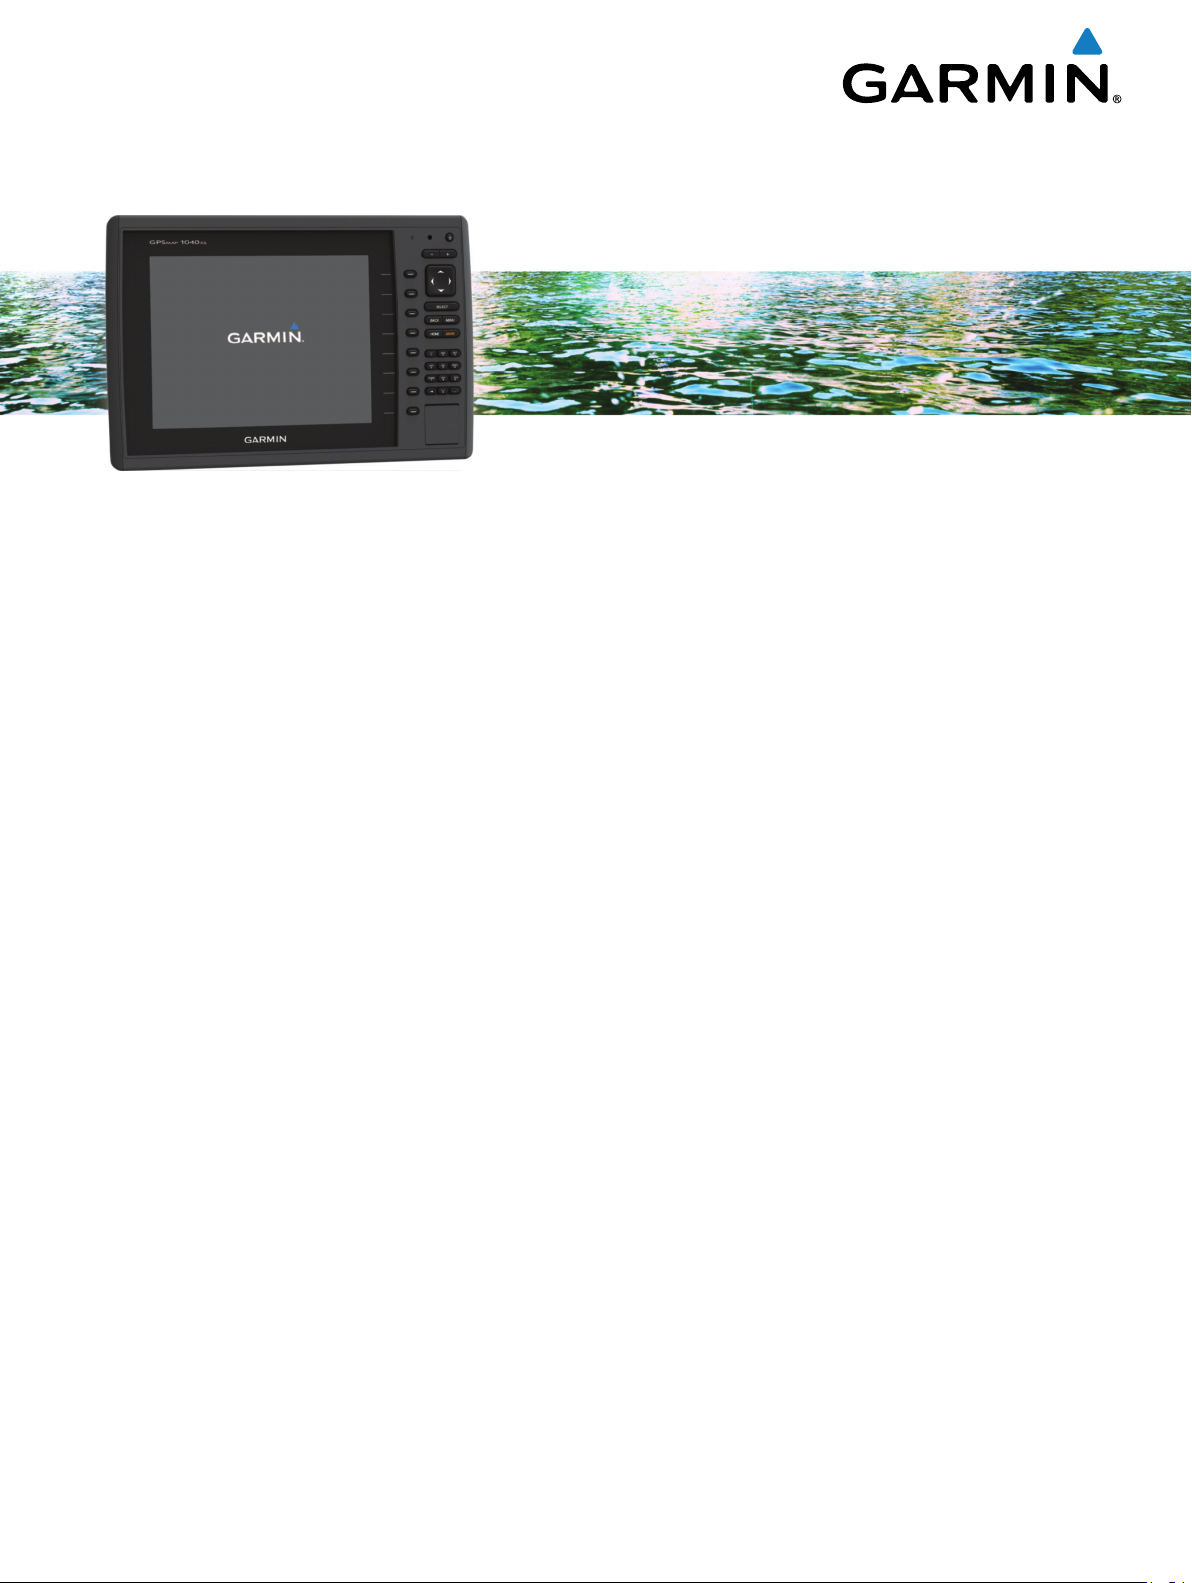
Navigation Chart and Offshore Fishing Chart
NOTE: The offshore Fishing chart is available with premium
charts, in some areas.
The Navigation and Fishing charts allow you to plan your
course, view map information, and follow a route. The Fishing
chart is for offshore fishing.
Mariner's Eye 3D and Fish Eye 3D chart views are
: Provides an underwater view that visually
The offshore Fishing chart is available with premium
To open the Navigation chart, select Charts > Navigation
Chart.
To open the Fishing chart, select Charts
> Fishing Chart
.
Zooming In and Out of the Chart
The zoom level is indicated by the scale number at the bottom of
the chart. The bar under the scale number represents that
distance on the chart.
• Select to zoom out.
• Select to zoom in.
Selecting an Item on the Map Using the Device Keys
From a chart or 3D chart view, select , , , or to move
1
the cursor.
SELECT.
Select
2
Measuring a Distance on the Chart
From a chart or the Radar overlay, select a location.
1
Measure Distance.
Select
2
A push pin appears on the screen at your present location.
The distance and angle from the pin is listed in the upper-left
corner.
TIP: To reset the pin and measure from the current location of
the cursor, select
Set Reference.
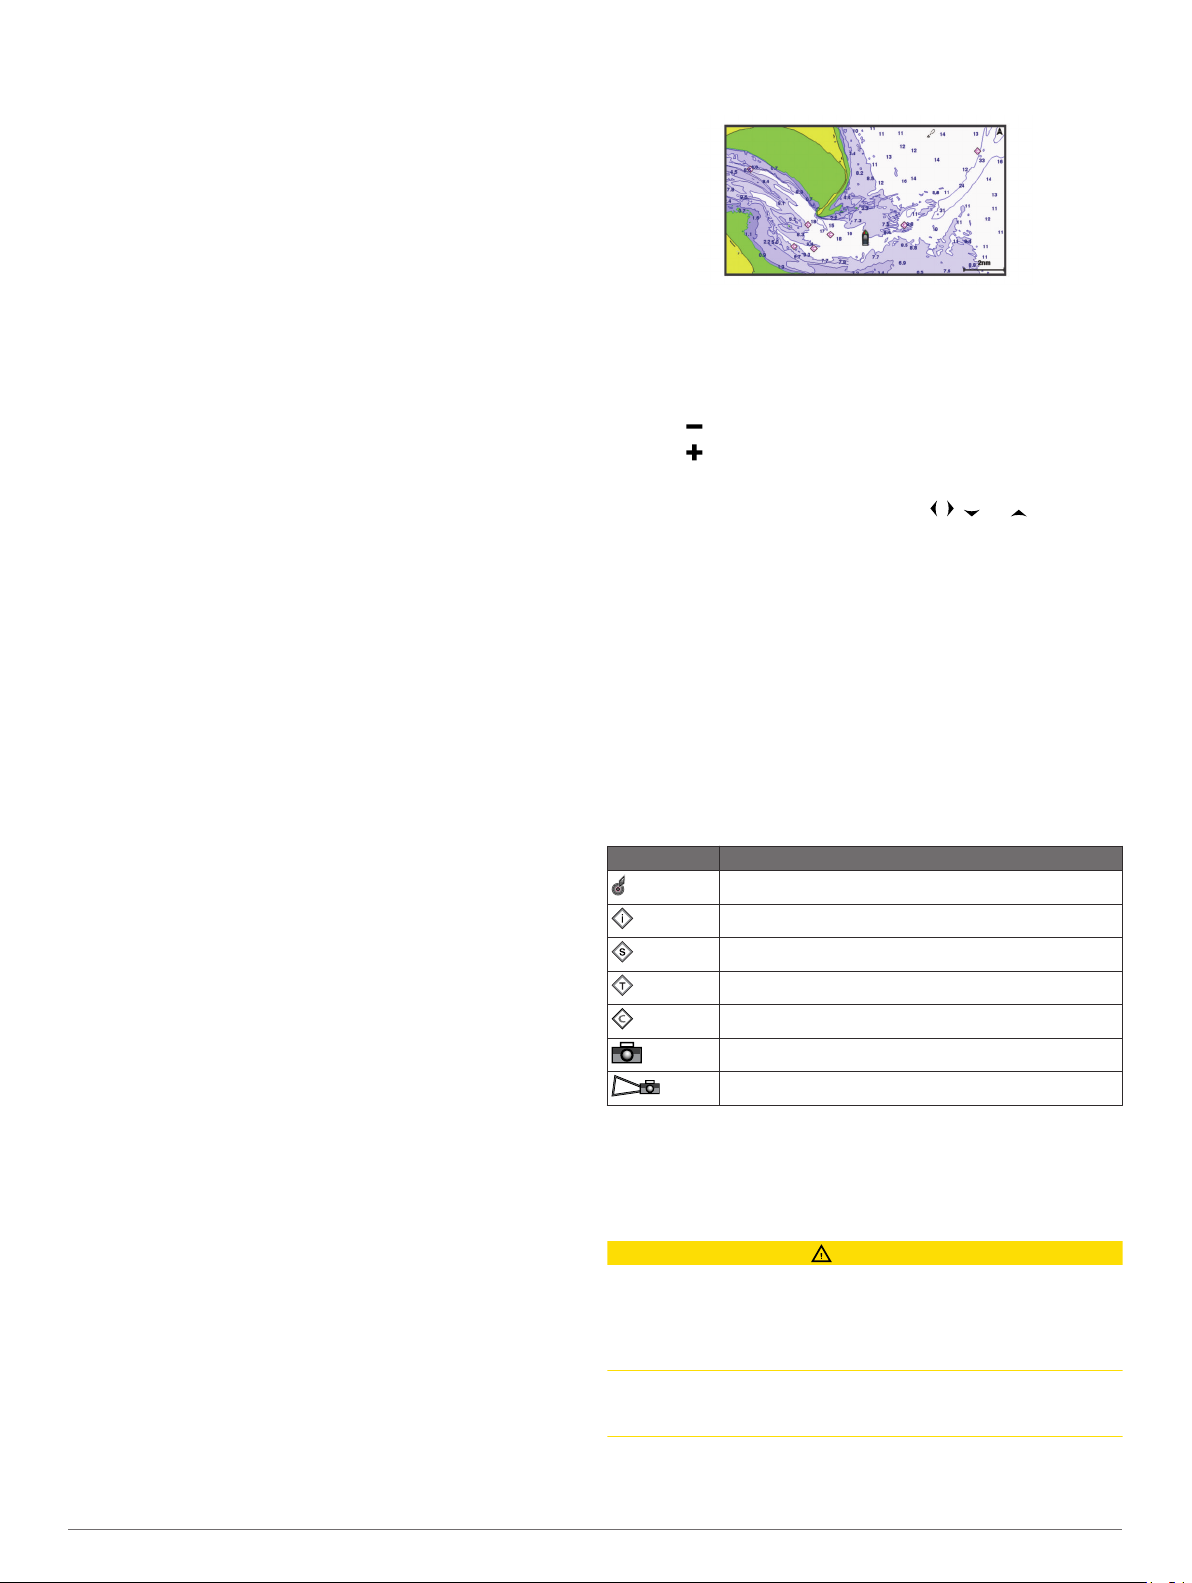
Chart Symbols
This table contains some of the common symbols you might see
on the detailed charts.
Icon Description
Buoy
Information
Marine services
Tide station
Current station
Overhead photo available
Perspective photo available
Other features common to most charts include depth contour
lines, intertidal zones, spot soundings (as depicted on the
original paper chart), navigational aids and symbols,
obstructions, and cable areas.
Navigating to a Point on the Chart
CAUTION
The Auto Guidance feature is based on electronic chart
information. That data does not ensure obstacle and bottom
clearance. Carefully compare the course to all visual sightings,
and avoid any land, shallow water, or other obstacles that may
be in your path.
When using Go To, a direct course and a corrected course may
pass over land or shallow water. Use visual sightings, and steer
to avoid land, shallow water, and other dangerous objects.
NOTE: The offshore Fishing chart is available with premium
charts, in some areas.
Charts and 3D Chart Views 3

NOTE:
areas.
1
2
3
4
5
6
Auto Guidance is available with premium charts, in some
From the Navigation chart or Fishing chart, select a location.
If necessary, select
Select
Navigate To.
Select an option:
• To navigate directly to the location, select Go To.
• To create a route to the location, including turns, select
Route To
• To use Auto Guidance, select Auto Guidance.
Review the course indicated by the magenta line.
NOTE: When using Auto Guidance, a gray segment within
any part of the magenta line indicates that Auto Guidance
cannot calculate part of the Auto Guidance line. This is due to
the settings for minimum safe water depth and minimum safe
obstacle height.
Follow the magenta line, steering to avoid land, shallow
water, and other obstacles.
SELECT.
.
Viewing Location and Object Information on a Chart
You can view information about a location or an object on the
Navigation chart or the Fishing chart.
NOTE: The offshore Fishing chart is available with premium
charts, in some areas.
From the Navigation chart or Fishing chart, select a location
1
or object.
A list of options appears along the right side of the chart. The
options that appear vary based on the location or object you
selected.
Select an option:
2
• To navigate to the selected location, select Navigate To
• To mark a waypoint at the cursor location, select New
Waypoint
• To view the distance and bearing of the object from your
current location, select Measure Distance.
The distance and bearing appear on the screen. Select
Select to measure from a location other than your current
location.
• To view tide, current, celestial, chart notes, or local
services information near the cursor, select Information
.
.
.
Viewing Details about Navaids
From the Navigation chart, Fishing chart, Perspective 3D chart
view, or Mariner’s Eye 3D chart view, you can view details about
various types of navigation aids, including beacons, lights, and
obstructions.
NOTE: The offshore Fishing chart is available with premium
charts, in some areas.
NOTE: Mariner's Eye 3D and Fish Eye 3D chart views are
available with premium charts, in some areas.
From a chart or 3D chart view, select a navaid.
1
Select the name of the navaid.
2
Selecting a Map
If your product has both
maps, you can select which map to use. Not all models have
both types of built-in maps.
From the Navigation chart, select MENU
1
Select an option:
2
• When you are on an inland lake, select LakeVü™ HD.
• When you are offshore, select BlueChart® g2.
BlueChart g2 and LakeVü
™
HD built-in
> Built-in Map
.
Premium Charts
CAUTION
The Auto Guidance feature is based on electronic chart
information. That data does not ensure obstacle and bottom
clearance. Carefully compare the course to all visual sightings,
and avoid any land, shallow water, or other obstacles that may
be in your path.
NOTE:
Optional premium charts, such as BlueChart g2 Vision
you to get the most out of your chartplotter. In addition to
detailed marine charting, premium charts may contain these
features, which are available in some areas.
Mariner’s Eye 3D: Provides a view from above and behind the
Fish Eye 3D
Fishing Charts: Shows the chart with enhanced bottom
High Resolution Satellite Imagery: Provides high-resolution
Aerial Photos
Detailed Roads and POI data: Shows detailed road and point
Auto Guidance: Uses specified safe depth, safe height, and
Viewing Tide Station Information
graph for a tide station to help predict the tide level at different
times or on different days.
NOTE:
areas.
1
2
Animated Tide and Current Indicators
NOTE:
areas.
You can view indicators for animated tide station and current
direction on the Navigation chart or the Fishing chart. You must
also enable animated icons in the chart settings (
and Current Indicators).
An indicator for a tide station appears on the chart as a vertical
bar graph with an arrow. A red arrow pointing downward
indicates a falling tide, and a blue arrow pointing upward
indicates a rising tide. When you move the cursor over the tide
station indicator, the height of the tide at the station appears
above the station indicator.
Current direction indicators appear as arrows on the chart. The
direction of each arrow indicates the direction of the current at a
specific location on the chart. The color of the current arrow
indicates the range of speed for the current at that location.
When you move the cursor over the current direction indicator,
the specific current speed at the location appears above the
direction indicator.
Not all models support all charts.
boat for a three-dimensional navigation aid.
: Provides an underwater, three-dimensional view
that visually represents the sea floor according to the
information on the chart.
contours and without navigational data. This chart works well
for offshore deep-sea fishing.
satellite images for a realistic view of the land and water on
the Navigation chart (Showing Satellite Imagery on the
Navigation Chart).
: Shows marinas and other navigationally
significant aerial photos to help you visualize your
surroundings (
of interest (POI) data, which includes highly detailed coastal
roads and POIs such as restaurants, lodging, and local
attractions.
chart data to determine the best course to your destination.
on the chart indicates a tide station. You can view a detailed
This feature is available with premium charts, in some
From the Navigation chart or Fishing chart, select a tide
station.
Tide direction and tide level information appear near .
Select the station name.
This feature is available with premium charts, in some
Viewing Aerial Photos of Landmarks).
®
, allow
Showing Tides
4 Charts and 3D Chart Views
Color Current Speed Range
Yellow 0 to 1 knot
Orange 1 to 2 knots
Red 2 or more knots
Showing Tides and Current Indicators
NOTE:
This feature is available with premium charts, in some
areas.
You can show static or animated tide and current station
indicators on the Navigation chart or Fishing chart.
From the Navigation or Fishing chart, select MENU > Chart
1
Setup
> Tides & Currents
Select an option:
2
.
• To show current station indicators and tide station
indicators on the chart, select On.
• To show animated tide station indicators and animated
current direction indicators on the chart, select Animated
Showing Satellite Imagery on the Navigation Chart
NOTE:
areas.
You can overlay high-resolution satellite images on the land or
on both land and sea portions of the Navigation chart.
NOTE: When enabled, high-resolution satellite images are
present only at lower zoom levels. If you cannot see highresolution images in your optional chart region, you can select
to zoom in. You also can set the detail level higher by changing
the map zoom detail.
1
2
This feature is available with premium charts, in some
From the Navigation chart, select MENU > Chart Setup >
Satellite Photos.
Select an option:
• Select
Land Only to show standard chart information on
the water, with photos overlaying the land.
• Select Photo Map Blend to show photos on both the
water and the land at a specified opacity. Use the slider
bar to adjust the photo opacity. The higher you set the
percentage, the more the satellite photos cover both land
and water.
Viewing Aerial Photos of Landmarks
Before you can view aerial photos on the Navigation chart, you
must turn on the
Satellite Photos setting in the chart setup.
NOTE: This feature is available with premium charts, in some
areas.
You can use aerial photographs of landmarks, marinas, and
harbors to help orient yourself to your surroundings or to
acquaint yourself with a marina or a harbor prior to arrival.
From the Navigation chart, select a camera icon:
1
• To view an overhead photo, select .
• To view a perspective photo, select . The photo was
taken from the location of the camera, pointed in the
direction of the cone.
Select
2
Aerial Photo.
Automatic Identification System
The Automatic Identification System (AIS) enables you to
identify and track other vessels, and alerts you to area traffic.
When connected to an external AIS device, the chartplotter can
show some AIS information about other vessels that are within
range, that are equipped with a transponder, and that are
actively transmitting AIS information.
The information reported for each vessel includes the Maritime
Mobile Service Identity (MMSI), location, GPS speed, GPS
heading, time that has elapsed since the last position of the
vessel was reported, nearest approach, and time to the nearest
approach.
Some chartplotter models also support Blue Force Tracking.
Vessels being tracked with Blue Force Tracking are indicated on
the chartplotter with a blue-green color.
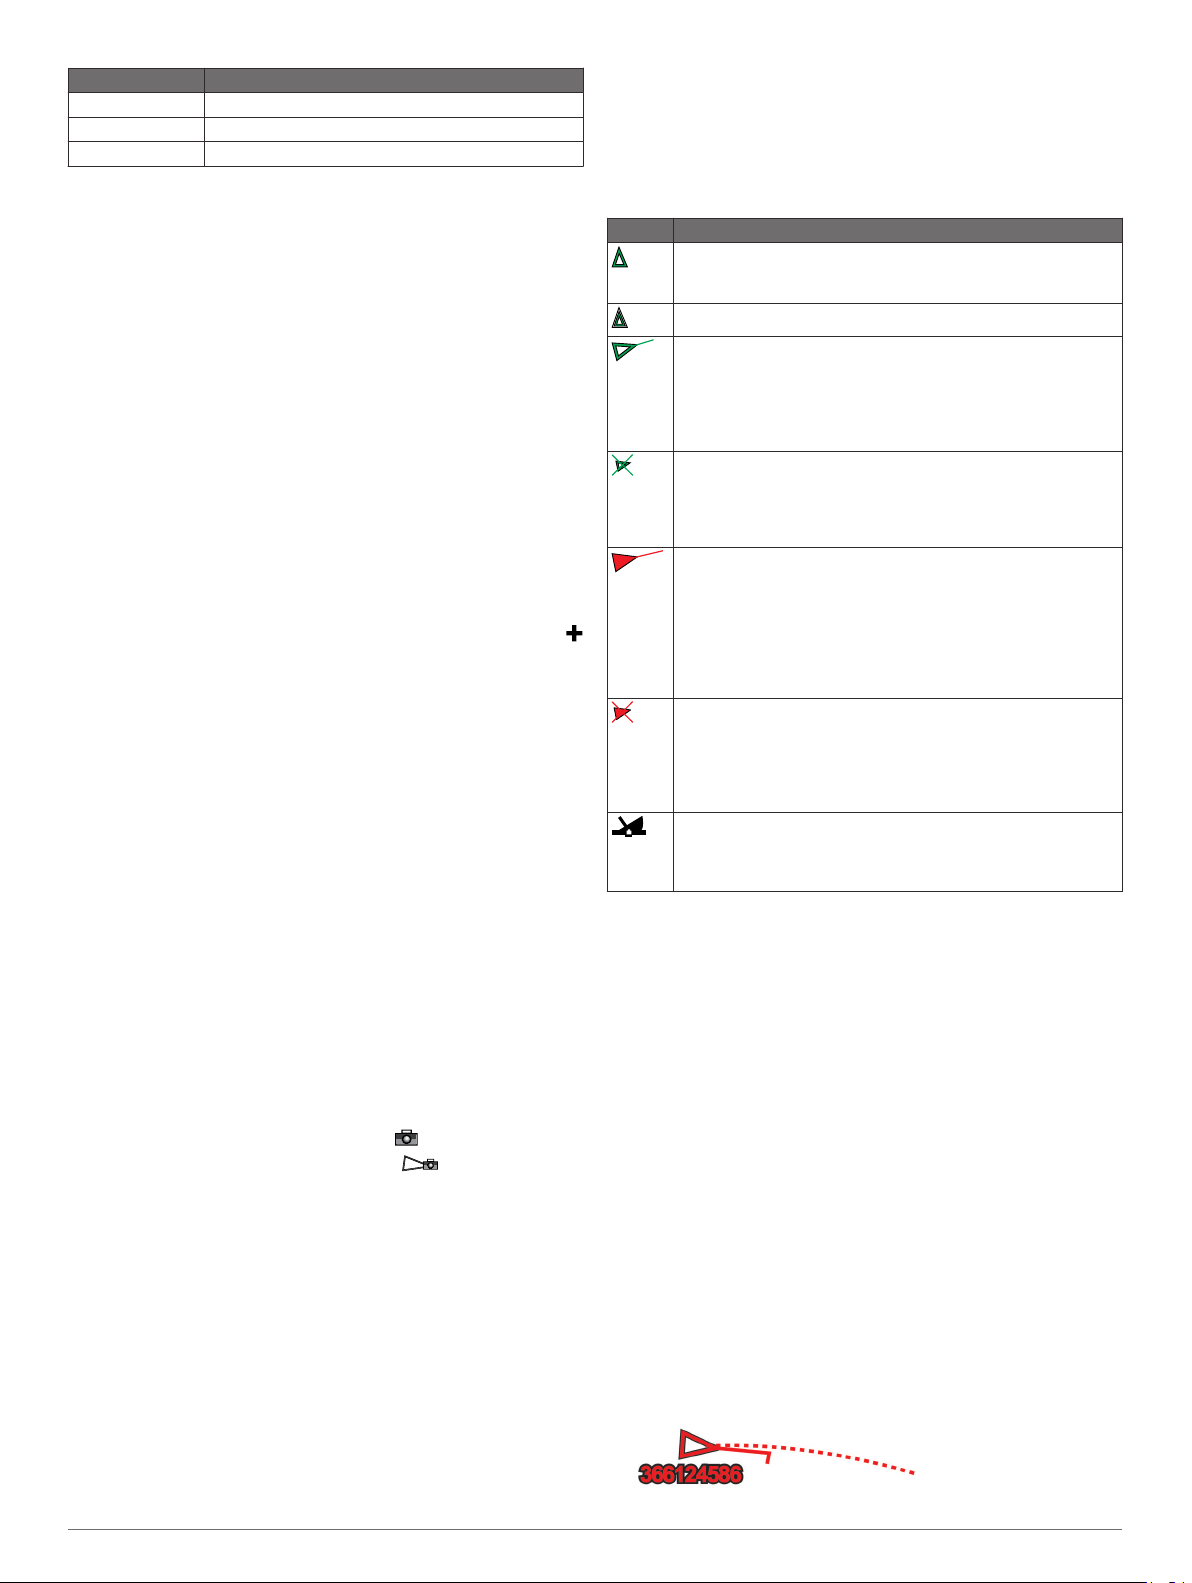
AIS Targeting Symbols
Symbol Description
AIS vessel. The vessel is reporting AIS information. The
direction in which the triangle is pointing indicates the
direction in which the AIS vessel is moving.
Target is selected.
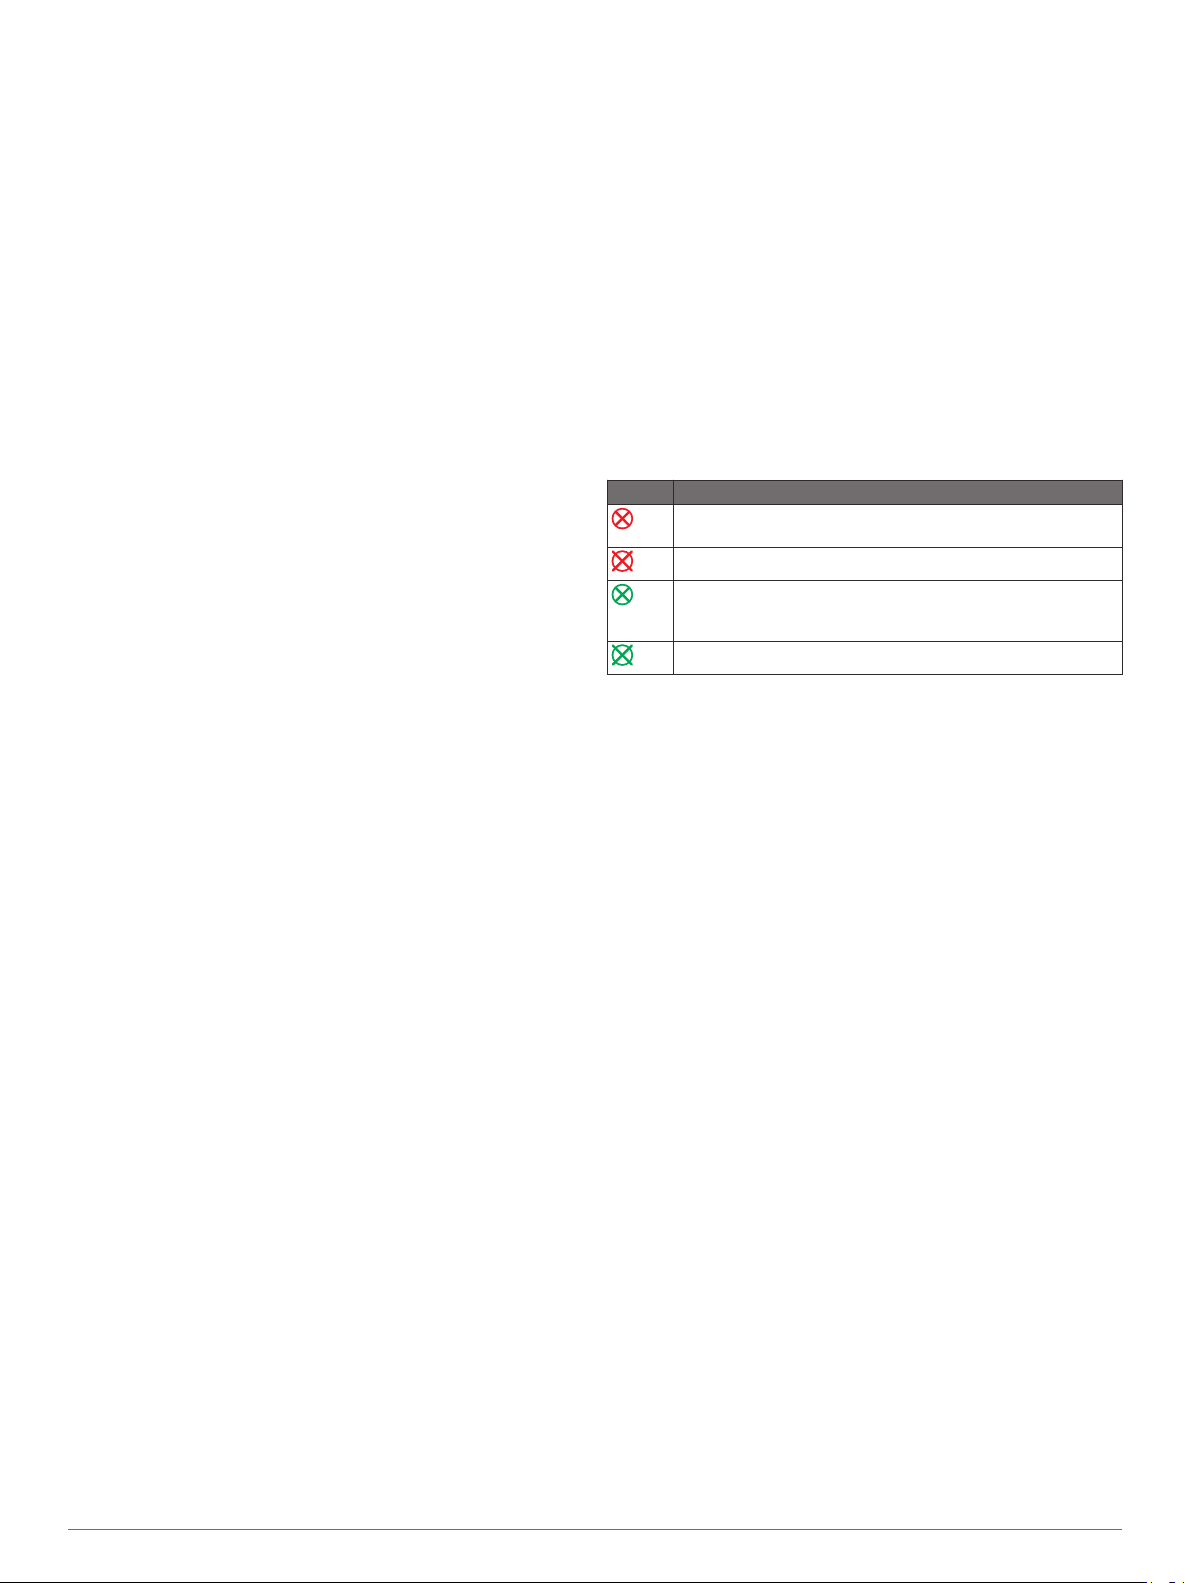
Target is activated. The target appears larger on the chart. A
green line attached to the target indicates the heading of the
target. The MMSI, speed, and direction of the vessel appear
beneath the target, if the details setting has been set to Show.
If the AIS transmission from the vessel is lost, a message
.
NOTE:
banner appears.
Target is lost. A green X indicates that the AIS transmission
from the vessel is lost, and the chartplotter displays a
message banner asking whether the vessel should continue
to be tracked. If you discontinue vessel tracking, the lost
target symbol disappears from the chart or the 3D chart view.
Dangerous target in range. The target flashes while an alarm
sounds and a message banner appears. After the alarm has
been acknowledged, a solid red triangle with a red line
attached to it indicates the location and the heading of the
target. If the safe-zone collision alarm has been set to Off, the
target flashes, but the audible alarm does not sound and the
alarm banner does not appear. If the AIS transmission from
the vessel is lost, a message banner appears.
Dangerous target is lost. A red X indicates that the AIS
transmission from the vessel is lost, and the chartplotter
displays a message banner asking whether the vessel should
continue to be tracked. If you discontinue vessel tracking, the
lost dangerous target symbol disappears from the chart or the
3D chart view.
The location of this symbol indicates the closest point of
approach to a dangerous target, and the numbers near the
symbol indicate the time to the closest point of approach to
that target.
Vessels being tracked with the Blue Force Tracking
feature are indicated with a blue-green color regardless of their
status.
Heading and Projected Course of Activated AIS Targets
When heading and course over ground information are provided
by an activated AIS target, the heading of the target appears on
a chart as a solid line attached to the AIS target symbol. A
heading line does not appear on a 3D chart view.
The projected course of an activated AIS target appears as a
dashed line on a chart or a 3D chart view. The length of the
projected course line is based on the value of the projected
heading setting. If an activated AIS target is not transmitting
speed information, or if the vessel is not moving, a projected
course line does not appear. Changes in the speed, course over
ground, or rate of turn information transmitted by the vessel can
impact the calculation of the projected course line.
When course over ground, heading, and rate of turn information
are provided by an activated AIS target, the projected course of
the target is calculated based on the course over ground and the
rate of turn information. The direction in which the target is
turning, which is also based on the rate of turn information, is
indicated by the direction of the barb at the end of the heading
line. The length of the barb does not change.
Charts and 3D Chart Views 5
When course over ground and heading information are provided
by an activated AIS target, but rate of turn information is not
provided, the projected course of the target is calculated based
on the course over ground information.
Showing AIS Vessels on a Chart or 3D Chart View
Before you can use AIS, you must connect the chartplotter to an
external AIS device and receive active transponder signals from
other vessels.
You can configure how other vessels appear on a chart or on a
3D chart view. The display range configured for one chart or one
3D chart view are applied only to that chart or to that 3D chart
view. The details, projected heading, and trails settings
configured for one chart or one 3D chart view are applied to all
charts and to all 3D chart views.
From a chart or 3D chart view, select MENU >
1
Vessels > AIS Display Setup
Select an option:
2
• To indicate the distance from your location in which AIS
vessels appear, select Display Range, and select a
distance.
• To show details about AIS-activated vessels, select
Details >
• To set the projected heading time for AIS-activated
vessels, select Proj. Heading, and enter the time.
• To show the tracks of AIS vessels, select Trails, and
select the length of the track that appears using a trail.
Show
.
.
Other
Activating a Target for an AIS Vessel
From a chart or a 3D chart view, select an AIS vessel.
1
Select AIS Vessel
2
Viewing Information about a Targeted AIS Vessel
You can view the AIS signal status, MMSI, GPS speed, GPS
heading, and other information that is reported about a targeted
AIS vessel.
From a chart or a 3D chart view, select an AIS vessel.
1
Select
2
Deactivating a Target for an AIS Vessel
1
2
AIS Vessel.
From a chart or a 3D chart view, select an AIS vessel.
Select AIS Vessel
> Activate Target
> Deactivate Target
.
.
Viewing a List of AIS Threats
From a chart or 3D chart view, select MENU
Vessels > AIS List
.
> Other
Setting the Safe-Zone Collision Alarm
Before you can set a safe-zone collision alarm, you must have a
compatible chartplotter connected to an AIS device.
The safe-zone collision alarm is used only with AIS. The safe
zone is used for collision avoidance, and can be customized.
Select Settings > Alarms >
1
A message banner appears and an alarm sounds when an
AIS-activated vessel enters the safe-zone area around your
boat. The object is also labeled as dangerous on the screen.
When the alarm is off, the message banner and audible
alarm are disabled, but the object is still labeled as
dangerous on the screen.
Select
2
3
4
5
Range.
Select a distance for the safe-zone radius around your
vessel.
Select
Time To.
Select a time at which the alarm will sound if a target is
determined to intersect the safe zone.
For example, to be notified of a pending intersection 10
minutes before it will likely occur, set Time To to 10, and the
AIS > AIS Alarm > On
.
alarm will sound 10 minutes before the vessel intersects the
safe zone.
AIS Distress Signals
Self-contained AIS distress signal devices transmit emergency
position reports when activated. The chartplotter can receive
signals from Search and Rescue Transmitters (SART),
Emergency Position Indicating Radio Beacons (EPIRB), and
other man overboard signals. Distress signal transmissions are
different than standard AIS transmissions, so they appear
differently on the chartplotter. Instead of tracking a distress
signal transmission for collision avoidance, you track a distress
signal transmission to locate and assist a vessel or person.
Navigating to a Distress Signal Transmission
When you receive a distress signal transmission, a distress
signal alarm appears.
Select Review > Go To to begin navigation to the
transmission.
AIS Distress Signal Device Targeting Symbols
Symbol Description
AIS distress signal device transmission. Select to see more
information about the transmission and begin navigation.
Transmission lost.
Transmission test. Appears when a vessel initiates a test of
their distress signal device, and does not represent a true
emergency.
Transmission test lost.
Enabling AIS Transmission Test Alerts
To avoid a large number of test alerts and symbols in crowded
areas such as marinas, you can select to receive or ignore AIS
test messages. To test an AIS emergency device, you must
enable the chartplotter to receive test alerts.
Select Settings > Alarms > AIS.
1
Select an option:
2
• To receive or ignore Emergency Position Indicating Radio
Beacon (EPRIB) test signals, select AIS-EPIRB Test.
• To receive or ignore Man Overboard (MOB) test signals,
select AIS-MOB Test.
• To receive or ignore Search and Rescue Transponder
(SART) test signals, select AIS-SART Test.
Turning Off AIS Reception
AIS signal reception is turned on by default.
Select Settings > Other Vessels > AIS > Off.
All AIS functionality on all charts and 3D chart views is
disabled. This includes AIS vessel targeting and tracking,
collision alarms that result from AIS vessel targeting and
tracking, and the display of information about AIS vessels.
Chart and 3D Chart View Settings
NOTE: Not all settings apply to all charts and 3D chart views.
Some options require premium maps or connected accessories,
such as radar.
These settings apply to the charts and 3D chart views, except
the radar overlay and Fish Eye 3D (Fish Eye 3D Settings).
From a chart or a 3D chart view, select MENU.
Waypoints & Tracks: See Waypoints and Tracks Settings on
the Charts and Chart Views.
Other Vessels: See Other Vessels Settings on the Charts and
Chart Views.
Surface Radar: Shows surface radar details on the Perspective
3D or Mariner's Eye 3D chart views.
Navaids: Shows navigational aids on the Fishing chart.
6 Charts and 3D Chart Views

Laylines: Adjusts the laylines, when in sailing mode (Laylines
Settings).
Chart Setup: See Navigation and Fishing Chart Setup.
Overlay Numbers: See Overlay Numbers Settings. This might
appear in the Chart Setup menu.
Chart Appearance: See Chart Appearance Settings. This might
appear in the Chart Setup menu.
Navigation and Fishing Chart Setup
NOTE:
Some settings require external accessories or applicable
premium charts.
From the Navigation chart or Fishing chart, select
Chart Setup.
Satellite Photos: Shows high-resolution satellite images on the
Water Overlay: Enables relief shading, which shows the
Tides & Currents: Shows current station indicators and tide
Roses: Shows a compass rose around your boat, indicating
Lake Level: Sets the present water level of the lake. This
Overlay Numbers: See Overlay Numbers Settings.
Weather: Sets which weather items are shown on the chart,
Chart Appearance: See Chart Appearance Settings.
Not all settings apply to all charts and 3D chart views.
MENU >
land or on both land and sea portions of the Navigation chart,
when certain premium maps are used Showing Satellite
Imagery on the Navigation Chart.
gradient of the bottom with shading, or sonar imagery, which
helps identify the density of the bottom. This feature is
available only with some premium maps.
station indicators on the chart Showing Tides and Current
Indicators and enables the tides and current slider, which
sets the time for which tides and currents are reported on the
map.
compass direction oriented to the heading of the boat. A true
wind direction or apparent wind direction indicator appears if
the chartplotter is connected to a compatible marine wind
sensor. When in sailing mode, true and apparent wind are
shown on the wind rose.
feature is available only with some premium maps.
when the chartplotter is connected to a compatible weather
receiver with an active subscription. Requires a compatible,
connected antenna and an active subscription.
Waypoints and Tracks Settings on the Charts and Chart Views
From a chart or a 3D chart view, select MENU > Waypoints &
Tracks.
Tracks: Shows tracks on the chart or 3D chart view.
Waypoints: Shows the list of waypoints (Viewing a List of all
Waypoints).
New Waypoint: Creates a new waypoint.
Waypoint Display: Sets how to display waypoints on the chart.
Active Tracks: Shows the active track options menu.
Saved Tracks: Shows the list of saved tracks (Viewing a List of
Saved Tracks).
Tracks Display: Sets which tracks to display on the chart based
on track color.
Laylines Settings
When in sailing mode (Setting the Vessel Type), you can display
laylines on the navigation chart. Laylines can be very helpful
when racing.
From the navigation chart, select MENU > Sailing
Display: Sets how the laylines and vessel are shown on the
chart, and sets the length of the laylines.
> Laylines
.
Sailing Ang.: Allows you to select how the device calculates
laylines. The Actual option calculates the laylines using the
measured wind angle from the wind sensor. The Manual
option calculates the laylines using manually entered
windward and leeward angles.
Tide Correction: Corrects the laylines based on the tide.
Overlay Numbers Settings
From a chart, 3D chart view, the Radar screen, or a
Combinations screen, select MENU > Overlay Numbers.
Edit Layout: Sets the layout of the data overlay, or data fields.
You can select the data to be shown within each data field.
Nav. Inset: Shows the navigation inset when the vessel is
navigating to a destination.
Navigation Inset Setup: Allows you to configure the navigation
inset to show
appears before a turn or destination.
Compass Tape: Shows the compass tape data bar when the
vessel is navigating to a destination.
Editing the Data Fields
You can change the data shown in the overlay numbers
displayed on the charts and other screens.
From a screen that supports overlay numbers, select MENU
1
If necessary, select
2
Select Overlay Numbers
3
Select a layout.
4
Select a data field.
5
Select the type of data shown in the field.
6
Available data options vary based on the chartplotter and
network configuration.
Route Leg Info, and to control when the inset
Chart Setup.
> Edit Layout
.
.
Showing a Navigation Inset
You can control whether a navigation inset appears on some
chart views. The navigation inset is shown only when the boat is
navigating to a destination.
From a chart or 3D chart view, select MENU.
1
If necessary, select Chart Setup.
2
Select Overlay Numbers >
3
Select Navigation Inset Setup.
4
Complete an action:
5
• To show waypoint velocity made good (VMG) when
navigating a route with more than one leg, select Route
Leg Info > On.
• To show next-turn data based on distance, select Next
Turn > Distance.
• To show next-turn data based on time, select Next Turn >
Time.
• To indicate how the destination data appears, select
Destination, and select an option.
Nav. Inset > Auto
.
Chart Appearance Settings
You can adjust the appearance of the different charts and 3D
chart views. Each setting is specific to the chart or chart view
being used.
NOTE:
and chartplotter models. Some options require premium maps or
connected accessories.
From a chart or 3D chart view, select
Chart Appearance
Orientation: Sets the perspective of the map.
Detail: Adjusts the amount of detail shown on the map, at
Heading Line: Shows and adjusts the heading line, which is a
Not all settings apply to all charts and 3D chart views
MENU
.
different zoom levels.
line drawn on the map from the bow of the boat in the
> Chart Setup >
Charts and 3D Chart Views 7

direction of travel, and sets the data source for the heading
line.
World Map: Uses either a basic world map or a shaded relief
map on the chart. These differences are visible only when
zoomed out too far to see the detailed charts.
Spot Depths: Turns on spot soundings and sets a dangerous
depth. Spot depths that are equal to or more shallow than the
dangerous depth are indicated by red text.
Safety Shading: Sets the shades from the shoreline to the
specified depth.
Depth Range Shading: Specifies an upper and lower depth to
shade between.
Symbols: Shows and configures the appearance of various
symbols on the chart, such as the vessel icon, navaid
symbols, land POIs, and light sectors.
Style: Sets how the chart appears over 3D terrain.
Hazard Colors: Shows shallow water and land with a color
scale. Blue indicates deep water, yellow is shallow water, and
red is very shallow water.
Safe Depth: Sets the appearance of a safe depth for the
Mariner’s Eye 3D chart view.
NOTE:
colors for the Mariner’s Eye 3D chart view. It does not affect
the safe water depth Auto Guidance setting or the sonar
shallow water alarm setting.
Range Rings: Shows and configures the appearance of range
rings, which help you to visualize distances in some chart
views.
Lane Width: Specifies the width of the navigation lane, which is
the magenta line in some chart views that indicates the
course to your destination.
This setting affects only the appearance of hazard
Setting the Heading and Course Over Ground Lines
You can show the heading line and the course over ground
(COG) line on the chart.
COG is your direction of movement. Heading is the direction the
bow of the boat is pointed, when a heading sensor is connected.
From a chart view, select MENU > Chart Setup > Chart
1
Appearance >
If necessary, select Source
2
• To automatically use the source available, select Auto
• To use the GPS antenna heading for COG, select GPS
Heading (COG).
• To use data from a connected heading sensor, select
North Reference.
• To use data from both a connected heading sensor and
the GPS antenna, select COG and Heading.
This displays both the heading line and the COG line on
the chart.
Select Display, and select an option:
3
• Select Distance
line shown on the chart.
• Select Time
the distance your boat will travel in the specified time at
your present speed.
Heading Line
> Distance
> Time
.
, and select an option:
.
, and enter the length of the
, and enter the time used to calculate
Other Vessels Settings on the Charts and Chart Views
NOTE:
an AIS receiver or VHF radio.
From a chart or 3D chart view, select
AIS List: Shows the AIS list (Viewing a List of AIS Threats).
DSC List: Shows the DSC list (DSC List).
AIS Display Setup: See AIS Display Settings.
These options require connected accessories, such as
MENU >
Other Vessels
.
DSC Trails: Shows the tracks of DSC vessels, and selects the
length of the track that appears using a trail.
AIS Alarm: Sets the safe-zone collision alarm (Setting the Safe-
Zone Collision Alarm).
AIS Display Settings
NOTE:
active transponder signals from other vessels.
From a chart or 3D chart view, select
AIS Display Setup.
AIS Dis. Range: Indicates the distance from your location within
Details: Shows details about AIS-activated vessels.
Proj. Heading: Sets the projected heading time for AIS-
Trails: Shows the tracks of AIS vessels, and select the length of
AIS requires the use of an external AIS device and
MENU > Other Vessels >
which AIS vessels appear.
activated vessels.
the track that appears using a trail.
Fish Eye 3D Settings
NOTE:
areas.
From the Fish Eye 3D chart view, select MENU.
View: Sets the perspective of the 3D chart view.
Tracks: Shows tracks.
Sonar Cone: Shows a cone that indicates the area covered by
Fish Symbols: Shows suspended targets.
This feature is available with premium charts, in some
the transducer.
Navigation with a Chartplotter
CAUTION
If your vessel has an autopilot system, a dedicated autopilot
control display must be installed at each steering helm in order
to disable the autopilot system.
The Auto Guidance feature is based on electronic chart
information. That data does not ensure obstacle and bottom
clearance. Carefully compare the course to all visual sightings,
and avoid any land, shallow water, or other obstacles that may
be in your path.
When using Go To, a direct course and a corrected course may
pass over land or shallow water. Use visual sightings, and steer
to avoid land, shallow water, and other dangerous objects.
NOTE:
areas.
NOTE:
available with premium charts, in some areas.
NOTE:
charts, in some areas.
To navigate, you must choose a destination, set a course or
create a route, and follow the course or route. You can follow
the course or the route on the Navigation chart, Fishing chart,
Perspective 3D chart view, or Mariner’s Eye 3D chart view.
You can set and follow a course to a destination using one of
three methods: Go To, Route To, or Auto Guidance.
Go To: Takes you directly to the destination. This is the
Route To: Creates a route from your location to a destination,
Auto Guidance is available with premium charts, in some
Mariner's Eye 3D and Fish Eye 3D chart views are
The offshore Fishing chart is available with premium
standard option for navigating to a destination. The
chartplotter creates a straight-line course or navigation line to
the destination. The path may run over land and other
obstacles.
allowing you to add turns along the way. This option provides
a straight-line course to the destination, but allows you to add
turns into the route to avoid land and other obstacles.
8 Navigation with a Chartplotter
 Loading...